Article

Multi–Scenario Prediction of Land Cover Changes and Habitat Quality Based on the FLUS–InVEST Model in Beijing

1
School of Landscape Architecture, Beijing Forestry University, Beijing 100083, China
2
State Key Laboratory of Earth Surface Processes and Resource Ecology, Beijing Normal University, Beijing 100875, China
3
School of Natural Resources, Faculty of Geographical Science, Beijing Normal University, Beijing 100875, China
*
Author to whom correspondence should be addressed.
Land 2024, 13(8), 1163; https://doi.org/10.3390/land13081163
Submission received: 29 April 2024 / Revised: 18 July 2024 / Accepted: 25 July 2024 / Published: 29 July 2024

Abstract

:
As urbanization accelerates worldwide, understanding the impact of urban expansion on habitat quality has become increasingly critical in environmental science research. This study examines the impact of urban expansion on habitat quality in Beijing, forecasting land cover changes and ecological effects by 2030. Using CA–Markov and FLUS models, the research analyzes habitat quality from 2000 to 2030 through the InVEST model, revealing a significant urban land increase of 1316.47 km2 and a consequent habitat quality decline. Predictions for 2030 indicate varying habitat quality outcomes across three scenarios: ecological priority (0.375), natural growth (0.373), and urban development (0.359). We observed that the natural growth scenario forecasts a further decline in habitat quality, primarily due to increased low–value habitat regions. Conversely, the ecological priority scenario projects a notable improvement in habitat quality. To mitigate habitat degradation in Beijing and enhance regional habitat quality and ecological conditions, it is recommended to control urban land cover expansion, adopt effective ecological conservation policies, and systematically carry out national spatial restructuring and ecological restoration. This research provides vital decision–making support for urban planning and ecological conservation, emphasizing the need for comprehensive land cover and ecological strategies in urban development. Additionally, our findings and methodologies are applicable to other rapidly urbanizing cities worldwide. This demonstrates the broader applicability and relevance of our research, providing a framework for sustainable urban planning in diverse global contexts.

1. Introduction

Urbanization is a pivotal global phenomenon that significantly drives the expansion of construction land, creating indispensable spaces for urban development [1,2]. This expansion, however, often leads to the substantial loss of critical ecological lands including farmlands, forests, and grasslands [3]. Such transformations not only alter the urban landscape but also pose severe threats to the sustainability of natural habitats [4,5]. Understanding these dynamics on a global scale is crucial, as urban expansion varies significantly across different regions and countries [6]. Habitats, which encompass all environmental factors critical for the survival of organisms—including broader spatial contexts and non–biological factors—are crucial for maintaining ecological balance [7]. Moreover, the quality of these habitats is assessed on a variety of spatial scales, from local habitats to larger ecosystems [8]. These assessments consider the impacts of broader environmental changes, such as climate change, thereby highlighting the intricate interdependencies within ecological systems [4,9]. Habitat quality is crucial to ecosystem services, deeply intertwined with biodiversity, and vital for enhancing ecosystem functionality [10]. The impact of urbanization on ecosystem services has been extensively studied, revealing that projected increases in urban areas can significantly affect ecological functions [6,11,12]. Urban expansion modifies land cover types, directly impacting the material and energy flows within habitats, thereby disrupting their natural distribution patterns [13]. Such alterations typically lead to increased fragmentation of habitat patches, a decline in biodiversity, and a noticeable degradation in ecosystem service functions [14]. Therefore, analyzing the impact of urban expansion on habitat quality requires a holistic approach that goes beyond just land cover analysis and incorporates additional ecological indicators. Exploring its relationship with urban development is crucial for striking a balance between ecological protection and urban growth [15,16,17]. This research aims to provide insights that are applicable to rapidly urbanizing cities worldwide, thereby enhancing the global relevance and applicability of our findings. In Shanghai, for instance, rapid urban expansion has led to the loss of agricultural land and increased habitat fragmentation, similar to trends observed in Beijing [18].
In recent years, the methodology for assessing habitat quality has evolved from field surveys to model evaluations, significantly enhancing the efficiency and scope of research. While field surveys provide precise data on biodiversity and habitats, their time–consuming and labor–intensive nature constrains scalability [19]. In contrast, model evaluation methods simulate and predict habitat quality through computational models, simplifying the operation process and expanding the geographic scope of ecological assessments. Various models offer tailored solutions for specific requirements in habitat quality assessment. For instance, the MaxEnt model primarily forecasts species distribution [20], inferring their potential geographic distributions by analyzing occurrence data, thereby indirectly assessing habitat quality. The ARIES model focuses on ecosystem services such as water and air purification, simulating their impacts on ecological health [21]. The HSI model evaluates species’ adaptability to environmental factors to determine habitat suitability [22]. The SoLVES model is specifically designed for particular environments, such as urban canals, deriving optimal water quality, hydraulic, and habitat standards [23]. Meanwhile, the InVEST model, renowned for its low data requirements and high assessment accuracy, is employed globally for habitat quality assessment in various regions [19,24]. This study selects this model to perform multi–scenario predictions of habitat quality in Beijing to explore the specific impacts of urban development on habitats. Our study employs a novel integration of the CA–Markov, FLUS, and InVEST models, providing a comprehensive framework that enhances the predictive accuracy of urban land cover changes and their ecological impacts. Unlike previous studies that often use short–term data, our research utilizes a long–term dataset spanning over three decades (2000–2030). This allows for a deeper understanding of the trends and long–term impacts of urbanization on habitat quality, providing insights that are critical for sustainable urban planning.
While numerous studies have explored the spatiotemporal evolution of habitat quality using single or multiple periods of land cover data [25], employing a range of assessment tools such as ecosystem service values, NPP and NDVI indices [26,27], the InVEST model, and geographic detectors [28] to quantitatively study the spatial distribution of habitat quality and its influencing factors. However, research on changes in habitat quality under different development scenarios still needs to be conducted [29], especially using multi–model coupling methods to predict land cover changes. By evaluating multiple scenarios, the impact of various urban development trajectories on habitat quality can offer crucial scientific foundations for developing future policies on urban and regional ecological and environmental protection and natural resource management. Furthermore, our study uniquely designs and applies three detailed development scenarios—natural development, urban development, and ecological protection. Each scenario is tailored to reflect different policy directions and their potential impacts on land cover and habitat quality. Based on our findings, we provide concrete, actionable policy recommendations that are directly aligned with current urban development and conservation needs. These recommendations are designed to assist policymakers in making informed decisions that balance urban growth with ecological sustainability.
As China’s capital and the developmental core of the Jing–Jin–Ji region, Beijing is undergoing rapid urban construction and economic growth. However, the “14th Five–Year Plan for Ecological and Environmental Protection” of Beijing points out that the quality of the ecological environment has not fundamentally improved, and resource pressure continues to increase. This study selects Beijing as a case to explore the evolution trends of habitat quality in major cities and the enhancement of ecosystem services, which has typical significance. Utilizing land cover data from 2000, 2010, and 2020, this research applies the CA–Markov, FLUS, and InVEST models to analyze the impact of land cover changes in Beijing on habitat quality. By simulating the land cover and habitat quality responses under various development scenarios for 2030, this study aims to provide a scientific foundation for the protection of biodiversity and natural resource management in Beijing and to serve as a reference for sustainable development studies in similar cities worldwide.

2. Materials and Methods

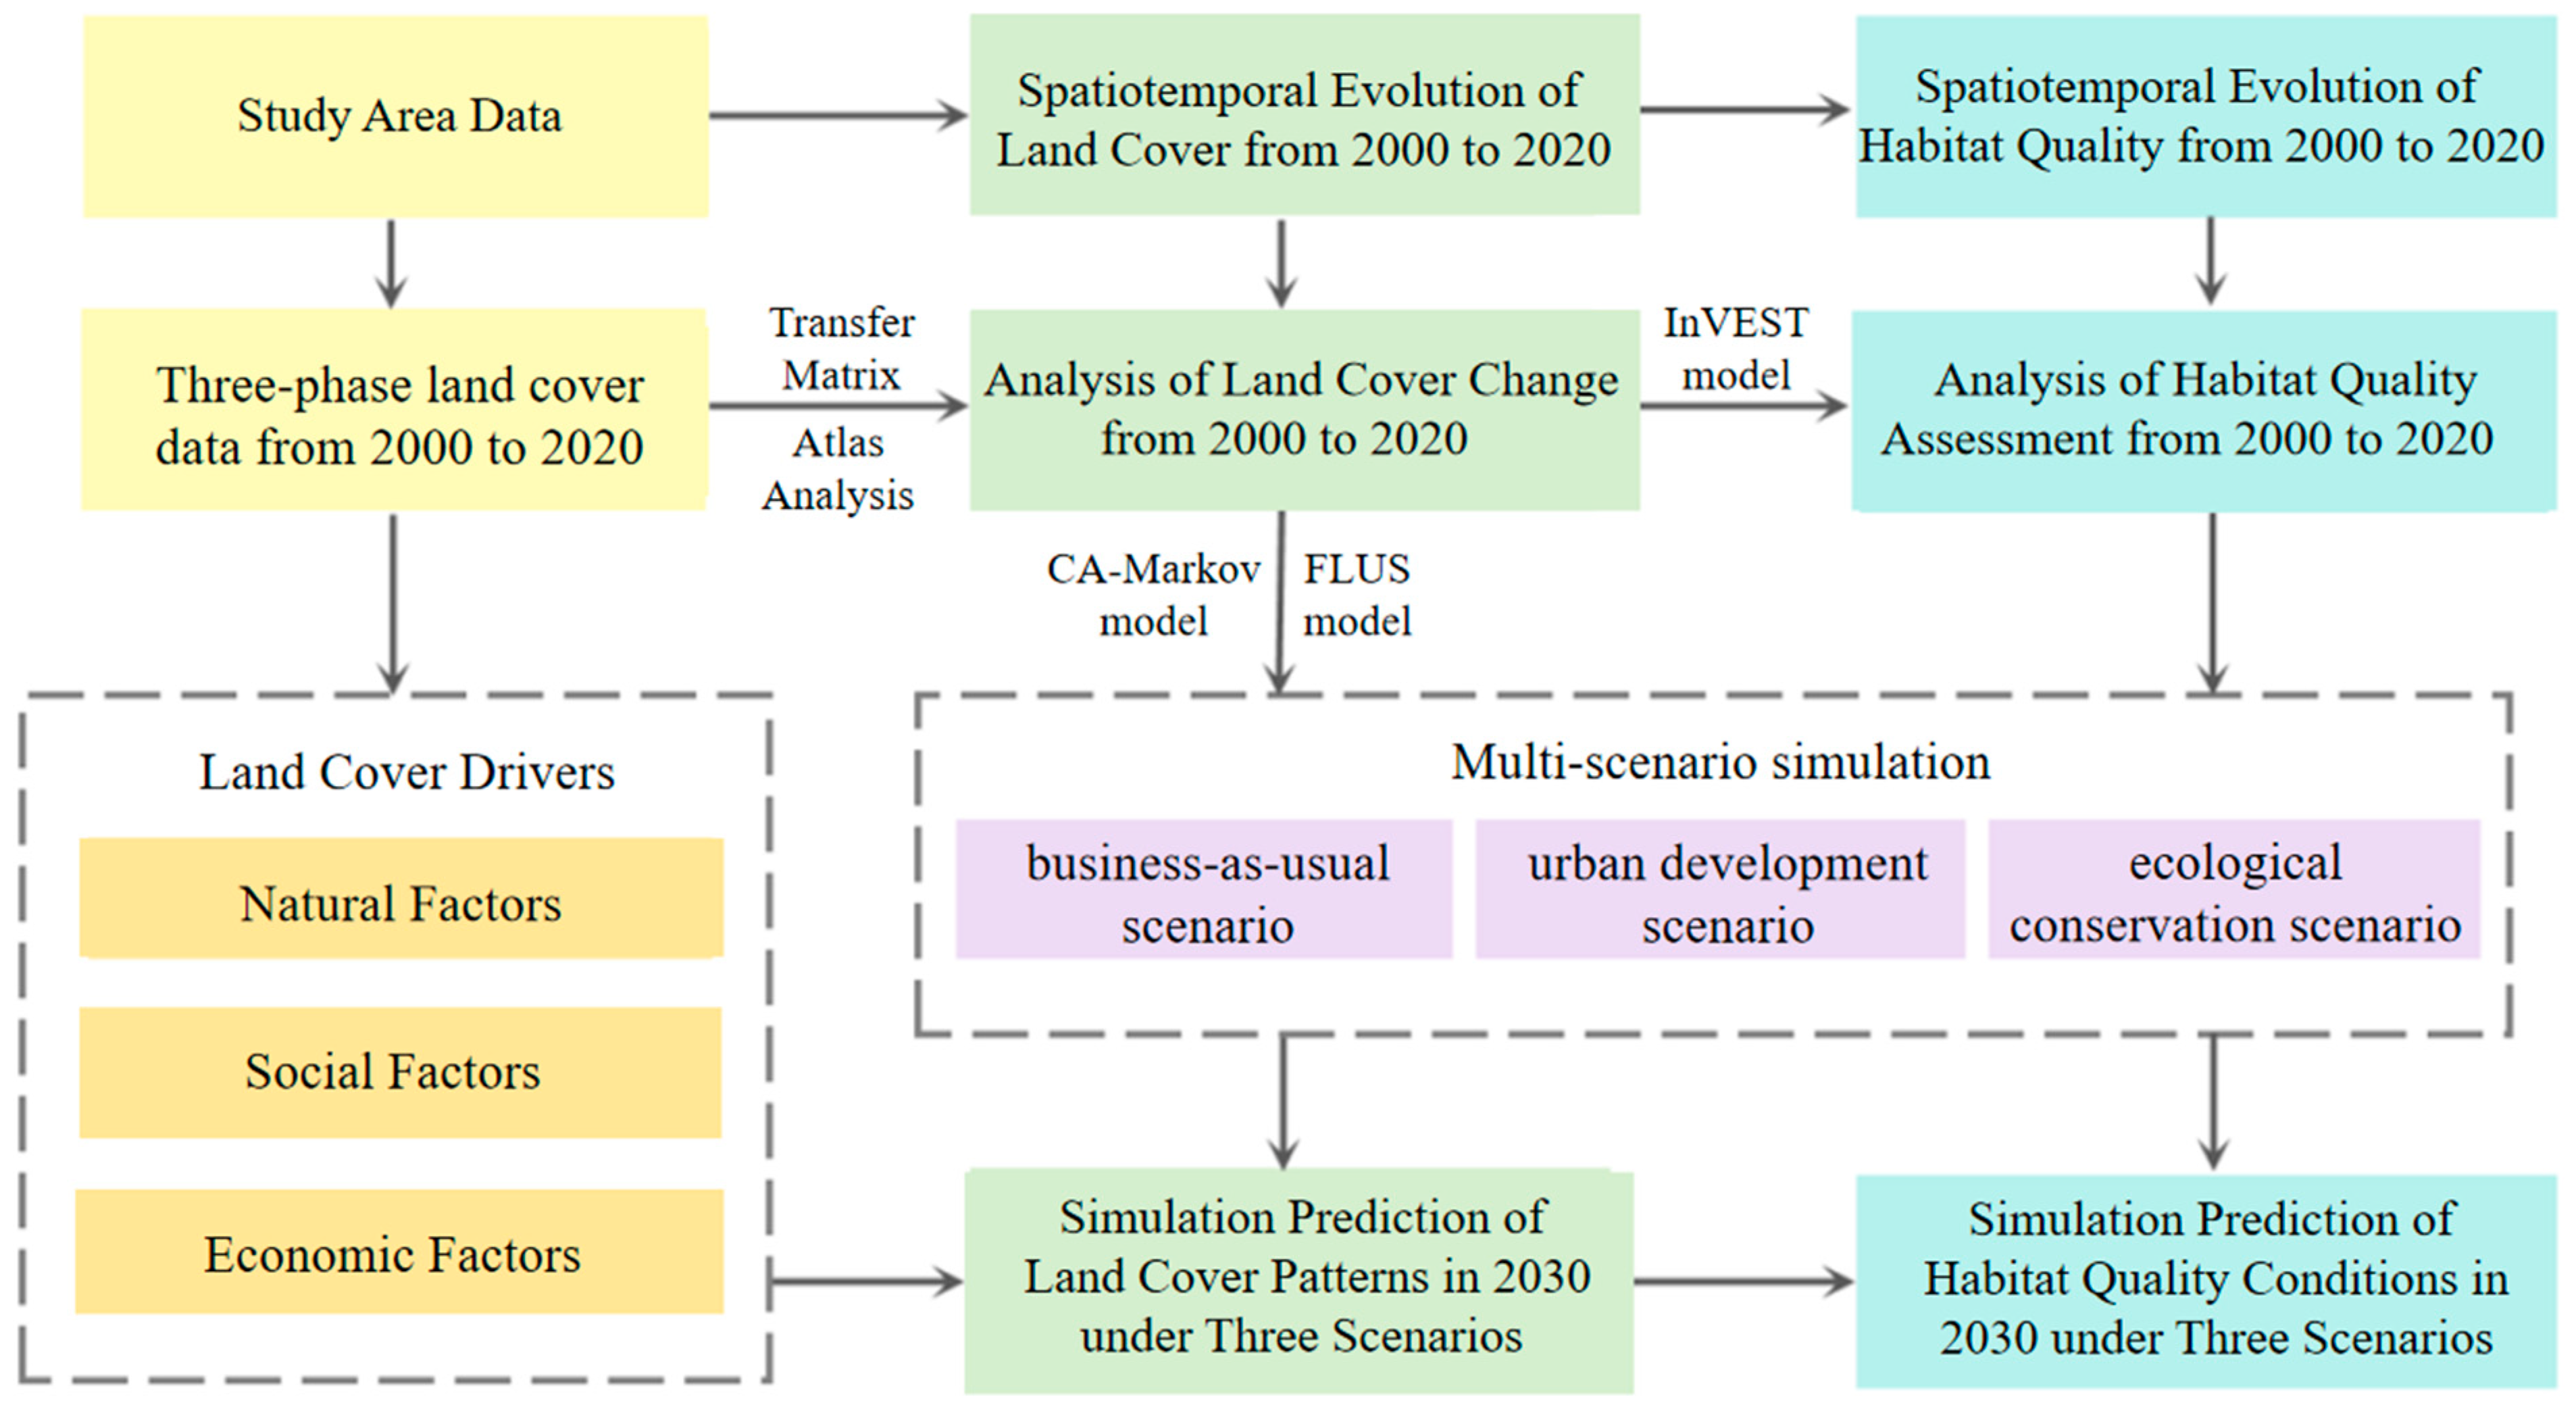
2.1. Research Framework

This research begins by using a transfer matrix and cartographic analysis to characterize urban land cover changes in Beijing across three time periods: 2000, 2010, and 2020. It then employs the Markov model to forecast the quantitative structure of land cover for 2030 under multiple scenarios. Following these projections, the Future land cover Simulation (FLUS) model is utilized to simulate the spatial distribution of land cover across different development scenarios. Finally, by leveraging three historical datasets of land cover and the outcomes from these simulation predictions, the Habitat Quality module within the InVEST model is covered to evaluate variations in habitat quality and the corresponding response trends under various scenarios. The specific research framework is detailed in Figure 1.

2.2. Study Area

As the capital of China, Beijing stands as not only the national center of politics and culture but also an important economic hub. According to the latest data, as of 2023, Beijing’s permanent population reached 21.766 million, with an urbanization rate of 87.80%, underscoring its advanced level of urban development. Geographically, Beijing is situated in the northern part of the North China Plain, at a latitude of 39 degrees 56 min north and a longitude of 116 degrees 20 min east. The city’s landscape primarily consists of plains, complemented by hills and mountainous areas, with elevations ranging from several tens of meters to over 2000 m (Figure 2). The climate is a temperate monsoon type, marked by distinct seasons, which creates favorable conditions for both living and production activities. In 2023, Beijing’s Gross Domestic Product (GDP) reached 4.4 trillion yuan, representing 3.63% of the national GDP, highlighting its pivotal role in the national economy. This economic prowess, combined with its geographical and climatic conditions, provides a distinctive background for urban development and related research. Studying habitat quality in Beijing offers unique advantages due to the city’s distinct urban dynamics and environmental policies. Beijing’s rapid urbanization and significant government land cover planning provide a valuable case study for understanding the impacts of anthropogenic activities on habitat quality. The city’s spatial heterogeneity and the government’s efforts to balance economic development with ecological protection create a complex but informative environment for habitat quality research. Such studies in Beijing can yield insights into sustainable urban development and conservation management, which apply to other rapidly urbanizing cities worldwide.

2.3. Data Sources and Processing

In this study, the land cover data for the three periods (2000, 2010, and 2020) were obtained from the Chinese Academy of Sciences Resource and Environment Data Sharing Center, featuring a spatial resolution of 30 m × 30 m. These data are further categorized into six types: cropland, forest land, grassland, water bodies, urban land, and unused land. To evaluate habitat quality comprehensively, we included additional data such as NDVI (Normalized Difference Vegetation Index) to estimate vegetation health and coverage and spatial data on population density, proximity to roads and urban centers, and industrial activity as proxies for external threats to habitats. Natural environments, transportation locations, and socio–economic factors influence land cover changes. The analysis employs key spatial variables, including natural characteristics such as the Digital Elevation Model (DEM), slope, and aspect; transportation location factors (distance to the city center, town center, rivers, railways, and highways); and socio–economic factors (population and GDP). DEM data are sourced from the Geospatial Data Cloud, with slope and aspect derived from this DEM data. Additionally, the GDP and population data for 2020 are grid–interpolated, and annual precipitation from 2000–2020 is spatially interpolated, both obtained from the Chinese Academy of Sciences Resource and Environment Data Sharing Centers (Table 1). To ensure consistency and comparability of the data, all raster data were standardized to a spatial resolution of 100 m × 100 m using the nearest–neighbor resampling method. The nearest–neighbor method was chosen because it is computationally efficient and preserves the original categorical nature of land cover data [11,30], which is crucial for maintaining the integrity of discrete land cover classes during resampling. The coordinate system was reprojected to WGS1984_UTM_ ZONE_50N to ensure consistency in spatial analysis.
Aspect data were quantified as northness and eastness to make them suitable for the presented models. Northness represents whether the aspect faces north (1) or south (−1), while eastness represents whether the aspect faces east (1) or west (−1). This method avoids using aspect values ranging from 0 to 360 degrees, making it more appropriate for the models used in this study. By integrating these diverse data sources, we aimed to provide a comprehensive evaluation of habitat quality that reflects both the physical characteristics of the land cover and the ecological pressures it faces.

2.4. Methods

2.4.1. Land Cover Simulation Based on the CA–Markov Model

This study employs the CA–Markov model within the FLUS2.4 software to predict the quantitative structure of land cover, merging the spatial analysis capabilities of the Cellular Automata (CA) model with the temporal analysis strengths of the Markov model [31]. The Cellular Automata (CA) comprises cells, cell states, neighborhoods, and transition rules, with the research approach of the model expanding from the simple behavior of individual cells to the global level [28]. The expression of the model is:
S t + 1 = f S t , N
In the formula: S(t+1) and S(t) are the sets of cell states at times t + 1 and t, respectively; N represents the neighborhood of the cell; f is the cell transition rule.
The Markov model utilizes probabilistic methods to estimate future outcomes in a random time series, basing predictions on current states and observed change trends [32]. The key to this model is acquiring the transition probability matrix for the phenomena. The expression for this is:
S t + 1 = P i j × S t
P i j = P 11 P 12 P 1 n P 21 P 22 P 2 n P n 1 P n 2 P n n
0 P i j < 1   a n d   j = 1 n P i j = 1 ( i , j = 1 , 2 , , n )

2.4.2. Simulation of Land Cover Spatial Distribution Based on the FLUS Model

This article employs the FLUS model in conjunction with the Markov model to simulate and predict the spatial distribution patterns of land cover in Beijing for the year 2030 under three different scenarios. The FLUS model, developed by Liu et al. [33] based on the principles of traditional cellular automata, operates by using artificial neural network algorithms to process baseline land cover data and various driving factors, estimating the development probabilities of different land types in the region. These probabilities are integrated with neighborhood influence factors, adaptive inertia coefficients, and conversion costs to calculate the overall transition probability of cells. A roulette competition mechanism determines the final simulation results [34]. As the neural network–based suitability probability calculation and adaptive inertia competition mechanism principles have been thoroughly explained in related studies, this article does not elaborate further, and specific references are cited [5].
(1)
Neighborhood Influence Factor
The “Neighborhood Influence Factor” encapsulates the interactions among different land cover types and between various units of the same land type within a neighborhood. These coefficients range from 0 to 1, with values directly proportional to the land cover’s expansion capability; values closer to 1 indicate a more robust expansion capability. A 3 × 3 Moore neighborhood is employed to define the neighborhood range. Based on related studies [35,36] and after multiple tests and adjustments, the neighborhood influence factor parameters for each land cover type are finalized, as shown in Table 2.
(2)
Conversion Costs and Restriction on Change Area Settings
Conversion costs represent the difficulty of transitioning from one land cover type to another. An analysis of Beijing’s land cover transfer matrix from 2000 to 2020 indicated that all land cover conversions are possible [37,38]. This paper has established three distinct conversion cost structures based on the scenarios outlined. In the natural development scenario, national land cover spatial planning constraints, such as general land cover and urban planning, are disregarded, focusing solely on urban expansion based on historical trends. The urban development scenario is designed such that, except for construction land, no transfers to other land cover types are allowed, and construction land does not convert to other land cover types. Land cover transfer rules are stringently enforced in the ecological protection scenario to prevent transfer out of forest, grassland, and water bodies. Additionally, construction land can be converted into forest and grassland for environmental restoration purposes.
(3)
Accuracy Verification
When verifying simulation accuracy, 2010 is used as the baseline data to simulate the land cover situation in 2020 using the methods above. Based on this, the Kappa coefficient is used to cross–compare and check the 2020 simulated map with the current map. The expression is as follows:
K a p p a = P 0 P c P p P c
In the formula, P0 is the ratio of the number of correctly simulated cells to the total number of cells; Pc is the ratio of the number of correctly simulated cells to the total number of cells under random conditions; and Pp is the ratio of the number of correctly simulated cells to the total number of cells under ideal conditions. When Kappa > 0.8, the simulation is excellent with high credibility and excellent consistency; when 0.6 < Kappa ≤ 0.8, the simulation is good with good consistency; when 0.4 < Kappa ≤ 0.6, the simulation is effective with moderate consistency; when 0.2 < Kappa ≤ 0., the simulation is poor; when Kappa ≤ 0.2, the simulation is very poor [39].

2.4.3. Land Cover Simulation Scenario Settings

Referencing related studies [40,41] and considering Beijing’s current development situation and future socio–economic planning, three scenarios were devised using the Markov model: natural development, urban development, and ecological protection. In the natural development scenario, the land cover class transition probabilities from 2020 to 2030 are maintained at the levels observed from 2000 to 2020. Drawing from the “Beijing City Master Plan (2016–2035)” and adjustments to the Markov process transition probabilities [42,43], the land cover transfer matrix from 2000 to 2020 is modified to establish the urban development and ecological protection scenarios. The natural development scenario disregards constraints from general land cover and urban planning, focusing exclusively on urban expansion based on historical trends. It primarily relies on the 2010–2020 land cover transfer probability matrix and suitable distribution probabilities. The urban development scenario ensures that apart from construction land, no transfer to other land cover classes occurs; it increases the transfer probabilities of agricultural land, forest land, and grassland to construction land by 20% while reducing the transfer probability of construction land to other land cover classes, excluding agricultural land, by 30%. The ecological protection scenario strictly limits the transfer of forest, grassland, and water bodies, setting construction land to be transferable to forest and grassland due to ecological restoration. The transfer probabilities of forest and grassland to construction land are reduced by 50% and agricultural land to construction land by 30%, and agricultural land and grassland to forest land are increased by 30%.

2.4.4. Habitat Quality Assessment Based on the InVEST Model

This study employs the Habitat Quality model within the InVEST 3.14.0 software to evaluate the habitat quality in Beijing. The InVEST biodiversity model factors in landscape type sensitivity and external threat intensity to determine the distribution of habitat quality, assessing the current state of biodiversity [44]. The InVEST model posits that regions with higher habitat quality scores are associated with richer biodiversity [45]. Its value range is from 0 to 1, where higher values indicate more stable ecosystems and higher habitat quality. The expression for the habitat quality score is:
Q x j = H j ( 1 D x j z D x j z + k z )
In the formula, Qxj is the habitat quality index for grid x within land cover type j; Hj is the habitat suitability of land cover type j; k and z are model default parameters [46]. Referencing the related literature [47] and considering actual conditions, this study defines agriculture, urban, industrial, and rural residential areas as threat factors. In addition to land cover, the model incorporates several other factors influencing habitat quality [47]:
(1)
NDVI (Normalized Difference Vegetation Index)
NDVI is used to estimate vegetation health and coverage, serving as a proxy for the presence and condition of vegetation within the study area.
(2)
Population Density
This metric accounts for human population distribution across the landscape, which can indicate the level of human disturbance and pressure on natural habitats.
(3)
Proximity to Roads and Urban Centers
These factors reflect the accessibility and potential disturbance from urban infrastructure and human activities. The closer a habitat is to roads and urban centers, the more likely it is to experience negative impacts on quality.
(4)
Industrial Activity
This factor considers the intensity and distribution of industrial activities, which can significantly impact habitat quality due to pollution and habitat fragmentation.
To accurately reflect these influences, the study defines specific threat factors including agriculture, urban, industrial, and rural residential areas. It sets different maximum impact distances and weights for these threat factors, as well as habitat suitability and the sensitivity of different habitats to these threats. The details are summarized in Table 3 and Table 4.
By integrating these diverse data sources and factors, the study aims to provide a comprehensive evaluation of habitat quality that reflects both the physical characteristics of the land cover and the ecological pressures it faces. This approach ensures that habitat quality assessments go beyond mere land cover classification, incorporating additional ecological indicators to capture a more accurate picture of habitat conditions.

3. Results

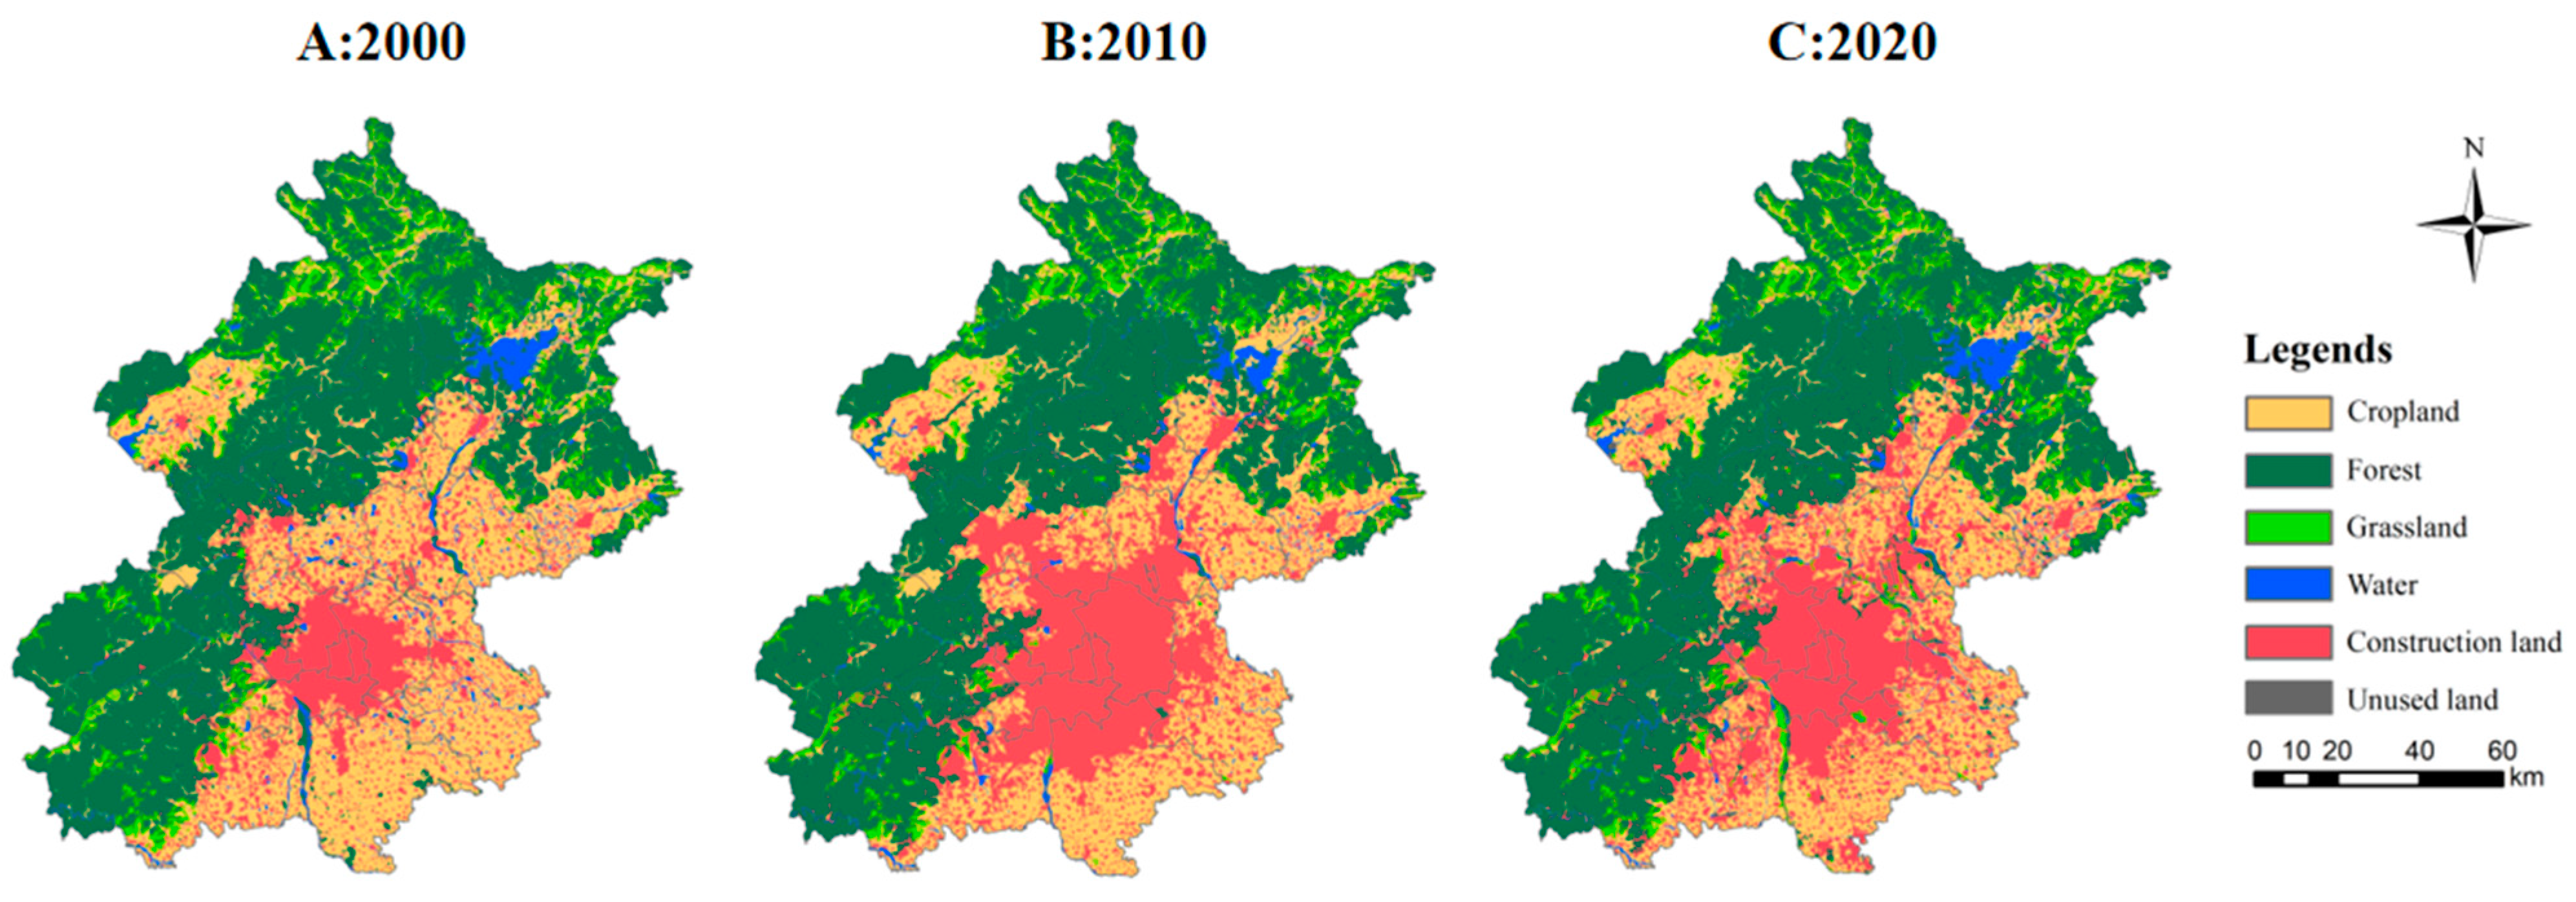
3.1. Spatiotemporal Characteristics of Land Cover Changes in Beijing from 2000 to 2020

The land cover distribution in Beijing from 2000 to 2020 is depicted in Figure 3. Forestland, as the most extensive type of land cover, is primarily located in the western, northern, and mountainous regions of Beijing, encompassing the Xishan, Jundu Mountains, and Yanshan ranges. Agricultural land ranks second in area and is found in the flatter southeastern parts of the city, with smaller patches in the northwest. Water bodies are mainly comprised of the Miyun Reservoir in the northeast and the Yongding and Chaobai rivers. Construction land is strategically placed between the Yongding and Chaobai rivers, forming the core area within the agricultural land type.
Over the last 20 years, Beijing has undergone significant changes in its land cover structure, marked by a dramatic expansion of construction land and a sharp decline in agricultural land. From 2000 to 2020, the construction land area increased from 2246.10 km2 to 3562.57 km2, an increase of 1316.47 km2, representing a growth rate of 58.60%. Simultaneously, agricultural land exhibited a substantial and continuous decline, dropping from 4913.25 km2 in 2000 to 3662.69 km2 in 2020, a reduction of 1250.56 km2 or 25%. Meanwhile, forestland, grassland, and water showed a trend of initial decline followed by growth over the 20 years. By 2020, forestland increased slightly from 7321.33 km2 in 2000 to 7479.77 km2. Grassland expanded from 1113.99 km2 in 2000 to 1255.46 km2 in 2020.
From Figure 4, it is evident that between 2000 and 2020, the primary source of Beijing’s construction land was agricultural land, with its conversion accounting for over 90% of the new construction area. During the decade 2000–2010, construction land expanded by 1596.17 km2, of which 1450.00 km2 was converted from agricultural land, representing 90.84% of the increase in construction land. Forestland accounted for a conversion of 189.53 km2 (11.87%). Spatial analysis shows that the expansion mainly involved construction land encroaching on surrounding agricultural land, with significant growth in districts such as Changping, Shunyi, Tongzhou, Daxing, Fangshan, and Mentougou. In contrast, from 2010 to 2020, the area of construction land shifted from expansion to contraction, decreasing by 279.46 km2, approximately 7.27% of the total. During this period, construction land was primarily converted back to agricultural land and forestland, with 405.75 km2 reverting to agriculture and 93.54 km2 to forestland. The contraction occurred primarily in the same regions that had expanded from 2000–2010, with notable reductions in Changping, Shunyi, and Daxing districts.

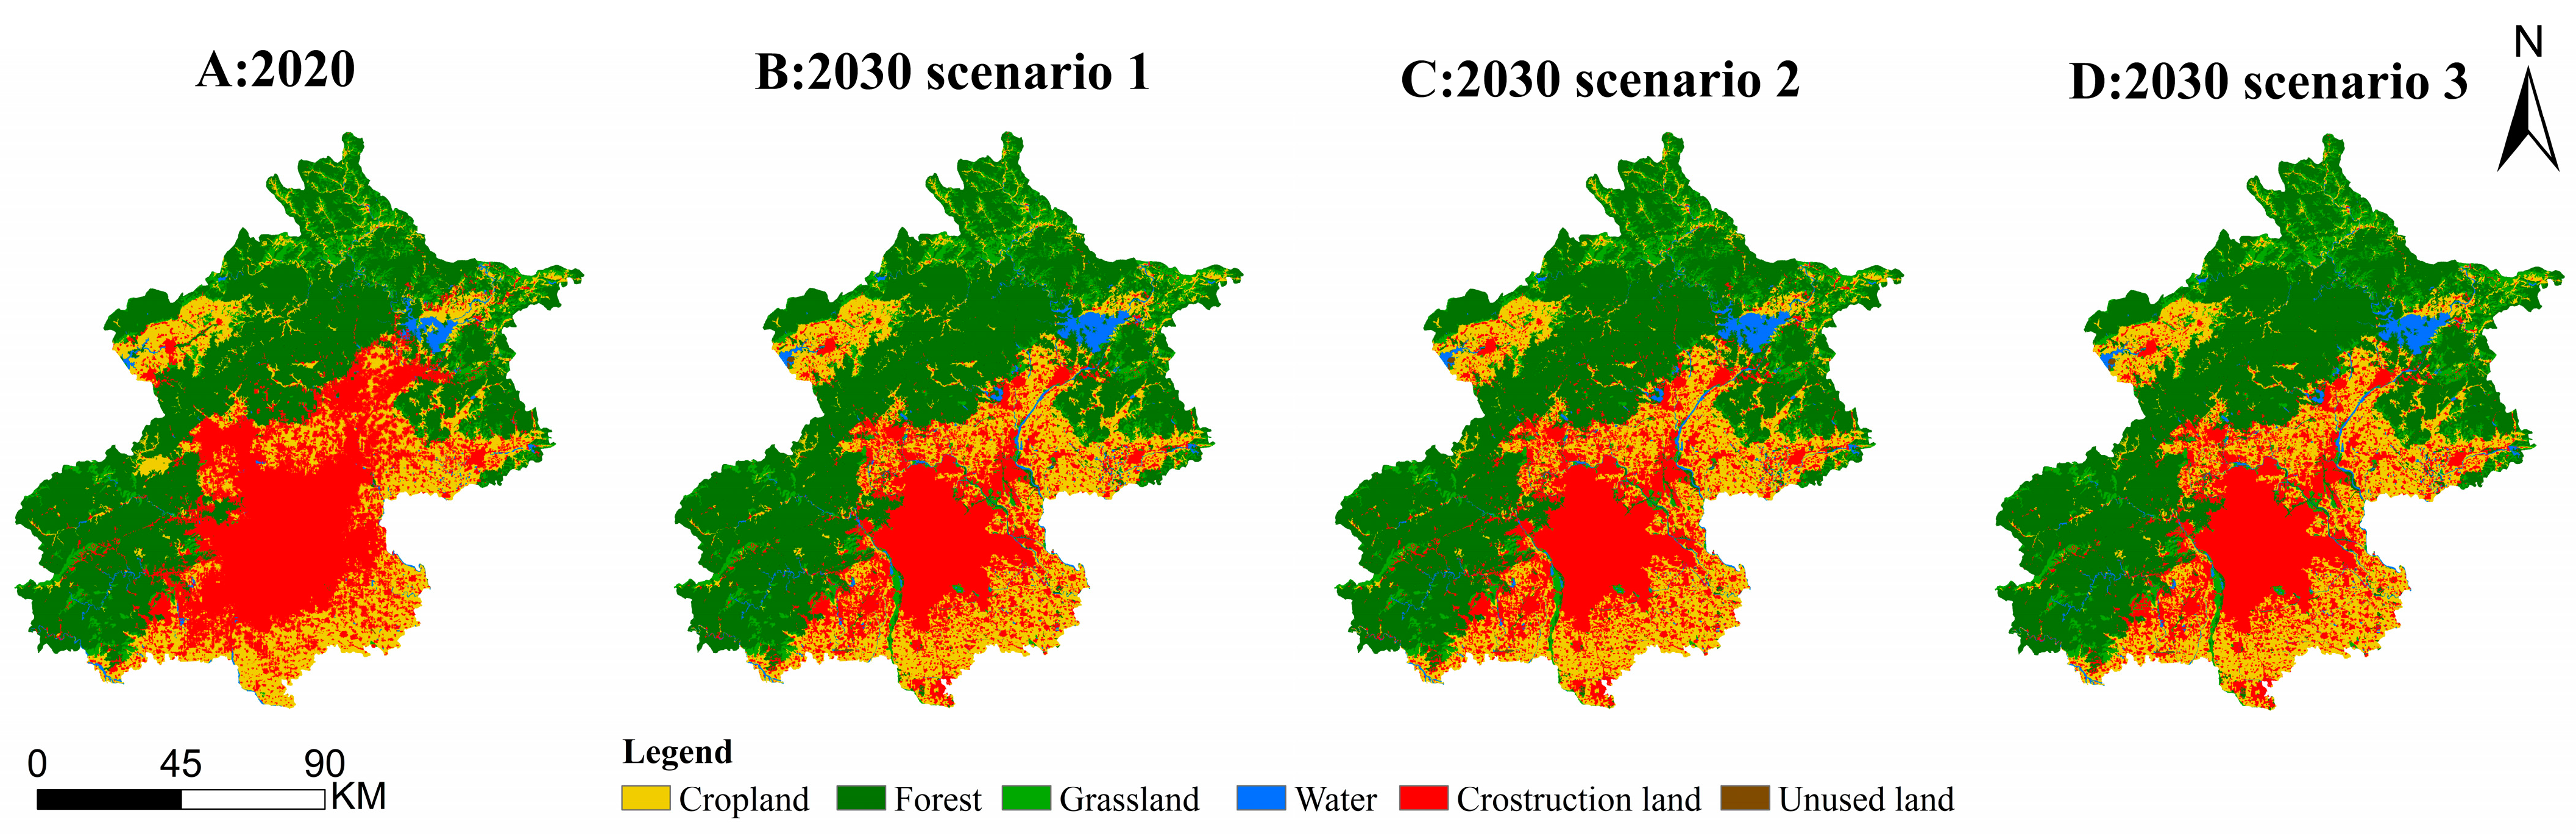
3.2. Simulation Prediction of Land Cover in Beijing in 2030 under Different Scenarios

Before forecasting Beijing’s land cover in 2030 using the coupled CA–Markov and FLUS models, it is essential first to predict the land cover structure for 2020 using data from 2010. This includes analyzing current land cover, roads, and urban centers using the CA–Markov model. On this basis, the FLUS model is employed to simulate the spatial distribution of land cover for 2030. The simulation results for 2020 are compared with the actual land cover status of that year. Observations and simulations of land cover maps for 2020 yield an overall accuracy of 0.908 and a Kappa coefficient of 0.853. Key land cover types such as arable, forest, and urban land have Kappa coefficients of 0.71, 0.94, and 0.91, respectively, indicating that the simulation predictions are well–suited for the study area. Based on this validated coupled CA–Markov and FLUS model, the land cover conditions under different scenarios for 2030 in Beijing are simulated with 2020 as the baseline (Figure 5). Overall, the regions with significant land cover changes in Beijing by 2030 under the three scenarios are primarily concentrated in the northern, southern, and central urban areas. Specifically, the changes manifest as follows:
(1)
In the natural development scenario, the urban land scale will expand to 22,123 km2 by 2030. Concurrently, other types of land, except other constructed land and water bodies, will continue to evolve following their existing trends.
(2)
Under the urban development scenario, the urban land area in 2030 will expand further compared to the natural development scenario, increasing to 22,871.875 km2. Concurrently, the areas of arable land, grassland, forest land, and unused land will all experience further reductions. By 2030, while urban land expansion in Beijing will notably diminish, the area of forest land will decrease further to 47,439.8125 km2.
(3)
In the ecological conservation scenario, the urban land area is projected to reach 21,723.1875 km2 by 2030. The spatial distribution of forested areas will extend outward from their existing locations, with notable expansion in the northern forests, increasing the total area to 47,889.375 km2. This indicates that implementing specific ecological conservation policies will significantly improve the ecological environment and maintain ecological balance. Furthermore, under the ecological conservation scenario, the area of arable land also increases, primarily due to a substantial reduction in construction land. The decreased construction land is mainly converted into forest and arable land, further contributing to ecological preservation.

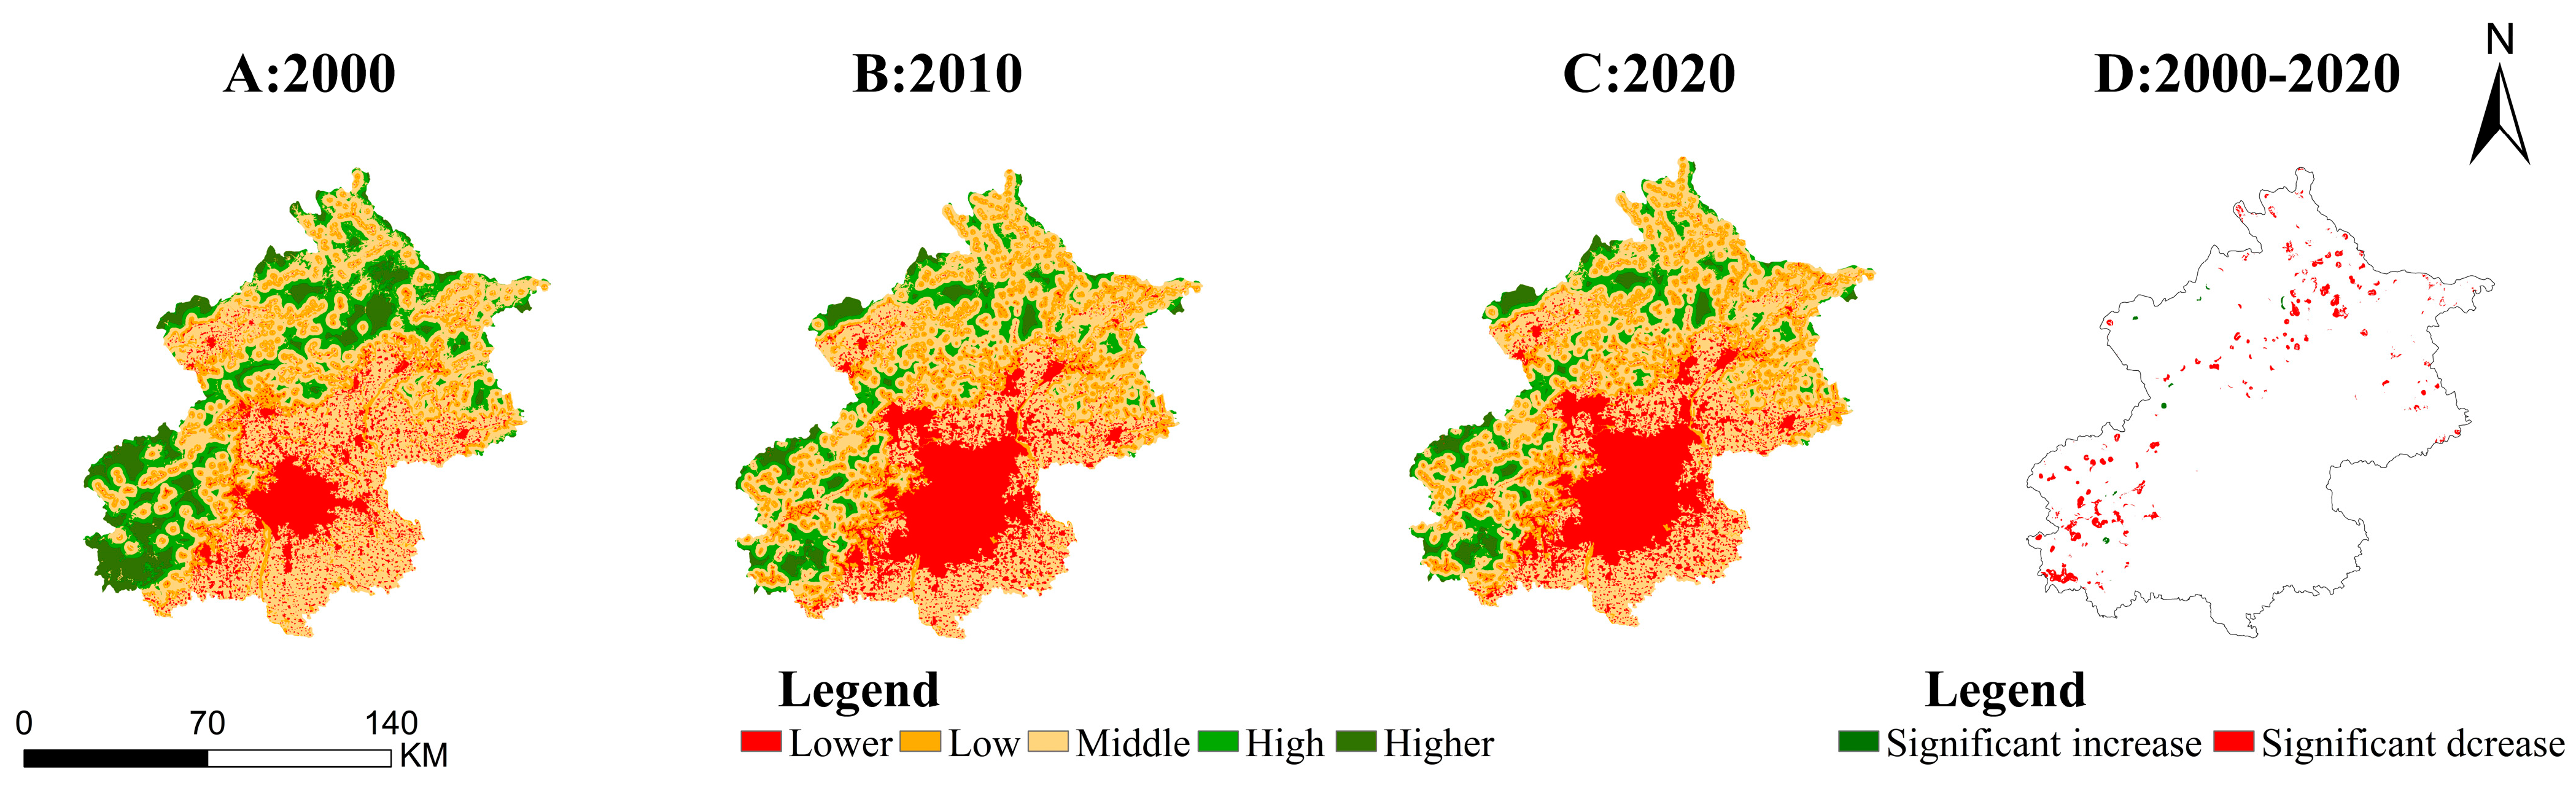
3.3. Spatiotemporal Evolution of Habitat Quality in Beijing from 2000 to 2020

The habitat quality in Beijing from 2000 to 2020 was assessed using the Habitat Quality model in the InVEST 3.14.0 software, guided by methodologies from relevant studies [12,44]. The results were categorized into five levels using the Equal Interval method in ArcMap software: high (0.81–1.00), moderately high (0.61–0.80), medium (0.41–0.60), moderately low (0.21–0.40), and low (0–0.20). Overall, Beijing’s habitat quality is at a medium level and has shown a continuous decline, with average habitat quality scores in 2000, 2010, and 2020 recorded at 0.444, 0.361, and 0.360, respectively. The analysis reveals an ongoing increase in areas of low habitat quality and a decrease in areas of high quality. The area of low–quality habitats increased from 13.70% in 2000 to 21.84% in 2020, primarily due to degradation from high, medium, and moderately low–quality areas (Figure 6). Concurrently, the area of high and moderately high–quality habitats decreased from 12,878.1875 km2 in 2010 to 12,089.625 km2 in 2020 (Figure 6).
Examining the spatial distribution of habitat quality from 2000 to 2020 in Beijing (as illustrated in Figure 6), it is evident that mountainous regions in the western and northern parts of the city exhibited higher habitat quality. In contrast, the eastern and southern plains showed lower quality. Over the 20–year period, significant changes occurred in the spatial patterns of habitat quality, marked by a noticeable expansion of areas with low habitat quality and a significant contraction of areas with high habitat quality.
The high–value habitat quality areas are primarily located in the high–altitude mountainous regions of the Western Hills, Jundu Mountains, and Yan Mountains in the northwestern part of Beijing. Over the span of 20 years, the proportion of high and moderately high–value areas decreased significantly, from 22.47% to 11.80%, nearly halving in size. According to Table 5, the area percentage of moderately high–value regions fell from 8.94% in 2000 to 2.94% in 2020, shrinking to a third of its original size. In contrast, low–value habitat areas are mainly found in the flatter central areas of the southeastern part, centered around Dongcheng, Xicheng, and Chaoyang districts, with a radial distribution extending to surrounding districts like Haidian, Shunyi, and Tongzhou. Over the same period, the proportion of moderately low and low–value areas increased from 28.44% to 43.92%, an increase of 53.38%. The expansion rate of low–value areas notably slowed from 28.44% in 2000 to 41.99% in 2010, with only a slight increase of 1.93% from 2010 to 2020. This trend correlates with a significant slowdown, and even decline, in the expansion rate of construction land in Beijing.
The changes in habitat quality in Beijing from 2000 to 2020 are illustrated in Figure 6. The areas experiencing significant declines far outnumber exceed those showing notable improvements, with both types of changes occurring in the mountainous regions of northwestern Beijing. The regions with significant declines are more widespread, mostly situated in the lower elevation areas of the Yan Mountains in the north and the Western Hills in the southwest. Conversely, the areas with noticeable improvements are primarily found in the lower–elevation zones of the Jundu Mountains in the west.

3.4. Simulation of Habitat Quality in Beijing for the Year 2030 Based on Different Scenarios

Using the coupled CA–Markov and FLUS models, along with the InVEST model, the habitat quality of Beijing in 2030 was assessed under three different scenarios, as illustrated in the figure. By 2030, the average habitat quality in Beijing under the natural development, urban development, and ecological conservation scenarios is projected to be 0.373, 0.359, and 0.375, respectively. Compared to 2020, the average habitat quality in Beijing in 2030 shows variations across these scenarios. Under the natural and urban development scenarios, the average habitat quality in Beijing is expected to decline further, whereas, under the ecological conservation scenario, an improvement is anticipated.
Overall, the areas showing the most significant differences in habitat quality class distribution under the three scenarios are primarily located in the northern region of Beijing (Figure 7). The distribution of low–value habitat quality areas is highly consistent with the spatial distribution of urban land, indicating that the expansion of urban areas directly impacts the distribution of low–value habitat areas within the region. Additionally, water bodies consistently maintain high–value habitat quality under all scenarios. While the quantity and spatial distribution of cropland, forestland, and grassland may vary across scenarios, these land types consistently fall within high–value habitat quality areas. The average habitat quality values are ranked across the three scenarios: ecological conservation scenario > natural development scenario > urban development scenario. The specific performance is as follows:
(1)
Under the natural development scenario, compared to 2020 (Figure 7), the overall habitat quality in Beijing is projected to decline by 2030. However, the proportion of high–value areas will increase by 0.8%. Despite the overall challenges to habitat quality, the rise in high–value habitat areas in Beijing highlights the effectiveness of recent environmental protection policies and natural ecological restoration efforts. This is particularly apparent in regions with rich biodiversity and significant ecological service functions, such as forests and wetlands. These observations suggest that future environmental management strategies should continue to focus on strengthening these areas’ protection and expansion to support Beijing’s ecological health and sustainable development.
(2)
Under the urban development scenario, accelerated urban expansion and rapid socio–economic development have led to a swift increase in urban land area while significantly reducing the areas of other land types. Consequently, the regions with low habitat quality have further expanded compared to the natural development scenario, mainly concentrated in the mountainous regions where the Yan Mountains and Jundu Mountains intersect, as well as central urban areas. Compared to 2020, the proportion of low–value habitat areas is expected to increase by 0.59% by 2030.
(3)
Under the ecological conservation scenario, the average habitat quality within the region improves to varying degrees, with the areas of poor habitat quality mainly concentrated in the urban central areas. By 2030, the proportion of high–value habitat areas in Beijing is expected to increase by 1.12% compared to 2020, while the area of low–value habitats is projected to decrease. Additionally, the areas showing an increase in high–value habitat quality under this scenario are primarily located in regions where forestland is expanding. Thus, it can be stated that forestland, as a habitat type, receives better protection under the ecological conservation scenario.

4. Discussion

4.1. Interaction between Urban Expansion and Habitat Quality

This study, by analyzing the land cover changes in Beijing from 2000 to 2020, reveals that the rapid expansion of urban areas has led to a significant reduction in cropland and forestland. This phenomenon is not unique to Beijing but is rather a global issue, with many significant cities showing a trend where ecological lands are being replaced by urban construction sites, thereby significantly degrading habitat quality [47]. For instance, in cities like Tokyo, comprehensive land cover policies have successfully mitigated some of the ecological impacts of urban expansion [48], highlighting the importance of policy interventions. Similarly, Romania’s initiatives in establishing ecological corridors have proven effective in maintaining biodiversity amidst urban growth [49]. In Bangalore, urban sprawl encroaching on coastal ecosystems and mangroves illustrates the widespread nature of this issue [50]. In urbanization, the continuous expansion of construction land is an inevitable trend. Moreover, this expansion triggers habitat fragmentation and the decline in ecosystem service functions [51], posing a severe threat to biodiversity [52]. Our research further underscores that habitat quality is influenced by more than just the type of land cover. Factors such as vegetation type, the extent of impervious surfaces, and proximity to urban centers significantly contribute to the overall habitat quality.
Habitat quality is a crucial indicator for assessing the ecological health of a region and accurately predicting its future changes is essential for developing effective ecological conservation and land management policies [28,53,54]. Research has established a close relationship between habitat quality and urban expansion; the direction and extent (pattern) of urban expansion directly influence changes in habitat quality [55]. For example, constructing ecological corridors and networks and optimizing the urban ecological security pattern can effectively mitigate the negative impacts of urban expansion on natural habitats [56,57]. Moreover, strong policies restricting urban development and expansion can enhance habitat quality [58]. The implementation of national policies such as the “Beijing Municipal Ecological Security Pattern Special Plan (2021–2035)” and initiatives aimed at protecting ecological conservation areas [59] have curbed continuous urban sprawl and minimized the encroachment of agricultural and urban lands on grasslands and forests. Therefore, managing habitat quality in urban areas requires a multi–faceted approach that includes not only land cover control but also attention to ecological threats such as industrial and agricultural activities. These measures have contributed to a virtuous cycle in the ecological environment, effectively promoting the maintenance of habitat quality.

4.2. Application of Models in Predicting Habitat Quality

This study utilizes the CA–Markov and FLUS models to forecast land cover scenarios for Beijing in 2030. It applies the InVEST model to evaluate the potential impacts of these scenarios on habitat quality. By comparing natural development, urban development, and ecological conservation scenarios, it was found that the ecological conservation scenario significantly enhances habitat quality, surpassing the outcomes of natural development and urban expansion scenarios. This multi–scenario simulation approach strengthens the scientific foundation for urban planning and ecological conservation decisions and highlights the extensive application potential of integrated modeling techniques in evaluating ecosystem services.
Urban expansion typically reduces natural habitats such as forests, grasslands, and water bodies, resulting in a decline in habitat quality (HQ) [60,61]. Under natural development scenarios, most ecological lands are overtaken by urban areas, rural settlements, and other constructed spaces, accelerating the loss of ecological land [62]. However, due to the diversity and complexity of natural conditions and socio–economic development, the specific impacts of urban expansion on habitat quality are challenging to quantify [63,64]. Utilizing the FLUS–InVEST model, it is evident that compared to the urban expansion scenario, the ecological conservation scenario, which involves stricter ecological protection policies, significantly mitigates the decline in habitat quality, reducing the decrease by 3.43% relative to the urban expansion scenario.
Based on these findings, the model offers urban planners and environmental conservationists a robust tool to scientifically assess and predict the potential impacts of different land cover strategies on ecosystem services and habitat quality. This aids in the precise formulation and implementation of targeted ecological conservation measures, thereby enhancing the protection and management of natural habitats in and around urban areas more effectively. Our methods and findings are also applicable to other rapidly urbanizing cities worldwide. For instance, in Shanghai, similar models can help balance urban growth and habitat conservation by predicting the impacts of various development scenarios [42]. In Bangalore, where urban sprawl threatens coastal ecosystems, these models can guide land–use policies to protect mangroves and other critical habitats [50]. Similarly, in Mexico City, which faces challenges with urban expansion and air quality, integrated modeling can support strategies to enhance green spaces and improve habitat quality [65].

4.3. Limitations and Future Research Directions

Currently, Habitat Quality (HQ) assessment largely depends on a comprehensive analysis of threat sources, habitat suitability, and sensitivity [66,67]. While we referenced the relevant literature to select assessment parameters and weights, these choices still carry a degree of subjectivity. Therefore, further scrutiny of the appropriateness of these parameters and weights is crucial for enhancing the accuracy of HQ assessments. The FLUS model used in this study shows clear advantages in improving simulation precision and generating realistic land cover patterns [68,69]. However, when accounting for urban spatial expansion, the model must fully consider factors such as topography, the ecological environment, and socio–economic conditions, including the impacts of local and regional policies and natural conditions like climate, precipitation, and soil [70]. Moreover, the effectiveness of coupling the FLUS–InVEST model largely depends on the predictive data on the land cover [71], which is significantly uncertain due to forecasting demands and changes in land costs [72]. Current models primarily focus on changes in construction land, yet they still need to integrate other critical factors, such as urban planning and land policies [73,74].
To address these concerns, future research should investigate the direct impacts of urban land scale on urban habitat quality and develop effective strategies for controlling the total extent of urban land cover. This includes evaluating strategies for redeveloping and reusing existing built environments to facilitate urban regeneration and enhance urban habitat quality [75]. Additionally, future studies should expand the application of multi–scenario simulations across a broader range of cities to validate the general applicability of these models and refine their predictive accuracy. Future research should delve into the intricate response mechanisms of various habitat types to urban expansion, assessing the long–term implications of these dynamics. Additionally, it is imperative to incorporate a comprehensive range of ecological, socio–economic, and cultural factors to refine the modeling of habitat quality changes. This necessitates a detailed quantification of the impacts of urban planning and land cover policies, encompassing a diverse spectrum of natural, social, climatic, and policy–related variables. Enhancing the scientific rigor and reliability of these models is crucial for the development of robust policies aimed at urban ecological conservation and sustainable development. Such an integrated approach will provide a more holistic and scientifically sound foundation for future urban planning and conservation initiatives, facilitating a balanced and sustainable coexistence between urban growth and ecological preservation.

5. Conclusions

This study employs a comprehensive approach using the CA–Markov, FLUS, and InVEST models to simulate and forecast land cover changes and habitat quality in Beijing through 2030 under different scenarios. Our findings offer critical insights for urban planning and ecological conservation:
(1)
From 2000 to 2010, Beijing’s urban land area surged by 1316.47 km2, reflecting intense urbanization. However, from 2010 to 2020, the urban land area slightly contracted by 279.46 km2, suggesting the effectiveness of recent land management policies. Model forecasts indicate that the urban development scenario will see the most extensive expansion by 2030, whereas the ecological conservation scenario will successfully limit urban growth to within 10%, demonstrating the impact of stringent land management strategies.
(2)
The period from 2000 to 2020 saw a general decline in habitat quality, particularly pronounced in central urban areas, spreading outward. However, the northern regions experienced a slower decline, attributed to extensive green spaces and forests. This suggests that conservation efforts have a buffering effect against urban expansion. Notably, the decline rate of habitat quality slowed significantly between 2010 and 2020, likely due to enhanced ecological protection policies.
(3)
By 2030, the ecological conservation scenario predicts the highest average habitat quality, followed by natural development, and then urban development. This scenario’s success is primarily due to increased forested areas, highlighting the critical role of land cover planning in habitat conservation. The results underscore the effectiveness of targeted ecological policies in improving habitat quality.
(4)
Incorporating diverse ecological factors into habitat quality assessments is crucial. Policymakers should balance economic growth with ecological sustainability, enforcing stricter land cover policies, especially in vulnerable areas. This approach ensures sustainable urban development without compromising ecological health.
(5)
The methodologies and insights from this study are not confined to Beijing but are applicable to other rapidly urbanizing cities like Shanghai, Bangalore, and Mexico City. These cities face similar challenges with land cover changes and habitat quality degradation due to urban expansion. Applying the CA–Markov, FLUS, and InVEST models in various contexts can help policymakers and urban planners manage land cover changes effectively, mitigating adverse impacts on habitat quality. This study provides a scalable framework for sustainable urban planning globally.

Author Contributions

Conceptualization, Z.W.; Validation, T.G.; Writing—original draft, X.Z.; Writing—review & editing, X.Z.; Supervision, Y.Z.; Project administration, Y.Z.; Funding acquisition, Z.W. All authors have read and agreed to the published version of the manuscript.

Funding

This research was funded by the National Key R&D Program of China (2023YFF1304605).

Data Availability Statement

Data are contained within the article.

Acknowledgments

The authors are grateful to the editor and reviewers for their valuable comments and suggestions.

Conflicts of Interest

The authors declare no conflicts of interest.

References

  1. Kates, R.W.; Parris, T.M. Long–term trends and a sustainability transition. Proc. Natl. Acad. Sci. USA 2003, 100, 8062–8067. [Google Scholar] [CrossRef] [PubMed]
  2. Zhong, S.; Wang, M.; Zhu, Y.; Chen, Z.; Huang, X. Urban expansion and the urban–rural income gap: Empirical evidence from China. Cities 2022, 129, 103831. [Google Scholar] [CrossRef]
  3. Liu, Y.; Fan, P.; Yue, W.; Song, Y. Impacts of land finance on urban sprawl in China: The case of Chongqing. Land Use Policy 2018, 72, 420–432. [Google Scholar] [CrossRef]
  4. Zhou, B.B.; Lü, L.G. Understanding the dynamics of farmland loss in a rapidly urbanizing region: A problem–driven, diagnostic approach to landscape sustainability. Landscape Ecol. 2020, 35, 2471–2486. [Google Scholar] [CrossRef]
  5. Elmqvist, T.; Andersson, E.; Frantzeskaki, N.; McPhearson, T.; Olsson, P.; Gaffney, O.; Takeuchi, K.; Folke, C. Sustainability and resilience for transformation in the urban century. Nat. Sustain. 2019, 2, 267–273. [Google Scholar] [CrossRef]
  6. Angel, S.; Parent, J.; Civco, D.L.; Blei, A.M.; Potere, D. The dimensions of global urban expansion: Estimates and projections for all countries, 2000–2050. Prog. Plan. 2011, 75, 53–107. [Google Scholar] [CrossRef]
  7. Abd–Elmabod, S.K.; Fitch, A.C.; Zhang, Z.; Ali, R.R.; Jones, L. Rapid urbanisation threatens fertile agricultural land and soil carbon in the Nile delta. J. Environ. Manag. 2019, 252, 109668. [Google Scholar] [CrossRef] [PubMed]
  8. Li, F.; Wang, L.; Chen, Z.; Clarke, K.C.; Li, M.; Jiang, P. Extending the SLEUTH model to integrate habitat quality into urban growth simulation. J. Environ. Manag. 2018, 217, 486–498. [Google Scholar] [CrossRef] [PubMed]
  9. Liu, C.F.; Wang, C. Spatio–temporal evolution characteristics of habitat quality in the loess hilly region based on land use change: A case study in Yuzhong County. Acta Ecol. Sin. 2018, 38, 7300–7311. [Google Scholar]
  10. Bai, L.; Xiu, C.; Feng, X.; Liu, D. Influence of urbanization on regional habitat quality: A case study of Changchun City. Habitat Int. 2019, 93, 102042. [Google Scholar] [CrossRef]
  11. Eigenbrod, F.; Bell, V.A.; Davies, H.N.; Heinemeyer, A.; Armsworth, P.R.; Gaston, K.J. The impact of projected increases in urbanization on ecosystem services. Proc. R. Soc. B 2011, 278, 3201–3208. [Google Scholar] [CrossRef]
  12. Grimm, N.B.; Faeth, S.H.; Golubiewski, N.E.; Redman, C.L.; Wu, J.; Bai, X.; Briggs, J.M. Global change and the ecology of cities. Science 2008, 319, 756–760. [Google Scholar] [CrossRef]
  13. Lyu, R.; Zhang, J.; Xu, M.; Li, J. Impacts of urbanization on ecosystem services and their temporal relations: A case study in Northern Ningxia, China. Land Use Policy 2018, 77, 163–173. [Google Scholar] [CrossRef]
  14. Wang, X.; Su, F.; Yan, F.; Zhang, X.; Wang, X. Effects of Coastal Urbanization on Habitat Quality: A Case Study in Guangdong–Hong Kong–Macao Greater Bay Area. Land 2023, 12, 34. [Google Scholar] [CrossRef]
  15. McDonald, R.I.; Kareiva, P.; Forman, R.T. The implications of current and future urbanization for global protected areas and biodiversity conservation. Biol. Conserv. 2008, 141, 1695–1703. [Google Scholar] [CrossRef]
  16. Bryan, B.A.; Raymond, C.M.; Crossman, N.D.; Macdonald, D.H. Targeting the management of ecosystem services based on social values: Where, what, and how? Landsc. Urban Plan. 2010, 97, 111–122. [Google Scholar] [CrossRef]
  17. Chang, Y.; Hou, K.; Wu, Y.; Li, X.; Zhang, J. A conceptual framework for establishing the index system of ecological environment evaluation: A case study of the upper Hanjiang River, China. Ecol. Indic. 2019, 107, 105568. [Google Scholar] [CrossRef]
  18. Amir Siddique, M.; Wang, Y.; Xu, N.; Ullah, N.; Zeng, P. The spatiotemporal implications of urbanization for urban heat islands in Beijing: A predictive approach based on CA–Markov modeling (2004–2050). Remote Sens. 2021, 13, 4697. [Google Scholar] [CrossRef]
  19. Qian, M.; Huang, Y.; Cao, Y.; Wu, J.; Xiong, Y. Ecological network construction and optimization in Guangzhou from the perspective of biodiversity conservation. J. Environ. Manag. 2023, 336, 117692. [Google Scholar] [CrossRef]
  20. Liao, H.; Sarver, E.; Krometis, L.-A.H. Interactive effects of water quality, physical habitat, and watershed anthropogenic activities on stream ecosystem health. Water Res. 2018, 130, 69–78. [Google Scholar] [CrossRef]
  21. Sarkar, B.; Islam, A.; Das, B.C. Role of declining discharge and water pollution on habitat suitability of fish community in the Mathabhanga–Churni River, India. J. Clean. Prod. 2021, 326, 129426. [Google Scholar] [CrossRef]
  22. Dehini, G.K.; Gomes, P.I.A. Deriving optimal hydraulic, water quality, and habitat quality criteria against a predefined reference state of urban canals via an analytical method: Implications on ecological rehabilitation. Ecol. Eng. 2022, 182, 106697. [Google Scholar] [CrossRef]
  23. Wu, L.; Sun, C.; Fan, F. Estimating the characteristic spatiotemporal variation in habitat quality using the InVEST model—A case study from Guangdong–Hong Kong–Macao Greater Bay Area. Remote Sens. 2021, 13, 1008. [Google Scholar] [CrossRef]
  24. Yohannes, H.; Soromessa, T.; Argaw, M.; Dewan, A. Spatio–temporal changes in habitat quality and linkage with landscape characteristics in the Beressa watershed, Blue Nile basin of Ethiopian highlands. J. Environ. Manag. 2021, 281, 111885. [Google Scholar] [CrossRef] [PubMed]
  25. Wang, W.; Yang, J.; Yang, G. Coordination characteristics and influencing mechanisms of habitat quality, ecological sensitivity, and net primary production: A case study on the Yangtze River economic belt in China. Environ. Dev. 2024, 49, 100969. [Google Scholar] [CrossRef]
  26. Liu, W.; Zhan, J.; Zhao, F.; Wang, C.; Zhang, F.; Teng, Y.; Chu, X.; Kumi, M.A. Spatio–temporal variations of ecosystem services and their drivers in the Pearl River Delta, China. J. Clean. Prod. 2022, 337, 130466. [Google Scholar] [CrossRef]
  27. Cui, G.; Zhang, Y.; Shi, F.; Jia, W.; Pan, B.; Han, C.; Liu, Z.; Li, M.; Zhou, H. Study of spatiotemporal changes and driving factors of habitat quality: A case study of the agro–pastoral ecotone in Northern Shaanxi, China. Sustainability 2022, 14, 5141. [Google Scholar] [CrossRef]
  28. Cao, Q.; Zhang, X.; Lei, D.; Guo, L.; Sun, X.; Kong, F.; Wu, J. Multi–scenario simulation of landscape ecological risk probability to facilitate different decision–making preferences. J. Clean. Prod. 2019, 227, 325–335. [Google Scholar] [CrossRef]
  29. Rahim, A. The influence of the calibration interval on simulating non–stationary urban growth dynamic using CA–Markov model. Remote Sens. 2021, 13, 468. [Google Scholar] [CrossRef]
  30. Lehner, B.; Messager, M.L.; Korver, M.C.; Linke, S. Global hydro–environmental lake characteristics at high spatial resolution. Sci. Data 2022, 9, 351. [Google Scholar] [CrossRef]
  31. Guan, D.; Zhao, Z.; Tan, J. Dynamic simulation of land use change based on logistic–CA–Markov and WLC–CA–Markov models: A case study in the three gorges reservoir area of Chongqing, China. Environ. Sci. Pollut. Res. 2019, 26, 20669–20688. [Google Scholar] [CrossRef] [PubMed]
  32. Mansour, S.; Al–Belushi, M.; Al–Awadhi, T. Monitoring land use and land cover changes in the mountainous cities of Oman using GIS and CA–Markov modelling techniques. Land Use Policy 2020, 91, 104414. [Google Scholar] [CrossRef]
  33. Liu, X.P.; Liang, X.; Li, X.; Xu, X.C.; Ou, J.P.; Chen, Y.M.; Li, S.Y.; Wang, S.J.; Pei, F.S. A future land use simulation model (FLUS) for simulating multiple land use scenarios by coupling human and natural effects. Landsc. Urban Plan. 2017, 168, 94–116. [Google Scholar] [CrossRef]
  34. Xu, L.; Liu, X.; Tong, D.; Liu, Z.; Yin, L.; Zheng, W. Forecasting urban land use change based on cellular automata and the PLUS model. Land 2022, 11, 652. [Google Scholar] [CrossRef]
  35. Yang, Y.Y.; Bao, W.K.; Liu, Y.S. Scenario simulation of land system change in the Beijing–Tianjin–Hebei region. Land Use Policy 2020, 96, 104677. [Google Scholar] [CrossRef]
  36. Li, H.H.; Song, W. Pattern of spatial evolution of rural settlements in the Jizhou District of China during 1962–2030. Appl. Geogr. 2020, 122, 102247. [Google Scholar] [CrossRef]
  37. Liao, J.; Shao, G.; Wang, C.; Tang, L.; Huang, Q.; Qiu, Q. Urban sprawl scenario simulations based on cellular automata and ordered weighted averaging ecological constraints. Ecol. Indic. 2019, 107, 105572. [Google Scholar] [CrossRef]
  38. Dong, N.; You, L.; Cai, W.; Li, G.; Lin, H. Land use projections in China under global socioeconomic and emission scenarios: Utilizing a scenario–based land–use change assessment framework. Glob. Environ. Chang. 2018, 50, 164–177. [Google Scholar] [CrossRef]
  39. Zhao, Q.; Shao, J. Evaluating the impact of simulated land use changes under multiple scenarios on ecosystem services in Ji’an, China. Ecol. Indic. 2023, 156, 111040. [Google Scholar] [CrossRef]
  40. Liu, J.; Li, J.; Qin, K.; Zhou, Z.; Yang, X.; Li, T. Changes in land–uses and ecosystem services under multi–scenarios simulation. Sci. Total Environ. 2017, 586, 522–526. [Google Scholar] [CrossRef]
  41. Cui, Y.; Khan, S.U.; Deng, Y.; Zhao, M.; Hou, M. Environmental improvement value of agricultural carbon reduction and its spatiotemporal dynamic evolution: Evidence from China. Sci. Total Environ. 2021, 754, 42170. [Google Scholar] [CrossRef] [PubMed]
  42. Xiao, R.; Guo, Y.; Zhang, Z.; Li, Y. A Hidden Markov Model based unscented Kalman Filtering framework for ecosystem health prediction: A case study in Shanghai–Hangzhou Bay Urban Agglomeration. Ecol. Indic. 2022, 138, 108854. [Google Scholar] [CrossRef]
  43. Alberti, M.; Booth, D.; Hill, K.; Coburn, B.; Avolio, C.; Coe, S.; Spirandelli, D. The impact of urban patterns on aquatic ecosystems: An empirical analysis in Puget lowland sub–basins. Landsc. Urban Plan. 2007, 80, 345–361. [Google Scholar] [CrossRef]
  44. Yang, Y.; Tian, Y.; Zhang, Q.; Tao, J.; Huang, Y.; Gao, C.; Lin, J.; Wang, D. Impact of current and future land use change on biodiversity in Nanliu River Basin, Beibu Gulf of South China. Ecol. Indic. 2022, 141, 109093. [Google Scholar] [CrossRef]
  45. Li, S.P.; Liu, J.L.; Lin, J.; Fan, S.-L. Spatial and temporal evolution of habitat quality in Fujian Province, China based on the land use change from 1980 to 2018. Chin. J. Appl. Ecol. 2020, 31, 4080–4090. [Google Scholar]
  46. Wang, B.; Oguchi, T.; Liang, X. Evaluating future habitat quality responding to land use change under different city compaction scenarios in Southern China. Cities 2023, 140, 104410. [Google Scholar] [CrossRef]
  47. Aneseyee, B.A.; Noszczyk, T.; Soromessa, T.T.; Elias, E. The InVEST habitat quality model associated with land use/cover changes: A qualitative case study of the Winike watershed in the Omo–Gibe basin, southwest Ethiopia. Remote Sens. 2020, 12, 1103. [Google Scholar] [CrossRef]
  48. Zhang, R.; Yan, W.; Shaw, R. Land Use Planning and Conservation Policy in the Tokyo Metropolitan Area. In Resilient and Adaptive Tokyo; Springer: Singapore, 2024; pp. 79–103. [Google Scholar]
  49. Popescu, O.-C.; Tache, A.-V.; Petrișor, A.-I. Methodology for Identifying Ecological Corridors: A Spatial Planning Perspective. Land 2022, 11, 1013. [Google Scholar] [CrossRef]
  50. Nagendra, H.; Gopal, D. Street trees in Bangalore: Density, diversity, composition and distribution. Urban For. Urban Green. 2010, 9, 129–137. [Google Scholar] [CrossRef]
  51. Sun, X.Y.; Jiang, Z.; Liu, F.; Zhang, D. Monitoring spatio–temporal dynamics of habitat quality in Nansihu Lake basin, eastern China, from 1980 to 2015. Ecol. Indic. 2019, 102, 716–723. [Google Scholar] [CrossRef]
  52. Hoekstra, A.Y.; Buurman, J.; van Ginkel, K.C.H. Urban water security: A review. Environ. Res. Lett. 2018, 13, 053002. [Google Scholar] [CrossRef]
  53. Haddad, N.M.; Brudvig, L.A.; Clobert, J.; Davies, K.F.; Gonzalez, A.; Holt, R.D.; Lovejoy, T.E.; Sexton, J.O.; Austin, M.P.; Collins, C.D.; et al. Habitat fragmentation and its lasting impacts on Earth’s ecosystems. Sci. Adv. 2015, 1, e1500052. [Google Scholar] [CrossRef] [PubMed]
  54. Beninde, J.; Veith, M.; Hochkirch, A. Biodiversity in cities needs space: A meta–analysis of factors determining intra–urban biodiversity variation. Ecol. Lett. 2015, 18, 581–592. [Google Scholar] [CrossRef] [PubMed]
  55. Zhang, D.; Wang, X.; Qu, L.; Li, S.; Lin, Y.; Yao, R.; Zhou, X.; Li, J. Land use/cover predictions incorporating ecological security for the Yangtze River Delta region, China. Environ. Sci. Policy 2020, 119, 106841. [Google Scholar] [CrossRef]
  56. Johnson, M.D. Measuring habitat quality: A review. Ornithol. Appl. 2007, 109, 489–504. [Google Scholar] [CrossRef]
  57. Song, S.; Liu, Z.; He, C.; Lu, W. Evaluating the effects of urban expansion on natural habitat quality by coupling localized shared socioeconomic pathways and the land use scenario dynamics–urban model. Ecol. Indic. 2020, 112, 106071. [Google Scholar] [CrossRef]
  58. Van Delden, H.; Luja, P.; Engelen, G. Integration of multi–scale dynamic spatial models of socio–economic and physical processes for river basin management. Environ. Model. Softw. 2007, 22, 223–238. [Google Scholar] [CrossRef]
  59. Qin, M.; Sun, M.; Li, J. Impact of environmental regulation policy on ecological efficiency in four major urban agglomerations in eastern China. Ecol. Indic. 2021, 130, 108002. [Google Scholar] [CrossRef]
  60. Mu, H.; Li, X.; Ma, H.; Du, X.; Huang, J.; Su, W.; Yu, Z.; Xu, C.; Liu, H.; Yin, D.; et al. Evaluation of the policy–driven ecological network in the Three–North Shelterbelt region of China. Landsc. Urban Plan. 2022, 218, 104305. [Google Scholar] [CrossRef]
  61. Meng, F.; Guo, J.; Guo, Z.; Lee, J.C.K.; Liu, G.; Wang, N. Urban ecological transition: The practice of ecological civilization construction in China. Sci. Total Environ. 2021, 755, 142633. [Google Scholar] [CrossRef]
  62. Kamwi, J.M.; Cho, M.A.; Kaetsch, C.; Manda, S.O.; Graz, F.P.; Chirwa, P.W. Assessing the Spatial Drivers of Land Use and Land Cover Change in the Protected and Communal Areas of the Zambezi Region, Namibia. Land 2018, 7, 131. [Google Scholar] [CrossRef]
  63. He, J.; Huang, J.; Li, C. The evaluation for the impacts of land use change on habitat quality: A joint contribution of cellular automata scenario simulation and habitat quality assessment model. Ecol. Model. 2017, 366, 58–67. [Google Scholar] [CrossRef]
  64. Ren, Q.; He, C.; Huang, Q.; Shi, P.; Zhang, D.A.; Güneralp, B. Impacts of urban expansion on natural habitats in global drylands. Nat. Sustain. 2022, 5, 869–878. [Google Scholar] [CrossRef]
  65. Fragkias, M.; Seto, K.C. Evolving urban form and transportation in a rapidly urbanizing region: The case of the Mexico City metropolitan area. Environ. Plan. B Plan. Des. 2009, 36, 286–303. [Google Scholar]
  66. Song, Y.; Wang, M.; Sun, X.; Fan, Z. Quantitative assessment of the habitat quality dynamics in Yellow River Basin, China. Environ. Monit. Assess. 2021, 193, 614. [Google Scholar] [CrossRef] [PubMed]
  67. Raji, S.A.; Odunuga, S.; Fasona, M. Spatially explicit scenario analysis of habitat quality in a tropical semi–arid zone: Case study of the Sokoto–Rima Basin. J. Geovisualization Spat. Anal. 2022, 6, 1–21. [Google Scholar] [CrossRef]
  68. Fang, L.; Wang, L.; Chen, W.; Sun, J.; Cao, Q.; Wang, S.; Wang, L. Identifying the impacts of natural and human factors on ecosystem service in the Yangtze and Yellow River Basins. J. Clean. Prod. 2021, 314, 127995. [Google Scholar] [CrossRef]
  69. Seto, K.C.; Güneralp, B.; Hutyra, L.R. Global forecasts of urban expansion to 2030 and direct impacts on biodiversity and carbon pools. Proc. Natl. Acad. Sci. USA 2012, 109, 16083–16088. [Google Scholar] [CrossRef]
  70. Wei, L.; Zhou, L.; Sun, D.; Yuan, B.; Hu, F. Evaluating the impacts of urban expansion on the habitat quality and constructing ecological security patterns: A case study of Jiziwan in the Yellow River Basin, China. Ecol. Indic. 2022, 145, 109544. [Google Scholar] [CrossRef]
  71. Ding, Q.; Chen, Y.; Bu, L.; Ye, Y. Multi–scenario analysis of habitat quality in the Yellow River delta by coupling FLUS with InVEST model. Int. J. Environ. Res. Public Health 2021, 18, 2389. [Google Scholar] [CrossRef]
  72. Chen, Z.; Huang, M.; Zhu, D.; Altan, O. Integrating remote sensing and a Markov–FLUS model to simulate future land use changes in Hokkaido, Japan. Remote Sens. 2021, 13, 2621. [Google Scholar] [CrossRef]
  73. Hou, Y.; Li, B.; Müller, F.; Chen, W. Ecosystem services of human–dominated watersheds and land use influences: A case study from the Dianchi Lake watershed in China. Environ. Monit. Assess. 2016, 188, 652. [Google Scholar] [CrossRef]
  74. Wu, J.; Luo, J.; Zhang, H.; Qin, S.; Yu, M. Projections of land use change and habitat quality assessment by coupling climate change and development patterns. Sci. Total Environ. 2022, 847, 157491. [Google Scholar] [CrossRef] [PubMed]
  75. Simkin, R.D.; Seto, K.C.; McDonald, R.I.; Jetz, W. Biodiversity impacts and conservation implications of urban land expansion projected to 2050. Proc. Natl. Acad. Sci. USA 2022, 119, e2117297119. [Google Scholar] [CrossRef] [PubMed]
Figure 1. Research framework.
Land 13 01163 g001
Figure 2. Location of study area.
Land 13 01163 g002
Figure 3. Land cover status and changes in Beijing City from 2000 to 2020.
Land 13 01163 g003
Figure 4. Land cover transfer of Beijing City from 2000 to 2020. Note: CL: Cropland; FL: Forest; GL: Grassland; WA: Water Area; CO: Construction Land; UL: Unused Land.
Land 13 01163 g004
Figure 5. Simulated predictions of land cover in Beijing by 2030 under various scenarios.
Land 13 01163 g005
Figure 6. The spatial distribution and changes in Beijing’s habitat quality from 2000 to 2020.
Land 13 01163 g006
Figure 7. Land cover simulation prediction map of Beijing City in 2030 under different scenarios.
Land 13 01163 g007
Table 1. Data sources.
CategoryData NameYearSpatial
Resolution
Data TypeData Sources
Land Cover
Data
Land Cover2000,
2010,
2020
30 mGridhttps://www.resdc.cn/
Distance Accessibility DataPoint of Interest(POI), Railway, River, Road, Transport20201 kmShapefilehttps://www.openstreetmap.org/
Natural Environmental DataElevation 2000–202030 mGridhttp://www.gscloud.cn/
Slope,
Northness, Eastness
2000–20201 kmGridExtracted from DEM
Normalized Difference Vegetation Index (NDVI) 202030 mGridhttps://www.resdc.cn/
Precipitation20201 kmGridhttps://data.tpdc.ac.cn
Socio–economic dataGross Domestic Product (GDP)20101 kmGridhttps://www.resdc.cn/
Population 20101 kmGridhttps://hub.worldpop.org/
Table 2. Neighborhood factor parameters.
Land Cover TypesCroplandForestGrasslandWatersUrban LandUnused Land
Natural development scenario0.60.40.20.20.70.1
Urban development scenario0.210.90.60.40.1
Ecological protection scenario0.70.40.30.210.1
Table 3. The maximum distance, weight, and spatial decay type of threat factors affecting habitat quality.
Threat FactorMaximum Influence Distance/kmWeight
cultivated land60.5
construction land101
unused land10.2
Table 4. Habitat suitability and sensitivity of different land cover types to threat factors.
Land CoverHabitat SuitabilitySensitivity
Cultivated LandConstruction LandUnused Land
cultivated land0.500.50.5
woodland10.610.2
grassland0.70.50.70.2
waters0.90.80.90.2
construction land0000.5
unused land0.10.10.30.2
Table 5. Ratio of habitat quality grades from 2000 to 2020 and under different scenarios for 2030.
GradeDomain2000201020202030 Scenario 12030 Scenario 22030 Scenario 3
Ratio/%Ratio/%Ratio/%Ratio/%Ratio/%Ratio/%
Lower0–0.213.70%23.44%21.84%21.69%22.43%21.30%
Low0.2–0.414.74%18.55%22.08%19.82%22.06%20.30%
Middle0.4–0.649.08%45.43%44.28%43.90%43.37%43.43%
High0.6–0.813.53%9.34%8.86%10.85%9.13%10.91%
Higher0.8–18.94%3.23%2.94%3.74%3.03%4.06%
Mean0.44380.36100.36010.37290.35880.3752
Disclaimer/Publisher’s Note: The statements, opinions and data contained in all publications are solely those of the individual author(s) and contributor(s) and not of MDPI and/or the editor(s). MDPI and/or the editor(s) disclaim responsibility for any injury to people or property resulting from any ideas, methods, instructions or products referred to in the content.

