
An Evaluation of the Dust Emission Characteristics of Typical Underlying Surfaces in an Aeolian Region in the Middle Reaches of the Yarlung Zangbo River on the Qinghai–Tibet Plateau
 ,
,
Abstract
:Highlights:
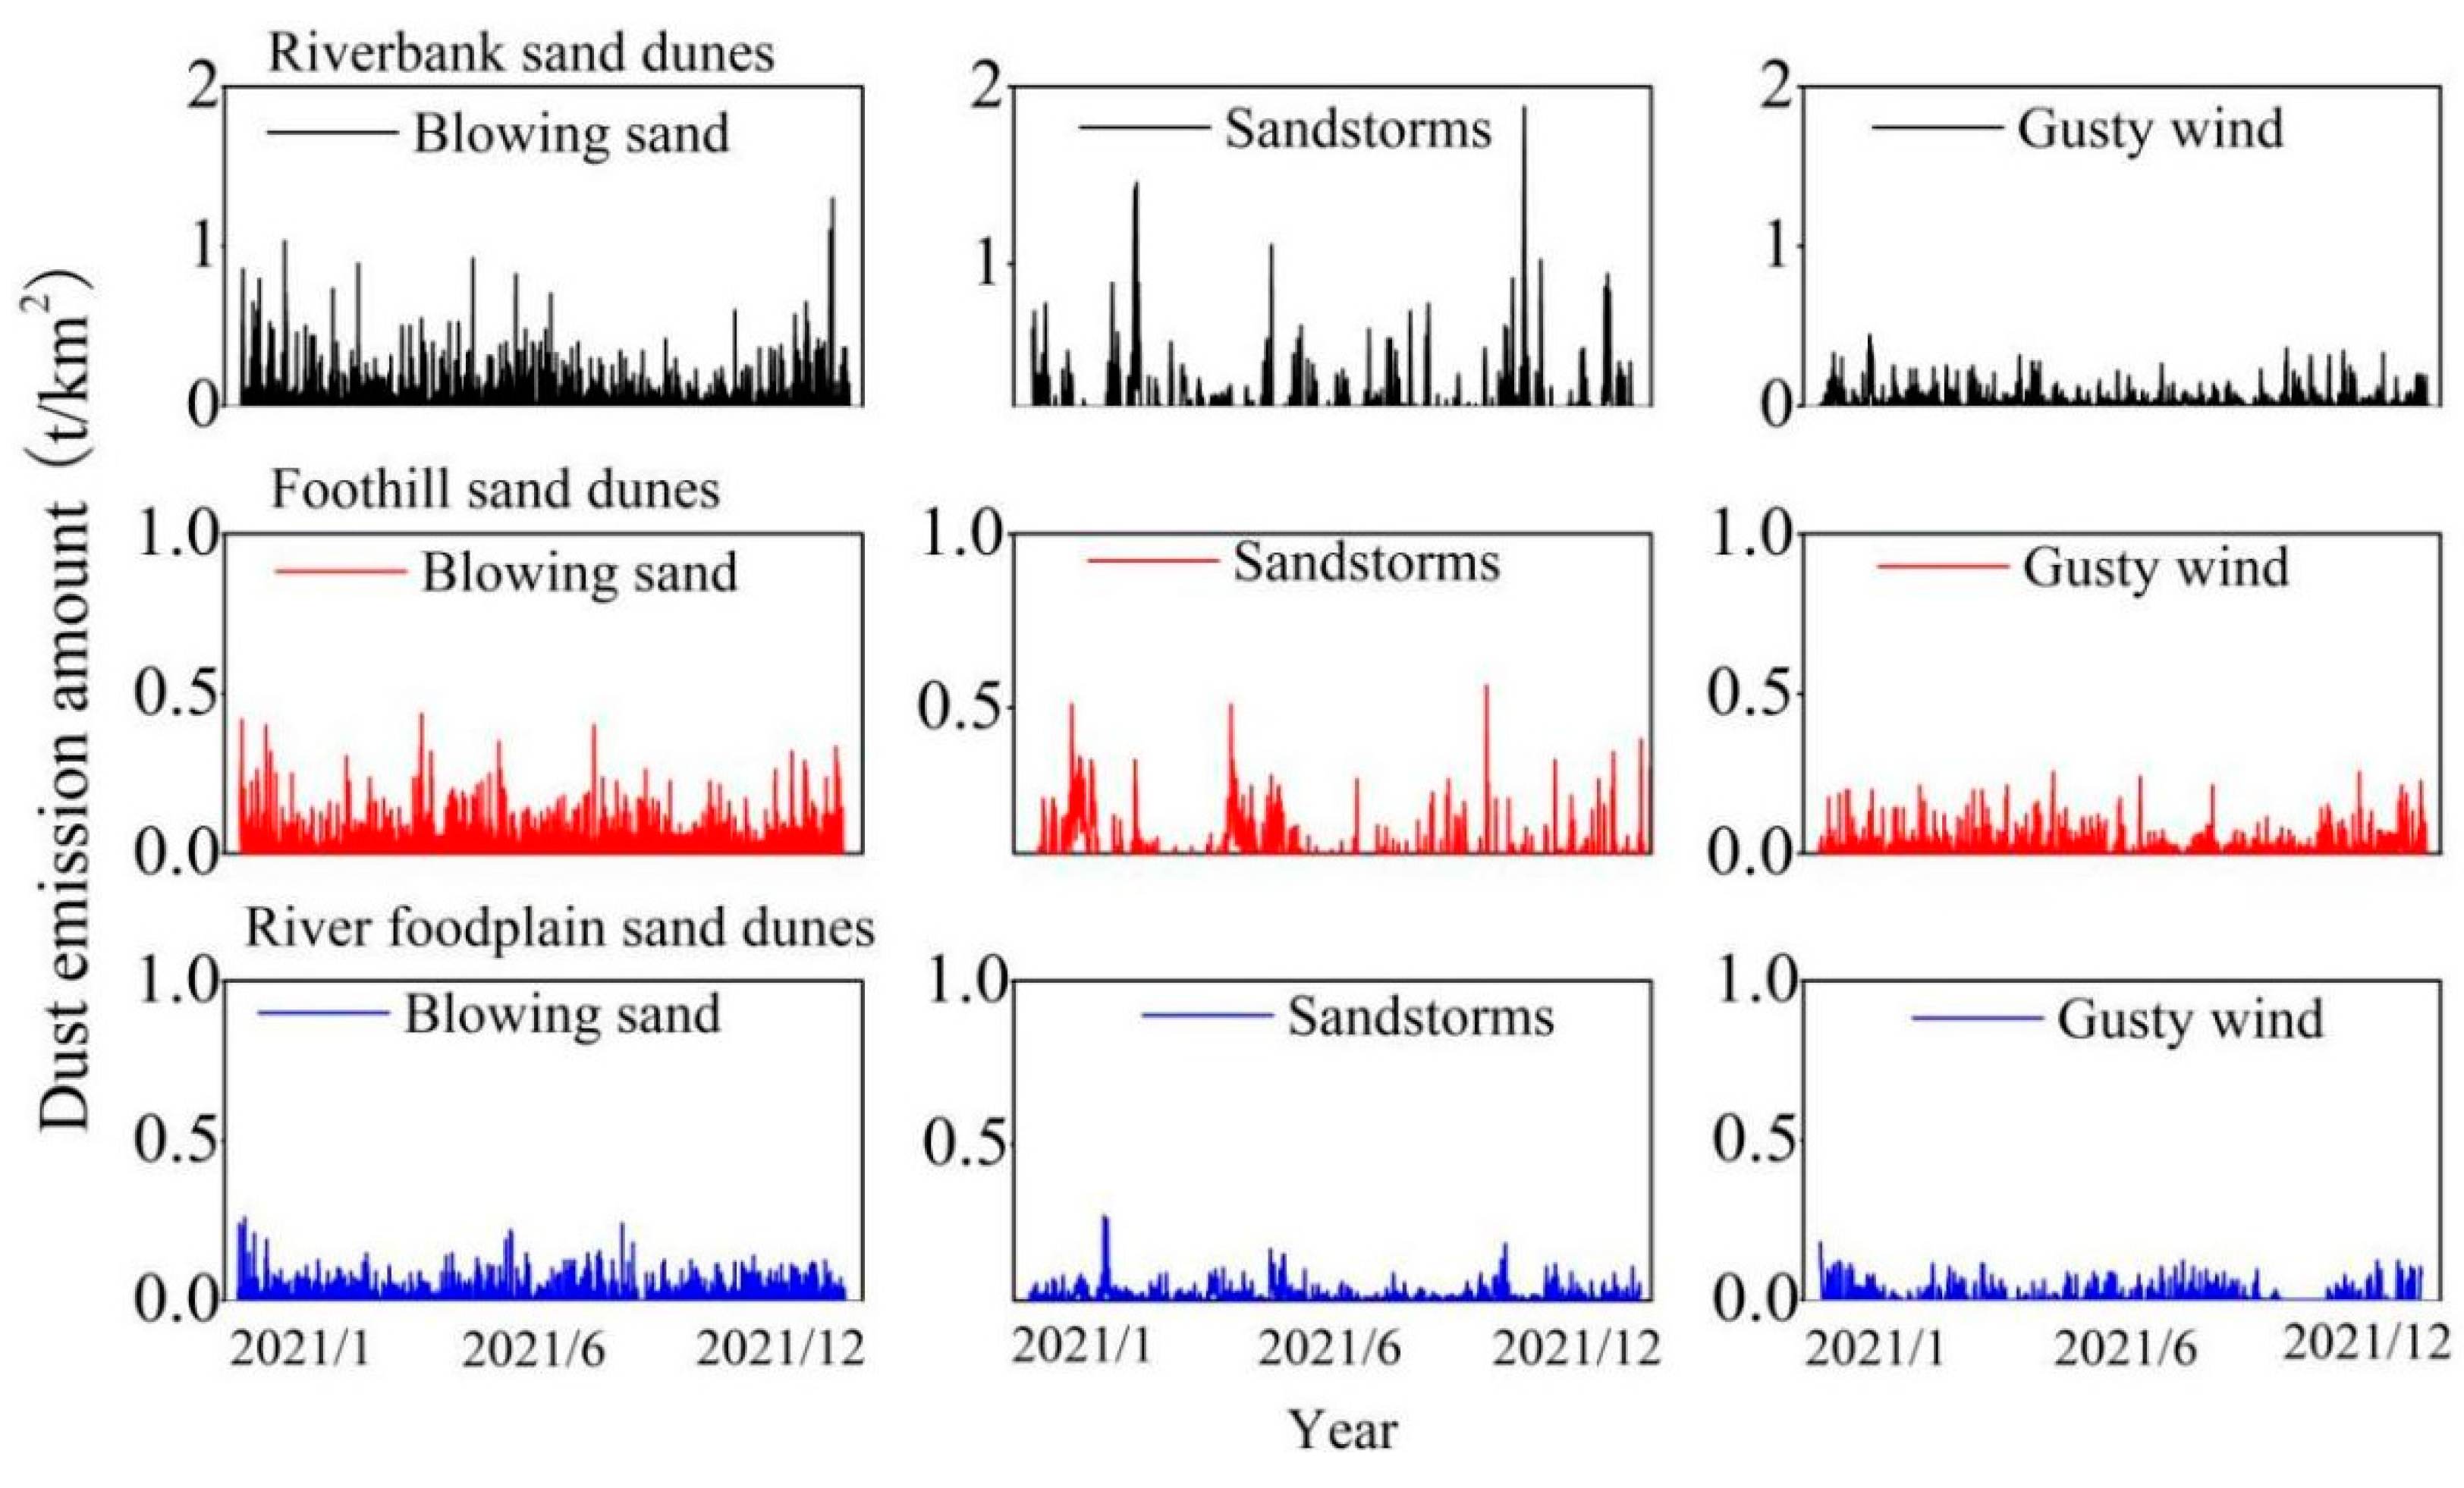
- The contributions of sandstorms, blowing sand, and gusty winds to dust emissions were determined;
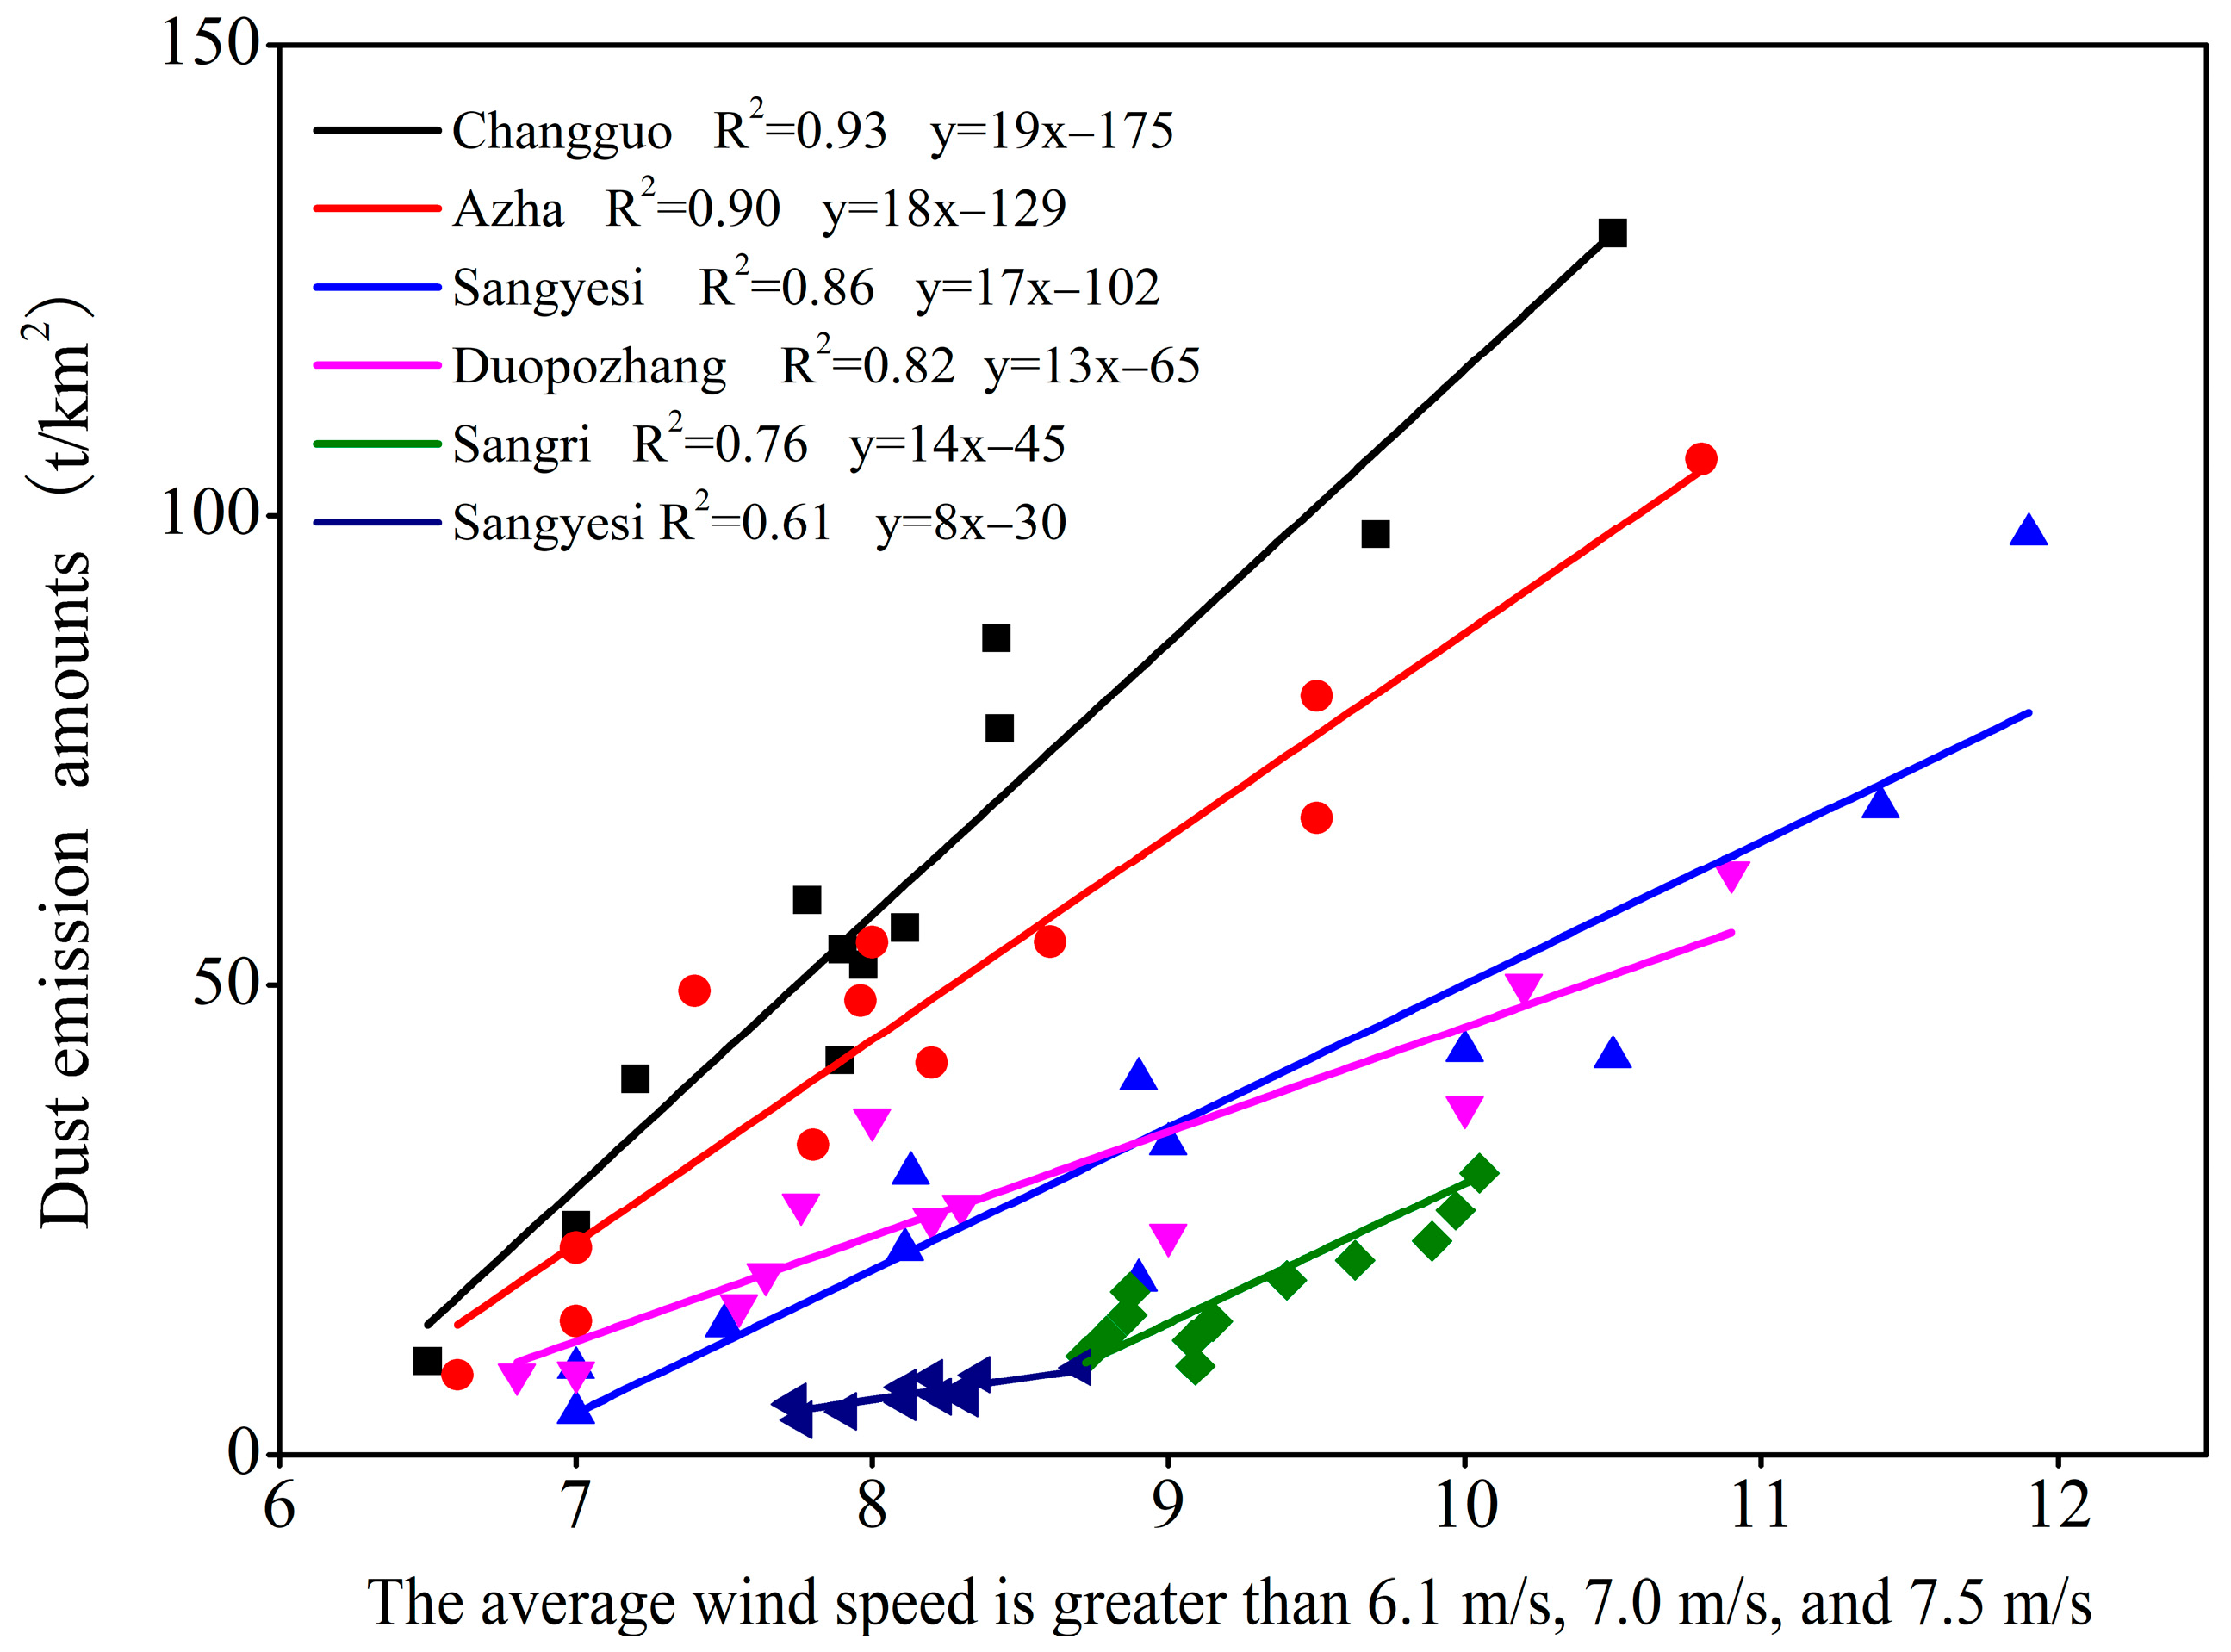
- Equations were established for different amounts of surface dust emissions and wind speeds >6.1 m/s.
1. Introduction
2. Data and Methods
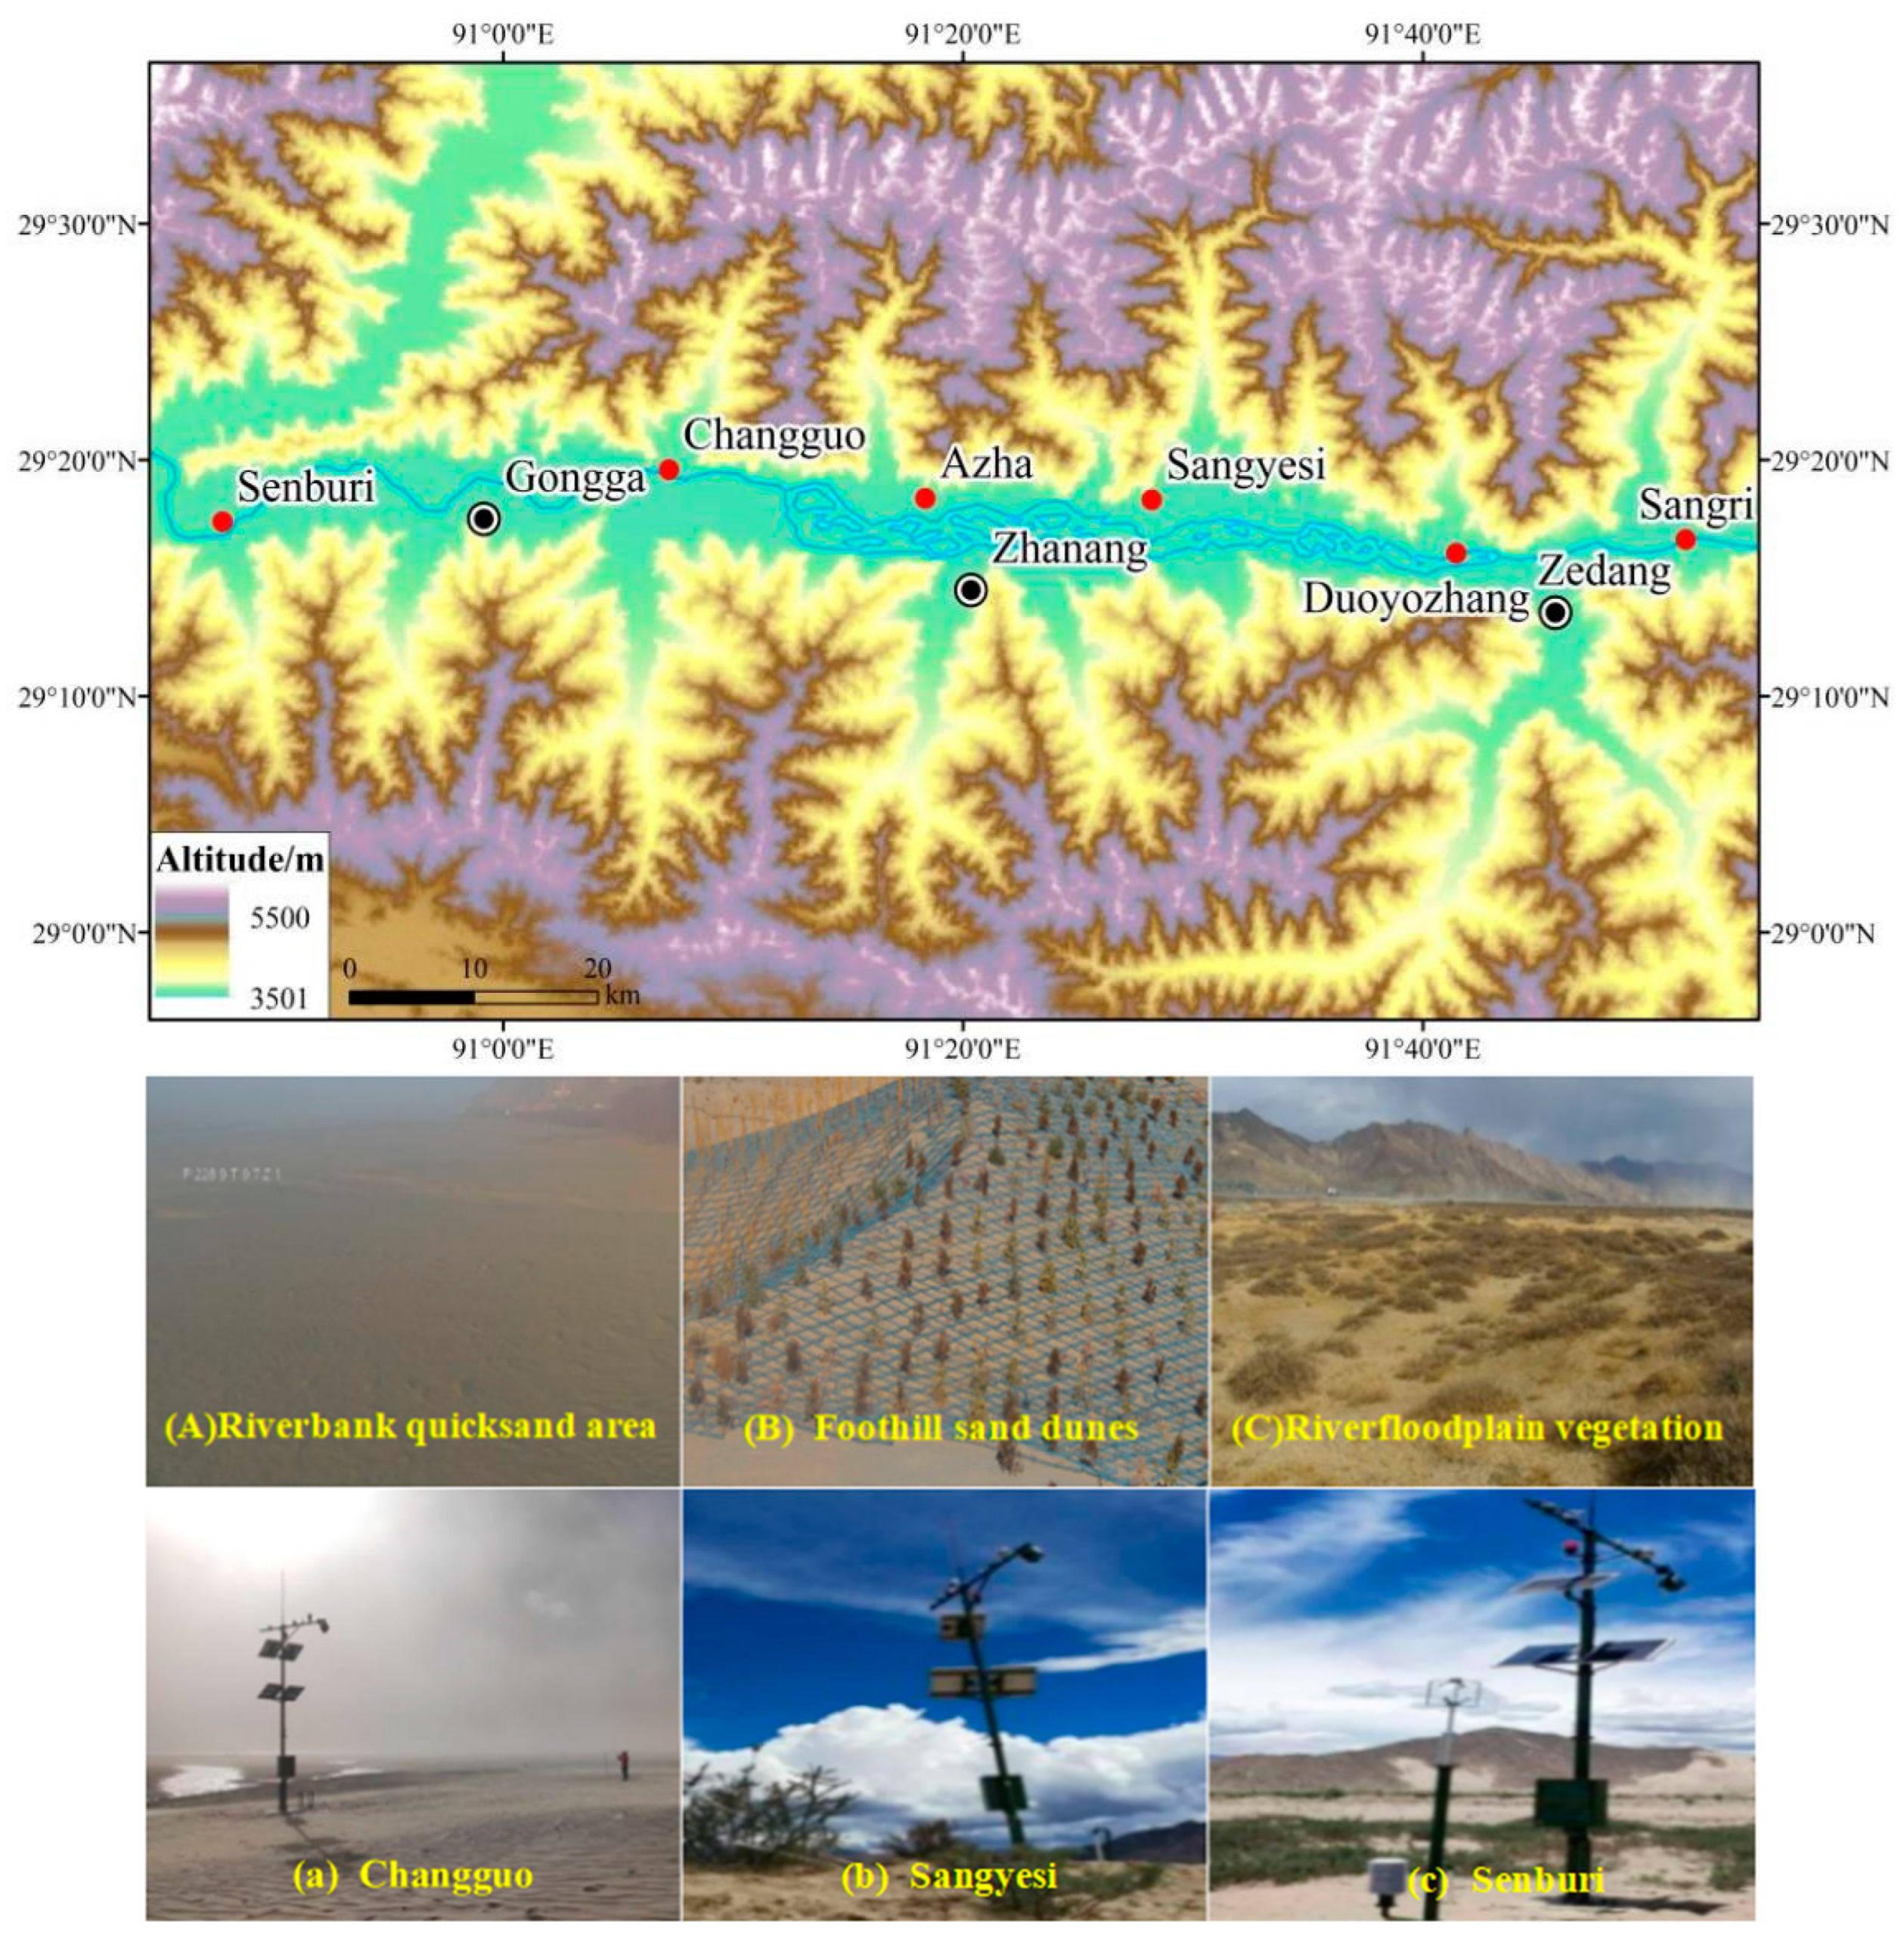
2.1. Study Area
2.2. Meteorological Observations
2.3. Calculation of DEAs by Dusty Weather
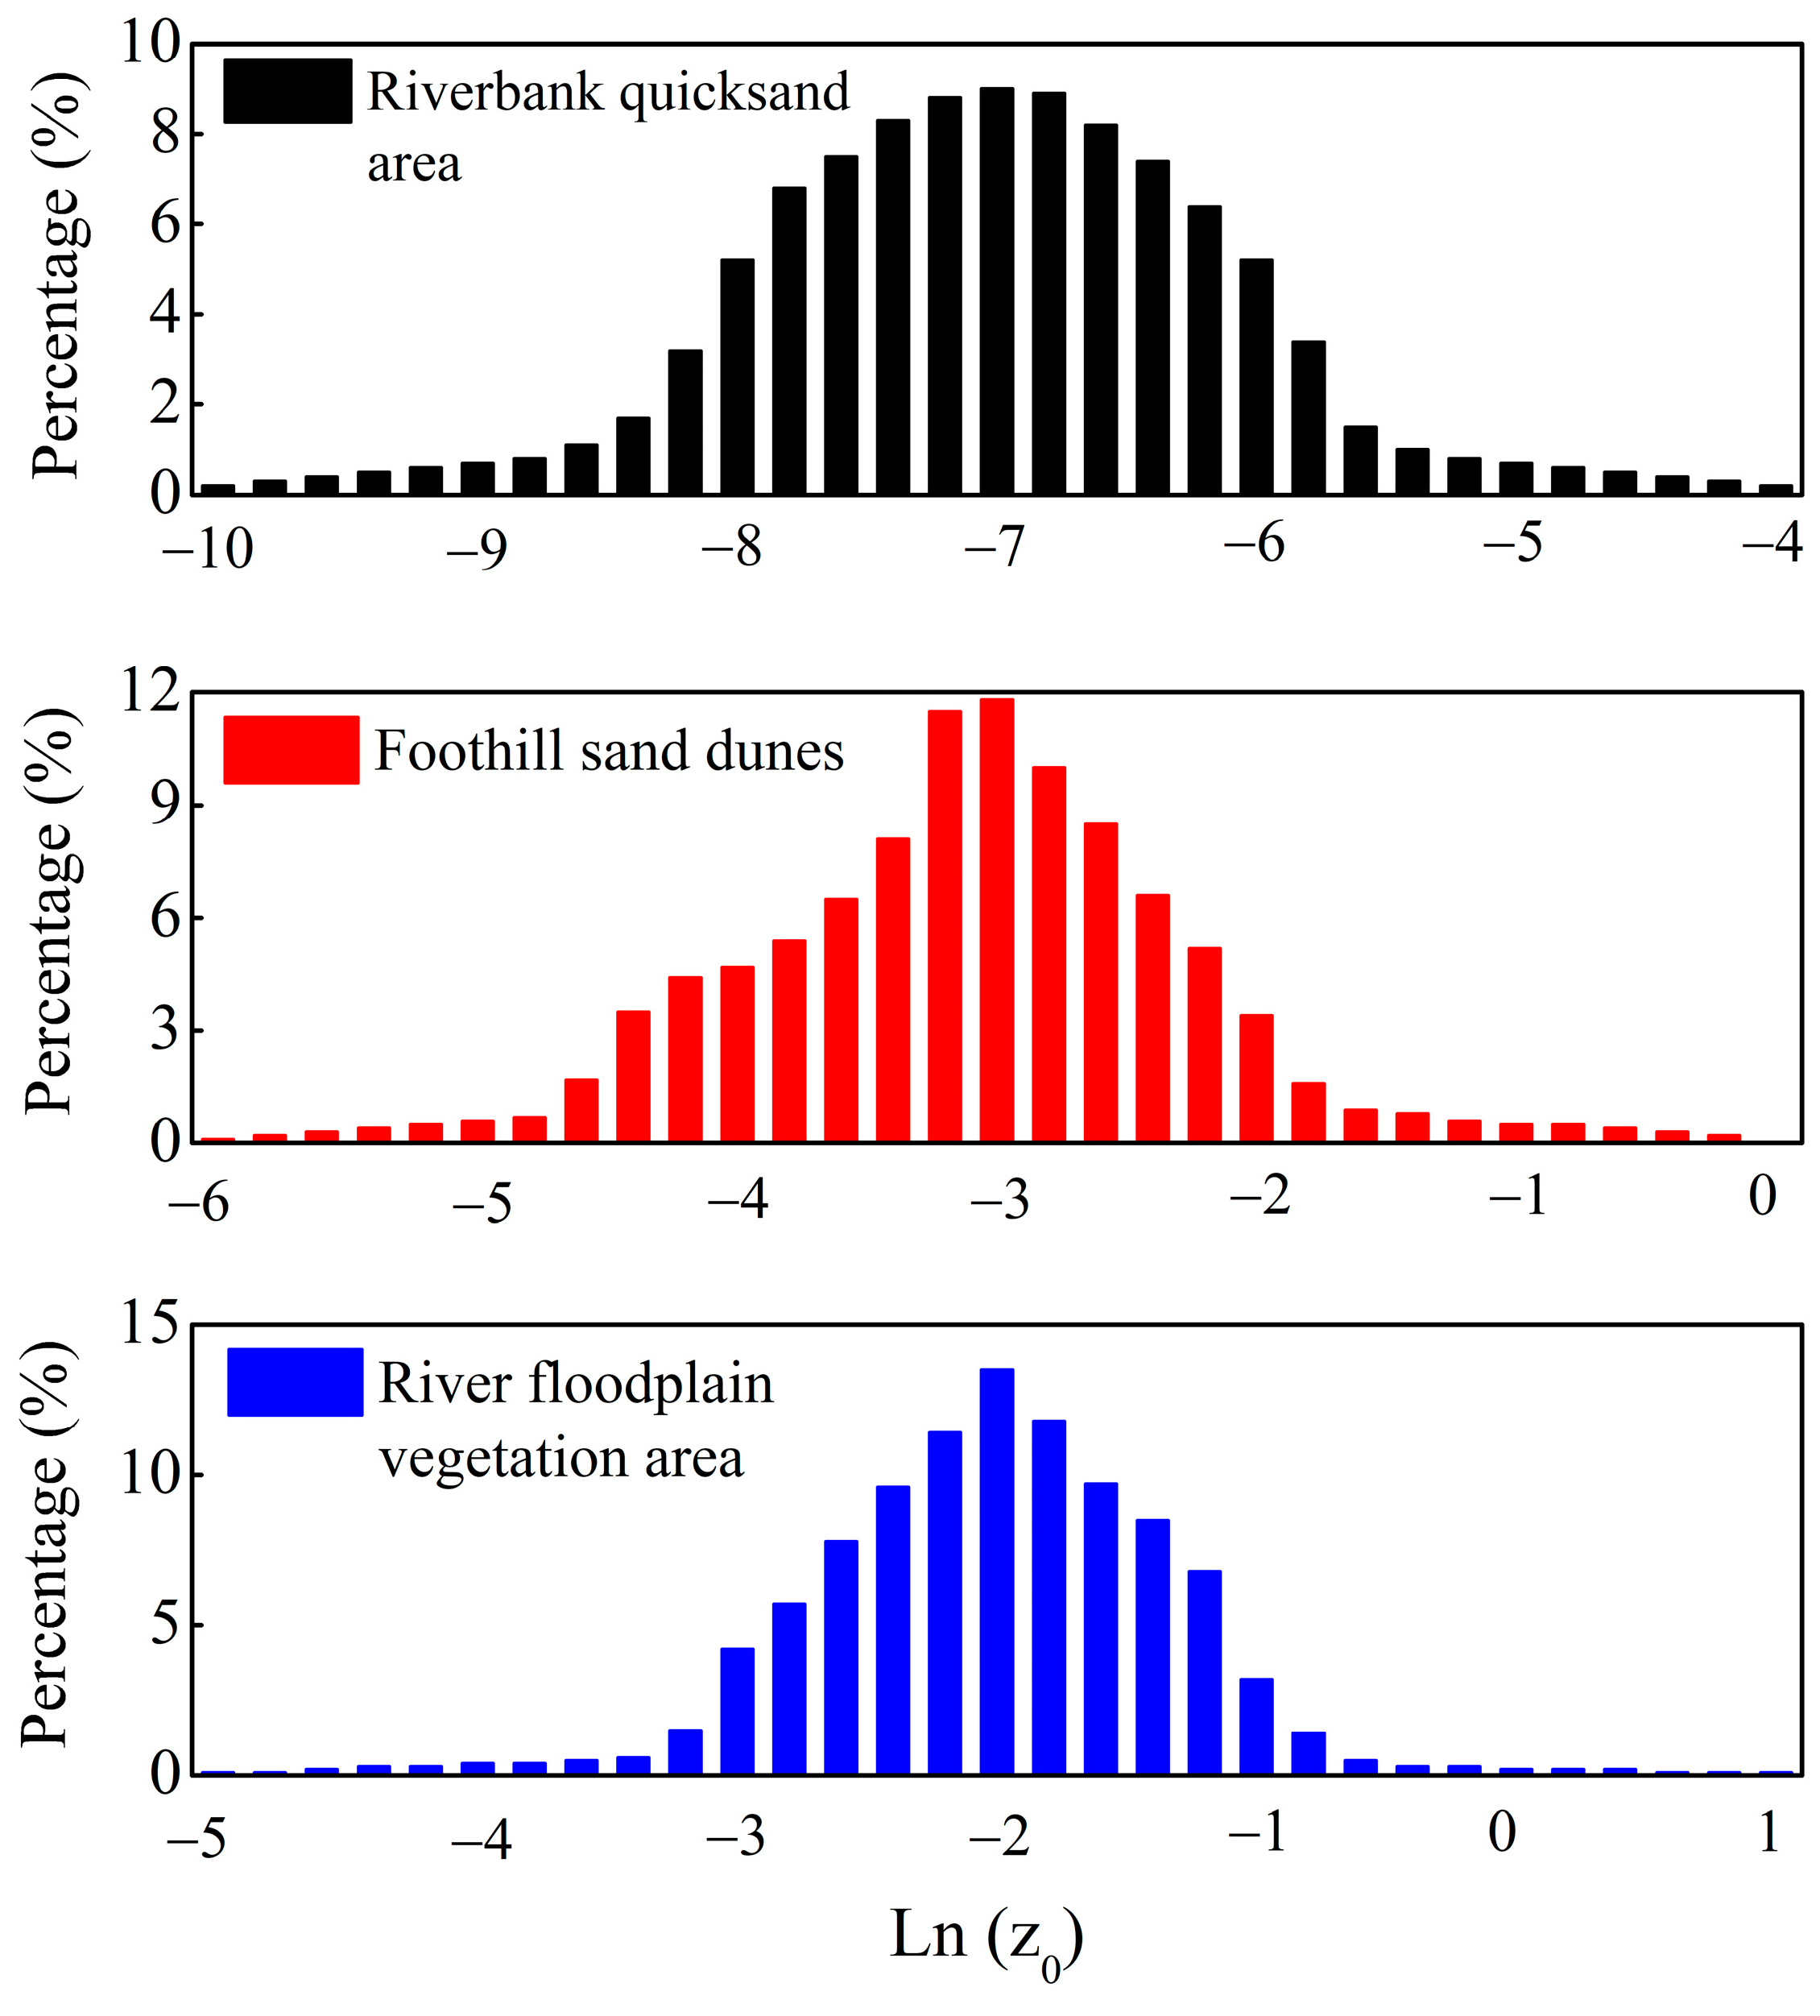
2.4. Aerodynamic Roughness Length
2.5. Calculation of Emission Threshold
3. Results and Discussion
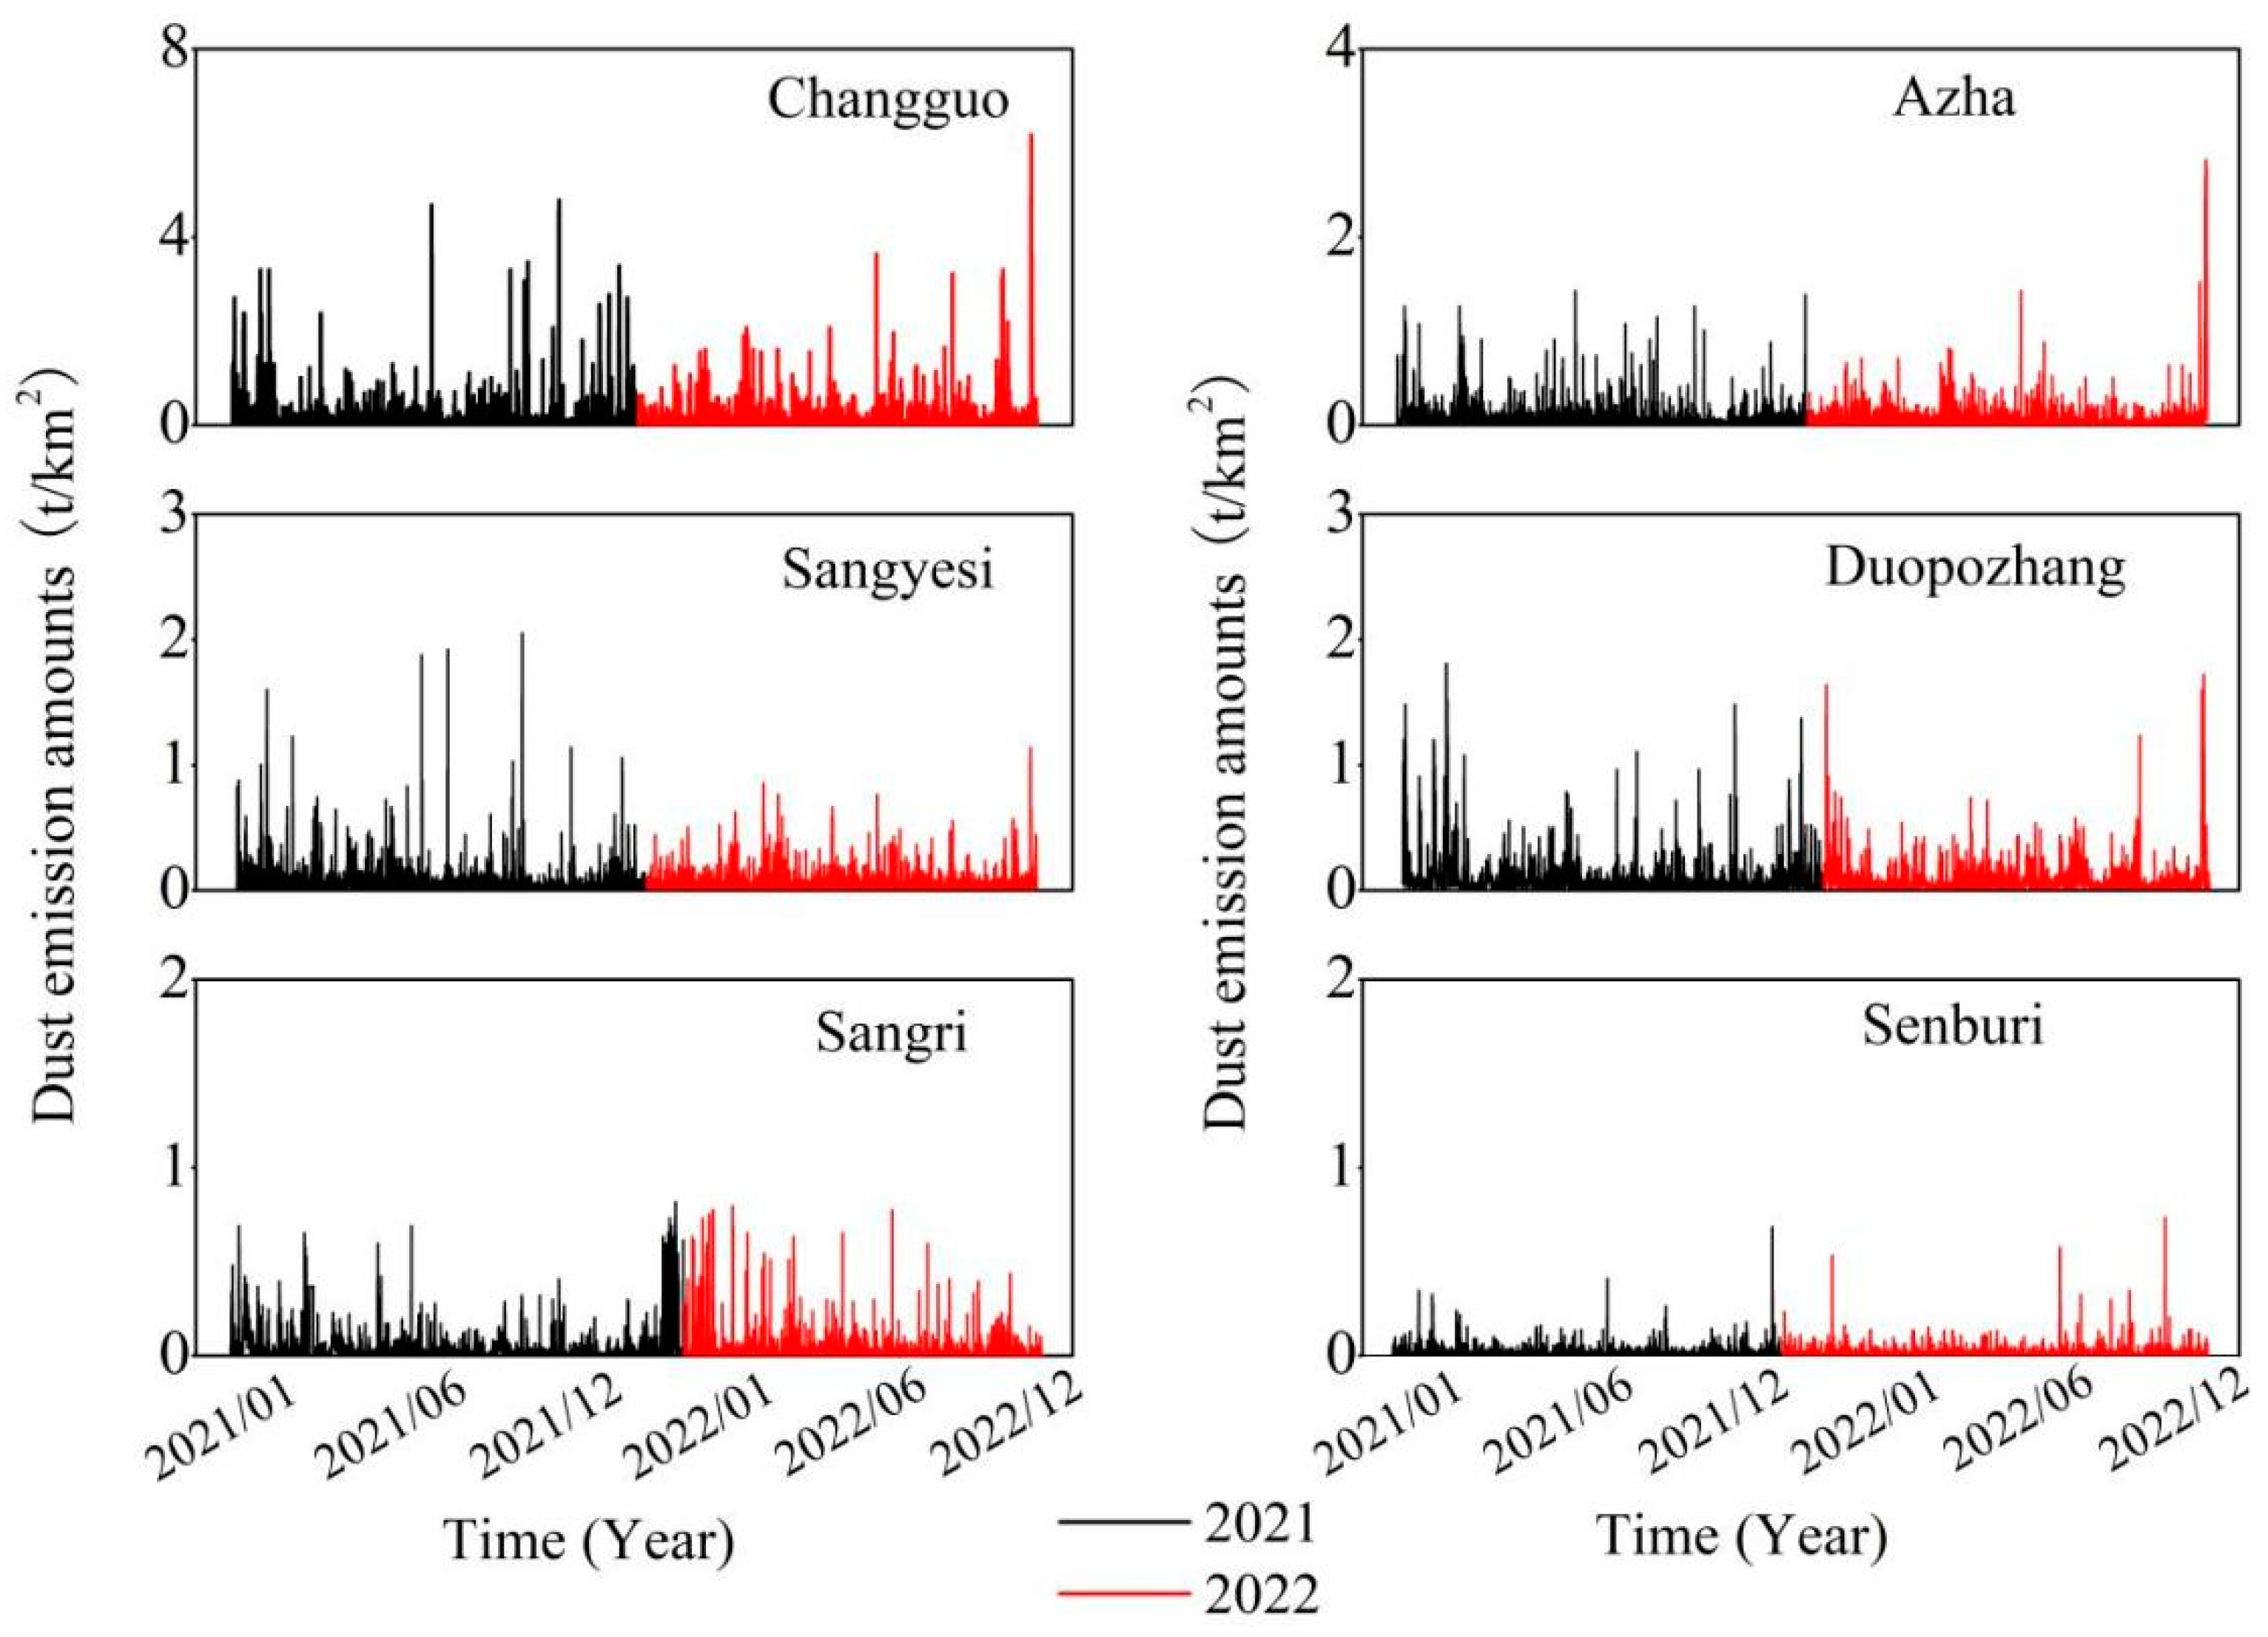
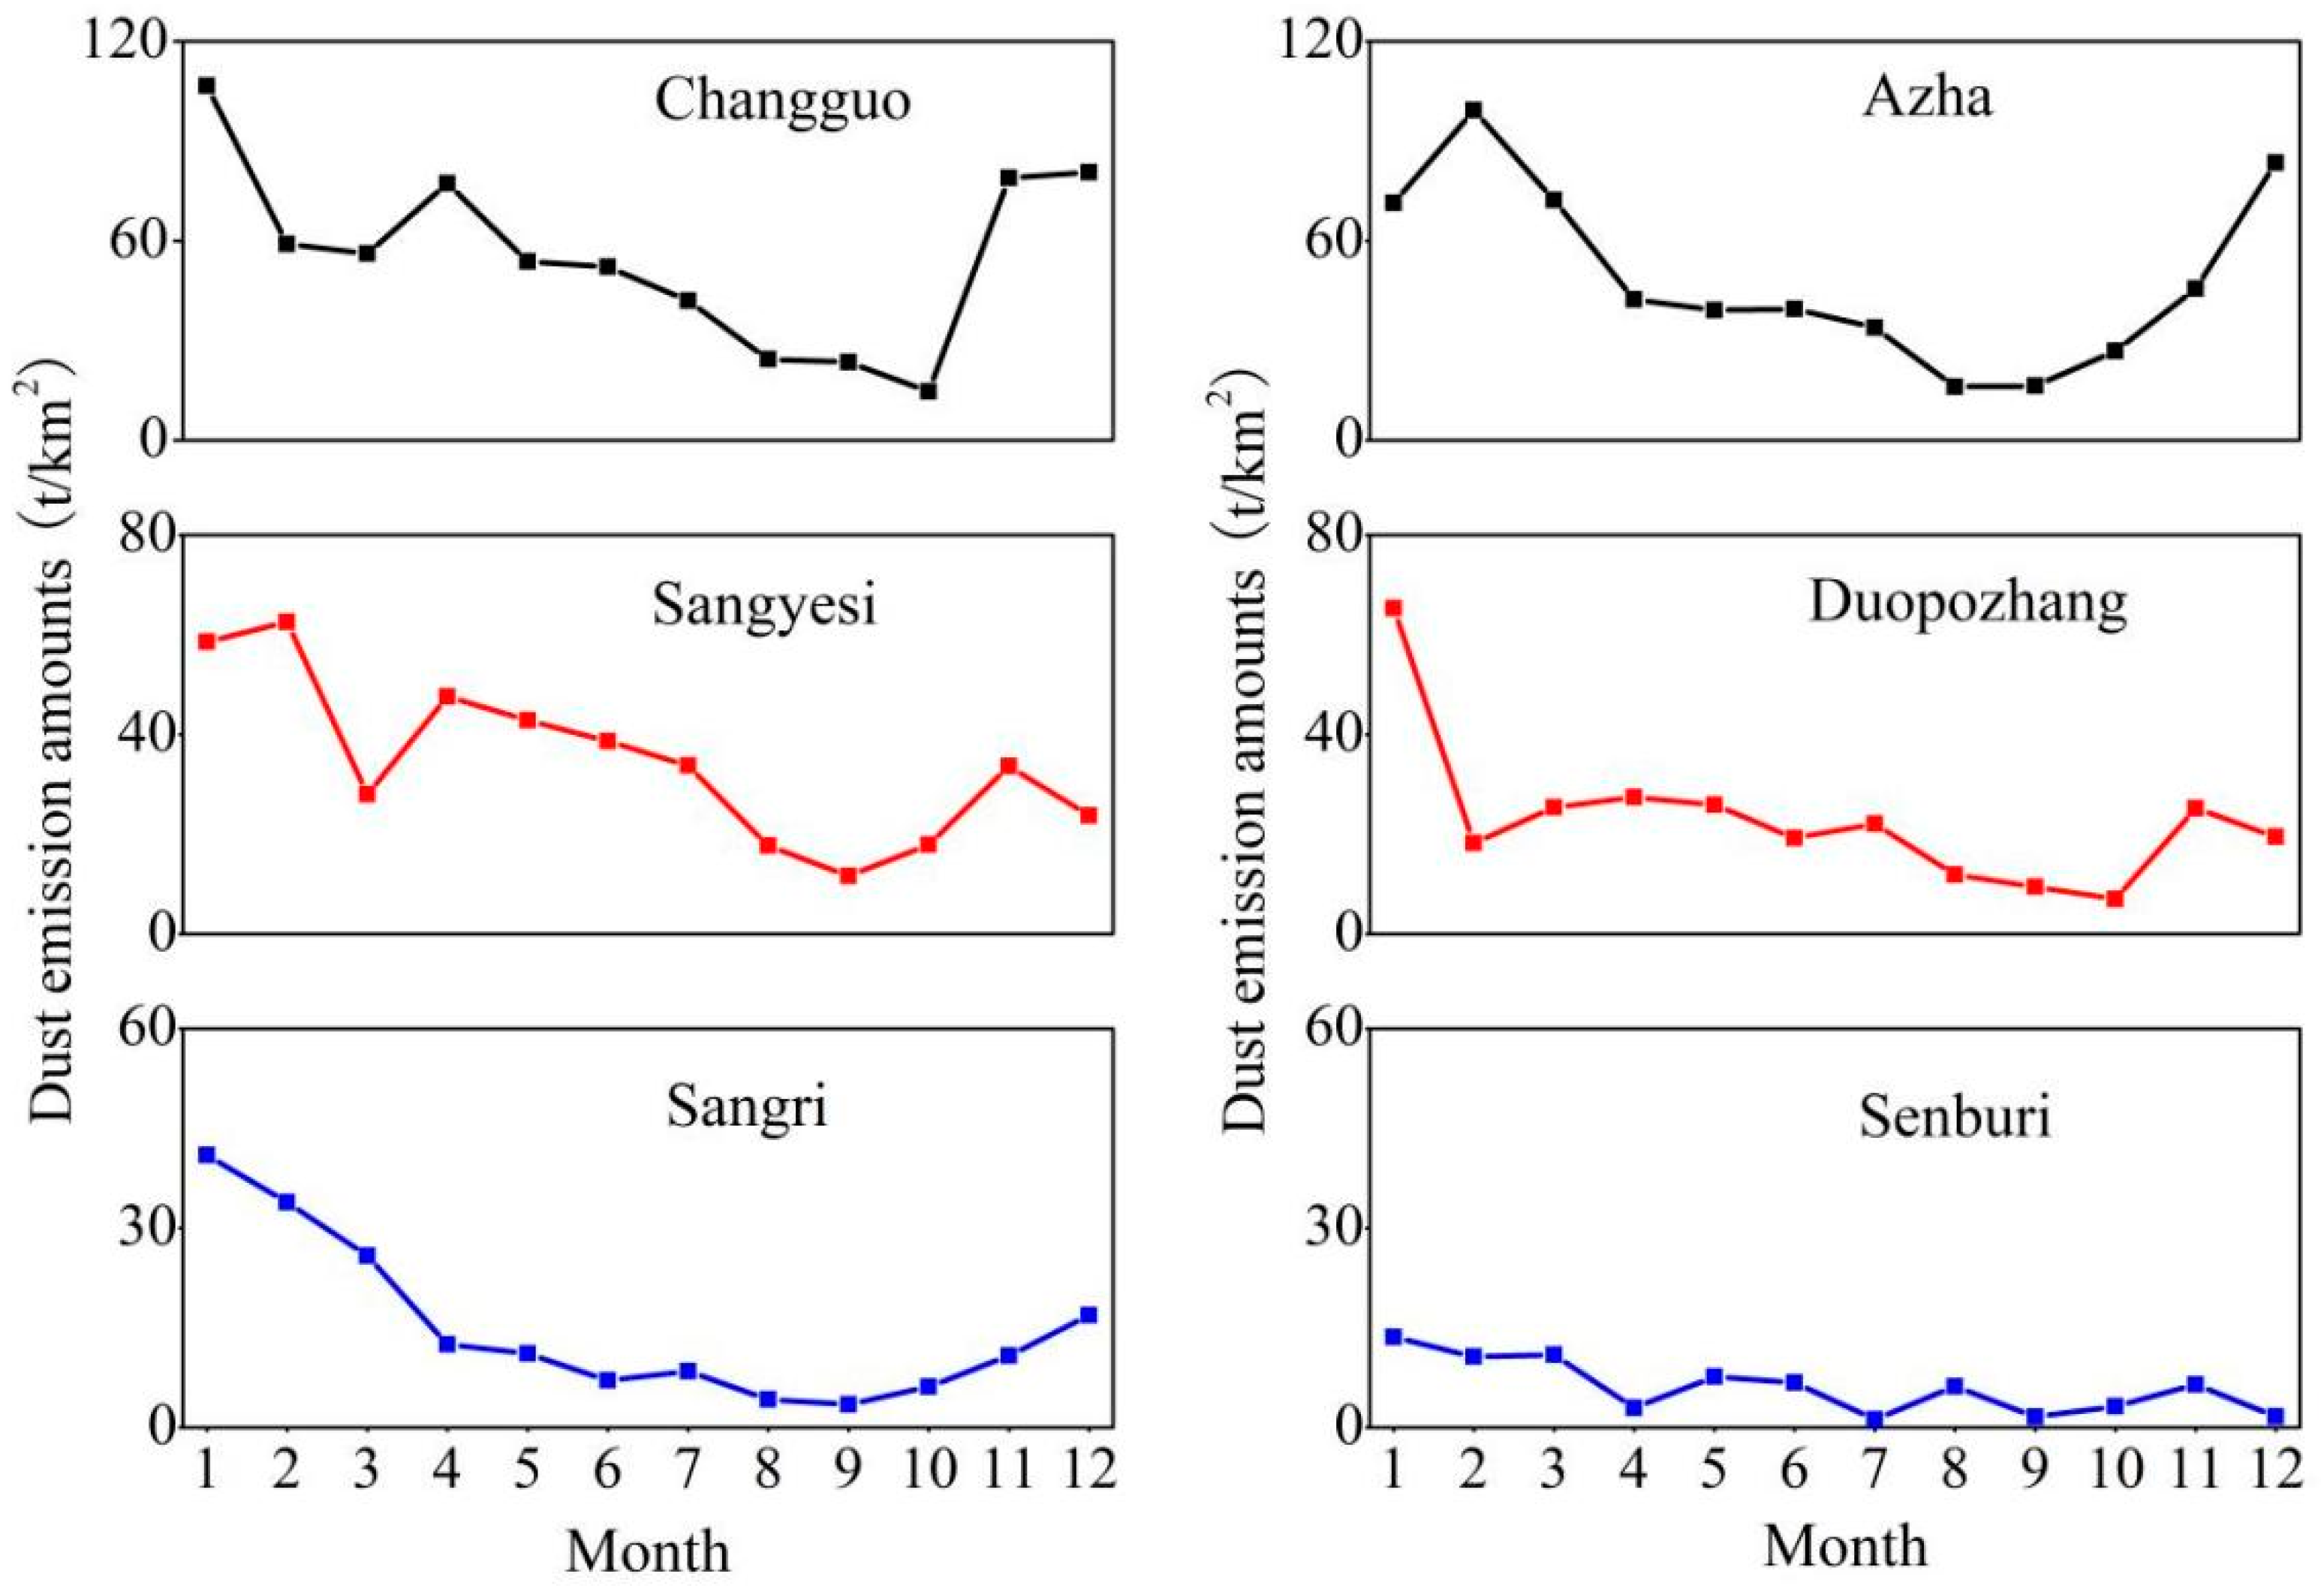
3.1. Characteristics of Total DEAs Variations
3.2. Characteristics of DEA Variations by Dusty Weather
4. Discussion
4.1. The Impact of Underlying Surface Characteristics on DEAs
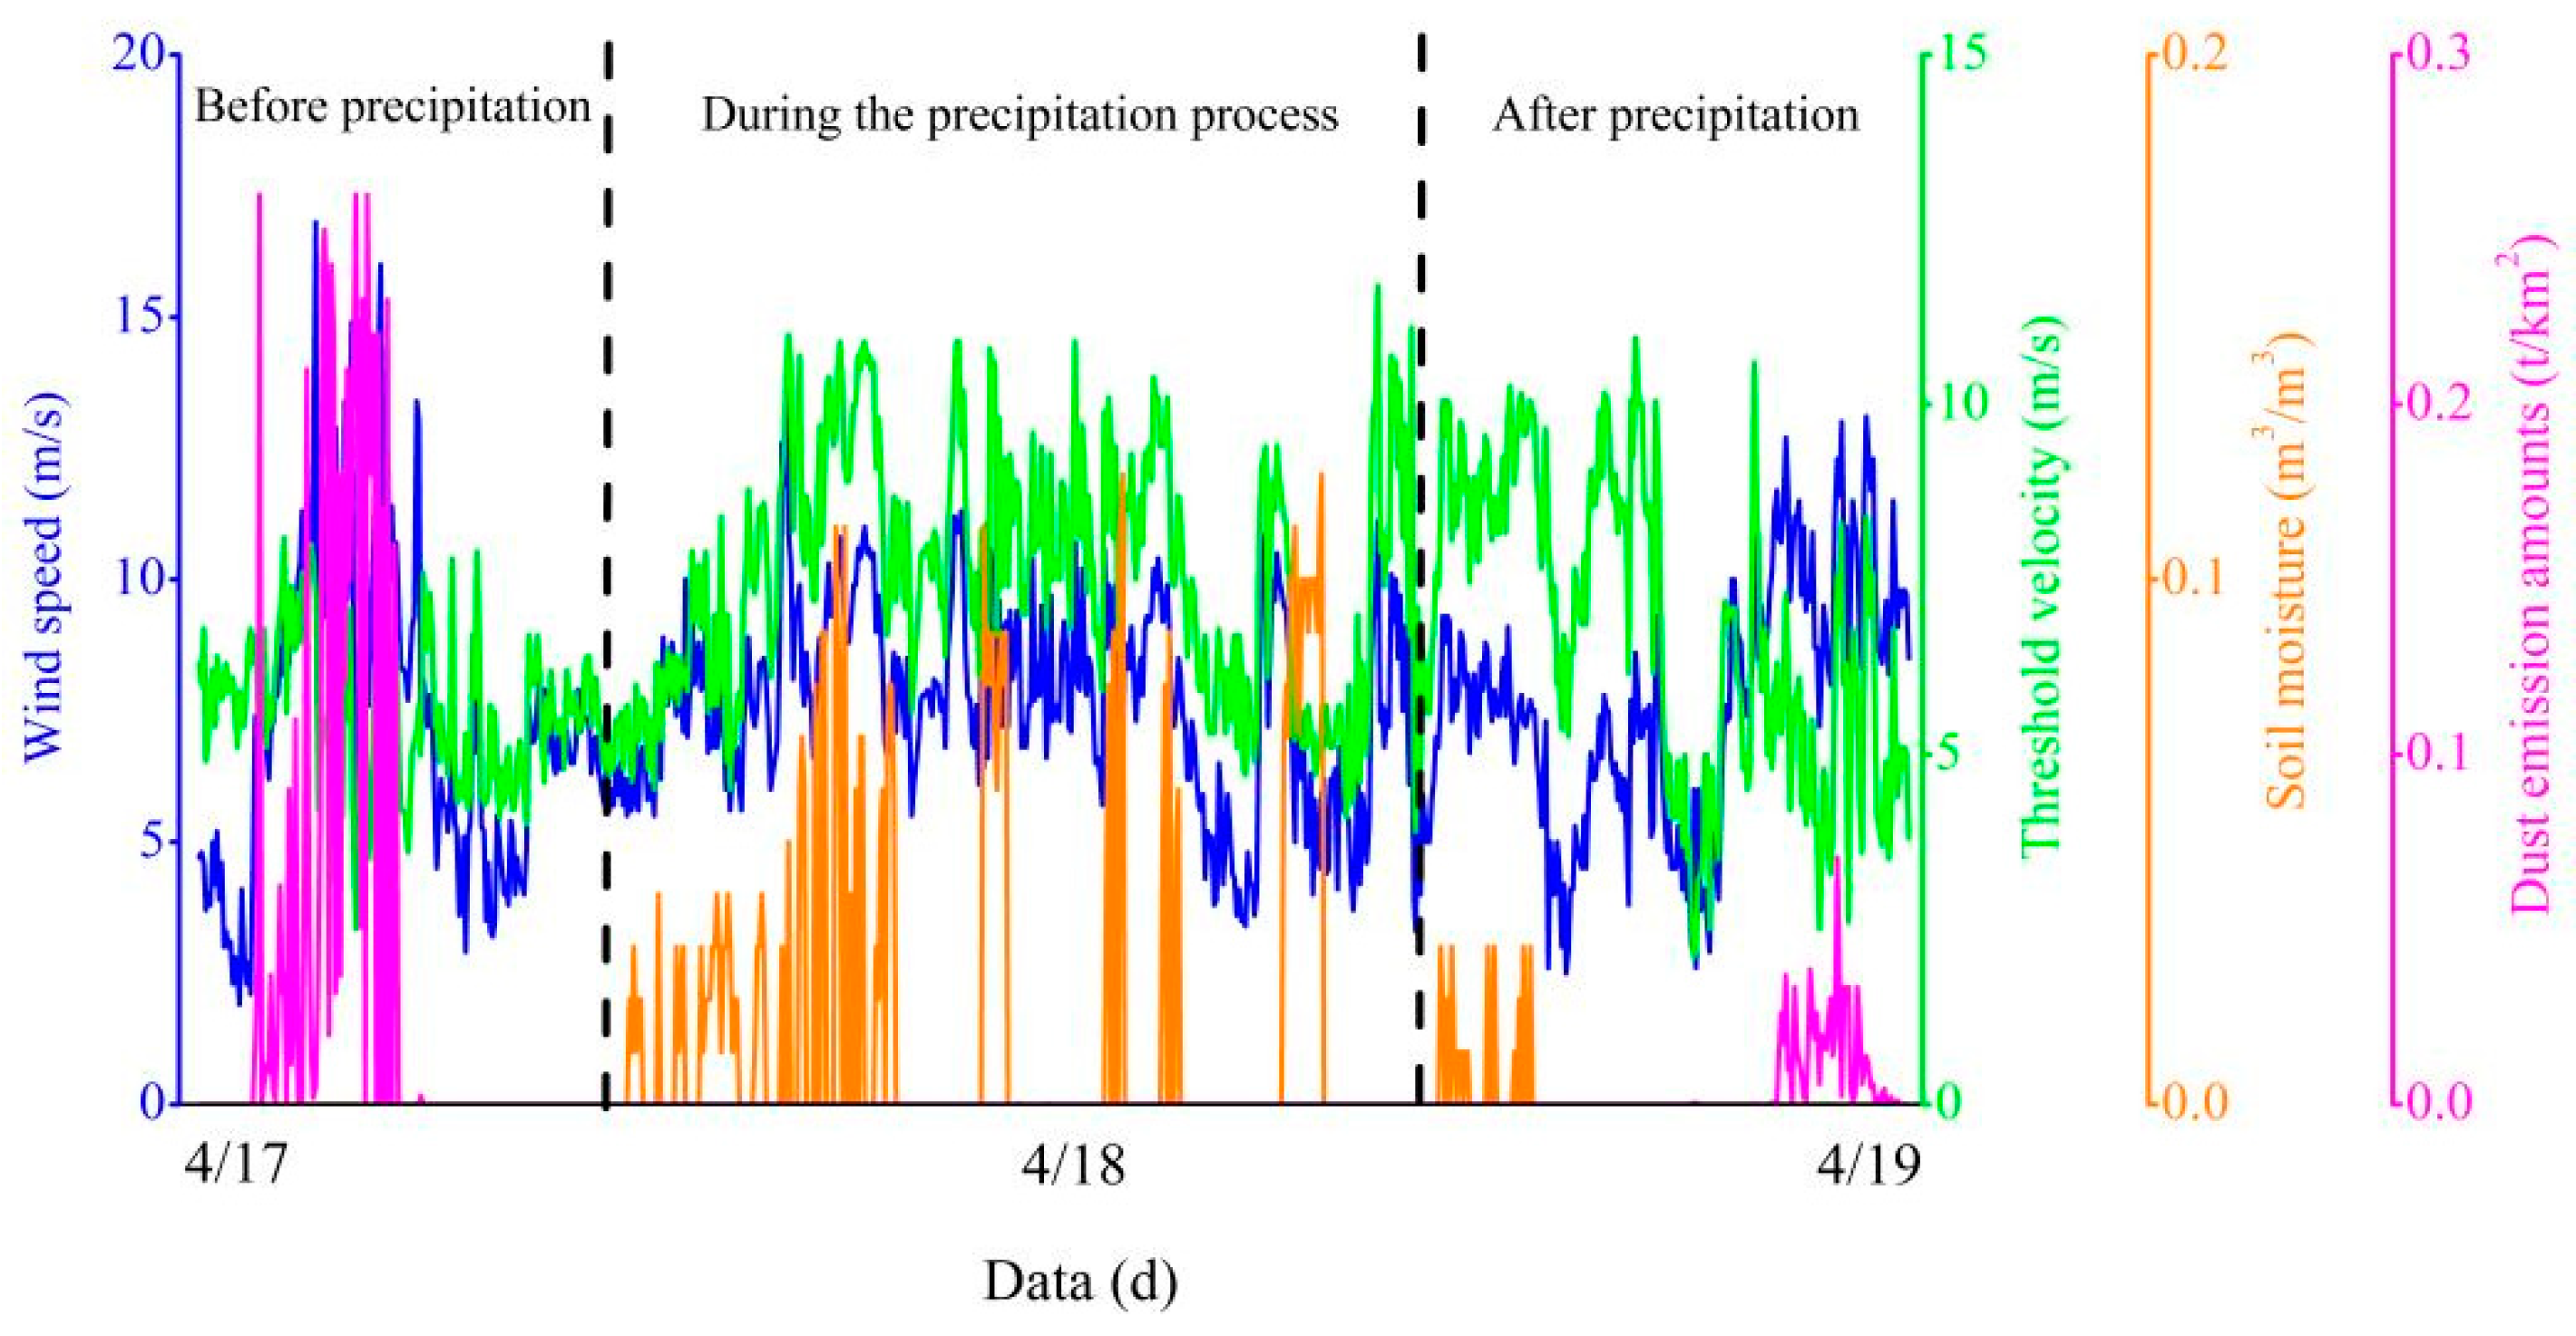
4.2. The Impact of Key Meteorological Factors on DEAs
5. Conclusions
Author Contributions
Funding
Data Availability Statement
Conflicts of Interest
References
- Li, S. Land Desertification and Its Control in Tibet; Science Press: Beijing, China, 2010; pp. 90–98. (In Chinese) [Google Scholar]
- Bagnold, R.A. The Physics of Blown Sand and Desert Dunes; Methuen: London, UK, 1941. [Google Scholar]
- Li, Z.S.; Zhang, Q.F. Evolution of Streamwise Sand Transport with Distance. J. Desert Res. 2006, 26, 189–193. (In Chinese) [Google Scholar]
- Dong, Y.X.; Hesp, P.A.; Namikas, S. Field Measurements of Structure of Wind-sand flow on Coastal Transverse Ridge in China. Sci. Geogr. Sin. 2008, 28, 507–512. (In Chinese) [Google Scholar]
- Zhang, Z.C.; Dong, Z.B.; Zhao, A.G. Artificial simulation of the Gobi sandstorm flow and wind course effect observation. Chin. Sci. Earth Sci. 2011, 41, 1505–1510. (In Chinese) [Google Scholar]
- Zhang, Z.C.; Dong, Z.B. Field Observation of Wind-sand Flow in the Southeastern Part of the Tengger Desert. J. Desert Res. 2013, 33, 973–980. (In Chinese) [Google Scholar]
- Wang, R.D.; Chang, C.P.; Guo, Z.L.; Li, Q. A wind erosion empirical model of farmland applied in Bashang area of Hebei, China. J. Desert Res. 2017, 37, 1071–1078. (In Chinese) [Google Scholar]
- Ho, T.D.; Valance, A.; Dupont, P.; Ould, E.M. Scaling Laws in Aeolian Sand Transport. Phys. Rev. Lett. 2011, 106, 094501. [Google Scholar] [CrossRef] [PubMed]
- Kamath, S.; Shao, Y.; Parteli, E.J.R. Scaling Laws in Aeolian Sand Transport Under Low Sand Availability. Geophys. Res. Lett. 2022, 49, e2022GL097767. [Google Scholar] [CrossRef]
- Pahtz, T.; Durán, O. Unification of Aeolian and Fluvial Sediment Transport Rate from Granular Physics. Phys. Rev. Lett. 2020, 124, 168001. [Google Scholar] [CrossRef] [PubMed]
- Yang, X.H.; Yang, F.; Zhou, C.L.; Mamtimin, M.; Huo, W.; He, Q. Improved parameterization for effect of soil moisture on threshold friction velocity for saltation activity based on observations in the Taklimakan Desert. Geoderma 2022, 369, 114322. [Google Scholar] [CrossRef]
- Dong, Z.B.; Qu, J.J.; Qian, G.Q.; Zhang, Z.C. Aeolian Geomorphological Regionlization of the Kumtagh Desert; Science Press: Beijing, China, 2011. [Google Scholar]
- Wang, T. China’s Deserts and Desertification; Hebei Science and Technology Press: Shijiazhuang, China, 2003. [Google Scholar]
- Qu, J.J.; Ling, Y.Q.; Liu, B.J.; Chen, G.T.; Wang, T.; Dong, Z.B. Research status and development trends of wind-sand engineering in China. Adv. Earth Sci. 2019, 34, 225–231. (In Chinese) [Google Scholar]
- Ma, P.F.; Zhang, Z.C.; Lunzhu, Q.P.; Gao, J.J.; Dai, R.; Ci, W.; Pan, K.J. Analysis on the sand transport wind power conditions and suggestions on the sand disaster preventions in the middle reaches of Yarlung Zangbo River. China. J. Desert Res. 2021, 41, 10–18. (In Chinese) [Google Scholar]
- Ma, P.F.; Lunzhu, Q.P.; Zhang, Z.C.; Nima, C.; Lu, J.F. Sand supplement characteristics indicated by the area of river inland, flood plain in the riverbed of the Yarlung Zangbo River. J. Desert Res. 2021, 41, 25–33. (In Chinese) [Google Scholar]
- Yang, J.H.; Xia, D.S.; Gao, F.Y.; Wang, S.Y.; Chen, Z.X.; Jia, J.; Yang, S.L.; Ling, Z.Y. Aeolian deposits in the Yarlung Zangbo River Basin, southern Tibetan Plateau: A brief review. Adv. Earth Sci. 2020, 35, 863–877. (In Chinese) [Google Scholar]
- Dong, Z.B.; Hu, G.Y.; Qian, G.Q.; Lu, J.F.; Zhang, Z.C.; Luo, W.Y.; Lyu, P. High-altitude aeolian research on the Tibetan Plateau. Rev. Geophys. 2017, 55, 864–901. [Google Scholar] [CrossRef]
- Yang, P.; Wei, X.H.; Dong, Y.X.; Li, S. Progress on study desertification research and future combating idea in Tibet, China. Bull. Chin. Acad. Sci. 2020, 35, 699–708. (In Chinese) [Google Scholar]
- Zhang, Y.; Ma, P.F.; Zeng, L.; Liang, A.; Zhang, Z.C. Study on silt and clay provenance in the Yarlung Zangbo River middle reaches using sediment physicochemical characteristics. J. Desert Res. 2021, 41, 92–100. (In Chinese) [Google Scholar]
- Ma, P.F.; Gao, J.J.; Zha, D.; Zhang, Y.; Zhang, Z.C. Analysis of soil nutrients in the aeolian disaster region along middle reaches of Yarlung Zangbo river. J. Arid. Land Resour. Environ. 2021, 35, 97–106. (In Chinese) [Google Scholar]
- Zhang, Z.C.; Zhang, Y.; Ma, P.F.; Pan, K.J.; Zha, D. Aerodynamic parameters of typical underlying surfaces in an aeolian region in the middle reaches of the Yarlung Zangbo River. Arid. Zone Res. 2022, 39, 998–1011. (In Chinese) [Google Scholar]
- Chang, X.X.; Chen, H.S.; Li, Z.G.; Zhang, H.P. Species diversity of ecological restoration plant communities in typical desert areas of the Brahmaputra River Basin in Tibet. J. Desert Res. 2021, 41, 187–194. (In Chinese) [Google Scholar]
- Dong, M.; Yan, P.; Wang, X.X.; Zhang, G.M.; Meng, X.N.; Ji, X.R.; Wang, Y. Characteristics of surface sediments on the climbing dunes in Shannan wide valley section of Yarlung Tsangpo River, China. J. Desert Res. 2022, 43, 194–203. (In Chinese) [Google Scholar]
- Yu, S.H.; Zhang, X.J. Analysis on the characteristics and trend of temperature change in the Yarlung Zangbo River Basin. J. Agric. Catastropholgy 2020, 10, 50–51. (In Chinese) [Google Scholar]
- Zhang, H.Z.; Zhou, K.S.; Ge, S.; Guo, Y.N. Analysis of spatiotemporal variation characteristics of wind-sand days in the Yarlung Zangbo river basin during 1981–2016. J. Arid. Land Resour. Environ. 2018, 32, 132–140. (In Chinese) [Google Scholar]
- Raupach, M.R.; Gillette, D.A.; Leys, J.F. The effect of roughness elements on wind erosion threshold. J. Geophys. Res. Atmos. 1993, 98, 3023–3029. [Google Scholar] [CrossRef]
- Wieringa, J. Representative roughness parameters for homogeneous terrain. Boundaray Layer Meteorol. 1993, 63, 323–363. [Google Scholar] [CrossRef]
- Lancaster, N.; Baas, A. Influence of vegetation cover on sand transport by wind:field studies at Owens Lake, California. Earth Surf. Process. Landf. 1998, 23, 69–82. [Google Scholar] [CrossRef]
- Kimura, R.; Bai, L.; Wang, L. Relationship among dust outbreaks, vegetation cover, and surface soil water content. Catena 2009, 77, 292–296. [Google Scholar] [CrossRef]
- Yang, X.H.; He, Q.; Liu, X.C.; Yang, F.; Huo, W.; Shen, S.H.; Mamtimin, A. Saltation activity and its threshold velocityin the Gurbantunggut Desert. Nat. Hazards 2018, 90, 349–364. [Google Scholar] [CrossRef]
- Shao, Y.P.; Lu, H. A simple expression for wind erosion threshold friction velocity. J. Geophys. Res. 2000, 105, 22437–22443. [Google Scholar] [CrossRef]
- Shao, Y.; Ishizuka, M.; Mikami, M. Parameterization of size-resolved dust emission and validation with measurements. J. Geophys. Res. Atmos. 2011, 116, D08203. [Google Scholar] [CrossRef]
- Greeley, R.; Iversen, J.D. Wind as a Geological Process on Earth, Mars, Venus and Titan; Cambridge University Press: Cambridge, UK, 1985; Volume 122, pp. 578–579. [Google Scholar]
- Gillette, D.A.; Passi, R. Modeling dust emission caused by wind erosion. J. Geophys. Res. 1988, 93, 14233–14242. [Google Scholar] [CrossRef]
- Luo, S.Q.J.; Zhang, Y.; Ma, P.F.; Zha, D.; Ge, D.; Zhang, Z.C. Study on the sand transport quantities on the different landscapes in the middle area of Yarlung Zangbo River. J. Desert Res. 2022, 42, 6–14. (In Chinese) [Google Scholar]
- Chen, S.Y.; Huang, J.P.; Kang, L.T.; Wang, H.; Ma, X.J.; He, Y.L.; Yuan, T.G.; Yang, B.; Hang, Z.W.; Zhang, G.L. Emission, transport, and radiative effects of mineral dust from the Taklimakan and Gobi Deserts: Comparison of measurements and model results. Atmos. Chem. Phys. 2017, 17, 1–43. [Google Scholar] [CrossRef]
- Ma, M.J.; Yang, X.H.; Zhou, C.L.; He, Q. Contributions of dusty weather and dust devil to dust emission amounts at the northern margin of the Taklimakan Desert. Nat. Hazards 2020, 103, 1441–1454. [Google Scholar] [CrossRef]
- Li, J.F.; He, Q.; Hu, L.Q. The Weather and Climate of the Taklamakan Desert and the Surrounding Mountainous Areas; The scientific Publishing House: Beijing, China, 2003; pp. 1–584. (In Chinese) [Google Scholar]
- Yang, X.H.; Yang, F.; Zhou, C.L.; Mamtimin, M.; Huo, W.; He, Q. Saltation emission in the Badain Jaran Desert: A field observation-based research. J. Arid. Land Resour. Environ. 2023, 37, 115–127. (In Chinese) [Google Scholar]
- Yang, X.H. Observation and Parameterization on Dust Emission over the Taklimakan Desert; Nanjing University of Information Science and Technology: Nanjing, China, 2019. [Google Scholar]


| Observation Point | Subfloor Characteristics | Particle Size (µm) |
|---|---|---|
| Changguo | The observation station is located about 10 m away from the riverbank. There are no plants between the station and riverbank. The ground consists of loose flowing sand. | 236 |
| Azha | About 150 m away from the river channel, there are sporadic artificial protective forests between the observation station and riverbank. On the west side, there is a crescent-shaped sand dune chain of about 20 m in width, which consists of mobile sand dunes. | 184 |
| Sangyesi | On the mountain foothills approximately 1.2 km from the river channel, the observation station is surrounded by natural vegetation with plant height <0.8 m and canopy coverage <30%. The area is a mobile sandy terrain. | 180 |
| Duopozhang | On the river floodplain, approximately 1.0 km from the river channel, there is an observation station surrounded by artificial protective forests. The vegetation has a height of 2.0 m and a spacing of 5 m. The area is characterized by mobile sandy terrain. | 150 |
| Sangri | The observation station is located about 15 m away from the river channel. There are no plants within 1.5 m around the station. On the eastern side, there is a crescent-shaped sand dune that is 1.0 m high. The surface of the ground is alluvial sediment and contains physical crust. | 112 |
| Senburi | The riverbed is composed of loose sediment. Within a 10 m radius of the observation station, there is scattered vegetation with a height of around 1.0 m, and the vegetation coverage is over 60%. | 82 |
Disclaimer/Publisher’s Note: The statements, opinions and data contained in all publications are solely those of the individual author(s) and contributor(s) and not of MDPI and/or the editor(s). MDPI and/or the editor(s) disclaim responsibility for any injury to people or property resulting from any ideas, methods, instructions or products referred to in the content. |
© 2024 by the authors. Licensee MDPI, Basel, Switzerland. This article is an open access article distributed under the terms and conditions of the Creative Commons Attribution (CC BY) license (https://creativecommons.org/licenses/by/4.0/).
Share and Cite
Ma, M.; Zha, D.; He, Q.; Yang, X.; Yang, F.; Mamtimin, A.; Zheng, X.; Sun, H. An Evaluation of the Dust Emission Characteristics of Typical Underlying Surfaces in an Aeolian Region in the Middle Reaches of the Yarlung Zangbo River on the Qinghai–Tibet Plateau. Land 2024, 13, 1168. https://doi.org/10.3390/land13081168
Ma M, Zha D, He Q, Yang X, Yang F, Mamtimin A, Zheng X, Sun H. An Evaluation of the Dust Emission Characteristics of Typical Underlying Surfaces in an Aeolian Region in the Middle Reaches of the Yarlung Zangbo River on the Qinghai–Tibet Plateau. Land. 2024; 13(8):1168. https://doi.org/10.3390/land13081168
Chicago/Turabian StyleMa, Mingjie, Duo Zha, Qing He, Xinghua Yang, Fan Yang, Ali Mamtimin, Xiannian Zheng, and Han Sun. 2024. "An Evaluation of the Dust Emission Characteristics of Typical Underlying Surfaces in an Aeolian Region in the Middle Reaches of the Yarlung Zangbo River on the Qinghai–Tibet Plateau" Land 13, no. 8: 1168. https://doi.org/10.3390/land13081168