Article

Nutrient Resorption in Young Stands of Three Native Tree Species to Support Restoration of Degraded Tropical Peatland in Indonesia

1
Research Center for Ecology and Ethnobiology, National Research and Innovation Agency, Jalan Raya Jakarta-Bogor Km 46, Cibinong, Bogor 16911, Indonesia
2
Research Center for Applied Zoology, National Research and Innovation Agency, Jalan Raya Jakarta-Bogor Km 46, Cibinong, Bogor 16911, Indonesia
3
Research Center for Applied Botany, National Research and Innovation Agency, Jalan Raya Jakarta-Bogor, Cibinong, Bogor 16911, Indonesia
4
Program of Tropical Silviculture, Faculty of Forestry and Environment, IPB University, Jalan Raya Dramaga, Bogor 16680, Indonesia
*
Author to whom correspondence should be addressed.
Land 2024, 13(8), 1169; https://doi.org/10.3390/land13081169 (registering DOI)
Submission received: 10 June 2024 / Revised: 16 July 2024 / Accepted: 24 July 2024 / Published: 30 July 2024
(This article belongs to the Special Issue Restoration of Tropical Peatlands: Science Policy and Practice)

Abstract

:
Nutrient resorption (NR) is a critical ecological process in forest ecosystems. However, there is a lack of knowledge about this process in the peatlands of Indonesia, and this may be seen as a research gap. In the present study, NR in young trees of three native species (Macaranga pruinosa, Cratoxylum arborescens, and Macaranga gigantea) and one exotic species (Acacia crassicarpa) in a drained tropical peatland was investigated. This study was conducted at an experimental plot in Pelalawan-Riau, Indonesia. Nutrient resorption efficiency (RE) and proficiency (RP) were calculated and correlated with soil properties, foliar nutrients, and growth variables. Our results revealed that M. pruinosa exhibited an RE value for phosphorus (PRE) that was 64% higher than that for the second-ranked native species but still significantly (84%) lower than that for A. crassicarpa. RE values for nitrogen (NRE) and potassium (KRE) did not differ significantly among species, ranging from 39 to 42% and 41 to 56%, respectively, for native species, with figures of 45% and 66%, respectively, for A. crassicarpa. Finally, PRE exhibited strong and significant correlations with PRP and tree growth, a finding that indicated that the uptake and conservation of P nutrients are essential for the fitness of the three native species. Overall, the results of the present study may be seen as beneficial for species selection and the management of nutrients by those engaged in restoration of tropical peatland forests.

Graphical Abstract

1. Introduction

Globally, tropical peatlands serve many essential functions. They may act as carbon sinks or serve to promote biodiversity and the protection of hydro-orology; in addition, they provide livelihoods for human beings. However, the majority of tropical peatlands have been degraded and deforested, leaving behind a diminished global landscape. This phenomenon has occurred most notably in Indonesia, which has the world’s largest area of tropical peatland, covering approximately 13.43 million hectares (ha) [1], but the pristine peat swamp forest in two of Indonesia’s main islands (Kalimantan and Sumatra) only remains about 4% [2].
In the last decade, the Indonesian government, through the Ministry of Environment and Forestry and the Peatland and Mangrove Restoration Agency of the Republic of Indonesia, has initiated a series of serious efforts to restore degraded and deforested peat lands through the 3R programs (rewetting, revegetation, and livelihood revitalization) [3]. A key driver of the success of these programs has been the rigorous application of species selection criteria grounded in ecological theory. Another issue that represents a challenge to peatland management in Indonesia is the declining productivity of plantation forests. In Indonesia, around 2.6 million ha of peatland is given over to the plantation of raw materials for the pulp and paper industries. Some 0.7 million ha of this concession is dedicated to krassikarpa (Acacia crassicarpa), an exotic tree species that may be planted in peatland [4]. However, the low productivity of A. crassicarpa (less than 140 m3/ha at harvest time) [5] has led managers at most plantations to consider other species, particularly native tree species, as suitable candidates to be promoted as replacements for A. crassicarpa. The importance of forest plantation to Indonesia as a source of raw materials for the pulp and paper industries means that the replacement of A. crassicarpa is a matter of national importance. Today, Indonesia ranks among the world’s top-ten pulp and paper producers [6]. If this rank is to be maintained, the identification of appropriate native tree species to replace A. crassicarpa is now urgently required.
As a megadiverse country in the tropics, Indonesia has many native tree species of high commercial value, along with other species of lower commercial value, including a number of lesser-known pioneer species characterized by fast rates of growth. However, until recently, few studies have been carried out on those species, compared with commercial fast-growing species such as mangium and sengon. Nevertheless, it has been shown [7,8] that the use of a broad variety of native tree species in reforestation programs may be of great value, because such a strategy promotes biodiversity, among other environmental benefits.
One study of native tree species that might potentially be developed on forest plantations involved mahang (Macaranga pruinosa), skubung (Macaranga gigantea), and geronggang (Cratoxylum arborescens). Among those species, mahang exhibited the best wood productivity for pulp raw material (wood volume 21.3 m3/ha/year) [9], but the best pulp yield was achieved by geronggang (4.83 m3 wood/ton pulp) [10]. In another study, it was found that geronggang produced the highest litterfall, of 7.04 ton/ha/year [11]. In light of such results, among the three species just mentioned, geronggang and mahang have been most often selected as candidates for pulpwood plantation. However, because these three species are all native to the tropical peat swamp forests of Indonesia, each may be seen as a good potential plantation candidate, as part of the Indonesian revegetation program of peatland restoration. However, to investigate this matter more comprehensively, other related parameters must be better understood. One of these parameters is the natural phenomenon of nutrient resorption (NR) and its associated variables.
The process by which nutrients are mobilized from senescing leaves and transported to other plant tissues is known as nutrient resorption [12]. This process reduces the reliance of plants upon external (soil) nutrients. Globally, NR satisfies 31% and 40% of the total annual demand of plants for nitrogen (N) and phosphorus (P), respectively [13]. NR plays an essential role in ecosystems as one of the indicators of biogeochemical cycles and functioning [14]. Moreover, the authors of [15] showed that, in forests, N resorption was more important to N acquisition and community productivity than N mineralization. Previous studies have also shown that the NR process is significantly associated with the growth and fitness of plants, as well as foliar and soil nutrient levels [16,17,18]. In the present study, the first to study NR in tropical peatland, the nutrient resorption patterns of three native tree species were investigated. Furthermore, to uncover their potential associations with environmental and internal factors, soil nutrient composition, foliar nutrient content, and plant growth performance were also investigated.

2. Materials and Methods

2.1. Experimental Site

This research was conducted at an experimental plot in Lubuk Ogong Village, Pelalawan District, Riau Province, Indonesia (101°41′06″–101°41′10″ E, 0°19′42″–0°19′48″ N, elevation 12 m ASL). Previously, this plot has been used for observing and evaluating the growth performance of native and exotic tree species, as described in [9]. Based on previous reports [9,19], this location may be said to have a climate of type A (based on the Schmidt–Ferguson classification), with mean annual temperature and rainfall of 21–32 °C and 2500–3000 mm, respectively. The site has a histosol soil type (fibric-hemic maturity), and has also been drained, with annual variations in the water level of about 20–135 cm below the soil surface.

2.2. Experimental Design

In the present study, in line with a previously described experimental layout [9], we utilized a randomized block design framework. As treatments, we used three native species of tree, namely, mahang (Macaranga pruinosa), geronggang (Cratoxylum arborescens), and skubung (Macaranga gigantean), and one exotic species, namely, Acacia crassicarpa. All tree species were planted using 2 m × 3 m spacing with five blocks/replications. Standard procedures for maintenance of the experimental plot were based on those applied by PT Riau Andalan Pulp and Paper [9]. Growth performance data for all observed tree species at 3.5 and 4.5 years old are provided in Table 1.

2.3. Data Collection

The study design involved five blocks/replications; however, resource limitations restricted the number of actual replications to three. Despite this, the experiment resulted in an adequate level of precision, as shown by a relatively low coefficient of variation. In addition, following [20], related data were collected only at three representative replications, which had approximately the same characteristics as unselected replications. At 3.75 years after planting (years), sufficient amounts of mature (expanded) and senesced (yellow-brown) leaves were collected from each studied tree species at selected replications, with the average number of trees of each species in each replication ranging from 15 to 42, depending on survival rates [9]. All collected leaves for each species and each replication were then mixed to produce a composite sample; thus, each studied species had three composite samples of mature and senesced leaves. In addition, composite samples of soil from under each studied species (sourced from five points) were collected from similar blocks at 3.5 years after planting, using a hoe at depths of 0–20 cm [21]. Samples of soil and leaves were all sealed in plastic prior to further processing in the laboratory.
Soil and foliar analysis was conducted at the Soil and Plant Laboratory of the Research Division of PT. Sarana Inti Pratama in Pekanbaru, Riau, Indonesia. Parameters for leaves expressed total content levels of N, P, and potassium (K) nutrients. For soil, carbon (C), N, available P, available cations, available Fe, cation exchange capacity (CEC), and pH were the variables analyzed. The Kjeldahl method was used to determine total N in leaves and soil, while total P and K in leaves were determined after extraction using 25% HCl. Soil pH was measured using a pH meter, while total foliar C was determined using the colorimeter method. The Bray II method was used to determine available soil P, while the NH4OAc (pH 7.0) extraction method was used to determine base cations (K, magnesium/Mg, calcium/Ca and natrium/Na) and CEC in soil. Finally, we used Morgan’s extraction method to measure soil-available iron (Fe).

2.4. Data Analyses

NR can be defined by two parameters: nutrient resorption efficiency (RE) and proficiency (RP). In the present study, RP expressed the nutrient content in senesced leaves, while RE was quantified based on the formula below [22]:
R E = ( t h e   a m o u n t   o f   n u t r i e n t   i n   g r e e n   l e a v e s t h e   a m o u n t   o f   n u t r i e n t   i n   s e n e s c e d   l e a v e s ) n u t r i e n t   i n   g r e e n   l e a v e s × 100 %
Differences among species in soil chemical properties, foliar nutrients, and NR were assessed using a one-way analysis of variance (ANOVA). Where significant differences (p < 0.05) were identified for specific variables, a Duncan test was further employed for post hoc pairwise comparisons. The ANOVA test was run after normality, and all data were tested for homogeneity using Shapiro–Wilk and Levene’s tests. Correlation analysis was conducted to explore the relationships between NR and soil, foliar, and growth traits. For correlation between NR and growth traits, growth data from [9] were used. The Shapiro–Wilk test for normality was used to determine the appropriate type of correlation. Pearson correlation was used for data that were normally distributed; Spearman correlation was used for data that were not normally distributed.

3. Results

3.1. Chemical Properties of Soil

As shown in Table 2, the soil acidity (pH < 4.5, with a range of 3.1–3.2) and nutrient content under stands of all studied species were relatively similar, except for the content of available P and Mg. Available P under skubung (65.8 ppm) was significantly lower (p < 0.05) than under other species (89.7–106.2 ppm), while available Mg under the stands of geronggang (2.7 me/100 g) and krassikarpa (2.8 me/100 g) was significantly higher than under mahang (2.0 me/100 g) and skubung (1.6 me/100 g). Total N content under the stands of all studied species was above 0.75% (1.3–1.4%), while the range of K content under all studied species was 0.29–0.48 me/100 g. Furthermore, CEC, base saturation (BS), and available Fe under the stands of all studied species were also similar, with values of above 130 me/100 g (135.7–153.0 me/100 g) for CEC, below 12% (8–11%) for BS, and below 45 ppm (38.7–40.3 ppm) for available Fe.

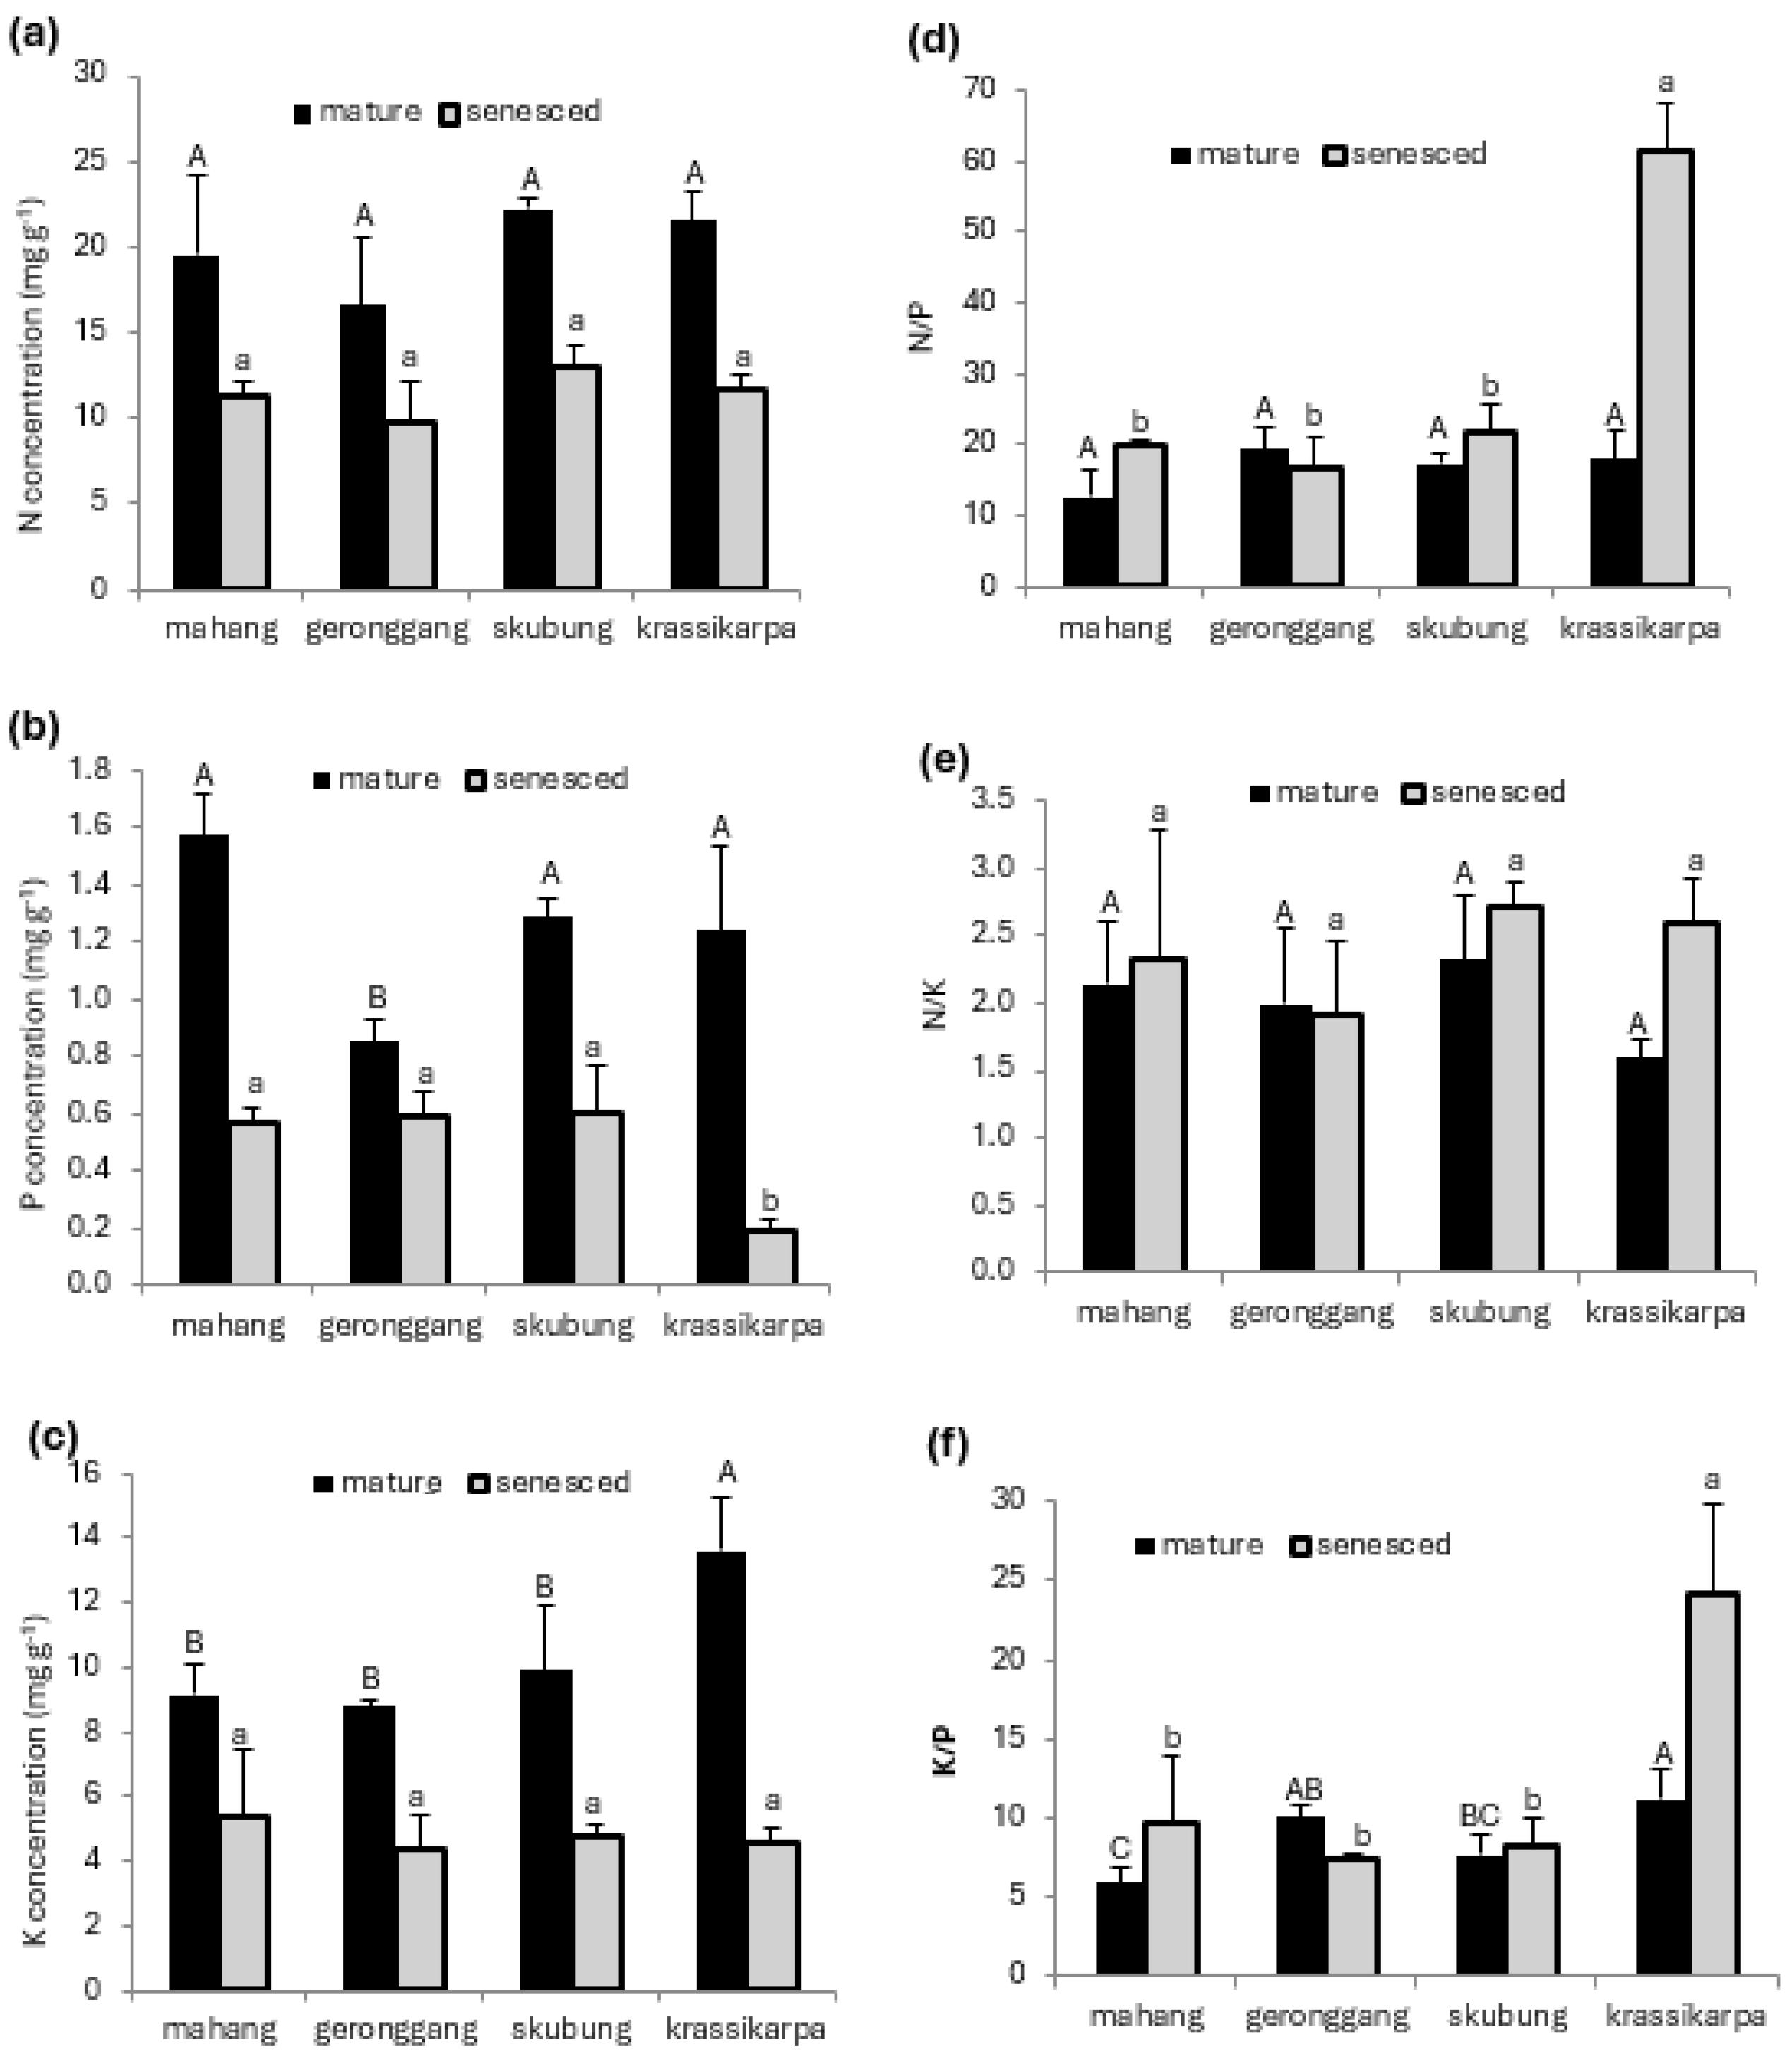
3.2. Foliar Nutrients

Levels of N, P, and K content in mature leaves (Nm, Pm and Km) of the three native species ranged from 16.6–21.16 mg g−1 and 0.8–1.6 mg g−1 to 9.7–12.9 mg g−1, respectively (Figure 1a–c). Values for Nm and Km did not differ significantly among native species (p > 0.05); however, the Pm of geronggang (0.8 mg g−1) was significantly lower than that of other native species (p < 0.05). When comparing the three native species with the single exotic species (krassikarpa), a general trend emerged; while the Nm and Pm values of krassikarpa did not differ significantly from those recorded for native species, the Km value for krassikarpa was demonstrably higher than that of all native species variants.
The N, P, and K content in senesced leaves (Ns, Ps and Ks) did not vary significantly among native species, with values recorded ranging from 9.7–12.9 mg g−1 and 0.57–0.60 mg g−1 to 4.8–5.4 mg g−1, respectively (Figure 1a–c). Measured differences between krassikarpa and native species with respect to Ns and Ks were insignificant (p > 0.05), but the Ps of krassikarpa (0.19 mg g−1) was significantly lower than that observed in native species (p < 0.05).
Variations in leaf N, P and K stoichiometry among studied species revealed a different pattern (Figure 1d–f). Among native species, the Nm/Pm and Ns/Ps ratios did not differ significantly (p > 0.05), with ranges of 12.7–19.4 and 16.6–21.9, respectively, being recorded (Figure 1d). In addition, the Nm/Pm ratios for native species did not differ significantly (p > 0.05) from the ratio for krassikarpa (18.1). However, the Ns/Ps ratio for krassikarpa was very high (61.6) and significantly higher than those for native species. The Nm/Km and Ns/Ks ratios did not differ significantly (p > 0.05) among studied species, with ranges of 1.6–2.3 and 1.9–2.7 being recorded (Figure 1e). However, for Km/Pm and Ks/Ps ratios, generally, values for krassikarpa (Km/Pm = 11.2; Ks/Ps = 24.2) were significantly higher than the ranges recorded for native species (5.9–10.4 for Km/Pm; 7.5–9.6 for Ks/Ps) (Figure 1e).

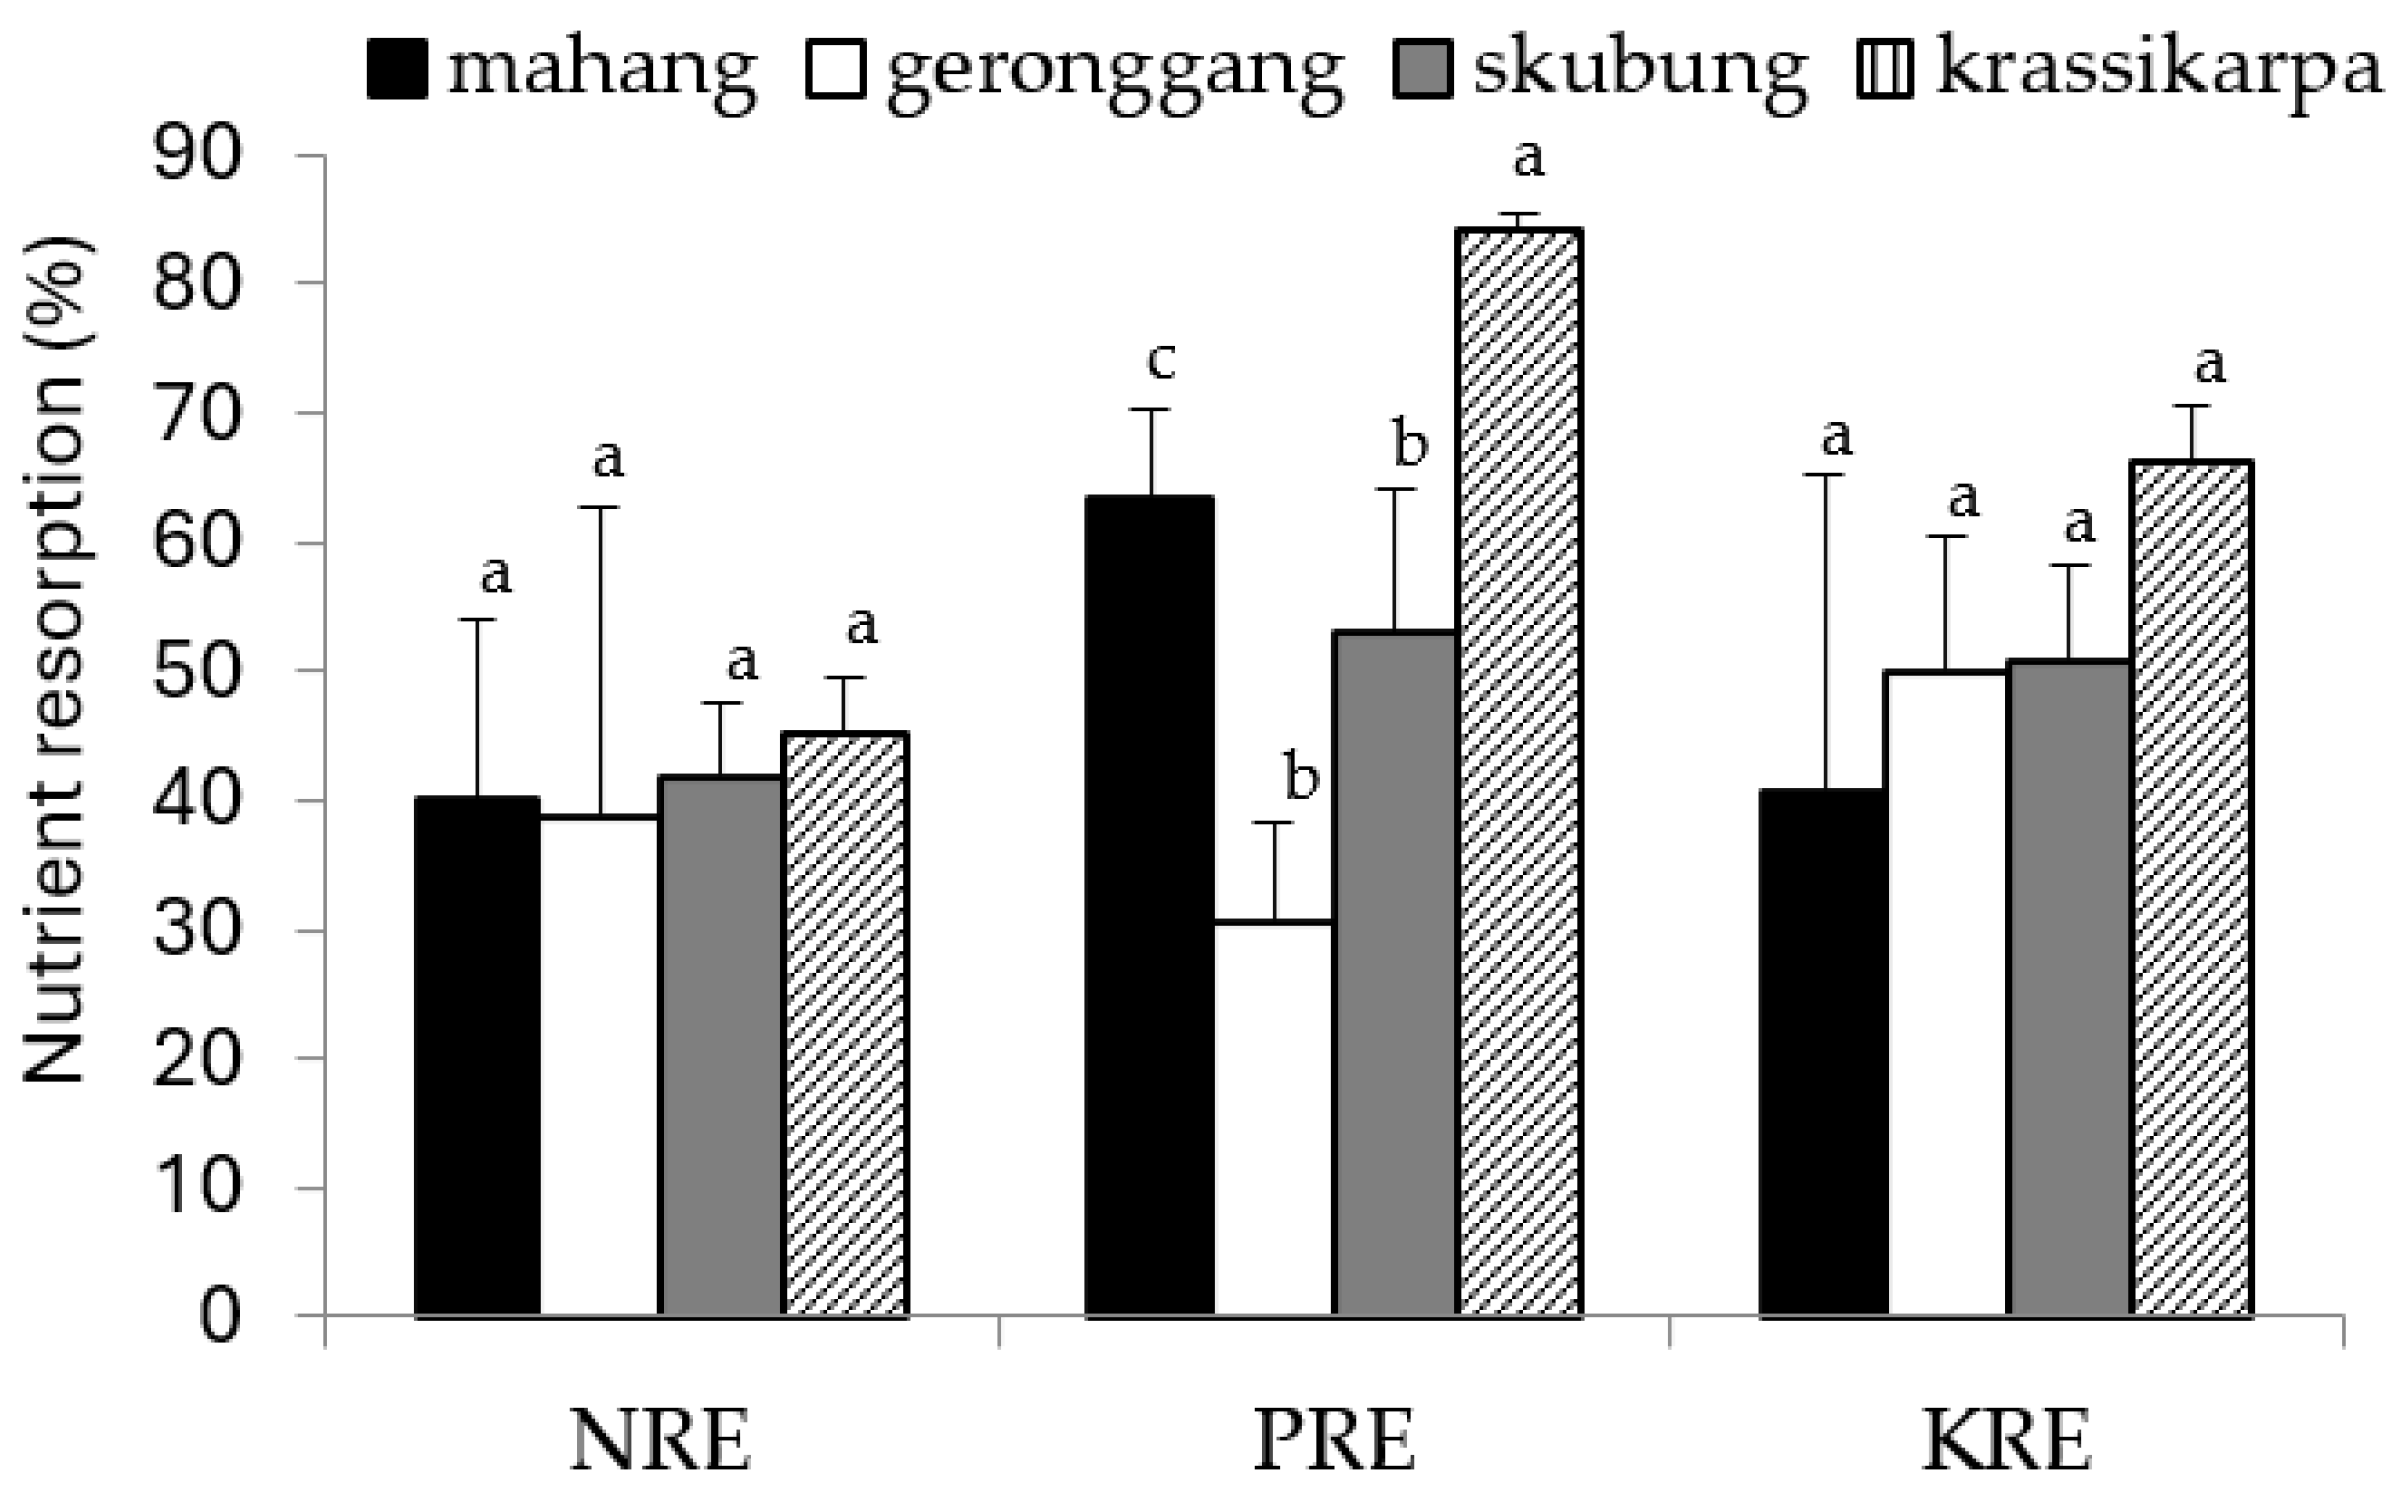
3.3. Nutrient Resorption

Values for resorption proficiency (RP), which were determined based on the maximum concentration of nutrients in senesced leaves, showed that, among native species, nitrogen resorption proficiency/NRP (9.7–12.9 mg g−1), phosphorus resorption proficiency/PRP (0.57–0.60 mg g−1), and potassium resorption proficiency/KRP (4.8–5.4 mg g−1) did not vary significantly (p > 0.05) (Figure 1a–c). In the case of krassikarpa, values for NRP (1.8 mg g−1) and KRP (4.6 mg g−1) did not differ significantly from those of native species. Furthermore, because a lower nutrient concentration in senesced leaves results in higher proficiency, krassikarpa (which had a PRP of 0.19 mg g−1) was significantly more proficient with respect to P than native species (0.57–0.6 mg g−1).
Among native species, nitrogen and potassium resorption efficiencies (NRE and KRE) did not vary significantly, with ranges of 39–42% and 41–51%, respectively, being recorded (Figure 2). In addition, the NRE and KRE values of native species did not vary significantly from those of krassikarpa (NRE = 45%; KRE = 66%). Among native species, the phosphorus resorption efficiency (PRE) was significantly higher in mahang (64%) and skubung (53%) than in geronggang (31%). However, the highest PRE value (84%) was obtained for krassikarpa, which was significantly higher than for any native species.

3.4. Relationships among Resorption, Soil Nutrients, Foliar Nutrients, and Tree Growth

Soil nutrients were not significantly correlated with NR. Several foliar nutrient variables were strongly (r > 0.5) and significantly (p < 0.05) positively correlated with NR (Table 3). These strong and significant positive correlations were between Nm and NRE, Km and PRE, and Km and KRE. In addition, a strongly negative relationship was observed between Ps and PRE.
Our findings indicated that, among the three primary macronutrients in mature leaves, potassium (Km) exhibited a stronger association with growth parameters, compared with nitrogen (Nm) or phosphorus (Pm) (Table 4). Km exhibited a strong and statistically significant positive association (p < 0.05) with diameter at breast height (dBH) at both 3.5 and 4.5 years old and also with height at 4.5 years old.
Nutrient resorption efficiency showed a positive correlation with tree growth. In addition, strong and significant positive correlations were expressed between PRE and growth and between PRP and growth (Table 5). Furthermore, the relationship between nutrient proficiency and growth showed that growth exhibited strong and significant positive correlations with PRP and the NRP/PRP ratio.

4. Discussion

The tropical peat swamp forests (TPSFs) of Indonesia have become a focus of interest to researchers worldwide. Because the effects of rapid degradation in this vital ecosystem have been related to the impact of global climate change, most of this research concerned the emission of greenhouse gasses, especially CO2 and CH4. To date, no studies on nutrient resorption (NR) and its associated variables in this vital ecosystem have been carried out, although research has been conducted in temperate and boreal peatlands [24,25]. Therefore, the present study is the first study to investigate NR in tropical peatlands. Though this was a local-scale study that involved only one experimental plot, it potentially fills the abovementioned research gap and provides a better understanding of ecological processes in the tropical peatlands of Indonesia. The findings presented in this study could be used to promote the better management of peatland, both for plantation/production purposes and also for rehabilitation programs.

4.1. Site Characteristics

The site of the present study was characterized by a high nutrient content, especially P availability. The availability of K, Ca, and Mg was also relatively sufficient. In short, the soil used in our plot experiment was fertile. This fertility might be related to the two factors of drainage and fertilizer application. Drainage alters peatland from an anoxic to an oxic condition and further activates mineralization in both soil and litter, thereby promoting soil nutrient availability. The authors of [21] reported that levels of P and K released from the litter of four studied species after four months of incubation reached 70.1–73.8% and 89.5–93.1%, respectively, of total content in litter. Furthermore, the plot in the present study received fertilizer, especially the slow-release fertilizer rock phosphate (Ca3 (PO4)2CaF) [9], which improved the availability of both P and Ca.

4.2. Foliar Nutrients and Their Stoichiometry

The present study found that the average levels of N, P, and K content in mature leaves of all three native species were 19.9 mg g−1 (16.6–22.3 mg g−1), 1.3 mg g−1 (0.9–1.6 mg g−1), and 9.3 mg g−1 (8.8–9.9 mg g−1), respectively; corresponding levels in senesced leaves were 11.3 mg g−1 (9.7–12.9 mg g−1), 0.6 mg g−1 (0.6–0.6 mg g−1), and 4.9 mg g−1 (4.4–5.4 mg g−1), respectively. As the present study involved pioneer evergreen woody species, the levels of N and P content that we found in mature leaves were higher than those previously recorded for leaves of evergreen woody species across the world [26]. Another previous study showed that levels of N and P in green leaves of pioneer woody species were higher than in non-pioneer woody species [27].
Mahang (Nm 19.6 mg g−1 and Pm 1.6 mg g−1) and skubung (Nm 22.3 mg g−1 and Pm 1.3 mg g−1) are classified in the same family of Euphorbiaceae. The authors of [28] reported that global mean values for N and P in mature leaves of Euphorbiaceae were 16.8 mg g−1 and 1.3 mg g−1, respectively. This means that the levels of N content found in mature leaves of mahang and skubung in the present study were higher than the global mean, while the level of P content was similar.
Another native species, geronggang (Nm 16.6 mg g−1 and Pm 0.9 mg g−1), is classified in the Guttiferae family, based on [29]. The authors of [28] reported that, globally, mean values for Nm and Pm of the Guttiferae family were 15.0 mg g−1 and 0.8 mg g−1, indicating that the levels of N and P content in mature leaves of geronggang found in the present study were relatively similar to global mean values.
To the best of our knowledge, only three previous studies have been conducted on the foliar nutrients of woody species in Indonesia. All three of these studies were carried out on mineral land (dry land) and involved only two woody species, cocoa and skubung [30,31,32]. The authors of [30,31] reported that Nm content in cocoa was lower than in three native species, but levels of Pm and Km were higher. This might have been because cacao is a fruit tree that requires more available P and K to produce its fruits. Furthermore, the level of Nm in skubung recorded in the present study was higher than the level recorded in the mineral land of Kalimantan by the authors of [32], but the corresponding Km level was lower. This difference is probably due to the site of the present study having lower soil total N, but higher K, compared with the skubung site reported in [32]. Another reason may be that the skubung in our study was younger than that used in [32].
Krassikarpa is classified within the leguminosae family. Globally, the content levels of Nm and Pm of leguminosae have been recorded as 27.4 mg g−1 and 0.12 mg g−1, respectively [28]. In the present study, the Nm content of krassikarpa was found to be 21.6 mg g−1, lower than the global value, while the Pm content was found to be 1.2 mg g−1, similar to the global value. This lower value of Nm is probably due to the global value including a number of non-Acacia species [33,34].
The foliar nutrient concentration is an important indicator that could determine the nutrient sufficiency of a tree [35]. Many authors have used foliar nutrient stoichiometry (especially N:P) to predict nutrient limitations with different critical ratios. Researchers have reported that plant growth can be limited by N or P when foliar N:P is <14 or >16 [36], or <16.3 or >16.3 [37]. In the present study, the N:P ratios of mahang, geronggang, skubung, and krassikarpa were 12.7, 19.4, 17.35, and 18.3, respectively, indicating that all studied species tended to suffer P limitation, with the exception of mahang.

4.3. Nutrient Resorption

For the three native tree species, NRE, PRE and KRE values were found to be 40%, 49%, and 47%, respectively; for krassikarpa, the corresponding values were 45%, 84%, and 66%, respectively. Nutrient resorption values in native tree species were, therefore, lower than the global average figures, which for NRE, PRE, and KRE were 62%, 64%, and 70%, respectively [38]. NRE and PRE values were also lower than the mean global values (across multiple plant species and ecosytems) for NRE (47%) and PRE (54%) recently reported by [39]. The authors of [38] showed that, among all plant types, the lowest nutrient resorption generally was shown by evergreen angiosperm species; this finding is supported by other studies [25,40] that found that RE in evergreen trees was lower than in deciduous trees or graminoids. In the present work, the four studied species were evergreen angiosperma; consequently, their RE values were lower than the global values that were calculated using other plant types with higher RE values, including conifer, deciduous angiosperm, fern, forb, and graminoid. However, the average RE in the present study was higher than that recorded for 39 tropical tree species (NRE 10%, PRE 36%, and KRE 45%) on dry land in French Guiana [41] and that recorded for six tropical tree species (NRE 12.6%) on dry land at Jambi, Indonesia [42]. This was probably because the present study involved pioneer fast-growing species that had relatively low wood density; in contrast, previous studies [41,42] have involved a mix of fast-growing and non-fast-growing/non-pioneer tree species with higher wood density. The authors of [41] found that RE declined with increased wood density, while the authors of [33] reported that foliar RE in pioneer tree species in the Brazilian Amazon was higher than in non-pioneer tree species. Generally, pioneer trees are fast-growing species that require more active growth in young leaves to support overall growth, so they become sinks for carbohydrates and nutrients in plants, with high resorption efficiencies [43].
Furthermore, because the present study involved species with the potential to be grown in forest plantations, average NRE values recorded were lower than the global value for planted forest (NRE 59%) [44]. This lower NRE value might be due to the present study having been conducted in a tropical area with high temperature and precipitation [45].
The PRE values for mahang, geronggang, skubung, and krassikarpa were 64%, 31%, 53%, and 84.2%, respectively. The global PRE value for planted forest is 60% [44]. In other words, the PRE values for krassikarpa and mahang were higher than the global figure, while the corresponding values for geronggang and skubung were lower. This variation in results is considered in the following sub-section, ”Relationship between nutrient resorption and growth”, in which further related traits in the studied species are also described.

4.4. Relationships between Nutrient Resorption, Soil Nutrients and Foliar Nutrients

In one previous study, a significant relationship between NR and soil properties was identified [40]. However, the present work did not find any significant or close correlation between soil nutrient and nutrient resorption efficiency (RE). The authors of [46] revealed a similar finding in their study of a Pinus massoniana plantation in Southern China, suggesting that context-specific factors might influence soil nutrient–RE interactions.
The lack of correlation between NE and soil properties in the present study might have been because our research was undertaken at a homogeneous site that generally did not exhibit any variations in soil properties [40] affecting levels of soil N, P, or K. Despite this, the present study showed the soil P and K under skubung stand as being significantly lower than those under other stands, but the soil P under skubung was still categorized as very high; it was low for K, but its class was not different enough than those under other stands, which were moderate. Another possible reason might have been that the variability in resorption in the present study was not determined by soil nutrients themselves but tended to be more related to the inherent physiological traits of the studied species [47].
The present study showed the close and significant positive correlation between NRE and N content in mature leaves and also between KRE and K content, in line with the findings of [16]. Because nutrients in green leaves mainly originate from soil, our findings indicate that those tree species that could uptake higher levels of N and K from soil had a better capability to resorp N and K and, thus, a better capability to conserve N and K nutrients. Our finding that PRE exhibited a close and significant negative correlation with P in senesced leaves was also in line with previous results [24,48], indicating that RE reflects resorption proficiency and further determines the completeness or incompleteness of resorption [49]. Notably, complete P resorption typically occurs in evergreen species when P levels in senesced leaves fall below 0.4 mg g−1 [50]. By applying this benchmark, we concluded that complete P resorption was not detected in all three native tree species but was detected in krassikarpa.
In the present study, PRE also exhibited a strong and significantly positive correlation with K mature leaves. This was not a surprising result, because resorption of certain nutrients may depend on other nutrients [51]. Therefore, it was very possible for K to influence PRE because resorption involves processes, such as enzymatic breakdown of P-containing compounds in the leaves (hydrolysis) and the loading and transport of phloem [52]; in both these processes, K is known to play an important role [53,54].

4.5. Nutrient Resorption and Tree Growth

The present study observed the resorption of the three most important nutrients (N, P, and K) required for plant growth. However, the results revealed that only P resorption (efficiency, proficiency, and stoichiometry) exhibited a strong and significant positive correlation with growth in the studied species. This finding was in line with the results of previous studies on Artemisia frigida and Medicago sativa [20,55]. It meant that nutrient resorption of P played an essential role in influencing the variation in the growth of our studied species. Put simply, tree species with higher nutrient resorption of P were faster-growing species. This was in line with the previous finding [18] that variation in interspecific growth in tropical tree species was more related to PRE than NRE. However, it must be noted that the content levels of soil P in most tropical land are low; in contrast, the site of the present study was characterized by abundant available P. Other studies have produced results contrary to ours; in these works, PRE was found to be negatively or insignificantly correlated with growth in abundant soil P [48,56,57].
Two possible reasons may be proposed to explain the differences between our results and those of several previous studies. The first possibility is related to the high content of soil N in the plot of the present study; it is possible that this limited P soil acquisition [51]. Though the availability of soil P was high, the quantity that could be absorbed by the plant might not have been optimal. This possibility is supported by our finding that the N:P of mature leaves indicated P limitation, so that the plant was driven to increase resorption. The second possibility arises from the fact that our studied species have the inherent trait that dominated the P soil factor [47,58], leading to different PRE values, despite similar levels of soil P.
Geronggang had the lowest PRE (31%), which might be explained as an effect of its association with arbuscular mycorrhizas [59], leading to improved absorption of soil P and a consequently low PRE. The highest PRE was recorded for krassikarpa (84%), followed by mahang (64%). Those two species are fast-growing species that require more P for the production of massive amounts of new tissue and organs and for the growth of new woody stem [60,61]. P is also required as a major component of genetic materials [62,63]. In light of this, we may suggest that krassikarpa and mahang maximize the utilization of P originating from all sources involved in resorption; this explains why their PRE values were higher than of those of the two other studied species and also the global average for planted forest [44]. Finally, we found in the present study that skubung had the slowest growth, but as a non-mycorrhizal plant, it had a higher PRE than geronggang but slower growth than krassikarpa and mahang. The P required from resorption was lower than that in krassikarpa and mahang; thus, the PRE of skubung was lower than that of krassikarpa and mahang.

5. Conclusions

In the present study, the NRE and KRE values for young stands of three native tree species (mahang, geronggang, and skubung) and the exotic species of Acacia crassicarpa were found to be similar. However, in the case of PRE, a ranking of geronggang < skubung ≈ mahang < Acacia crassicarpa was determined. In combination with potentially related factors, foliar nutrients were found to determine nutrient resorption in the following cases: N of mature leaves on NRE; K of mature leaves on KRE and PRE; and P of senesced leaves on PRE. PRE showed a significantly positive role in determining growth variation across species, indicating that it could be used for species selection among our studied tree species and might potentially be used for species selection in pioneer tree species of tropical peat swamp forests; however, further research involving greater numbers of species is still required. For forest plantation and restoration in degraded peatland, the present study suggests that the native species mahang—which exhibited better growth and higher PRE—should be selected for forest plantation and restoration programs in degraded peatland. Finally, although geronggang was found to have low PRE, we also recommend that this species be selected due to its association with arbuscular mycorrhizas.

Author Contributions

Conceptualization, A.J. and N.M.; methodology, A.J., A.P. and N.M.; formal analysis, A.J.; investigation, A.J. and A.P.; data curation, A.J.; writing—original draft preparation, A.J., A.P., N.M., D.O., I.W.S.D., H.K., R.F., H.S., B.T.P., A.W.N., Y.L., Y., A.D.N. and M.I.; writing—review and editing, A.J., A.P., N.M., D.O., I.W.S.D., H.K., R.F., H.S., B.T.P., A.W.N., Y.L., Y., A.D.N. and M.I.; visualization, A.J.; supervision, N.M.; funding acquisition, A.J., A.P. and A.D.N. All authors have read and agreed to the published version of the manuscript.

Funding

This research was funded by Balai Penelitian Teknologi Serat Tanaman Hutan, grant number DIPA-029-07-2014 and DIPA-029-07-2015.

Data Availability Statement

The data presented in this study are available on request from the corresponding author.

Acknowledgments

We want to thank the Ministry of Environment and Forestry, Research and Development Division of PT. RAPP and Dahlan (Chief of Lubuk Ogong Village) for a lot of valuable facilitations in this research. We also thank Arifin and Sunarto for assisting us in the field.

Conflicts of Interest

The authors declare no conflicts of interest.

References

  1. Anda, M.; Ritung, S.; Suryani, E.; Sukarman; Hikmat, M.; Yatno, E.; Mulyani, A.; Subandiono, R.E.; Suratman; Husnain. Revisiting tropical peatlands in Indonesia: Semi-detailed mapping, extent and depth distribution assessment. Geoderma 2021, 402, 115235. [Google Scholar] [CrossRef]
  2. Miettinen, J.; Liew, S.C. Status of peatland degradation and development in Sumatra and Kalimantan. AMBIO 2010, 39, 394–401. [Google Scholar] [CrossRef] [PubMed]
  3. Dohong, A. Bolstering Peatlands restoration in Indonesia through 3Rs approach. In Workshop of Developing International Collaborations to Address Fire and Other Conservation Issues in Central Kalimantan, Indonesia; Badan Restorasi Gambut: Jakarta, Indonesia, 2017. [Google Scholar]
  4. Harwood, C.E.; Nambiar, E.K.S. Sustainable Plantation Forestry in South-East Asia; ACIAR: Canberra, Australia, 2014. [Google Scholar]
  5. Suhartati; Rahmayanto, Y.; Daeng, Y. The reducing of acacia rotation impact to sustainability of productivity, ecology and social aspect. Info Tek. Eboni 2014, 11, 103–116. [Google Scholar]
  6. Potensi Pulp and Paper di Indonesia. Available online: https://kemlu.go.id/maputo/id/news/11882/potensi-pulp-and-paper-di-indonesia (accessed on 6 June 2024).
  7. Subiakto, A.; Rachmat, H.H.; Sakai, C. Choosing native tree species for establishing man-made forest: A new perspective for sustainable forest management in changing world. Biodivers. J. Biol. Divers. 2016, 17, 620–625. [Google Scholar] [CrossRef]
  8. Giesen, W. Tropical peatland restoration in Indonesia by replanting with useful indigenous peat swamp species: Paludiculture. In Tropical Peatland Eco-Management, 1st ed.; Osaki, M., Tsuji, N., Foead, N., Rielay, J., Eds.; Springer Nature Singapore Pte Ltd.: Singapore, 2021; pp. 411–441. [Google Scholar]
  9. Junaedi, A. Growth performance of three native tree species for pulpwood plantation in drained peatland of Pelalawan District, Riau. Indones. J. For. Res. 2018, 5, 119–132. [Google Scholar] [CrossRef]
  10. Aprianis, Y.; Akbar, O.T.; Rizqiani. Comparison the properties of raw material and kraft pulp from Nature and Plantation of Geronggang Wood (Cratoxylon arborescen). J. Trop. Wood Sci. Technol. 2018, 16, 177–183. [Google Scholar]
  11. Junaedi, A.; Hardiwinoto, S.; Supriyo, H.; Mindawati, N. Litter productivity and leaf litter nutrient return of three native tree species in drained tropical peatland, Riau-Indonesia. IOP Conf. Ser. Earth Environ. Sci. 2020, 533, 012007. [Google Scholar] [CrossRef]
  12. Aerts, R. Nutrient resorption from senescing leaves of perennials: Are there general patterns? J. Ecol. 1996, 84, 597–608. [Google Scholar] [CrossRef]
  13. Cleveland, C.C.; Houlton, B.Z.; Smith, W.K.; Marklein, A.R.; Reed, S.C.; Parton, W.; Del Grosso, S.J.; Running, S.W. Patterns of new versus recycled primary production in the terrestrial biosphere. Proc. Natl. Acad. Sci. USA 2013, 110, 12733–12737. [Google Scholar] [CrossRef]
  14. Pang, Y.; Tian, J.; Wang, D. Response of multi-ecological component stoichiometry and tree nutrient resorption to medium-term whole-tree harvesting in secondary forests in the Qinling Mountains, China. For. Ecol. Manag. 2021, 498, 119573. [Google Scholar] [CrossRef]
  15. Zhang, P.; Lü, X.T.; Jin, G.; Liu, Z.; Li, M.H. Leaf nitrogen resorption is more important than litter nitrogen mineralization in mediating the diversity–productivity relationship along a nitrogen-limited temperate forest succession chronosequence. For. Ecosyst. 2023, 10, 100102. [Google Scholar] [CrossRef]
  16. Du, B.; Ji, H.; Liu, S.; Kang, H.; Yin, S.; Liu, C. Nutrient resorption strategies of three oak tree species in response to interannual climate variability. For. Ecosyst. 2021, 8, 70. [Google Scholar] [CrossRef]
  17. Luo, Y.; Peng, Q.; Li, K.; Gong, Y.; Liu, Y.; Han, W. Patterns of nitrogen and phosphorus stoichiometry among leaf, stem and root of desert plants and responses to climate and soil factors in Xinjiang, China. Catena 2021, 199, 105100. [Google Scholar] [CrossRef]
  18. Zhang, J.L.; Zhang, S.B.; Chen, Y.J.; Zhang, Y.P.; Poorter, L. Nutrient resorption is associated with leaf vein density and growth performance of dipterocarp tree species. J. Ecol. 2015, 103, 541–549. [Google Scholar] [CrossRef]
  19. Husnain, H.; Sipahutar, I.A.; Purnomo, J.; Widyanto, H.; Nurhayati, N. CO2 Emissions from Tropical Peat Soil Affected by Fertilization. J. Trop. Soils 2017, 22, 1–9. [Google Scholar] [CrossRef]
  20. Lu, J.; Liu, M.; Yang, M.; Xie, J.; Yang, H.; Li, L. Leaf resorption and stoichiometry of N and P of 1, 2 and 3 year-old lucerne under one-time P fertilization. Soil Tillage Res. 2020, 197, 104481. [Google Scholar] [CrossRef]
  21. Junaedi, A.; Mindawati, N.; Pribadi, A.; Hardiwinoto, S. Leaf litter decomposition and nutrient release of three native tree species in a drained tropical peatland in Riau, Indonesia. HAYATI J. Biosci. 2022, 29, 182–191. [Google Scholar] [CrossRef]
  22. Pan, X.; Ping, Y.; Cui, L.; Zhang, X.; Li, W.; Hu, Y.; Cornelissen, J.H.C. Nutrient resorption from leaves of wetland plants in a constructed wetland depends on green leaf nutrient content and life form. Wetlands 2020, 40, 983–991. [Google Scholar] [CrossRef]
  23. Eviati, S. Analisis Kimia Tanah, Tanaman, Air, dan Pupuk, Petunjuk Teknis, 2nd ed.; Balai Penelitian Tanah: Bogor, Indonesia, 2009. [Google Scholar]
  24. Gao, S.; Song, Y.; Song, C.; Wang, X.; Gong, C.; Ma, X.; Gao, J.; Cheng, X.; Du, Y. Long-term nitrogen addition alters peatland plant community structure and nutrient resorption efficiency. Sci. Total Environ. 2020, 844, 157176. [Google Scholar] [CrossRef] [PubMed]
  25. Kučerová, A.; Adamec, L. Foliar resorption efficiency does not change along an elevational gradient in two dominant peatbog plant species. Folia Geobot. 2022, 57, 247–257. [Google Scholar] [CrossRef]
  26. Güsewell, S. N:P ratios in terrestrial plants: Variation and functional significance. New Phytol. 2024, 164, 243–266. [Google Scholar] [CrossRef]
  27. Tsujii, Y.; Fan, B.; Atwell, B.J.; Lambers, H.; Lei, Z.; Wright, I.J. A survey of leaf phosphorus fractions and leaf economic traits among 12 co-occurring woody species on phosphorus-impoverished soils. Plant Soil 2023, 489, 107–124. [Google Scholar] [CrossRef]
  28. Tian, D.; Yan, Z.; Ma, S.; Ding, Y.; Luo, Y.; Chen, Y.; Du, E.; Han, W.; Kovacs, E.D.; Shen, H.; et al. Family-level leaf nitrogen and phosphorus stoichiometry of global terrestrial plants. Sci. China Life Sci. 2019, 62, 1047–1057. [Google Scholar] [CrossRef]
  29. Ibrahim, M.Y.; Mohamed, N.; Mohan, S.; Ameen, M.; Ibrahim, S.; Adam, I.; Yahayu, M.; Zeenelabdin, L.; Elhag, O. α-Mangostin from Cratoxylum arborescens: An in vitro and in vivo toxicological evaluation. Arab. J. Chem. 2015, 8, 129–137. [Google Scholar] [CrossRef]
  30. Triadiati; Tjitrosemito, S.; Guhardja, E.; Sudarsono; Qayim, I.; Leuschner, C. Nitrogen resorption and nitrogen use efficiency in cacao agroforestry systems managed differently in Central Sulawesi. HAYATI J. Biosci. 2007, 14, 127–132. [Google Scholar] [CrossRef]
  31. Erwiyono, R.; Prawoto, A.A.; Murdiyati, A. Efisiensi resorpsi hara pada tanaman kakao di dataran rendah pada tanah Aluvial. Pelita Perkeb. 2012, 28, 32–44. [Google Scholar]
  32. Susanto, D.; Hayatudin; Setiawan, A.; Purnomo, H.; Ruhiyat, D.; Amirta, R. Characterizing nutrient status and growth of Macaranga gigantea in tropical rainforest gaps after selective logging in East Kalimantan, Indonesia. Biodiversitas 2017, 18, 996–1003. [Google Scholar] [CrossRef]
  33. Machado, M.R.; Sampaio, P.D.T.B.; Ferraz, J.; Camara, R.; Pereira, M.G. Retranslocação de nutrientes em espécies florestais na Amazônia Brasileira. Acta Sci.-Agron. 2016, 38, 93–101. [Google Scholar] [CrossRef]
  34. van der Colff, D.; Dreyer, L.L.; Valentine, A.; Roets, F. Comparison of nutrient cycling abilities between the invasive Acacia mearnsii and the native Virgilia divaricata trees growing sympatrically in forest margins in South Africa. S. Afr. J. Bot. 2017, 111, 358–364. [Google Scholar] [CrossRef]
  35. O’Brien, P.L.; Thomas, A.L.; Sauer, T.J.; Brauer, D.K. Foliar nutrient concentrations of three economically important tree species in an alley-cropping system. J. Plant Nutr. 2020, 43, 2557–2568. [Google Scholar] [CrossRef]
  36. Koerselman, W.; Meuleman, A.F.M. The vegetation N:P ratio: A new tool to detect the nature of nutrient limitation. J. Appl. Ecol. 1996, 33, 1441–1450. [Google Scholar] [CrossRef]
  37. Zhang, R.; Pan, H.; He, B.; Chen, H.; Zhou, Z. Nitrogen and phosphorus stoichiometry of Schima superba under nitrogen deposition. Sci. Rep. 2018, 8, 13669. [Google Scholar] [CrossRef]
  38. Vergutz, L.; Manzoni, S.; Porporato, A.; Ferreira, N.R.; Jackson, R.B. Global resorption efficiencies and concentrations of carbon and nutrients in leaves of terrestrial plants. Ecol. Monogr. 2012, 82, 205–220. [Google Scholar] [CrossRef]
  39. You, C.; Wu, F.; Yang, W.; Xu, Z.; Tan, B.; Zhang, L.; Yue, K.; Ni, X.; Li, H.; Chang, C.; et al. Does foliar nutrient resorption regulate the coupled relationship between nitrogen and phosphorus in plant leaves in response to nitrogen deposition? Sci. Total Environ. 2018, 645, 733–742. [Google Scholar] [CrossRef]
  40. Hu, R.; Liu, T.; Zhang, Y.; Zheng, R.; Guo, J. Leaf nutrient resorption of two life-form tree species in urban gardens and their response to soil nutrient availability. PeerJ 2023, 11, e15738. [Google Scholar] [CrossRef]
  41. Urbina, I.; Grau, O.; Sardans, J.; Margalef, O.; Peguero, G.; Asensio, D.; LLusià, J.; Ogaya, R.; Gargallo-Garriga, A.; Van Langenhove, L.; et al. High foliar K and P resorption efficiencies in old-growth tropical forests growing on nutrient-poor soils. Ecol. Evol. 2021, 11, 8969–8982. [Google Scholar] [CrossRef]
  42. Violita. Dinamika Nitrogen pada Sistem Transformasi Hutan Alam Menjadi Perkebunan Kelapa Sawit di Sumatera, Indonesia. Ph.D. Thesis, Institut Pertanian Bogor, Bogor, Indonesia, 2015. [Google Scholar]
  43. Yuan, Z.; Shi, X.; Jiao, F.; Han, F. N and P resorption as functions of the needle age class in two conifer trees. J. Plant Ecol. 2018, 11, 780–788. [Google Scholar] [CrossRef]
  44. Jiang, D.; Geng, Q.; Li, Q.; Luo, Y.; Vogel, J.; Shi, Z.; Ruan, H.; Xu, X. Nitrogen and phosphorus resorption in planted forests worldwide. Forests 2019, 10, 201. [Google Scholar] [CrossRef]
  45. Du, E.; Terrer, C.; Pellegrini, A.F.A.; Ahlström, A.; van Lissa, C.J.; Zhao, X.; Xia, N.; Wu, X.; Jackson, R.B. Global patterns of terrestrial nitrogen and phosphorus limitation. Nat. Geosci. 2020, 13, 221–226. [Google Scholar] [CrossRef]
  46. Jiang, J.; Lu, Y.; Chen, B.; Ming, A.; Pang, L. Nutrient resorption and C:N:P stoichiometry responses of a Pinus massoniana plantation to various thinning intensities in Southern China. Forests 2020, 13, 1699. [Google Scholar] [CrossRef]
  47. Tully, K.L.; Wood, T.E.; Schwantes, A.M.; Lawrence, D. Soil nutrient availability and reproductive effort drive patterns in nutrient resorption in Pentaclethra macroloba. Ecology 2013, 94, 930–940. [Google Scholar] [CrossRef]
  48. Wang, M.; Li, G.; Liu, Y. Nursery fertilization affected field performance and nutrient resorption of Populus tomentosa Carr. ploidy levels. iForest 2022, 15, 16–23. [Google Scholar] [CrossRef]
  49. Gerdol, R.; Iacumin, P.; Brancaleoni, L. Differential effects of soil chemistry on the foliar resorption of nitrogen and phosphorus across altitudinal gradients. Funct. Ecol. 2019, 33, 1351–1361. [Google Scholar] [CrossRef]
  50. Killingbeck, K.T. Nutrients in senesced leaves: Keys to the search for potential resorption and resorption proficiency. Ecology 1996, 77, 1716–1727. [Google Scholar] [CrossRef]
  51. Gonzales, K.E.; Yanai, R.D.; Fahey, T.J.; Fisk, M.C. Evidence for P limitation in eight northern hardwood stands: Foliar concentrations and resorption by three tree species in a factorial N by P addition experiment. For. Ecol. Manag. 2023, 529, 120696. [Google Scholar] [CrossRef]
  52. Rejmánková, E. Nutrient resorption in wetland macrophytes: Comparison across several regions of different nutrient status. New Phytol. 2005, 167, 471–482. [Google Scholar] [CrossRef]
  53. Sardans, J.; Peñuelas, J. Potassium control of plant functions: Ecological and agricultural implications. Plants 2021, 10, 419. [Google Scholar] [CrossRef]
  54. Liesche, J. How regulation of phloem transport could link potassium fertilization to increased growth. Tree Physiol. 2015, 36, 1–5. [Google Scholar] [CrossRef]
  55. Shen, Y.; Zhang, F.; Yang, Y.; Lu, G.; Yang, X. Arbuscular mycorrhizal fungi alter plant N and P resorption of dominant species in a degraded grassland of northern China. Ecol. Indic. 2023, 150, 110195. [Google Scholar] [CrossRef]
  56. Hofmann, K.; Heuck, C.; Spohn, M. Phosphorus resorption by young beech trees and soil phosphatase activity as dependent on phosphorus availability. Oecologia 2016, 181, 369–379. [Google Scholar] [CrossRef]
  57. Ji, H.; Wen, J.; Du, B.; Sun, N.; Berg, B.; Liu, C. Comparison of the nutrient resorption stoichiometry of Quercus variabilis Blume growing in two sites contrasting in soil phosphorus content. Ann. For. Sci. 2018, 75, 59. [Google Scholar] [CrossRef]
  58. Munford, K.E.; Casamatta, M.; Basiliko, N.; Glasauer, S.; Mykytczuk, N.C.S.; Watmough, S.A. Paper Birch (Betula papyrifera) Nutrient Resorption Rates on Nutrient-Poor Metal-Contaminated Soils and Mine Tailings. Water Air Soil Pollut. 2021, 232, 33. [Google Scholar] [CrossRef]
  59. Tawaraya, K.; Takaya, Y.; Turjaman, M.; Tuah, S.J.; Limin, S.H.; Tamai, Y.; Cha, J.Y.; Wagatsuma, T.; Osaki, M. Arbuscular mycorrhizal colonization of tree species grown in peat swamp forests of Central Kalimantan, Indonesia. For. Ecol. Manag. 2003, 182, 381–386. [Google Scholar] [CrossRef]
  60. Brant, A.N.; Chen, H.Y.H. Patterns and Mechanisms of nutrient resorption in llants. Crit. Rev. Plant Sci. 2015, 34, 471–486. [Google Scholar] [CrossRef]
  61. Veneklaas, E.J. Phosphorus resorption and tissue longevity of roots and leaves—Importance for phosphorus use efficiency and ecosystem phosphorus cycles. Plant Soil 2022, 476, 627–637. [Google Scholar] [CrossRef]
  62. Deng, J.; Wang, S.; Ren, C.; Zhang, W.; Zhao, F.; Li, X.; Zhang, D.; Han, X.; Yang, G. Nitrogen and phosphorus resorption in relation to nutrition limitation along the chronosequence of black locust (Robinia pseudoacacia L.) plantation. Forests 2019, 10, 261. [Google Scholar] [CrossRef]
  63. Guo, Q.; Li, H.; Sun, X.; An, Z.; Ding, G. Patterns of Needle Nutrient Resorption and Ecological Stoichiometry Homeostasis along a Chronosequence of Pinus massoniana Plantations. Forests 2023, 14, 607. [Google Scholar] [CrossRef]
Figure 1. (a) Content of N in mature and senesced leaves. (b) Content of P in mature and senesced leaves. (c) Content of K in mature and senesced leaves. (d) N/P ratios in mature and senesced leaves. (e) N/K ratios in mature and senesced leaves. (f) K/P ratios in mature and senesced leaves. Post hoc comparisons revealed statistically significant differences (p < 0.05) between treatments, as denoted by distinct alphabetical groupings above the columns. Uppercase letters indicate significant differences among mature samples; lowercase letters indicate distinguished senesced treatments.
Land 13 01169 g001
Figure 2. Resorption efficiency of N (NRE), P (PRE) and K (KRE) in studied species. Post hoc comparisons revealed statistically significant differences (p < 0.05) between treatments, as denoted by distinct alphabetical groupings above the columns.
Land 13 01169 g002
Table 1. Growth traits of all studied species at 3.5 and 4.5 years old [9].
SpeciesHeight
(cm)
Root Collar Diameter
(cm)
Diameter at Breast Height (cm)
3.5 Years4.5 Years3.5 Years4.5 Years3.5 Years4.5 Years
Mahang8.9 ± 0.611.5 ± 0.511.6 ± 0.713.5 ± 1.29.9 ± 0.512.1 ± 1.3
Geronggang7.7 ± 0.210.0 ± 0.510.2 ± 0.311.7 ± 0.38.4 ± 0.410.2 ± 0.3
Skubung5.9 ± 1.47.5 ± 1.29.9 ± 1.512.0 ± 1.07.5 ± 1.09.5 ± 0.4
Krassikarpa18.0 ± 1.518.9 ± 1.021.9 ± 2.527.1 ± 2.618.3 ± 1.423.0 ± 2.3
Table 2. Properties of soil under studied tree species.
VariablesMahangGeronggangSkubungKrassikarpa
pH H2O ns3.2 ± 0.00
(extremely acid)
3.2 ± 0.00
(extremely acid)
3.1 ± 0.06
(extremely acid)
3.2 ± 0.06
(extremely acid)
C (%) ns43.1 ± 2.02
(very high)
43.6 ± 1.27
(very high)
42.6 ± 0.72
(very high)
42.4 ± 1.93
(very high)
Total N (%) ns1.3 ± 0.19
(very high)
1.3 ± 0.03
(very high)
1.4 ± 0.08
(very high)
1.4 ± 0.16
(very high)
C/N ns34.9 ± 6.79
(very high)
34.0 ± 1.29
(very high)
30.3 ± 1.32
(very high)
31.2 ± 4.85
(very high)
Available P (ppm)106.2 ± 17.03 b
(very high)
89. 7 ± 13.5 b
(very high)
65.8 ± 15.68 a
(very high)
91.4 ± 25.61 b
(very high)
Available Ca (me/100 g) ns10.2 ± 4.8
(high)
12.8 ± 4.06
(high)
9.1 ± 2.70
(moderate)
10.1 ± 5.43
(high)
Available Mg (me/100 g)2.0 ± 0.12 b
(moderate)
2.7 ± 0.62 a
(high)
1.6 ± 0.30 b
(moderate)
2.8 ± 0.71 a
(high)
Available K (me/100 g) ns 0.48 ± 0.19
(moderate)
0.46 ± 0.143
(moderate)
0.29 ± 0.07
(low)
0.38 ± 0.051
(moderate)
Available Na (me/100 g) ns0.003 ± 0.006
(very low)
0.02 ± 0.02
(very low)
0.01 ± 0.005
(very low)
0.02 ± 0.006
(very low)
CEC (me/100 g) ns143.3 ± 5.03
(extremely high)
142. 7 ± 11.67
(extremely high)
135.7 ± 6.45
(extremely high)
153 ± 14.18
(extremely high)
Base saturation (%) ns8.9 ± 3.69
(extremely low)
11.4 ± 3.56
(extremely low)
8.1 ± 2.02
(extremely low)
9.0 ± 4.96
(extremely low)
Available Fe (ppm) ns39.5 ± 2.00
(extremely high)
39.9 ± 2.00
(extremely high)
38.7 ± 2.75
(extremely high)
40.3 ± 2.16
(extremely high)
ns—nonsignificant (p > 0.05); each value is given as a mean followed by standard deviation; categorization in parentheses refers to [23]. Post hoc comparisons revealed statistically significant differences (p < 0.05) between treatments, as denoted by distinct alphabetical groupings in similar rows.
Table 3. Correlations between REs and nutrients in soil, mature leaves, and senesced leaves.
NREPREKRE
N Soil−0.0240.185−0.109
P Soil−0.0020.101−0.399
K soil0.281−0.372−0.163
N mature leaves0.70 ***0.340.46
P mature leaves−0.020.54−0.32
Ratio of N mature leaves/Pmature laeaves0.38−0.30.44
K mature leaves0.070.74 ***0.63 ***
N senesced leaves−0.40.220.13
P senesced leaves−0.13−0.81 ***−0.55
K senesced leaves−0.480.07−0.56
NRE—nitrogen resorption efficiency; PRE—phosphorus resorption efficiency; KRE—potassium resorption efficiency, *** close and significant correlation (r > 0.5 and p < 0.05).
Table 4. Correlations between nutrient content in mature leaves and growth.
dBHh3.5dBH4.5h3.5h4.5
Nm0.07−0.160.13−0.03
Pm0.080.070.0090.045
Km0.72 ***0.73 ***0.410.74 ***
Nm/Pm−0.02−0.430.10−0.01
*** strong and significant correlation (r > 0.5 and p < 0.05); dBH3.5 and dBH4.5—diameter at breast height at 3.5 and 4.5 years old, respectively; h3.5 and h4.5—height at 3.5 and 4.5 years old, respectively.
Table 5. Correlation between nutrient resorption and growth.
h3.5dBH3.5h4.5dBH4.5
NRE0.320.340.140.10
PRE0.73 ***0.78 ***0.73 ***0.77 ***
KRE0.520.470.460.49
NRP0.0010.04−0.050.05
PRP0.89 ***0.89 ***0.90 ***0.89 ***
KRP−0.13−0.11−0.08−0.12
NRP/PRP0.92 ***0.93 ***0.90 ***0.93 ***
*** strong and significant correlation (r > 0.5 and p < 0.05); dBHh3.5 and dBH4.5—diameter at breast height at 3.5 and 4.5 years old, respectively; h3.5 and h4.5—height at 3.5 and 4.5 years old, respectively.
Disclaimer/Publisher’s Note: The statements, opinions and data contained in all publications are solely those of the individual author(s) and contributor(s) and not of MDPI and/or the editor(s). MDPI and/or the editor(s) disclaim responsibility for any injury to people or property resulting from any ideas, methods, instructions or products referred to in the content.

