Article

The Ecological Environmental Effects and Topographic Gradient Analysis of Transformation in the Production–Living–Ecological Spaces in the Northern Slope of the Tianshan Mountains

1
School of Public Policy & Management, China University of Mining and Technology, Xuzhou 221116, China
2
School of Environment and Spatial Informatics, China University of Mining and Technology, Xuzhou 221116, China
*
Author to whom correspondence should be addressed.
Land 2024, 13(8), 1170; https://doi.org/10.3390/land13081170
Submission received: 8 July 2024 / Revised: 20 July 2024 / Accepted: 21 July 2024 / Published: 30 July 2024

Abstract

:
Taking the northern slope of the Tianshan Mountains (NSTM) in Xinjiang as the research area, this study analyzes the changes in the Production–Living–Ecological (P-L-E) Spaces and their Ecological Environmental Effects, providing a basis for optimizing the spatial pattern of the P-L-E Spaces and regional ecological environment protection in this area. Based on land use data and DEM data, various methods were used for analysis. These methods include the land use transfer matrix, ecological environment quality index, hot spot analysis, ecological contribution rate, and Terrain Position Index. The analysis focused on changes in the spatial pattern of the P-L-E Spaces from 1980 to 2020. It also examined the spatiotemporal distribution of ecological environment quality (EEQ). Furthermore, it explored the differentiation characteristics of EEQ in terrain gradients. The conclusions are as follows: (1) On the NSTM, Ecological Space decreased while Production and Living Space expanded. From 1980 to 2020, Agricultural Production Space increased rapidly. Industrial Production Space also saw rapid growth during this period. Urban Living Space expanded significantly from 1980 to 2020. Rural Living Space experienced steady growth over the same period. Forest Ecological Space initially increased but later decreased. Water Ecological Space showed an initial increase followed by a decrease from 1980 to 2020. (2) The EEQ first remained stable, declined slightly from 2000 to 2010, improved significantly, and then deteriorated from 2010 to 2020. The distribution of EEQ exhibits a “high in the northwest, low in the southeast” pattern. EEQ hot spots on the NSTM are concentrated in the Tianshan Mountains, with clustering increasing in both northern and southern areas. Cold spots are found in the southern, eastern, and northern NSTMs, with aggregation strengthening in the south and north and slightly weakening in the east. Hot spots of EEQ changes on the NSTM show stable distribution, with stronger aggregation from 2000 to 2020. However, aggregation of cold spots has gradually weakened, yet noticeable aggregation persists throughout the study period. (3) There is a significant gradient difference in EEQ distribution. Higher terrain gradients have a higher EEQ. From 1980 to 2020, lower terrain gradients saw improvement, while higher gradients experienced deterioration. The EEQ on the NSTM has declined, showing significant spatial differences, with better quality on the northern side than the southern side. Future efforts should focus on restoring the environment at lower gradients, mitigating deterioration at higher gradients, and enhancing water conservation in the Tianshan Mountains.

1. Introduction

The 20th National Congress proposed that China’s urban construction has transitioned from a simple era of urban competition to an era of regional coordinated development. Building a regional economic layout and land spatial system with complementary advantages and high-quality development has become a key objective of the current stage of development. With the rapid acceleration of China’s urbanization, the demand for space for production and living activities is sharply increasing [1]. However, this demand has led to a series of problems. These problems include worsening environmental pollution. They also involve significant degradation of ecosystem functions. Additionally, there are inadequate living space facilities. Furthermore, the loss of urban vitality is another consequence of these issues. These problems not only affect the quality of people’s living environment but also pose a serious threat to regional sustainable development [2]. The concept of Production–Living–Ecological Spaces is proposed domestically for the development and optimization of the national territory. The 20th National Congress proposed to promote the construction of a beautiful China and accelerate the green transformation of development mode. These proposals further highlight the importance of research on the land use of the P-L-E Spaces. Specifically, research on Ecological Space is emphasized. Studying the intrinsic operating mechanism of the P-L-E Spaces is important. Optimizing the land layout of the P-L-E Spaces is crucial. Coordinating the development of the P-L-E Spaces is essential. These efforts have great theoretical and practical significance. They promote the construction of China’s ecological civilization [3].
After the concept of the P-L-E Spaces was proposed, scholars’ research on the P-L-E Spaces gradually increased. On the one hand, some research focused on the changes within the P-L-E Spaces themselves, including the identification of P-L-E Spaces areas [4], functional assessment [5,6], spatial differentiation patterns [7,8,9], scenario simulations [10,11], transformation driving factors [12,13,14], and pattern optimization [15]. On the other hand, some studies have shown that land use transformation can lead to a series of ecological environmental problems [16]. One of the main manifestations of land use transformation is the change in the functions of the P-L-E Spaces [17,18]. The impact of land use transformation in P-L-E Spaces on the ecological environment is multifaceted, including landscape patterns [19], ecological environmental quality [20], ecosystem service value [21], and so on. Existing research perspectives mostly focus on basins [22,23], urban agglomerations [24,25], specific regions [26,27,28], etc., using methods such as the ecological environmental quality index [29], landscape pattern index [30], and the remote sensing ecological index [31] to characterize the ecological environment condition; using methods such as the land use transfer matrix [32] and the ecological contribution rate [33] to analyze the spatiotemporal differentiation patterns of the ecological environment; using spatial econometric models [34,35] to explore the driving mechanisms of ecological environmental changes.
The NSTM is the region with the highest population and urban density, as well as the most developed social economy, in Xinjiang. However, there are large areas of unused land without vegetation cover in this region, with a sparse distribution of water bodies. The limited availability of usable soil and water resources, along with prominent issues such as land desertification and soil salinization, exacerbate the environmental challenges. The rapid development of urban economies and industries, coupled with accelerated urbanization, has further deteriorated the already fragile local ecological environment, seriously impeding sustainable development. In regions with complex terrains, terrain gradient is a crucial factor that influences land use patterns and the quality of the ecological environment [36]. Existing research mostly analyzes topographic factors as influencing elements, while discussions on the distribution patterns of land use and ecological environment quality along topographic gradients are relatively scarce. Therefore, studying the land use changes in the P-L-E Spaces of the NSTM, analyzing the impact of land use transformation on the ecological environment, and exploring the distribution of Ecological Environment Quality (EEQ) along topographic gradients aim to provide references for optimizing the spatial pattern of the P-L-E Spaces and protecting the ecological environment on the NSTM. This research endeavor seeks to promote sustainable development and ecological civilization construction in the region.

2. Materials and Methods

2.1. Study Area

The NSTM is located in the Xinjiang Uygur Autonomous Region of China (75°31′ to 91°54′ E, 39°34′ to 46°12′ N) in the transition area between the northern foot of the Tianshan Mountains and the Junggar Basin. A map of the administrative divisions of the Xinjiang Uygur Autonomous Region of China is displayed in Figure 1. Backed by the Tianshan Mountains, this region features a temperate continental semi-arid climate with low annual precipitation and significant seasonal variations. The terrain of the NSTM is generally higher in the south and lower in the north. The Tianshan Mountains span the entire Xinjiang region, crossing the following nine subordinate regions: Kashgar, Aksu, Ili Kazakh Autonomous Prefecture, Bortala Mongol Autonomous Prefecture, Bayingolin, Changji, Urumqi, Turpan, and Hami. The Tianshan Mountains form the natural geographical boundary between the Junggar Basin and the Tarim Basin and are a distinctive feature of Xinjiang’s geography. The NSTM is the most economically developed region in Xinjiang, focusing on agriculture, animal husbandry, and the development of energy resources such as petroleum and coal, holding significant influence across Xinjiang. The urbanization level in the northern slope region reaches 86.98%, making it a highly productive area. This region boasts the most advanced modern industries, agriculture, transportation, information technology, education, and science and technology in Xinjiang. It houses 83% of Xinjiang’s heavy industry and 62% of its light industry, contributing over 40% of the region’s GDP annually. With excellent infrastructure in terms of urban areas, transportation, and energy, it plays a crucial role in driving, influencing, and setting examples for the economic development of Xinjiang.

2.2. Data Source

The land use data for the NSTM are land cover datasets for the years 1980, 2000, and 2020 obtained from the Data Center for Resources and Environmental Sciences, Chinese Academy of Sciences (http://www.resdc.cn/ accessed on 23 December 2023). This dataset includes six primary types and twenty-three secondary types, and it features a spatial resolution of 1 km. The DEM (Digital Elevation Model) data for the northern slope of the Tianshan Mountains are obtained from the ASTGTM2 DEM dataset (https://earthexplorer.usgs.gov/ accessed on 6 March 2024) and feature a spatial resolution of 30 m. The slope data for the NSTM are calculated from this dataset. Based on this land use classification standard, and referring to existing research findings [37], a classification system for the P-L-E Spaces of the NSTM was established. Using the ecological environmental quality index of the secondary land classes in the existing land use classification system as the basis, the ecological environmental quality index of the secondary land use classes in the P-L-E Spaces classification system was assigned using the area-weighted method (Table 1).

2.3. Methodology

2.3.1. Land Use Transfer Matrix

The NSTM is a developed region located in Xinjiang. It experiences a continuously strengthened internal agglomeration effect. The region benefits from the advantages of an outward-oriented economy. These factors together have promoted rapid urbanization. They have also caused significant changes in the land use pattern. Therefore, the use of the Land Use Transfer Matrix can quantitatively describe the current status, transfer relationships, and evolution characteristics of the land use in the P-L-E Spaces of the NSTM. It can accurately describe the transfer structure and direction of land use in the P-L-E Spaces of the NSTM [23]. The formula is as follows:
S = S ij = S 11 S 12 S 13 S 14 S 21 S 22 S 23 S 24 S n 1 S n 2 S n 3 S n 4
where S represents the total area of the P-L-E Spaces on the NSTM; n represents the number of P-L-E Spaces land types on the NSTMs; i and j represent different periods of study for P-L-E Spaces land types.

2.3.2. EEQ Index

The EEQ Index is quantitatively characterized by comprehensively considering the EEQ of various land use types in the region and their area proportions. This index can be used to describe the EEQ of a certain area. A 2 km × 2 km grid cell was established, generating a total of 143,590 grid cells. The 2 km × 2 km grid cell contains 4 grids from the land use data, which ensures a rich variety of land use types in the region and avoids the problem of large grids and discrepancies between research results and actual situations. Therefore, connecting the land use data for the years 1980, 2000, and 2020 with the grid data allows for the quantitative characterization of the EEQ on the NSTM, reflecting its spatial distribution and spatiotemporal changes [20]. The formula is as follows:
E V t = i = 1 n C i × L U k i / T A
where EVt represents the EEQ Index for the NSTM during the i-th time period; Ci represents the EEQ Index for the i-th land use type in the P-L-E Spaces classification system of the NSTM; n represents the total number of land use types in the P-L-E Spaces classification system; LUki represents the area of the i-th land use type during the t-th time period, k represents the k-th grid cell; TA represents the total area of the NSTM.

2.3.3. Hot Spot Analysis (Getis-Ord G* Statistics)

The hot spot analysis tool can calculate Getis-Ord Gi* Statistics for each element in the dataset. As these elements are being influenced by certain spatial process factors and have spatial correlations, this method is used to identify spatial clustering of high values (hot spot) and low values (cold spot) with statistical significance. It is useful to identify the spatial clustering of high-value or low-value EEQ in order to investigate the EEQ and the high and low aggregation areas based the degree of change [38]. The formula for the local G index is as follows:
G i * = j = 1 n x j W i j x ¯ j = 1 n W i j n j = 1 n W i j 2 ( j = 1 n W i j ) 2 × n 1
where G i * represents the statistics of the local G in grid cells i; n represents the total number of grid cells on the NSTM; xj represents the value of EEQ in grid cells j; Wij represents the spatial weight matrix.

2.3.4. Ecological Contribution Rate

The Ecological Contribution Rate of P-L-E Spaces land transformation refers to the degree of impact of changes in regard to a certain type of P-L-E Space land use on the regional EEQ. It is used to measure the impact of mutual conversion between P-L-E spatial land use types on EEQ. This indicator is determined by calculating the change in the EEQ Index of different P-L-E Space land-use types, reflecting the contribution of different transformations of P-L-E Spaces to EEQ. Studying the contribution rate of changes in EEQ on the NSTM caused by the transformation of the P-L-E Spaces classification system can intuitively describe the improvement or deterioration of the EEQ [29]. The formula is as follows:
L E I = ( L E t + 1 L E t ) L A / T A
where LEI represents the EEQ Index of a specific P-L-E Space land-use type; LEt represents the EEQ Index of a specific P-L-E Space land-use type at time t; LEt+1 represents the EEQ Index of the same land-use type at time t + 1; LA represents the area of change for the specific P-L-E Spaces land-use type; TA represents the total area of the NSTM.

2.3.5. Terrain Gradient Classification

Terrain factors influence the distribution of P-L-E Spaces. A single terrain factor cannot comprehensively represent the terrain characteristics of an area. However, the Terrain Position Index (T value) can comprehensively describe the terrain conditions of a point by considering both elevation and slope factors [25]. A larger Terrain Position Index indicates both high elevation and steep slope, while a smaller index indicates low elevation and gentle slope. A moderate Terrain Position Index indicates that either the elevation or slope is large while the other is small. The formula for calculating the Terrain Position Index is as follows:
T = lg [ ( E E ¯ + 1 ) × ( S S ¯ + 1 ) ]
where T represents the Terrain Position Index; E represents the elevation of a specific location in the study area; S represents the slope of a specific location in the study area; E ¯ and S ¯ , respectively, represent the average elevation and average slope of the study area.
The EEQ’s Terrain Distribution Index can reflect the influence of terrain conditions on the spatial distribution of EEQ. Its value represents the frequency of occurrence of EEQ at different terrain position levels [39]. The formula is as follows:
P = ( S ie / S i ) / ( S e / S )
where P represents the Terrain Distribution Index; Sie represents the area of the i-th level of the EEQ’s zone under the e-th terrain gradient; Si represents the total area of the i-th level of the EEQ’s zone in the study area; Se represents the total area of the e-th terrain gradient; S represents the total area of the study area.

3. Results

3.1. P-L-E Spaces Transformation

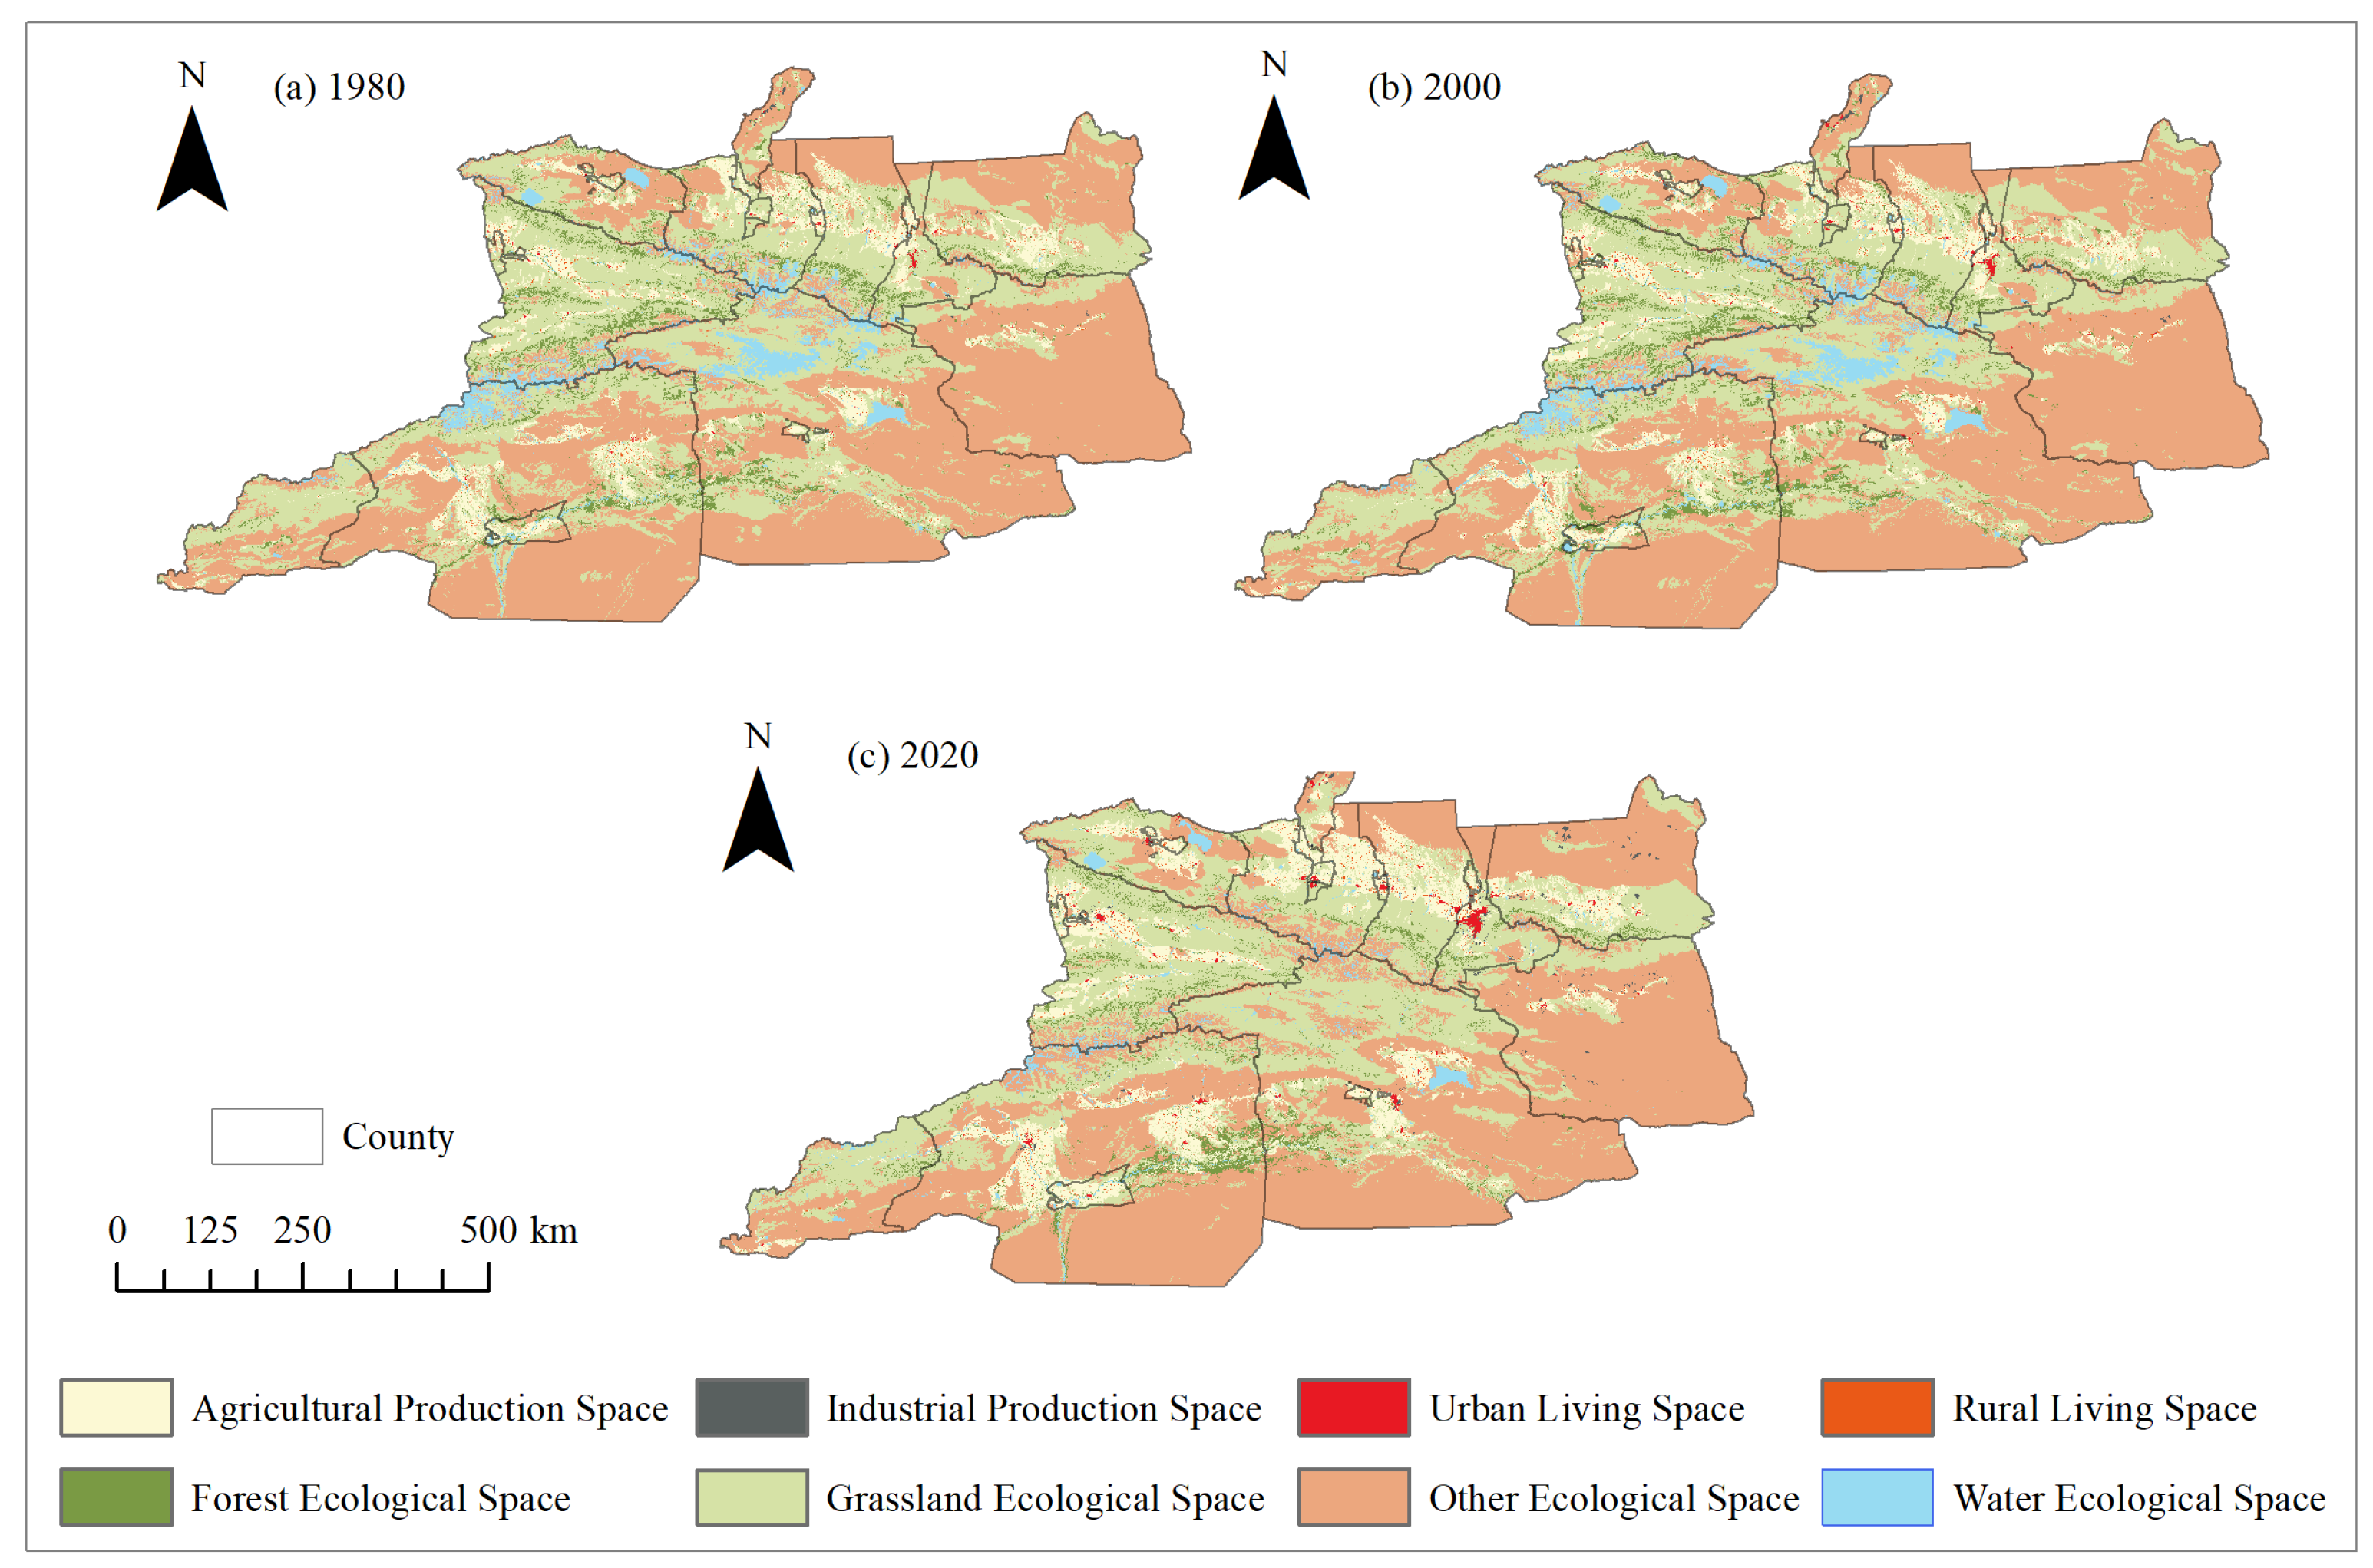
3.1.1. Spatiotemporal Pattern of P-L-E Spaces Change

Based on the P-L-E Spaces classification system, the temporal evolution and spatial distribution characteristics of P-L-E Spaces on the NSTM are obtained (Figure 2, Table 2). The NETM is mainly composed of Ecological Space, which is widely distributed and accounts for over 85% of the total area. However, the area of Ecological Space shows a decreasing trend, with a total decrease of 25,163 km2 occurring during the study period. Production Space is distributed on both sides of the Tianshan Mountains, while Living Space is distributed in densely populated areas in subordinate regions. Both Production Space and living space show a trend of continuous expansion during the study period, with an increase in area of 23,083 km2 and 2145 km2, respectively.
From the spatial distribution of land use at the secondary level, Grassland Ecological Space and Other Ecological Space have the largest area and widest distribution. Grassland Ecological Space is distributed along the Tianshan Mountains. It is mainly found in the Ili Kazakh Autonomous Prefecture, Changji, and Urumqi on the north side of the Tianshan Mountains. Additionally, there is a distribution of Grassland Ecological Space in the northern parts of the Kizilsu Kirghiz Autonomous Prefecture and Bayingolin. The large area of Other Ecological Space is due to the extensive distribution of deserts, sand dunes, and bare land in Turpan, the southeastern part of Bayingolin, the southern part of Aksu, and the northern part of Changji. The Water Ecological Space mainly includes Bosten Lake, Ebinur Lake, Sayram Lake, as well as the abundant glacier water storage in the Tianshan Mountains. Forest Ecological Space is more concentrated at the junction of Aksu and Bayingolin, while, in other areas, it is mainly distributed in a strip-like pattern.
From the changes at the secondary level, during the period from 1980 to 2020, Agricultural Production Space, Industrial Production Space, and Urban Living Space continued to grow rapidly, increasing by 21,596 km2, 1487 km2, and 1424 km2, respectively. Among them, the changes in Industrial Production Space and Urban Living Space were the most drastic. Rural Living Space showed steady growth, with an increase in area of 721 km2. The area of Forest Ecological Space initially decreased, then increased over time. The area of Water Ecological Space also decreased. It decreased significantly by a total of 10,925 km2. This amount is less than 50% of the initial study period. The Grassland Ecological Space continued to decrease, although the change was relatively small, with rates of −3.47% and −4.22% over the two periods; however, due to the large base area of Grassland Ecological Space, the total decrease was 15,639 km2. The area of Other Ecological Space showed slow growth.

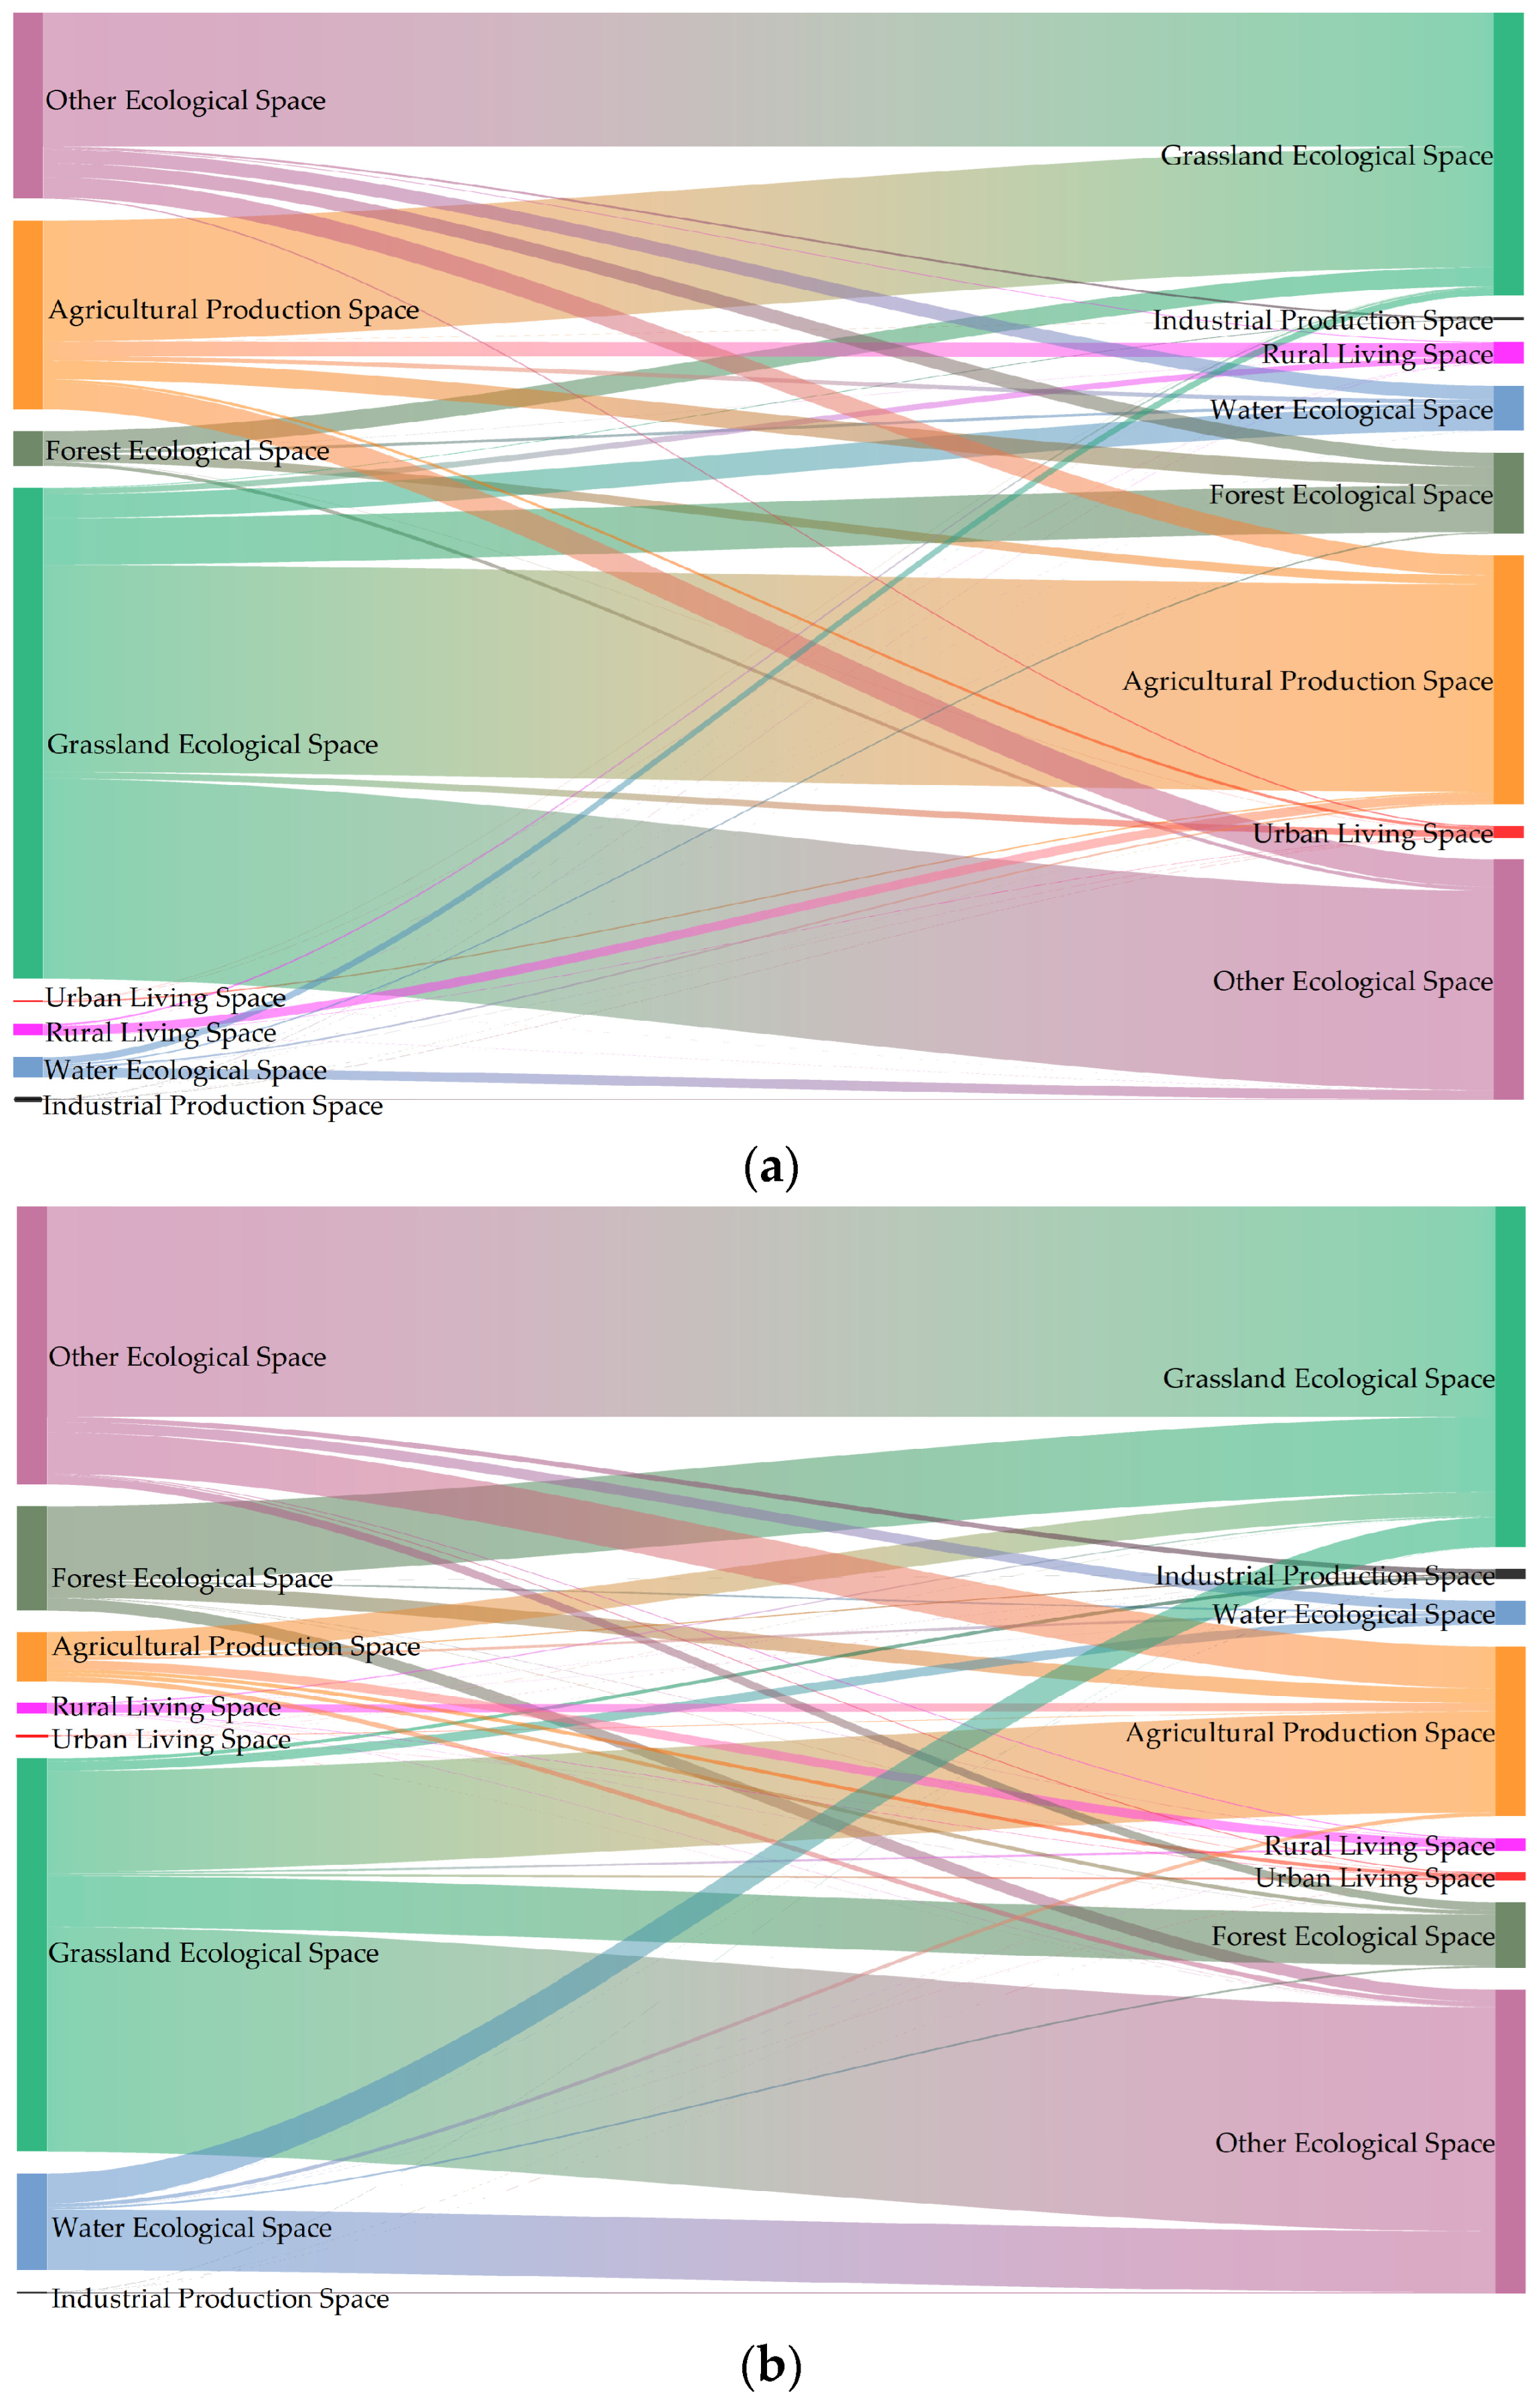
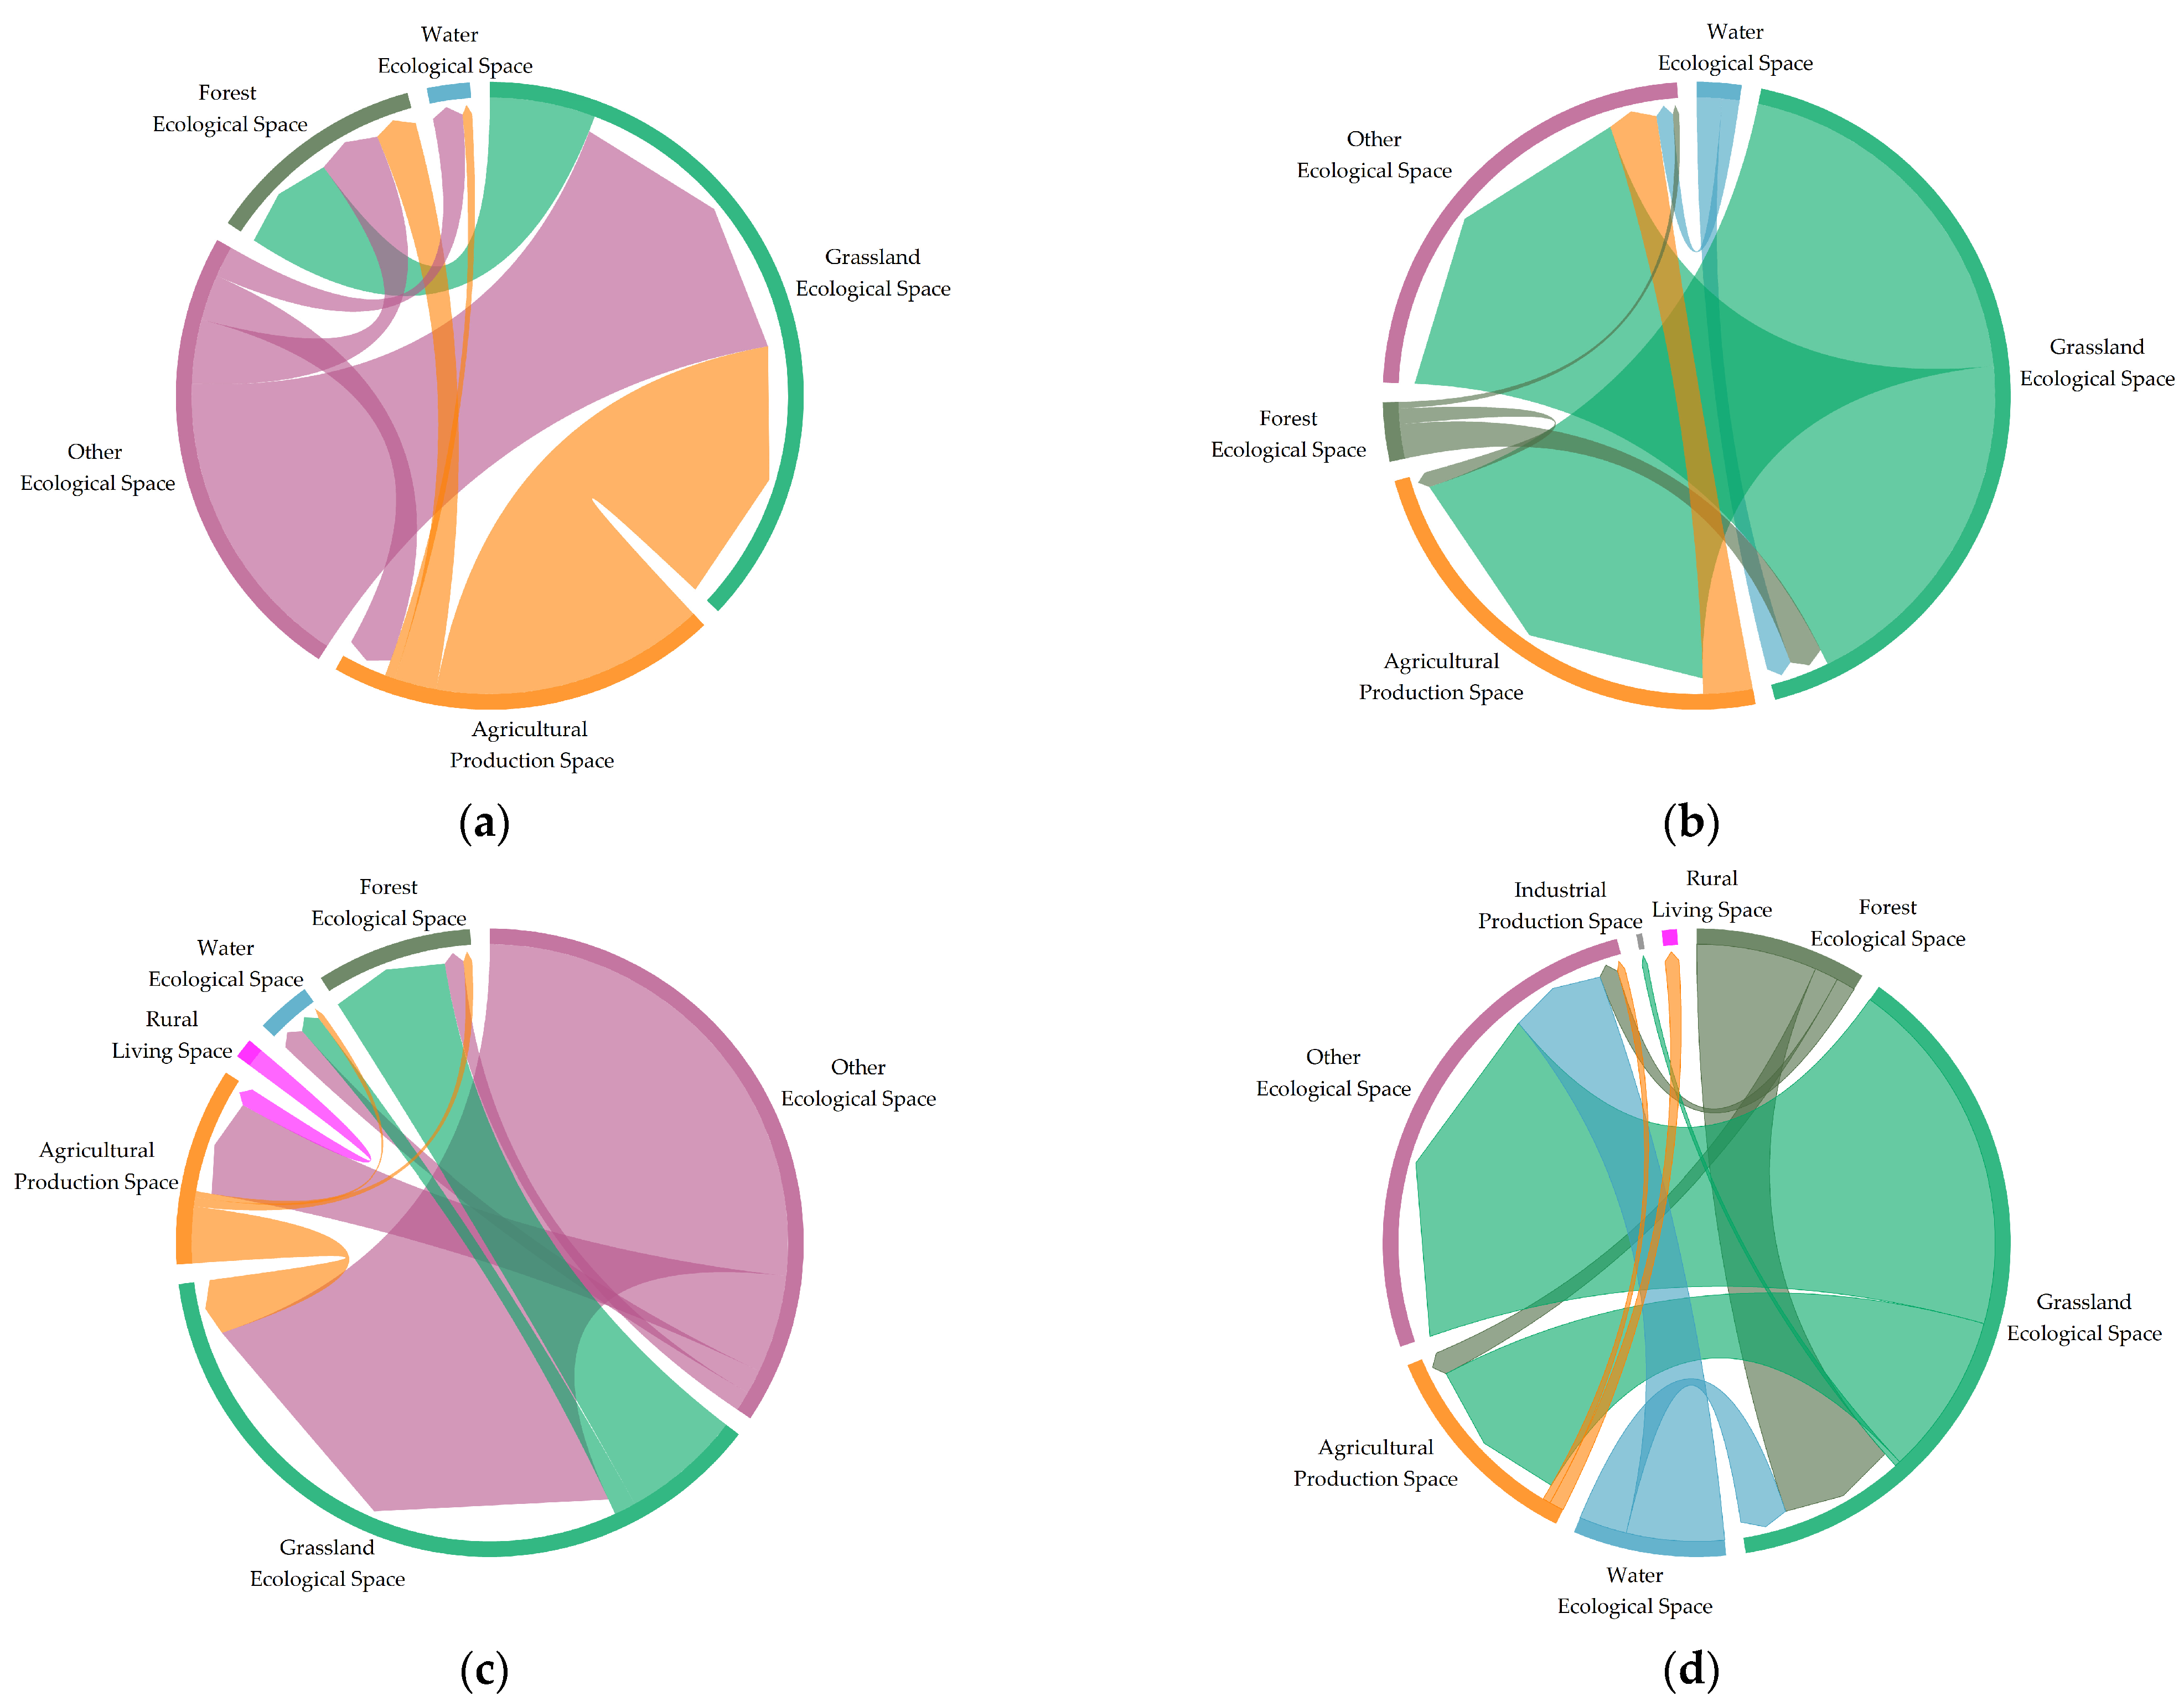
3.1.2. Transformation Patterns of P-L-E Spaces

A land-use transfer matrix was constructed for the P-L-E Space on the NSTM (Figure 3). The results indicate that, from 1980 to 2000, A large amount of Grassland Ecological Space was converted into Agricultural Production Space or degraded into Other Ecological Space. The increase in Urban Living Space was mainly at the expense of Grassland Ecological Space. The Industrial Production Space mainly transformed from Other Ecological Space.
From 2000 to 2020, the NSTM embraced development opportunities. The Grassland Ecological Space and Agricultural Production Space were converted into Urban Living Space and Industrial Production Space. The Agricultural Production Space was mainly derived from Grassland Ecological Space. The area of the Water Ecological Space significantly decreased, with most of it being transformed into Other Ecological Space, while the Forest Ecological Space was extensively converted into Grassland Ecological Space.
During the entire period (1980–2020), the early urban-rural development of NSTM occupied a large amount of Grassland.. Meanwhile, the NSTM made significant contributions to economic development and ecological protection, and the area of Water Ecological Space increased. As time goes on, the industrialization and urbanization processes on the NSTM have accelerated, with a noticeable expansion of production space and a significant improvement in urbanization levels. Due to extensive land occupation for regional development, various measures have been taken on the NSTM to compensate for the occupied grasslands, including conversion from forest land and the extensive reclamation of bare land. However, during the process of development and ecological restoration, many water body have been disturbed, coupled with the effects of arid climate, leading to water bodies drying up and a reduction in aquatic areas.

3.2. Spatiotemporal Variation Characteristics of EEQ

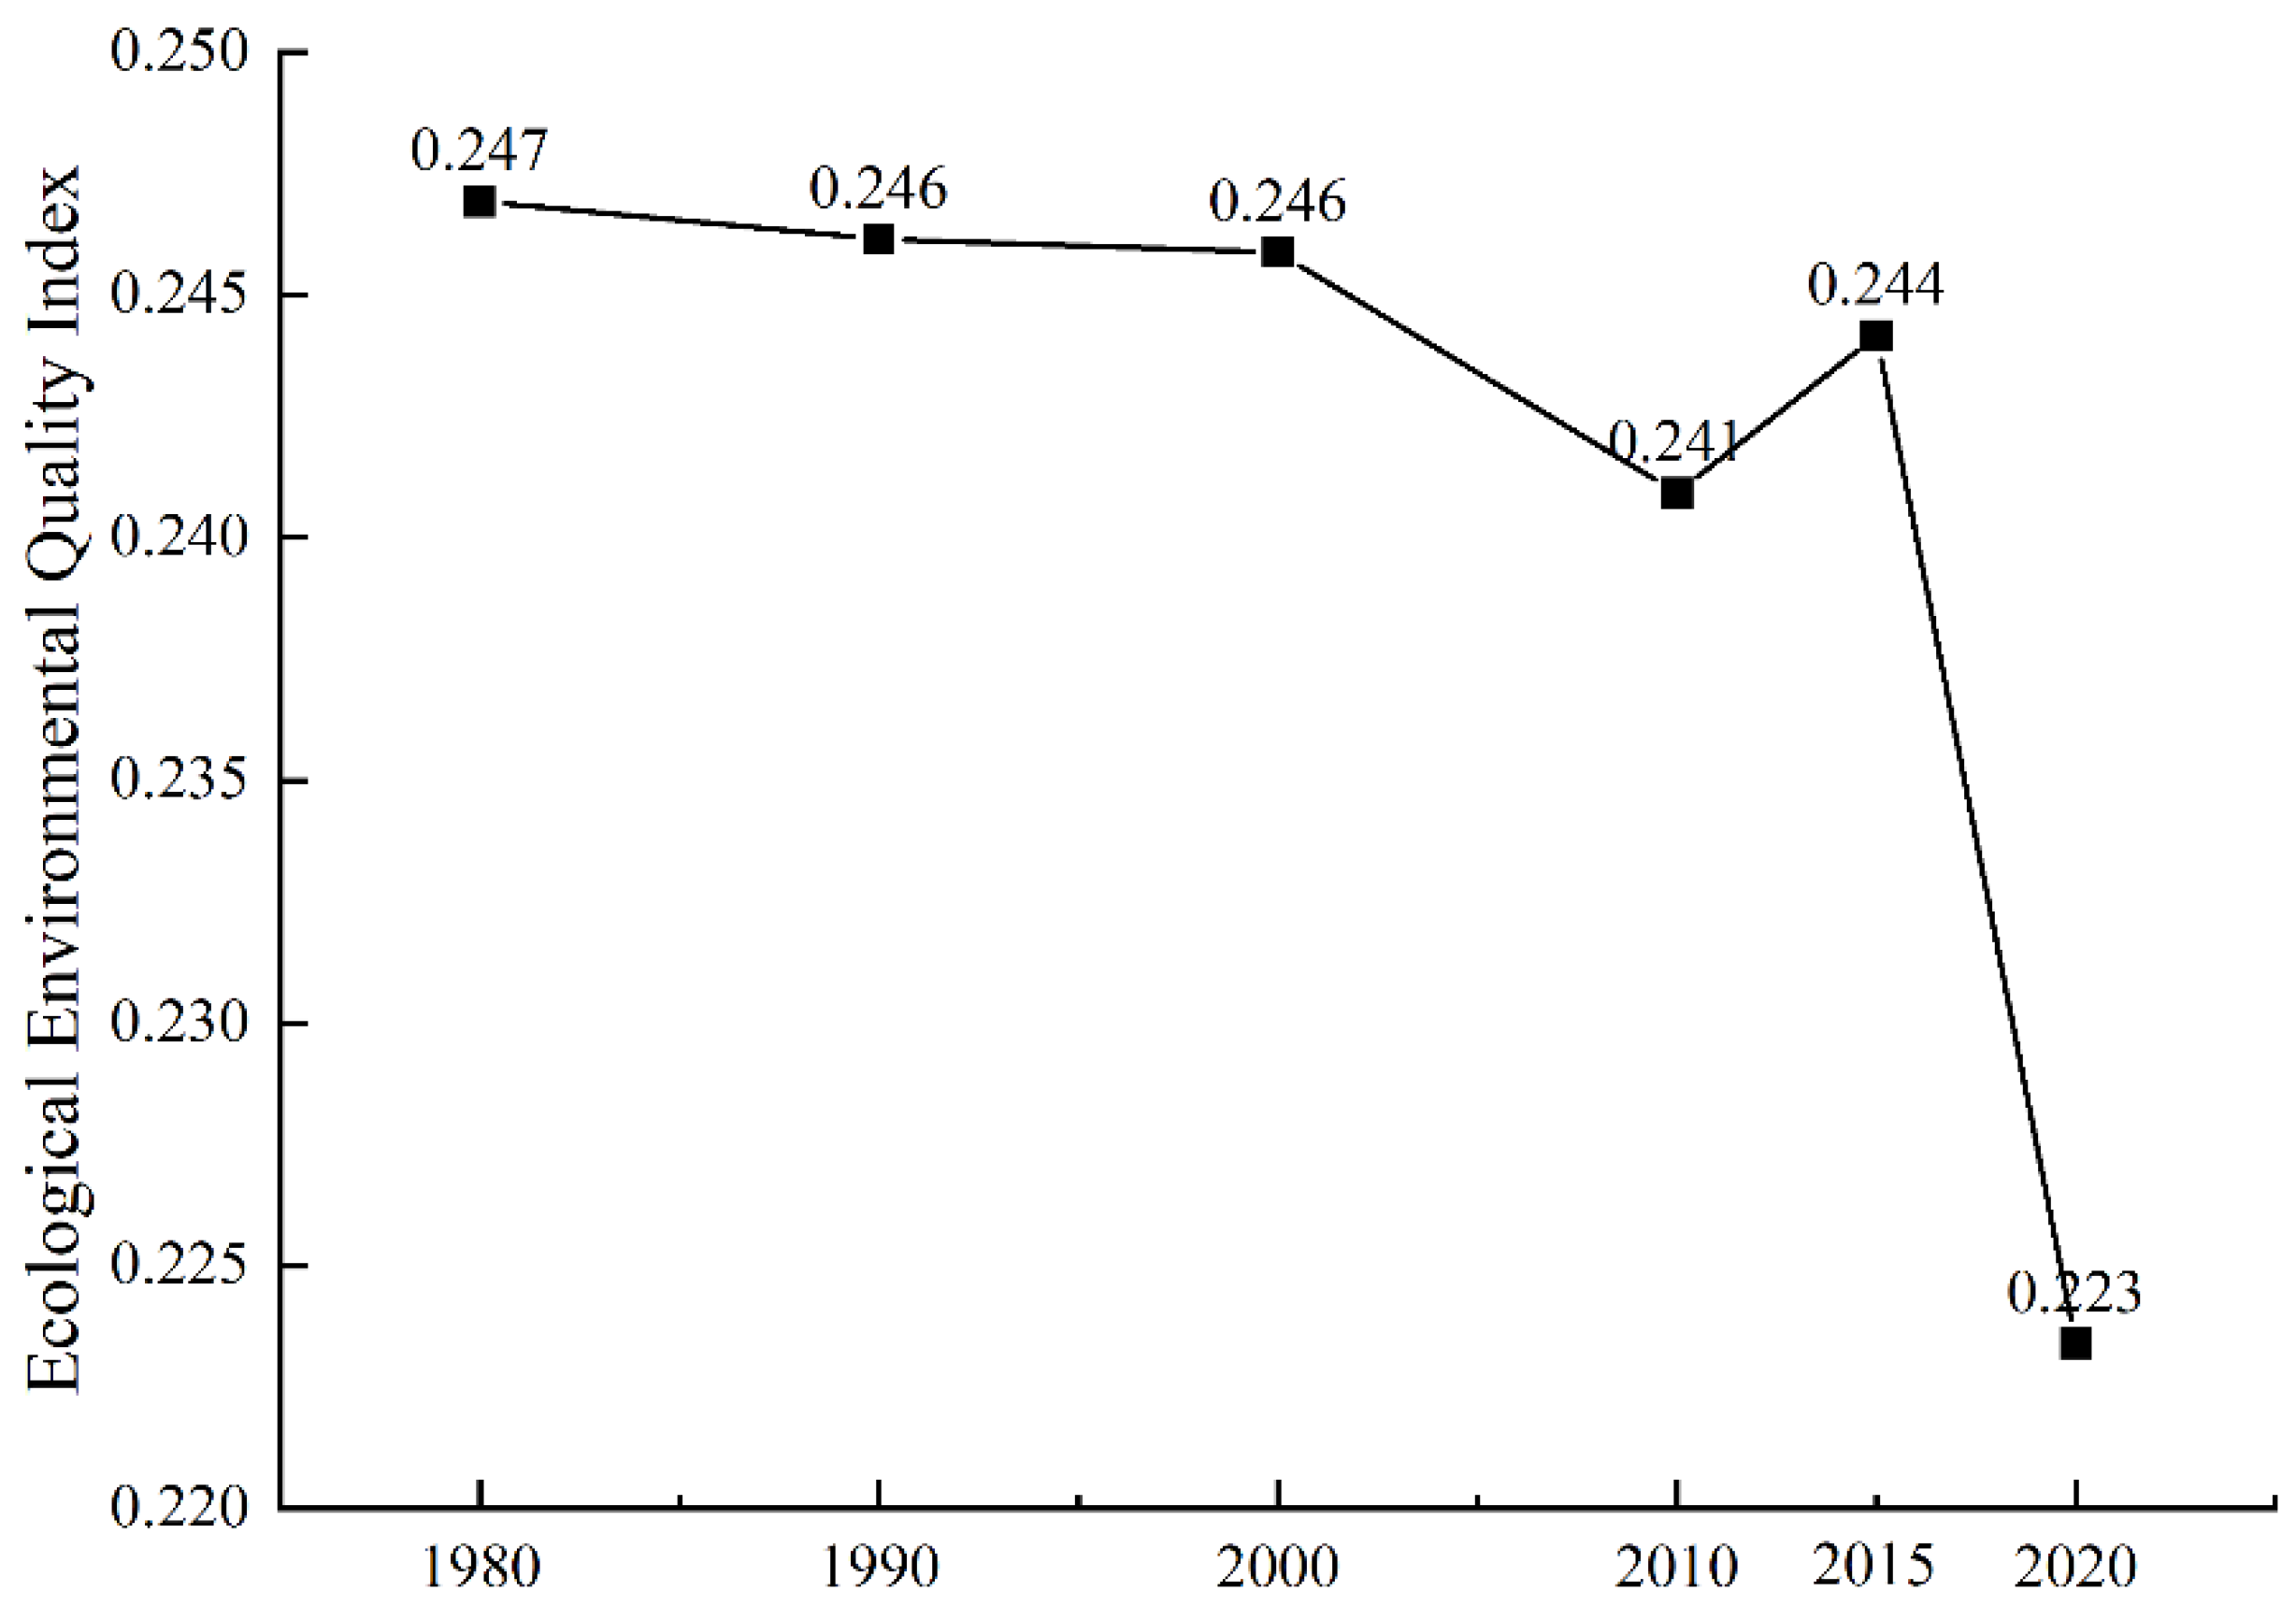
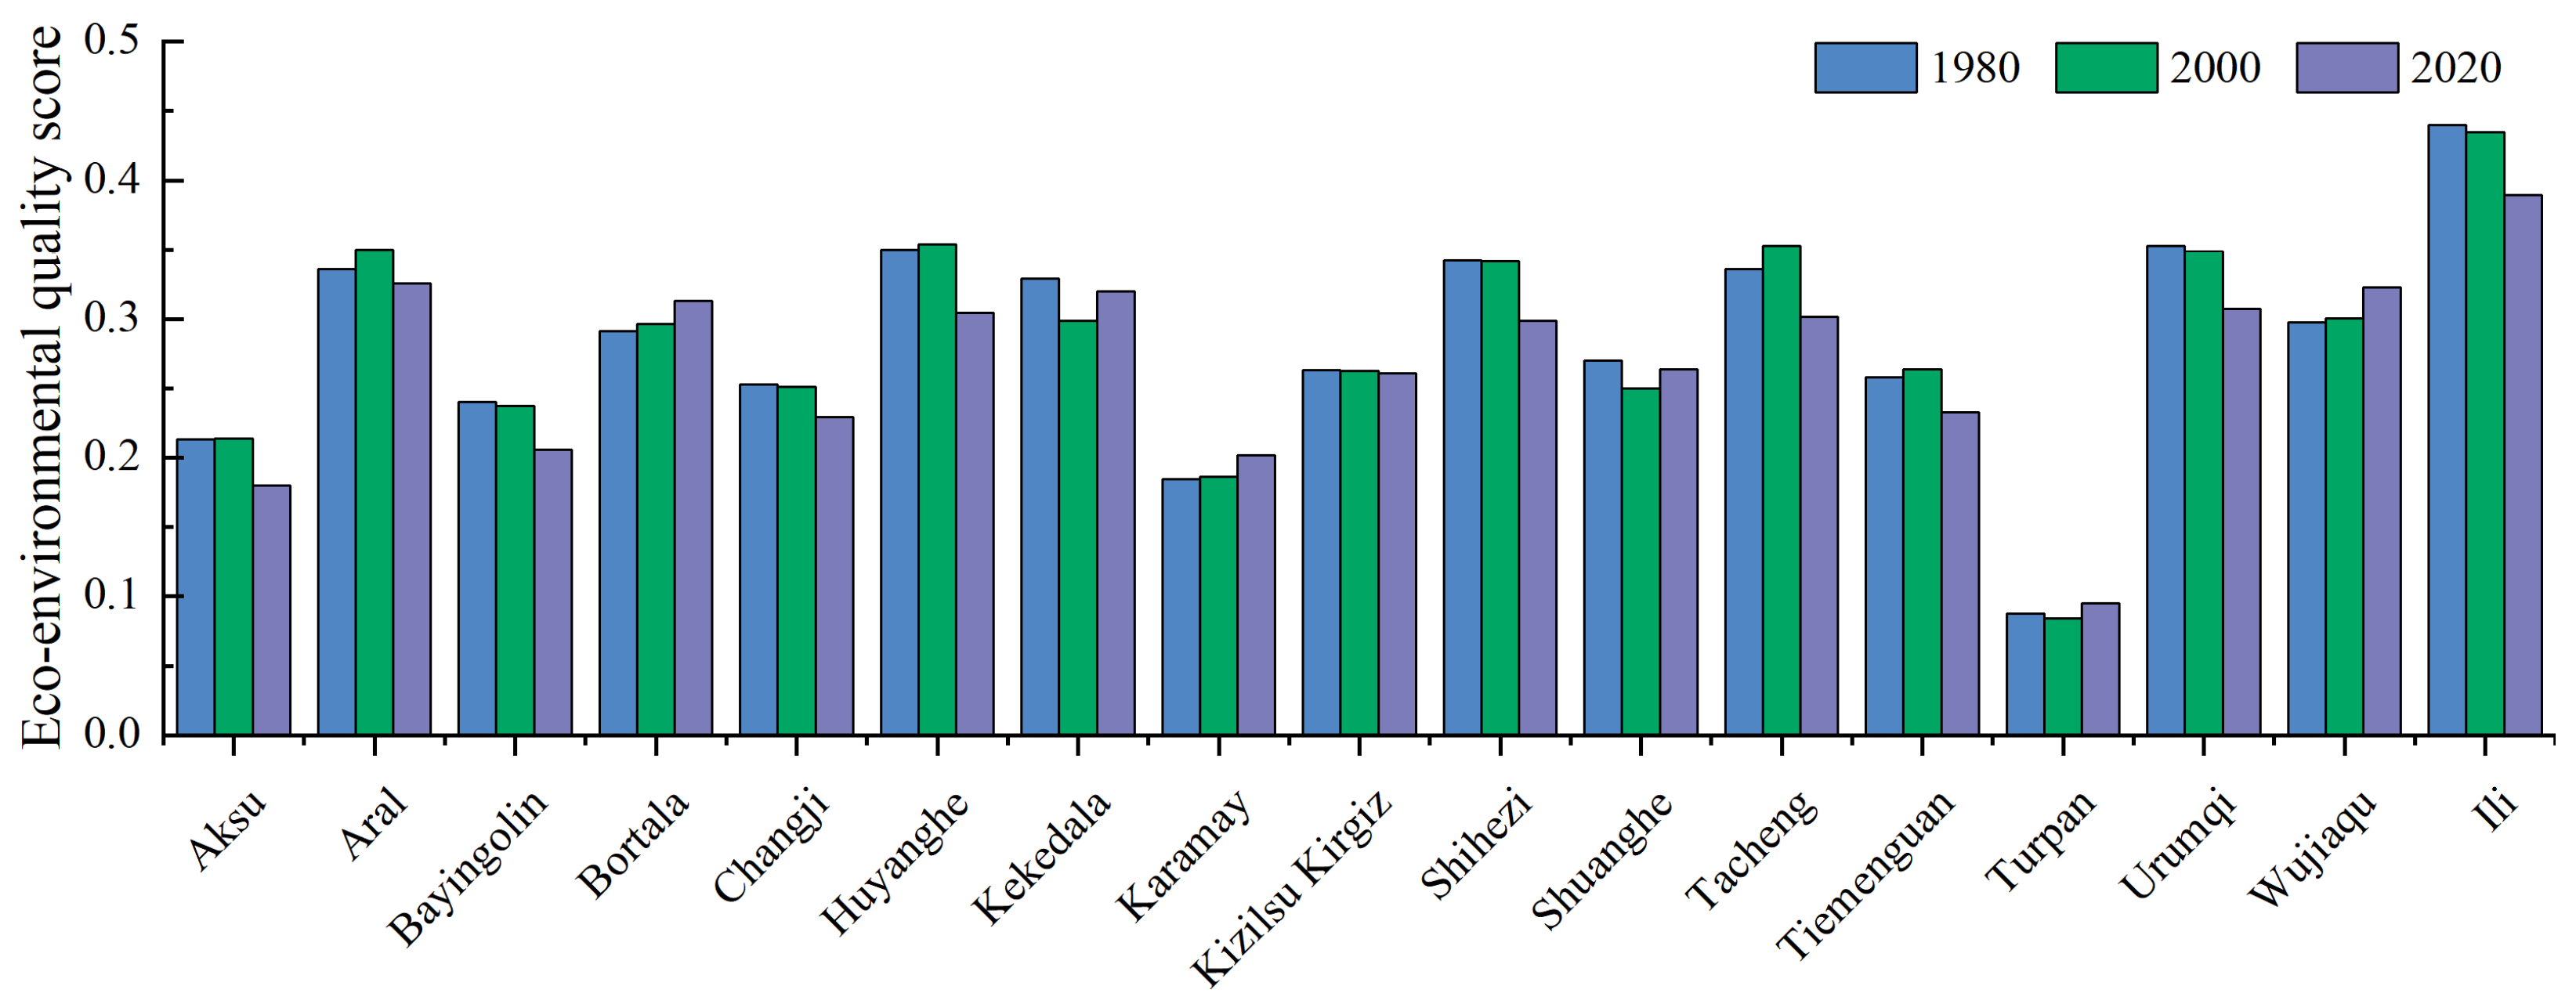
3.2.1. Temporal Changes in EEQ

The EEQ Index for the NSTM from 1980 to 2020 is shown in the Figure 4. The index remained basically unchanged from 1980 to 2000, indicating a stable EEQ. From 2000 to 2010, the index declined slightly from 0.246 to 0.241. From 2010 to 2015, the index rose to 0.244. However, from 2015 to 2020, the index sharply declined to 0.223. From the development process of the northern slope of the Tianshan Mountains, it can be seen that the early years (from 1980 to 2000) had few disturbances in terms of EEQ. Since 2000, the degree of disturbance has gradually increased. At the same time, the NSTM has welcomed many development opportunities. These opportunities have promoted the development of areas with poor EEQ (Other Ecological Space). These opportunities have, to some extent, improved the overall EEQ. After 2015, the development of areas with poor EEQ could not compensate for the disturbance caused by development to areas with good EEQ. The overall EEQ in the northern slope of the Tianshan Mountains rapidly declined. The following will further support this viewpoint from the perspective of Ecological Contribution Rate.
Figure 5 shows the calculation results of the Ecological Contribution Rate of the P-L-E Space transformation on the NSTM. The results indicate that, from 1980 to 2000, the primary factor causing ecological degradation was the conversion from Grassland Ecological Space to Agricultural Production Space and Other Ecological Space. Conversely, EEQ improvement was also observed due to the conversion of Agricultural Production Space and Other Ecological Space, which were converted to Grassland Ecological Space. This mutual conversion was the main reason for the relatively stable EEQ during this period, marking the early development of ecological compensation concepts on the NSTM. From 2000 to 2020, the primary reasons for the deterioration of EEQ were the occupation of Forest Ecological Space, Grassland Ecological Space, and Water Ecological Space. The main contributors to the improvement of EEQ were the restoration and development of Other Ecological Spaces. However, the contribution rate to ecological degradation was 6.18%, higher than the 3.53% contribution rate to ecological improvement. The quality of the ecological environment has therefore declined. Therefore, the P-L-E Space transformation pattern during this period led to severe disturbances in water bodies, grassland, and forests, resulting in the degradation of the EEQ.

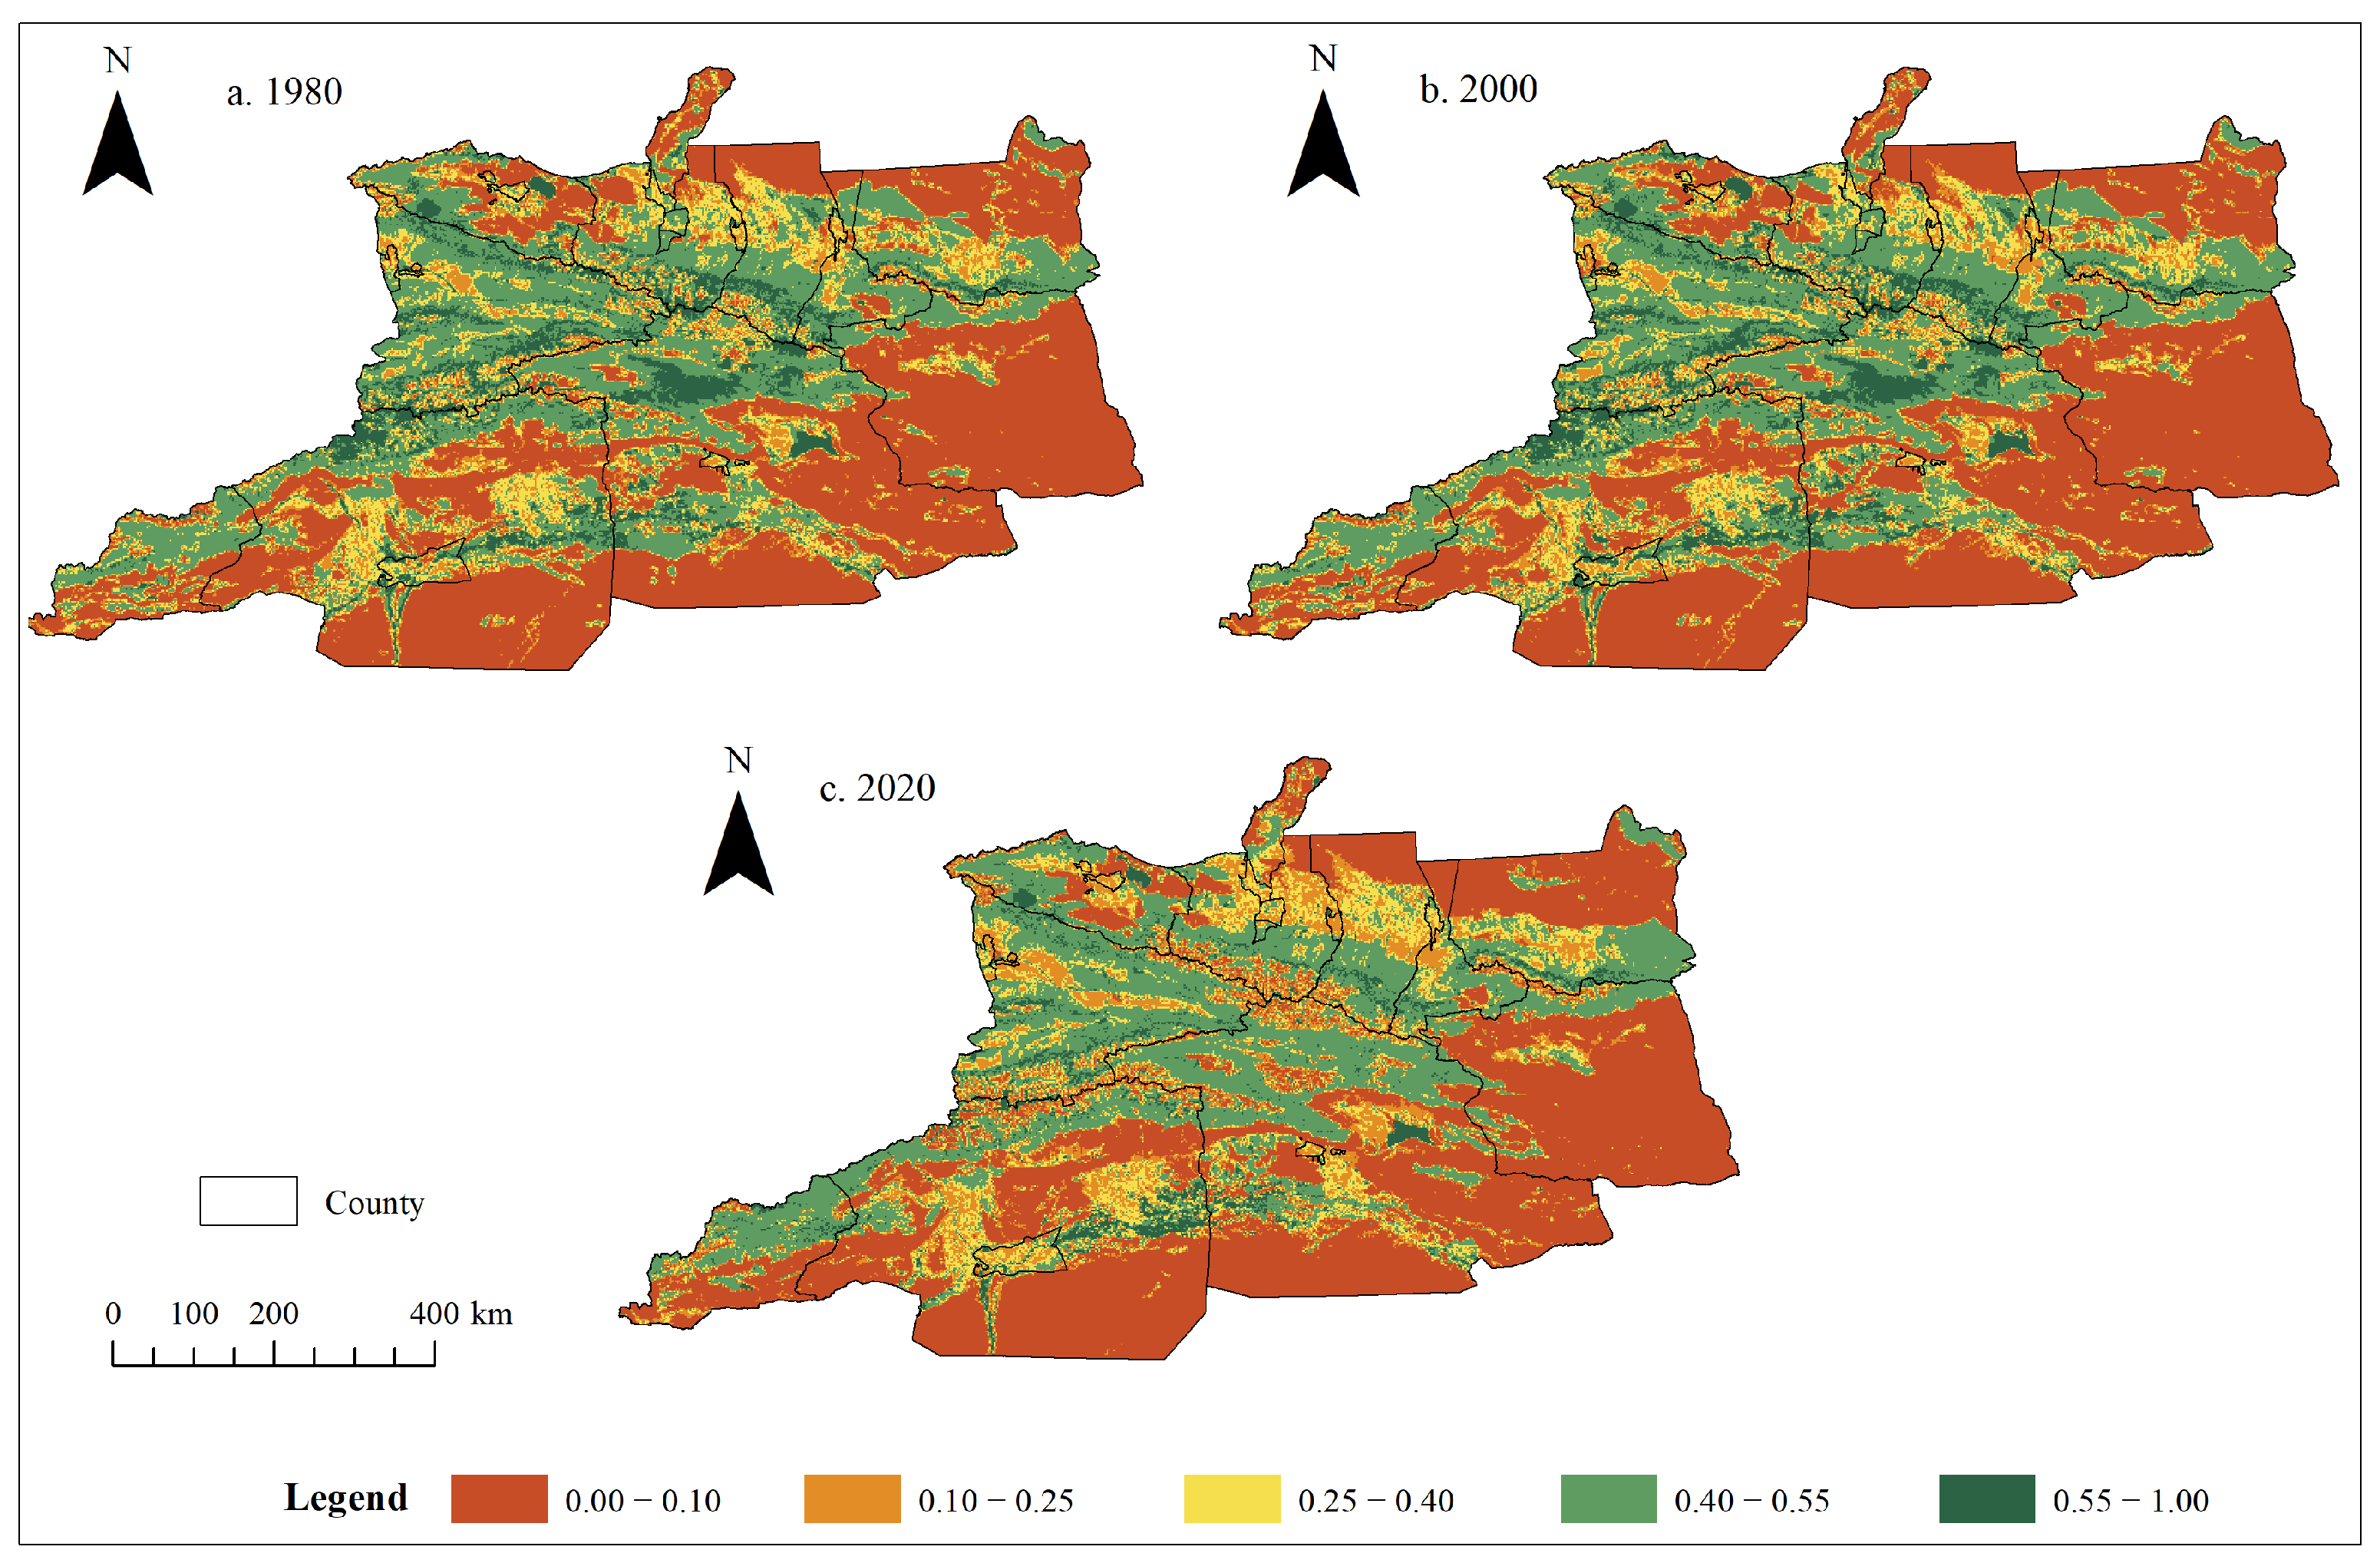
3.2.2. Spatial Distribution Characteristics of EEQ

Based on the area of the NSTM, a grid of 2 km × 2 km was established in ArcGIS software, creating a total of 143,590 grids. Using these grids as the smallest research units, we examined the EEQ of the NSTM, resulting in the spatial distribution characteristics for the years 1980, 2000, and 2020 (Figure 6). According to the natural breakpoint method, the EEQ was classified into five levels, and the number and area of grids at different levels were counted (Table 3). The results show that the EEQ on the NSTM mainly presents a “high in the northwest, low in the southeast” pattern. During the three periods (1980, 2000, 2020), the areas with low EEQ on the NSTM accounted for 42.49%, 42.84%, and 44.39%, respectively. Nearly half of the areas on the NSTM had poor EEQ, mainly distributed in Turpan, Aksu, and Bayingolin. During the research period, the highest level of EEQ change was observed in the high-quality area. Its proportion decreased from 7.62% to 3.77%, with many of these grids falling to low-quality and relatively low-quality areas.

3.2.3. Spatial Distribution Change of EEQ

Figure 7 shows the EEQ variation on the NSTM. From 1980 to 2000, the EEQ on the NSTM remains unchanged, with a regional proportion of 82.51%. The proportion of EEQ rising and falling areas is 7.95% and 9.54%, respectively. The regions with improved EEQ included Turpan, Urumqi, the Ili Kazakh Autonomous Prefecture, Kekedala, and Shuanghe. The regions with declining EEQ included Aral, the Bortala Mongol Autonomous Prefecture, and the Tacheng Region (Figure 8). From 2000 to 2020, the EEQ on the NSTM has undergone drastic changes, with a proportion of 57.11% in the affected areas. Among them, the proportion of areas with a decreased EEQ is 33.54%, while the proportion of areas with a increased EEQ is 23.57%. The EEQ in the Tianshan Mountains has significantly decreased. Except for the Bortala Mongol Autonomous Prefecture, Kekedala, Shuanghe, and Wujiaqu, the EEQ in other regions declined. The regions with significant declines included Aksu, Bayingolin, Huyanghe, Shihezi, Tacheng, and the Ili Kazakh Autonomous Prefecture. Spatially, the decline in EEQ was more severe in the northern part of the NSTM than in the southern part, and the areas near the Tianshan Mountains showed more pronounced declines (Figure 8). Overall, from 2000 to 2020, the changes in EEQ on the NSTM are similar to those from 2000 to 2020, with the proportion of areas experiencing a decrease in EEQ further increasing, reaching 34.36%.

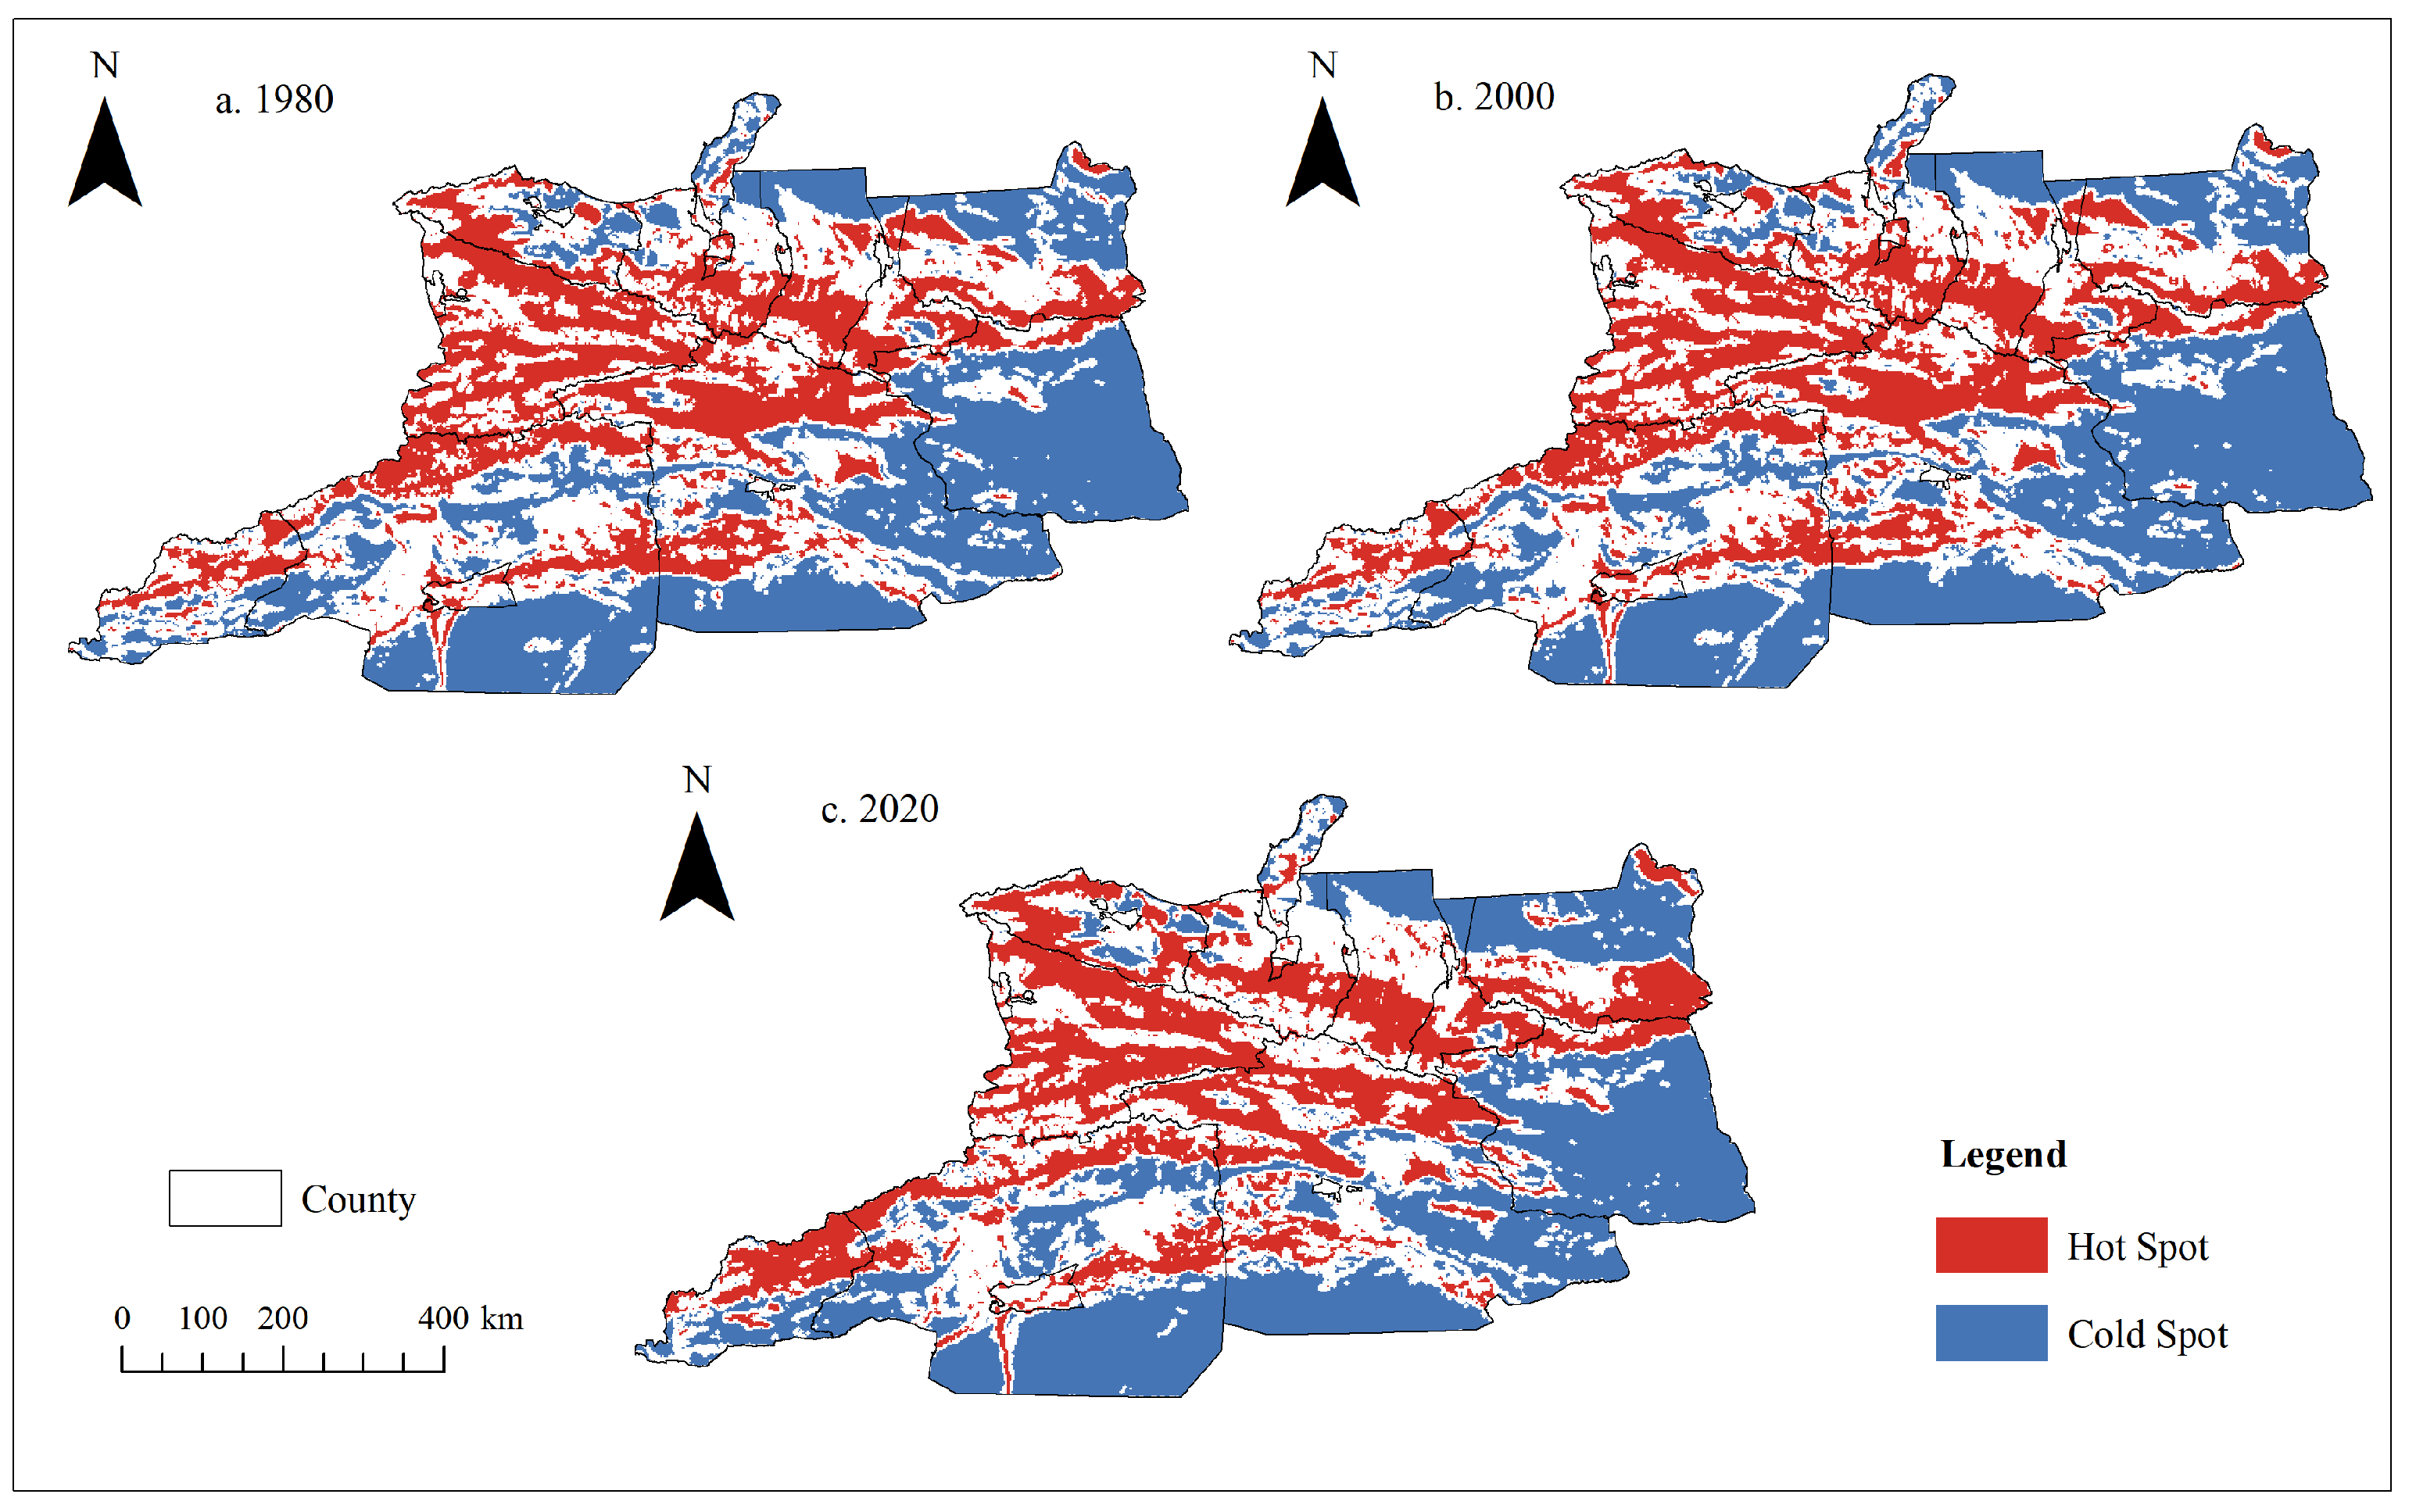
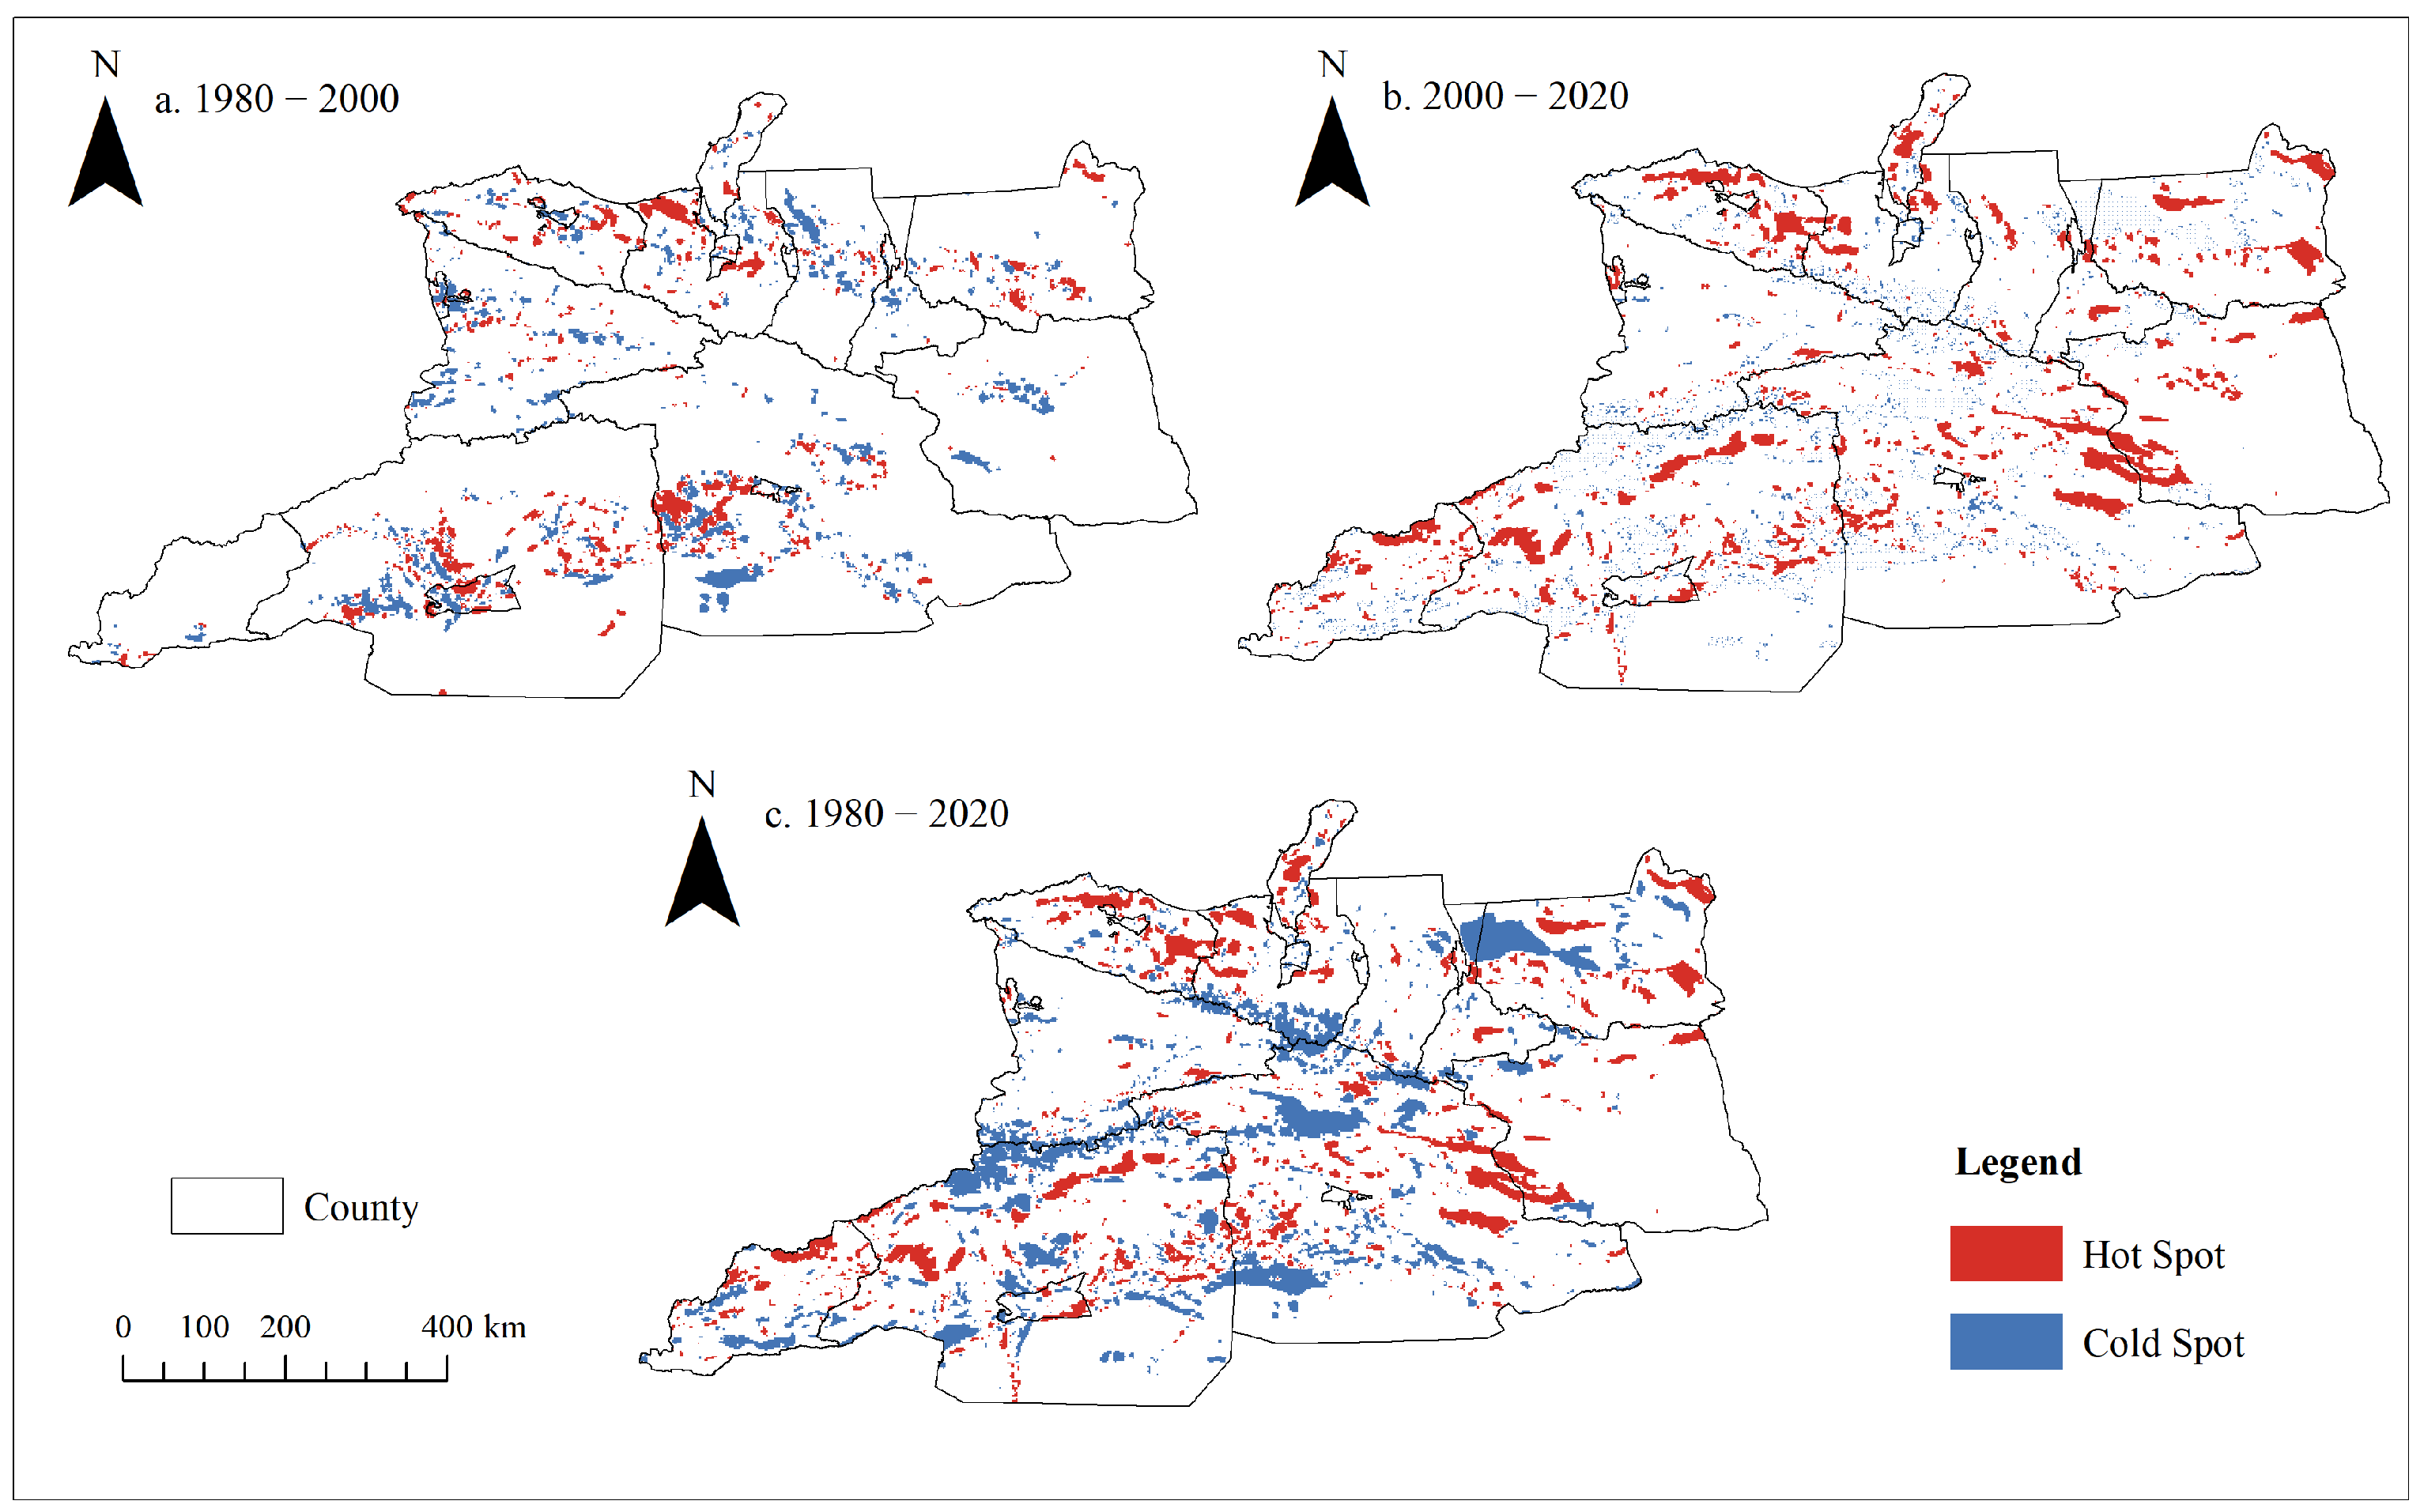
3.2.4. Spatial Autocorrelation of EEQ on the NSTM

Figure 9 shows the spatial distribution of EEQ cold and hot spots during the study period (1980–2020). The EEQ hot spots are mainly concentrated in the central and western parts of the NSTM. The EEQ cold spots are mainly concentrated in the eastern and southern parts of the northern slope of the Tianshan Mountains. In 1980, the EEQ cold spots were mainly concentrated in Turpan, the southern part of Aksu, and the southern part of Bayingolin. The EEQ hot spot patches were distributed along the Tianshan Mountains. In 2000, the distribution of EEQ cold spots and hot spots did not change significantly and was similar to the pattern in 1980. There was a slight increase in hot spots in the northern part of the NSTM and a slight increase in cold spots in the southern part. In 2020, the distribution of EEQ cold and hot spots on the NSTM underwent significant changes. The Tianshan Mountains were divided into the northern, central, and southern ranges. In the northern Tianshan Mountains, the EEQ hot spots formed two concentrated areas, and the area of the EEQ hot spots increased. In the northern Tianshan Mountains, the EEQ hot spots significantly decreased near Urumqi and significantly increased in the Changji. The area of EEQ hot spots in the central Tianshan Mountains significantly decreased, especially in parts of the Aksu and Bayingolin areas. The area of EEQ cold spots increased in the northern and southern parts of the NSTM, while the area of EEQ cold spots slightly decreased in the eastern part of the NSTM.
This indicates that the distribution of EEQ hot spots on the NSTM is significantly influenced by the Tianshan Mountains. The Tianshan Mountains are a concentration area for EEQ hot spots, and the clustering effect of EEQ hot spots in both the northern and southern Tianshan Mountains is continuously increasing. In the southern, eastern, and northern parts of the NSTM, EEQ cold spots are concentrated. The agglomeration effect of EEQ cold spots continues to strengthen in the southern and northern areas, while it has slightly weakened in the eastern EEQ cold spot areas.
The distribution of cold and hot spots of EEQ changes is shown in Figure 10. From 1980 to 2000, the hot spots of EEQ changes are mainly distributed in the northern part of North Tianshan and the southern part of Middle Tianshan. The cold spots of EEQ changes are distributed not only in these two areas but also in the Ili Kazakh Autonomous Prefecture and Turpan. From 2000 to 2020, the distribution of hot spots of EEQ changes has expanded to include the southern Tianshan Mountains and its southern parts. The agglomeration effect in the original two regions has strengthened. The agglomeration effect of EEQ change cold spots has nearly disappeared, with only scattered distribution remaining on the NSTM. Over the entire study period (1980–2020), the distribution of hot spots of EEQ changes is similar to that of the period 2000–2020. The cold spots of EEQ changes are mainly distributed in the central Tianshan Mountains and its southern parts, with a high aggregation area also present in Urumqi and Changji.
The results indicate that the distribution of hot spots of EEQ changes on the NSTM is stable. There are stronger aggregation effects during the 2000–2020 period compared to 1980–2000. The distribution of hot spots dominated the entire study period (1980–2020). However, the aggregation effect of cold spots of EEQ changes on the NSTM has gradually weakened from the 1980–2000 period to the 2000–2020 period. Nevertheless, over the entire study period (1980–2020), there are noticeable aggregation characteristics.

3.3. The Terrain Gradient Differentiation Characteristics of EEQ

Applying the natural breakpoint method, we classify the Terrain Gradient into following five levels: One TG (0–0.33), Two TG (0.33–0.51), Three TG (0.51–0.73), Four TG (0.73–0.99), and Five TG (0.99–1.59). When the Distribution Index (P) > 1, it indicates that the EEQ’s area of this type is in a dominant distribution on this level of terrain gradient. The larger the P value, the higher the dominance; conversely, the smaller the P value, the lower the dominance.
The relationship between the EEQ and Terrain Gradient is shown in Figure 11. At the One Terrain Gradient level, low-quality and medium-quality areas are dominantly distributed. This gradient level is mainly distributed in the northern part of the NSTM, an area characterized by fertile land, sufficient water sources, and convenient transportation. These factors provide excellent conditions for agricultural and pastoral production and residence, making it a primary area for Production Space and Living Space. At the Two Terrain Gradient level, low-quality areas are dominantly distributed. This gradient level is widely found in the southern part of the NSTM. As the Terrain Position Index increases, this region become less suitable for habitation and production activities. Moreover, the desert grasslands and Gobi areas are mostly distributed at this terrain gradient level. At the Three Terrain Gradient level, relatively high-quality areas are dominantly distributed. This gradient level is found along the foothills of the Tianshan Mountains, an area rich in grassland resources, including the Bayanbulak Grassland, Kunnes Grassland, Barkol Grassland, and vast mountain grasslands. A large amount of pasture ecological land is distributed here. At the Four Terrain Gradient level, both relatively high-quality and high-quality areas are dominantly distributed. This gradient level is mainly distributed on the mid-slopes of the Tianshan Mountains, an area abundant in forest resources. The coniferous forest is widely distributed here, and there are many artificial forests near settlements, primarily consisting of farmland shelterbelts and orchard. The Five Terrain Gradient is distributed at the mountain tops of the Tianshan Mountains. At this gradient level, high-quality areas are dominantly distributed with the highest degree of dominance. Additionally, relatively high-quality, moderate-quality, and relatively low-quality areas are also dominantly distributed here. This area lies above the snow line, where numerous glaciers are found, providing abundant glacier water storage. Moreover, the Tianshan glaciers serve as the source of many rivers in Xinjiang, providing a stable supply of water, thereby contributing to the good EEQ. However, this gradient level also includes the high-altitude ice and snow gravel desert landscape, characterized by bare rocks with no vegetation cover.
From 1980 to 2020, the Distribution Index changes (Figure 12) indicate that the dominance of low and medium quality areas on the One Terrain Gradient has slightly increased. The distribution of high-quality areas has also increased, but it has not formed a dominant distribution; additionally, the dominant distribution pattern on the Two Terrain Gradient has not changed significantly. The distribution of high-quality areas has increased but has not formed a dominant distribution. On the Three Terrain Gradient, the dominance of high-quality areas has further expanded, while the distribution of low-quality areas has decreased and is no longer dominant. On the Four Terrain Gradient, the distribution pattern remains stable, but the most dominant quality area has shifted from high-quality to relatively high-quality. On the Five Terrain Gradient, there have been significant changes in the distribution pattern. The distribution of high-quality areas has significantly decreased and no longer holds its dominant distribution. Meanwhile, the distribution of low-quality and relatively low-quality areas has increased, with the dominance of relatively low-quality areas becoming similar to that of high-quality areas. The main reason for this phenomenon is the increased emphasis on environment protection, which has gradually improved the EEQ on low-terrain gradients (levels 1–2), showing a positive trend. On the mid-level terrain gradients (levels 3–4), forest and grassland have been damaged, leading to varying degrees of vegetation degradation and a reduction in forests. However, these issues have also received attention, with increased efforts in forest protection, the implementation of livestock management based on grassland capacity, and the initiation of ecological construction projects. As a result, the EEQ at these gradients has not significantly declined. The EEQ on high-terrain gradients (level 5) has deteriorated. On one hand, the degradation of forests and grassland on mid-level gradients has led to a decline in water conservation functions. On the other hand, climate change has caused glacial melting, resulting in an expansion of exposed rock areas and a significant reduction in glacier water storage.

4. Discussion

The changes in the P-L-E Spaces on the NSTM reflect the development status of the region. The NSTM enjoys obvious geographical advantages, favorable natural conditions, and convenient transportation, with the Beijiang Railway and highways traversing the region. Leveraging its geographical and resource advantages, the NSTM have developed a modern industrial system supported by energy resources and led by strategic emerging industries. Simultaneously, it has promoted the industrialization of agriculture, making significant contributions to the coordinated development of Xinjiang’s new industrialization, new urbanization, and modernization of agriculture and animal husbandry. Therefore, the area’s production space has expanded. The development of industry and agriculture has attracted settlers, leading to a continuous expansion of the Living Space in the northern slope of the Tianshan Mountains. However, rapid development inevitably impacts the ecological environment. The areas of Grassland Ecological Space, Water Ecological Space, and Forest Ecological Space have decreased, while the areas of deserts and barren land have expanded. Nonetheless, the area of Other Ecological Space has further expanded.
Due to the influence of the P-L-E Spaces, the EEQ on the NSTM has undergone drastic changes, especially after 2010. In 2010, China provided targeted assistance to Xinjiang, providing comprehensive support in terms of talents, technology, management, and funds to the region, greatly changing its development landscape. The proposal of the “Belt and Road” initiative in 2013 and the establishment of the core area of the Silk Road Economic Belt since the 18th National Congress of the Communist Party of China have brought significant development opportunities to the region. These developments have led to comprehensive and rapid socio-economic development and improved infrastructure construction. As the development of Xinjiang accelerated, the environmental problems on the NSTM became more pronounced. The construction of highways and railways, as well as the use of transmission tower foundations and oil pipelines have a strong impact on the surrounding environment. The construction of multiple phases of the Xinjiang Power Transmission Project and West–East Gas Pipeline Project has occupied ecological space, leading to a deterioration in EEQ. To compensate for the ecological damage, the NSTM strengthened water body protection while simultaneously developing tree planting in deserts and developing industrial, mining, and transportation sectors.
This study, to some extent, can support the rational utilization of land resources and the improvement of ecological environment quality in the region. Nevertheless, there are still shortcomings in this research. It only analyzed the differentiation characteristics of ecological environment quality on terrain gradients, neglecting other factors influencing the ecological environment quality in the region, such as temperature and precipitation, as well as human factors like railway and highway construction and urban expansion. All of these factors can alter the distribution pattern of P-L-E Spaces and affect EEQ. In the future, it will be necessary to comprehensively consider these factors and conduct in-depth analyses to understand the driving mechanisms behind changes in EEQ.

5. Conclusions

This study, based on the perspective of P-L-E Spaces, analyzes the distribution and transformation of P-L-E Spaces, spatiotemporal changes in EEQ, and terrain gradient effects on the NSTM. The conclusions are as follows:
  • The NSTM are predominantly Ecological Space, covering over 85% of the total area. However, this area has been decreasing, with a total reduction of 25,163 km2 over the study period. Production Space is distributed on both sides of the Tianshan Mountains, while Living Space is concentrated in densely populated areas. Both Production Space and Living Space have shown continuous expansion, increasing by 23,083 km2 and 2145 km2, respectively, during the study period. From 1980 to 2020, Agricultural Production Space, Industrial Production Space, and Urban Living Space have grown rapidly, increasing by 21,596 km2, 1487 km2, and 1424 km2. Rural living Space have shown stable growth. The area of Forest Ecological Space and Water Ecological Space initially increased and then decreased. Water Ecological Space showed a significant reduction, converting mainly to Other Ecological Space, and Forest Ecological Space largely converted to Grassland Ecological Space. Grassland Ecological Space continued to decrease, with a total reduction of 15,639 km2, mostly converting to Urban Living Space and Industrial Production Space.
  • The EEQ on the NSTM remained stable from 1980 to 2000. From 2000 to 2010, the EEQ Index declined slightly from 0.246 to 0.241. Between 2010 and 2015, the index rose to 0.244, indicating significant improvement. However, from 2015 to 2020, the index rapidly declined from 0.244 to 0.223, signifying deterioration in EEQ. In terms of Ecological Contribution Rates, from 1980 to 2000, the degradation of the EEQ was the conversion of Grassland Ecological Space to Agricultural Production Space and Other Ecological Space. Conversely, EEQ’s improvement was driven by the conversion of Agricultural Production Space and Other Ecological Space, which were back to Grassland Ecological Space. From 2000 to 2020, the deterioration in EEQ was mainly due to the occupation of Forest Ecological Space, Grassland Ecological Space, and Water Ecological Space. The improvement in EEQ during this period was primarily contributed by the restoration of Other Ecological Space.
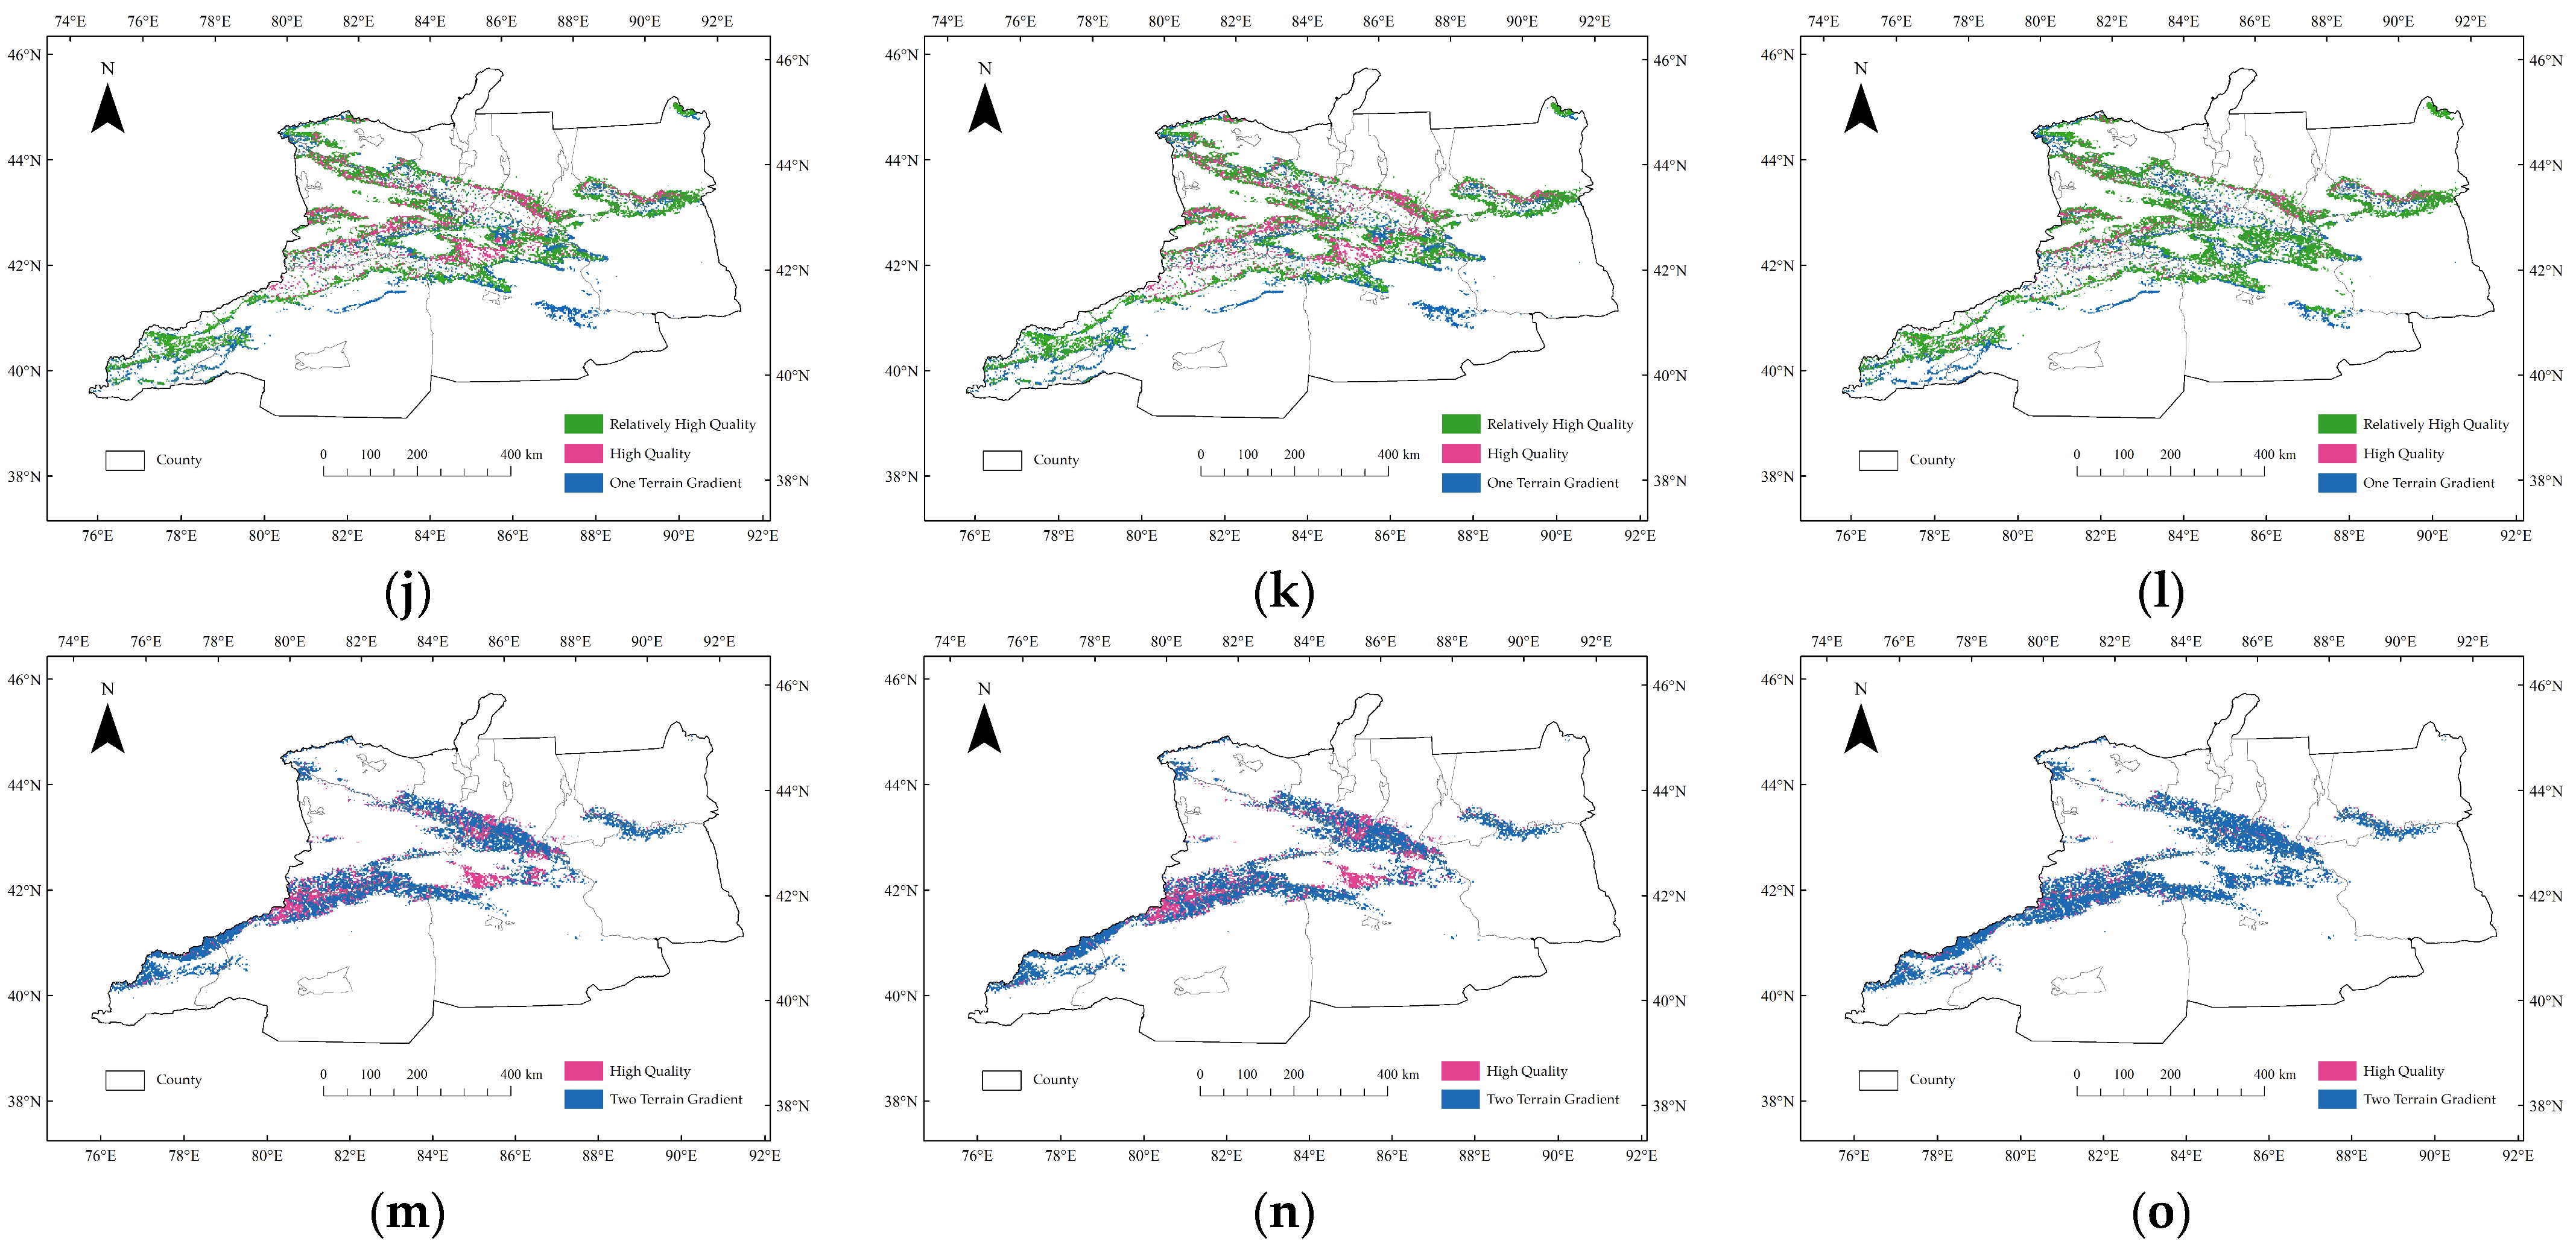
  • The EEQ of the NSTM mainly exhibits a “northwest high, southeast low” pattern. The distribution of EEQ hot spots on the NSTM is significantly influenced by the Tianshan Mountains. The Tianshan Mountains are a concentration area for EEQ hot spots, and the clustering effect of EEQ hot spots in both the northern and southern Tianshan Mountains is continuously increasing. In the southern, eastern, and northern parts of the NSTM, EEQ cold spots are concentrated. The agglomeration effect of EEQ cold spots in the southern and northern areas continues to strengthen, while, in the eastern EEQ cold spot areas, the agglomeration effect has slightly weakened. The distribution of hot spots of EEQ changes on the NSTM is stable, with stronger aggregation effects during the 2000–2020 period, and it dominates the entire study period. However, the aggregation effect of cold spots of EEQ changes on the NSTM has gradually weakened from the 1980–2000 period to the 2000–2020 period. Nevertheless, over the entire study period, there are noticeable aggregation characteristics.
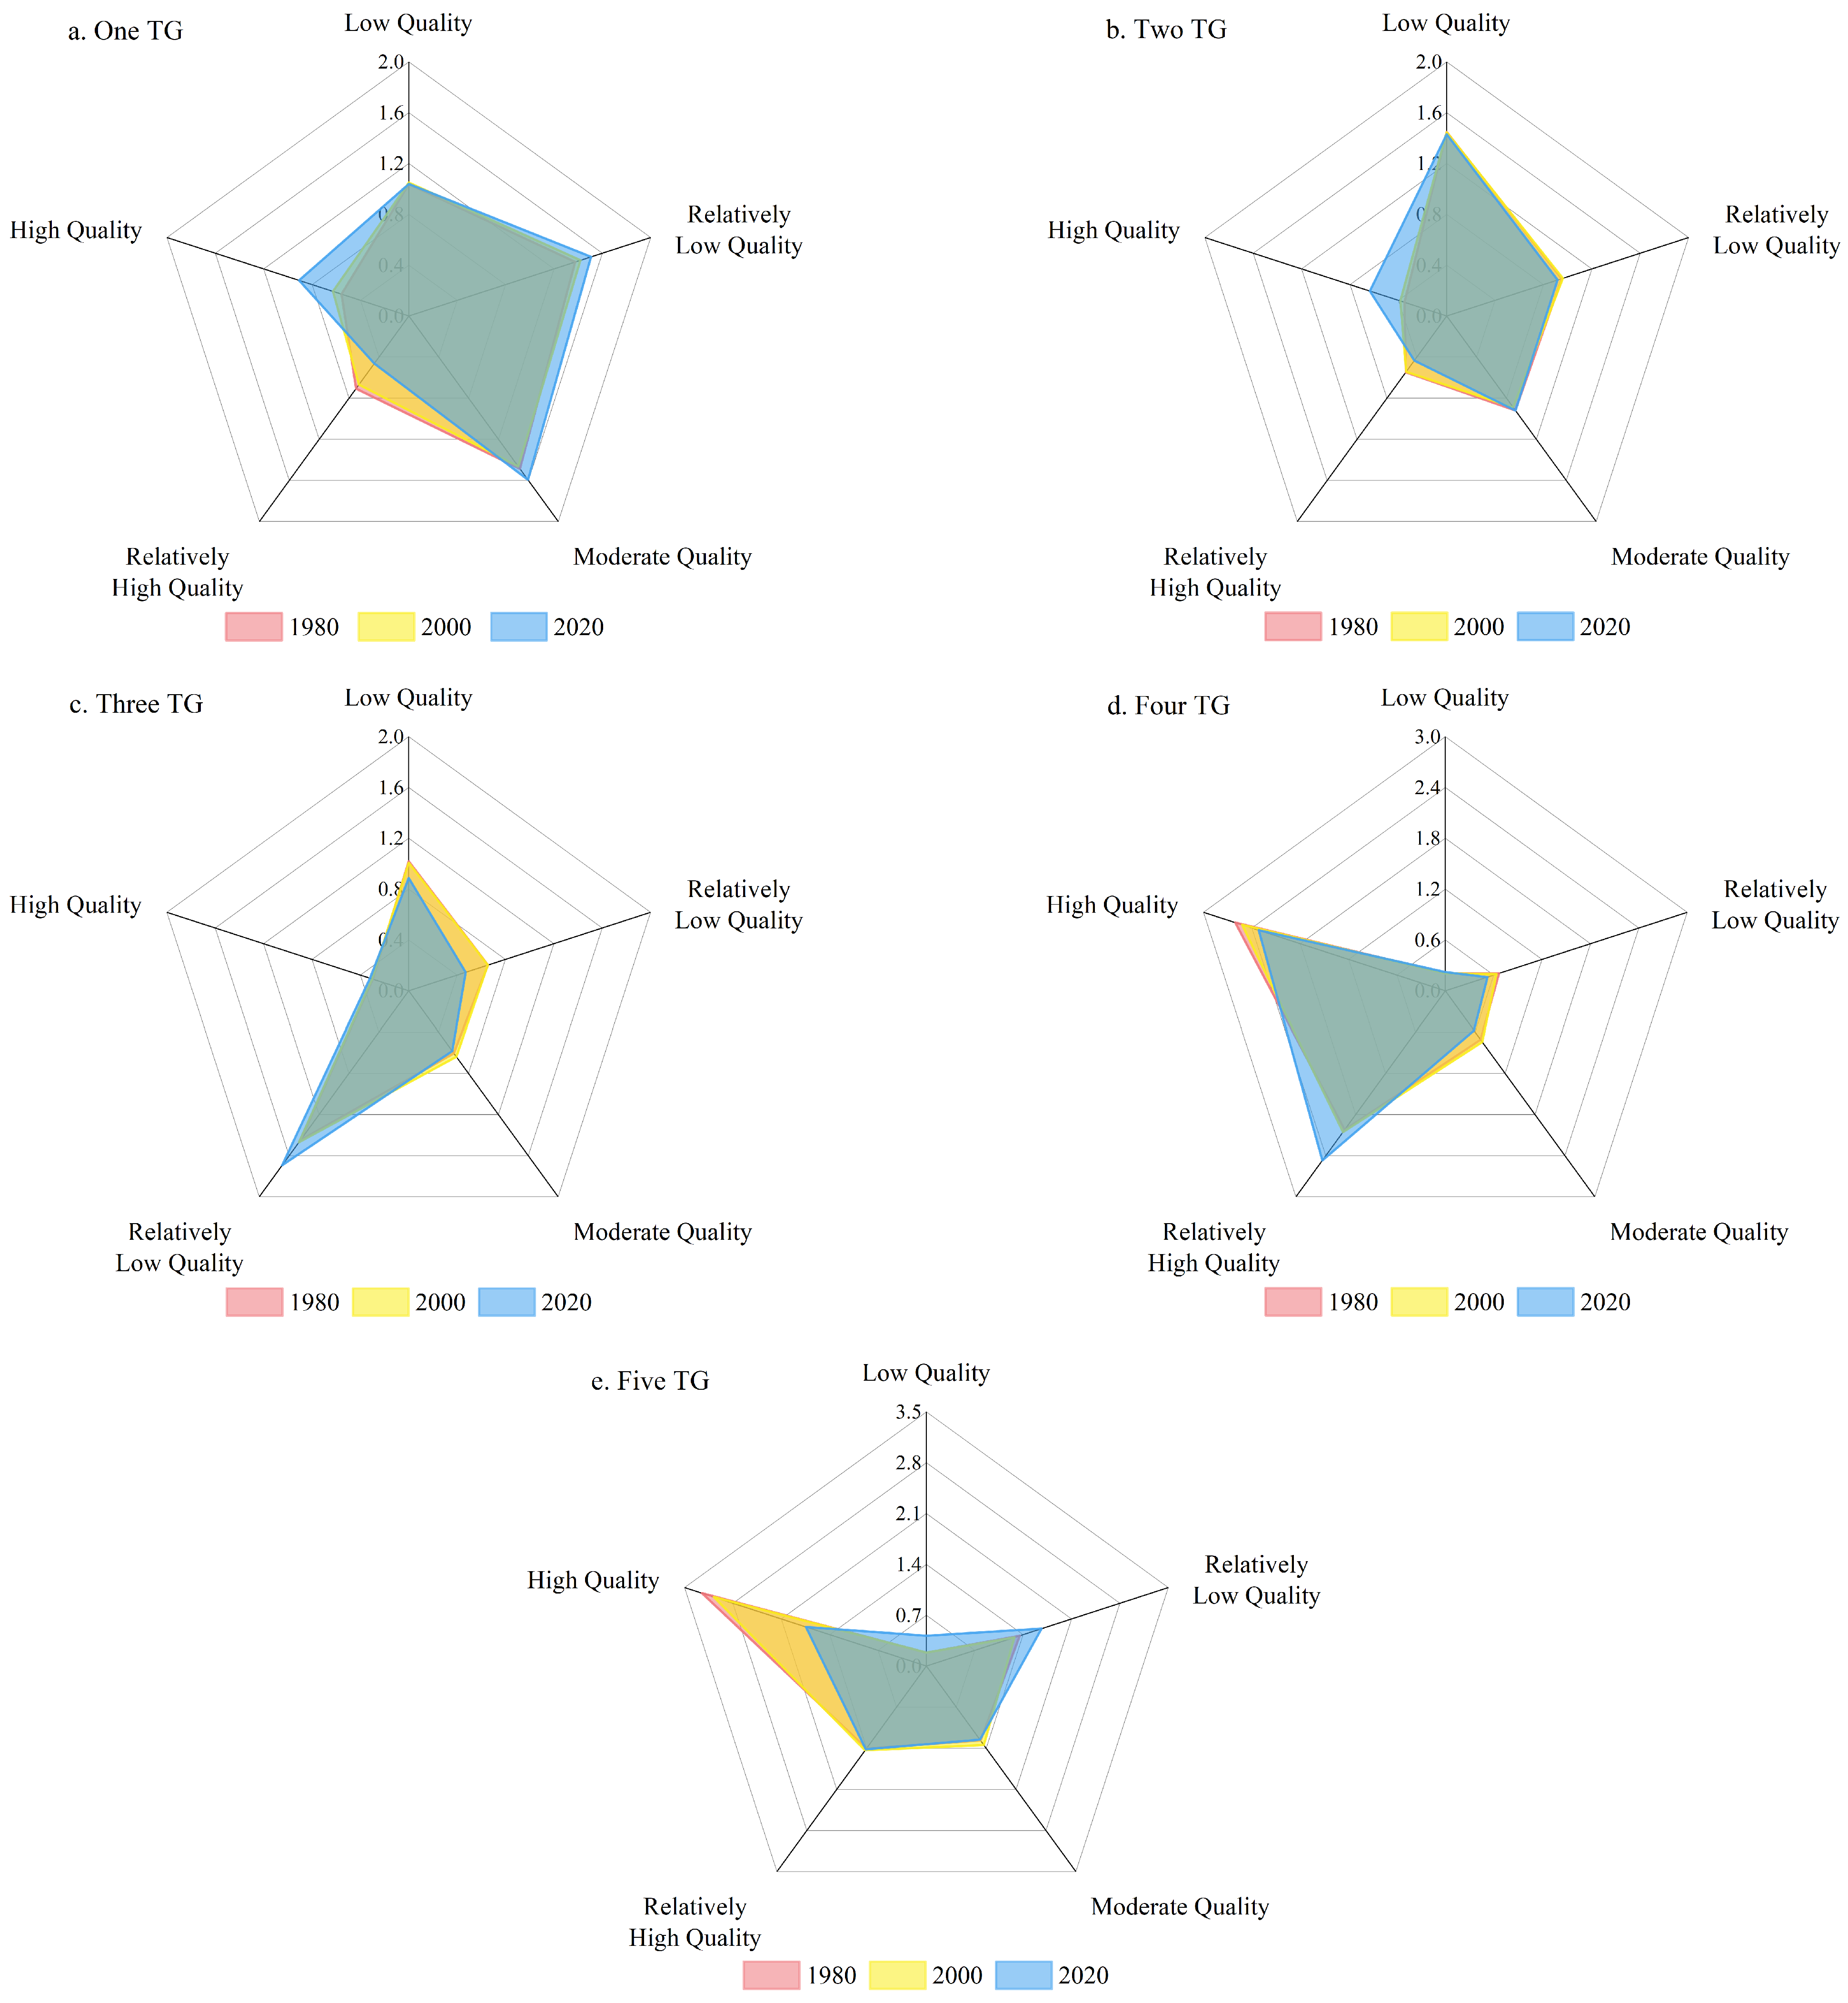
  • Different levels of EEQ areas exhibit significant gradient differences. In the One and Two Gradient Levels, low-quality, relatively low-quality, and moderate-quality areas are predominantly distributed. Conversely, on the Three to Five Gradient Levels, EEQ is better, and, as the Terrain Gradient level increases, regions exhibiting predominant distribution tend to have higher EEQ. From 1980 to 2020, there was a slight improvement in EEQ on the One and Two Terrain Gradient levels, significant improvement on the Three Terrain Gradient level, slight deterioration on the Four Terrain Gradient level, but predominant distribution still consisted of high-quality and relatively high-quality areas. On the Five Terrain Gradient level, EEQ declined, with a significant reduction in the area of high-quality areas.

Author Contributions

Conceptualization, M.Y. and Q.Y.; methodology, M.Y.; software, K.L.; validation, M.Y., Q.Y. and X.M.; formal analysis, M.Y.; investigation, G.L.; resources, Z.W.; data curation, Q.P. and K.L.; writing—original draft preparation, M.Y.; writing—review and editing, Q.Y. and X.M.; visualization, X.C.; supervision, G.L.; project administration, Z.W.; funding acquisition, Z.W. and Q.Y. All authors have read and agreed to the published version of the manuscript.

Funding

This research was funded by the Study on the Ecological Environment Effects and Driving Factors in the Northern Slope Region of the Tianshan Mountains (No. 2024WLKXJ130), the Study on the Ecological Environment Effects and Driving Factors in the Northern Slope Region of the Tianshan Mountains (No. KYCX24_2973), the Third Comprehensive Scientific Expedition to Xinjiang in China-Geological Hazards and Ecological Environment Investigation of the National Major Energy Channel on the North Slope of Tianshan Mountains (No. 2022xjkk1004).

Data Availability Statement

The original contributions presented in the study are included in the article, further inquiries can be directed to the corresponding author/s.

Acknowledgments

The authors would like to thank the anonymous reviewers and editors for commenting on this paper. Thank you to everyone who contributed to this study.

Conflicts of Interest

The authors declare no conflict of interest.

References

  1. Chen, W.; Li, J.; Zeng, J.; Ran, D.; Yang, B. Spatial Heterogeneity and Formation Mechanism of Eco-Environmental Effect of Land Use Change in China. Geogr. Res. 2019, 38, 2173–2187. [Google Scholar] [CrossRef]
  2. Huang, J.; Zhong, P.; Zhang, J.; Zhang, L. Spatial-Temporal Differentiation and Driving Factors of Ecological Resilience in the Yellow River Basin, China. Ecol. Indic. 2023, 154, 110763. [Google Scholar] [CrossRef]
  3. Zhang, W.; Yuan, Q.; Cai, H. Unravelling Regional Development through the Production-Living-Ecological Perspective: Assessing Heterogeneity and Expert Insights. Urban Clim. 2024, 55, 101937. [Google Scholar] [CrossRef]
  4. Duan, Y.; Wang, H.; Huang, A.; Xu, Y.; Lu, L.; Ji, Z. Identification and Spatial-Temporal Evolution of Rural “Production-Living-Ecological” Space from the Perspective of Villagers’ Behavior—A Case Study of Ertai Town, Zhangjiakou City. Land Use Policy 2021, 106, 105457. [Google Scholar] [CrossRef]
  5. Zhang, Z.; Hou, Y.; Sun, H.; Guo, S. Study on the Evaluation of the Spatial Function and Coordination Relationship of the Territorial “Production-Living-Ecological” Spaces at the Township-Street Scale. J. Nat. Resour. 2022, 37, 2898-2814. [Google Scholar] [CrossRef]
  6. Zhao, T.; Cheng, Y.; Fan, Y.; Fan, X. Functional Tradeoffs and Feature Recognition of Rural Production–Living–Ecological Spaces. Land 2022, 11, 1103. [Google Scholar] [CrossRef]
  7. Fu, J.; Gao, Q.; Jiang, D.; Li, X.; Lin, G. Spatial–Temporal Distribution of Global Production–Living–Ecological Space during the Period 2000–2020. Sci. Data 2023, 10, 589. [Google Scholar] [CrossRef]
  8. Lei, J.; Chen, Y.; Li, L.; Chen, Z.; Chen, X.; Wu, T.; Li, Y. Spatiotemporal Change of Habitat Quality in Hainan Island of China Based on Changes in Land Use. Ecol. Indic. 2022, 145, 109707. [Google Scholar] [CrossRef]
  9. Huang, J.; Xue, D.; Dong, C.; Wang, C.; Zhang, C.; Ma, B.; Song, Y. China Eco-Environmental Effects and Spatial Differentiation Mechanism of Land Use Transition in Agricultural Areas of Arid Oasis: A Perspective Based on the Dominant Function of Production-Living-Ecological Spaces. Prog. Geogr. 2022, 41, 2044–2060. [Google Scholar] [CrossRef]
  10. Wu, J.; Zhang, D.; Wang, H.; Li, X. What Is the Future for Production-Living-Ecological Spaces in the Greater Bay Area? A Multi-Scenario Perspective Based on DEE. Ecol. Indic. 2021, 131, 108171. [Google Scholar] [CrossRef]
  11. Jiang, X.; Zhai, S.; Liu, H.; Chen, J.; Zhu, Y.; Wang, Z. Multi-Scenario Simulation of Production-Living-Ecological Space and Ecological Effects Based on Shared Socioeconomic Pathways in Zhengzhou, China. Ecol. Indic. 2022, 137, 108750. [Google Scholar] [CrossRef]
  12. Xu, D.; Zhang, K.; Cao, L.; Guan, X.; Zhang, H. Driving Forces and Prediction of Urban Land Use Change Based on the Geodetector and CA-Markov Model: A Case Study of Zhengzhou, China. Int. J. Digit. Earth 2022, 15, 2246–2267. [Google Scholar] [CrossRef]
  13. Liu, J.; Jin, X.; Li, H.; Zhang, X.; Xu, W.; Fan, Y.; Zhou, Y. Spatial-Temporal Changes and Driving Factors of the Coordinated Relationship among Multiple Land Use Efficiencies Integrating Stakeholders’ Vision in Eastern China. J. Clean. Prod. 2022, 336, 130406. [Google Scholar] [CrossRef]
  14. Zhang, Y.; Lin, W.; Yin, H.; Cheng, L.; Zhang, K.; Ye, S. Spatiotemporal Evolution Characteristics and Influence Factor Analysis of the Production–Living–Ecological Space in Laiwu, China, from 2001 to 2018. J. Urban Plan. Dev. 2024, 150, 04024007. [Google Scholar] [CrossRef]
  15. Zhang, K.; Huang, C.; Wang, Z.; Wu, J. Optimization of “Production-Living-Ecological” Spaces Based on DTTD-MCR-PLUS Model-Taking Changsha City as an Example. Acta Ecol. Sin. 2022, 42, 9957–9970. [Google Scholar] [CrossRef]
  16. Sun, R.; Wu, Z.; Chen, B.; Yang, C.; Qi, D.; Lan, G.; Fraedrich, K. Effects of Land-Use Change on Eco-Environmental Quality in Hainan Island, China. Ecol. Indic. 2020, 109, 105777. [Google Scholar] [CrossRef]
  17. Liu, J.; Liu, Y.; Li, Y. Classification Evaluation and Spatial-Temporal Analysis of “Production-Living-Ecological” Spaces in China. Acta Geogr. Sin. 2017, 72, 1290–1304. [Google Scholar] [CrossRef]
  18. Tao, Y.; Wang, Q. Quantitative Recognition and Characteristic Analysis of Production-Living-Ecological Space Evolution for Five Resource-Based Cities: Zululand, Xuzhou, Lota, Surf Coast and Ruhr. Remote Sens. 2021, 13, 1563. [Google Scholar] [CrossRef]
  19. Liu, H.; Qin, L.; Xing, M.; Yan, H.; Shang, G.; Yuan, Y. Effects of Production–Living–Ecological Space Patterns Changes on Land Surface Temperature. Remote Sens. 2023, 15, 3683. [Google Scholar] [CrossRef]
  20. Liu, J.; Cong, Z.; Wang, Z. Ecological effects of production-living-ecological space transformation at multi-scales:A case study on the Shandong Section of the Yellow River Basin. China Environ. Sci. 2023, 43, 2519–2530. [Google Scholar] [CrossRef]
  21. Wang, A.; Liao, X.; Tong, Z.; Du, W.; Zhang, J.; Liu, X.; Liu, M. Spatial-Temporal Dynamic Evaluation of the Ecosystem Service Value from the Perspective of “Production-Living-Ecological” Spaces: A Case Study in Dongliao River Basin, China. J. Clean. Prod. 2022, 333, 130218. [Google Scholar] [CrossRef]
  22. Li, J.; Sun, W.; Li, M.; Meng, L. Coupling Coordination Degree of Production, Living and Ecological Spaces and Its Influencing Factors in the Yellow River Basin. J. Clean. Prod. 2021, 298, 126803. [Google Scholar] [CrossRef]
  23. Su, Y.; Zhang, E.; Liu, Y.; Lin, F. Land-use change and ecological environment effects on Fenhe River Basin. Arid Zone Res. 2022, 39, 968–977. [Google Scholar] [CrossRef]
  24. Yang, Y.; Bao, W.; Liu, Y. Coupling Coordination Analysis of Rural Production-Living-Ecological Space in the Beijing-Tianjin-Hebei Region. Ecol. Indic. 2020, 117, 106512. [Google Scholar] [CrossRef]
  25. Leng, A.; Wang, K.; Bai, J.; Gu, N.; Feng, R. Analyzing Sustainable Development in Chinese Cities: A Focus on Land Use Efficiency in Production-Living-Ecological Aspects. J. Clean. Prod. 2024, 448, 141461. [Google Scholar] [CrossRef]
  26. Yang, D.; Yang, Q.; Tong, Z.; Du, W.; Zhang, J. Coupling Coordination Analysis of Production, Living, and Ecological Spaces in Wetlands: A Case Study of Xianghai Wetland Nature Reserve, China. Ecol. Indic. 2024, 158, 111578. [Google Scholar] [CrossRef]
  27. Zhang, M.; Rong, L.; Li, Y.; Dang, H. Land Use Function Transformation in the Agro-Pastoral Ecotone Based on Ecological-Production-Living Spaces and Associated Eco-Environment Effects: A Case of Baotou City. Arid. Land Geogr. 2023, 46, 958–967. [Google Scholar] [CrossRef]
  28. Nan, S.; Wei, W.; Liu, C.; Zhou, J. Eco-Environmental Effects and Spatiotemporal Evolution Characteristics of Land Use Change: A Case Study of Hexi Corridor, Northwest China. Chin. J. Appl. Ecol. 2022, 33, 3055. [Google Scholar] [CrossRef]
  29. Yang, S.; Zheng, X.; Zhao, G. Spatial ecological effects of ecological-production-living spaces in the Guanzhong Plain Urban Agglomeration and influencing factors. J. Arid. Land Resour. Environ. 2023, 37, 26–35. [Google Scholar] [CrossRef]
  30. An, M.; Xie, P.; He, W.; Wang, B.; Huang, J.; Khanal, R. Spatiotemporal Change of Ecologic Environment Quality and Human Interaction Factors in Three Gorges Ecologic Economic Corridor, Based on RSEI. Ecol. Indic. 2022, 141, 109090. [Google Scholar] [CrossRef]
  31. Feng, P.; Yang, N.; Li, J. Improvement of Remote Sensing Ecological Index and Evaluation of Ecological Environment Quality in Luanhe River Basin, China. Chin. J. Appl. Ecol. 2023, 34, 3195. [Google Scholar] [CrossRef]
  32. Ma, X.; Xu, H.; Gulinar, M. Transformation of land use function and its ecological environmental effects: A case study in the Gaochang District of Turpan City. Arid Land Geogr. 2022, 45, 445–455. [Google Scholar] [CrossRef]
  33. Duo, L.; Wang, J.; Zhang, F.; Xia, Y.; Xiao, S.; He, B.-J. Assessing the Spatiotemporal Evolution and Drivers of Ecological Environment Quality Using an Enhanced Remote Sensing Ecological Index in Lanzhou City, China. Remote Sens. 2023, 15, 4704. [Google Scholar] [CrossRef]
  34. Dong, J.; Zhang, Z.; Da, X.; Zhang, W.; Feng, X. Eco-Environmental Effects of Land Use Transformation and Its Driving Forces from the Perspective of “Production-Living-Ecological” Spaces: A Case Study of Gansu Province. Acta Ecol. Sin. 2021, 41, 5919–5928. [Google Scholar] [CrossRef]
  35. Wu, Z.; Yan, Q.; Li, G. Research on the Transformation and Development of Resource Exhausted Cities; China University of Mining and Technology Press: Xuzhou, China, 2023. [Google Scholar]
  36. Zhang, X.; Luo, J.; Shi, P.; Zhou, L. Spatial-Temporal Evolution Pattern and Terrain Gradient Differentiation of Ecosystem Service Value in Zhangye, Northwest China at the Grid Scale. Chin. J. Appl. Ecol. 2020, 31, 543. [Google Scholar] [CrossRef]
  37. Li, X.; Fang, C.; Huang, J.; Mao, H. The Urban Land Use Transformations and Associated Effects on Eco-Environment in Northwest China Arid Region: A Case Study in Hexi Region, Gansu Province. Quat. Sci. 2003, 23, 280–290. [Google Scholar]
  38. Zenghui, S.; Jichang, H.; Yanan, L.; Liangyan, Y.; Lei, S.; Jiakun, Y. Effects of Large-Scale Land Consolidation Projects on Ecological Environment Quality: A Case Study of a Land Creation Project in Yan’an, China. Environ. Int. 2024, 183, 108392. [Google Scholar] [CrossRef]
  39. Zhou, X.; He, Y.; Huang, X.; Zhang, M. Topographic gradient effects of habitat quality and its response to land use change in Hubei Section of the Three Gorges Reservoir. Trans. Chin. Soc. Agric. Eng. 2021, 37, 259–267. [Google Scholar] [CrossRef]
Figure 1. Study area and geographical location (drawing review number GS (2019) 1822).
Land 13 01170 g001
Figure 2. Distribution of P-L-E Spaces on the NSTM from 1980 to 2020.
Land 13 01170 g002
Figure 3. Sankey Diagram of the Conversion of P-L-E Spaces on the NSTM. (a) Sankey Diagram from 1980 to 2000; (b) Sankey Diagram from 2000 to 2020.
Land 13 01170 g003
Figure 4. Changes in the EEQ Index of the NSTM from 1980 to 2020.
Land 13 01170 g004
Figure 5. Major land use transitions affecting EEQ and their contribution rates. (a,c) Contribution rate of factors leading to improvement in EEQ from 1980 to 2000, from 2000 to 2020; (b,d) contribution rate of factors leading to the deterioration of EEQ from 1980 to 2000, from 2000 to 2020.
Land 13 01170 g005
Figure 6. Spatial distribution of EEQ on the NSTM from 1980 to 2020.
Land 13 01170 g006
Figure 7. Spatial distribution of EEQ changes on the NSTM from 1980 to 2020.
Land 13 01170 g007
Figure 8. EEQ of different regions on the NSTM from 1980 to 2020.
Land 13 01170 g008
Figure 9. The cold and hot spot distribution of EEQ on the NSTM from 1980 to 2020.
Land 13 01170 g009
Figure 10. The cold and hot spots distribution of EEQ changes on the NSTM from 1980 to 2020.
Land 13 01170 g010
Figure 11. Terrain Distribution Index of EEQ. (ae) Terrain Distribution Index of EEQ in One to Five Terrain Gradient.
Land 13 01170 g011
Figure 12. Spatial distribution of Terrain Gradients and regions with predominant EEQ. (ac) Distribution of One Terrain Gradient in 1980, 2000, 2020; (df) distribution of Two Terrain Gradient in 1980, 2000, 2020; (gi) distribution of Three Terrain Gradient in 1980, 2000, 2020; (jl) distribution of Four Terrain Gradient in 1980, 2000, 2020; (mo) distribution of Five Terrain Gradient in 1980, 2000, 2020.
Land 13 01170 g012aLand 13 01170 g012b
Table 1. Classification of P-L-E Spaces and EEQ Index on the NSTM.
Classification of P-L-E SpacesSecondary Classification of the Land Use EEQ Index
Primary ClassificationSecondary Classification
Production SpaceAgricultural Production SpacePaddy Field, Dryland0.25
Industrial Production SpaceIndustrial and Mining, Transportation Construction Land0.15
Living SpaceUrban Living SpaceUrban Land0.2
Rural Living SpaceRural Residential Areas0.2
Ecological SpaceForest Ecological SpaceSparse Forest Land, Shrub Forest Land, Forested Land, Other Forest Land0.766
Grassland Ecological SpaceLow Coverage Grassland, Medium Coverage Grassland, High Coverage Grassland0.448
Water Ecological SpaceRiver Channels, Lakes, Reservoirs, Ponds, Permanent Glaciers and Snowfields, Beaches0.814
Other Ecological SpaceWetlands, Bare Rock and Gravel, Gobi Desert, Sandy Land, Beaches, Saline-Alkaline Land, Bare Soil, High Cold Desert0.019
Table 2. Changes of P-L-E Spaces on the NSTM.
Primary ClassificationSecondary ClassificationArea (km2)Change (km2)Dynamism (%)
198020002020S80–00S00–20K80–00K00–20
Production SpaceAgricultural Production Space36,15238,21857,748206619,5305.7151.10
Industrial Production Space224295171171141631.69480
Living SpaceUrban Living Space36,37638,51359,459213720,9465.8754.38
Rural Living Space4617991885338108673.31135.91
Ecological SpaceForest Ecological Space16722038239336635521.8817.41
Grassland Ecological Space213328374278704144133.0050.79
Water Ecological Space20,87722,47616,1461599−63307.65−28.16
Other Ecological Space207,034199,845191,395−7189−8450−3.47−4.22
Table 3. Classification standards and area proportion of EEQ on the NSTM.
Ecological Environment Quality198020002020
Number of Grid CellsProportionNumber of Grid CellsProportionNumber of Grid CellsProportion
Low-quality0.00–0.1061,01542.49%61,50842.84%63,74544.39%
Relatively low-quality0.10–0.2513,3569.30%14,1739.87%17,84212.43%
Moderate-quality0.25–0.4018,55812.92%17,55112.22%17,08811.90%
Relatively high-quality0.40–0.5540,21828.01%39,41627.45%39,50527.51%
High-quality0.55–1.0010,4437.28%10,9427.62%54103.77%
Disclaimer/Publisher’s Note: The statements, opinions and data contained in all publications are solely those of the individual author(s) and contributor(s) and not of MDPI and/or the editor(s). MDPI and/or the editor(s) disclaim responsibility for any injury to people or property resulting from any ideas, methods, instructions or products referred to in the content.

