Article

From Expansion to Shrinkage: An Assessment of the Carbon Effect from Spatial Reconfiguration of Rural Human Settlements in the Wuhan Metropolitan Area

1
Research Base for Consolidating the Chinese National Community Consciousness of Four Ministries and Commissions, South-Central Minzu University, Wuhan 430074, China
2
College of Public Administration, South-Central Minzu University, Wuhan 430074, China
3
College of Public Administration, Huazhong University of Science and Technology, Wuhan 430074, China
*
Author to whom correspondence should be addressed.
Land 2024, 13(8), 1176; https://doi.org/10.3390/land13081176
Submission received: 26 June 2024 / Revised: 28 July 2024 / Accepted: 28 July 2024 / Published: 30 July 2024
(This article belongs to the Section Land Environmental and Policy Impact Assessment)

Abstract

:
Nowadays, the reorganization of rural land-use space exhibits a dynamic process of expansion and shrinkage. Taking the Wuhan Metropolitan Area as an example, this study used the InVEST model to quantitatively assess changes in rural built-up land between 1995 and 2020 and its impact on regional carbon storage. Combined with the PLUS model, further simulations were carried out to predict the heterogeneous mechanisms of shrinkage and expansion of rural habitable space under three scenarios in 2030. The results indicate that the area of rural built-up land in the Wuhan Metropolitan Area showed an overall increasing trend, with shrinkage mainly concentrated in the Wuhan-Ezhou border, Tianmen, and southern Xiantao, while expansion displayed a decentralized point distribution. The PLUS model predicts that, in the scenario of rural built-up land expansion, a significant amount of cropland is encroached upon. This study provides a new perspective for understanding the impact of rural habitat changes on the carbon cycle. Future land management and planning should pay more attention to maintaining ecosystem services and considering the environmental effects of changes in rural built-up land layout.

1. Introduction

Environmental issues such as global warming have garnered considerable global attention [1]. Carbon emissions are a major contributor to global climate change [2,3], and the importance of land use management and emission-reduction measures is widely acknowledged [4,5]. Despite rapid urban expansion, approximately half of the world’s population still resides in rural areas [6], highlighting the ongoing importance of rural regions amidst globalization and modernization [7,8]. Therefore, it is imperative to revisit and reorganize sustainable development strategies for rural areas [9]. Rural ecological spaces play a critical role in regulating biogeochemical cycles and supporting ecosystem services [10]. Studies show that anthropogenic greenhouse gas emissions from agriculture and food production in rural areas account for 19–29% of total global emissions [11]. Moreover, rural land-use patterns and spatial configurations are significantly changing due to population migration, policy adjustments, and technological advances [12,13]. Residential areas around transportation routes are increasing and fragmenting [14]. Additionally, policy-driven comprehensive reforms of towns and villages, including village consolidation and ecological migration, have expanded human spaces in village centers while small rural settlements gradually disappear [15]. Overall, the reorganization of rural land-use space reflects a dual process of expansion and shrinkage.
China has implemented a policy of “Linkage between Urban-land Taking and Rural-land Giving” to demolish inefficient and disorderly rural settlements. However, the construction of new houses, driven by farmers’ desire for better living conditions, remains common. The phenomenon of simultaneous demolition and construction of built-up land frequently occurs in rural areas of China. New construction often takes place at the expense of cropland and forest land, while demolition leads to the conversion of existing rural construction land to other uses. These activities have resulted in several issues, including rural hollowing [16], the inactivity of rural residential bases [17], and the alteration of rural habitats [18], all of which have complex implications for carbon storage. For instance, Zhang et al. [19] reveal that aboveground carbon storage increases most significantly in the intermediate zone, which is located between two and four kilometers from rural settlements. This study suggests that as the distance from human settlements increases, the pressure to use natural resources decreases. Currently, various models, such as the InVEST model [20,21], CASA model [22], IPCC inventory method [23], and CEVSA model [24], are commonly used in carbon storage assessment studies. Among them, the InVEST model employs distributed algorithms and utilizes 3S technology, facilitating the input and analysis of spatial data. It is capable of elucidating the dynamics and trajectories of carbon storage across various plots, leading to its extensive application in diverse countries and regions, as demonstrated by Piyathilake et al. [25] and Wang et al. [26].
Land use change is a complex, dynamic system influenced by a wide range of factors. Under different environments and conditions, the intensity and mechanism of these factors vary, leading to significant differences in land use evolution patterns. Spatial simulation has become a key tool for studying land use change [27]. The PLUS model (Patch-generating Land Use Simulation model) developed by Liang et al. [28] is a representative model. It is based on a multi-type patch generation strategy, allowing for conductive simulation of land use evolution in both temporal and geographical dimensions, providing more accurate simulation results [29].
In summary, there is a notable gap in existing research. First, specific analyses of the flow of rural built-up land are lacking. The temporal transfer of land use in rural built-up areas and the source categories of new built-up land remain unclear. Second, there is insufficient research on carbon stock changes due to single land use categories, particularly those resulting from changes in rural construction land. Finally, most studies on the impact of land use activities on carbon stock adopt a comprehensive perspective, with limited exploration of the shrinkage and expansion differentiation of rural built-up land. Relevant empirical literature needs further development.
The overall goal of this study is to provide strategic recommendations for the future development of human settlement spaces in the Wuhan Metropolitan Area. The specific objectives of this paper are to:
  • Quantitatively analyze the spatial pattern of rural construction land transfers to comprehensively reflect the evolutionary stages.
  • Assess the impacts of spatial and temporal changes in rural built-up land on regional carbon stocks over time.
  • Forecast the spatial distribution of carbon stock in the Wuhan Metropolitan Area by 2030 under different scenarios of rural built-up land expansion and shrinkage.

2. Materials and Methods
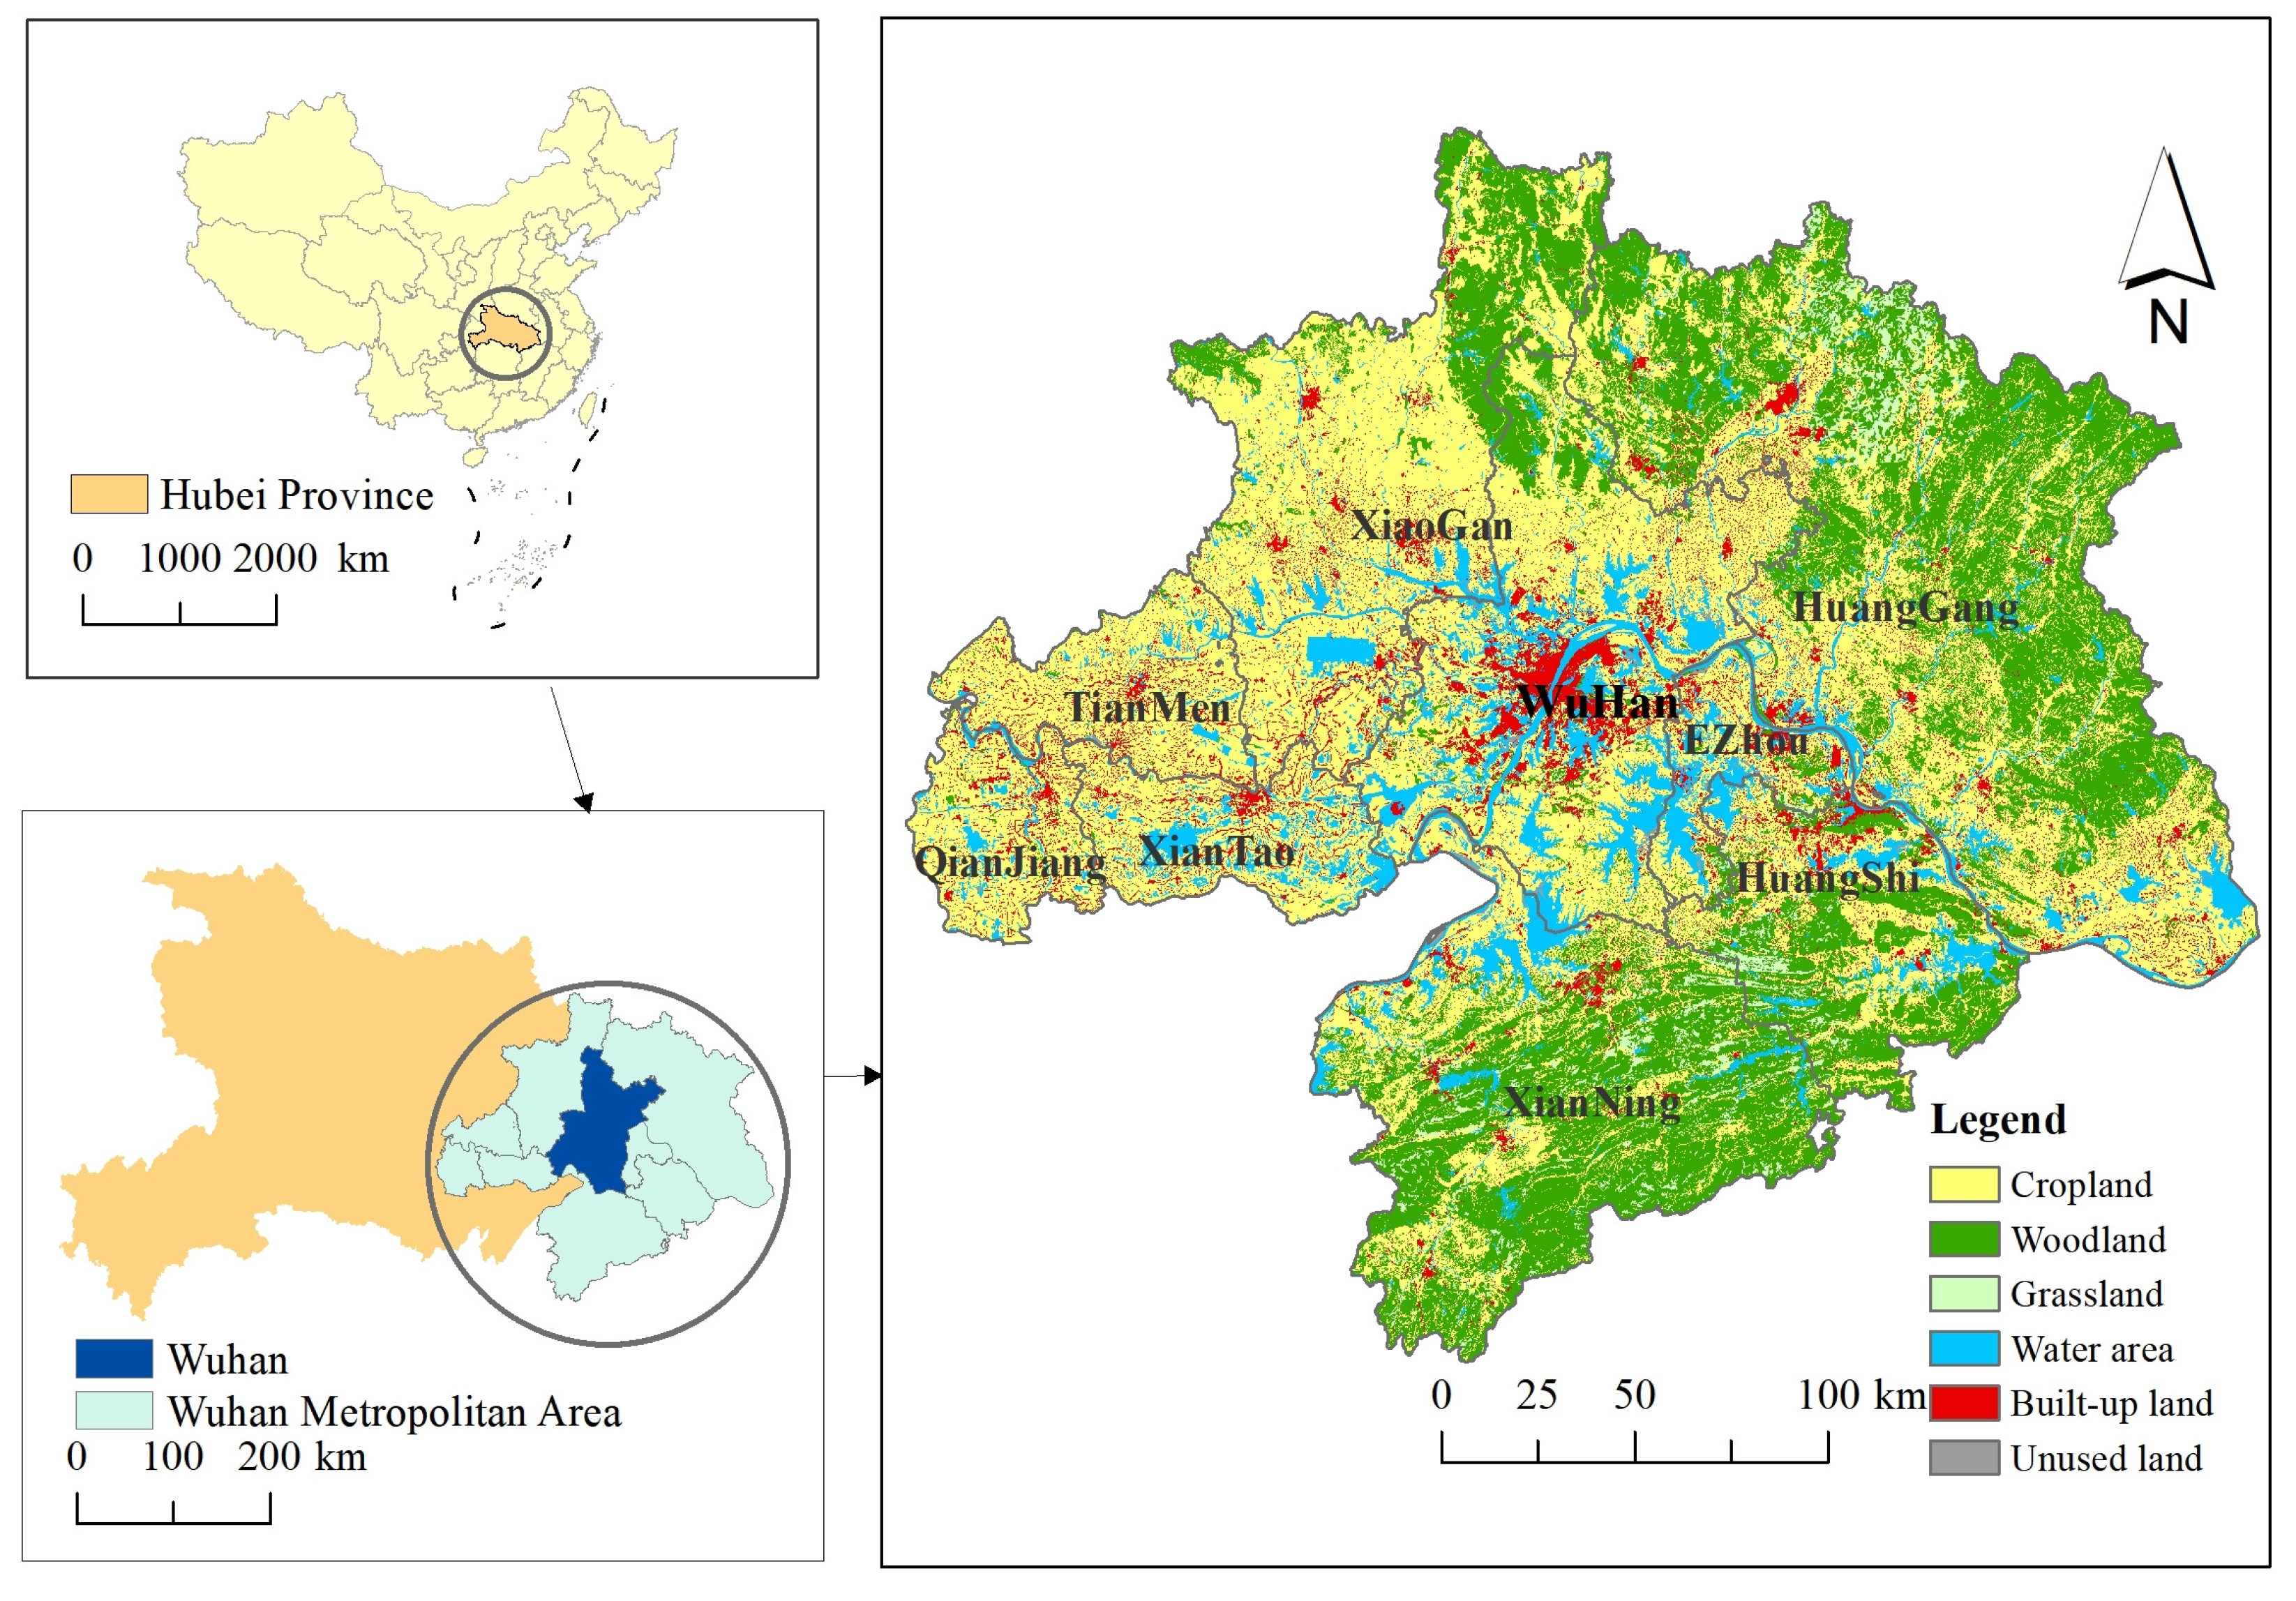
2.1. Study Area

The Wuhan Metropolitan Area, centered on Wuhan (8569.15 km2), the largest city in central China, encompasses a cluster of nine surrounding cities (Figure 1). This region has the potential to transfer industrial resources from the eastern area to the west while exploring market space and development opportunities. Given the Chinese government’s current environmental protection strategy to achieve the “dual-carbon” goal, the geographic advantages of the Wuhan Metropolitan Area position it as a critical hub. Its practices in carbon emission management and reduction are essential not only for the region’s sustainability but also as a model for other cities to emulate.

2.2. Data Acquisition and Processing

2.2.1. Urban Built-up Land and Rural Built-up Land Classification System

The rural settlement data utilized in this study were sourced from the Resource and Environmental Science Data Center of the Chinese Academy of Sciences (http://www.resdc.cn, accessed on 12 March 2023). The dataset includes six primary land types and twenty-five secondary land types, encompassing arable land, forest land, grassland, watershed, built-up land, and unutilized land. Based on Landsat series data, the integrated valuation accuracy of the secondary land use types exceeds 90% [30]. In this study, we follow the categorization and merging approach by Wang et al. [31] for the three secondary land classes within the primary class of construction land. Specifically, “urban land” and “other built-up land” are merged into urban built-up land, while “rural settlements” are classified as rural built-up land. Detailed descriptions of each land use type are provided in Table 1 [32].

2.2.2. Data Sources

Fourteen items are chosen as driving factors from five categories: climatic conditions, soil conditions, socioeconomic conditions, topographic conditions, and accessibility (Table 2).

2.3. Research Methods

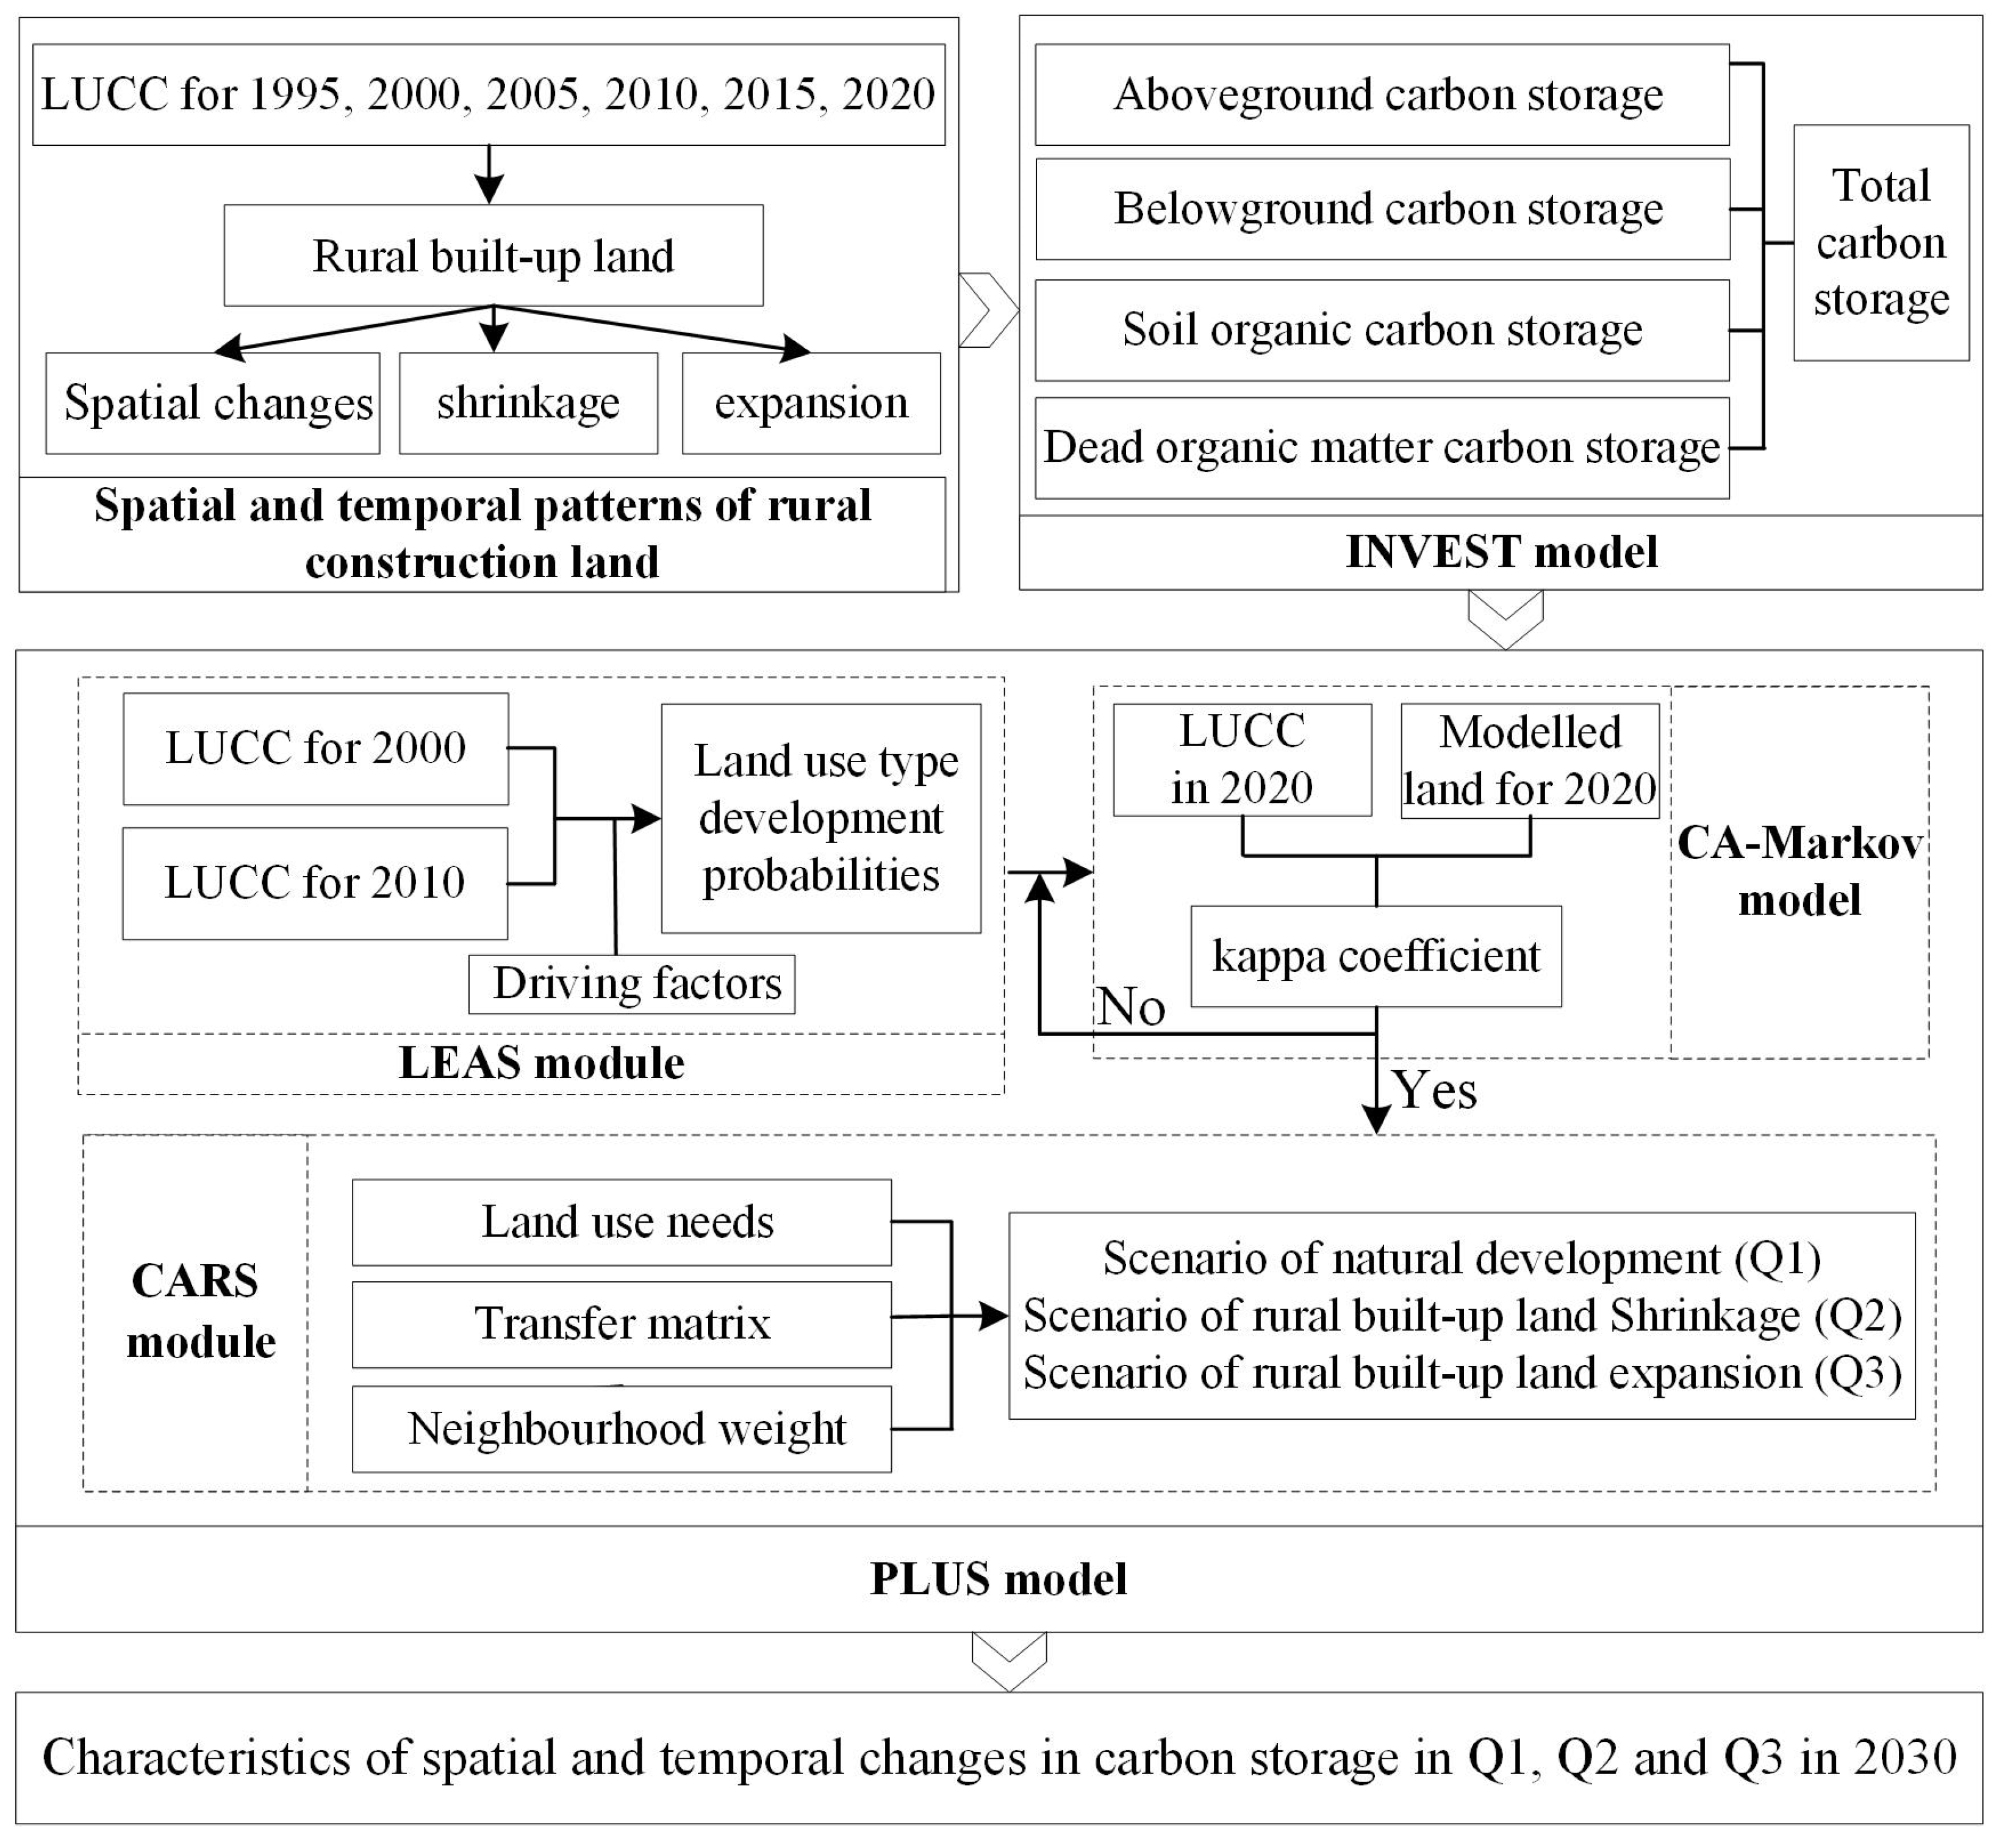
2.3.1. The Research Framework

The main research steps are as follows: First, land use data from six periods (1995, 2000, 2005, 2010, 2015, and 2020) were utilized to extract the expansion and shrinkage of rural built-up land. The rural built-up land shrinkage rate (RSR) was introduced to quantify the shrinkage of rural built-up land (Equation (1)). The rural built-up expansion rate (RER) was introduced to quantify the expansion of rural built-up land (Equation (2)).
R S R = A r e a R S R A r e a i n i t i a l × 100 %
R E R = A r e a R E R A r e a i n i t i a l × 100 %
where A r e a R S R is the area of rural built-up land reduced during the study period, A r e a R E L is the area of rural built-up land increased during the study period, and A r e a i n i t i a l is the total area of rural built-up land at the beginning of the study.
Second, the InVEST model was applied to assess the impact on carbon storage in the Wuhan Metropolitan Area. In the carbon storage module of the InVEST model, the carbon storage of an ecosystem consists of four components: above-ground carbon storage, below-ground carbon storage, soil organic matter carbon storage, and dead organic matter carbon storage [33].
Finally, fourteen driving factors were selected. Three development scenarios—natural development (Q1), rural built-up land shrinkage (Q2), and rural built-up land expansion (Q3)—were established to simulate and predict the spatial pattern of rural built-up land and the spatial distribution of carbon storage in 2030.
The research framework is shown in Figure 2.

2.3.2. InVEST Model

The InVEST model is a robust tool for quantifying, mapping, and valuing ecosystem services. The aboveground biogenic carbon pool represents the carbon content in all living plant material above the soil, including stems, branches, and leaves of vegetation such as trees, shrubs, and grasses. The below-ground biogenic carbon pool encompasses the carbon in the living root systems of plants. Dead organic carbon pools refer to the carbon content in biomass that has died, including dead trees and other organic material. The soil organic carbon pool, a crucial component of the carbon store, includes organic carbon in both organic and mineral soils [34]. The specific formula is as follows:
C t o t a l = i = 1 n A i × ( C i a b o v e + C i b e l o w + C i d e a d + C i s o i l )
where C t o t a l represents the overall carbon storage; i is the land use type; n is the number of land use types; A i is the area of land use type i ; C i a b o v e , C i b e l o w , C i d e a d , C i s o i l represent the average above-ground, below-ground, dead organic matter, and soil organic matter carbon densities of land use type i , respectively [35].
The carbon density data in this study are based on Zhang et al. [36] (Table 3).

2.3.3. Markov Chain

The Markov Chain is an effective method for modeling land use change. It predicts future land use status by using transition probability matrices. The specific formula is as follows:
S ( t + 1 ) = P i j × S t
where S t and S ( t + 1 ) are the land use status of the study area at moment t and moment t+1, respectively. P i j is the land use transfer probability matrix (i,j = 1,2,…,n).

2.3.4. PLUS Model

The PLUS model consists of three parts: accuracy test, multi-scenario simulation, and weight setting.
(1)
Accuracy verification
Land use data for the Wuhan Metropolitan Area between 2000 and 2010 were selected for analysis. The LEAS module was utilized to determine the likelihood of each type of land use shift. The simulation features of the CARS module were then combined with these data to generate land use simulation data for 2020. The specific formula for the kappa coefficient is as follows:
Kappa = p o p c p p p c
where the simulation accuracy index is denoted by Kappa, the actual simulation accuracy by p o , the required simulation accuracy under random conditions by p c , and the ideal simulation accuracy by p p . Generally, a simulation’s accuracy is considered high when the Kappa value exceeds 0.75. The simulated data were compared to the actual land-use scenario in 2020. The resulting Kappa coefficient of 0.87 confirms the model’s accuracy and reliability.
(2)
Multi-scenario settings
Three scenarios for land use in the Wuhan Metropolitan Area in 2030 were forecasted and examined. The principles of land use type conversion under different scenarios are as follows:
Natural Development Scenario (Q1): This scenario, based primarily on historical trends and current land use patterns, assumes that future development will continue to follow existing trends without additional policy interventions or changes. It provides a “no-change” expected outcome, helping to assess the need for and effectiveness of policy adjustments.
Shrinkage of Rural Built-up Land Scenario (Q2): The main purpose of shrinking rural built-up land is to achieve rational allocation and efficient utilization of land resources. To prevent disorderly rural expansion, the layout and utilization efficiency of existing construction land should be optimized. Additionally, to avoid exceeding the red line of converting arable land to construction land, the flow of arable land is strictly limited. Therefore, this scenario increases the probability of transferring rural built-up land to cropland, forest land, water surface, and urban built-up land by 40%, while decreasing the probability of transferring cropland, forest land, water surface, and urban built-up land to rural built-up land by 40%.
Expansion of Rural Built-up Land Scenario (Q3): The primary purpose of expanding rural built-up land is to support the development of industry and residential space in rural areas based on historical development trends. The Opinions of the CPC Central Committee and the State Council on Comprehensively Promoting Rural Revitalization and Accelerating Agricultural and Rural Modernization clearly propose exploring the implementation of a system for market entry of land for rural collectively operated construction. Therefore, this scenario reduces the probability of rural construction land flow to cropland, forest land, grassland, waters, and urban construction land by 40%, while increasing the probability of cropland, forest land, grassland, waters, and urban construction land flow by 40%.
(3)
Weight setting.
All land kinds can be converted into one another in this study, and all of the matrices are 1. In light of He et al. [37], neighborhood weights are established, and values are assigned using the 2010–2020 normalized index. The specific formula is as follows:
W i = Δ T A i Δ T A m i n Δ T A m a x Δ T A m i n
where W i is the neighborhood weight of class land use type i . Δ T A i is the amount of change in land type i . Δ T A m a x and Δ T A m i n are the maximum and minimum values of change in land type i , respectively. However, for some types of land, this weight setting approach will result in zero weight; hence, this study manually alters the zero value to 0.1 to better reflect the actual circumstance.

3. Results and Analysis

3.1. Analysis of Spatial and Temporal Patterns of Rural Built-up Land

3.1.1. Analysis of the Overall Pattern of Rural Built-up Land

The rural built-up land area in the Wuhan Metropolitan Area increased from 215,067 ha in 1995 to 223,218 ha in 2020, indicating a general growth trend. However, the quantity of rural built-up land decreased in 2010, contrasting with prior and subsequent years (Figure 3). During this period, rural built-up land was primarily transferred to arable land and urban built-up land, with transfer areas of 8702 ha and 4026 ha, respectively. Additionally, most of the new rural built-up land originated from arable land, amounting to 12,029 ha, demonstrating a dynamic two-way exchange between arable land and rural built-up land. Conversely, the conversion of rural built-up land to urban built-up land is a one-way process. Overall, the area of land compensation is insufficient to balance the outflow of rural construction land.
With the advancement of the “Three Modernizations” (Industrialization, Urbanization, and Informatization) in the Wuhan Metropolitan Area, the total scale of rural built-up land has expanded to meet the demand for public service facilities, residential housing, and industrial zones. However, according to the Wuhan Overall Land Use Plan (2006–2020), the utilization efficiency of rural construction land in 2005 was comparatively low, and the per capita area of rural residential land exceeded the national standard [38]. Consequently, from 2005 to 2010, the government implemented stricter control over rural construction land. Through the remediation of inefficient and abandoned construction land and optimization of the land use structure, the 2010 target of “reducing the quantity but not the quality” of rural construction land was achieved. The primary cause of changes in rural construction land is its conversion to agriculture. As illustrated in Figure 4, changes in rural built-up land are especially concentrated in the cities of Xiantao, Qianjiang, and Tianmen, with significant concentration at the border between Wuhan and neighboring cities. In the main city of Wuhan, there is a noticeable hollow area, indicating a concentration of urban built-up land with no potential for expansion or shrinkage of rural built-up land. Additionally, the shrinkage of rural built-up land is more aggregated, while its expansion is significantly smaller and shows a dispersed point distribution within the study area.

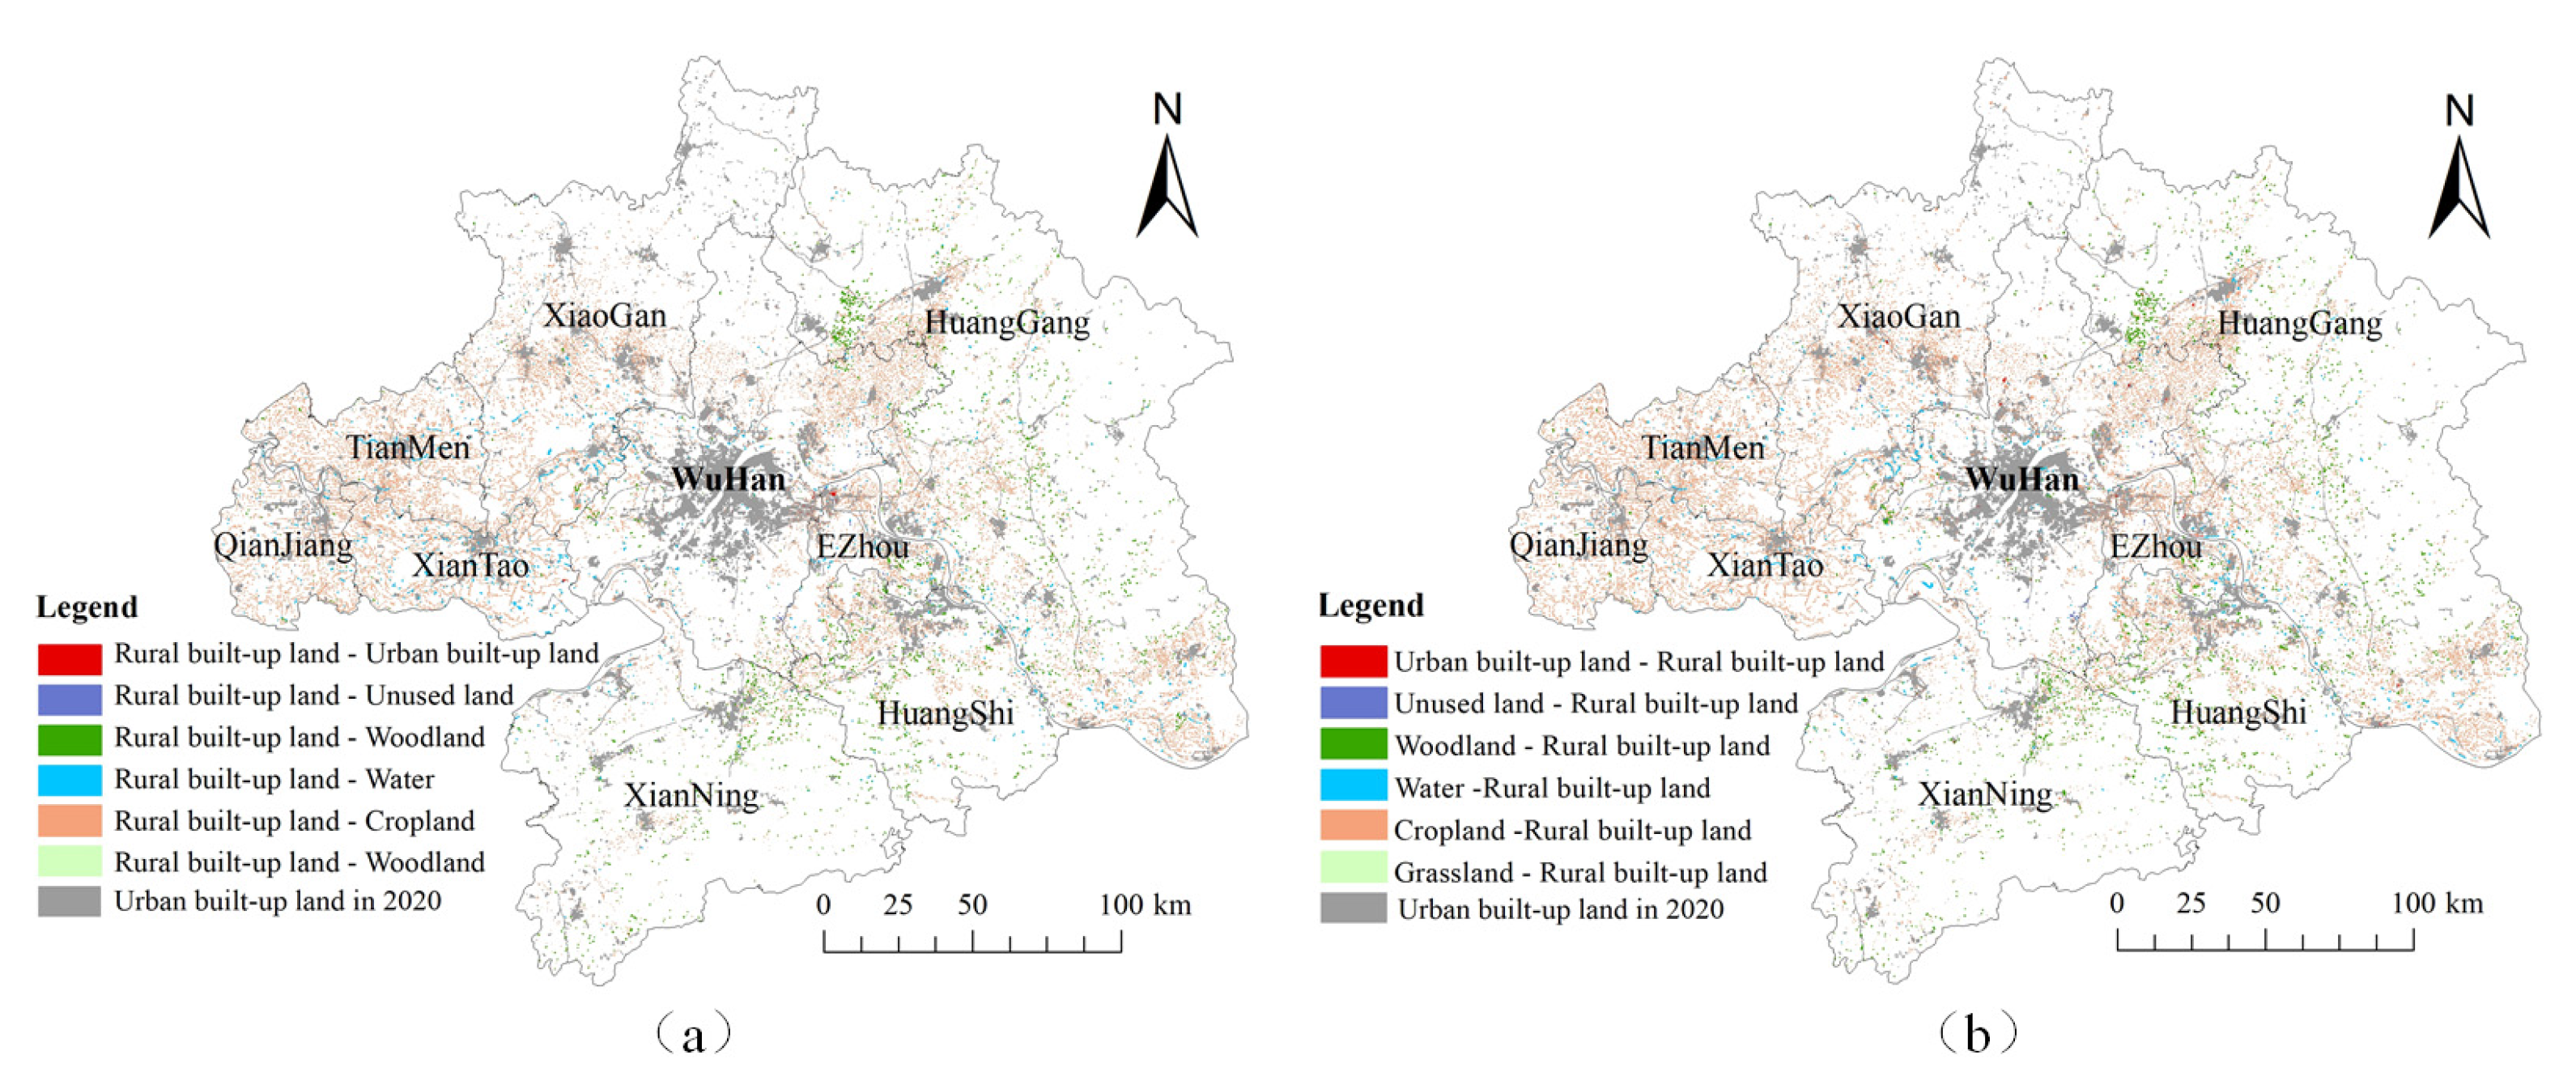
3.1.2. Analysis of the Temporal Pattern of Shrinkage of Rural Built-up Land

Overall, the RSR in the Wuhan Metropolitan Area from 1995 to 2020 was 5.08%. Cropland, urban built-up land, water, and woodland accounted for the majority of this loss, with percentages of 78.10%, 9.17%, 6.85%, and 5.36%, respectively. Grassland and unused land accounted for smaller percentages of rural built-up land loss, at 0.29% and 0.23%, respectively (Table 4).
Over time, the RSR during different periods exhibited a fluctuating trend of high-low-high-low-high. This means that after an increase in rural built-up land transfers, a decrease followed in the subsequent period. From 2000 to 2005, only 428 ha of rural built-up land were transferred out, resulting in an RSR of 0.20%, the lowest value among all periods. In contrast, from 2005 to 2010, 14,597 ha of rural built-up land were transferred, yielding the highest RSR of 6.68%. The second highest volume of transfers occurred from 2015 to 2020, with 12,240 hectares transferred, significantly higher than other years. This phenomenon can be attributed to the increased supply of land due to the out-migration of rural built-up land, which subsequently lowered land prices. When land prices fall to a certain level, farmers may choose to retain their land rather than transfer it out, leading to a reduction in the amount of rural built-up land transferred in the next period. Eventually, as land values rise again, farmers may be encouraged to sell land once more, initiating a cycle of meandering upward movement.

3.1.3. Analysis of the Temporal Pattern of Rural Built-up Land Expansion

Cropland, urban built-up land, woodland, and water are the primary sources of supplemental rural built-up land, accounting for 87.16%, 4.74%, 4.59%, and 3.05% of the area’s increase, respectively. Grassland and unused land contributed less, at 0.33% and 0.13%, respectively. In terms of periods, the RER was highest from 2015 to 2020 at 6.92%. The period from 2005 to 2010 witnessed the second highest RER at 6.48%, consistent with the RSR results (Table 5). The shrinkage and expansion of rural built-up land tend to occur simultaneously.
While supporting the development of rural industries, China emphasizes the principles of food security, ecological safety, and standardized land use. This means that in promoting rural development, it is essential to ensure that permanent basic farmland is not occupied, the scale of built-up land is not exceeded, and ecological environments are not damaged. Under this policy orientation, the increase in rural built-up land needs to be achieved by optimizing and adjusting existing land resources rather than simply expanding the land area.

3.2. Impact of Spatial Evolution of Rural Built-up on Carbon Storages

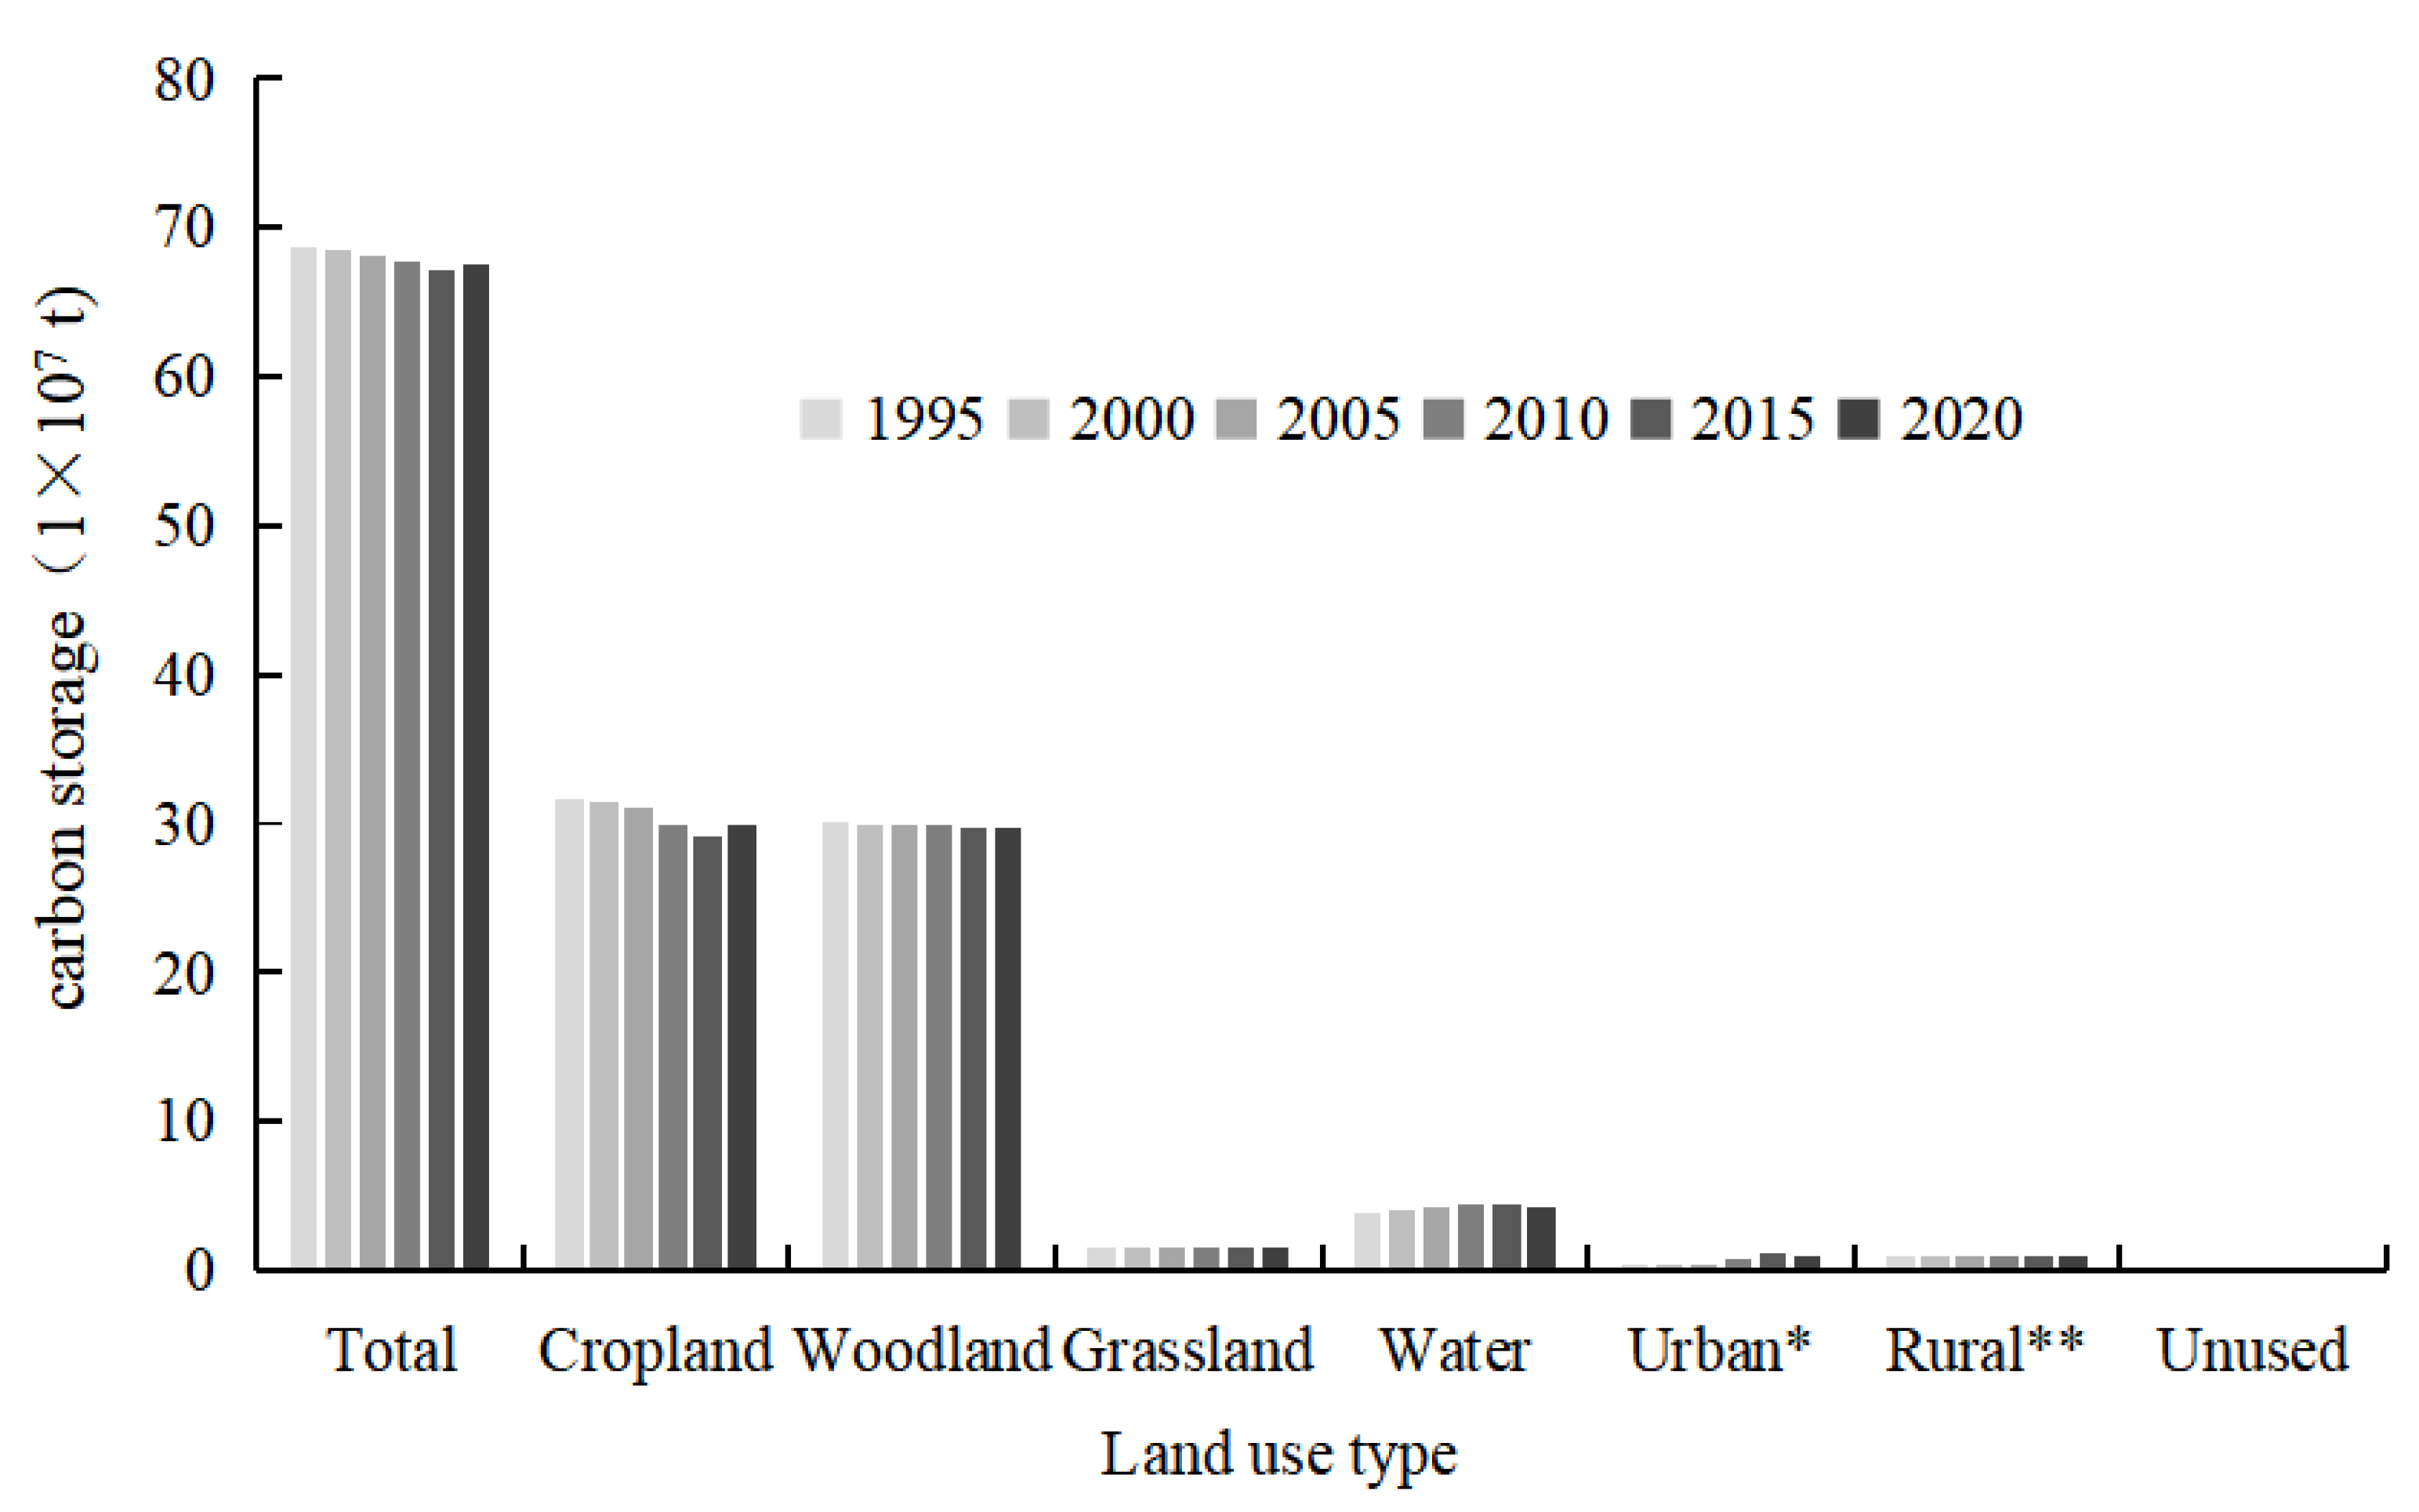
3.2.1. Value of Carbon Storage Changes Due to Overall Land-Use Change

All types of land areas have changed to varying degrees, leading to a fluctuating trend of carbon storage decreasing and then briefly recovering (Figure 5). Overall, carbon storage decreased by a total of 1.262 × 10⁷ tons over the 25 years. During the periods 1995–2000, 2000–2005, 2005–2010, and 2010–2015, carbon stocks decreased by 0.412%, 0.318%, 0.778%, and 0.755%, respectively. However, carbon storage increased by 0.415% during 2015–2020. Cropland and woodland accounted for the highest carbon storage, with a total share of more than 85% in every period.
This study isolates rural built-up land as a separate land category to analyze the changes in carbon storage due to changes in rural built-up land (Table 6). The carbon stock showed a negative change in all periods except 2015–2020. In 1995–2000 and 2000–2005, changes in carbon stocks due to the alteration of rural construction land were −1.41 × 10⁵ tons and −0.63 × 10⁵ tons, respectively. During 2005–2010, 2010–2015, and 2015–2020, carbon storage showed a sustained decline after a brief rebound. Previous analysis shows that the area of rural construction land, which is the least carbon-intensive, decreased from 2005 to 2010, but the change in total carbon storage also had a negative value. This is because during this period, in addition to changes in rural built-up land, other land types also underwent inter-conversion, such as the conversion of woodland to grassland. Therefore, the total land use carbon stocks also declined. In land planning and management, the carbon storage capacity of various types of land needs to be considered in an integrated manner to achieve better carbon management.

3.2.2. Value of Changes in Carbon Storages Due to Shrinkage of Rural Built-up Land

After obtaining the raster maps of total carbon stock for different years using the InVEST model, raster subtraction operations were performed in ARCGIS 10.8 for adjacent years. The carbon stock changes caused by the transfer out (shrinkage) and transfer in (expansion) of rural built-up land are shown in Table 7. Since rural built-up land has significantly lower carbon intensity, carbon stocks from shrinkage consistently show a positive increase.
With 84.55% of the total, the conversion of rural built-up area to farmland was the main driver of the change in carbon stock between 1995 and 2020. Woodland followed with a share of 12.08%. The carbon stock increased by just 0.36% due to the conversion of rural built-up area to grassland. The reduction in built-up land in rural areas caused a peak in the growth of carbon storage from 2015 to 2020, totaling about 713,726 tons. In terms of land types, the conversion of rural built-up area to agriculture, woods, and grassland resulted in minimal carbon stock levels between 2000 and 2005. Meanwhile, the value of carbon stock changes due to the conversion to watershed and unutilized land showed minimum values in 2010–2015.

3.2.3. Value of Carbon Storage Changes Due to Expansion of Rural Built-up Land

From 1995 to 2020, the conversion of cropland to rural built-up land caused the largest change in carbon stocks, with a total share of 88.66%. This was followed by woodland, with a share of 9.70%. Water and grassland had smaller shares of 1.28% and 0.39%, respectively (Table 8).
From 2000 to 2005, the value of carbon loss caused by the expansion of rural built-up land was the lowest, with a change of −69,870 tons. This was mainly due to the small area of cropland and woodland being converted to built-up land. From 2005 to 2010, besides cropland and woodland, water became the primary source of new rural built-up land expansion. The expansion of rural construction land often involved filling in wetlands, rivers, and lakes, impairing key ecosystem services. Wetlands absorb carbon dioxide, regulate climate, and provide flood control. As an important freshwater resource, wetlands are critical to the regional water cycle and water supply. Landfilling wetlands for the construction of rural settlements weakens natural barriers and may exacerbate the risk of extreme weather and water scarcity, posing a long-term threat to ecological balance and human well-being. The highest carbon loss occurred from 2005 to 2010, with a change of −867,992 tons. During this period, the carbon loss caused by the conversion of woodland into built-up land rose more than tenfold compared to the previous period. Transfers away from rural built-up areas primarily involved converting these areas into croplands, bodies of water, and other types of land known for their lower carbon density values. Consequently, this led to a significant decline in overall carbon storage. The period from 2010 to 2015 witnessed the least carbon loss when grasslands were transformed into rural built-up areas, with a loss of 339 tons. Furthermore, the increase in rural built-up land from 2015 to 2020 resulted in a significant decline in carbon storage of −665,869 tons. This considerable drop was mostly caused by the conversion of these areas into croplands, woods, and water bodies.

3.3. Land Use Modeling and Carbon Storage Projections under Different Scenarios for 2030

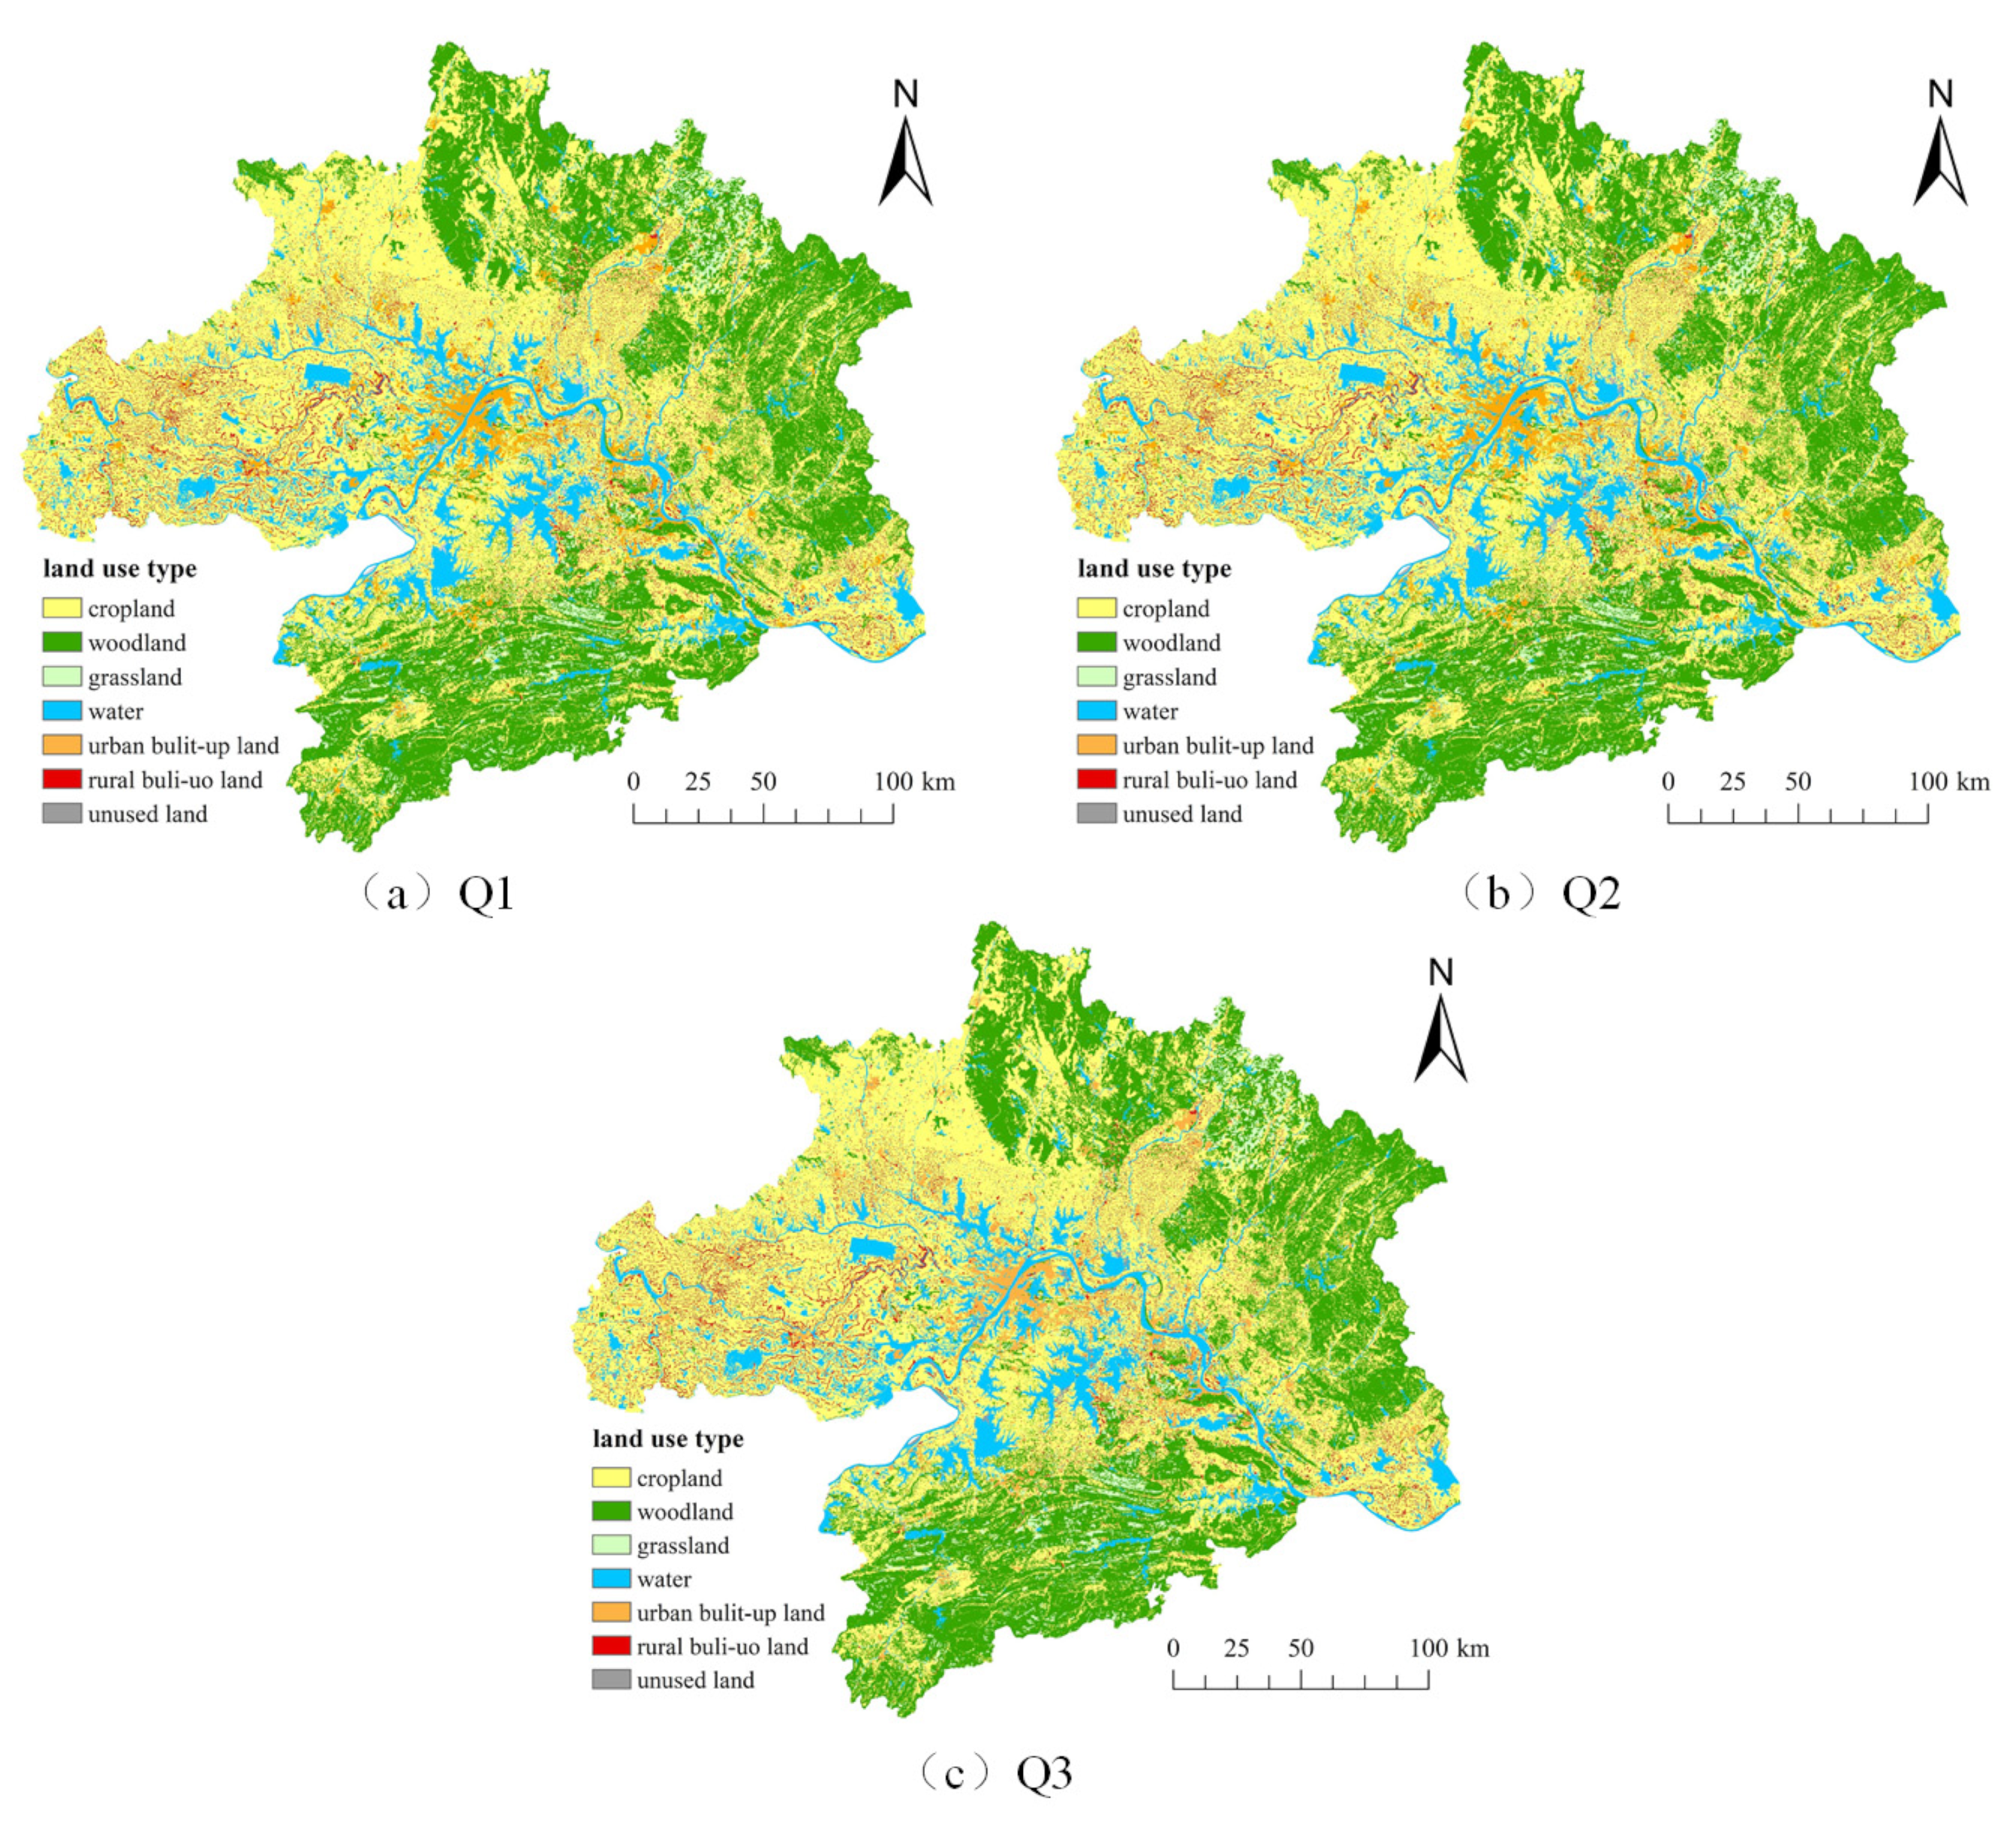
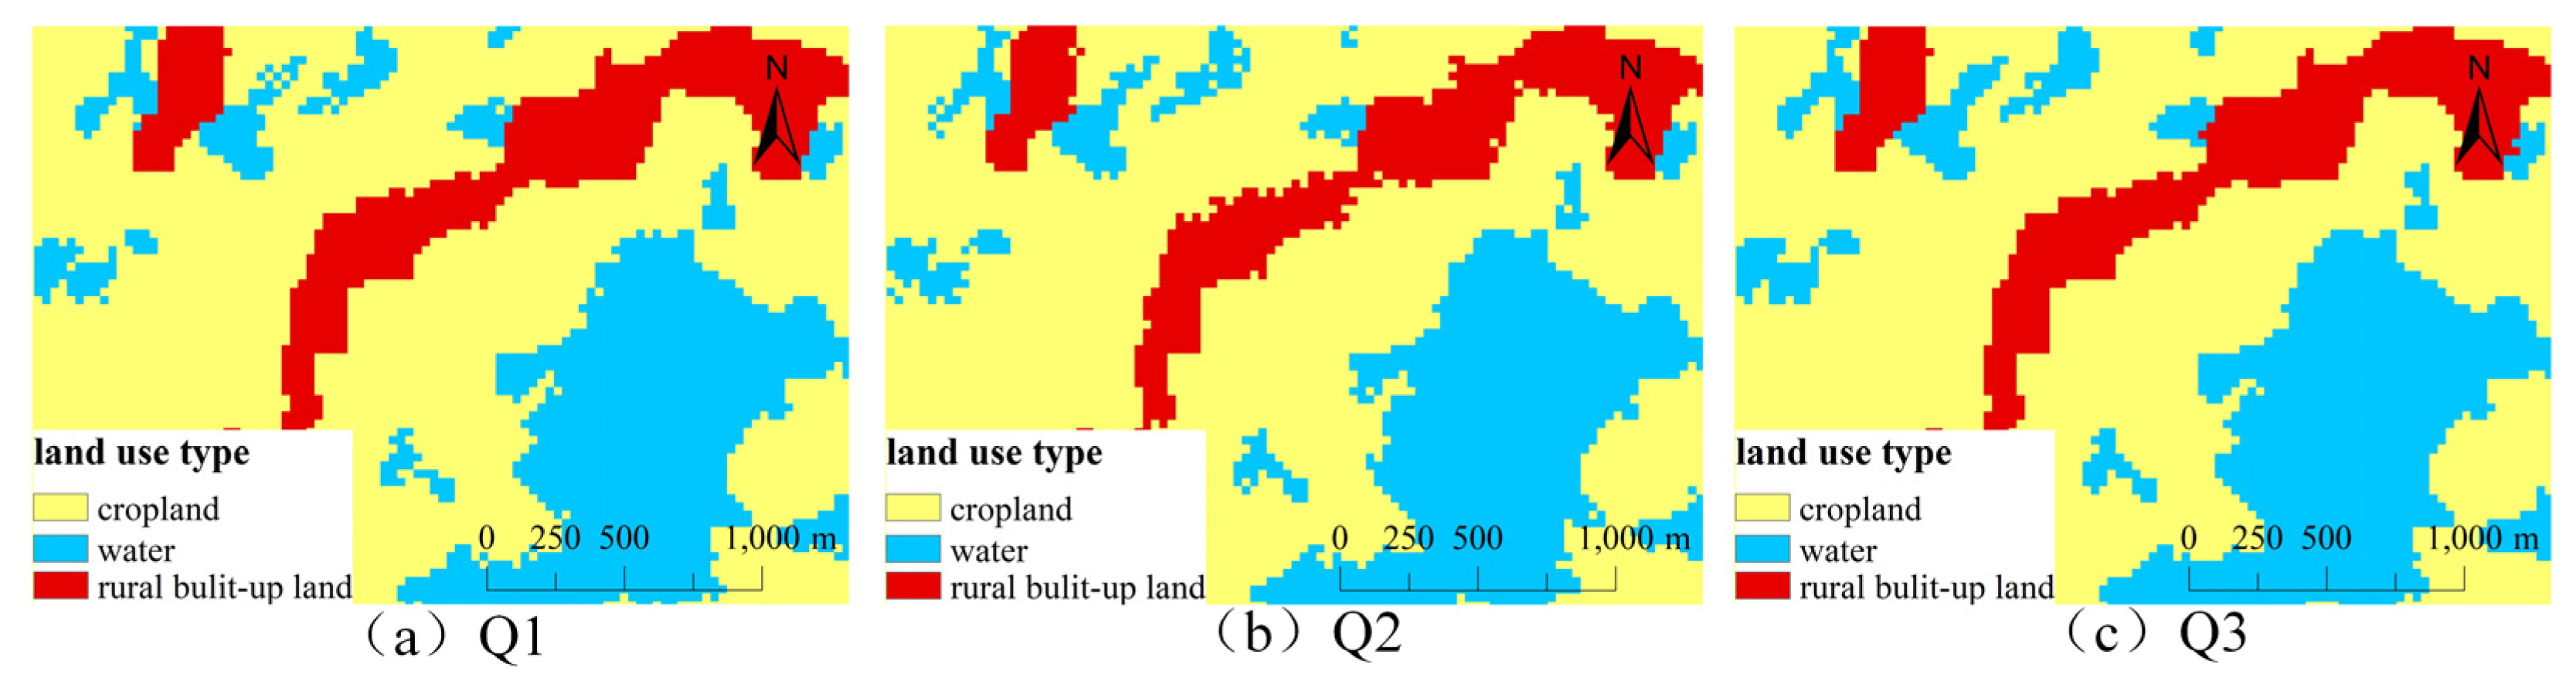
3.3.1. Simulation of Land-Use Change under Different Scenarios

Based on the land use data from 2000 and 2010 for the Wuhan Metropolitan Area, the two datasets were initially overlaid to identify modified raster cells. These cells were then fed into the LEAS module along with the driver folder. Integrating this with the simulation capabilities of the CARS module yielded the land use simulation data for the year 2020. These simulation results were then compared to actual land use data for 2020 (Figure 6).
Three potential scenarios for the year 2030 were also simulated (Figure 7 and Table 9). Under Q1, each land category is transformed according to the original transfer probability. Cropland and woodland are projected to increase by 0.153% and 0.188%, respectively. Grassland, water, urban built-up land, and rural built-up land are expected to decrease by 0.013%, 0.146%, 0.195%, and 0.008%, respectively. Rural built-up land will primarily be transferred to cropland, with a total decrease of 437 hectares. Much of this decrease is concentrated in three county-level cities under provincial jurisdiction. This phenomenon may be attributed to local governments’ comprehensive remediation and restoration plans to effectively respond to the hollowing out of rural areas caused by population exodus. As a result, inefficient or abandoned rural built-up land has been substantially converted into cropland. Under Q2, the trend of decreasing total rural built-up land area intensifies, with a total reduction of 5849 hectares. The area of cropland increases significantly, rising by 17,157 hectares. The area of woodland decreases slightly but remains more stable, indicating that ecological land has been protected. Under Q3, the total rural built-up land area increases by 181 hectares. The magnitude of change in cropland is the most prominent among all land changes. This trend indicates that rural built-up land remediation activities have played a key role in optimizing land-use structures and improving food security.
This study provides a comparative analysis of a specific land parcel within the Wuhan Metropolitan Area under different scenarios (Figure 8). According to the Q2 and Q3 simulation results, the dynamic changes in rural built-up land do not occur randomly but follow a certain spatial pattern. From a macroscopic perspective, the expansion of rural construction land shows a tendency to agglomerate on a large scale. Due to the concentration of economic activities and better infrastructure, new built-up land tends to expand around existing built-up areas, forming continuous zones of built-up land. From a micro perspective, different villages or townships are often affected by topography, land ownership distribution, and rural road layout. Farmers will develop land according to their actual needs and land location. In short, most dynamic changes occur around the original homesteads, forming a tendency of clustering in large areas and dispersing in small areas. Currently, there is a mismatch between the ideal goals of land use planning and the real needs of farmers’ individual land use choices. On the one hand, planners aim to achieve intensive use of land resources and ecological protection by merging villages and optimizing the layout. On the other hand, farmers make land-use decisions based on their life and livelihood needs that align with their own interests. This contradiction not only reduces the effectiveness of land use planning but also may negatively impact regional carbon stocks.

3.3.2. Simulation of Carbon Storage Distribution under Different Scenarios

The spatial distribution of carbon in the Wuhan Metropolitan Area in 2030 changes little compared with 2020 under the three different projection scenarios (Figure 9). High values of carbon stocks are clustered in the three densely forested cities: Huanggang, Huangshi, and Xianning. The carbon storage of land resources under Q1 is 6755.94 × 105 tons, which increases by 0.241% compared with 2020. The carbon storage of rural built-up land decreased by 0.196%. Under Q3, the value of carbon storage in land resources is 6753.62 × 105 tons, and the carbon storage in rural construction land rises by 0.081% (Table 10). The growth and loss of carbon storage in land resources show a specific geographical distribution pattern: high values are more dispersed and sporadically distributed on the fringes of the Wuhan Metropolitan Area, forming a hollow pattern with high values surrounding a lower center. Meanwhile, areas of high carbon storage loss are concentrated in the main urban area. Due to urbanization and industrialization pressures, the main urban areas have experienced large-scale land development and utilization changes. The original natural land surface has been replaced by buildings, roads, and other infrastructures, leading to the destruction of ecosystems and the decline of carbon storage capacity. Overall, radiating outward from the main urban area of Wuhan, the carbon stock of land resources has gradually increased, showing a sporadic point-like distribution. The increase is lower in the east and larger in the west, with an overall arrow-shaped distribution, reflecting the gradient change and uneven growth from the city center to the periphery.
Under Q2, the carbon storage value of land resources is 6757.87 × 105 tons, which increased by 0.269% compared with 2020, showing significantly better performance than the other two scenarios. The carbon stock of rural built-up land decreased by 2.620%. Rural built-up land was substantially converted to cropland, enhancing the carbon sink function of ecosystems and thereby increasing regional ecosystem carbon stocks. In some hilly areas, woodlands and grasslands that might have been converted to cropland have been preserved, as the demand for cropland has been met by the transfer of rural construction land. As a result, these ecosystems have maintained or even enhanced their carbon sequestration capacity due to reduced anthropogenic disturbances, creating high carbon storage areas. This phenomenon shows that a single-dimensional land policy can produce different environmental effects in different regions. When formulating land management policies, the unique ecological characteristics of each region and the specific requirements of sustainable development must be fully considered [39]. Only by ensuring that land resources are rationally developed and utilized can the ecological environment be comprehensively protected [40].

4. Discussion

4.1. Analysis of Factors Related to Changes in Land Use Types

The contribution of relevant factors to changes in different land use types was obtained using the PLUS model (Table 11). Although the degree of influence varies, the factors most associated with changes in key ecological sites are temperature, precipitation, and population density. For grasslands, DEM is also a significant factor. First, temperature directly affects the growing conditions of plants in ecosystems and the ecological structure of water, which in turn influences the persistence of woodland cover and changes in aquatic habitats. Second, the amount and distribution of precipitation profoundly impact all types of ecological land use by influencing agricultural irrigation, the frequency of woodland fires, and the health of grasslands. Third, aside from major ecological land use, population density is closely related to changes in urban built-up land, with a contribution rate of 0.233. As the population concentrates, the demand for housing, commercial space, industrial areas, and public service facilities increases, driving the city to expand to the periphery or reorganize its internal space.
The top three relevant factors for changes in rural built-up land are nighttime lighting, precipitation, and population density. The least contributing factors are distance to branch road, distance to secondary road, and slope orientation. Areas with more intense nighttime lighting tend to have a higher concentration of human activity, resulting in a greater demand for building land. Additionally, transportation accessibility has the least relevance to land use change among all the factors involved. Improvements in transportation infrastructure often respond to land development activities that have already occurred or are anticipated, and their correlation with land use change may take a longer period to become apparent.

4.2. Comparison with Existing Research

Existing research on the impact of land use changes on carbon storage primarily focuses on comprehensive and macro-level analyses. For example, Schulp et al. [41] investigated the effects of land use changes on ecosystem services across the European Union. Similarly, Sil et al. [42] assessed carbon storage dynamics under different land use scenarios in Portugal. While these studies provide valuable insights, they often lack a specific focus on the unique role of rural built-up land in carbon storage dynamics.
Moreover, research on the spatial heterogeneity of carbon storage changes due to the expansion and shrinkage of rural settlements remains limited. Li et al. [21] projected the regional distribution characteristics of land use/land cover carbon stocks in Liaoning Province but assessed them in terms of overall change. Wang et al. [38] investigated the effects of land use changes on carbon storage in the Pinggu District of Beijing but did not specifically target rural built-up land. Focusing on urban areas, Li et al. [43] examined the potential impact of urban growth on carbon stocks. Although Ye et al. [6] addressed the impact of rural built-up land changes on ecological land carbon stocks, their analysis was conducted mainly from the perspective of rural settlement expansion and lacked the exploration of shrinkage.
This study aims to fill these research gaps by focusing on the specific impacts of rural built-up land changes on carbon storage in the Wuhan Metropolitan Area. By distinguishing between the expansion and shrinkage of rural settlements and quantifying their effects on carbon storage using the InVEST model, this research provides a more nuanced understanding of the role of rural built-up land in carbon dynamics. Furthermore, the application of the PLUS model to simulate future scenarios of rural settlement changes and their impacts on carbon storage offers valuable insights for land use planning and policy-making in the region.

4.3. Policy Implications

Based on the findings of this study, several policy implications are drawn to guide future land management and planning practices in the Wuhan Metropolitan Area and serve as a reference for other regions undergoing similar transformations.
(1)
In response to the ongoing increase of rural constructed land and its impact on ecosystem carbon storage, the government should improve rural built-up land transfer management, optimize the transfer mechanism, and encourage reasonable transfers to avoid land idleness and waste. Additionally, it should intensify ecological restoration activities in critical areas such as the Wu-E border, Tianmen, and southern Xiantao to enhance regional carbon storage capacity and promote the recovery and expansion of ecosystem carbon stocks.
(2)
The government should promote a shift in land-use planning to a “demand-oriented” approach. The actual needs and interests of farmers should be fully considered and respected in the planning process to ensure that planning programs are closely integrated with the production and life of farmers. By enhancing the flexibility and operability of planning, the planning objectives will be closer to the actual situation of farmers, thus improving the implementation and acceptance of planning and reducing negative impacts on regional carbon stocks.
(3)
To strengthen the management of carbon stock in land resources, the government should establish a carbon stock monitoring system to regularly assess and report changes in carbon stock. At the same time, it should implement differentiated carbon stock protection policies based on the geographical distribution characteristics of carbon stock changes. Through policy guidance and market mechanisms, the rational flow and optimal allocation of factors of production within the region should be promoted to achieve the harmonious unity of economic, social, and ecological benefits.

5. Conclusions

This study analyzes the changes in rural built-up land in the Wuhan Metropolitan Area over six equal intervals: 1995, 2000, 2005, 2010, 2015, and 2020. Assuming the accuracy of PLUS simulations has been validated, this study utilizes fourteen driving factors to simulate three scenarios: natural development, shrinkage of rural built-up land, and expansion of rural built-up land.
The main conclusions are as follows:
(1)
The area of rural built-up land generally increased between 1995 and 2020. However, unlike previous years, the area decreased in 2010. Compared to the expansion of rural built-up land, the shrinkage is more concentrated, primarily at the Wu-E border, Tianmen, and southern Xiantao. The carbon stock of terrestrial ecosystems in the Wuhan urban area showed a cyclical pattern of continuous decline followed by brief recovery.
(2)
According to the PLUS model’s prediction results, under the rural construction land expansion scenario, a significant amount of arable land is encroached upon. Additionally, most changes in rural built-up land occur around the original home base, forming a pattern of large-scale agglomeration and small-scale dislocation.
(3)
In the natural development scenario, the carbon storage value of land resources is 6753.62 × 105 tons. The total carbon storage under the rural built-up land shrinkage scenario surpasses that of the other two scenarios. Concurrently, the alteration in carbon storage across land resources exhibits a distinct geographical distribution pattern, characterized by a gradient radiating from the primary urban zone of Wuhan City and demonstrating disparate growth rates in various directions.
Future research directions include:
(1)
Monitoring changes in land cover status through high-resolution, multi-temporal remote sensing data, and establishing more accurate and comprehensive simulation and prediction models of land use changes.
(2)
Studying the changing patterns of rural built-up land to deeply explore and understand the phenomena of expansion and contraction in rural built-up land.
(3)
Combining remote sensing data with other data sources to assess the impact of these changes on functions such as the carbon cycle, biodiversity, and soil and water conservation.

Author Contributions

Conceptualization, Y.R.; methodology, Y.R.; software, Y.R.; validation, Y.R. and C.W.; formal analysis, C.W.; resources, Q.H.; writing—original draft preparation, C.W.; writing—review and editing, Y.R., C.W. and Q.H. All authors have read and agreed to the published version of the manuscript.

Funding

This research was supported by the Fund for Academic Innovation Teams of South-Central Minzu University (CSZ24001), Fundamental Research Funds for the Central Universities of South-Central Minzu University (XTS24023), National Natural Science Foundation of China (42371424), Natural Science Foundation of Hubei Province (2023AFB630), Enshi Science and Technology Program (D20220039), Bidding Project for the Research Base on Consolidating Chinese National Community Consciousness of Four Ministries and Commissions at South-Central Minzu University (JDY23013).

Institutional Review Board Statement

Not applicable.

Informed Consent Statement

Not applicable.

Data Availability Statement

The data presented in this study are available on request from the corresponding author.

Conflicts of Interest

The authors declare no conflicts of interest.

References

  1. Abbass, K.; Qasim, M.Z.; Song, H. A review of the global climate change impacts, adaptation, and sustainable mitigation measures. Environ. Sci. Pollut. Res. 2022, 29, 42539–42559. [Google Scholar] [CrossRef] [PubMed]
  2. Matthews, H.D.; Gillett, N.P.; Stott, P.A.; Zickfeld, K. The proportionality of global warming to cumulative carbon emissions. Nature 2009, 459, 829–832. [Google Scholar] [CrossRef] [PubMed]
  3. Udara Willhelm Abeydeera, L.H.; Wadu Mesthrige, J.; Samarasinghalage, T.I. Global research on carbon emissions: A scientometric review. Sustainability 2019, 11, 3972. [Google Scholar] [CrossRef]
  4. Miles, L.; Kapos, V. Reducing greenhouse gas emissions from deforestation and forest degradation: Global land-use implications. Science 2008, 320, 1454–1455. [Google Scholar] [CrossRef] [PubMed]
  5. Jurjonas, M.; Seekamp, E. Balancing carbon dioxide: A case study of forest preservation, out-migration, and afforestation in the Pueblos Mancomunados of Oaxaca, Mexico. J. Sustain. For. 2019, 38, 697–714. [Google Scholar] [CrossRef]
  6. Ye, X.; Chuai, X. Have rural settlement changes harmed ecosystem carbon in China? Appl. Geogr. 2023, 153, 102917. [Google Scholar] [CrossRef]
  7. Vercher, N.; Bosworth, G.; Esparcia, J. Developing a framework for radical and incremental social innovation in rural areas. J. Rural Stud. 2023, 99, 233–242. [Google Scholar] [CrossRef]
  8. Jiang, C.; Li, J.; Liu, J. Does urbanization affect the gap between urban and rural areas? Evidence from China. Socio-Econ. Plan. Sci. 2022, 82, 101271. [Google Scholar] [CrossRef]
  9. Wang, Y.; Liu, Y.; Li, Y.; Li, T. The spatio-temporal patterns of urban–rural development transformation in China since 1990. Habitat Int. 2016, 53, 178–187. [Google Scholar] [CrossRef]
  10. Duan, Y.; Wang, H.; Huang, A.; Xu, Y.; Lu, L.; Ji, Z. Identification and spatial-temporal evolution of rural “production-living-ecological” space from the perspective of villagers’ behavior—A case study of Ertai Town, Zhangjiakou City. Land Use Policy 2021, 106, 105457. [Google Scholar] [CrossRef]
  11. Vermeulen, S.J.; Campbell, B.M.; Ingram, J.S. Climate change and food systems. Annu. Rev. Environ. Resour. 2012, 37, 195–222. [Google Scholar] [CrossRef]
  12. Han, D.; Qiao, J.; Zhu, Q. Rural-spatial restructuring promoted by land-use transitions: A case study of Zhulin Town in central China. Land 2021, 10, 234. [Google Scholar] [CrossRef]
  13. Van Vliet, J.; de Groot, H.L.; Rietveld, P.; Verburg, P.H. Manifestations and underlying drivers of agricultural land use change in Europe. Landsc. Urban Plan. 2015, 133, 24–36. [Google Scholar] [CrossRef]
  14. Cuadrado-Ciuraneta, S.; Durà-Guimerà, A.; Salvati, L. Not only tourism: Unravelling suburbanization, second-home expansion, and “rural” sprawl in Catalonia, Spain. Urban Geogr. 2017, 38, 66–89. [Google Scholar] [CrossRef]
  15. Tian, Y.; Qian, J.; Wang, L. Village classification in metropolitan suburbs from the perspective of urban-rural integration and improvement strategies: A case study of Wuhan, central China. Land Use Policy 2021, 111, 105748. [Google Scholar] [CrossRef]
  16. Wen, Q.; Li, J.; Ding, J.; Wang, J. Evolutionary process and mechanism of population hollowing out in rural villages in the farming-pastoral ecotone of Northern China: A case study of Yanchi County, Ningxia. Land Use Policy 2023, 125, 106506. [Google Scholar] [CrossRef]
  17. Rao, J. Comprehensive land consolidation as a development policy for rural vitalization: Rural In Situ Urbanisation through semi socio-economic restructuring in Huai Town. J. Rural Stud. 2022, 93, 386–397. [Google Scholar] [CrossRef]
  18. Chen, K.; Wang, Y.; Li, N.; Xu, Y.; Zheng, Y.; Zhan, X.; Li, Q. The impact of farmland use transition on rural livelihood transformation in China. Habitat Int. 2023, 135, 102784. [Google Scholar] [CrossRef]
  19. Zhang, X.; Brandt, M.; Tong, X.; Ciais, P.; Yue, Y.; Xiao, X.; Zhang, W.; Wang, K.; Fensholt, R. A large but transient carbon sink from urbanization and rural depopulation in China. Nat. Sustain. 2022, 5, 321–328. [Google Scholar] [CrossRef]
  20. Chen, Z.; Li, Y.; Liu, Y.; Liu, X. Does rural residential land expansion pattern lead to different impacts on eco-environment? A case study of loess hilly and gully region, China. Habitat Int. 2021, 117, 102436. [Google Scholar] [CrossRef]
  21. Li, P.; Chen, J.; Li, Y.; Wu, W. Using the InVEST-PLUS model to predict and analyze the pattern of ecosystem carbon storage in Liaoning Province, China. Remote Sens. 2023, 15, 4050. [Google Scholar] [CrossRef]
  22. Huang, C.; Sun, C.; Nguyen, M.; Wu, Q.; He, C.; Yang, H.; Tu, P.; Hong, S. Spatio-temporal dynamics of terrestrial Net ecosystem productivity in the ASEAN from 2001 to 2020 based on remote sensing and improved CASA model. Ecol. Indic. 2023, 154, 110920. [Google Scholar] [CrossRef]
  23. Li, Q.; Gao, M.; Li, J. Carbon emissions inventory of farm size pig husbandry combining Manure-DNDC model and IPCC coefficient methodology. J. Clean Prod. 2021, 320, 128854. [Google Scholar] [CrossRef]
  24. Wang, L.; Gao, J.; Shen, W.; Shi, Y.; Zhang, H. Carbon storage in vegetation and soil in Chinese ecosystems estimated by carbon transfer rate method. Ecosphere 2021, 12, e03341. [Google Scholar] [CrossRef]
  25. Piyathilake, I.D.U.H.; Udayakumara, E.P.N.; Ranaweera, L.V.; Gunatilake, S.K. Modeling predictive assessment of carbon storage using InVEST model in Uva province, Sri Lanka. Model. Earth Syst. Environ. 2022, 8, 2213–2223. [Google Scholar] [CrossRef]
  26. Wang, Z.; Li, X.; Mao, Y.; Li, L.; Wang, X.; Lin, Q. Dynamic simulation of land use change and assessment of carbon storage based on climate change scenarios at the city level: A case study of Bortala, China. Ecol. Indic. 2022, 134, 108499. [Google Scholar] [CrossRef]
  27. Gharaibeh, A.; Shaamala, A.; Obeidat, R.; Al-Kofahi, S. Improving land-use change modeling by integrating ANN with Cellular Automata-Markov Chain model. Heliyon 2020, 6, e05092. [Google Scholar] [CrossRef]
  28. Liang, X.; Guan, Q.; Clarke, K.C.; Liu, S.; Wang, B.; Yao, Y. Understanding the drivers of sustainable land expansion using a patch-generating land use simulation (PLUS) model: A case study in Wuhan, China. Comput. Environ. Urban Syst. 2021, 85, 101569. [Google Scholar] [CrossRef]
  29. Gao, L.; Tao, F.; Liu, R.; Wang, Z.; Leng, H.; Zhou, T. Multi-scenario simulation and ecological risk analysis of land use based on the PLUS model: A case study of Nanjing. Sust. Cities Soc. 2022, 85, 104055. [Google Scholar] [CrossRef]
  30. Ning, J.; Liu, J.; Kuang, W.; Xu, X.; Zhang, S.; Yan, C.; Li, R.; Wu, S.; Hu, Y.; Du, G.; et al. Spatiotemporal patterns and characteristics of land-use change in China during 2010–2015. J. Geogr. Sci. 2018, 28, 547–562. [Google Scholar] [CrossRef]
  31. Wang, Z.; Zeng, J.; Chen, W. Impact of urban expansion on carbon storage under multi-scenario simulations in Wuhan, China. Environ. Sci. Pollut. Res. 2022, 29, 45507–45526. [Google Scholar] [CrossRef] [PubMed]
  32. Liu, X.; Xin, L. Assessment of the Efficiency of Cultivated Land Occupied by Urban and Rural Construction Land in China from 1990 to 2020. Land 2022, 11, 941. [Google Scholar] [CrossRef]
  33. Li, Y.; Liu, Z.; Li, S.; Li, X. Multi-scenario simulation analysis of land use and carbon storage changes in changchun city based on FLUS and InVEST model. Land 2022, 11, 647. [Google Scholar] [CrossRef]
  34. He, Y.; Xia, C.; Shao, Z.; Zhao, J. The spatiotemporal evolution and prediction of carbon storage: A case study of urban agglomeration in China’s Beijing-Tianjin-Hebei region. Land 2022, 11, 858. [Google Scholar] [CrossRef]
  35. Li, K.; Cao, J.; Adamowski, J.F.; Biswas, A.; Zhou, J.; Liu, Y.; Zhang, Y.; Liu, C.; Dong, X.; Qin, Y. Assessing the effects of ecological engineering on spatiotemporal dynamics of carbon storage from 2000 to 2016 in the Loess Plateau area using the InVEST model: A case study in Huining County, China. Environ. Dev. 2021, 39, 100641. [Google Scholar] [CrossRef]
  36. Zhang, B.; Li, L.; Xia, Q.; Dong, J. Land use change and its impact on carbon storage under the constraints of “three lines”: A case study of Wuhan City circle. Acta Ecol. Sin. 2022, 42, 2265–2280. [Google Scholar] [CrossRef]
  37. He, N.; Guo, W.; Wang, H.; Yu, L.; Cheng, S.; Huang, L.; Jiao, X.; Chen, W.; Zhou, H. Temporal and Spatial Variations in Landscape Habitat Quality under Multiple Land-Use/Land-Cover Scenarios Based on the PLUS-InVEST Model in the Yangtze River Basin, China. Land 2023, 12, 1338. [Google Scholar] [CrossRef]
  38. Wang, C.; Liu, Y.; Kong, X.; Li, J. Spatiotemporal decoupling between population and construction land in urban and rural Hubei province. Sustainability 2017, 9, 1258. [Google Scholar] [CrossRef]
  39. Zheng, H.; Zheng, H. Assessment and prediction of carbon storage based on land use/land cover dynamics in the coastal area of Shandong Province. Ecol. Indic. 2023, 153, 110474. [Google Scholar] [CrossRef]
  40. Xiang, S.; Wang, Y.; Deng, H.; Yang, C.; Wang, Z.; Gao, M. Response and multi-scenario prediction of carbon storage to land use/cover change in the main urban area of Chongqing, China. Ecol. Indic. 2022, 142, 109205. [Google Scholar] [CrossRef]
  41. Schulp, C.J.E.; Nabuurs, G.J.; Verburg, P.H. Future carbon sequestration in Europe—Effects of land use change. Agric. Ecosyst. Environ. 2008, 127, 251–264. [Google Scholar] [CrossRef]
  42. Sil, Â.; Fonseca, F.; Gonçalves, J.; Honrado, J.; Marta-Pedroso, C.; Alonso, J.; Ramos, M.; Azevedo, J.C. Analysing carbon sequestration and storage dynamics in a changing mountain landscape in Portugal: Insights for management and planning. Int. J. Biol. Sci. 2017, 13, 82–104. [Google Scholar] [CrossRef]
  43. Li, L.; Song, Y.; Wei, X.; Dong, J. Exploring the impacts of urban growth on carbon storage under integrated spatial regulation: A case study of Wuhan, China. Ecol. Indic. 2020, 111, 106064. [Google Scholar] [CrossRef]
Figure 1. Location of The Wuhan Metropolitan Area.
Land 13 01176 g001
Figure 2. Research Framework.
Land 13 01176 g002
Figure 3. Rural built-up land area and proportion of overall land area, 1995–2020. The bar chart represents the area of rural built-up land. The line represents the proportion of rural built-up land area to the total land area.
Land 13 01176 g003
Figure 4. Changes in rural built-up land in the Wuhan Metropolitan Area, 1995–2020. (a) represents the spatial distribution of the shrinkage of rural built-up land; (b)represents the spatial distribution of the expansion of rural built-up land. Note: Due to the small size of the parcel changes, this map bolds the outlines of parcels where rural built-up land has changed. Consequently, the map only represents the location of land type changes, and the pixel occupancy does not reflect the actual area converted. For specific conversion areas, please refer to Table 4 and Table 5.
Land 13 01176 g004
Figure 5. Carbon storage in seven land use types in Wuhan urban area, 1995–2020. Note: * is urban built-up land, ** is rural built-up land.
Land 13 01176 g005
Figure 6. Comparison between the current land use status in 2020 and PLUS simulation. (a) represents the actual land use; (b) represents the land use simulated by PLUS model.
Land 13 01176 g006
Figure 7. Spatial simulation of land use under three different scenarios in Wuhan Metropolitan Area in 2030. (a) represents a natural development scenario; (b) represents a scenario of rural built-up land shrinkage; (c) represents a scenario of rural built-up land expansion.
Land 13 01176 g007
Figure 8. Changes in the spatial pattern of rural built-up land in Wuhan Metropolitan Area. (a) represents a natural development scenario; (b) represents a scenario of rural built-up land shrinkage; (c) represents a scenario of rural built-up land expansion.
Land 13 01176 g008
Figure 9. Simulation of the spatial distribution of carbon storages in Wuhan Metropolitan Area under three different scenarios in 2030 (t/ha). (a) represents a natural development scenario; (b) represents a scenario of rural built-up land shrinkage; (c) represents a scenario of rural built-up land expansion.
Land 13 01176 g009
Table 1. Urban built-up land and rural settlement land classification system.
Classification of Built-up LandSubclassesDescription
Urban built-up landUrban landLand in large, medium, and small cities and built-up areas above the county town level.
Other built-up landFactories, mines, large industrial areas, oilfields, saltworks, quarries, as well as transportation roads and airports.
Rural built-up landRural settlementsThe built-up areas in rural settlements.
Table 2. Data sources.
Data TypeYearSpatial ResolutionData Sources
Basic dataLand use data1995, 2000, 2005, 2010, 2015, 202030 mResource and Environmental Data Center, Chinese Academy of Sciences
(http://www.resdc.cn, accessed on 12 March 2023)
Climatic dataTemperature20201000 m
Precipitation20201000 m
Soil dataSoil type20201000 m
Socio-economic dataGDP20191000 m
Nighttime Lighting Data20201000 m
Population20201000 mWorldPop Website (https://www.hub.worldpop.org/, accessed on 21 March 2023)
Topographic dataDEM2020250 mGeospatial Data Cloud
(https://www.gscloud.cn/, accessed on 21 March 2023)
Slope2020250 mCalculated from DEM
Slope orientation2020250 mCalculated from DEM
Accessibility dataDistance to railway202030 mOpenStreetMap
(https://www.openstreetmap.org/, accessed on 5 March 2023) Calculating Euclidean Distances in ArcGIS 10.8
Distance to highway202030 m
Distance to the main road202030 m
Distance to secondary road202030 m
Distance to branch road202030 m
Table 3. Carbon density of different land use types in the study area (t/ha).
Land Use Type C i a b o v e C i b e l o w C i d e a d C i s o i l Existing CodeOriginal Code
Cropland4.020.752.1198.1311
Woodland22.6218.032.78126.7522
Grassland3.6011.77.2890.4333
Water1.5903.9864.0344
Urban built-up land0.830.08043.71551, 53
Rural built-up land0.830.08043.71652
Unused land0.590.640.9628.4276
Table 4. Area and percentage of rural built-up land converted to other land use types, 1995–2020 (ha).
1995–20002000–20052005–20102010–20152015–20201995–2020
AreaPercentage
Rural built-up land-into-cropland11556087026519755886178.10%
Rural built-up land-into-Woodland1172725628546095.36%
Rural built-up land-into-Grassland50130366330.29%
Rural built-up land-into-Water322191992705577786.85%
Rural built-up land-into-Urban built-up land51726402649294410409.17%
Rural built-up land-into-Unused land1614921065260.23%
Total213242814,597127912,24011,346100.00%
RSR0.99%0.20%6.68%0.59%5.56%5.08%/
Table 5. Area and percentage of other land use types converted to rural built-up land, 1995–2020 (ha).
1995–20002000–20052005–20102010–20152015–20201995–2020
AreaPercentage
Cropland-into-Rural built-up land343490812,0292700904916,99387.16%
Woodland-into-Rural built-up land1361099621226918944.59%
Grassland-into-Rural built-up land116865120650.33%
Water-into-Rural built-up land35741639949945953.05%
Urban built-up land-into-Rural built-up land874137661643699244.74%
Unused land-into-Rural built-up land1469520240.13%
Total4812106914,162354115,24319,496100.00%
RER2.24%0.49%6.48%1.62%6.92%8.73%/
Table 6. Changes in overall carbon stock and carbon stock on rural built-up land 1995–2000 (105 t).
1995–20002000–20052005–20102010–20152015–2020
Carbon storage changes in rural built-up land−1.41−0.63−2.18−1.320.48
Change in total carbon storage−28.30−21.74−53.03−51.1127.89
Table 7. Value of change in carbon storage in shrinking area of rural built-up land (t).
1995–20002000–20052005–20102010–20152015–20201995–2020
Carbon StoragePercentage
Rural built-up land-into-Cropland69,7433609525,40639,323589,029534,99384.55%
Rural built-up land-into-Woodland14,70221590,9917809107,16276,40212.08%
Rural built-up land-into-Grassland36308894222452422710.36%
Rural built-up land-into-Water8046476224,764174513,91519,4133.07%
Rural built-up land-into-Unused land−227−2086−293−6−904−358−0.06%
Total92,6286500649,76249,091713,726632,722100.00%
Table 8. Value of carbon storage changes in the area of rural built-up land expansion (t).
1995–20002000–20052005–20102010–20152015–20201995–2020
Carbon StoragePercentage
Cropland-into-Rural built-up land−207,365−54,862−726,347−163,053−546,429−1,026,13688.66%
Woodland-into-Rural built-up land−17,064−13,673−120,773−15,267−86,697−112,2249.70%
Grassland-into-Rural built-up land−739−382−5890−339−8186−44620.39%
Water-into-Rural built-up land−8925−1007−15,951−2338−24,836−14,8581.28%
Unused land-into-Rural built-up land115497071279342−0.03%
Total−234,082−69,870−867,992−180,926−665,869−1,157,340100.00%
Table 9. Area of different land types under different scenarios.
Land Type20202030Amount of Change in 2030
Q1Q2Q3Q1Q2Q3
Area/Ha
Percentage/%
Area/Ha
Percentage/%
Area/Ha
Percentage/%
Area/Ha
Percentage/%
Area/Ha
Percentage/%
Area/Ha
Percentage/%
Area/Ha
Percentage/%
Cropland2,847,7002,856,5502,864,8572,848,240885017,157540
(49.104)(49.257)(49.400)(49.114)(0.153)(0.296)(0.009)
Woodland1,741,5551,752,4341,750,3871,753,32610,879883211,771
(30.031)(30.218)(30.183)(30.234)(0.188)(0.152)(0.203)
Grassland141,267140,533140,623140,443−734−644−824
(2.436)(2.423)(2.425)(2.422)(−0.013)(−0.011)(−0.014)
Water607,744599,264596,969605,841−8480−10775−1903
(10.480)(10.333)(10.294)(10.447)(−0.146)(−0.186)(−0.033)
Urban built-up land 218,079206,780208,128207,100−11299−9951−10979
(3.760)(3.566)(3.589)(3.571)(−0.195)(−0.172)(−0.189)
Rural built-up land223,218222,781217,369223,399−437−5849181
(3.849)(3.842)(3.748)(3.852)(−0.008)(−0.101)(0.003)
Unused land19,70320,92420,93320,917122112301214
(0.340)(0.361)(0.361)(0.361)(0.021)(0.021)(0.021)
Table 10. Changes in carbon storages under different scenarios (105 t).
YearScenarioCarbon Storage on Rural Built-up LandTotal Carbon Storage
2020/99.606739.72
2030Q199.406755.94
Q296.996757.87
Q399.686753.62
Rate of change
(over 2020)
Q1−0.196%0.241%
Q2−2.620%0.269%
Q30.081%0.206%
Table 11. Contribution of factors related to changes in different land use types.
FactorsCroplandWoodlandGrasslandWaterUrban Built-up LandRural Built-up LandUnused Land
Distance to secondary road0.0360.0260.0270.0300.0350.0330.027
DEM0.0580.0660.1690.0740.1120.1000.035
Distance to highway0.0670.0490.0350.0490.0540.0530.033
GDP0.1040.0870.1020.1090.0710.0750.070
Precipitation0.1290.1430.1500.1150.0640.1270.080
slope0.0410.0360.0360.0410.0810.0680.231
Population density0.1160.1440.1520.1510.2330.1240.031
Slope orientation0.0290.0330.0340.0320.0270.0390.022
Temperature0.1370.1610.1220.1440.0670.0760.201
Distance to railway0.0650.0510.0460.0570.0930.0570.029
Soil type0.0330.0340.0230.0380.0220.0430.063
Nighttime Lighting0.1150.0960.0630.1010.0960.1380.107
Distance to branch road0.0320.0330.0250.0260.0190.0260.022
Distance to the main road0.0380.0410.0160.0330.0260.0410.049
Disclaimer/Publisher’s Note: The statements, opinions and data contained in all publications are solely those of the individual author(s) and contributor(s) and not of MDPI and/or the editor(s). MDPI and/or the editor(s) disclaim responsibility for any injury to people or property resulting from any ideas, methods, instructions or products referred to in the content.

