Article

Analysis of the Spatiotemporal Changes in Cropland Occupation and Supplementation Area in the Pearl River Delta and Their Impacts on Carbon Storage

1
School of Geography and Remote Sensing, Guangzhou University, Guangzhou 510006, China
2
Laboratory for Earth Surface Processes, Peking University, Beijing 100871, China
3
Guangdong Nanling Forest Ecosystem National Observation and Research Station, Guangdong Forestry Bureau Project (LC-2021124), Shaoguan 512600, China
*
Author to whom correspondence should be addressed.
Land 2024, 13(8), 1195; https://doi.org/10.3390/land13081195
Submission received: 9 July 2024 / Revised: 31 July 2024 / Accepted: 31 July 2024 / Published: 3 August 2024

Abstract

:
In recent years, the “dual carbon” issue has become a major focus of the international community. Changes in land use driven by anthropogenic activities have a profound impact on ecosystem structure and carbon cycling. This study quantitatively assesses the spatiotemporal changes in cropland occupation and supplementation in the Pearl River Delta from 2000 to 2020 using the InVEST model, analyzing the spatial clustering of carbon storage changes caused by variations in cropland area. The PLUS model was employed to simulate land-use patterns and the spatial distribution of carbon storage in four future development scenarios. The results indicate the following: (1) From 2000 to 2020, the net change rate of cropland area in the Pearl River Delta was −0.81%, with a decrease of 16.49 km2 in cropland area, primarily converted to built-up land and forest land. (2) Carbon storage in the Pearl River Delta exhibited a pattern of lower values in the center and higher values in the periphery. The terrestrial ecosystem carbon storage in the Pearl River Delta was 534.62 × 10⁶ t in 2000, 518.60 × 10⁶ t in 2010, and 512.57 × 10⁶ t in 2020, showing an overall decreasing trend. The conversion of cropland and forest land was the main reason for the decline in total regional carbon storage. (3) The area of carbon sequestration lost due to cropland occupation was significantly greater than the area of carbon loss compensated by new cropland, indicating an imbalance in the quality of cropland occupation and supplementation as a crucial factor contributing to regional carbon loss. (4) Under the ecological priority scenario, the expansion of built-up land and the reduction in ecological land such as cropland and forest land were effectively controlled, resulting in the minimal loss of carbon storage. The soil organic carbon pool of cropland is the most active carbon pool in terrestrial ecosystems and has a significant impact on carbon storage. Clarifying the relationship between “cropland protection measures–land use changes–ecosystem carbon storage” will improve cropland protection policies, provide references for regional carbon sequestration enhancement, and support sustainable socio-economic development.

1. Introduction

Climate change has led to global ecological imbalance, severely affecting the sustainable development of human society. In light of this context, China has set forth the objectives of “carbon peak” and “carbon neutrality”, offering a Chinese approach to global governance. Land use changes are important components of the global ecological environment and have significant impacts on the carbon balance of ecosystems [1]. In recent years, the academic community has strengthened research on the impact of land use on the carbon cycle of ecosystems, focusing mainly on carbon emissions and carbon storage. Research scales include global, national, provincial, county, and watershed levels. Regarding carbon emissions from land use, research scales are mostly concentrated at the provincial level [2,3,4] and urban agglomerations [5,6,7,8]. For instance, Wei (2024) examined the spatial characteristics of land use carbon emissions. This study covered the past 20 years. It focused on 87 counties in Gansu Province [9]. Zhang (2024) examined the spatial-temporal dynamics of land use carbon emissions and ecosystem service values in the Guan Zhong urban agglomeration. The study also explored the interaction patterns between these factors [10]. Liu (2023) evaluated the relationship between land use/cover changes and carbon emissions in the Chao bai River Basin, which demonstrates the expansion of the Beijing–Tianjin–Hebei metropolitan area [11]. Pertaining to the investigation of land use and carbon storage, scholars mainly analyze the impact of land use on carbon storage from the perspectives of individual carbon pools and regional overall evaluation. From a purely theoretical research perspective, Wani et al. (2023) reviewed soil carbon storage and examined various factors that influence its carbon sequestration capacity, such as land use [12]. The impact of historical land use changes on carbon storage has been analyzed by most scholars from a regional comprehensive land use perspective, with mathematical and statistical methods being utilized [13,14,15]. Some researchers [16,17,18], on the other hand, have examined the impact of land use changes on individual carbon pools. Aquino (2024) revealed notable interactions between the cycles of hydrological, climatic, and wetland vegetation changes, particularly within the context of land use and land cover transformations. Furthermore, these findings underscore the complex interdependencies and impacts associated with these environmental processes [19]. Nohemi et al. (2024) investigated how changes in water and land use are related in the Mexican basin. Their findings revealed that an increase in urban land area led to a corresponding rise in the runoff volume within the study area [20]. Colman et al. (2024) investigated the factors driving grassland vegetation loss in Brazil. Based on their findings, they suggested policy recommendations aimed at balancing production with conservation efforts [21]. At present, research on carbon storage typically involves the integration of model analysis of historical land use changes and spatial-temporal variations in carbon storage, often coupled with simulation and forecasting. Gao et al. (2023) employed System Dynamics (SD), PLUS, and InVEST models to forecast land use trends and associated carbon sequestration in Heilongjiang for the period from 2030 to 2050. Their analysis revealed that the transformation of developed land into cropland enhanced carbon sequestration by 102.71 × 10⁶ t [22]. Li et al. (2022) conducted a historical analysis of land use transformations in Chengzhi City from 2000 to 2020. They investigated the factors influencing carbon sequestration and its spatial-temporal patterns during different periods. Furthermore, the study proposed strategies for future environmental management, emphasizing the need to prioritize the protection of high-value carbon sink areas [23]. Regarding studies on the carbon balance of individual land use types, most scholars focus on forest carbon sinks and carbon emissions from urban construction land [24,25,26,27], while some researchers explore the impact of cropland on carbon balance. Song (2024) quantified the relationship between cropland carbon sinks and influencing factors using a geographically weighted regression model. Additionally, the study discussed potential pathways to enhance farmland carbon sinks [28]. Li (2023) evaluated the overall carbon sequestration of conservation tillage. The study examined the spatial and temporal variability of factors affecting these carbon sinks [29]. Leifeld (2023) discussed the role of carbon agriculture in mitigating climate change in agriculture or forestry [30]. Kong et al. (2023) assessed how annual cropland changes (expansion and abandonment) from 2000 to 2020 were influenced on carbon storage in the northwest region [31]. Chen et al. (2024) analyzed the impact of cropland changes in the economic zone north of the Tianshan Mountains. The carbon effects of the increase in cropland area were calculated. It was demonstrated that newly added cropland was mainly derived from low-coverage grassland and unused land. It was found that the quality of cropland improved, carbon storage increased, and ecological risks decreased [32]. Schierhorn, F., (2013) examined the carbon sequestration of cultivated land in the former Soviet Union from 1990 to 2009. The study discovered that a net rise of 470 TgC in carbon sequestration resulted from unmanaged land [33].
In recent years, research on carbon storage related to land use has increased, with most studies focusing on the impact of overall land use changes within entire ecosystems on carbon storage. There is a notable lack of studies specifically examining the effects of individual land types, particularly the balance of cultivated land occupation and compensation, on carbon storage. Land regulations substantially affect land use transformations. They frequently impact issues such as “draining water bodies to establish fields”, “clearing forests for farming”, and “insufficient recompense for high-quality land”, which markedly deteriorate the condition of farmland [34]. Additionally, most compensated cultivated land is sourced from ecological land (grasslands, forests, wetlands) [35], directly impacting terrestrial ecosystem carbon storage [36]. For instance, Tang et al. (2023) utilized land use data from 2000 and 2015, and the LAND-SCAPE model was employed to simulate land use patterns for 2030 in different scenarios of arable land occupation and compensation balance. Furthermore, the InVEST model was applied to explore how these balance scenarios influence carbon storage at provincial and sub-provincial levels from 2015 to 2030 [37]. He et al. (2023) employed the InVEST model to quantitatively evaluate the ramifications of cultivated land occupation and compensation areas on terrestrial ecosystem carbon sequestration in Hubei Province. Furthermore, they utilized the PLUS model to simulate land use trajectories and carbon storage trends in prospective development scenarios within the region. The soil organic carbon pool in cultivated land, being the most dynamic carbon pool in terrestrial ecosystems, is inevitably impacted by land use changes driven by cultivated land protection policies. The carbon sequestration capacity of the land and the overall carbon storage of terrestrial ecosystems are significantly influenced by these changes [38]. Current methods for assessing cultivated land carbon storage mainly include traditional field surveys, remote sensing inversion, and model simulation predictions. Traditional measurement methods are labor-intensive, costly, and lack the capability to visualize spatial patterns and dynamic changes. In comparison to other models, the InVEST model stands out for its ease of use and its ability to spatially represent assessment outcomes. The PLUS model supports multi-scenario simulations of future carbon storage and facilitates policy planning. This study focuses on the effectiveness of cultivated land occupation and compensation policies, using the PRD as the study area. The InVEST model is employed to quantitatively assess the spatiotemporal changes in cultivated land occupation and compensation areas from 2000 to 2020, and their impact on regional carbon storage and its spatial correlation. Combined with the PLUS model, this study predicts the spatiotemporal changes in land use and carbon storage in four different development scenarios for 2030. By clarifying the relationship between “cultivated land protection policy measures–land use changes–ecosystem carbon storage”, this study aims to provide insights for improving cultivated land protection policies.

2. Materials and Methods

2.1. Study Area

The Pearl River Delta (PRD), abbreviated as the Pearl Delta, is located in the south-central part of Guangdong Province, China. At the mouth of the Pearl River, it faces Southeast Asia across the sea and is bordered by hilly and mountainous terrain to the west, north, and east. The area covers approximately 54,766.62 km2 (according to the Guangdong Statistical Yearbook) and has a coastline extending 1059 km. Most of the PRD is situated south of the Tropic of Cancer. This places it in the South Asian subtropical region. The region is characterized by a South Asian subtropical monsoon climate. It features abundant rainfall, substantial warmth, and coinciding periods of rain and heat. The greater PRD area also encompasses the Hong Kong Special Administrative Region (SAR) and the Macau SAR, making it one of China’s most densely populated, innovative, and economically powerful urban agglomerations. However, for the purposes of this study, the PRD is defined to include only the nine prefecture-level cities within Guangdong Province, excluding the Hong Kong SAR, Macau SAR, and the Shen Zhen-Shan Wei Special Cooperation Zone. The base map is sourced from the standard maps provided by the official website of Guangdong Province, China (Figure 1). The review numbers are Yue, S. (2021), No. 115, and Yue, G.S. (2023), No. 1032.

2.2. Data Sources

The data involved in this study include land use, elevation, slope, population density, GDP density, temperature, precipitation, roads, and carbon density (Table 1). The land use data for the Pearl River Delta from the years 2000, 2010, and 2020 was obtained from CNLUCC. After being processed and clipped using ArcGIS software, the current land use status of the study area was determined. Elevation and gradient information were obtained from the Geographic Spatial Data Cloud, with a spatial resolution of 30 × 30 m. Other data were sourced from the platform of the Chinese Academy of Sciences. Due to the challenges of directly collecting carbon density data and the variation in numerical values across different researchers’ findings, carbon density coefficients from a single researcher were utilized to prevent substantial data inconsistencies [39].

3. Transportation Location Data

3.1. Quantitative Characteristics of Cultivated Land Changes

3.1.1. Characteristics of Farmland Change Quantity

Illustrated is the net change rate (NCR) of agricultural land, reflecting the relative growth or reduction in agricultural land. Denoted is agricultural land conversion by plots that were initially farmland but have been changed to non-agricultural land, whereas signified is agricultural land addition by plots that were initially non-agricultural but have been converted to farmland. By evaluating the variations in agricultural land area from the start to the conclusion of the research period, the trends in agricultural land conversion and addition can be grasped and conservation strategies can consequently be devised. The calculation formula is as follows:
N C R = A r e a C F A r e a R F A r e a f i r s t × 100 %
In the equation, AreaCF represents the area of farmland supplemented during the study period, AreaRF denotes the area of farmland occupied during the study period, and Areafirst indicates the total area of farmland at the beginning of the study.

3.1.2. Land Use Transition Matrix

The magnitude and rate of change in farmland resources during the study period are reflected in the dynamism of farmland change. Poorer stability of farmland resources is indicated by a higher absolute value of dynamism. Below is the formula used for calculation:
K = U y U x U x × 1 T × 100 %
In the equation, K indicates the change dynamics of farmland; Ux and Uy denote the farmland area at the initial and final stages of the study, respectively; and T denotes the duration between the two periods.

3.2. Calculation of Carbon Stock—InVEST Model

3.2.1. Total Carbon Stock

The InVEST model serves as an integrated tool for evaluating ecosystem services and trade-offs, designed to simulate variations in the amount and value of ecosystem resources across various land cover scenarios. The InVEST Carbon Stock module is divided into four basic carbon pools: aboveground biomass carbon, belowground biomass carbon, soil carbon, and dead organic carbon. The calculation formulas are as follows:
C t o t a l = C a b o v e + C b e l o w + C s o i l + C d e a d
C t o t a l = i = 1 n C i S i
In the equation, Ctotal represents the total carbon stock; Si denotes the total area of land use type i; Ci represents the total carbon stock in each land use category; i represents the individual carbon pool; and n is the categorical variable for land use types.

3.2.2. Carbon Density Data

Due to the difficulty of obtaining carbon density data in the field, to ensure the consistency and accuracy of carbon density data, carbon density coefficients are preferably selected based on measured data from the Pearl River Delta. If data from the Pearl River Delta are not available, measured data or literature compiled data from Guangdong Province are used. This study refers to the carbon density coefficients summarized by Zheng Huiling [39] for various land types in the Guangdong–Hong Kong–Macao Greater Bay Area (Table 2). The coefficient has been corrected and validated and can be used as a reference.

3.3. Carbon Stock Hot Spot Analysis

Carbon density is used to quantify regional carbon sequestration capacity. Hot spot analysis identifies spatial concentrations of carbon density, reflecting carbon stock distribution. At the county level, ArcGIS classifies carbon stocks related to cropland changes from 2000 to 2020 as follows: Z < 2.576 (99%) indicates primary cold spots; −2.5766 < Z < −1.9605 (95%) denotes secondary cold spots; −1.9598 < Z < −1.6449 (90%) represents tertiary cold spots; −1.6447 < Z < 1.6448 is non-significant; Z > 2.5759 (99%) signifies primary hot spots; 1.9599 < Z < 2.5756 (95%) denotes secondary hot spots; and 1.449 < Z < 1.959 (90%) corresponds to tertiary hot spots. The methodology for calculation is provided below:
G i * d = j = 1 n w i j X j Σ j = 1 n X j
z G i * = G i * E G i * var G i *
In the equation, E(Gi*) and var (Gi*) represent the expected value and variance of Gi*, respectively, while Wij denotes the spatial weight. A high and positive Z(Gi*) indicates that the surrounding values are significantly elevated, signifying a hot spot region; conversely, a negative Z(Gi*) suggests that the surrounding values are relatively diminished, indicating a cold spot region. A higher Z(Gi*) value corresponds to a more intense concentration of hot spot clustering, while a lower Z(Gi*) value reflects a more pronounced aggregation of cold spot clustering.

3.4. Land Use Change—PLUS Model

The PLUS model is a raster-based, patch-scale, land use change simulation model utilizing cellular automata. It simulates future land use changes by interpreting deep relationships between land use types and analyzing land use change policies. PLUS comprises two modules: the Land Expansion Analysis Strategy (LEAS) module, which determines the development potential for different land types within a region, and the CA model based on multi-type Random Seeds (CARS) module, which simulates local land use competition and predicts the future demand for various land use types.
(1)
Accuracy Verification. The Kappa index is a metric used to measure classification accuracy, assessing the agreement between the model’s predictions and actual classifications. The Kappa index ranges from [0,1], where a value greater than 0.7 indicates high reliability of the model. The larger the Kappa index, the higher the model’s accuracy, and the closer the predictions are to reality. The calculation formula is as follows:
k a p p a = P 0 P e 1 P e
where P0 represents the observed accuracy and Pe represents the expected accuracy under random conditions.
(2)
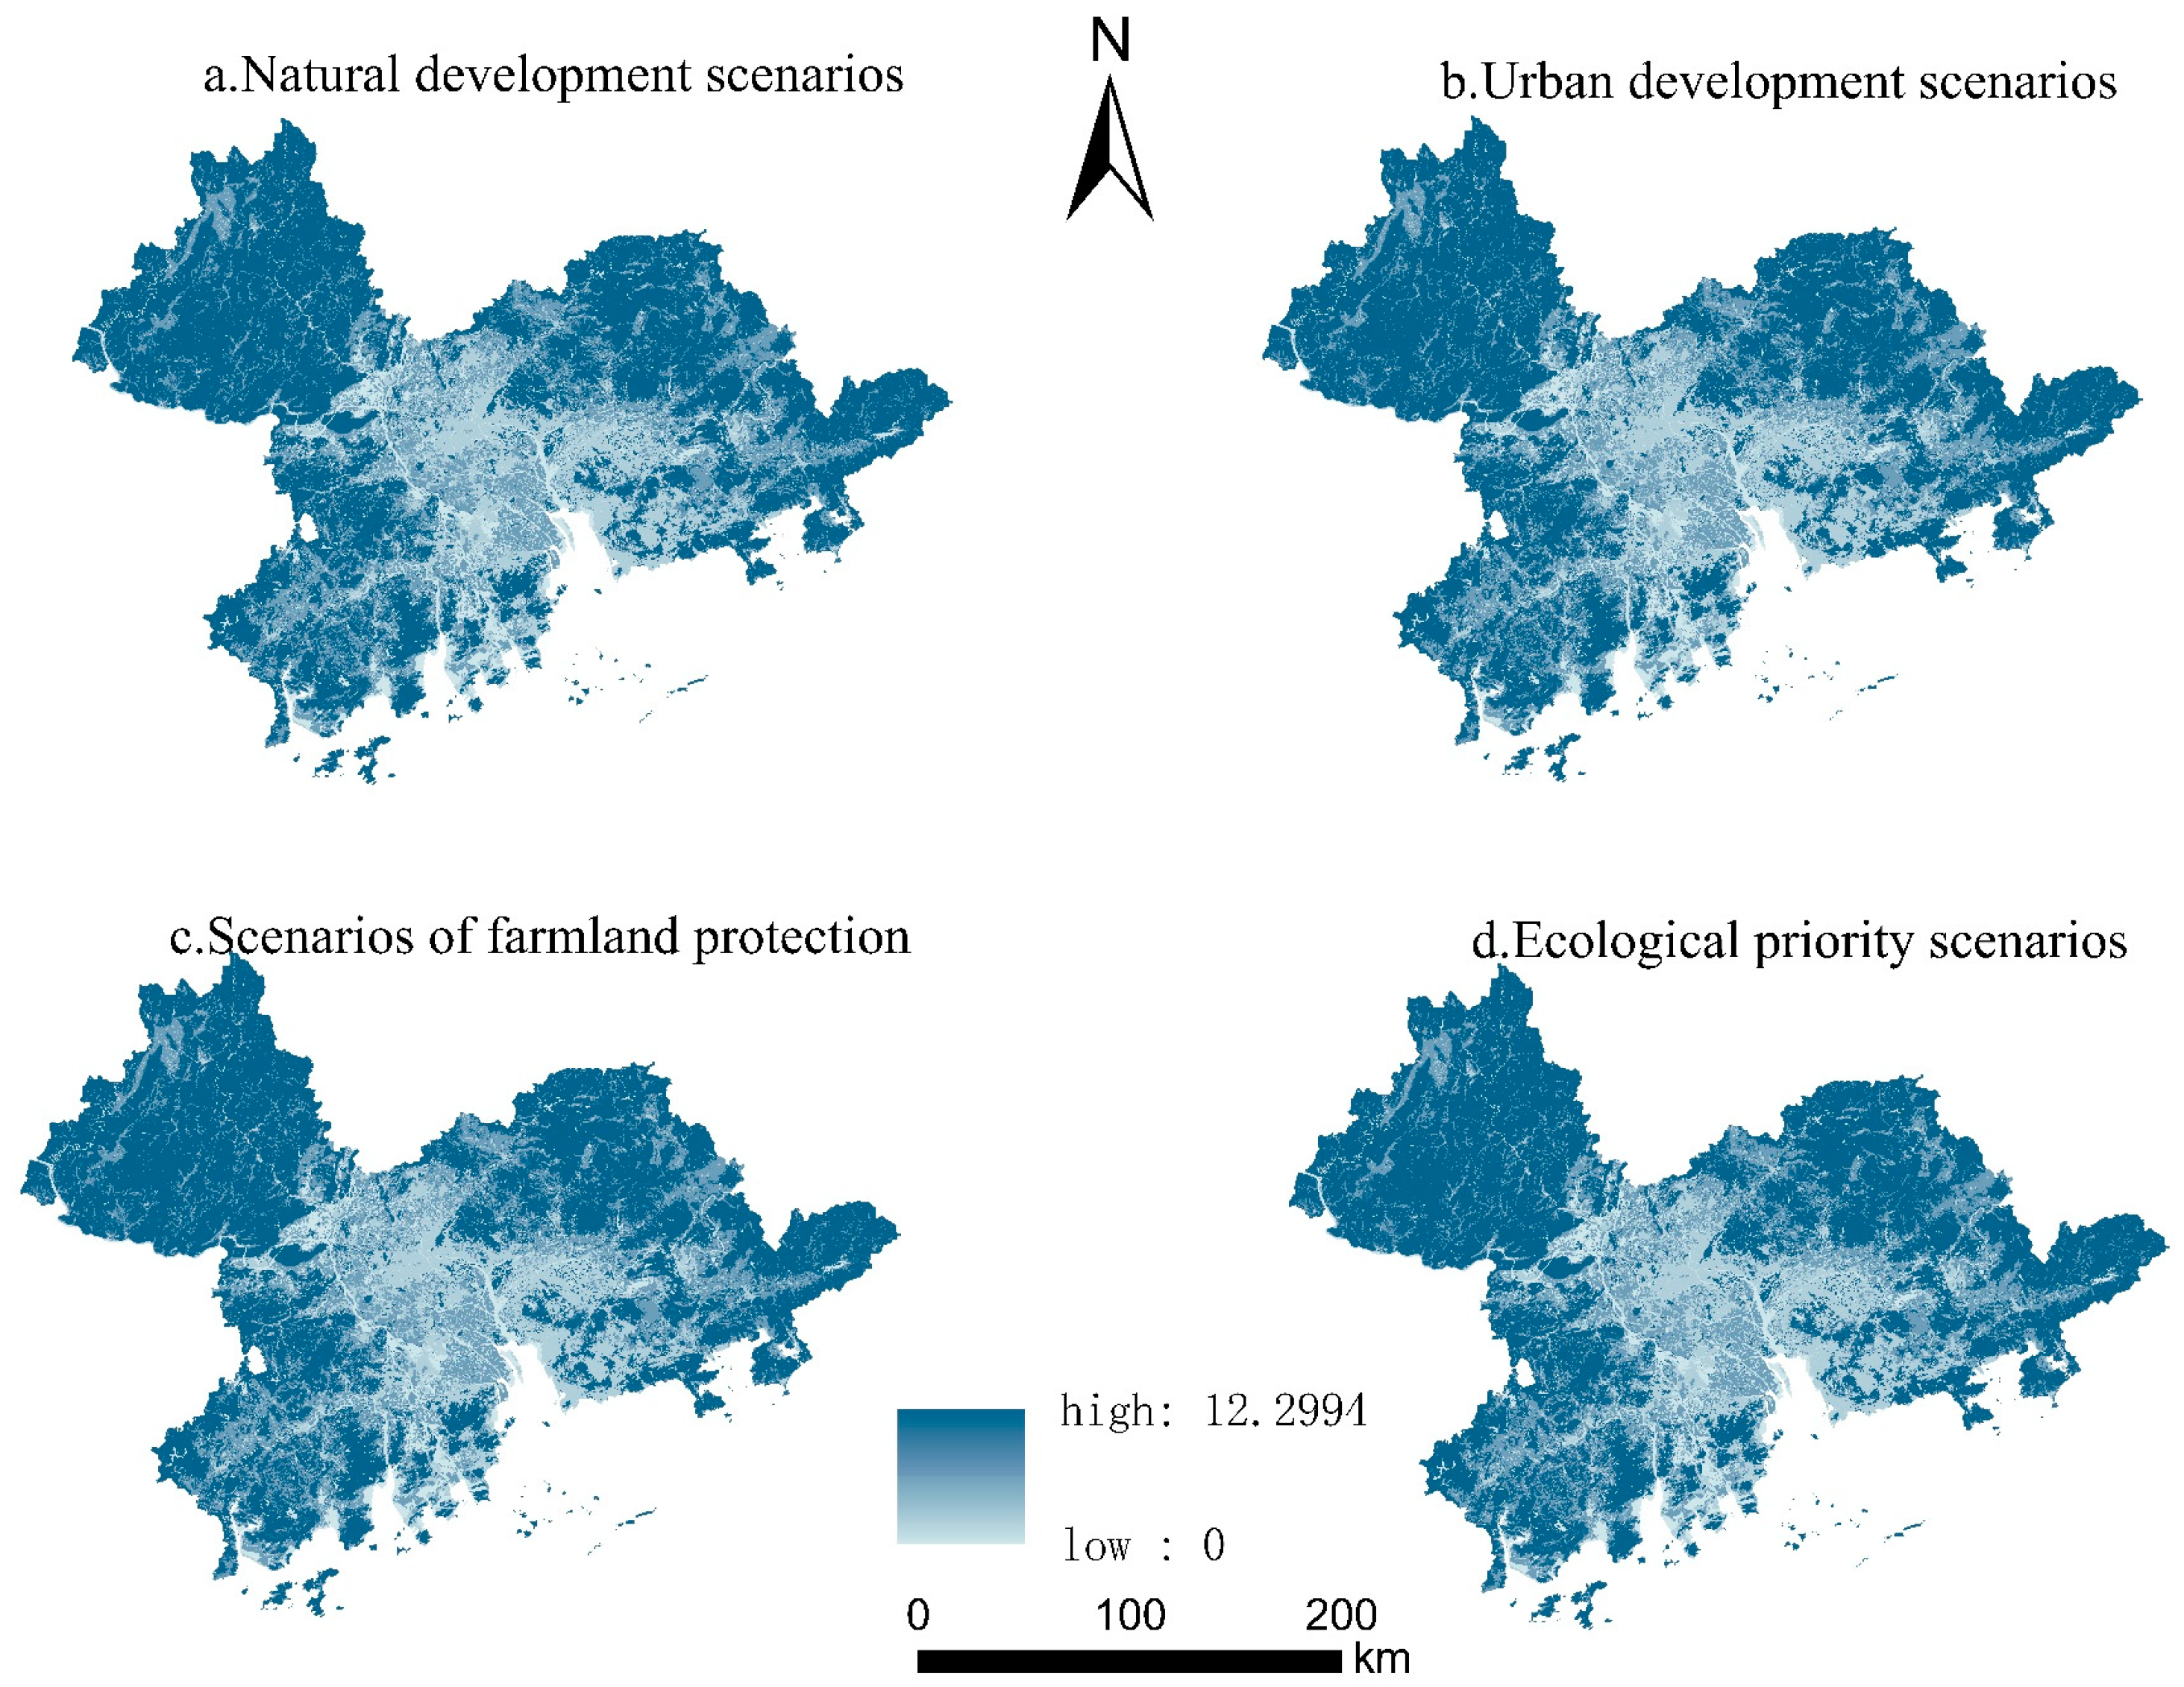
The multi-scenario analysis [3,40] involves simulating land cover changes in the PRD region from 2000 to 2020 based on different scenarios: natural development, urban development, farmland protection, and ecological priority. The restricted area is defined based on the “Guangdong Wetland Protection Regulations” (2022 Revision), incorporating wetland area control goals into the ecological protection red line according to the law. Hence, this study designates marshland in water bodies and unused land as restricted areas. ① The natural succession scenario follows the natural development trend observed from 2000 to 2020. ② In the Pearl River Delta, the urban development scenario emphasizes economic expansion, industrialization, and urbanization. It increases the likelihood of converting farmland, forestland, and meadows to urban areas by 30%, while it decreases the probability of converting urban areas to other land types (excluding farmland) by 30%. ③ The ecological priority scenario will aim to enhance the conversion of other land types into ecological land and to slow down the conversion out of ecological land to achieve ecological protection. Under this scenario, all land types, except urban land, will be eligible for conversion. The probability of converting woodland and grassland to urban land will decrease by 50%, while the probability of converting farmland to urban land will decrease by 30%. Conversely, the probability of converting farmland and grassland to woodland will increase by 30%. ④ The farmland protection scenario aims to protect farmland by slowing down the rate of conversion from farmland to other land types or urban land. Hence, the probability of farmland conversion to urban and rural construction land decreases by 60%, and the probability of conversion from farmland to woodland, grassland, and water bodies decreases by 30%. This scenario is used to predict the land use status in 2030 under farmland protection conditions.
(3)
Model Parameter Configuration
In different scenarios, land use demand is populated based on future scenario modeling and the outcomes derived from the Markov chain forecasts. The transition matrix indicates the transfer rules between different land types, where 1 denotes permissible transitions and 0 denotes prohibited transitions. In this study, different parameter constraints for land type conversions are set according to different scenarios. The neighborhood matrix references the research by Wang Baocheng et al. [41], with values assigned based on the normalized expansion values of various land use types during the historical period from 2015 to 2020. The formula is as follows:
W i = T A i T A m i n T A m a x T A m i n
In the formula, Wi represents the neighborhood weight for land use type i, TAi is the expansion area of land type i, TAmin is the minimum expansion area among all land use types, and TAmax is the maximum expansion area among all land use types. In practical scenarios, even land types with a neighborhood weight of 0 will undergo expansion [38]; so, in this study, the neighborhood weight for the land type with the minimum expansion area is set to 0.1.

4. Results

4.1. Analysis of the Balance of Cultivated Land Requisition–Compensation in the Pearl River Delta

In 2000, 2010, and 2020 (Figure 2), the cultivated land area in the Pearl River Delta was 14,514.99 km2, 12,715.09 km2, and 12,162.46 km2, respectively. The net change rate of cultivated land from 2000 to 2020 was −0.81%, with a reduction of 16.49 km2 in cultivated land. During this period, the largest loss of cultivated land occurred from 2000 to 2020, with an area loss of 2352.53 km2, resulting in a change rate of −1.24%. The lost cultivated land was primarily occupied by construction land, water bodies, and forest land, accounting for 66.96%, 21.16%, and 10.6% of the occupied land, respectively. In the Pearl River Delta region, the requisition of cultivated land is closely linked to economic development and rapid urbanization. The demand for construction land has been accelerated by economic development, resulting in the surrounding cultivated land being occupied. The sources of cultivated land compensation mainly include the reclamation of water bodies, forest land, and construction land, accounting for 43.28%, 29.09%, and 25.68%, respectively. Over the 20-year period, the area of occupied cultivated land reached 3678.66 km2, while the compensation area was 1325.73 km2, with the occupied area nearly three times the compensation area, indicating a significant imbalance in the requisition compensation of cultivated land in the Pearl River Delta region.
From a time-segment perspective (Table 3), the fastest reduction in cultivated land occurred between 2000 and 2010, with a dynamic change rate of −1.24%. During the later phase, the rate of decline decelerated, chiefly due to the industrial reorganization resulting from the reform and opening-up policy, combined with the favorable policies for economic growth in the Pearl River Delta region from Guangdong Province. The urbanization process in the Pearl River Delta area was expedited, positioning construction land as the main contributor to the occupied arable land, with 1786.22 km2 being converted to construction land. Between 2010 and 2020, the disparity between the requisition and compensation of arable land in the Pearl River Delta significantly narrowed, with the area of construction land taking over arable land reduced to half of the 2000–2010 level. This reduction was attributed to the national focus on arable land conservation following the 18th National Congress, coupled with Guangdong Province’s issuance of the “Implementation Opinions on Enhancing Arable Land Protection and Improving the Requisition–Compensation Balance”. This policy delineated permanent basic farmland, strictly controlled the requisition of cultivated land for construction, and promoted the reclamation of old lands to achieve the requisition–compensation balance.
From a spatial perspective (Figure 3 and Table 3), farmland occupation from 2000 to 2020 appears scattered, primarily concentrated in regions with rapid socio-economic development such as Guangzhou and Dongguan; meanwhile, supplemented farmland is concentrated in the southern part of Foshan. During the 2000–2010 period, the demand for construction land increased rapidly due to socio-economic development, with farmland occupation being the predominant trend and farmland compensation being relatively limited, mainly concentrated in the southern part of Foshan. This can be attributed to Foshan’s implementation of basic farmland protection subsidies as part of its “Ten Livelihood Projects” in 2007, which increased regional enthusiasm for protecting farmland and effectively supplemented the quantity of farmland. From 2010 to 2020, farmland occupation has been effectively controlled, with farmland supplementation becoming the main trend. However, the spatial distribution of supplemented farmland is scattered, which may exacerbate farmland fragmentation.
From the perspective of farmland occupation and compensation balance at the prefecture level (Figure 4), there are significant differences in the situation among prefecture-level cities, with all cities in the Pearl River Delta showing negative net changes in farmland area, and none of them experienced an increase in farmland area over the 20 years. Specifically, Dongguan, Zhuhai, and Shenzhen had net changes in farmland area of less than −53.65%, indicating that these three prefecture-level cities experienced the most severe farmland loss due to the rapid expansion of construction land resulting from urban and rural development. Zhongshan and Guangzhou had relatively large net changes in farmland area, although not as high as Dongguan, Zhuhai, and Shenzhen, but the area of replenished farmland was significantly lower than the area of occupied farmland. Huizhou, Zhao qing, Jiangmen, and Foshan had net changes in farmland area close to zero, indicating the relatively effective implementation of the farmland occupation and compensation balance policy. Among them, Foshan has basically achieved farmland occupation and compensation balance due to the effective implementation of basic farmland protection subsidies.

4.2. Impact of Changes in Various Land Types on Carbon Storage

By combining land use and carbon density information with the InVEST model, the fluctuations in carbon storage between 2000 and 2020 were estimated (Figure 5 and Figure 6). As shown in the figures, the carbon storage in the Pearl River Delta region exhibits a characteristic of being low in the middle and high around the periphery. The land-based ecosystem carbon reserves in the Pearl River Delta for the years 2000, 2010, and 2020 were 534.62 × 10⁶ t, 518.60 × 10⁶ t, and 512.57 × 10⁶ t, respectively. The regional carbon storage shows an overall decreasing trend year by year, with a total reduction of 22.05 × 10⁶ t over 20 years, a decrease of 4.12%, and an average annual decrease of 1.1 × 10⁶ t. Considering various time intervals, between 2000 and 2010, carbon reserves diminished substantially, with the decline primarily centered in the core area of the Pearl River Delta, whereas the growth in carbon reserves was focused in the southern section of Foshan. During this period, the change in carbon storage almost coincided with the range of land use changes. From 2010 to 2020, carbon storage continued to decrease, with a relatively scattered spatial distribution and no obvious areas of carbon storage increase. In terms of different land use types, forests contribute the most to regional carbon storage, with relatively small changes in carbon storage magnitude across the three periods, accounting for approximately 77%. Following forests, croplands contribute the second most to regional carbon storage, with proportions of 19.03%, 17.19%, and 16.63% in the three periods, respectively. Forests and croplands together account for over 90% of all land types of carbon storage, with minimal changes in forest carbon storage and a decreasing proportion of cropland carbon storage over the years. The conversion between croplands and forests is the main reason for the overall decrease in carbon storage in the Pearl River Delta region.

4.3. Temporal and Spatial Distribution of Carbon Storage in Cultivated Land Occupation and Compensation

Cultivated land, as one of the main sources of regional carbon sink, has profound implications for regional carbon storage with its changes in area. In order to provide a clearer and more intuitive reflection of the response of carbon storage to changes in cultivated land area, the spatial-temporal changes in cultivated land occupation and compensation from 2000 to 2020 were utilized. Through the raster subtraction calculation of carbon storage spatial distribution between adjacent periods, the changes in carbon storage resulting from two types of cultivated land changes, namely occupation and compensation, were symbolized and displayed. The calculation of carbon storage changes caused by regional cultivated land changes was conducted, distinguishing between carbon sequestration and loss due to cultivated land occupation and compensation (Figure 7). From 2000 to 2020, the carbon storage changes caused by cultivated land occupation were most pronounced, with regions of carbon loss concentrated in the central part of the Pearl River Delta, particularly in Zhuhai and Dongguan. Conversely, regions where carbon sequestration was achieved through cultivated land occupation were relatively small in area and mainly concentrated in the southern part of Foshan. Carbon sequestration resulting from cultivated land compensation was scattered, concentrated in the northern part of Dongguan, with small amounts dispersed in Shenzhen, Jiangmen, and Huizhou. The areas of carbon loss resulting from cultivated land compensation were small and scattered, with carbon loss patches observed in all nine prefecture-level cities. Over the time periods examined, the overall pattern of carbon storage changes remained consistent from 2000 to 2020, with the area of carbon sequestration resulting from cultivated land occupation significantly exceeding the area of carbon loss resulting from cultivated land compensation. Moreover, carbon loss was concentrated in the central part and scattered around the periphery, with carbon sequestration primarily occurring in the southern part of Foshan. Compared to the previous period, there was no obvious clustering of carbon storage changes caused by cultivated land occupation and compensation from 2010 to 2020, and the difference in the area between carbon sequestration resulting from cultivated land compensation and carbon loss resulting from cultivated land occupation decreased.
Analyzing from the perspective of time periods and types of land conversion (Table 4), the changes in land conversion have led to a continuous decrease in carbon storage loss from 2000 to 2020, totaling a reduction of −20.47 × 10⁶ t. Among these, the period from 2000 to 2010 witnessed the fastest reduction rate, with land conversion covering an area of 3488.68 km2, resulting in a regional carbon storage loss of 13.47 × 10⁶ t. Specifically, the area of land occupation amounted to 2647.12 km2, directly causing a reduction in carbon storage by 15.65 × 10⁶ t, with land occupation for construction being the primary reason for the decline in carbon storage during this phase. Between 2010 and 2020, carbon reserves continued to decline, although at a slower pace compared to the prior period, resulting in an overall carbon reduction of 5.06 × 10⁶ t. Within this timeframe, land occupation contributed to a carbon storage loss of 5.42 × 10⁶ t, while land compensation accounted for a carbon sequestration of 0.36 × 10⁶ t. During this phase, besides land occupation for construction, the conversion of forest land into cultivated land also significantly contributed to the regional carbon loss.

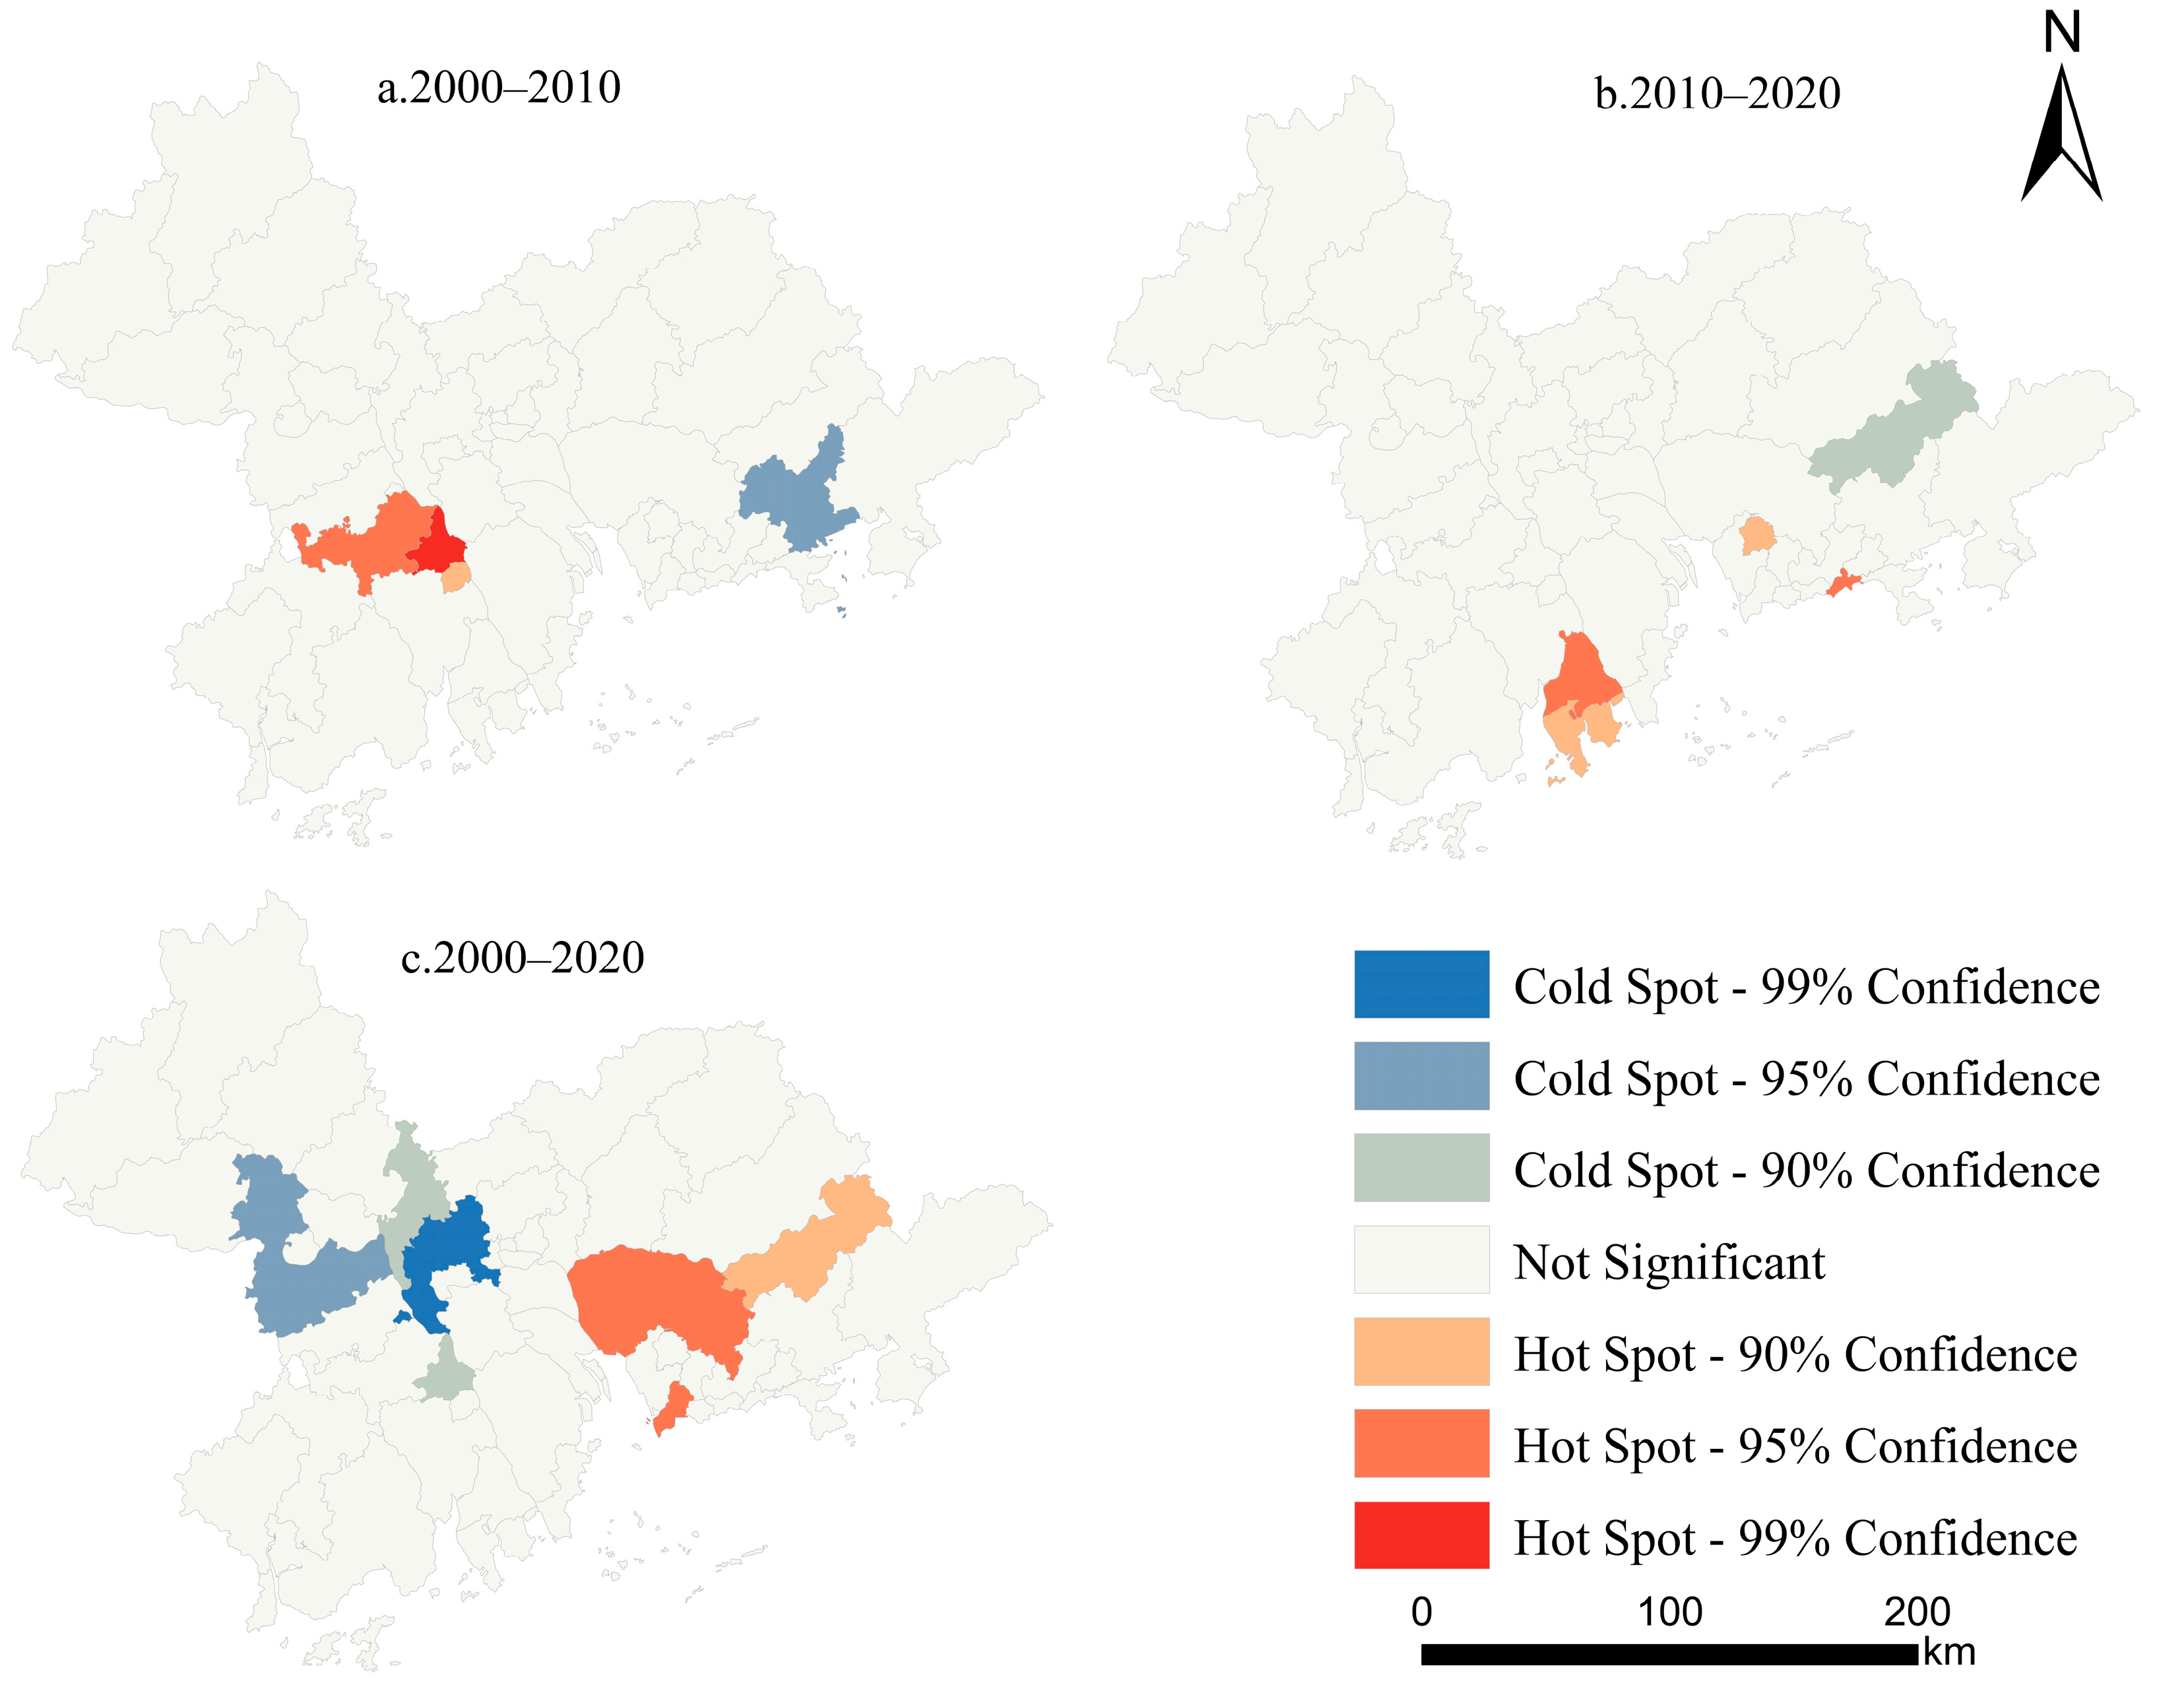
4.4. Hot Spot Analysis of Carbon Storage Changes Due to Land Conversion

To better reveal the aggregation characteristics of carbon storage changes resulting from land conversion in each county-level administrative unit in the Pearl River Delta region, a hot spot analysis was conducted (Figure 8). From 2000 to 2020, the distribution of carbon storage hot spots in most areas of the Pearl River Delta was not significant. The areas where land conversion led to hot spot aggregation of carbon storage changes included Dongguan, Hui Cheng District, and Nanshan District of Shenzhen. Among them, Dongguan and Foshan were secondary hot spot aggregation areas, where the carbon storage changes due to land conversion were relatively large, forming regional hot spot aggregation of carbon storage. Cold spots were primarily located in the central region of the PRD, including San Shui, Gao Yao District, Nan Hai District, and Peng jiang District. These areas had low carbon storage change values, and the surrounding areas also had low change values, resulting in carbon storage loss due to land conversion. From 2000 to 2010, the areas of Heshan, Peng Hiang District, and Jiang Hai District transitioned from hot spot aggregation to nonsignificant, mainly due to the conversion of land use types from high carbon-density cropland to low carbon-density water bodies and built-up areas in the previous period. The Huizhou district transformed from a secondary cold spot to nonsignificant, mainly because in the previous period, the conversion of low carbon-density water bodies and built-up areas to high carbon-density cropland led to an increase in regional carbon storage. From 2010 to 2020, the newly added areas of Dou Men District, Jin Wan District, Yantian District, and Guang Ming District became hot spot aggregation areas, mainly due to the conversion of water bodies to cropland, resulting in an increase in carbon storage. Hui Cheng District became a tertiary cold spot area due to the impact of cropland conversion to built-up areas.

4.5. Simulation of Land Use in Different Scenarios and Prediction of Carbon Storage

The PLUS model, based on land use data from the Pearl River Delta in 2015 and selecting 12 driving factors of land use change, simulated the quantity and distribution of land use in 2020. The simulated data were compared with actual land use data from 2020, validating the overall accuracy of the model to be 0.93, with a Kappa coefficient of 0.89, both exceeding 0.75. This indicates that the model has a good fitting effect and can be used to predict land use conditions in the Pearl River Delta in different scenarios in 2030.
Based on the 2020 land use data, the Markov model predicted land use quantities to simulate the land use status in the Pearl River Delta in 2030 (Figure 9), and then calculated the carbon storage in different scenarios (Figure 10). From the results (Table 5), it is evident that there are significant differences in land use demand and distribution across the Pearl River Delta in different scenarios by 2030, which also demonstrate varied responses in carbon storage to land use changes, showing an overall declining trend. (1) In the natural development scenario, land use patterns are expected to follow natural progression laws. It is anticipated that by 2030, grassland and built-up land in the Pearl River Delta will slightly increase, while forest land, agricultural land, aquatic areas, and unutilized land will diminish. Spatially, the expansion of construction land is mainly concentrated in economically developed areas such as Guangzhou and Shenzhen, with urban expansion in regions like Guangzhou and Foshan primarily encroaching on arable land, while the southern part of Shenzhen mainly encroaches on forest land. The urban expansion of Dongguan and Zhongshan occupies approximately equal areas of forest land and arable land. In this scenario, the low carbon density of construction land occupies the higher carbon density of forest land and arable land, leading to a reduction in the carbon storage of the Pearl River Delta’s ecosystem by approximately −3.05% compared to 2020. (2) Under the urban development scenario, except for grassland and construction land, all other land types experience varying degrees of decrease, with the construction land witnessing the largest increase, reaching 14.66%. The newly added construction land is scattered in the urban areas around the Pearl River Estuary, with areas like Bai Yun District, Huadu District, and Nan Hai District in Guangzhou being relatively concentrated. The transformation of land types to construction land remains primarily focused on arable land. In this scenario, the regional carbon storage declines most rapidly, decreasing by 18.7 × 10⁶ t compared to 2020, with a reduction rate of −3.5%. Without proper control, the imbalance in arable land occupation and compensation cannot be achieved, posing a threat to the ecological environment. (3) Under the arable land protection scenario, strict restrictions on the conversion of arable land to other land types result in effective increases in arable land area, with an increase of 1.57%. Although construction land continues to expand, its rate of expansion slows down effectively [41]. Spatially, the increased arable land is distributed sparsely, mainly in areas with slightly slower economic development, such as Jiangmen and Zhao Qing, with relatively significant increases in areas like Cheng Heng District and Taishan City. Under the arable land protection scenario, the carbon storage of the Pearl River Delta’s terrestrial ecosystem decreases by 2.53% compared to 2020, showing a mitigated decline compared to the natural and urban development scenarios. (4) Under the ecological priority scenario, interventions in land use patterns are made by controlling the transfer of ecological land and encouraging afforestation on abandoned farmland. In this scenario, grassland increases by 9.49% compared to 2020, while forest land decreases by −0.18%. Although forest land still transfers to other land types under the ecological priority scenario, its rate of decline is much lower than the other three development scenarios, effectively protecting high-carbon-density ecological land. Although the area of construction land still increases, it decreases from 9.96% under the natural growth scenario to 3.85%. The sharp decline in arable land area is smaller than that under the natural development scenario, balancing social development and ecological protection. Spatially, the reduced arable land is still mainly concentrated in rapidly developing areas like Guangzhou and Zhongshan, with the direction of arable land transfer remaining towards construction land. In this scenario, high-carbon-density ecological land is protected, and the loss of carbon storage is minimized, decreasing by only 1.82%.

5. Discussion

5.1. The Impact of Land Use Balance Policy on the Spatiotemporal Distribution of Carbon Stock

This study calculated the impact of land use change in the Pearl River Delta (PRD) from 2000 to 2020 on carbon stock. It was found that land use change resulted in a decrease in ecosystem carbon stock of 20.47 × 10⁶ t, accounting for 93.83% of the total carbon stock change in the PRD. This reduction was primarily attributed to the conversion of farmland to urban land and the occupation of forest land by farmland, consistent with conclusions drawn by some scholars [33]. Xin Ye verified that the expansion of urban land leads to an annual carbon sink loss of 4.95 × 10¹² m3, predominantly in eastern China [42]. The reduction in farmland area due to urban expansion and water body enlargement, coupled with the conversion of ecological land to urban land, are key factors driving the decline in carbon stock [43]. The initial intention of implementing the land use balance policy was to control the conversion of farmland to urban land and safeguard food security. However, in practice, the main source of supplemented farmland was forest land, while urban construction land was not effectively restricted, exacerbating ecological damage and causing regional carbon loss. Therefore, in future land use planning, it is crucial not only to consider the quantity but also the quality of land use balance. Transforming the way farmland is supplemented, such as utilizing land reclamation methods instead of occupying forest land, is recommended [38]. Among the different scenario simulations, urban development is identified as a major driver of carbon loss, while ecological protection promotes carbon sequestration. The ecological priority scenario represents a favorable development path, resulting in minimal carbon loss. In this scenario, the expansion of construction land is controlled, and the reduction in farmland and forest land, among other ecological lands, is effectively managed. These findings prompt a re-evaluation of the specific effectiveness of the land use balance policy. While the initial aim was to replenish farmland to offset the loss caused by urban expansion, the implementation process, characterized by the “preferential occupation and inferior compensation” and the occupation of forest land, has exacerbated ecological risks and led to significant carbon loss. Therefore, future farmland protection policies should prioritize ecological impact, transform compensation methods, and utilize land reclamation to supplement high-quality farmland, thus establishing a comprehensive development pattern integrating quantity, quality, and ecological considerations for farmland.

5.2. The Regional Disparities in the Impact of Changes in Farmland Occupation and Compensation on Carbon Storage

The uneven regional development in the Pearl River Delta results in distinct spatial heterogeneity in the impact of farmland occupation and compensation on carbon storage. From 2000 to 2020, farmland occupation and compensation led to a significant decrease in the total carbon storage in the study area. During the period from 2000 to 2010, carbon loss predominated, while in the subsequent period from 2010 to 2020, carbon loss and carbon retention were generally balanced. The hot spots of carbon storage in the region are mainly areas with relatively minor carbon loss. From 2000 to 2010, the primary hot spot was Jiangmen City in the western part of the Pearl River Delta. This was attributed to the slower economic development in Jiangmen compared to other areas, resulting in fewer conversions of farmland and forest land for urban construction, thus leading to lesser carbon loss. Moreover, Jiangmen undertook significant tasks in farmland protection and occupation–compensation balance, as outlined in the Eleventh Five-Year Plan, which included agricultural restructuring and afforestation programs. This resulted in the transformation of low-carbon-density farmland into land categories with higher carbon density, leading to overall less carbon loss in the region. From 2010 to 2020, the hot spots shifted to Zhuhai City, Shenzhen’s Yantian District, and Guang Ming New District. This shift was primarily due to the influence of the “Guidance on Implementing the Combination of Supplementing Farmland Quantity with Enhancing Farmland Quality to Achieve Occupation–Compensation Balance” issued by the Guangdong Provincial Department of Land and Resources. The guidance effectively protected farmland, leading to an increase in carbon storage. Consequently, the region saw limited occupation of farmland, resulting in less overall carbon loss. Overall, from 2000 to 2020, hot spots were concentrated in eastern areas such as Dongguan, while cold spots were concentrated in western areas such as Foshan and Zhao Qing. The overall negligible change was observed in other regions. The improper implementation of farmland occupation and compensation policies in terms of quantity and quality may lead to severe overall carbon loss in the region. This finding is similar to the conclusion drawn by Tang Lan Ping regarding the overall severe loss of carbon storage under interprovincial farmland occupation–compensation balance in China. In summary, land use is an important factor that cannot be ignored in the future changes in carbon sinks [44]. As economic development and population growth have led to the expansion of built-up areas, an overall imbalance between farmland use and its restoration has resulted. Promoting the conversion of construction land back to farmland through land remediation policies can help achieve a balance in farmland occupation and compensation. The differences in natural conditions and socio-economic status across different regions of the Pearl River Delta led to regional disparities in the driving forces of farmland change and, consequently, in the impact of farmland occupation and compensation on carbon storage.

5.3. The Innovative Aspects, Limitations, and Prospects of the Study Are as Follows

The innovation of this study lies in its departure from the prevailing academic focus on land use and low-carbon research at large scales, where the impact of overall land use patterns on regional carbon storage dynamics is well-established. Moreover, existing studies predominantly concentrate on the temporal and spatial variations of carbon storage associated with single land use types, primarily focusing on forest carbon sinks. However, research examining the influence of land use changes, particularly those related to farmland occupation and compensation balance, on carbon storage dynamics is scarce. This study breaks new ground by investigating the effects of farmland occupation and compensation balance on carbon storage from a novel perspective. Utilizing the PLUS model, it simulates and predicts future land use patterns under various scenarios, thus enriching and expanding the research landscape within the field of land use and low-carbon studies. The research is not limited to a specific region and can provide universal value and theoretical reference for studies on land use and carbon sinks globally. The existing field data are insufficient to address all management scenarios for every soil type and climate [45]. Therefore, future research should focus more on exploring the relationship between research results and agricultural planning, as well as land use modeling using more advanced techniques [46], in order to identify potential solutions that could improve the current situation.
This study has several limitations. First, the study utilizes InVEST coupled with the PLUS model to analyze the spatiotemporal changes in cropland occupation and compensation in the Pearl River Delta and their impact on carbon storage. Although the model has the advantages of simplifying the carbon cycle process and ease of calculation, the evaluation of ecosystem carbon storage is complex. The model only considers the impact of changes in cropland area on carbon storage under a certain carbon density, ignoring the internal heterogeneity and dynamics of land use, as well as the variations in carbon density within the same type of land. Therefore, there is a certain discrepancy between the simulation results and reality. Second, while the study’s results broadly reflect the trend of carbon storage changes caused by spatiotemporal variations in cropland area, they do not consider the quality of cropland occupation and compensation as factors influencing carbon storage changes. Third, the carbon density coefficients used in this study are referenced from the existing literature without field investigation, and the changes in carbon density under the varying conditions of temperature, precipitation, and human activities over different periods were not fully considered. Consequently, there may be some errors in the calculated carbon storage. Future research should focus on field sampling and the continuous monitoring of carbon density to improve the accuracy of the calculations. Finally, terrestrial ecosystems are complex and dynamic systems, and land use changes are complicated processes. When using the PLUS model to simulate future land use changes, the selection of driving factors and the setting of transition matrices under future development scenarios involve a degree of subjectivity. Moreover, due to difficulties in data acquisition, policy factors such as ecological protection red lines and permanent basic farmland protection red lines were not considered. Therefore, the obtained land use data only approximate future land use data and do not represent actual land use.

6. Conclusions

(1)
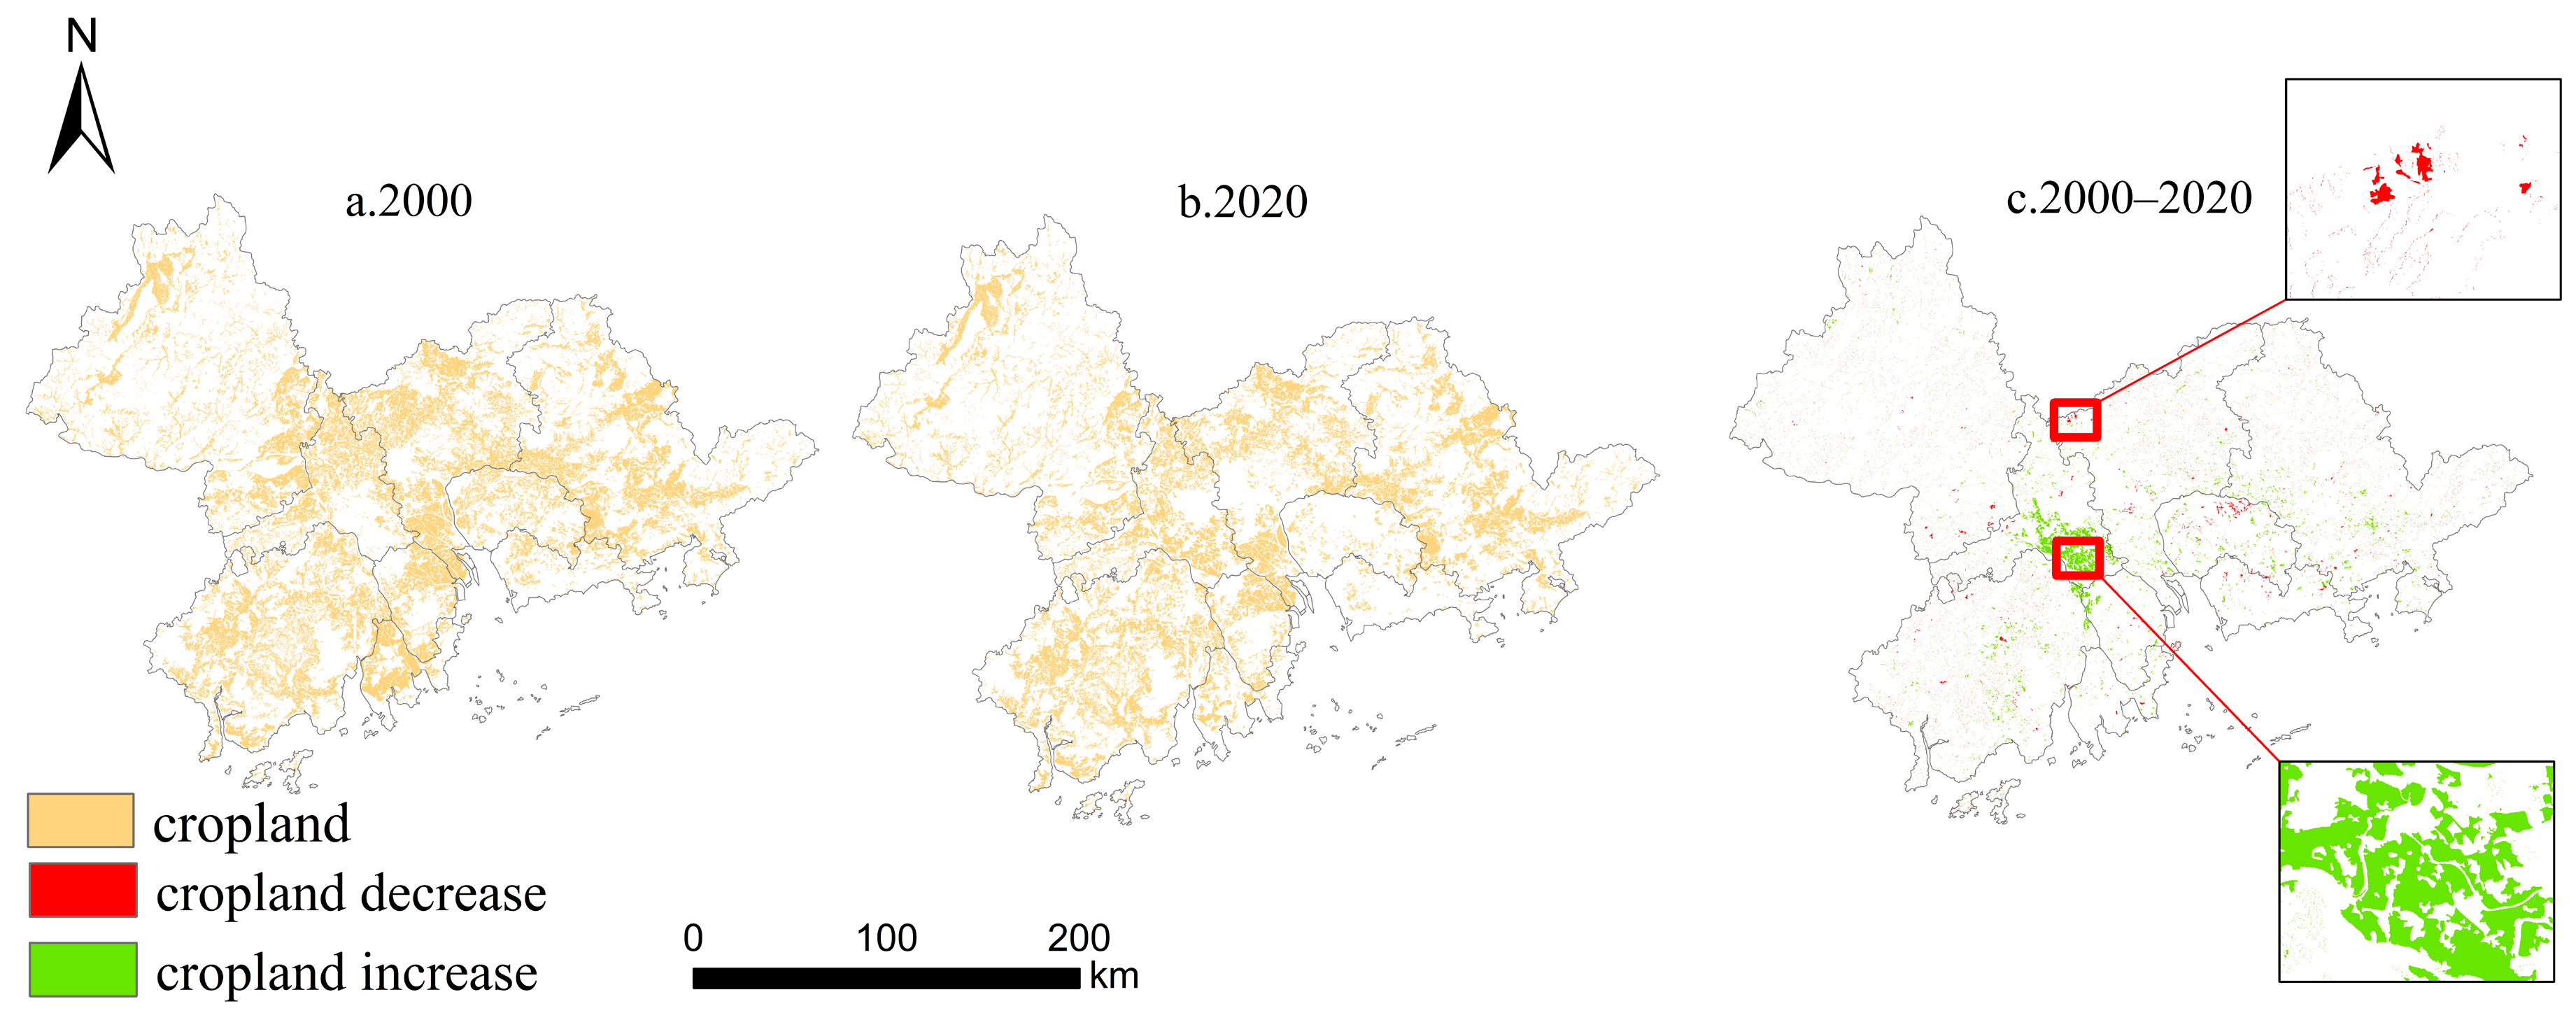
In 2000, 2010, and 2020, the cropland area in the Pearl River Delta was 14,514.99 km2, 12,715.09 km2, and 12,162.46 km2, respectively. The net change rate of cropland area from 2000 to 2020 was −0.81%, with a decrease of 16.49 km2. The lost cropland was mainly occupied by construction land and forest land.
(2)
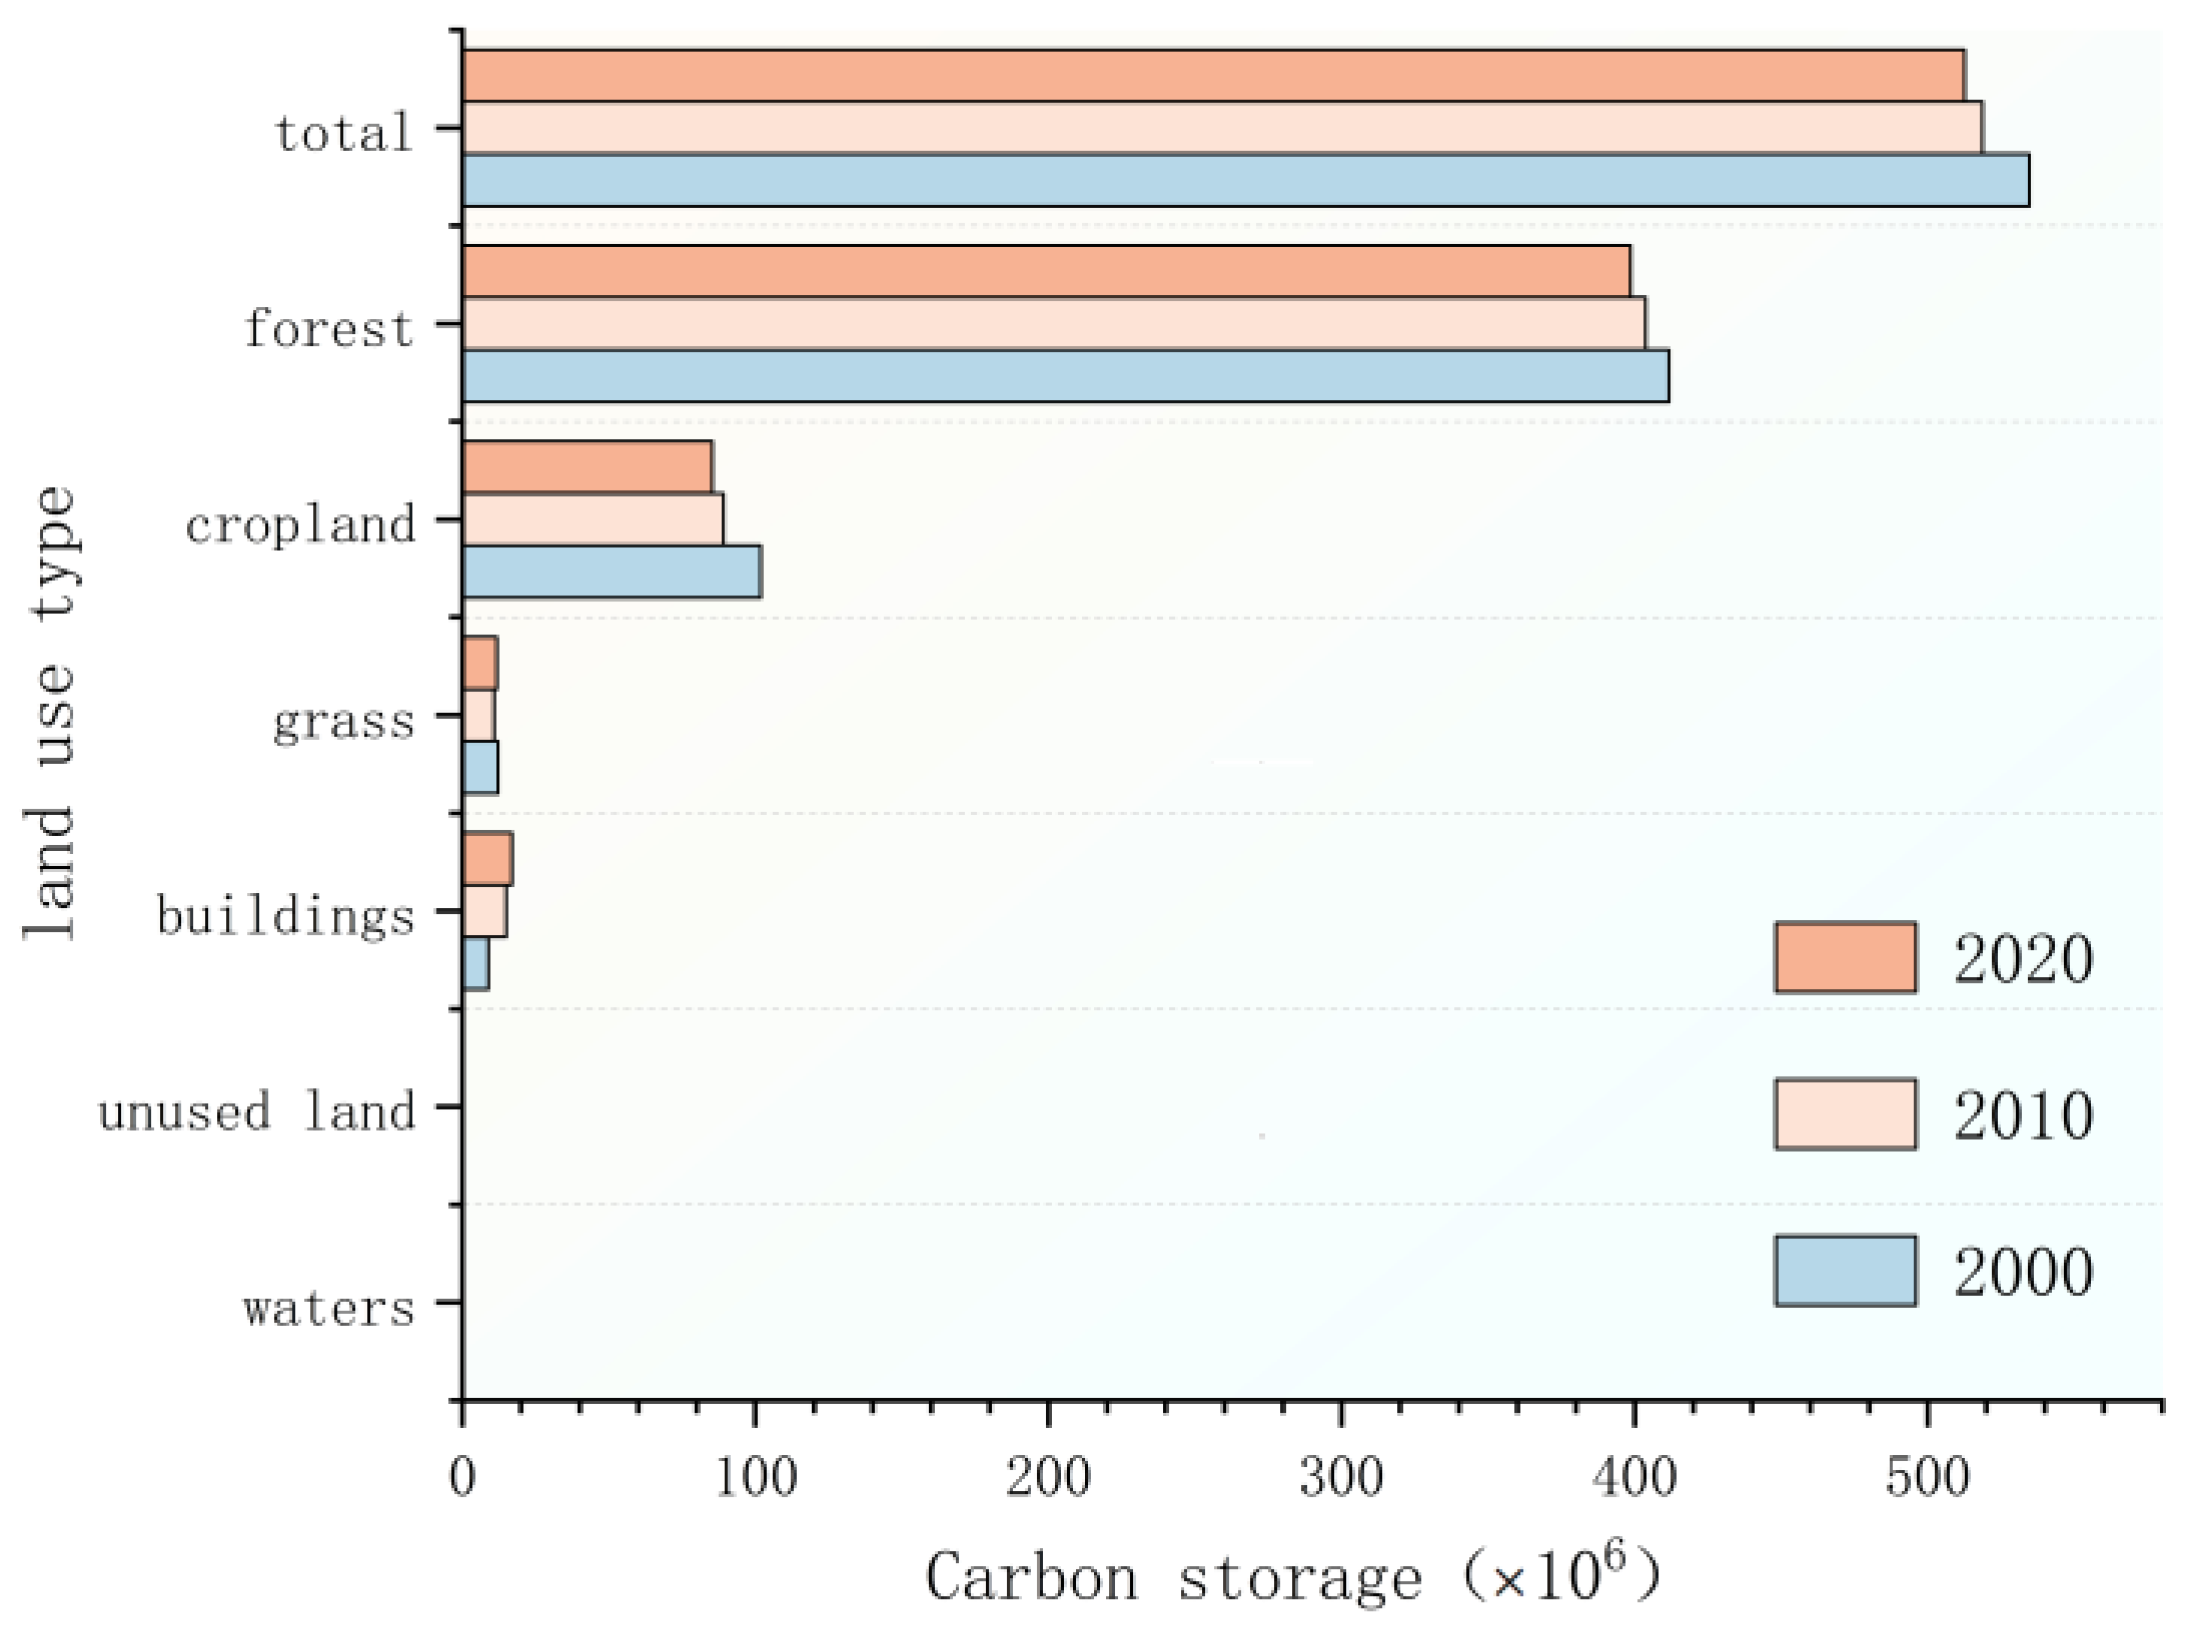
The pattern of low values in the center and high values around the periphery is exhibited by the carbon storage in the Pearl River Delta region. The terrestrial ecosystem carbon storage in the Pearl River Delta for 2000, 2010, and 2020 was 534.62 × 10⁶ t, 518.60 × 10⁶ t, and 512.57 × 10⁶ t, respectively. The regional carbon storage shows a decreasing trend year by year. The conversion of cropland and forest land is the main reason for the decline in total carbon storage in the Pearl River Delta region.
(3)
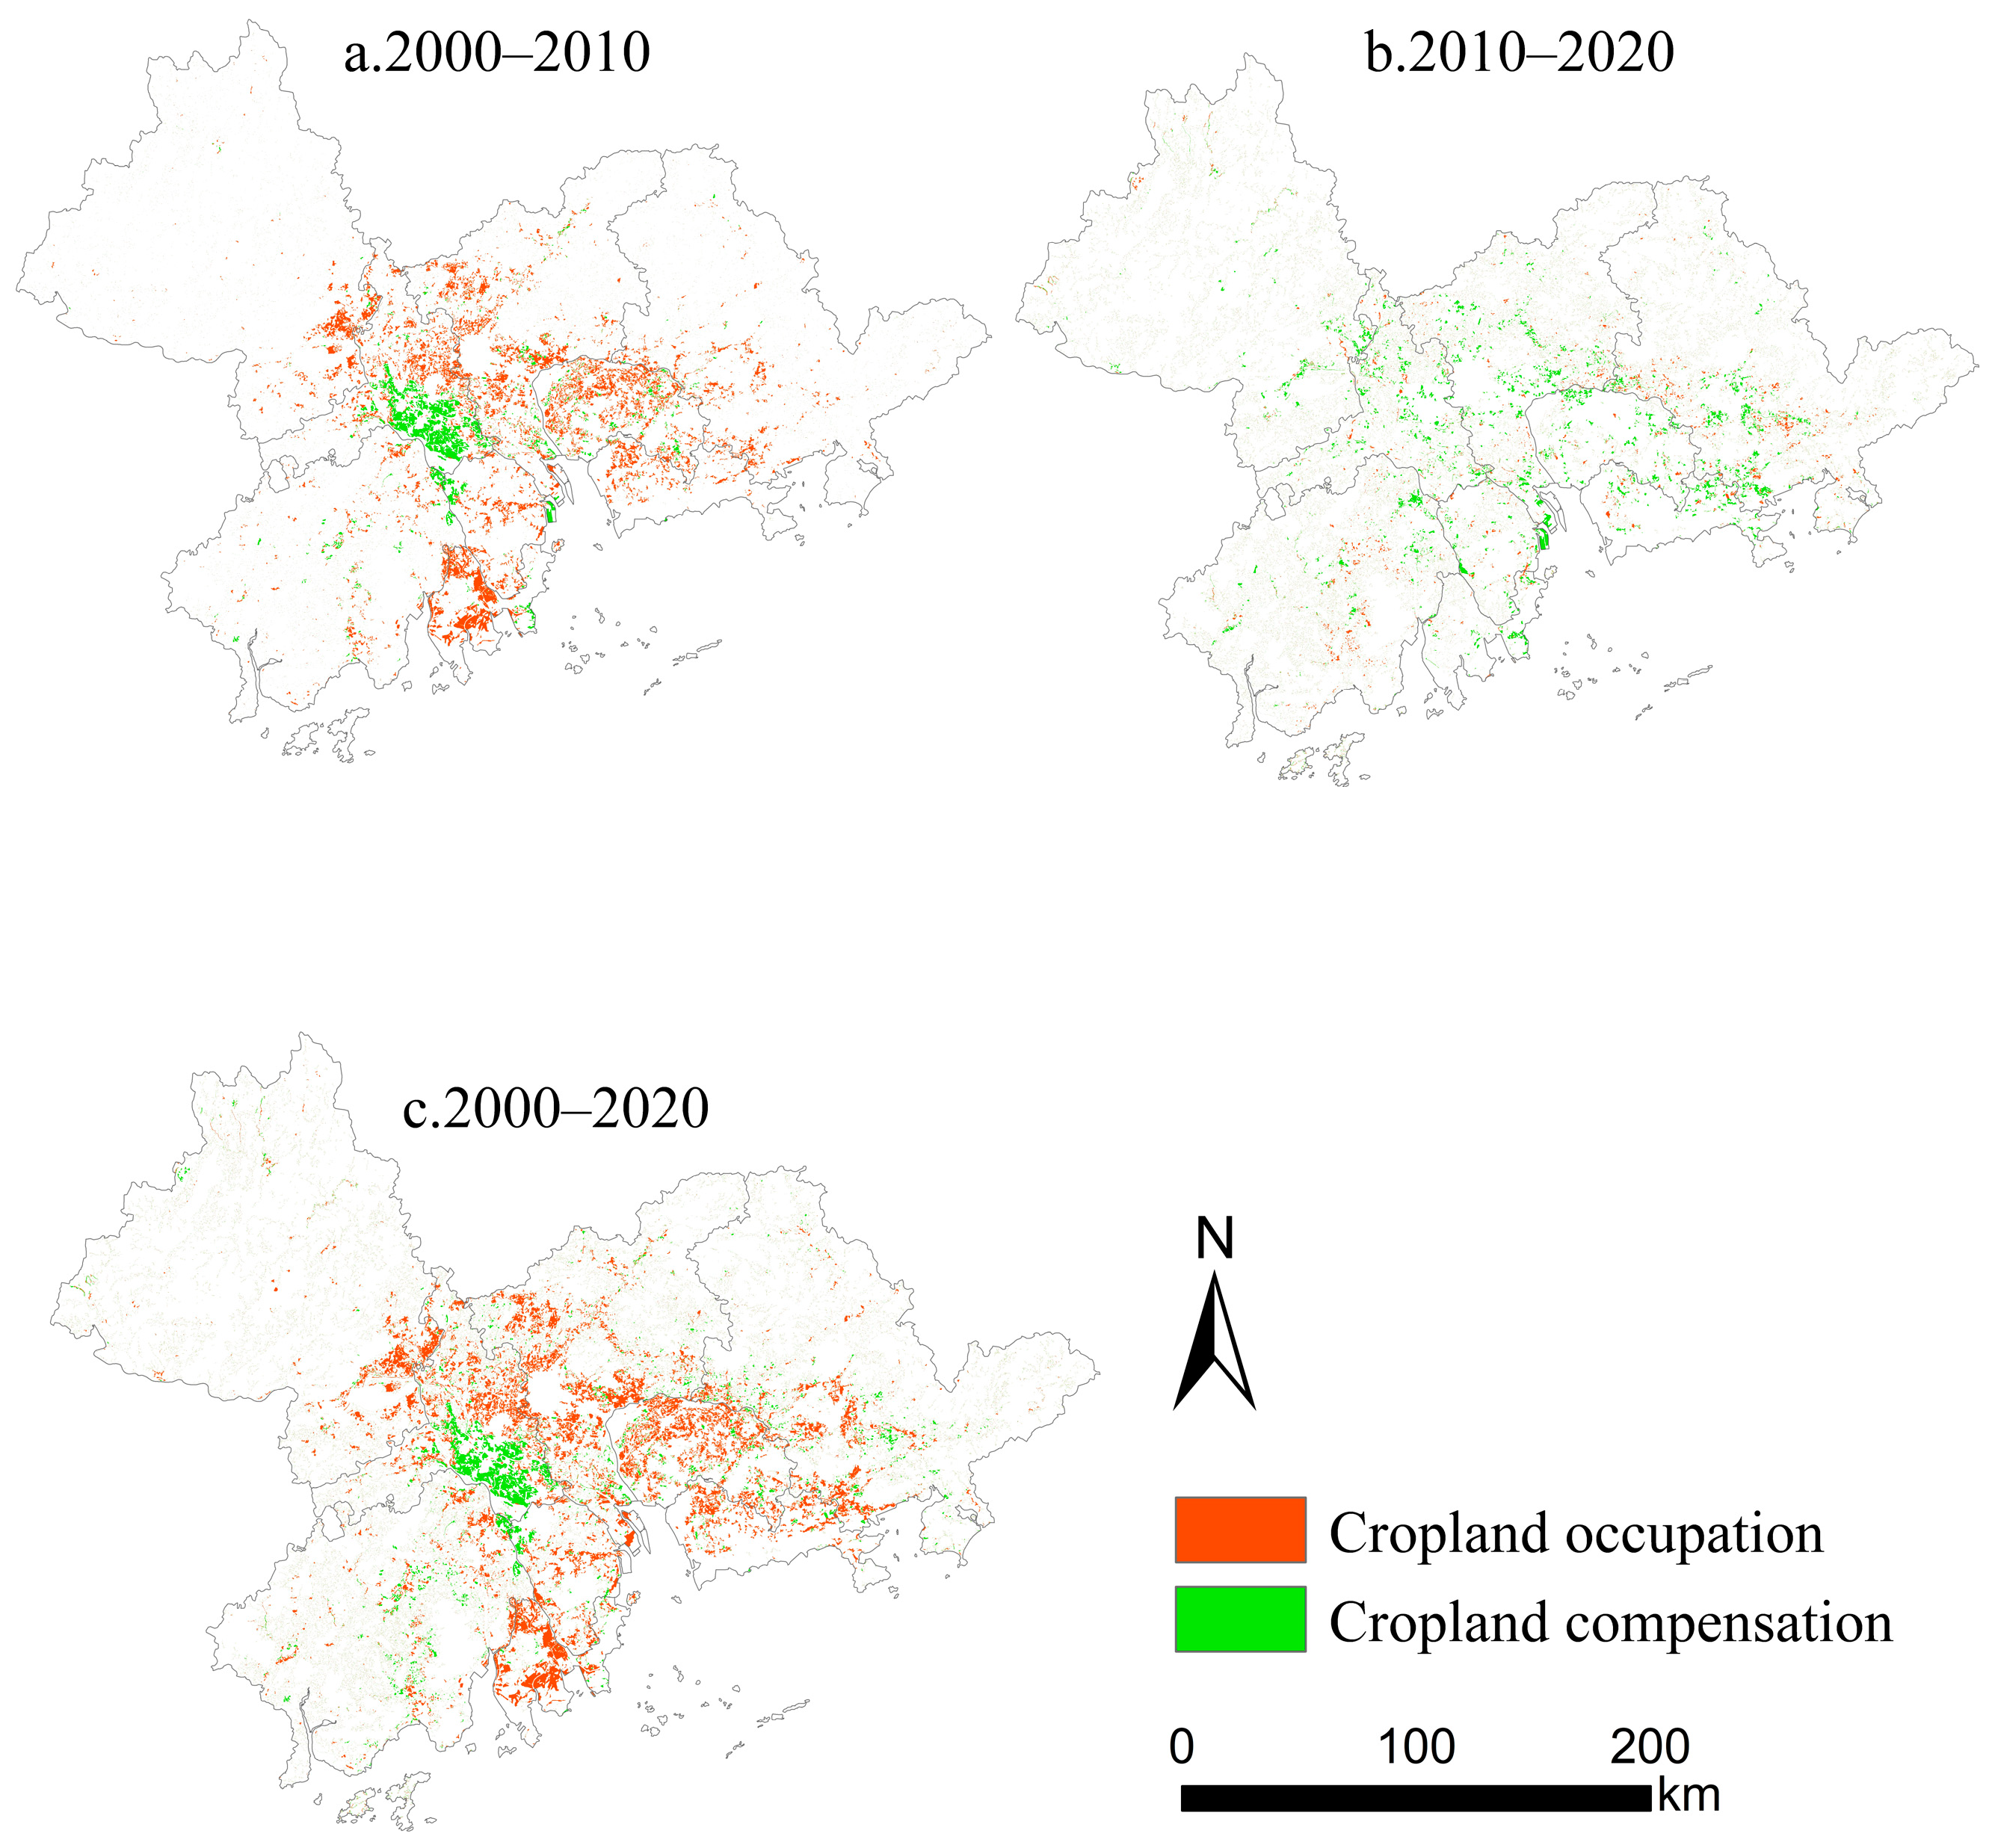
Over the 20-year period, changes in carbon storage were most significant. The carbon sequestration area occupied by cropland was significantly larger than the carbon loss area compensated by cropland, with the carbon loss concentrated in the more developed central regions and scattered around the periphery. The carbon sequestration areas were mainly concentrated in the southern part of Foshan. The imbalance in the quality of cropland occupation and compensation is an important reason for regional carbon loss.
(4)
Among different scenario simulations, the urban development scenario is an important driving factor causing carbon loss, while ecological protection is the driving force promoting carbon sequestration. The ecological priority scenario is a relatively optimal development scenario. In this scenario, the expansion of construction land and the reduction in ecological land such as cropland and forest land are effectively controlled, resulting in minimal carbon storage loss.

Author Contributions

Conceptualization, S.-Q.H. and D.-F.W.; methodology, S.-Q.H. and D.-F.W.; software, S.-Q.H. and J.-Y.L.; validation, J.-Y.L. and Y.-L.P.; formal analysis, S.-Q.H.; investigation, S.-Q.H.; writing—original draft, S.-Q.H.; writing—review and editing, S.-Q.H., D.-F.W., J.-Y.L. and Y.-L.P.; visualization, S.-Q.H. and J.-Y.L.; supervision, D.-F.W.; project administration, D.-F.W. and P.Z.; funding acquisition, D.-F.W. and P.Z. All authors have read and agreed to the published version of the manuscript.

Funding

This research was funded by the Open Fund Sponsored Project of Peking University; the Laboratory for Earth Surface 678 Processes Ministry of Education (Serial No. 6); the Guangdong Academy of Sciences’ Action Fund for Building a Comprehensive Industrial Technology Innovation Center (Grant No. 2022GDASZH-2022010201-01); the Guangdong Forestry Bureau National Park Special Fund Project (Grant No. LC-2021124); the National Natural Science Foundation of China (Grant No. 41771096); the Innovative Team Project of Guangdong Ordinary Colleges and Universities (Humanities and Social Sciences) (Grant No. 2023WCXTD019); the Guangdong Province Ordinary University characteristic innovation category project (Humanities and Social Sciences category) (Grant No. 2022WTSCX087); the Tertiary Education Scientific research project of Guangzhou Municipal Education Bureau (No. 202235269); the Guangzhou University Graduate Students’ “Civic Politics in the Curriculum” Demonstration Project, Science of land consolidation, 2024.1–2025.12 (No. 6); the Guangzhou University 2023 Exploratory Experimental Construction Project (No. SJ202310); the Teaching and Research Office of Real Estate Management Program, Teaching Quality and Teaching Reform Project for 2023 Undergraduate Colleges and Universities in Guangdong Province (Serial No. 269); the 2022 Guangzhou Higher Education Teaching Quality and Teaching Reform Project Teaching Team Program “Real Estate Management Teaching Team” (2022JXTD001); the 2022 Research Project of Guangdong Undergraduate Colleges and Universities Online Open Course Steering Committee: “Innovative Research on the Construction of First-class Courses Supported by Online Open Courses-Taking Real Estate Management as an Example” (2022ZXKC367); the Guangdong, Hong Kong and Macao Greater Bay Area Universities Online Open Course Consortium 2023 Education and Teaching Research and Reform Project “Exploration and Practice of Online-Offline Blended Teaching of Online Open Course ‘Real Estate Management’ Based on the Consortium Platform” (WGKM2023139); the Guangzhou University Practice Base for Industry-Education Integration of Cultivated Land Protection (24CJRH13); and the 2024 Guangzhou Higher Education Teaching Quality and Teaching Reform Project Section Industry-Teaching Integration Practice Teaching Base Project, Cultivated Land Protection Section Industry-Teaching Integration Practice Teaching Base (2024KCJJD002).

Data Availability Statement

Data are contained within the article.

Acknowledgments

The authors would like to acknowledge Wu Da Fang, Guangzhou University, for their valuable discussion and assistance in interpreting the significance of the results of this study. We also thank the editor and reviewers for their valuable comments and suggestions.

Conflicts of Interest

The authors declare no conflicts of interest.

References

  1. Han, L.; Peng, M.; Jiang, R.; Xu, B.; Zhang, B.; Chen, M. The Logical Roots, Model Exploration and Management Innovation of Farmland Occupation and Compensation Balance in the New Era—Reflections Based on the “Seminar on Improvement and Management Innovation of Farmland Occupation and Compensation Balance in the New Era”. China Land Sci. 2018, 32, 90–96. [Google Scholar]
  2. Fan, M.; Wang, Z.; Xue, Z. Spatiotemporal evolution characteristics, influencing factors of land use carbon emissions, and low-carbon development in Hubei Province, China. Ecol. Inform. 2024, 81, 102567. [Google Scholar] [CrossRef]
  3. Zhao, Q.; Xie, B.; Han, M. Unpacking the Sub-Regional Spatial Network of Land-Use Carbon Emissions: The Case of Sichuan Province in China. Land 2023, 12, 1927. [Google Scholar] [CrossRef]
  4. Li, X.; Hu, S.; Jiang, L.; Han, B.; Li, J.; Wei, X. Spatiotemporal Patterns and the Development Path of Land-Use Carbon Emissions from a Low-Carbon Perspective: A Case Study of Guizhou Province. Land 2023, 12, 1875. [Google Scholar] [CrossRef]
  5. Abdul, M.F.; Riad, S.M.; Yad, S.M. Impacts of land use-based carbon emission pattern on surface temperature dynamics: Experience from the urban and suburban areas of Khulna, Bangladesh. Remote Sens. Appl. Soc. Environ. 2021, 22, 100485. [Google Scholar]
  6. Dionizio, E.A.; Pimenta, F.M.; Lima, L.B.; Costa, M.H. Carbon stocks and dynamics of different land uses on the Cerrado agricultural frontier. PLoS ONE 2020, 15, e0241637. [Google Scholar] [CrossRef]
  7. Zhao, L.; Zhang, C.F.; Wang, Q.; Yang, C.H.; Suo, X.X.; Zhang, Q.P. Climate extremes and land use carbon emissions: Insight from the perspective of sustainable land use in the eastern coast of China. J. Clean. Prod. 2024, 452, 142219. [Google Scholar] [CrossRef]
  8. Zhang, X.M.; Fan, H.B.; Hou, H.; Xu, C.Q.; Sun, L.; Li, Q.Y.; Ren, J.Z. Spatiotemporal evolution and multi-scale coupling effects of land-use carbon emissions and ecological environmental quality. Sci. Total Environ. 2024, 922, 171149. [Google Scholar] [CrossRef] [PubMed]
  9. Wei, W.; Li, Y.Y.; Ma, L.B.; Xie, B.B.; Hao, R.J.; Chen, D.B.; Yang, S.L. Carbon emission change based on land use in Gansu Province. Environ. Monit. Assess. 2024, 196, 311. [Google Scholar] [CrossRef]
  10. Zhang, R.J.; Yu, K.H.; Luo, P.P. Spatio-Temporal Relationship between Land Use Carbon Emissions and Ecosystem Service Value in Guanzhong, China. Land 2024, 13, 118. [Google Scholar] [CrossRef]
  11. Liu, C.X.; Xu, R.; Xu, K.J.; Lin, Y.W.; Cao, Y.G. Carbon Emission Effects of Land Use in Chaobai River Region of Beijing–Tianjin–Hebei, China. Land 2023, 12, 1168. [Google Scholar] [CrossRef]
  12. Wani, O.A.; Kumar, S.S.; Hussain, N.; Wani, A.I.A.; Babu, S.; Alam, P.; Rashid, M.; Popescu, S.M.; Mansoor, S. Multi-scale Processes Influencing Global Carbon Storage and Land-Carbon-Climate Nexus: A Critical Review. Pedosphere 2023, 33, 250–267. [Google Scholar] [CrossRef]
  13. Hernández-Guzmán, R.; Ruiz-Luna, A.; González, C. Assessing and Modeling the Impact of Land Use and Changes in Land Cover Related to Carbon Storage in a Western Basin in Mexico. Remote Sens. Appl. Soc. Environ. 2019, 13, 318–327. [Google Scholar] [CrossRef]
  14. Robinson, D.T.; Zhang, J.X.; MacDonald, D.; Samson, C. Estimating Settlement Carbon Stock and Density Using an Inventory Approach and Quantifying Their Variation by Land Use and Parcel Size. Urban For. Urban Green. 2023, 82, 127878. [Google Scholar] [CrossRef]
  15. Thakur, T.K.; Swamy, S.L.; Thakur, A.; Mishra, A.; Bakshi, S.; Kumar, A.; Altaf, M.M.; Kumar, R. Land Cover Changes and Carbon Dynamics in Central India’s Dry Tropical Forests: A 25-Year Assessment and Nature-Based Eco-Restoration Approaches. J. Environ. Manag. 2024, 351, 119809. [Google Scholar] [CrossRef] [PubMed]
  16. Chalchissa, F.B.; Kuris, B.K. Modeling Soil Organic Carbon Dynamics under Extreme Climate and Land Use and Land Cover Changes in Western Oromia Regional State, Ethiopia. J. Environ. Manag. 2024, 350, 119598. [Google Scholar] [CrossRef]
  17. Gutierrez, S.; Grados, D.; Moller, A.B.; Gomes, L.D.; Beucher, A.M.; Giannini-Kurina, F.; de Jonge, L.W.; Greve, M.H. Unleashing the sequestration potential of soil organic carbon under climate and land use change scenarios in Danish agroecosystems. Sci. Total Environ. 2023, 905, 166921. [Google Scholar] [CrossRef] [PubMed]
  18. Sahu, C.; Mishra, R.; Basti, S. Land-Use Change Affects Carbon Storage and Lability in Tropical Soil of India. Geoderma Reg. 2023, 32, e00621. [Google Scholar] [CrossRef]
  19. Aquino, D.S.; Gavier-Pizarro, G.; Rescia, A.J.; Quintana, R.D. Wetland responses to non-stationary hydro-climatic dynamics in the context of land cover and land use change. Remote Sens. Appl. Soc. Environ. 2024, 34, 101156. [Google Scholar] [CrossRef]
  20. Nohemi, G.S.; Selene, O.O.; Oscar, E.; Priscila, M.O. Analysis of the Relationship between Land Use Change and Piezometric Levels in the Basin of Mexico. J. S. Am. Earth Sci. 2024, 136, 104817. [Google Scholar] [CrossRef]
  21. Colman, C.B.; Guerra, A.; Almagro, A.; Roque, F.D.; Rosa, I.M.D.; Fernandes, G.W.; Oliveira, P.T.S. Modeling the Brazilian Cerrado Land Use Change Highlights the Need to Account for Private Property Sizes for Biodiversity Conservation. Sci. Rep. 2024, 14, 4559. [Google Scholar] [CrossRef] [PubMed]
  22. Gao, F.J.; Xin, X.H.; Song, J.X.; Li, X.W.; Zhang, L.; Zhang, Y.; Liu, J.F. Simulation of LUCC Dynamics and Estimation of Carbon Stock under Different SSP-RCP Scenarios in Heilongjiang Province. Land 2023, 12, 1665. [Google Scholar] [CrossRef]
  23. Xie, L.J.; Bai, Z.K.; Yang, B.Y.; Fu, S. Simulation Analysis of Land-Use Pattern Evolution and Valuation of Terrestrial Ecosystem Carbon Storage of Changzhi City, China. Land 2022, 11, 1270. [Google Scholar] [CrossRef]
  24. Josephine, M. Environmental Integrity of Forest Offsets in a Changing Climate: Embedding Future Climate in Australia’s Sinks Policy Regime. J. Environ. Plan. Manag. 2024, 67, 1328–1346. [Google Scholar] [CrossRef]
  25. Ge, J.; Lin, B. Convergence or Divergence? Unraveling the Global Development Pattern of Forest Carbon Sink. Environ. Impact Assess. Rev. 2024, 105, 107442. [Google Scholar] [CrossRef]
  26. Mo, L.D.; Zohner, C.M.; Reich, P.B.; Liang, J.J.; de Miguel, S.; Nabuurs, G.J.; Renner, S.S.; van den Hoogen, J.; Araza, A.; Herold, M.; et al. Integrated Global Assessment of the Natural Forest Carbon Potential. Nature 2023, 624, 92–101. [Google Scholar] [CrossRef] [PubMed]
  27. Lv, T.G.; Geng, C.; Zhang, X.M.; Li, Z.Y.; Hu, H.; Fu, S.F. Impact of the Intensive Use of Urban Construction Land on Carbon Emission Efficiency: Evidence from the Urban Agglomeration in the Middle Reaches of the Yangtze River. Environ. Sci. Pollut. Res. 2023, 30, 113729–113746. [Google Scholar] [CrossRef]
  28. Song, S.X.; Kong, M.L.; Su, M.J.; Ma, Y.X. Study on Carbon Sink of Cropland and Influencing Factors: A Multiscale Analysis Based on Geographical Weighted Regression Model. J. Clean. Prod. 2024, 447, 141455. [Google Scholar] [CrossRef]
  29. Li, Y.Y.; Xue, C.X.; Chai, C.Q.; Li, W.; Li, N.; Yao, S.B. Influencing Factors and Spatiotemporal Heterogeneity of Net Carbon Sink of Conservation Tillage: Evidence from China. Environ. Sci. Pollut. Res. 2023, 30, 110913–110930. [Google Scholar] [CrossRef]
  30. Leifeld, J. Carbon Farming: Climate Change Mitigation via Non-Permanent Carbon Sinks. J. Environ. Manag. 2023, 339, 117893. [Google Scholar] [CrossRef]
  31. Kong, J.Q.; Chen, L.F. The Changes in Cropland Pattern Enhanced Carbon Storage in Northwest China. Agronomy 2023, 13, 2736. [Google Scholar] [CrossRef]
  32. Chen, C.; Xu, Y.F. Impacts, carbon effects, and forecasts for cropland expansion in the Northern Tianshan Mountain Economic Zone. Environ. Monit. Assess. 2024, 196, 7. [Google Scholar] [CrossRef] [PubMed]
  33. Schierhorn, F.; Müller, D.; Beringer, T.; Prishchepov, A.V.; Kuemmerle, T.; Balmann, A. Post-Soviet Cropland Abandonment and Carbon Sequestration in European Russia, Ukraine, and Belarus. Glob. Biogeochem. Cycles 2013, 27, 1175–1185. [Google Scholar] [CrossRef]
  34. Song, W.; Liu, M. Farmland Conversion Decreases Regional and National Land Quality in China. Land Degrad. Dev. 2017, 28, 459–471. [Google Scholar] [CrossRef]
  35. Ke, X.; van Vliet, J.; Zhou, T.; Verburg, P.H.; Zheng, W.; Liu, X. Direct and indirect loss of natural habitat due to built-up area expansion: A model-based analysis for the city of Wuhan, China. Land Use Policy 2018, 74, 231–239. [Google Scholar] [CrossRef]
  36. Ke, X.; Tang, L. Impact of coupling urban expansion and farmland protection on carbon storage of terrestrial ecosystems: A case study in Hubei Province, China. Acta Ecol. Sin. 2019, 39, 672–683. [Google Scholar]
  37. Tang, L.P.; Ke, X.L.; Zheng, W.W. Scenario Analysis of the Impact of Farmland Occupation and Compensation Balance on Carbon Storage. Land Econ. Res. 2020, 2, 76–93. [Google Scholar]
  38. He, Q.S.; Jiang, X. Measurement of the Impact of Temporal and Spatial Changes in Farmland Occupation and Compensation Area on Carbon Storage: A Case Study of Hubei Province. Acta Ecol. Sin. 2023, 43, 10413–10429. [Google Scholar] [CrossRef]
  39. Zheng, H.; Zheng, H. Evaluation and prediction of carbon storage in the Guangdong-Hong Kong-Macao Greater Bay Area based on land use/land cover dynamic changes. Environ. Sci. 2024, 45, 2321–2331. [Google Scholar] [CrossRef]
  40. Peng, Y.; Cheng, W.; Xu, X.; Song, H. Analysis and prediction of the spatiotemporal characteristics of land-use ecological risk and carbon storage in Wuhan metropolitan area. Ecol. Indic. 2024, 158, 111432. [Google Scholar] [CrossRef]
  41. Wang, B.; Liao, J.; Zhu, W. Neighborhood weight setting of FLUS model based on historical scenarios: A case study of land use simulation in 2030 for the Minnan-Triangle Urban Agglomeration. Acta Ecol. Sin. 2019, 39, 4284–4298. [Google Scholar]
  42. Ye, X.; Chuai, X. Carbon Sinks/Sources’ Spatiotemporal Evolution in China and Its Response to Built-Up Land Expansion. J. Environ. Manag. 2022, 321, 115863. [Google Scholar] [CrossRef] [PubMed]
  43. Fu, Y.; He, Y.; Chen, W.; Xiao, W.; Ren, H.; Shi, Y.; Hu, Z. Dynamics of Carbon Storage Driven by Land Use/Land Cover Transformation in Coal Mining Areas with a High Groundwater Table: A Case Study of Yanzhou Coal Mine, China. Environ. Res. 2024, 247, 118392. [Google Scholar] [CrossRef] [PubMed]
  44. Schulp, C.J.E.; Nabuurs, G.-J.; Verburg, P.H. Future carbon sequestration in Europe—Effects of land use change. Agric. Ecosyst. Environ. 2008, 127, 251–264. [Google Scholar] [CrossRef]
  45. Eve, M.D.; Sperow, M.; Howerton, K.; Paustian, K.; Follett, R.F. Predicted impact of management changes on soil carbon storage for each cropland region of the conterminous United States. J. Soil Water Conserv. 2002, 57, 196–204. [Google Scholar]
  46. Lin, J.; Li, X.; Wen, Y.; He, P. Modeling urban land-use changes using a landscape-driven patch-based cellular automaton (LP-CA). Cities 2023, 132, 103906. [Google Scholar] [CrossRef]
Figure 1. Location map of the Pearl River Delta.
Land 13 01195 g001
Figure 2. Temporal and spatial changes in cultivated land area in the Pearl River Delta from 2000 to 2020.
Land 13 01195 g002
Figure 3. Distribution of farmland occupation and compensation from 2000 to 2020.
Land 13 01195 g003
Figure 4. Net change rate of farmland area in various cities of the Pearl River Delta from 2000 to 2020.
Land 13 01195 g004
Figure 5. Variations in carbon reserves over time and space in the Pearl River Delta, 2000–2020.
Land 13 01195 g005
Figure 6. Carbon storage of various land use types from 2000 to 2020.
Land 13 01195 g006
Figure 7. Spatial distribution changes in carbon storage induced by cultivated land occupation and compensation in the Pearl River Delta from 2000 to 2020.
Land 13 01195 g007
Figure 8. Hot spot analysis of carbon storage changes resulting from land conversion in the Pearl River Delta.
Land 13 01195 g008
Figure 9. Land use in the Pearl River Delta for 2030: spatial simulation in four distinct scenarios.
Land 13 01195 g009
Figure 10. Spatial distribution simulation of carbon stock in different scenarios in the Pearl River Delta in 2030.
Land 13 01195 g010
Table 1. Data information and sources.
Data CategoryData NameData SourceData Accuracy/m
Base DataLand Cover Data for 3 Periodshttp://www.resdc.cn/30
Restricted conversion zoneLand Use Restriction FactorsArcGIS reclassification: 0—restriction conversion; 1—other30
Socioeconomic dataPopulation densityhttp://www.resdc.cn/1000
GDPhttp://www.resdc.cn/1000
Natural factor dataAnnual mean temperaturehttp://www.resdc.cn/1000
Annual average precipitationhttp://www.resdc.cn/1000
Soil typehttp://www.resdc.cn/1000
DEMGeospatial Data Cloud30
SlopeFrom DEM30
AspectFrom DEM30
Translates to “transportation data”Distance to main roadOpenStreetMap500
Distance to secondary roadOpenStreetMap500
Distance to railwayOpenStreetMap500
Distance to water bodiesOpenStreetMap500
Table 2. Carbon density of different land use types/mg·hm−2.
Land Use TypeC_AboveC_AboveC_SoilC_Dead
Cultivated land6.115.2657.831.32
Woodland28.3810.8295.352.11
Grassland14.2915.1975.78.46
Waters0000
Building land0020.780
Unused land1.96015.880
Ocean6.115.2657.831.32
Table 3. Cultivated land occupation and compensation areas in the Pearl River Delta from 2000 to 2020 km2.
Type of Cultivated Land Occupation and CompensationPeriod
2000–20102010–20202000–2020
Cultivated Land OccupationCropland–Woodland200.37277.50390.08
Cropland–Grassland6.5821.1446.74
Cropland–Waters653.81213.58778.23
Cropland–Buildings1786.22857.812463.39
Cropland–Unused land0.140.210.22
Total2647.121370.223678.66
Cultivated Land CompensationWoodland–Cropland146.75300.49385.73
Grassland–Cropland10.1317.9224.78
Waters–Cropland552.68126.05573.81
Buildings–Cropland129.89372.89340.45
Unused land–Cropland2.120.500.96
Total841.56817.851325.73
Dynamicity of Farmland Changes −1.24%−0.43%−0.81
Table 4. Carbon storage changes caused by land conversion in the Pearl River Delta region from 2000 to 2020.
Type of Cultivated Land Occupation and CompensationPeriod × 106/t
2000–20102010–20202000–2020
Cultivated Land OccupationCropland–Woodland1.401.952.73
Cropland–Grassland0.050.150.33
Cropland–Waters−4.58−1.50−5.46
Cropland–Building−12.52−6.01−17.27
Cropland–Unused land−0.0010−0.0015−0.0016
Total−15.65−5.42−19.67
Cultivated Land CompensationWoodland–Cropland−1.99−4.08−5.24
Grassland–Cropland−0.11−0.20−0.28
Waters–Cropland4.023.874.02
Building–Cropland0.270.770.70
Unused land–Cropland0.00380.00090.0017
Total2.180.36−0.80
Table 5. Carbon stock and land use structure in different scenarios in the Pearl River Delta for 2030 (area/km2 C × 106 t).
Land Use ScenariosCroplandWoodlandGrasslandWatersBuildingsUnused LandCarbon Stock
2020 Actual Demand12,160.3229,323.661041.334014.998159.346.82512.57
2030 Natural Development Scenario11,711.6828,961.631121.733934.748972.314.39496.92
2030 Urban Development Scenario11,560.3628,803.031091.643891.849355.244.38494.40
2030 Farmland Protection Scenario12,351.0328,882.021115.673873.448479.994.33499.60
2030 Ecological Priority Scenario11,877.5829,271.621140.203938.928473.764.40503.24
Natural Development Scenario Change Rate−3.69−1.237.72−2.009.9635.66−3.05
Urban Development Scenario Change Rate−4.93−1.784.83−3.0714.6635.88−3.54
The Change Rate under the Farmland Protection Scenario1.57−1.517.14−3.533.9336.58−2.53
The Change Rate under the Ecological Priority Scenario−2.33−0.189.49−1.893.8535.58−1.82
Disclaimer/Publisher’s Note: The statements, opinions and data contained in all publications are solely those of the individual author(s) and contributor(s) and not of MDPI and/or the editor(s). MDPI and/or the editor(s) disclaim responsibility for any injury to people or property resulting from any ideas, methods, instructions or products referred to in the content.

