Abstract
Smart community construction (SCC) is pivotal for urban modernization, yet extant research often neglects the residents’ perceptions of these initiatives, focusing predominantly on technological advancements. A hybrid evaluation method integrating the Entropy Weight Method (EWM) and PROMETHEE II was developed to quantify residents’ perceptions of SCC. Through the literature review and expert interview, the evaluation indicators for residents’ perceptions of the SCC were identified, leading to the development of an evaluation indicator system consisting of 5 dimensions and 25 indicators. The hybrid evaluation method that combines EWM and PROMETHEE II was then applied to quantify the level of residents’ perceptions of SCC across five communities in Shenzhen city of China, using data from 410 valid questionnaires. The results indicated that the Baolong community had the highest level of the SCC, while the Nanyuan community exhibited the lowest ranking. Sensitivity analysis confirmed the robustness of these results, thereby validating the evaluation process. Moreover, recommendations were proposed to enhance residents’ perceptions of smart community initiatives. This research not only introduces a novel evaluation method that expands the body of knowledge on the SCC and residents’ perceptions but also helps the government develop sustainable SCC strategies.
1. Introduction
With the acceleration of urbanization, smart communities are becoming a new direction for sustainable community development [1]. Generally, the smart community prioritizes the well-being of its residents, emphasizes mutual support and community cohesion, and offers smart services that are inclusive and hospitable [2,3,4]. It aims to provide a wide range of services that promote feelings of safety, happiness, and a sense of gain among residents, ultimately fostering a welcoming and cohesive living environment [5,6]. Numerous countries have acknowledged the advantages of smart communities and implemented initiatives to foster their growth [6,7]. In alignment with this trend, the Chinese government has put forth various policies to facilitate SCC, such as the ‘Guidelines for the Construction of Smart Communities,’ ‘Smart Community Construction and Operation Guide,’ and ‘Opinions on Continuous Improvement in Smart Communities’ [7]. In this process, the development of smart communities increasingly focuses on exploring the outcomes of the SCC from the perspective of residents’ perceptions [8]. However, despite these efforts, evaluating the SCC from the perspective of residents’ perceptions has become increasingly complex and challenging due to the diverse and intricate nature of residents’ perceptions [9].
In recent years, researchers have conducted studies focusing on the public perception of smart cities and the evaluation of SCC. Regarding the public perception of smart cities, the relationship between smart cities and residents has been explored, including analyzing the public perception of smart city services and preferences [10], exploring factors that influence the quality-of-life perceptions in smart cities [11], and conducting research on perceptions of smart technology among vulnerable consumers [12]. With the continuous advancement of smart city research, scholars have increasingly focused on the SCC [13,14,15,16]. Existing studies explore a variety of dimensions that are critical to assessing the SCC, including quality of life [7], community engagement [17], sustainability [18], and resilience [19]. Despite these studies significantly enhancing residents’ perceptions, more research is needed to evaluate residents’ perceptions of the SCC as residents place more importance on perception than ever before [20,21,22]. Meanwhile, researchers have explored a wide range of methods related to the evaluation of the SCC. For example, the CRITIC-PROMETHEE II was utilized to quantify the level of smart community services [23], while the ANP-FCE was employed to evaluate the disaster resilience of the urban community [24]. On this basis, the EWM-FCE-ODM method was utilized to evaluate the residents’ sense of gain on the SCC [25]. Nevertheless, few studies have combined the EWM with the preference ranking organization method for enrichment evaluations II (PROMETHEE II) to explore the SCC from the perspective of residents’ perceptions, which may facilitate decision-makers’ understanding of indicators by providing visual tools for easy comparison and ranking [25,26,27,28]. Overall, several previous studies have inspired this study, but some gaps in the field are evident [7,29]. Comprehensive evaluation indicators for residents’ perceptions of the SCC are still lacking since smart community development is still in its infancy. Furthermore, an integrated evaluation method utilizing EWM and PROMETHEE II approaches to quantify residents’ perceptions of the SCC is relatively rare. Finally, the evaluation results must be verified for their reliability and validity in order to ensure their robustness.
Three principal objectives have been determined to address existing gaps in the field. The initial objective is the systematic identification of evaluation indicators that capture residents’ perceptions of the SCC. Subsequently, this research aims to enhance the precision of assessments concerning these perceptions by developing an integrated evaluation method. The third objective seeks to devise more effective strategies to improve these perceptions significantly. Following these objectives, this study has established an integrated evaluation indicator system and formulated a novel evaluation method that incorporates the EWM and PROMETHEE II approaches. This combination clearly represents residents’ perceptions of SCC, ensuring an objective and systematic evaluation process. This research not only expands the knowledge base for quantifying residents’ perceptions of the SCC but also provides cost-effective strategies for smart community development, thus providing a better living environment for residents in these communities.
2. Materials and Methods
A novel evaluation method was established using EWM and PROMETHEE II approaches to quantify residents’ perceptions of the SCC. The evaluation process is shown in Figure 1. Specifically, Step 1 is to identify the evaluation indicators for residents’ perceptions of the SCC using the literature review (LR) and expert interviews. Step 2 is to determine the evaluation indicator weights through EWM. Step 3 is to quantify residents’ perceptions of the SCC using PROMETHEE II.
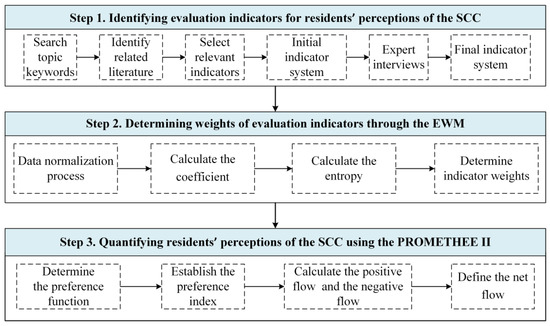
Figure 1.
The evaluation process of residents’ perceptions of the SCC.
2.1. Identifying Evaluation Indicators for Residents’ Perceptions of the SCC
Establishing a comprehensive evaluation indicator system is essential to evaluate residents’ perceptions of the SCC. The LR was used to identify the relevant evaluation indicators [30,31,32]. According to the SCC-related literature and evaluation guidelines, the primary indicator system was developed, encompassing 5 dimensions and 28 indicators [5,6,7,20,21]. Further details regarding the primary evaluation indicator system are provided in Supplementary File S1. Subsequently, in August 2022, a panel of 27 experts with significant expertise in the SCC field were invited for an interview session to refine the initial evaluation criteria. The meeting was conducted via VooV Meeting. During each session, each expert was interviewed using the expert questionnaire, lasting at least one hour. This expert questionnaire, as detailed in Supplementary File S2 and summarized in Table 1, consists of two main parts. The first part collects basic information about the experts, such as demographic and professional background, which helps ensure a diverse and relevant panel of contributors. The second part of the questionnaire requires experts to rate the importance of various indicators for evaluating residents’ perceptions of the SCC. The rating is done on a five-point Likert scale ranging from 1 (very unimportant) to 5 (very important). During the interview, experts offered their professional insights on these indicators, promoting the rationalization of the evaluation indicator system. The detailed information of the experts is shown in Table 2. As a result, a total of 25 indicators are included across 5 dimensions as part of the evaluation indicator system for residents’ perceptions of the SCC, as shown in Figure 2. Further details regarding the final evaluation indicator system are provided in Supplementary File S3.

Table 1.
Summary of Expert Questionnaire (Detailed information can be seen in Supplemental File S2).
Table 2.
Experts Information.

Figure 2.
Evaluation indicator system of residents’ perceptions of the SCC.
2.2. Determining Weights of Evaluation Indicators through the EWM
The EWM was chosen to determine the weights of evaluation indicators of residents’ perceptions of the SCC. This method effectively manages multiple criteria with varying measurement units and considers their interrelationships and correlations, enhancing the accuracy and consistency of the results [33]. The detailed calculation process is shown below.
- (1)
- Data normalization.
Owing to the notable differences in the scope of evaluation indicators and units of measurement, data normalization is required to standardize the scale of all the data in a given set, transforming the values to a uniform range between 0 and 1. The calculation equations are as follows:
The equation representing the positive indicator is
The equation to calculate the negative indicator is
where Zij represents the standardized values of the jth indicator for SCC in the range 0–1; Xij is the original value of the jth indicator in the ith community; Xjmin and Xjmax are the minimum and maximum values of the jth indicator of all communities.
Then, all zero-normalized data are converted into non-zero values:
where Zij’ denotes the processed data of evaluation indicators for SCC, and A is a constant (typically considered as 0.0001) [34].
- (2)
- The entropy of evaluation indicators.
After normalizing the data, the entropy value of the evaluation indicators, the coefficient Pij, is calculated as shown in Equation (4):
In this study, N is the total count of communities.
The entropy of evaluation indicators Ej is calculated using the Equation (5):
- (3)
- The weight of the jth indicator.
According to the entropy of the evaluation indicators, the coefficient Gj can be calculated with Equation (6):
The weight of the jth indicator Wj is determined by the Equation (7):
2.3. Quantifying Residents’ Perceptions of the SCC Using the PROMETHEE II
PROMETHEE II is a multi-criteria decision management (MCDM) approach, offering preference modeling and decision-making [28]. It is recognized for effectively handling complex decision scenarios. The flexibility of PROMETHEE II allows it to analyze alternative options comprehensively by incorporating a wide range of criteria and preferences [27]. Therefore, it is used to rank the level of residents’ perceptions of the SCC in this study. Here are the detailed procedures:
Calculating the preference function over the criterion:
The quantifies the degree to which alternative is favored over alternative based on criterion . Due to its sensitivity to distance changes, the Gaussian rule is selected as the preference function [28], as shown in Equation (8).
The multi-criteria preference indexes are established as follows:
where ; . The variable represents the level of importance assigned to the evaluation of the community and by decision-makers when considering all indicators concurrently.
By utilizing Equations (10) and (11), it is possible to determine each evaluation object’s positive and negative flow.
where and are unequal, denotes the positive community trajectory, suggesting the community’s potential superiority over other evaluation entities, with higher values corresponding to higher levels. Conversely, signifies a community’s negative trajectory, suggesting the potential superiority of other evaluation entities over the community, with lower values corresponding to higher levels.
The ranking of the evaluation objects can be calculated by Equation (12):
where , , is greater, the evaluation community performs better.
2.4. Rationale for Using EWM and PROMETHEE II
Integrating the EWM and PROMETHEE II approach offers significant advantages in evaluating residents’ perceptions of the SCC. This combined method allows comprehensive assessments across multiple dimensions, including the perceptions of community infrastructure, integrated services platform, community safety, community service, and community governance. The EWM’s objective weighting mechanism enhances the precision of the evaluation process by accurately reflecting the significance of each indicator. Moreover, the adaptability of the EWM-PROMETHEE II enables its application across various residents’ perception scenarios, facilitating unbiased evaluations of smart communities with diverse characteristics. This method also provides stakeholders with visual representations of decision outcomes, assisting in the formulation of informed strategies for SCC. Overall, the EWM-PROMETHEE II method offers a robust framework for quantifying residents’ perceptions of the SCC, thereby yielding valuable insights that may enhance residents’ well-being in practical settings.
2.5. Case Study
2.5.1. Study Area
Shenzhen city, located on the coast in the south of China, is a pioneer in smart city development [29]. Several factors led to the selection of this city as the study area. Shenzhen’s urbanization rate has reached 100%, a notable achievement within China, positioning it as a leading city in the SCC [7]. Residents-centered services make the city ideal for investigating residents’ perceptions of SCC [21]. Furthermore, Shenzhen has developed multiple successful smart communities, providing valuable insights into residents’ perceptions of such initiatives [25].
Among Shenzhen’s ten administrative districts, Luohu, Nanshan, and Longgang District were selected in light of their substantial residential populations and contributions to the development of smart communities [35]. These districts have already initiated some SCC projects, which provided a wealth of data for in-depth analysis [7]. Considering the comparatively lower levels of smart community initiatives in the other seven districts at the time of our research, they were excluded from this study [23].
Following interviews with 27 experts in the SCC, five smart communities were selected as sample sites in Shenzhen. These include Nanyuan and Fuguang in Nanshan District, Baolong and Huilongpo in Longgang District, and Yucun in Luohu District, as depicted in Figure 3. Each community was selected due to its distinct contributions to the SCC. Baolong and Yucun communities, for instance, have developed integrated service platforms for enhancing public services, which meet residents’ demands, particularly in healthcare and elderly care services. Meanwhile, the Internet of Things technology has been used in the Huilongpo and Fuguang communities to boost the efficiency of handling official affairs for residents. Similarly, the Nanyuan community stands out for offering high-quality convenience services.
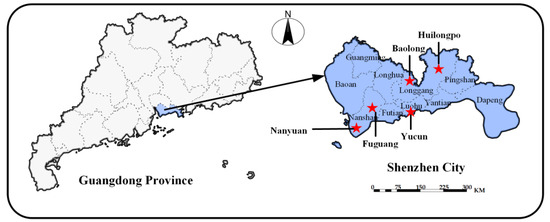
Figure 3.
The location of the selected five smart communities.
2.5.2. Data Collection
A survey was conducted in October 2022 to evaluate residents’ perceptions of the SCC in Shenzhen. The questionnaire included a brief introduction to the study’s objectives, demographic and socioeconomic information of the respondents, and detailed information on evaluation indicators. Residents were asked to rate each indicator on a five-point Likert scale ranging from 1 (very poor) to 5 (very good). Since Shenzhen is a Chinese city and most residents are Mandarin speakers, the survey was conducted to ensure that respondents could comfortably understand and answer the questions. In particular, the questionnaire was initially prepared in English and then translated into Mandarin by bilingual experts. To ensure accuracy and reliability, we used a back-translation method; the Mandarin version was translated back into English by a different set of bilingual experts and compared with the original. Any discrepancies were resolved through discussion to ensure the final version accurately reflected the intended content. Detailed information about the questionnaire is provided in Supplementary File S4. According to the sample size formula proposed by Cochran [21], the required sample size was calculated to be 385 with a 95% confidence interval and a 5% confidence level. Data collection was facilitated through the Wenjuanxing platform, which converts questionnaires into online formats accessible via hyperlinks or QR codes, allowing for easy completion on mobile devices [21]. The survey targeted residents of the Nanyuan, Fuguang, Yucun, Baolong, and Huilongpo communities. Considering potential errors in the distribution of the questionnaires, 450 questionnaires were distributed in total via Wenjuanxing, and 410 valid responses were received, which corresponds to an effective response rate of 91.1%. Table 3 provides descriptive details about the respondents, showing that the demographic and socio-economic characteristics, such as gender, age, education level, years of residence, forms of housing, working conditions, and monthly income, represent the studied communities. These attributes validate the reliability of the survey data for further analysis.
Table 3.
Descriptive Statistics of Individual Characteristics.
3. Results
3.1. The Results of Evaluation Indicator Weights through the EWM
According to 410 valid questionnaires collected, the EWM method can be used to determine the weights of evaluation indicators. The detailed data, which include the results of calculations based on Equations (1)–(5), are shown in Supplementary File S5. The data provided by residents exhibited a high level of reliability, with a confidence level (Cronbach’s α) of 0.922. Subsequently, the weight of each indicator was calculated using Equations (1)–(5), as illustrated in Figure 4. It can be observed that the weights of 25 indicators range from 0.0253 to 0.0622. Moreover, the result shows that the top three weights of indicators are L2S3 (6.22%), L1S4 (5.30%), and L5S4 (5.40%), indicating that the three indicators are the most important for determining the level of residents’ perceptions of the SCC. Conversely, the lowest three weights of indicators are L1S5 (2.53%), L3S6 (3.00%), and L5S3 (3.01%). It is noteworthy that two indicators have weights below 3%, collectively representing 4% of the total. The majority of indicators, specifically 15 in total, have weights ranging from 3% to 4%, constituting the largest proportion. Furthermore, 9 indicators have weights exceeding 3%, accounting for 36% in total.

Figure 4.
The weights of evaluation indicators for residents’ perceptions of the SCC.
3.2. The Evaluation Results of Residents’ Perceptions of the SCC through the PROMETHEE II
After obtaining the weights for the 25 evaluation indicators, the PROMETHEE II method, combined with the questionnaire data from 410 respondents, can be used to quantify the residents’ perceptions of the SCC across five communities. Specifically, the study utilized Equations (8)–(12) to calculate the net flow for the five communities and ranked them as presented in Table 4. The net flow values varied from −0.1749 to 0.4335, with higher values reflecting more favorable levels of residents’ perceptions of the SCC. Consequently, the Baolong community exhibited the highest level of residents’ perceptions of the SCC with a value of 0.4335, followed by the Yucun community (0.0111), Huilongpo community (−0.1126), and Fuguang community (−0.1571). Conversely, the Nanyuan community displayed the lowest level of residents’ perceptions of the SCC at −0.1749.
Table 4.
The level of residents’ perceptions of the SCC in the five communities.
Subsequently, a comprehensive analysis was conducted on the distinctions among the five communities across various evaluation dimensions by calculating the net flow rankings for each community in five dimensions, as depicted in Table 5. The results revealed that the Baolong community attained the top rank in all five dimensions, underscoring its prominent standing in residents’ perceptions of the SCC. Conversely, the Nanyuan community ranked last overall but secured second rank in terms of perception of community infrastructure with a net flow of 0.3067. This indicates that while the general residents’ perceptions of the SCC in certain communities may have been lacking, these communities demonstrated excellence in specific dimensions. For example, the Huilongpo community ranked second in the perception of community governance despite ranking third to last overall. Similarly, the Fuguang community, which was fourth to last overall, ranked third in the perception of community infrastructure.
Table 5.
The level of residents’ perceptions of the SCC across ten dimensions rankings.
As shown in Figure 5, the results were displayed using a radar chart to enhance readability, illustrating the residents’ perceptions of the SCC across 25 evaluation indicators in the five communities. The radar chart provided an intuitive method for identifying the evaluation indicators where these communities need improvement. The results indicated that while these communities demonstrated excellence in specific dimensions, they still require further improvement in others. Specifically, the Baolong community excelled in most indicators across all five dimensions but ranked lowest in the perception of property services. In contrast, while performing the worst overall, the Nanyuan community ranked first in the perception of property services, response to public safety events, infrastructure planning, and the visualization platform. This ranking suggests that residents in this community perceive strong effectiveness in the SCC within these aspects.
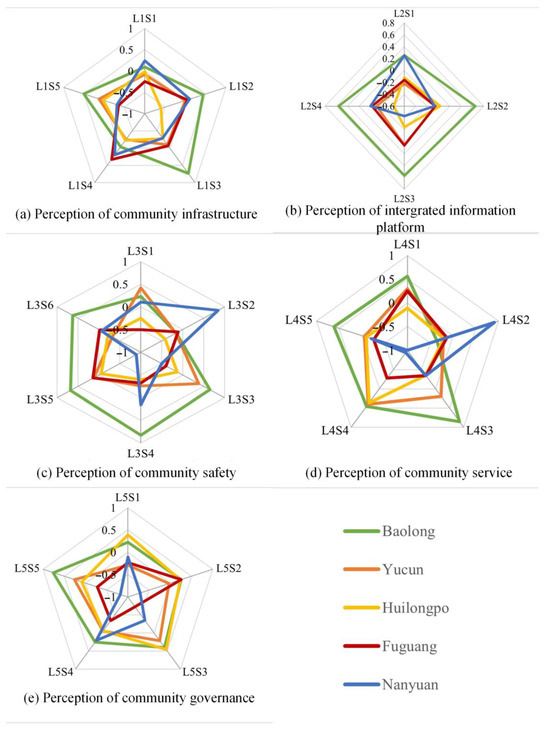
Figure 5.
The ranking of 5 communities in residents’ perceptions of the SCC across 25 indicators.
3.3. Validating the Results via Sensitivity Analysis
Sensitivity analysis is a critical tool used to assess the impact of varying weights on decision outcomes, offering insights into the robustness of these decisions [28]. By systematically adjusting the weights assigned to different indicators, this study evaluates how sensitive the outcomes are to these changes. A high degree of sensitivity suggests potential unreliability in the decision-making process [27]. Typically, the analysis begins by uniformly distributing weights across all indicators, followed by monitoring the resultant fluctuations in the evaluations [23]. Using Visual PROMETHEE 1.4.0.0 software, which features a specialized ‘weight-walking’ function, decision-makers can iteratively adjust weights and directly observe the effects on outcomes, as depicted in Figure 6. Notably, consistent weights across different scenarios preserve the relative rankings of evaluation objects, confirming decision stability.
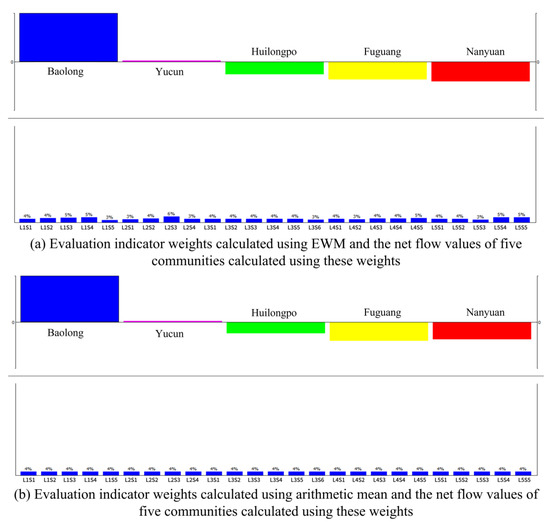
Figure 6.
Ranking under different weights for different communities.
Moreover, the Visual PROMETHEE software incorporates Visual Stability Interval functions, which facilitate monitoring stability intervals for individual indicators, ensuring consistent evaluation outcomes. This tool allows for precise adjustments to the weights of specific indicators, quantifying their impact on the overall ranking. Such analysis significantly improves the understanding of weight sensitivity and the reliability of decision outcomes. For instance, as shown in Figure 7, the weight of indicator L3S1 ranges from 0% to 6.36% without affecting the overall ranking. However, weights exceeding 6.36% alter the ranking, indicating a critical threshold for stability. In contrast, the weight of indicator L3S3, with a stability interval from 0% to 100%, shows no impact on the ranking, suggesting robustness against weight variations. Therefore, broader stability intervals generally indicate lower sensitivity of the rankings to changes in the weights of indicators. Extensive analysis of 25 indicators revealed that variations in the weights of indicators L4S4 and L5S5 did not influence the evaluation outcomes, highlighting their stability within the tested scenarios.
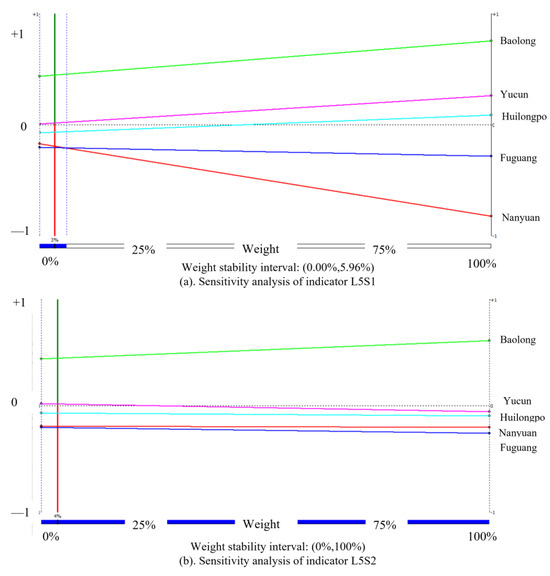
Figure 7.
Results of the weight sensitivity analysis for the L3S1 and L3S3. Note: The vertical axis is represented by a green/red line: the green section indicates values greater than zero, and the red section indicates values less than zero. The left side of this line has a constant weight, while the right side has a variable weight.
4. Discussion
4.1. Variability in Evaluation Indicator Weights
The weights assigned to evaluation indicators showed notable variations, reflecting differing priorities in the SCC. The indicator L2S3, which assesses residents’ perceptions of integration capability in service, holds the greatest weight. This aligns with the platforms’ central role in integrating residents, property management, and community services, thereby simplifying daily tasks and enhancing life quality [36,37]. The L2S3, L1S4, and L5S4, which evaluate residents’ perceptions of communication infrastructure and community activities, also received significant weight. Effective communication infrastructure is crucial for fostering robust networks among community organizations, local media, and residents [38], thus supporting environments that contribute to well-being [39]. Similarly, active participation in community activities bolsters engagement and a sense of belonging, which is key for sustainable, smart community development [40].
Conversely, indicators such as L1S5, L3S6, and L5S3, associated with self-service terminals, personal safety, and housing management, were weighted less. This may reflect a community preference for more immediately tangible benefits like enhanced public services and infrastructure over aspects like self-service terminals, which, while useful, do not directly impact daily living [25]. Moreover, in well-integrated smart communities, safety features may be so seamlessly incorporated that residents perceive them as less critical, thus attributing lower weights [41]. The perception of housing management indicator, often less visible in its immediate benefits, similarly received a lower priority [42,43].
4.2. Variability in the Residents’ Perceptions of SCC
Analysis of aggregate scores across five communities, detailed in Table 4, revealed significant disparities in the residents’ perceptions of SCC. The Baolong community emerged as the leader, achieving the highest scores in all five dimensions. This superior performance is likely due to its status as an innovative demonstration community, a pilot initiative aimed at spearheading advanced smart community development. Key to Baolong’s success is its comprehensive deployments of ‘Smart-home Devices,’ an ‘Intelligent Management System,’ and a ‘Safe Building Platform,’ which collectively enhance its overall ranking [44,45]. On the contrary, the Nanyuan community exhibited the lowest score, reflecting challenges potentially rooted in its demographic composition, geographic location, developmental history, and other relevant factors [29]. Intermediate in this spectrum, the Yucun community outperformed Huilongpo and Nanyuan, indicating a moderate level of residents’ perceptions of SCC. Notably, Yucun has prioritized diverse, smart technologies but has not deeply developed these technologies [7]. In addition, Huilongpo and Fuguang communities have concentrated on deepening certain smart services, sacrificing breadth in service categories. These strategic differences in smart community service development have led to varying levels of residents’ perceptions of SCC [10]. Given these findings, each community must adopt a customized strategy that addresses its unique challenges and leverages its strengths, thereby improving residents’ perceptions of the SCC [2,46].
4.3. Suggestions for Enhancing Residents’ Perceptions of the SCC
This study conducted an in-depth analysis of the evaluation results to enhance residents’ perceptions of the SCC. Previous research has identified two distinct dimensions of residents’ perceptions relevant to the SCC: the perception of the managerial aspect and the perception of the technological aspect [29]. Generally, the perception of the managerial aspect emphasizes community safety, community service, and community governance [44,47], while the perception of the technological aspect focuses on fostering smart infrastructure and addressing socio-technical challenges [48,49]. Therefore, the dimensions of community safety, community service, and community governance were classified as the perception of managerial aspects, while community infrastructure and integrated services platforms were classified as the perception of technological aspects. Following this, the five communities in each category were compiled to create a decision matrix, as shown in Figure 8.
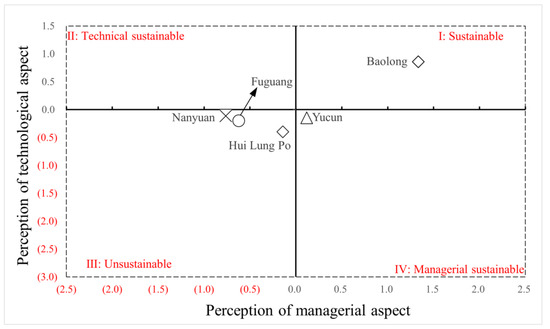
Figure 8.
The decision matrix of residents’ perceptions of the SCC. Note: The red numbers in this figure represent negative values (e.g., a red 0.5 indicates −0.5), while the black numbers represent positive values.
According to Figure 8, five communities were analyzed across three of the four quadrants, with none located in the second quadrant (perception of technical aspect sustainability). This distribution underscores distinct residents’ perceptions of the SCC. The Baolong community excels in both the perception of the technical aspect and the perception of the managerial aspect, qualifying it as a potential model for sustainable SCC. However, challenges remain, notably in the lower social safety and property services ranking, which could hinder further SCC. In contrast, the Yucun community, located in the fourth quadrant, could benefit from prioritizing enhancements in residents’ perceptions of technological aspects. This is particularly crucial within the dimensions currently viewed less favorably, namely ‘community infrastructure’ and ‘integrated services platform.’ Improvements in communication infrastructure, enhancements to the construction of the visualization platform, and acceleration of administrative approval processes are key focus areas to address these concerns. Both management and technological improvements are crucial for communities in the third quadrant—Huilongpo, Nanyuan, and Fuguang. Huilongpo could focus on infrastructure planning and safety response mechanisms. Nanyuan is advised to enhance services and governance, particularly in business and elderly care services, vehicle management, and grid-based governance. Fuguang needs to bolster its integrated service platforms and safety and governance measures, emphasizing self-service terminals, platform functionality, and responses to natural and public health events. Overall, the decision matrix provides a comprehensive framework for quantifying residents’ perceptions of the SCC, offering invaluable insights for decision-makers to develop targeted strategies to enhance residents’ perceptions.
4.4. Comparative Analysis with Extant Studies
This study introduces a novel hybrid evaluation method by combining the EWM and PROMETHEE II to quantify residents’ perceptions of SCC. This methodology stands out by providing a more comprehensive and systematic evaluation than traditional methods, which often overlook the nuanced human-centric factors crucial in urban planning and smart community development [26,27]. The primary value of this research lies in its innovative application of the hybrid EWM-PROMETHEE II approach, significantly enhancing the accuracy and reliability of assessing residents’ perceptions. Such enhancements are critical as they offer practical insights for policymakers and urban planners, enabling them to tailor SCC strategies more effectively to meet residents’ needs and improve their quality of life. Furthermore, the findings contribute significantly to academic discourse by presenting empirical evidence from Shenzhen, a frontrunner in smart city initiatives. Unlike most existing studies that prioritize technological advancements and infrastructure development, this research focuses on the residents’ perspective, thus providing a more holistic view of SCC effectiveness [13,45,48]. This approach bridges a notable gap in current research and enriches the understanding of community-specific strategies, as demonstrated through the detailed case study in Shenzhen.
5. Conclusions
This study established a novel method using the EWM-PROMETHEE II, applied in five selected smart communities in Shenzhen, China, to effectively quantify residents’ perceptions of the SCC. A robust 25-indicator evaluation system spanning five dimensions was developed through a literature review and expert interviews. Applying the EWM-PROMETHEE II method revealed significant differences in residents’ perceptions among the communities, with Baolong ranking highest and Fuguang lowest. This divergence underscores the varying strengths and weaknesses across communities: while Baolong demonstrated comprehensive development strategies in both technological and managerial aspects, Nanyuan lagged in community services and technological infrastructure. Sensitivity analysis validated these results, demonstrating stability across varying indicator weights. The consistent application of this method across diverse community attributes further validated its versatility and effectiveness in providing an objective evaluation of SCC.
This study offers a hybrid evaluation method that enhances the SCC knowledge system and helps the government develop sustainable SCC strategies. However, it is important to note two limitations of this study. First, the emphasis on case studies from Shenzhen’s smart communities might not fully capture the different residents’ perceptions of SSC in other Chinese cities or globally. Future research should extend its geographical scope to include diverse smart communities domestically and internationally to gain a more comprehensive understanding of SCC. Second, as smart communities evolve, the indicator weights may need adjustment. Thus, exploring the dynamic evaluation of residents’ perception of the SCC represents a fruitful direction for future research.
Supplementary Materials
The following supporting information can be downloaded at: https://www.mdpi.com/article/10.3390/land13081197/s1. File S1: The primary evaluation indicator system; File S2: Questionnaire for optimizing the evaluation indicators of residents’ perceptions of smart community construction; File S3: The evaluation indicator system for residents’ perceptions of the smart community construction; File S4: Questionnaire of residents’ perceptions of smart community construction; File S5: Detailed calculation process. Refs [7,20,45,50,51,52,53,54,55,56,57,58,59,60,61,62,63,64,65,66,67,68,69,70,71,72,73] are cited in Supplementary Materials file.
Author Contributions
Conceptualization, T.G.; methodology, Y.W.; software, Y.W., E.H. and C.W.; validation, T.G., C.W., L.W. and M.X.; formal analysis, T.G. and C.W.; investigation, Y.W. and E.H.; resources, L.W.; data curation, E.H.; writing—original draft, Y.W.; writing—review and editing, T.G., Y.W. and L.W.; visualization, Y.W.; supervision, T.G.; project administration, T.G.; funding acquisition, T.G. All authors have read and agreed to the published version of the manuscript.
Funding
This study is funded by the National Natural Science Foundation of China (Grant No. 72104233) and China Postdoctoral Science Foundation (Certificate Number: 2023M743767).
Data Availability Statement
The original contributions presented in the study are included in the article/supplementary material, further inquiries can be directed to the corresponding author.
Conflicts of Interest
The authors declare that they have no conflict of interest.
References
- Aggarwal, S.; Chaudhary, R.; Aujla, G.S.; Kumar, N.; Choo, K.-K.R.; Zomaya, A.Y. Blockchain for Smart Communities: Applications, Challenges and Opportunities. J. Netw. Comput. Appl. 2019, 144, 13–48. [Google Scholar] [CrossRef]
- Kashef, M.; Visvizi, A.; Troisi, O. Smart City as a Smart Service System: Human-Computer Interaction and Smart City Surveillance Systems. Comput. Hum. Behav. 2021, 124, 106923. [Google Scholar] [CrossRef]
- Ciasullo, M.V.; Troisi, O.; Grimaldi, M.; Leone, D. Multi-Level Governance for Sustainable Innovation in Smart Communities: An Ecosystems Approach. Int. Entrep. Manag. J. 2020, 16, 1167–1195. [Google Scholar] [CrossRef]
- Macke, J.; Rubim Sarate, J.A.; de Atayde Moschen, S. Smart Sustainable Cities Evaluation and Sense of Community. J. Clean. Prod. 2019, 239, 118103. [Google Scholar] [CrossRef]
- Zhu, H.; Shen, L.; Ren, Y. How Can Smart City Shape a Happier Life? The Mechanism for Developing a Happiness Driven Smart City. Sustain. Cities Soc. 2022, 80, 103791. [Google Scholar] [CrossRef]
- Chen, C.-W. Can Smart Cities Bring Happiness to Promote Sustainable Development? Contexts and Clues of Subjective Well-Being and Urban Livability. Dev. Built Environ. 2023, 13, 100108. [Google Scholar] [CrossRef]
- Gu, T.; Hao, E.; Wang, C.; Zhu, S.; Wang, Y. CRITIC-PROMETHEE II-Based Evaluation of Smart Community Services: A Case Study of Shenzhen, China. J. Knowl. Econ. 2024, 1–35. [Google Scholar] [CrossRef]
- Huang, G.; Li, D.; Yu, L.; Yang, D.; Wang, Y. Factors Affecting Sustainability of Smart City Services in China: From the Perspective of Citizens’ Sense of Gain. Habitat. Int. 2022, 128, 102645. [Google Scholar] [CrossRef]
- Sánchez-Teba, E.M.; Benítez-Márquez, M.D.; Romero-Navas, T. Residents’ Negative Perceptions towards Tourism, Loyalty and Happiness: The Case of Fuengirola, Spain. Sustainability 2019, 11, 6841. [Google Scholar] [CrossRef]
- Ji, T.; Chen, J.-H.; Wei, H.-H.; Su, Y.-C. Towards People-Centric Smart City Development: Investigating the Citizens’ Preferences and Perceptions about Smart-City Services in Taiwan. Sustain. Cities Soc. 2021, 67, 102691. [Google Scholar] [CrossRef]
- Macke, J.; Casagrande, R.M.; Sarate, J.A.R.; Silva, K.A. Smart City and Quality of Life: Citizens’ Perception in a Brazilian Case Study. J. Clean. Prod. 2018, 182, 717–726. [Google Scholar] [CrossRef]
- Shirani, F.; Groves, C.; Henwood, K.; Pidgeon, N.; Roberts, E. ‘I’m the Smart Meter’: Perceptions of Smart Technology amongst Vulnerable Consumers. Energy Policy 2020, 144, 111637. [Google Scholar] [CrossRef]
- Gerges, F.; Assaad, R.H.; Nassif, H.; Bou-Zeid, E.; Boufadel, M.C. A Perspective on Quantifying Resilience: Combining Community and Infrastructure Capitals. Sci. Total Environ. 2023, 859, 160187. [Google Scholar] [CrossRef] [PubMed]
- Wang, J.; Ding, S.; Song, M.; Fan, W.; Yang, S. Smart Community Evaluation for Sustainable Development Using a Combined Analytical Framework. J. Clean. Prod. 2018, 193, 158–168. [Google Scholar] [CrossRef]
- Talò, C. Community-Based Determinants of Community Engagement: A Meta-Analysis Research. Soc. Indic. Res. 2018, 140, 571–596. [Google Scholar] [CrossRef]
- Park, J.-M.; Bae, S.-M. Impact of Depressive, Anxiety, and PTSD Symptoms in Disaster Victims on Quality of Life: The Moderating Effect of Perceived Community Resilience. Int. J. Disaster Risk Reduct. 2022, 69, 102749. [Google Scholar] [CrossRef]
- Anthony, B. The Role of Community Engagement in Urban Innovation Towards the Co-Creation of Smart Sustainable Cities. J. Knowl. Econ. 2024, 15, 1592–1624. [Google Scholar] [CrossRef]
- Yigitcanlar, T.; Kamruzzaman, M.; Foth, M.; Sabatini-Marques, J.; da Costa, E.; Ioppolo, G. Can Cities Become Smart without Being Sustainable? A Systematic Review of the Literature. Sustain. Cities Soc. 2019, 45, 348–365. [Google Scholar] [CrossRef]
- Niu, S.; Yang, X.; Li, H.; Zhang, J. Evaluation of Smart Community Resilience: Empirical Evidence from Heilongjiang Province, China. Env. Dev. Sustain. 2024, 1–31. [Google Scholar] [CrossRef]
- Li, D.; Shang, X.; Huang, G.; Zhou, S.; Zhang, M.; Feng, H. Can Smart City Construction Enhance Citizens’ Perception of Safety? A Case Study of Nanjing, China. Soc. Indic. Res. 2024, 171, 937–965. [Google Scholar] [CrossRef]
- Gu, T.; Hao, E.; Zhang, L. Exploring Determinants of Residents’ Participation Intention towards Smart Community Construction by Extending the TPB: A Case Study of Shenzhen City. Eng. Constr. Archit. Manag. 2024; ahead-of-print. [Google Scholar] [CrossRef]
- Linwei, H.; Longyu, S.; Fengmei, Y.; Xue-qin, X.; Lijie, G. Method for the Evaluation of Residents’ Perceptions of Their Community Based on Landsenses Ecology. J. Clean. Prod. 2021, 281, 124048. [Google Scholar] [CrossRef]
- Babaei, S.; Ghazavi, R.; Erfanian, M. Urban Flood Simulation and Prioritization of Critical Urban Sub-Catchments Using SWMM Model and PROMETHEE II Approach. Phys. Chem. Earth Parts A/B/C 2018, 105, 3–11. [Google Scholar] [CrossRef]
- Zou, T.; Su, Y.; Wang, Y. Research on the Hybrid ANP-FCE Approach of Urban Community Sustainable Construction Problem. Math. Probl. Eng. 2018, 2018, 8572498. [Google Scholar] [CrossRef]
- Dong, F.; Yin, J.; Xiang, J.; Chang, Z.; Gu, T.; Han, F. EWM-FCE-ODM-Based Evaluation of Smart Community Construction: From the Perspective of Residents’ Sense of Gain. Sustainability 2023, 15, 6587. [Google Scholar] [CrossRef]
- Li, H.; Guo, J.; Pan, C.; Wu, J.; Liu, X. The EWM-Based Evaluation of Healthy City Construction Levels in East China under the Concept of “Making Improvements Is More Important Than Reaching Standards”. Sustainability 2024, 16, 4311. [Google Scholar] [CrossRef]
- Wątróbski, J. Temporal PROMETHEE II—New Multi-Criteria Approach to Sustainable Management of Alternative Fuels Consumption. J. Clean. Prod. 2023, 413, 137445. [Google Scholar] [CrossRef]
- Liu, X.; Liu, Y. Sensitivity Analysis of the Parameters for Preference Functions and Rank Reversal Analysis in the PROMETHEE II Method. Omega 2024, 128, 103116. [Google Scholar] [CrossRef]
- Wang, C.; Wang, L.; Gu, T.; Yin, J.; Hao, E. CRITIC-TOPSIS-Based Evaluation of Smart Community Safety: A Case Study of Shenzhen, China. Buildings 2023, 13, 476. [Google Scholar] [CrossRef]
- Davlasheridze, M.; Miao, Q. Does Post-Disaster Aid Promote Community Resilience? Evidence from Federal Disaster Programs. Nat. Hazards 2021, 109, 63–88. [Google Scholar] [CrossRef]
- Tamilmani, K.; Rana, N.P.; Wamba, S.F.; Dwivedi, R. The Extended Unified Theory of Acceptance and Use of Technology (UTAUT2): A Systematic Literature Review and Theory Evaluation. Int. J. Inf. Manag. 2021, 57, 102269. [Google Scholar] [CrossRef]
- Han, Y.; Chong, W.K.; Li, D. A Systematic Literature Review of the Capabilities and Performance Metrics of Supply Chain Resilience. Int. J. Prod. Res. 2020, 58, 4541–4566. [Google Scholar] [CrossRef]
- Chenhong, X.I.A.; Guofang, Z. The Spatiotemporal Evolution Pattern of Urban Resilience in the Yangtze River Delta Urban Agglomeration Based on TOPSIS-PSO-ELM. Sustain. Cities Soc. 2022, 87, 104223. [Google Scholar] [CrossRef]
- Tierney, B.T.; Tan, Y.; Kostic, A.D.; Patel, C.J. Gene-Level Metagenomic Architectures across Diseases Yield High-Resolution Microbiome Diagnostic Indicators. Nat. Commun. 2021, 12, 2907. [Google Scholar] [CrossRef] [PubMed]
- Lai, Y.; Jiang, L.; Xu, X. Exploring Spatio-Temporal Patterns of Urban Village Redevelopment: The Case of Shenzhen, China. Land 2021, 10, 976. [Google Scholar] [CrossRef]
- Almao, E.C.; Golpayegani, F. Are Mobile Apps Usable and Accessible for Senior Citizens in Smart Cities? In Human Aspects of IT for the Aged Population. Design for the Elderly and Technology Acceptance: 5th International Conference, ITAP 2019, Held as Part of the 21st HCI International Conference, HCII 2019, Orlando, FL, USA, 26–31 July 2019; Springer International Publishing: Berlin/Heidelberg, Germany, 2019; pp. 357–375. [Google Scholar]
- Delmastro, F.; Arnaboldi, V.; Conti, M. People-Centric Computing and Communications in Smart Cities. IEEE Commun. Mag. 2016, 54, 122–128. [Google Scholar] [CrossRef]
- Goulbourne, T.; Yanovitzky, I. The Communication Infrastructure as a Social Determinant of Health: Implications for Health Policymaking and Practice. Milbank Q. 2021, 99, 24–40. [Google Scholar] [CrossRef] [PubMed]
- Du, Q.; Song, H.; Zhu, X. Social-Feature Enabled Communications Among Devices Toward the Smart IoT Community. IEEE Commun. Mag. 2019, 57, 130–137. [Google Scholar] [CrossRef]
- Hassanli, N.; Walters, T.; Williamson, J. ‘You Feel You’Re Not Alone’: How Multicultural Festivals Foster Social Sustainability through Multiple Psychological Sense of Community. J. Sustain. Tour. 2021, 29, 1792–1809. [Google Scholar] [CrossRef]
- Żywiołek, J.; Schiavone, F. Perception of the Quality of Smart City Solutions as a Sense of Residents’ Safety. Energies 2021, 14, 5511. [Google Scholar] [CrossRef]
- Ullah, F.; Sepasgozar, S.M.E.; Shirowzhan, S.; Davis, S. Modelling Users’ Perception of the Online Real Estate Platforms in a Digitally Disruptive Environment: An Integrated KANO-SISQual Approach. Telemat. Inform. 2021, 63, 101660. [Google Scholar] [CrossRef]
- Ullah, F.; Sepasgozar, S.M.E. Key Factors Influencing Purchase or Rent Decisions in Smart Real Estate Investments: A System Dynamics Approach Using Online Forum Thread Data. Sustainability 2020, 12, 4382. [Google Scholar] [CrossRef]
- Ceglia, F.; Esposito, P.; Marrasso, E.; Sasso, M. From Smart Energy Community to Smart Energy Municipalities: Literature Review, Agendas and Pathways. J. Clean. Prod. 2020, 254, 120118. [Google Scholar] [CrossRef]
- Iqbal, A.; Olariu, S. A Survey of Enabling Technologies for Smart Communities. Smart Cities 2020, 4, 54–77. [Google Scholar] [CrossRef]
- Gu, T.; Hao, E.; Ma, L.; Liu, X.; Wang, L. Exploring the Determinants of Residents’ Behavior towards Participating in the Sponge-Style Old Community Renewal of China: Extending the Theory of Planned Behavior. Land 2022, 11, 1160. [Google Scholar] [CrossRef]
- Li, R.; Huang, Q.; Chen, X.; Zheng, B.; Liu, H. Factors Affecting Smart Community Service Adoption Intention: Affective Community Commitment and Motivation Theory. Behav. Inf. Technol. 2019, 38, 1324–1336. [Google Scholar] [CrossRef]
- Ponce, P.; Polasko, K.; Molina, A. End User Perceptions toward Smart Grid Technology: Acceptance, Adoption, Risks, and Trust. Renew. Sustain. Energy Rev. 2016, 60, 587–598. [Google Scholar] [CrossRef]
- Marimuthu, M.; D’Souza, C.; Shukla, Y. Integrating Community Value into the Adoption Framework: A Systematic Review of Conceptual Research on Participatory Smart City Applications. Technol. Forecast. Soc. Change 2022, 181, 121779. [Google Scholar] [CrossRef]
- Meerow, S. The Politics of Multifunctional Green Infrastructure Planning in New York City. Cities 2020, 100, 102621. [Google Scholar] [CrossRef]
- Monteiro, R.; Ferreira, J.; Antunes, P. Green Infrastructure Planning Principles: An Integrated Literature Review. Land 2020, 9, 525. [Google Scholar] [CrossRef]
- Wang, H.; Wang, R.; Fu, L.; Miao, Q.; Li, N. Activities-Centered Participatory Community Design: Shoupa Community Service Station Rooftop Renovation Plan. In Proceedings of the 14th International Conference, CCD 2022, Held as Part of the 24th HCI International Conference, HCII 2022, Virtual Event, 26 June–1 July 2022; pp. 242–255. [Google Scholar]
- Matei, S.; Ball-Rokeach, S. The Internet in the Communication Infrastructure of Urban Residential Communities: Macro- or Mesolinkage? J. Commun. 2003, 53, 642–657. [Google Scholar] [CrossRef]
- Wu, Q.; Huang, L.; Zong, J. User Interface Characteristics Influencing Medical Self-Service Terminals Behavioral Intention and Acceptance by Chinese Elderly: An Empirical Examination Based on an Extended UTAUT Model. Sustainability 2023, 15, 14252. [Google Scholar] [CrossRef]
- Petrie, H.; Darzentas, J.S.; Power, C. Self-Service Terminals for Older and Disabled Users: Attitudes of Key Stakeholders. In Computers Helping People with Special Needs; Springer: Berlin/Heidelberg, Germany, 2014; pp. 340–347. [Google Scholar]
- Jovanovic, M.; Sjödin, D.; Parida, V. Co-Evolution of Platform Architecture, Platform Services, and Platform Governance: Expanding the Platform Value of Industrial Digital Platforms. Technovation 2022, 118, 102218. [Google Scholar] [CrossRef]
- Badii, C.; Bellini, P.; Difino, A.; Nesi, P. Smart City IoT Platform Respecting GDPR Privacy and Security Aspects. IEEE Access 2020, 8, 23601–23623. [Google Scholar] [CrossRef]
- Bartelheimer, C.; Wolf, V.; Langhorst, N.; Seegers, F. Designing Digital Community Service Platforms for Crowd-Based Services in Urban Areas. In Proceedings of the 15th International Conference on Design Science Research in Information Systems and Technology, DESRIST 2020, Kristiansand, Norway, 2–4 December 2020; pp. 35–41. [Google Scholar]
- Juuso, E.K. Integration of Intelligent Systems in Development of Smart Adaptive Systems. Int. J. Approx. Reason. 2004, 35, 307–337. [Google Scholar] [CrossRef]
- Ye, Y.; Jiao, W.; Yan, H. Managing Relief Inventories Responding to Natural Disasters: Gaps Between Practice and Literature. Prod. Oper. Manag. 2020, 29, 807–832. [Google Scholar] [CrossRef]
- Hong, B.; Bonczak, B.J.; Gupta, A.; Kontokosta, C.E. Measuring Inequality in Community Resilience to Natural Disasters Using Large-Scale Mobility Data. Nat. Commun. 2021, 12, 1870. [Google Scholar] [CrossRef] [PubMed]
- Xu, Z.; Mei, L.; Lv, Z.; Hu, C.; Luo, X.; Zhang, H.; Liu, Y. Multi-Modal Description of Public Safety Events Using Surveillance and Social Media. IEEE Trans. Big Data 2019, 5, 529–539. [Google Scholar] [CrossRef]
- Sledge, D.; Thomas, H.F. From Disaster Response to Community Recovery: Nongovernmental Entities, Government, and Public Health. Am. J. Public Health 2019, 109, 437–444. [Google Scholar] [CrossRef] [PubMed]
- Xie, Z.; Weng, W.; Pan, Y.; Du, Z.; Li, X.; Duan, Y. Public Opinion Changing Patterns under the Double-Hazard Scenario of Natural Disaster and Public Health Event. Inf. Process. Manag. 2023, 60, 103287. [Google Scholar] [CrossRef]
- Feng, Y.; Cui, S. A Review of Emergency Response in Disasters: Present and Future Perspectives. Nat. Hazards 2021, 105, 1109–1138. [Google Scholar] [CrossRef]
- Calvello, M.; D’Orsi, R.N.; Piciullo, L.; Paes, N.M.; Magalhaes, M.A.; Coelho, R.; Lacerda, W.A. The Community-Based Alert and Alarm System for Rainfall Induced Landslides in Rio de Janeiro, Brazil. In Engineering Geology for Society and Territory—Volume 2; Springer International Publishing: Cham, Switzerland, 2015; pp. 653–657. [Google Scholar]
- Reis, F.G.I.; Gonçalves, I.; Lopes, A.R.M.; Henggeler Antunes, C. Business Models for Energy Communities: A Review of Key Issues and Trends. Renew. Sustain. Energy Rev. 2021, 144, 111013. [Google Scholar] [CrossRef]
- Bing-Jonsson, P.C.; Hofoss, D.; Kirkevold, M.; Bjørk, I.T.; Foss, C. Sufficient Competence in Community Elderly Care? Results from a Competence Measurement of Nursing Staff. BMC Nurs. 2016, 15, 5. [Google Scholar] [CrossRef]
- Masood, A.; Azfar Nisar, M. Administrative Capital and Citizens’ Responses to Administrative Burden. J. Public Adm. Res. Theory 2021, 31, 56–72. [Google Scholar] [CrossRef]
- Lu, H.; Zhang, Y.; Li, Y.; Jiang, C.; Abbas, H. User-Oriented Virtual Mobile Network Resource Management for Vehicle Communications. IEEE Trans. Intell. Transp. Syst. 2021, 22, 3521–3532. [Google Scholar] [CrossRef]
- Fancourt, D.; Baxter, L. Differential Participation in Community Cultural Activities amongst Those with Poor Mental Health: Analyses of the UK Taking Part Survey. Soc. Sci. Med. 2020, 261, 113221. [Google Scholar] [CrossRef] [PubMed]
- Li, N.; Su, L. Construction of Community Grid Unit Assessment System from the Perspective of Refined Governance. Sustainability 2023, 15, 10279. [Google Scholar] [CrossRef]
- Jung, E.; Kim, Y.-C. Commuting, Communication, and Community Engagement From a Communication Infrastructure Theory Perspective. Communic. Res. 2021, 48, 740–766. [Google Scholar] [CrossRef]
Disclaimer/Publisher’s Note: The statements, opinions and data contained in all publications are solely those of the individual author(s) and contributor(s) and not of MDPI and/or the editor(s). MDPI and/or the editor(s) disclaim responsibility for any injury to people or property resulting from any ideas, methods, instructions or products referred to in the content. |
© 2024 by the authors. Licensee MDPI, Basel, Switzerland. This article is an open access article distributed under the terms and conditions of the Creative Commons Attribution (CC BY) license (https://creativecommons.org/licenses/by/4.0/).