Abstract
Amid unprecedented challenges to protect arable land, China’s permanent capital farmland (PCF) has played a crucial role in grain production. However, a clear legal and physical boundary between PCF and arable land seems to be unable to stop the spread of non-grain production. To address it, an analysis framework for PCF non-grain production was developed to examine the state and drivers of village-scale PCF non-grain production based on the logical relationship between PCF and arable land in the rapid urbanization of Liyang. The results suggested that PCF comprised approximately 70% arable land and 30% adjustable land. Meanwhile, forest land and aquaculture ponds occupied over 25% of PCF, while nearly 20% of PCF is unsuitable for the resumption of crop cultivation. The transition state (scenario SR) offered a realistic representation of PCF non-grain production, with an average non-grain production of 48.88%. This is 14.00% lower than the current state (scenario SD) and 9.65% higher than the future state (scenario ST). Furthermore, PCF area and agricultural income per capita significantly encouraged PCF non-grain production, with explanatory powers of 51.60% and 42.40%, respectively. In contrast, urbanization rate (with an explanatory power of 35.30%) significantly discouraged it. Therefore, this paper proposed PCF redefinition, flexible PCF, and diversified economic incentives to mitigate PCF non-grain production at the village scale.
1. Introduction
Protecting arable land resources to stabilize food production is an important part of maintaining global food security. China has implemented the strictest arable land protection system to cope with the scarcity of per capita arable land resources, especially the special protection of permanent capital farmland (PCF), which has significantly contributed to the elimination of hunger [1,2]. However, in recent years, China has faced an unprecedented challenge in protecting and allocating arable land resources due to population growth, consumption upgrades, the tightening of resource and environmental caring capacity, and increased international uncertainty [3]. The arable land non-grain production has become an emerging phenomenon, with non-grain crops, trees, ponds, and illegal construction encroaching on arable land [4,5,6,7]. In this regard, the Chinese government has made successive decisions and deployments to resolutely stop the non-agricultural production and non-grain production of arable land.
Arable land non-grain production refers to the practice of shifting from grain crops to non-grain crops or other forms of land utilization [8]. This involves adjusting the use of arable land from planting grain crops to growing cash crops as well as developing other forms of production, such as forestry, fruit cultivation, livestock farming, poultry rearing, and aquaculture [9]. It can be characterized by the proportion of non-grain crop area, and the ratio of non-grain crop sown area [10,11,12]. In China, the basic situation of arable land non-grain production has been generally recognized. For one thing, arable land non-grain production is usually greater in rapid urbanizing regions than in other regions [13,14]. For example, the degree of non-grain production in Zhejiang Province (50.69%) [15], Liyang in Jiangsu Province (48.09%) [16] and Guanzhong Plain in Shaanxi Province (45.31%) [17] were significantly larger than that in Northeast China (11.72%) [18] and Henan Province (26.89%) [15]. For another, since PCF policies are stricter than arable land policies and there is a clear legal and physical boundary between PCF and arable land, PCF non-grain production should be much lower than arable land. However, according to limited reports, the PCF non-grain production in Guangxi Province is 74.84% [12], and it is estimated that PCF non-grain production in a county of Hubei Province and a county of Yunnan Province may be more than 60% [19,20,21], which seems surprisingly higher than that on arable land. This further suggests that the non-grain production characteristics of PCF cannot be clearly grasped at present, compared to research conducted on arable land. In addition, PCF is unique due to its special compositional structure [22,23,24,25], and the relationship between PCF and arable land is further complicated by the dynamic balance system policies [1]. Therefore, understanding the confusing practical state of PCF non-grain production in a region has become an urgent problem in current non-grain production research.
Presently, among the complex influences, the main drivers of arable land non-grain production are considered to be cost–benefit, land turnover, social capital inputs, policy measures and natural resource endowment [6,7,11,16]. As with arable land, the drivers behind PCF non-grain production are complex and varied, encompassing economic, social, natural, and policy-related factors [26,27,28,29]. Cost–benefit is recognized as the primary factor responsible for non-grain production [6,30,31]. The low comparative returns from planting grain crops have resulted in a considerable loss of PCF [32,33], and in particular, the conversion of PCF to orchards for economic efficiency is a typical formation of PCF non-grain production [34]. In addition, policy measures have an important impact on the utilization of PCF [17,35]. Land use adjustments due to conflicting grain for green policies or facility agricultural land policies and PCF protection policies would also result in some degree of non-grain production [1,26,36,37]. Natural resources largely shape the structure of agricultural cultivation [38,39], which in turn determines the extent of the risk of PCF non-grain production. On the basis of the complexity and variability of the factors, the driving mechanisms of non-grain production have relied on the spatial analysis methods of detecting spatial heterogeneity by the geodetector, though this should be further explored to gain a full understanding [40,41]. In summary, to address PCF non-grain production, it is crucial to accurately identify the problem of non-grain production, determine the true degree of non-grain production, and recognize the key drivers.
The rapid acceleration of urbanization in the Yangtze River Delta region over the past 30 years has led to a significant reduction in arable land resources [42]. As a result, the problem of non-grain production has become a major issue [43], especially in areas like Changzhou City, which has witnessed a reduction in arable land and an increase in fragmentation over the years [44]. Additionally, studying the non-grain production in rapidly urbanizing regions at the county scale is very effective in revealing the structure and drivers of the problem. On the one hand, non-grain production problems tend to be more severe in rapid urbanizing areas than in other areas [14]. On the other hand, grain production at the county level is crucial for food security, just as county governance is key to modernizing the overall governance system. Liyang is under the jurisdiction of the rapidly urbanizing Changzhou City, with arable land and PCF areas accounting for 30% and 38% of Changzhou City, respectively, and is at high risk of shifting to non-grain production. The diversity of landscape in Liyang, including hills, plains, and large ecological reserves [45,46] provides it with more complex drivers of non-grain production and makes it a better study site for exploring solutions to the problem of PCF non-grain production.
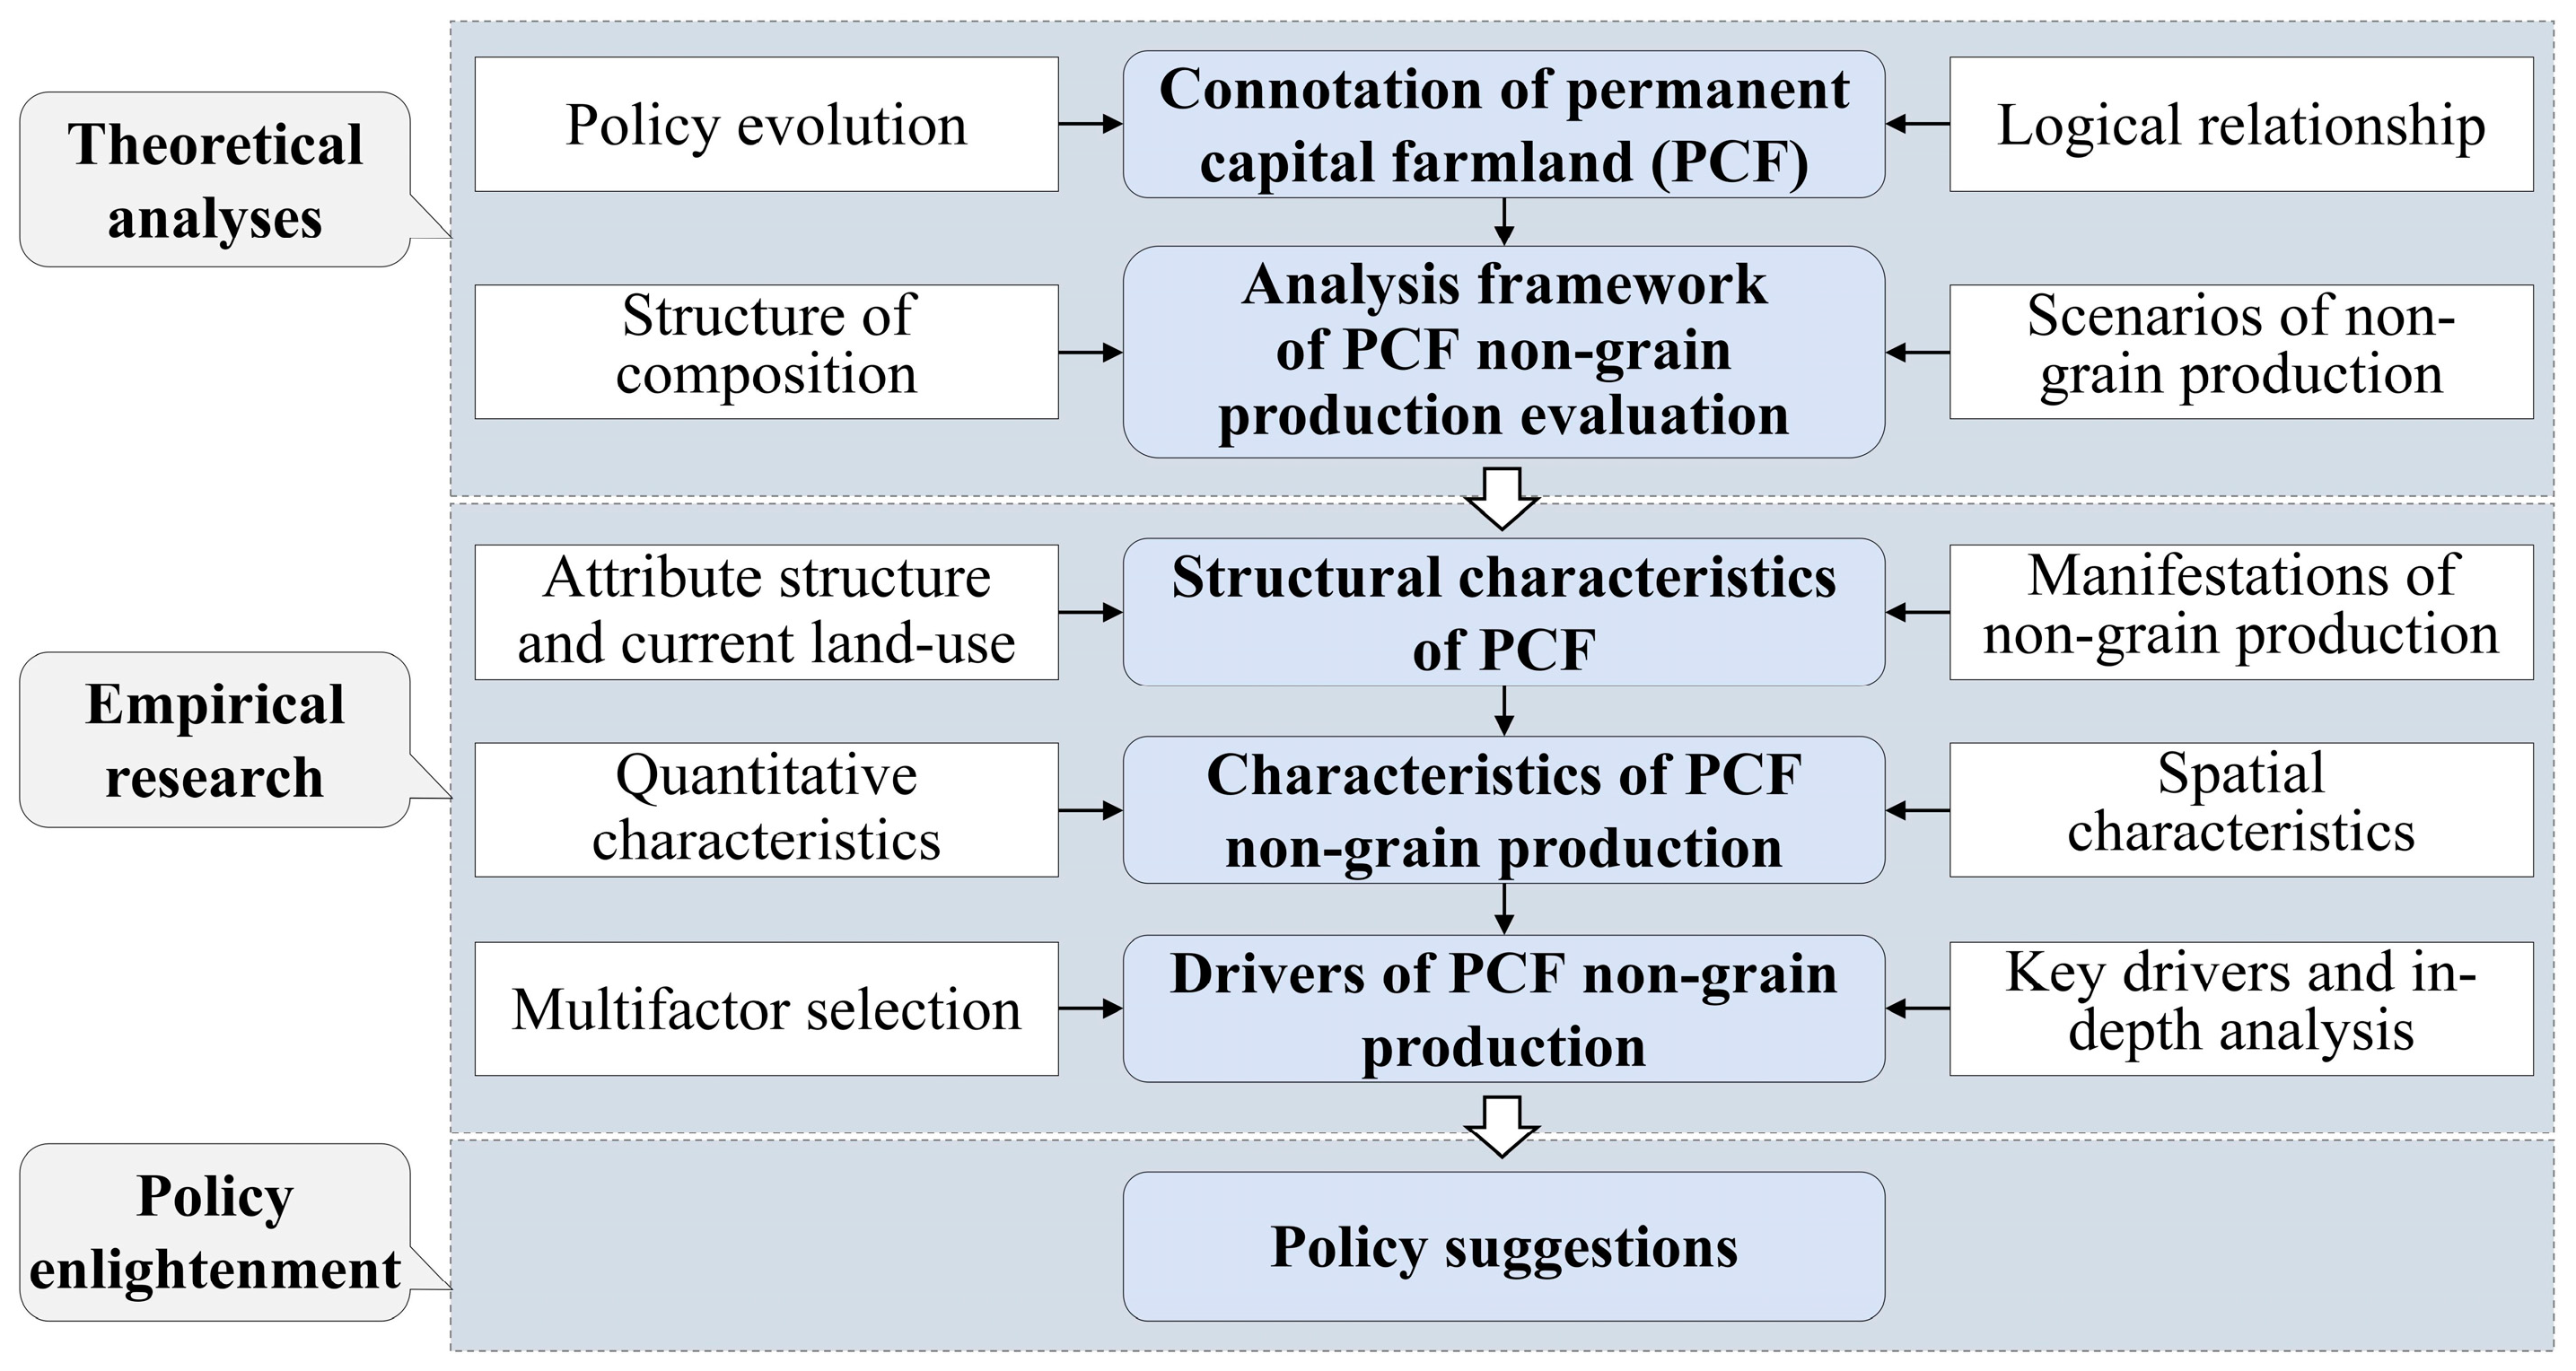
This paper clarifies the policy of PCF and its logical relationship with arable land, and an empirical study was conducted in Liyang with the following objectives: (i) designing an analysis framework for evaluating PCF non-grain production, (ii) objectively clarifying the issue of PCF non-grain production at the village scale, and (iii) analyzing the dominant drivers of PCF non-grain production. This study is not a mere duplication of study on the quantification and drivers of arable non-grain production. It is a new understanding of PCF non-grain production based on clarifying the relationship between PCF and arable land. Thus, the study contributes to a further understanding of the relationship between PCF non-grain production and arable land non-grain production. The relevant policy suggestions will help optimize land resources and grain production at the village scale. The research idea of this paper is to raise problems through theoretical analysis and then make policy recommendations after empirical research. The three parts of the overall flow chart are the theoretical analysis part, the empirical research part, and the policy enlightenment part (Figure 1). The theoretical analysis part includes the connotation of PCF and the analytical framework of the evaluation of PCF non-grain production. The analysis of the policy evolution of the PCF and the logical relationship between the PCF and arable land will be the basis for determining the structure of the PCF components and the establishment of scenarios in the analytical framework. The empirical research part includes the structural characteristics of PCF, the characteristics of PCF non-grain production, and the drivers of PCF non-grain production. The structural characterization of the PCF focuses on clarifying the attribute structure and current land use of the PCF while finding more detailed manifestations of non-grain production. The characterization of PCF non-grain production, on the other hand, shows the quantitative and spatial status of non-grain production from different scenarios, with a village-scale analysis of the transition state scenario, which is congruent with the state of arable land. The drivers of PCF non-grain production are then anchored to the transition state scenario (as this scenario is congruent with the arable land situation and is suitable for finding the drivers of non-grain production), the key drivers are found from the initial selection of indicators using the geodetector. These key drivers are then further analyzed in depth. The policy enlightenment section presents the corresponding policy suggestions based on the findings. These suggestions will reflect more locally appropriate solutions in policy.
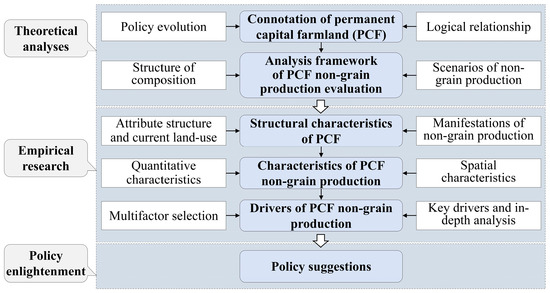
Figure 1.
Overall flow chart of this paper.
2. Background and Analysis Framework
2.1. Relationship between Permanent Capital Farmland (PCF) and Arable Land
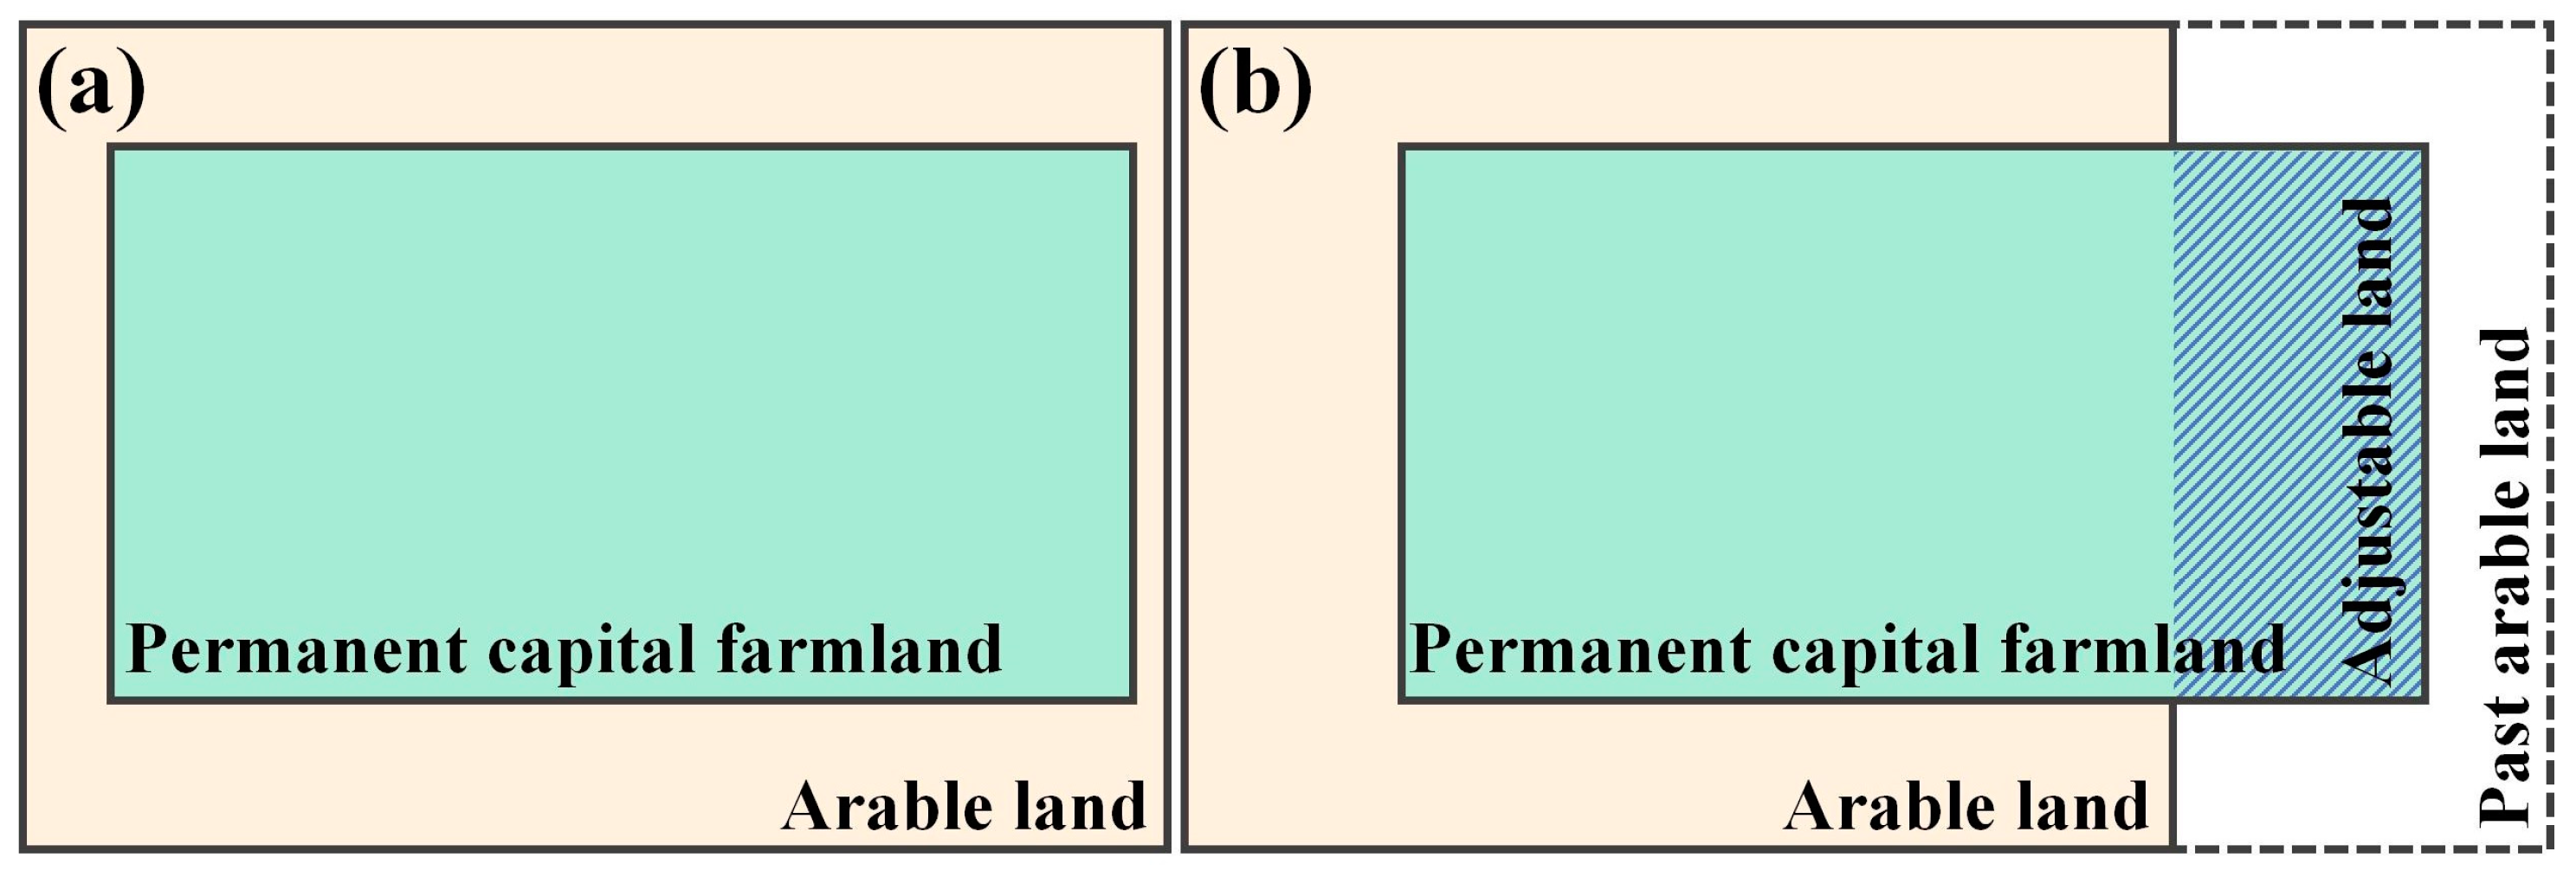
According to the Third National Land Survey in China (TNLS), arable land refers to the land on which crops are grown (crops do not include garden land, forest land, reed field, natural or artificial grassland, etc., which are of a specialized nature); the land on which crops are grown is predominantly that with scattered logs and trees; and the mudflats that are reclaimed and are guaranteed to be harvested for an average of one season per year. PCF is arable land that may not be occupied according to the comprehensive land use planning. According to Article 33 of the Land Administration Law of the People’s Republic of China, which was newly revised and implemented in 2020, the PCF demarcated by each provincial-level administrative unit should generally account for more than 80% of the arable land within the administrative region. The Regulations on Capital Farmland Protection and the Opinions of the Central Committee of the CPC and the State Council on Doing a Good Job in the Key Work of Comprehensively Promoting Rural Revitalization in 2022 have made it clear that the PCF should be broken down and handed down on an administrative level-by-level. Once determined, the PCF area will be constant in non-special circumstances at the county and town levels. In theory, PCF is part of arable land in space (Figure 2a). In practice, however, PCF has incorporated a portion of past arable land (adjustable land in PCF) into the scope of protection at the initial stage of demarcation [23,24]. The purpose of the inclusion is that the adjustable land can be restored to arable land through adjusted the planting or engineering means. Nevertheless, a large portion of the adjustable land has not been restored to arable land because of poor soil conditions, steep slopes, and delayed restoration [25]. Actually, it would not be possible to satisfy the full affiliation of PCF and arable land (Figure 2a), thus forming a new spatial relationship of partial affiliation (Figure 2b). These characteristics also lead to the fact that the combing of PCF non-grain production is more complicated than that of arable land.
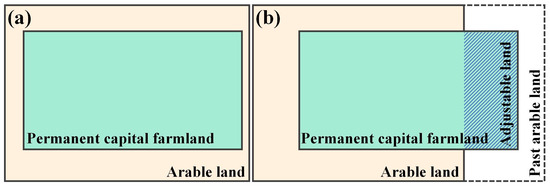
Figure 2.
Logical relationship between permanent capital farmland (PCF) and arable land at the county level. (a) Theoretical relationship and (b) practical relationship.
The establishment of PCF in China was motivated by a desire to ensure the country’s ability to feed its growing population despite its limited land resources. Therefore, PCF is focused on the development of grain production, especially ration production. The Land Administration Law of the People’s Republic of China and the Regulations on the Protection of Capital Farmland clearly stipulate that PCF can only be planted with grain crops such as rice, corn, wheat, potatoes, and soybeans, in addition to cotton, hemp, oil, and other crops specified by the State [47,48]. The Opinions of the Central Committee of the CPC and the State Council on Fulfilling the Key Work of Comprehensively Promoting Rural Revitalization in 2023 have called for the formulation of an implementation plan for gradually building all PCF into well-facilitated farmland. This initiative means that China has planned to turn all PCF in the country into well-facilitated farmland, thus eliminating the negative impacts of adjustable land.
2.2. Policy Evolution of PCF
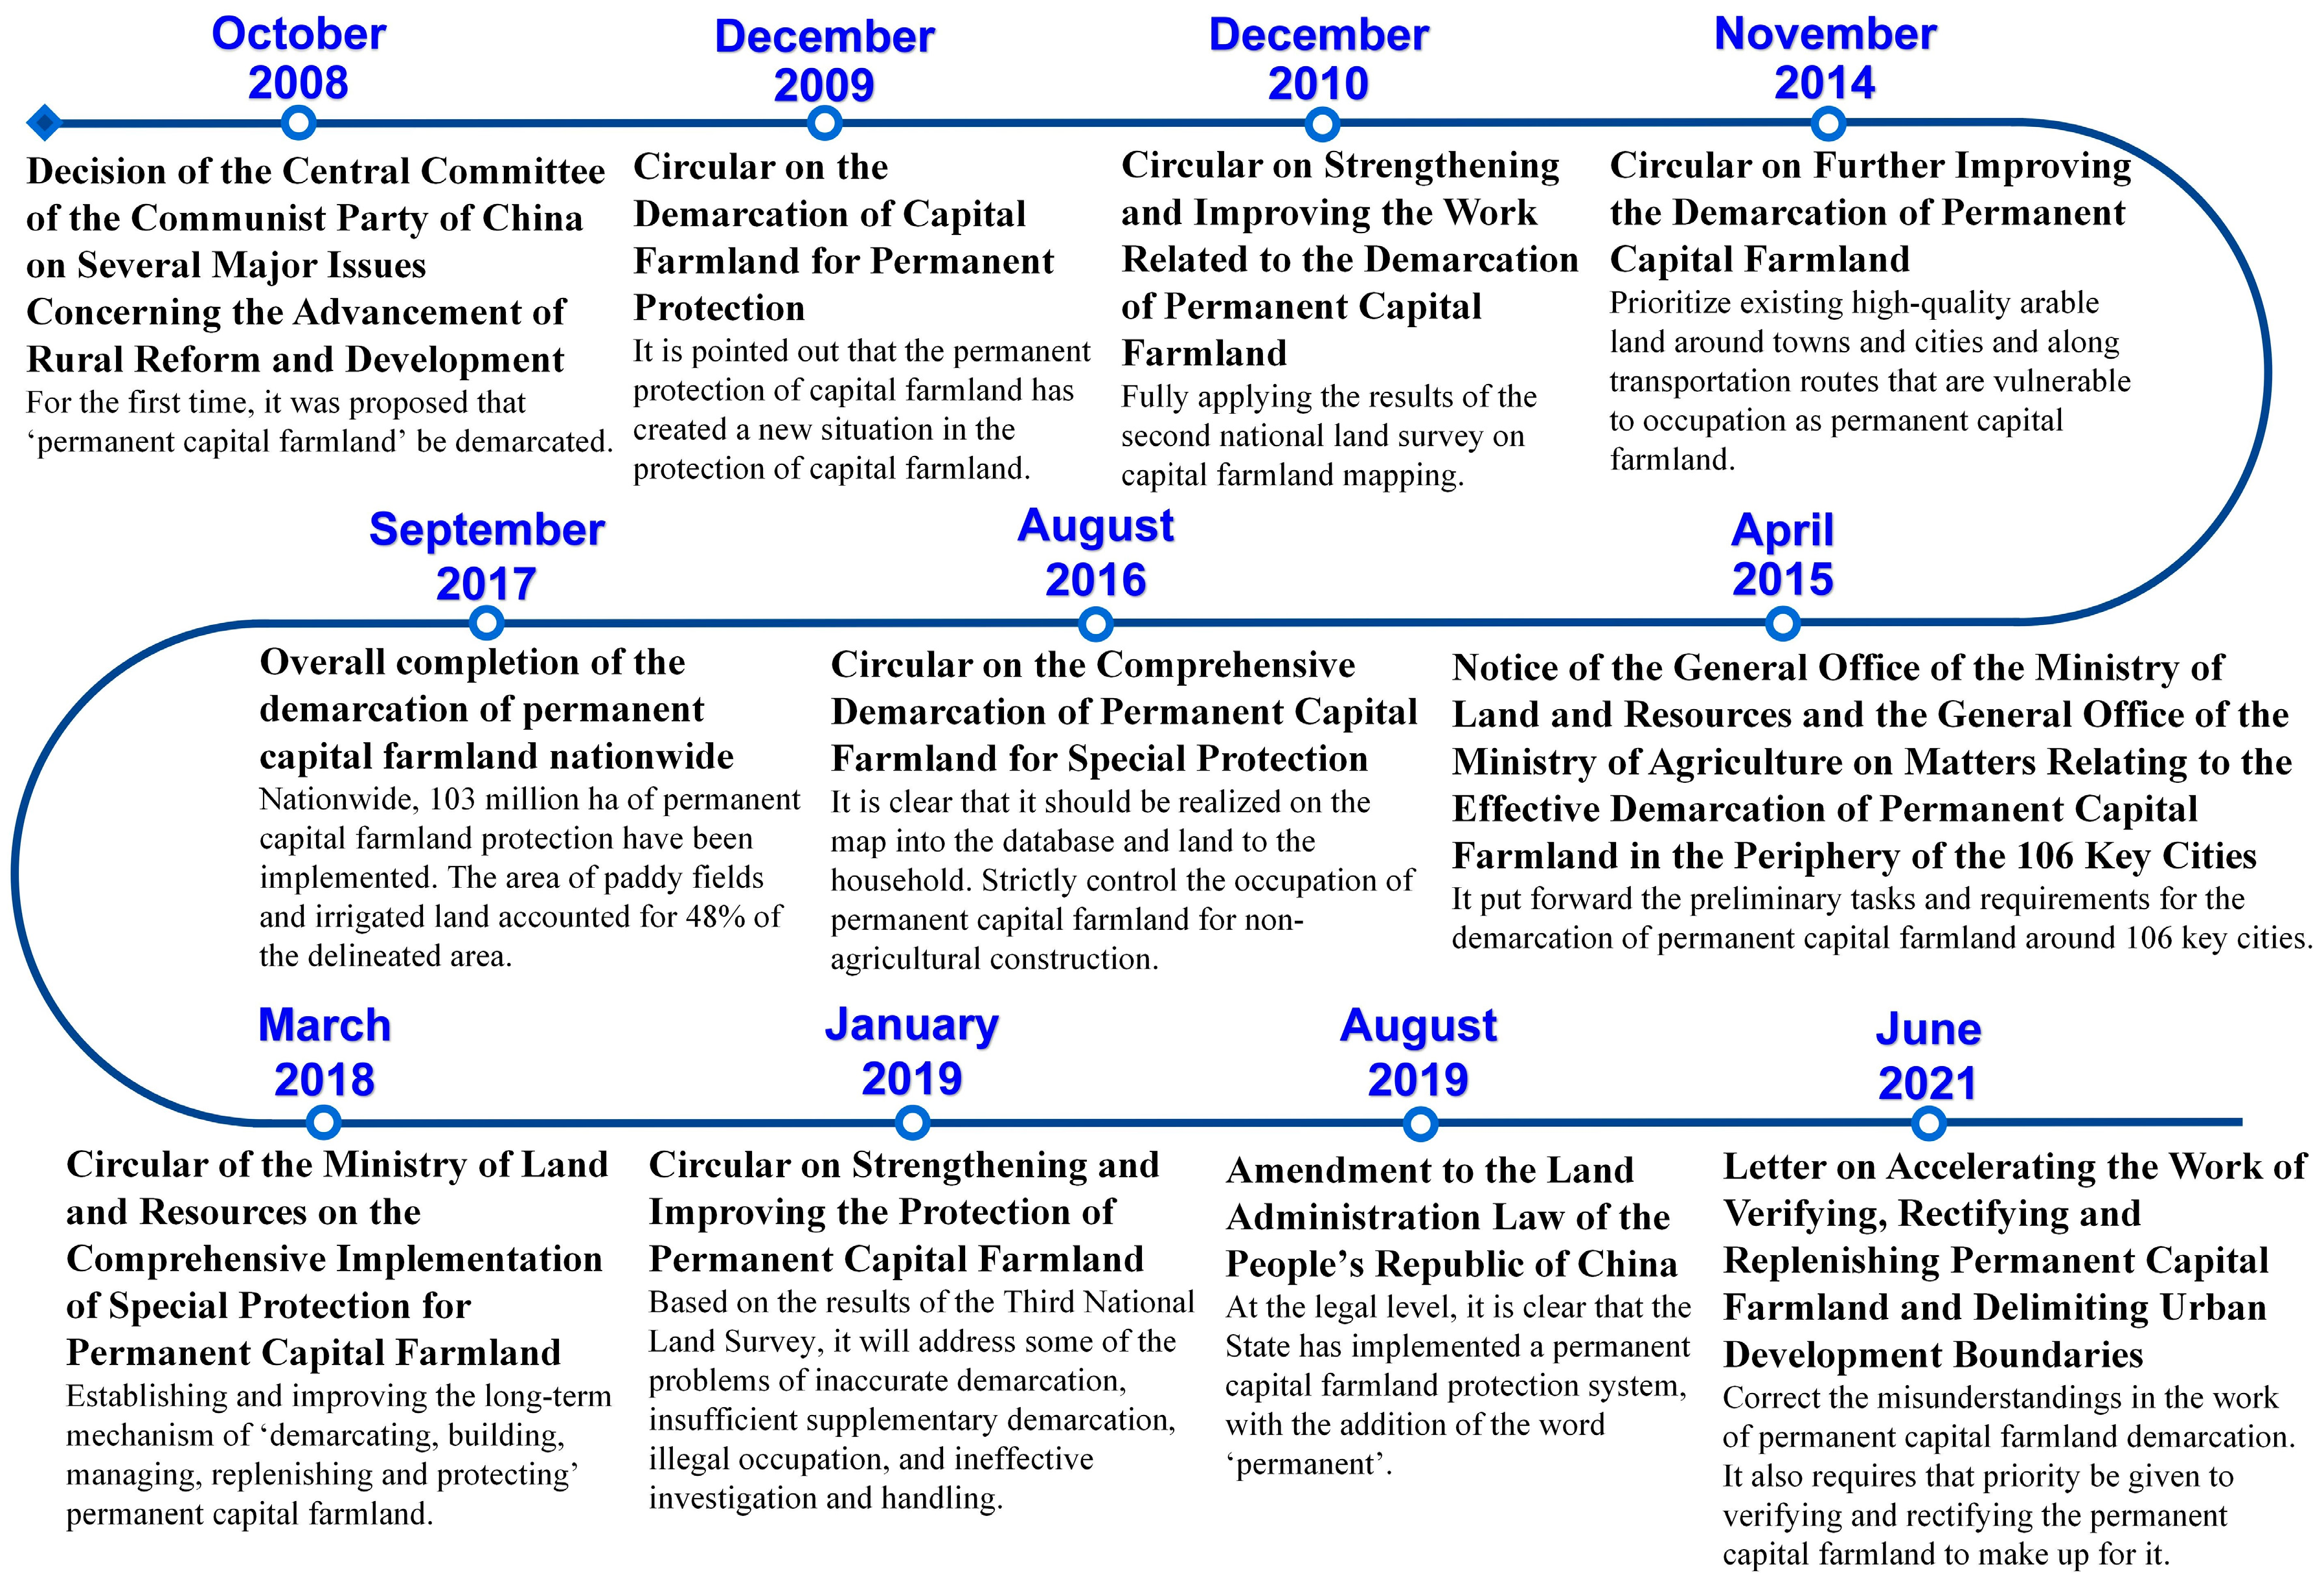
PCF evolved from capital farmland and is a special concept put forward during the exploration of arable land protection in China. PCF is the permanent protection of capital farmland, which is defined as arable land that may not be occupied to guarantee national food security, under the demand for agricultural products by the population and economic and social development over a certain period, and by the protection objectives set out in the territorial spatial planning. China’s PCF policy can be traced back to the Regulation on Capital Farmland Protection in the early 1990s and has been gradually clarified in the Land Management Law of the People’s Republic of China [1,3]. As can be seen from the main events presented in Figure 3, since the PCF was first proposed in 2008, the Chinese government has continued to enact laws and regulations to strengthen the protection of PCF. From 2009 to 2016, the State began to promote the construction of well-facilitated capital farmland that can be protected from drought and flooding. During this period, PCF demarcation was implemented and completed. At the same time, the State decided to permanently protect capital farmland, thus establishing the protection system for PCF. From 2017 to 2020, the conservation of PCF was based on the construction of well-facilitated farmland for land improvement and focused on the construction of ecological fields. During this period, PCF protection was explored for improvement, leading to the full implementation of a special protection system for PCF. After 2021, well-facilitated farmland has been gradually improved and constructed in all regions, focusing on the combination of grain production and farmland construction while ensuring the quantity protection and quality improvement of PCF. These actions have effectively implemented the principle of ‘storing grain in the farmland’ and guaranteeing national food security. The Chinese government is currently discussing the implementation plan to build all PCF into well-facilitated farmland and the red-line management of PCF. With the improvement of these policies with detailed rules, the latest revision and protection of PCF will be more strict and effective.

Figure 3.
Evolution of PCF policies.
The results of China’s PCF were finalized based on the results of the Second National Land Survey in China and adjusted following the adjustment program of the Outline of the National Overall Land Use Plan (2006–2020). It is worth noting that PCF has retained adjustable land in its demarcations [24]. Adjustable land is the land that has been converted from arable land to orchards, forests, meadows, ponds, and waters due to agricultural restructuring, and where the tillage layer has not been destroyed [25]. It originated from the Circular on Improving Agricultural Land Management to Promote the Structural Adjustment of Agricultural Production issued by the Ministry of Land and Resources and the Ministry of Agriculture of China in 1999. As a result, adjustable land brings a high level of uncertainty to identify the true cultivation of PCF. China’s Ministry of Natural Resources issued a Letter on Accelerating the Work of Verifying, Rectifying and Replenishing Permanent Capital Farmland and Delimiting Urban Development Boundaries in June 2021, which involving removing the inadequacies in the demarcation of PCF (Figure 3). Recently, the Ministry of Natural Resources and the Ministry of Agriculture and Rural Affairs have publicly solicited the Measures for the Management of the Red Line of Permanent Capital Farmland Protection (a draft for public comment), which will provide a better legal system for the management of the PCF in the new round of demarcation. Given that the importance of PCF in protecting national food security has been repeatedly emphasized and is being continuously developed and optimized, coupled with the prominence of PCF non-grain production, it is particularly necessary to sort out the current problems of PCF non-grain production.
2.3. Analysis Framework
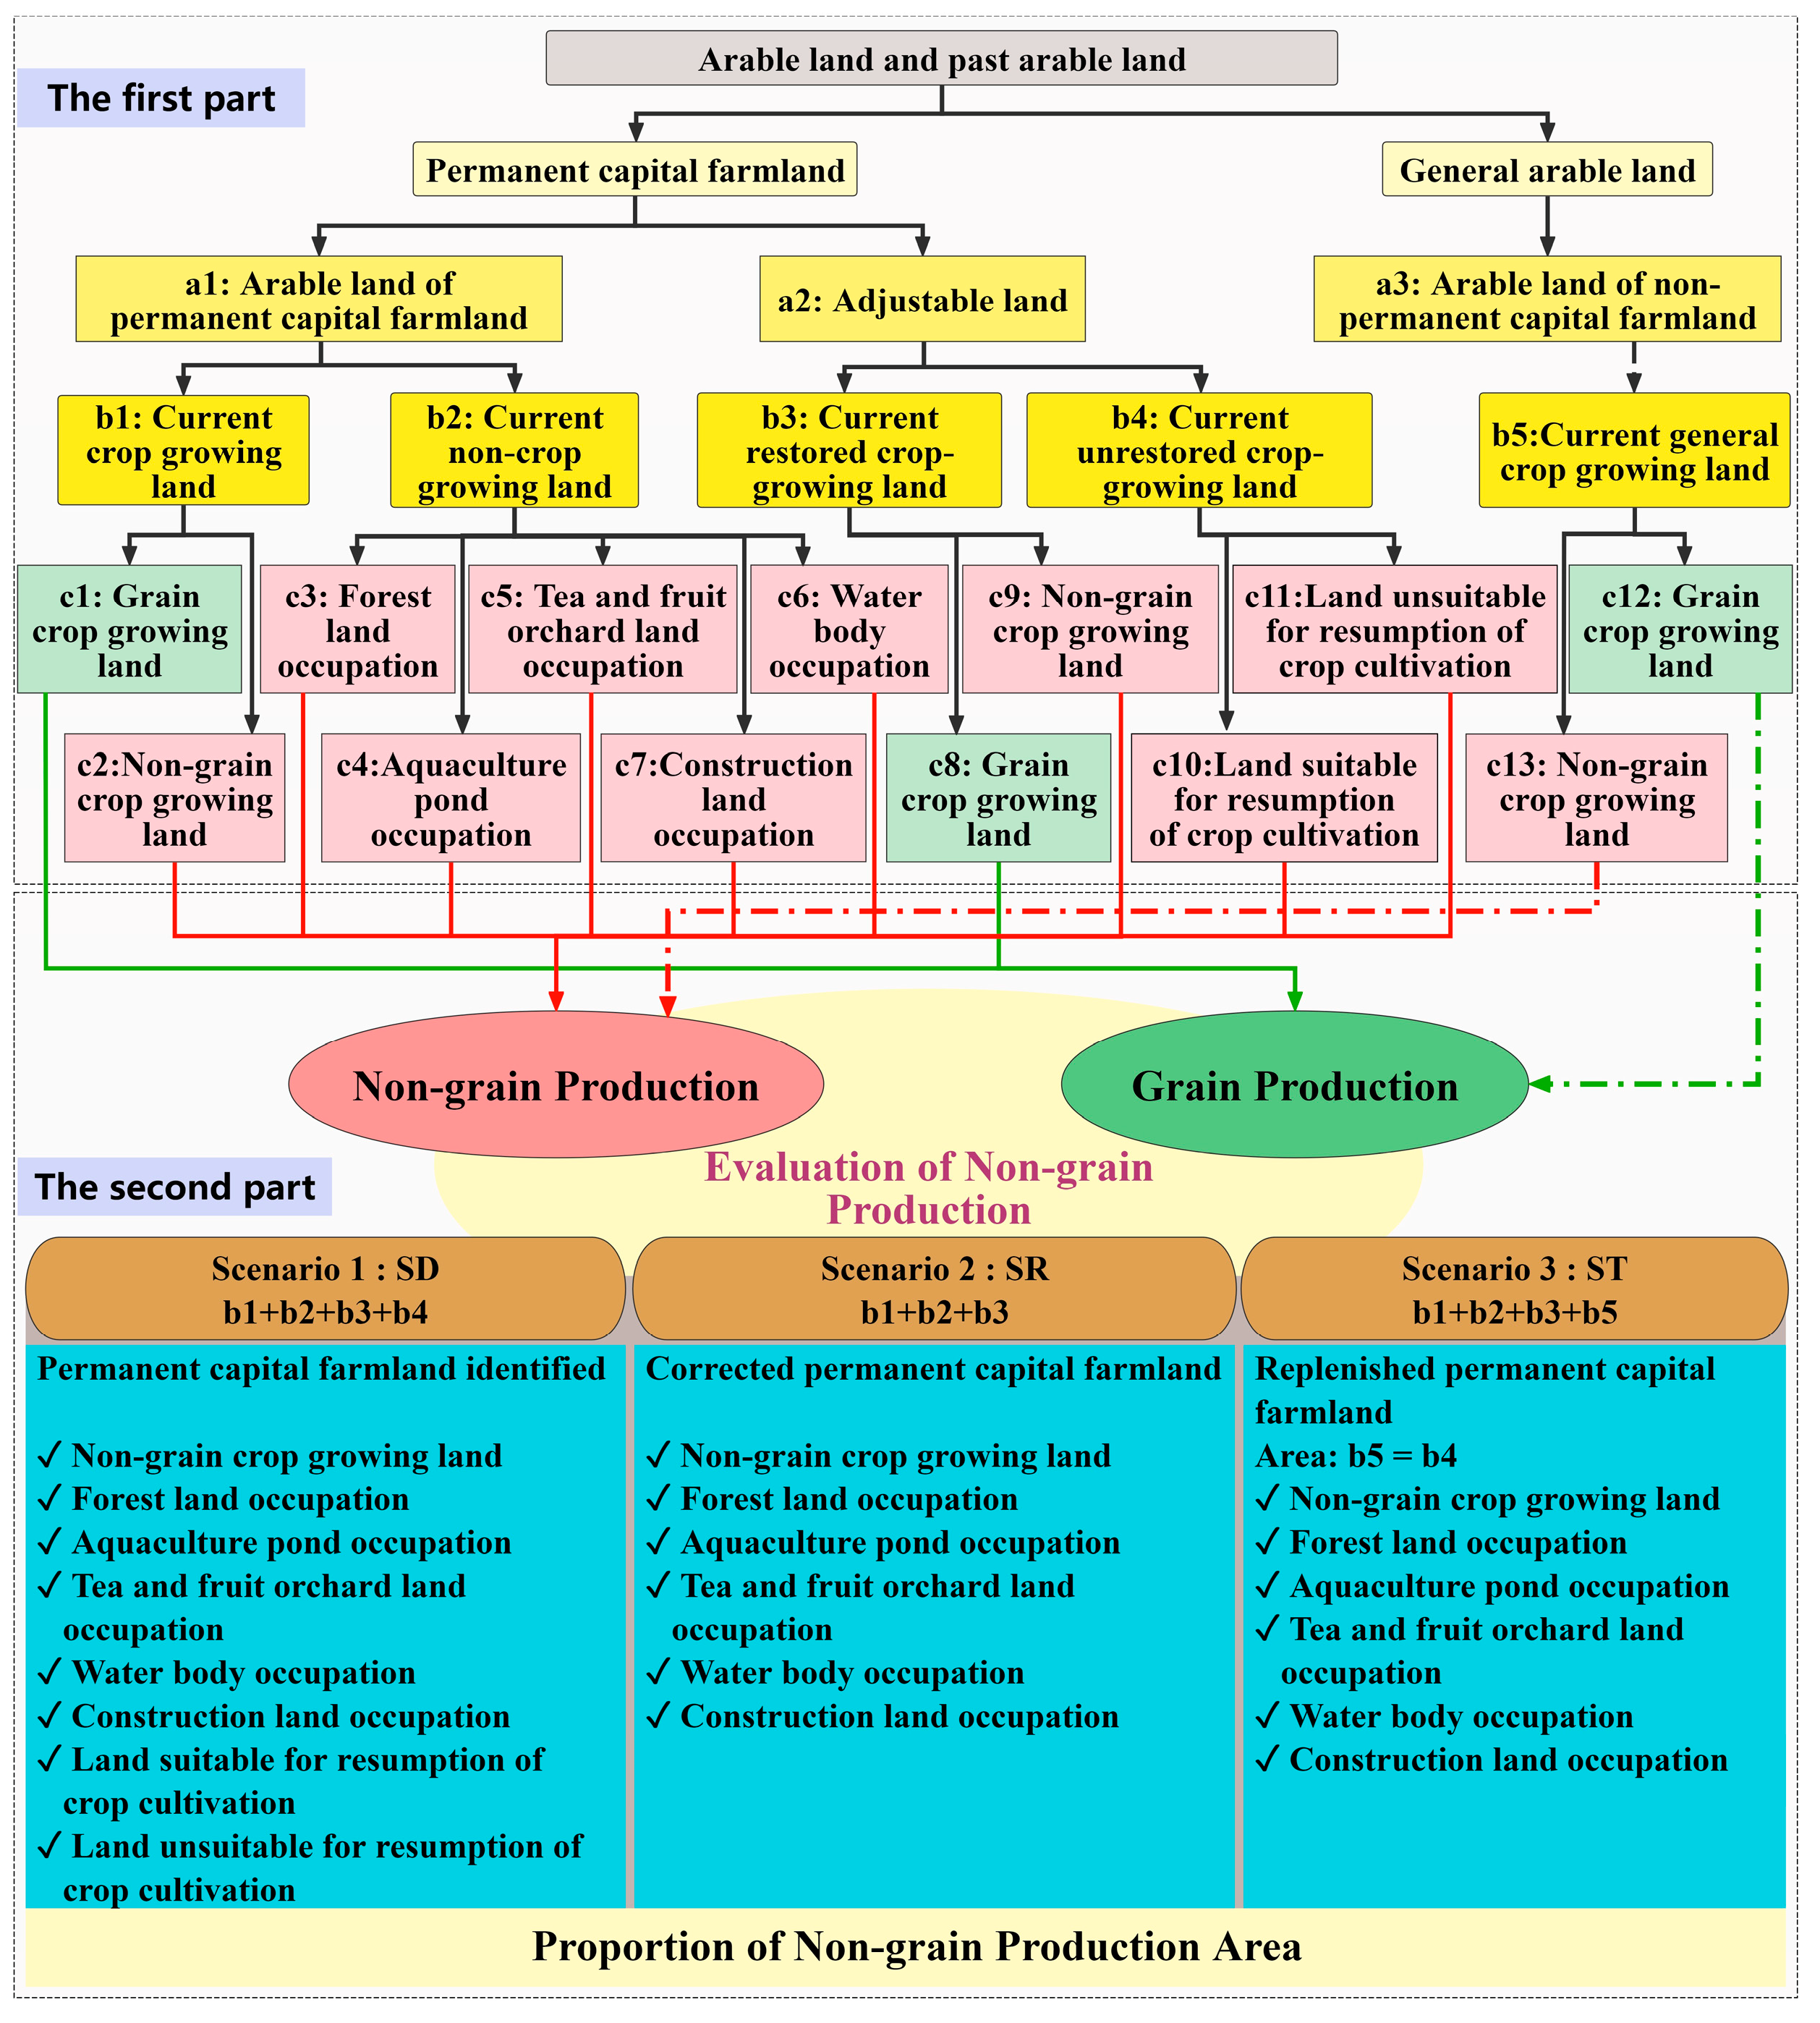
The prerequisite for objectively evaluating the degree of PCF non-grain production at the county scale is to clarify the problem of PCF non-grain production. Therefore, it is necessary to develop an analysis framework to evaluate PCF non-grain production in order to quantify it. Based on the partial affiliation of PCF with arable land, the analysis framework consists of two parts (Figure 4): structural clarification and non-grain production evaluation. The first part sorts out the current state of PCF and clarifies the manifestations and quantities of PCF non-grain production. The second part evaluates the degree of PCF non-grain production and expresses the state of PCF non-grain production through different scenarios.
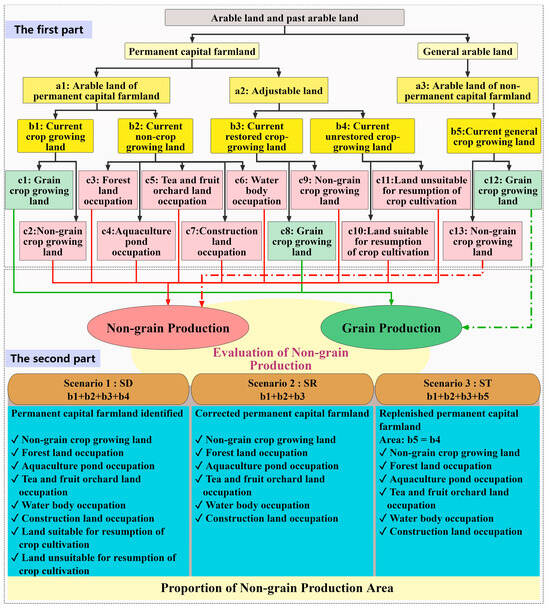
Figure 4.
Analysis framework of PCF non-grain production evaluation. Description of a1–a3 and b1–b5: a1 (arable land within PCF), a2 (past arable land within PCF), a3 (non-PCF within arable land), b1 (in arable land of PCF, still arable land), b2 (in arable land of PCF, changed to non-arable land), b3 (in adjustable land, restored to arable land), b4 (in adjustable land, not restored to arable land), b5 (in arable land of non-PCF, potential complement to b4).
- What is the current structure of PCF?
- Categorized into arable land of permanent capital farmland (arable land of PCF) (a1) and adjustable land (a2) based on attribute structure at the time of PCF demarcation.
- Current state land use identified using high-resolution remote sensing images. The combination of internal and external work identified crop-growing land (b1), current non-crop-growing land (b2), current restored crop-growing land (b3), and current unrestored crop-growing land (b4).
- The arable land of non-permanent capital farmland (arable land of non-PCF) (a3) incorporated into the evaluation system, to screen the current general crop-growing land (b5) in a3 as a potential complement to b4 for satisfying the subsequent PCF non-grain production evaluation.
- What are the manifestations and quantities of PCF non-grain production?
- To divide the crop-growing land of b1, b3, and b5 into grain crop-growing land (c1, c8 and c12) and non-grain crop-growing land (c2, c9 and c13) using TNLS information and visual interpretation.
- To divide b2 into actual occupancy categories according to visual interpretation and labeling, which are forest land occupation (c3), aquaculture pond occupation (c4), tea and fruit orchard land occupation (c5), water body occupation (c6), and construction land occupation (c7).
- To divide b4 into land suitable for the resumption of crop cultivation (c10) and land unsuitable for the resumption of crop cultivation (c11) with the help of the screening conditions defined by the Standard for Well-facilitated Capital Farmland Construction (TD/T 1033-2012) and the Well-facilitated Farmland Construction—General Rules (GB/T 30600-2014).
- What is the state of PCF non-grain production?
- The grain crop-growing land of c1, c8 and c12 are recognized as the land utilized for grain production, and the total area was summarized.
- The non-grain crop-growing land of c2, c9 and c13, the actual occupied land of c3, c4, c5, c6 and c7, and the unrestored crop-growing land of c10 and c11 are recognized as the land utilized for non-grain production utilization, and the total area was summarized.
- The proportion of non-grain production area is used to evaluate the degree of PCF non-grain production. It is calculated as a percentage of the total PCF area of non-grain production, expressed in ‘%’ (Equation (1)).
- Which scenario could objectively represent the state of PCF non-grain production?In fact, b4 is covered by the PCF, but the function of arable land has not assumed since the demarcation of the PCF. Therefore, b4 should not be included in the evaluation of non-grain production in the real plantable area of PCF. However, excluding b4 from the PCF nullifies the condition that the area of PCF must be constant at the county scale, and therefore, in order to express the potential non-grain production of the PCF, it is necessary to supplement it with an equal amount of other arable land (b5). Based on this, three PCF non-grain production evaluation scenarios are proposed.
- Scenario 1 (scenario SD): Categorized as b1 + b2 + b3 + b4 combined, this scenario evaluates the current state of demarcated (SD) PCF non-grain production, reflecting the practical relationship between PCF and arable land, as shown in Figure 2b.
- Scenario 3 (scenario ST): Categorized as b1 + b2 + b3 + b5 combined, this scenario evaluates the theoretical (ST) PCF non-grain production, representing the future state with a constant PCF area after replenishment, as shown in Figure 2a.
3. Research Area and Method
3.1. Research Area
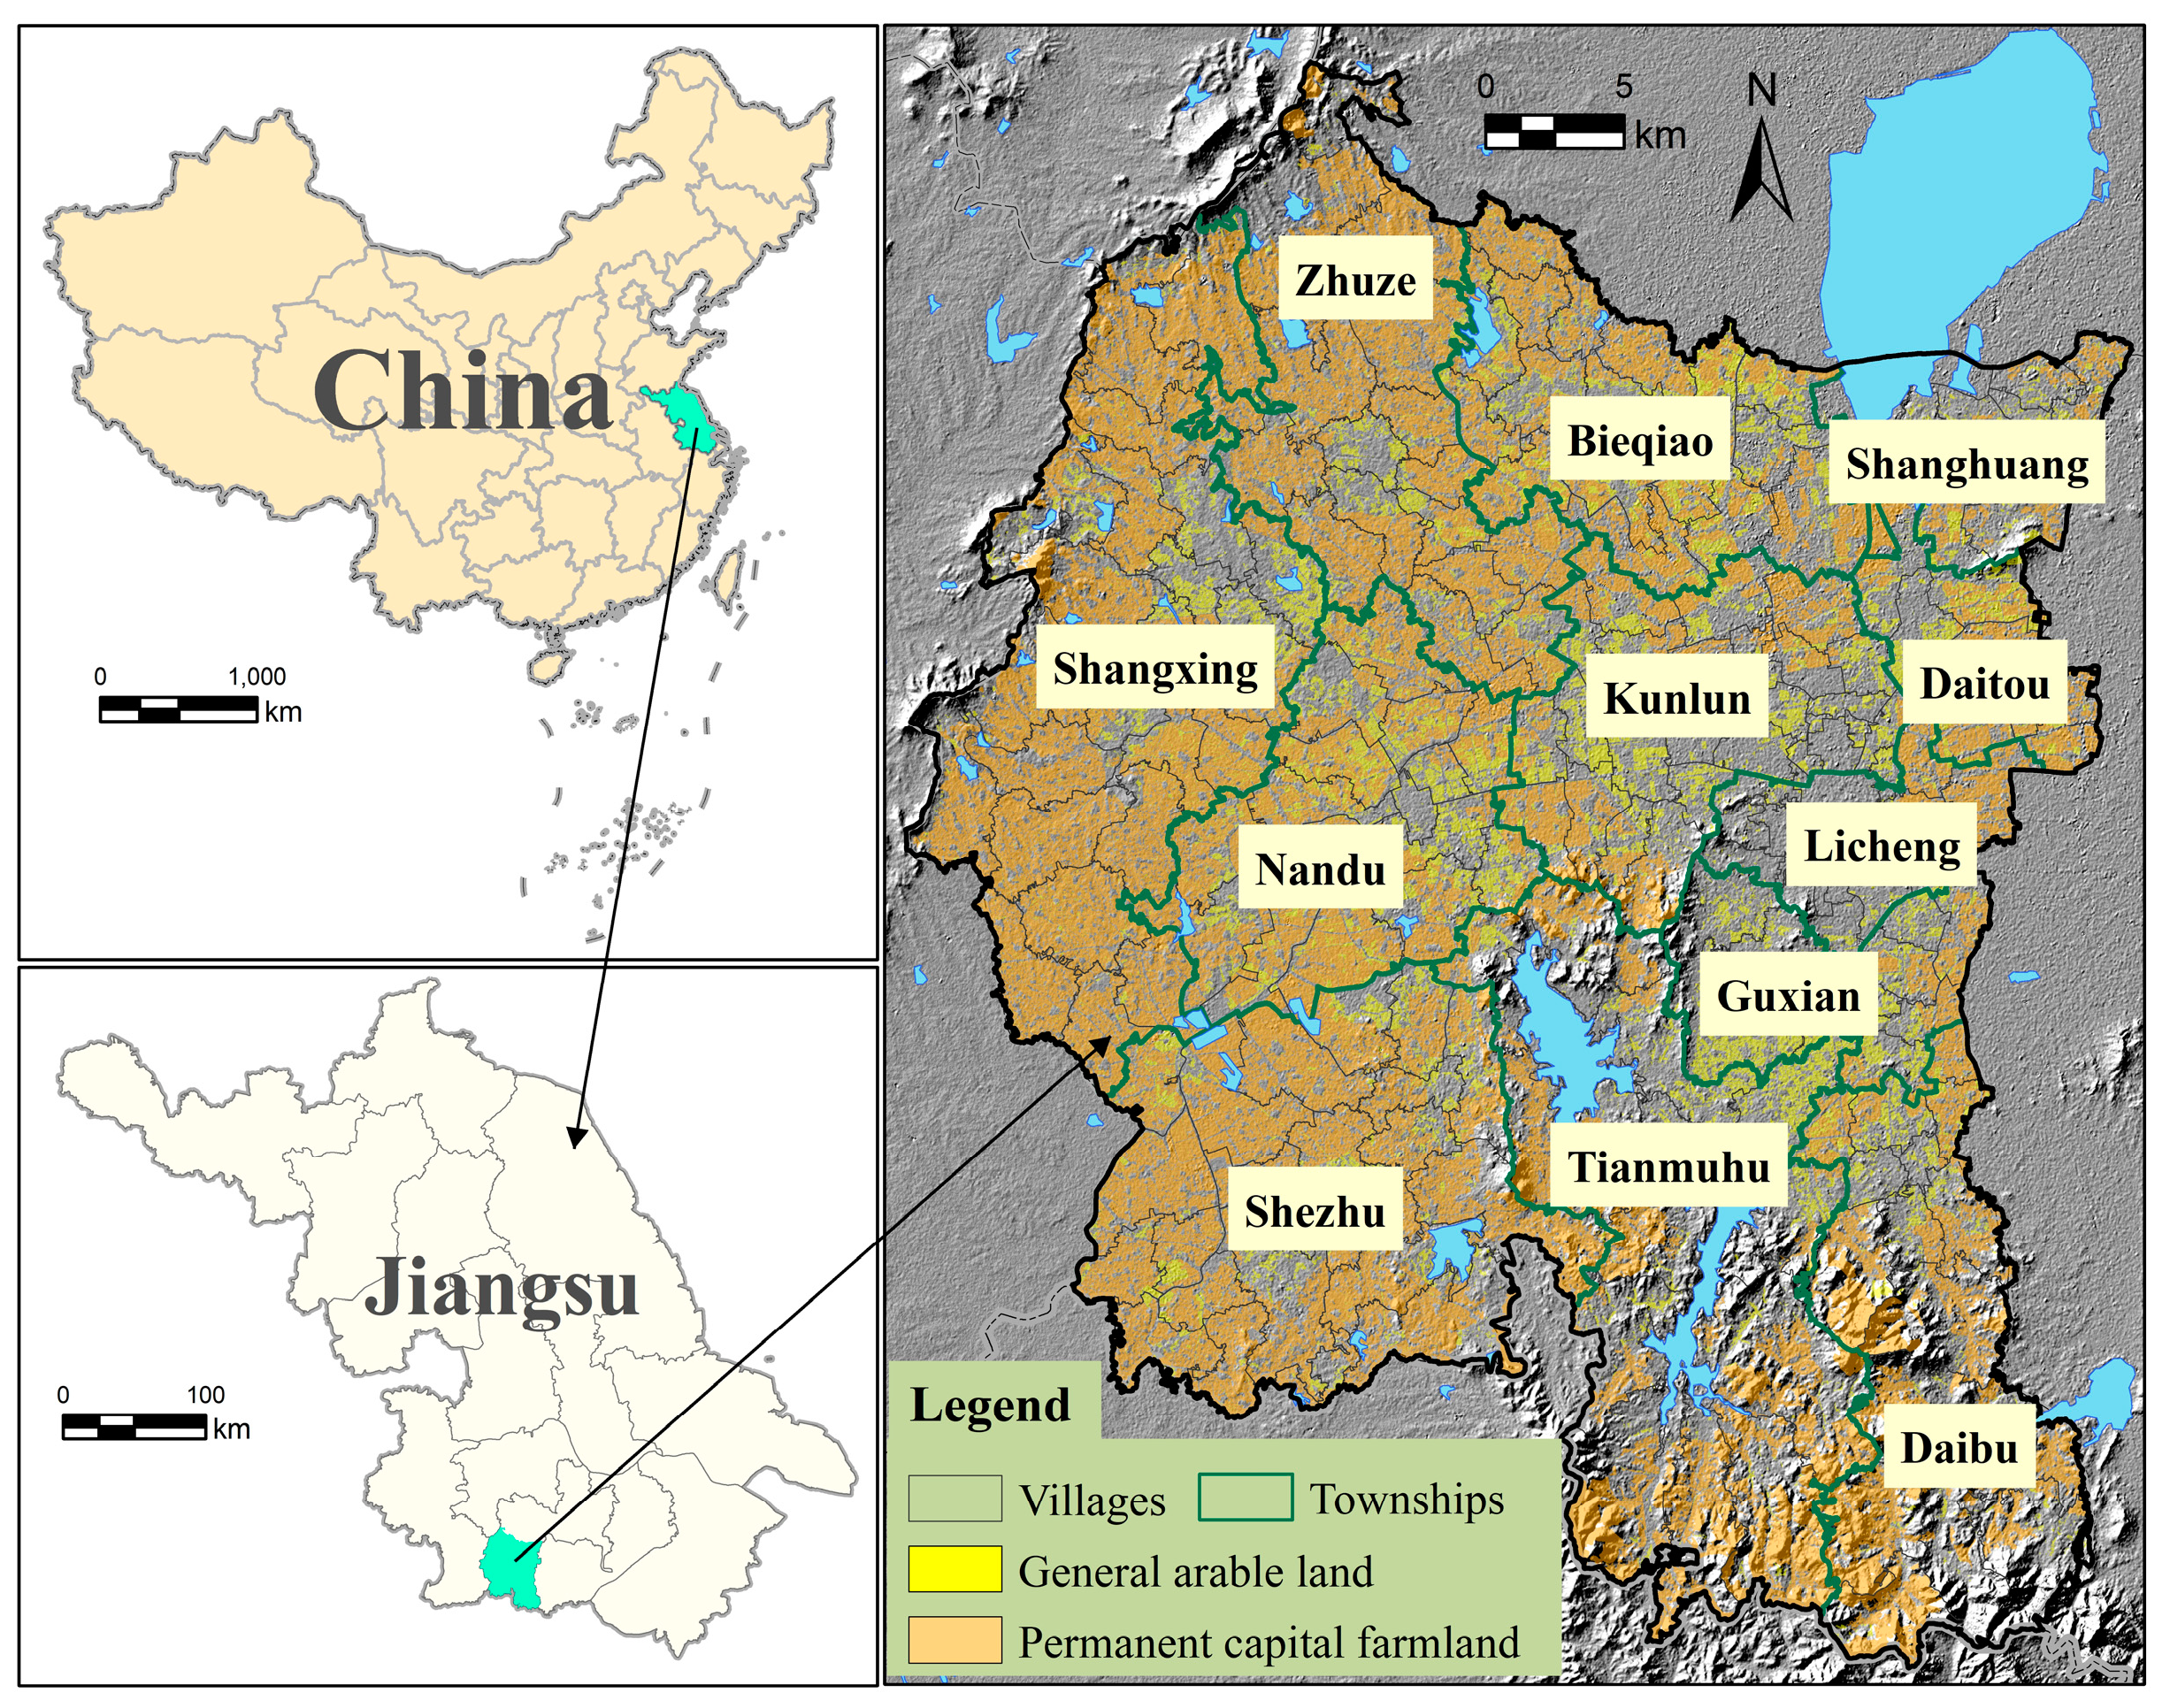
With a total land area of 153,500 ha, Liyang (longitude 119°08′–119°36′ E, latitude 31°01′–31°41′ N) is located at the junction of the Nanjing Metropolitan Area, Anhui Yangtze River City Belt, Hangzhou Metropolitan Area, and the Suzhou, Wuxi and Changzhou City Clusters, which is a typical rapid urbanizing area (Figure 5). It achieved a GDP of CNY 141.62 billion in 2022 and has been ranked among the top 100 counties in China for many years. Liyang has a distinctive subtropical monsoon climate with the average annual temperature and precipitation of 17.5 °C and 1149.7 mm, respectively, which is favorable for crop growth. The ratio of plains to hills is close to 1:1 [46]. In 2020, the total arable land and PCF area were 58,611 ha and 56,667 ha, respectively. The cropping system in Liyang is mainly a rotation of rice/wheat or rice/rapeseed cultivation. Furthermore, the sown area of grain was 54,850 ha, with a total output of 408,610 t, of which 31,870 ha and 19,040 ha were sown for rice and wheat, respectively, and 18,840 ha were sown for other crops.
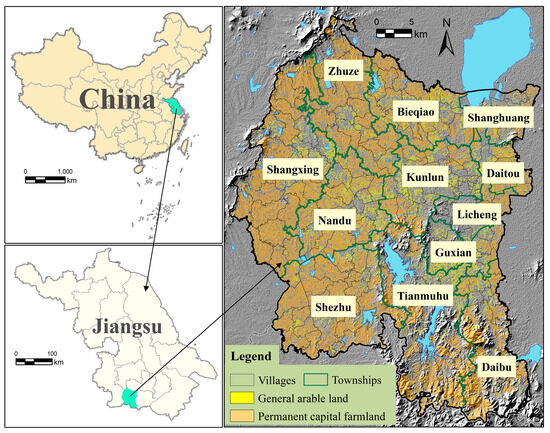
Figure 5.
Location map of Liyang.
3.2. Data Sources and Drivers Determination
3.2.1. Data Sources
The data used in this paper mainly include PCF data, remote sensing data, land use data, and social and economic data (Table 1). The spatial resolution of the Gaofen-2 satellite (GF-2) is 1.0 m. The digital elevation model (DEM) data are the 12.5 m spatial resolution data of Advanced Land Observing Satellite (ALOS). A field investigation has verified that the visual interpretation data based on GF-2 and other auxiliary data (PCF data and TNLS data) are up to 97% accurate. The drivers of PCF non-grain production in this study (Section 3.2.2) were counted as village-scale data based on social and economic data and DEM data. The data in Section 4.3.2 was organized according to average costs and benefits of major agricultural operations in Liyang.

Table 1.
Data and their sources.
3.2.2. Drivers Determination
PCF non-grain production, like arable land, is influenced by various factors, including economic, social, resource, and policy factors [21,26,27,49,50,51]. Considering the typicality and availability of driver data, the main drivers of PCF non-grain production were initially identified (Table 2). Among the economic factors, agricultural income and non-agricultural income are recognized as key factors in non-grain production [29,45,50]. The added value of the primary industry, agricultural income per capita, and aquaculture income per capita were selected to represent indicators of economic factors. Among the social factors, the level of population and the level of urbanization, together, determine the impact of human capital on non-grain production [21,43,50]. Although the distances to the city and the roads were considered important drivers [16,26], the gap in the distance from the village area to the township was not significant. So, the agricultural population, non-agricultural population, and urbanization rate were considered as indicators of social factors. In terms of resource factors, the conditions of arable land, the various types of production conditions in agriculture, and topographical conditions are important factors representing land resources, production resources, and natural conditions, and acting on non-grain production [9,13,14,16,21,50]. The total power of agricultural machinery, PCF area, and mean slope were selected to represent indicators of resource factors. In terms of policy factors, the transfer of agricultural land is within the scope of the policy, which is considered to be an important factor affecting non-grain production [29,52]. Agricultural cooperatives are representative of local policy orientations and have a positive impact on non-grain production [21]. In addition, the degree of policy insurance participation is more descriptive of receiving benefits from policies at the village scale, which is similar to agricultural subsidies [53]. Therefore, the arable land area transferred, the number of agricultural cooperatives, and the policy insurance participation rate were used to characterize the indicators of policy factors.
Table 2.
The selected drivers of permanent capital farmland (PCF) non-grain production in this study.
3.3. Method
3.3.1. Non-Grain Measurements
PCF non-grain production means that grain crops are no longer grown. PCF non-grain is quantified using the proportion of the area of PCF non-grain production plots to the total area of PCF in the region [12,54]. The equation is shown below.
where is the proportion of PCF non-grain production; is the area of PCF non-grain production plots in the PCF; and is the total area of the PCF.
3.3.2. Geodetector Modeling
Geodetector modeling is a set of statistical methods for detecting spatial heterogeneity and revealing the drivers behind it [55]. Its factor detector method is used to detect the influence of the driving factor X on the spatial heterogeneity of PCF non-grain production, which is expressed by q. The value of q ranges from 0 to 1, and the larger the value, the stronger the influence of the driving factor on the spatial heterogeneity of PCF non-grain production. The equation is shown below.
where h = 1, 2 …, L is the categorization or partitioning of the variable Y or the factor X; N and are the number of units in the whole zone and layer h, respectively; and are the Y value variances for layer h and the whole zone, respectively.
4. Results
4.1. The Structural Characteristics of PCF
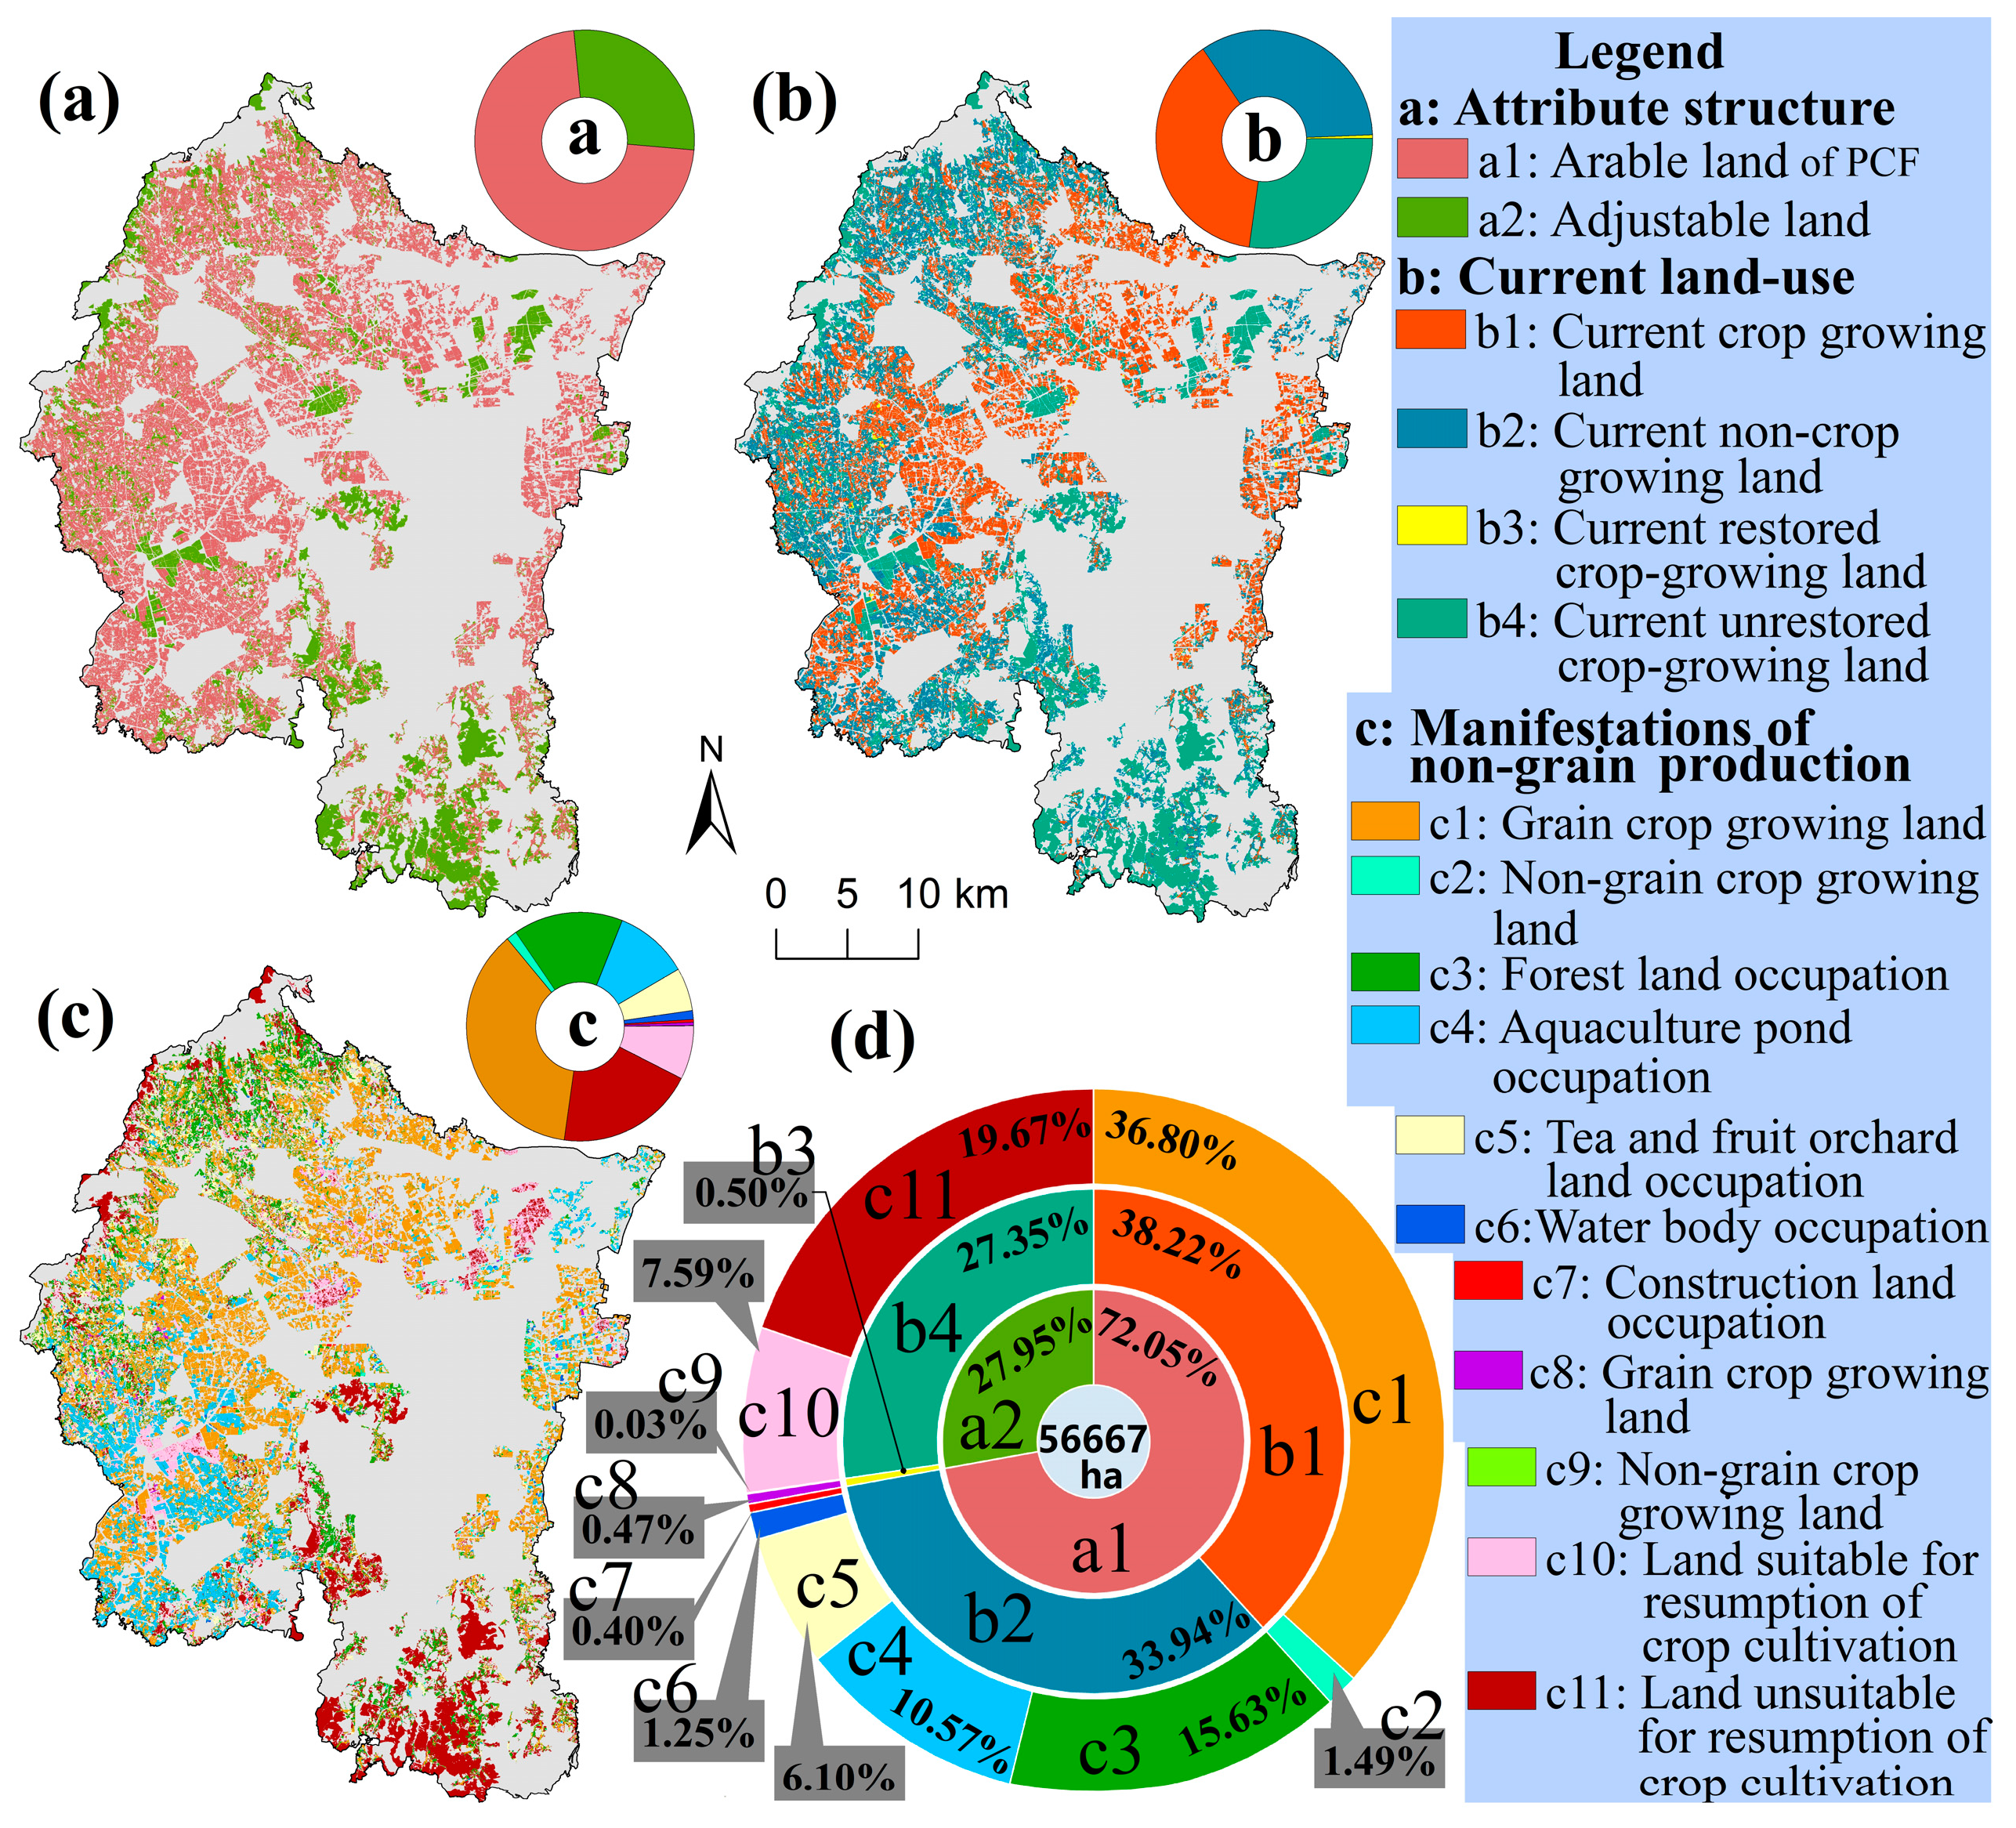
Figure 6 illustrates the total area of PCF in Liyang, which is 56,667 ha. The arable land of PCF is mainly located in the central and western plains, covering 72.05% of the area, whereas the adjustable land is mainly located in the southern hills, covering 27.95% of the area. The current land use pattern shows that b1 is mostly concentrated in the central plains, occupying the largest area of 38.22%. The b2 (33.94%) and b4 (27.35%) are mainly distributed along the hills in the west and south but have a higher proportion than in an ideal situation. Indeed, PCF non-grain production, manifested through different circumstances, varied widely. PCF non-grain production under the arable land of PCF is mainly characterized by changes in agricultural practices, as shown in c3 (15.63%), c4 (10.57%), and c5 (6.10%), while among the adjustable lands, the measurement of PCF non-grain production is largely determined by the portion of the adjustable lands that do not have the attribute to cultivate grain, with the larger areas being c11 (19.67%) and c10 (7.59%).
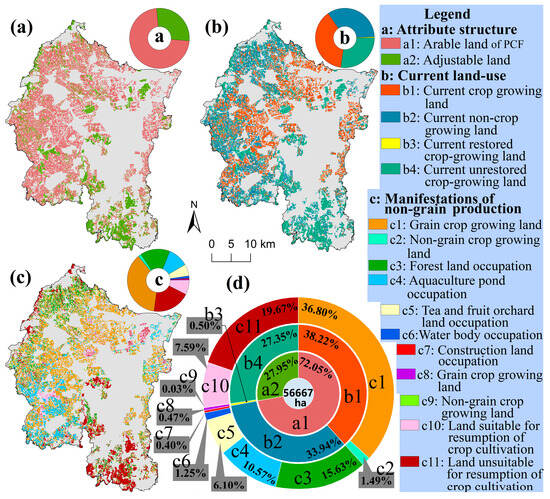
Figure 6.
Current structural characteristics of PCF in Liyang. (a) Attribute structure, (b) current land use, (c) manifestations of non-grain production, and (d) quantitative structure.
4.2. The Characteristics of PCF Non-Grain Production
4.2.1. Scenario Analysis of PCF Non-Grain Production
The study evaluated PCF non-grain production in various scenarios. As shown in Figure 7a–d, scenario SD had the highest average PCF non-grain production of 62.88%, with significantly larger results for hilly villages than for plains. Villages in Tianmuhu Town had the largest results, averaging over 80%. Scenario SR, on the other hand, had an average PCF non-grain production of 48.88%, which was 14.00% less than scenario SD. The results were relatively lower for both hilly and plains villages. Scenario ST had an average PCF non-grain production of 39.23%, which was 23.65% and 9.65% lower than scenario SD and scenario SR, respectively. While the results for hilly villages were higher than those for plains, the gap between the two generally narrowed. Scenario SD, SR, and ST demonstrated the transition of PCF and arable land from a practical relationship (Figure 2b) to a theoretical relationship (Figure 2a). Overall, scenario SD produced the highest average PCF non-grain production, followed by scenario SR and then scenario ST. Scenario SR was a more realistic representation of PCF non-grain production and it was easier to analyze its drivers. Therefore, the following analysis will focus on the scenario SR.
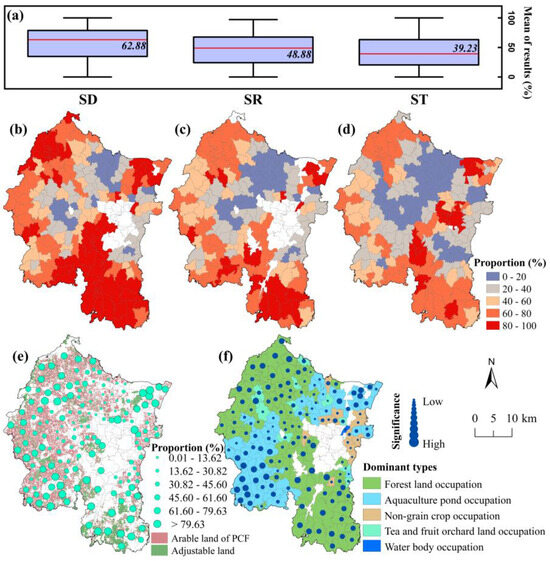
Figure 7.
The PCF non-grain production in Liyang in different scenarios and the village scale of the scenario SR. (a) Statistical distribution (25–75%) and mean value (red line) of PCF non-grain production results in different scenarios, (b) scenario SD results, (c) scenario SR results, (d) scenario ST results, (e) proportion of PCF non-grain production area of the scenario SR, and (f) dominant types of PCF non-grain production of the scenario SR.
4.2.2. Spatial Characteristics of Realistic Scenario of PCF Non-Grain Production
The scenario SR results (Figure 7e,f) showed that villages with less than 30% of PCF non-grain production area were mostly located in the central plains, while villages with more than 60% of PCF non-grain production area were grouped in the western and southern hilly contiguous areas, forming a slanted U-shaped spatial pattern. The degree of PCF non-grain production also decreased from hills to plains, but there was a tendency for an inverse incremental increase in villages located around towns. The most prevalent types of PCF non-grain production were forest land occupation, aquaculture pond occupation, non-grain crop land occupation, tea and fruit orchard land occupation, and water body occupation in the villages. Forest land occupation and aquaculture pond occupation are the most common types of PCF non-grain production. The hills had forest land occupation as the dominant type of PCF non-grain production, while in the plains, aquaculture pond occupation was more common. Notably, the significance of the dominant types decreased from hills to plains.
4.3. Drivers of PCF Non-Grain Production
4.3.1. Drivers Analysis Based on Geodetector Factor Detection
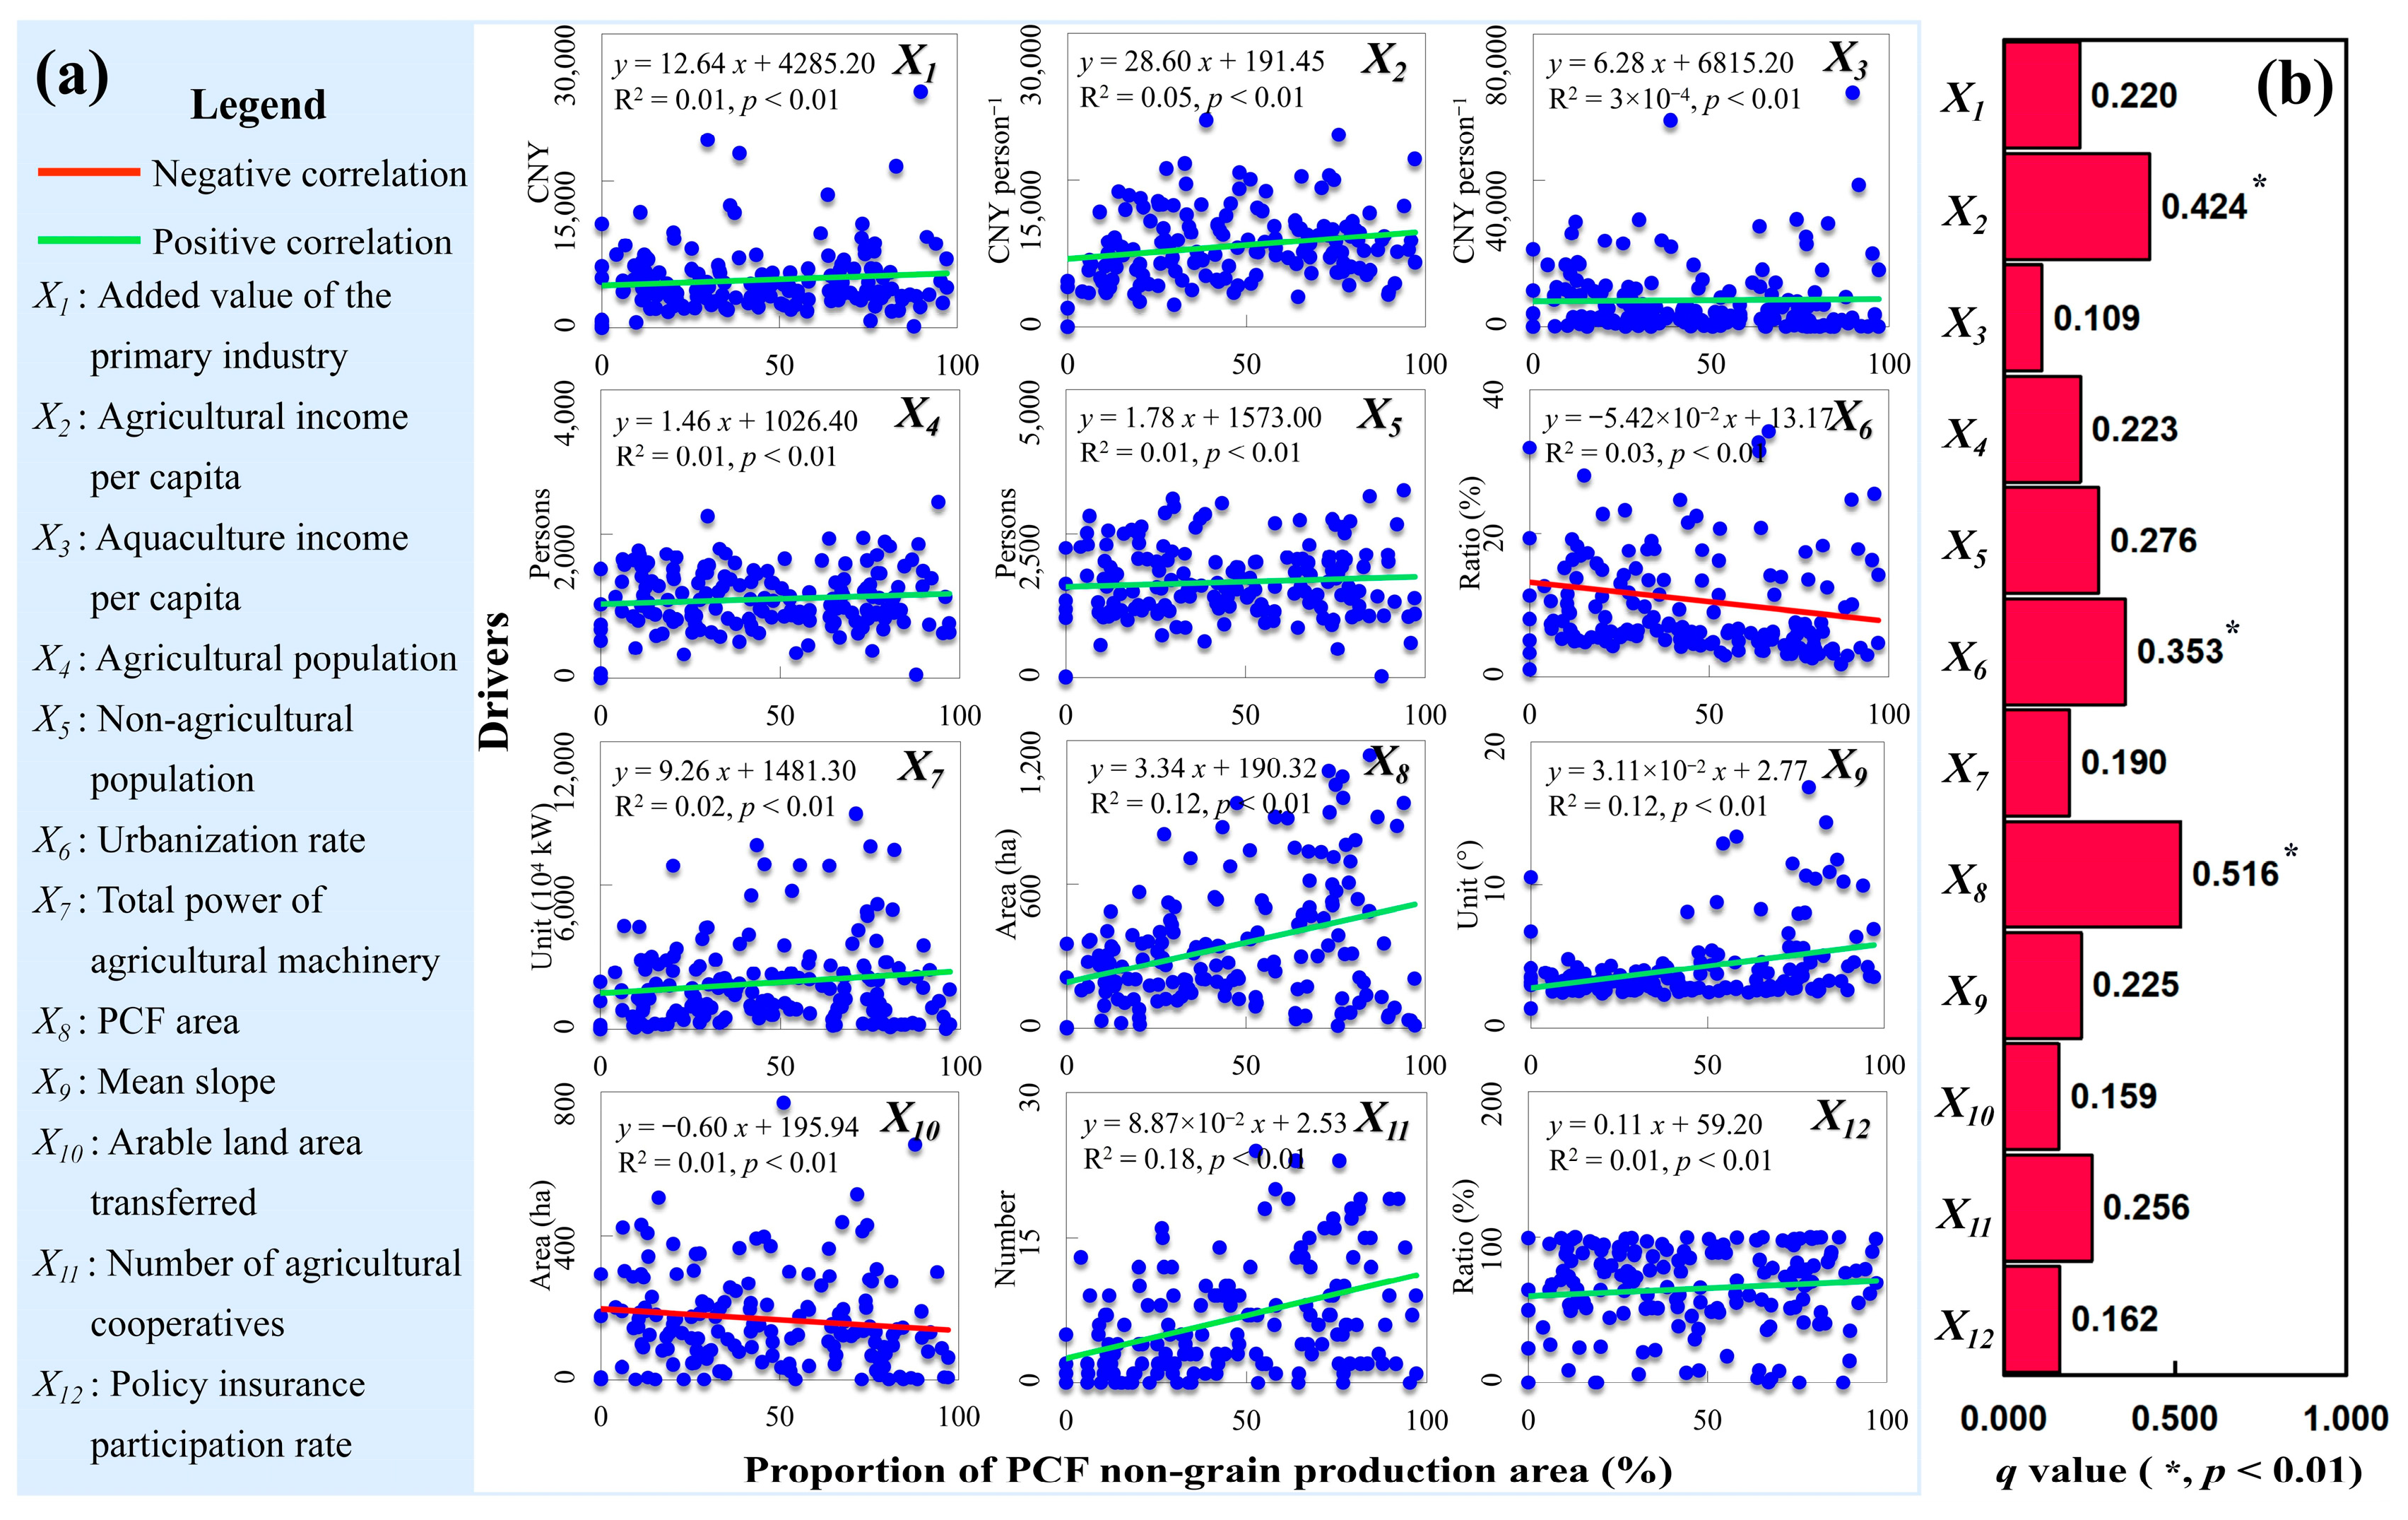
We have examined the factors that contributed to scenario SR. The variance inflation factors (VIF) for the selected drivers ranged between 1.37 and 5.23, all being less than 10. This indicated that none of the mean VIF for the drivers exhibited inter-factor multicollinearity. Figure 8a shows that all of the drivers (X1–X12) are significant at the 1% level. The proportion of PCF non-grain production area was negatively correlated to urbanization rate (X6) and arable land area transferred (X10), while it was positively correlated with the remaining drivers.

Figure 8.
The explanatory power of drivers and the relationship between the proportion of PCF non-grain production area and the drivers at the village scale in Liyang. (a) The relationship between the proportion of PCF non-grain production area and the drivers and (b) the explanatory power of drivers of PCF non-grain production.
According to the results of geodetector factor detection (Figure 8b), the explanatory power of the drivers for the PCF non-grain production in the study area are listed in order as follows: PCF area (X8), agricultural income per capita (X2), X6, non-agricultural population (X5), number of agricultural cooperatives (X11), mean slope (X9), agricultural population (X4), added value of the primary industry (X1), total power of agricultural machinery (X7), policy insurance participation rate (X12), X10, and aquaculture income per capita (X3). Among these factors, X8, X2, and X6 had the strongest explanatory power, with a contribution of PCF non-grain production of 51.60%, 42.40%, and 35.30%, respectively (based on a 1% level of significance). It is clear that PCF area, agricultural income per capita, and urbanization rate were the most important factors that influenced the PCF non-grain production in the study area.
4.3.2. Explanation of Dominant Factors
This section offers a detailed analysis of these key factors (X8, X2, and X6) and their impact on PCF non-grain production based on local survey evidence.
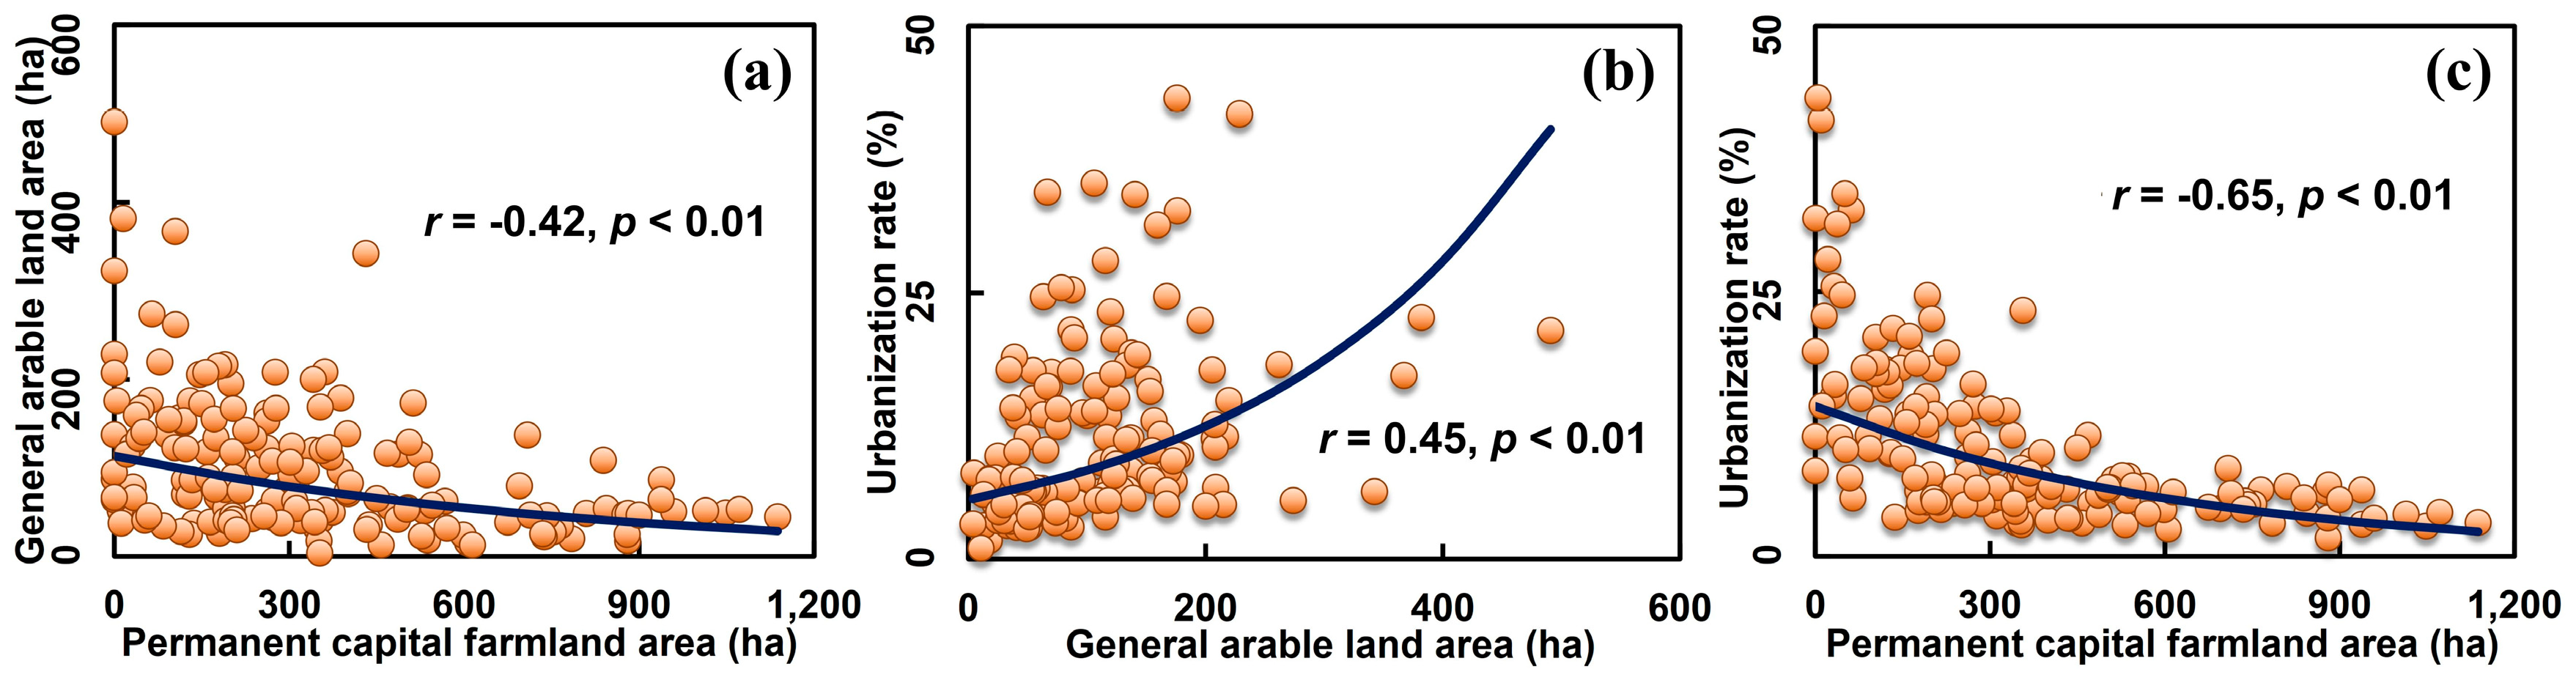
The PCF area indicator reflected the capacity level of the natural resource endowment. In the study area, the PCF area accounted for 96.7% of the total arable land. The theoretical stock of arable land outside the PCF boundaries of the villages was low. However, there was a special logical relationship between PCF and arable land (Figure 2), which created uncertainty about the impact of land resource endowment on PCF non-grain production. The positive correlation between X8 and PCF non-grain production implied that PCF non-grain production rose with the increasing PCF area of the village (Figure 8a). According to Figure 9a, it is found that the scale of PCF and general arable land (arable land outside the PCF) in villages are complementary in the context of constant arable land resources. Since PCF is more restricted by policies than general arable land, the large general arable land resulting from a small PCF area is more conducive to carrying out non-grain operations. Otherwise, maintaining a larger PCF area would result in the limited general arable land being insufficient to support the development of non-grain operations, which would inevitably lead to the occupation of more PCF area, and thus the increase in PCF non-grain production.
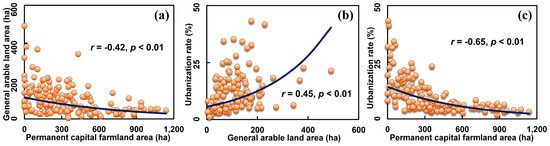
Figure 9.
Interrelationships among PCF area, general arable land, and urbanization rate in villages of Liyang. (a) PCF and general arable land, (b) general arable land and urbanization rate, and (c) PCF and urbanization rate.
The indicator of agricultural income per capita is a measure of the profitability of agricultural production. Table 3 demonstrates that planting cash crops and shrimp farming is more profitable than planting grain crops. In terms of grain cultivation, rice/wheat rotation and rice/rapeseed rotation were the priority systems, with cash earnings of 21,936 CNY ha−1 yr−1 and 28,302 CNY ha−1 yr−1, respectively (cash earnings influence farmers’ operational decisions more than the net profit indicator [56]). However, the cash earnings from tea and shrimp were twice as high as those from the grain cultivation methods. Furthermore, Figure 8a shows a positive correlation between X2 and PCF non-grain production. This indicates that higher agricultural income per capita in a village leads to greater PCF non-grain production. The low returns from grain cultivation are the primary reason for the prevalence of PCF non-grain production in terms of aquaculture pond occupation in the plains and tea and fruit orchard land occupation in the hills. Agricultural operators often choose the mode of utilization that maximizes economic efficiency through comparative trade-offs [38]. Despite the strict policy limitations and higher costs of non-grain production operations, PCF non-grain production operations tend to have higher comparative returns compared to grain cultivation. Rational farm operators tend to choose operations with high comparative returns to their current operations [57]. As a result, the shrimp and tea models have become the preferred choice of operation, leading to the current phenomenon of PCF non-grain production.
Table 3.
Average costs and benefits of major agricultural operations in Liyang, 2018–2022.
The urbanization rate is an indicator that reflects the level of urban development and the competition between urban and agricultural spaces. In general, the urbanization rate is positively related to the non-grain production of arable land, which is linked to lower agricultural profitability due to development occupation [13,45]. However, we have found a negative correlation between X6 and PCF non-grain production (Figure 8a). This was mainly due to the fact that towns had reserved a portion of their arable land for future development, which was not included in the PCF. This resulted in more general arable land and less PCF in villages with high urbanization rates (Figure 9b). As Figure 9c, villages with larger urbanization rates also have smaller PCF areas. Therefore, the negative correlation between the urbanization rate and PCF non-grain production can be better understood by linking it to the PCF area indicator. If PCF-eligible arable land is not included in the PCF, but non-grain arable land is included instead, it can reduce the space suitable for grain cultivation, which ultimately leads to PCF non-grain production.
5. Discussion and Implications
5.1. PCF Non-Grain Production vs. Arable Land Non-Grain Production
5.1.1. Insights into Differences in the Results of Non-Grain Production
There is a large gap between the results for PCF non-grain production and arable land non-grain production. Our study showed that the results of scenario SD were 14.00% larger than those of scenario SR for PCF non-grain production (Figure 7a). This suggested that there was a large gap between practical and theoretical PCF non-grain production. The average PCF non-grain production of scenario SD was 62.88%, which was much larger than the local result of 48.09% for arable land, as reported by Cheng et al. [16]. However, the result of scenario SR, which showed 48.88% PCF non-grain production, was similar to the result reported by Cheng et al. [16]. These findings suggested that PCF non-grain production during the transition phase (scenario SR) was more comparable to the non-grain production of arable land. Importantly, the scope of the evaluation of PCF non-grain production in scenario SR did not include past arable land. This is also a result of benefiting from the implementation of the analysis framework of PCF non-grain production evaluation (Figure 4). Thus, b4 (current unrestored crop-growing land), obtained by combing through the analysis framework, explained the source of the 14.00% gap between scenario SD and scenario SR. Moreover, the PCF non-grain production result of scenario ST was 9.65% lower than that of scenario SR, which also indicated that PCF non-grain production was lower than arable land by about 10% if in the theoretical relationship (Figure 2a). These results were justified by the fact that PCF was originally established for grain production, and the PCF non-grain production in the same area was logically lower than arable land. Therefore, the previously reported PCF non-grain production in Guangxi Province [12], a county in Hubei Province [19], and a county in Yunnan Province [20] were considered to be overvalued.
5.1.2. Insights into Differences in the Dominant Land Types for Non-Grain Production
The dominant types of PCF non-grain production in hilly areas differ from that of arable land non-grain production but are more similar in the plains. On the one hand, in the study area, we found that b4 (current unrestored crop-growing land) accounted for 27.35% of the PCF, and was mostly located in hilly villages (Figure 6). It can be seen that in the hilly areas, the contribution to PCF non-grain production was greater in the adjustable land that remained under non-cultivation. For instance, the part of a large forested area in the PCF non-grain production may be linked to adjustable land that has been in a forested state since the demarcation of the PCF [12,20]. In contrast, abandoned land was the dominant type leading to non-grain production on arable land [45]. Abandoned land, unlike adjustable land, is still arable land and can be replanted at any time. With the different dominant types between PCF non-grain production and arable land non-grain production in the hilly areas, it seems that the non-grain production of PCF was more difficult to reduce than on the arable land. On the other hand, c4 (aquaculture pond occupation) was the dominant type of PCF non-grain production in the plains villages (Figure 7f). This indicated that aquaculture development had a significant impact on PCF non-grain production in these areas. However, aquaculture ponds and artificial forest land have been identified as the dominant type contributing to arable land non-grain production in our study area [45]. In the plains of similar rapid urbanizing areas, aquaculture ponds and artificial forests have also been shown to be the dominant types of arable land non-grain production [8]. Thus, in the plains areas, the dominant types that lead to the non-grain production of PCF were similar to local arable land. Importantly in the plains, aquaculture was an alarming type of PCF non-grain production, and artificial forestry was one that needed more attention in arable land.
5.1.3. Insights into Differences in the Drivers of Non-Grain Production
General arable land, as an external factor, may indirectly have shaped the difference between the primary drivers of PCF non-grain production and arable land non-grain production. Our study revealed that the dominant factors contributing to PCF non-grain production were X8 (PCF area), X2 (agricultural income per capita), and X6 (urbanization rate) (Figure 8b). This finding contrasts with the results of studies on arable land non-grain production in areas experiencing rapid urbanization. In those studies, economic benefits have been considered the primary factor driving non-grain production [6,15,21,43,45]. Indicators such as the urban-to-rural disposable income ratio [21], per capita GDP [43], income level [15], and the proportion of the fishing industry in the primary industry [45] were considered. The urbanization rate was also identified as an important driver [13]. However, the arable land area that exhibited scale characteristics did not show a strong driving ability [21]. In contrast, agricultural income per capita had the same driving effect on PCF non-grain production as arable land, while the urbanization rate had the opposite effect. Notably, the PCF area, which represents scale characteristics, was the most distinctive factor contributing to PCF non-grain production.
The differences in the driving factors mentioned above are closely related to logical errors caused by the inconsistency between the theoretical and practical relationships of the PCF (Figure 2). First, the PCF has a structural problem that creates uncertainty in identifying the drivers of non-grain production. This is because the adjustable land, which was once arable land, affects both the scale of the PCF and the general arable land. This uncertainty may lead to the identification of surprising dominant driving factors in our results. Additionally, unlike arable land, PCF non-grain production is driven not only by economic incentives but also by the size of the general arable land. General arable land is a less restrictive policy option than PCF and has a greater potential for non-grain production. If there is a negative correlation between PCF and general arable land in a given area (Figure 9a), then the size of PCF (measured by area) will have a positive impact on the production of non-grain crops in that area. These results are supported by the findings of Su et al. [26], emphasizing that the policy implementation of PCF encourages non-grain production.
5.1.4. Breaking the Boundary between PCF and Arable Land
The results of this paper and the discussion above suggest that the current legal and physical boundary between PCF and arable land is not effective in preventing the spread of non-grain production. Traditional methods are no longer adequate in exploring PCF non-grain production. Therefore, this paper focuses on contributing to understanding PCF non-grain production from the perspective of breaking the boundary between PCF and arable land. This breaking of the boundary has four implications: (i) breaking the legal boundary between the two, which refers to a theoretical relationship; (ii) breaking the physical boundary between the two, which refers to a spatial relationship; (iii) breaking the rights boundary between the two, which refers to a non-tradable barrier; and (iv) breaking the non-grain production evaluation boundary between the two, which refers to shackles of non-comparability. It contributes to understanding the relationship between PCF non-grain production and arable land non-grain production, as well as to finding out the key to cracking the PCF non-grain production problem from the village scale.
5.2. Rational Understanding of PCF Non-Grain Production
5.2.1. PCF Non-Grain Production and the Change in Diet Structure
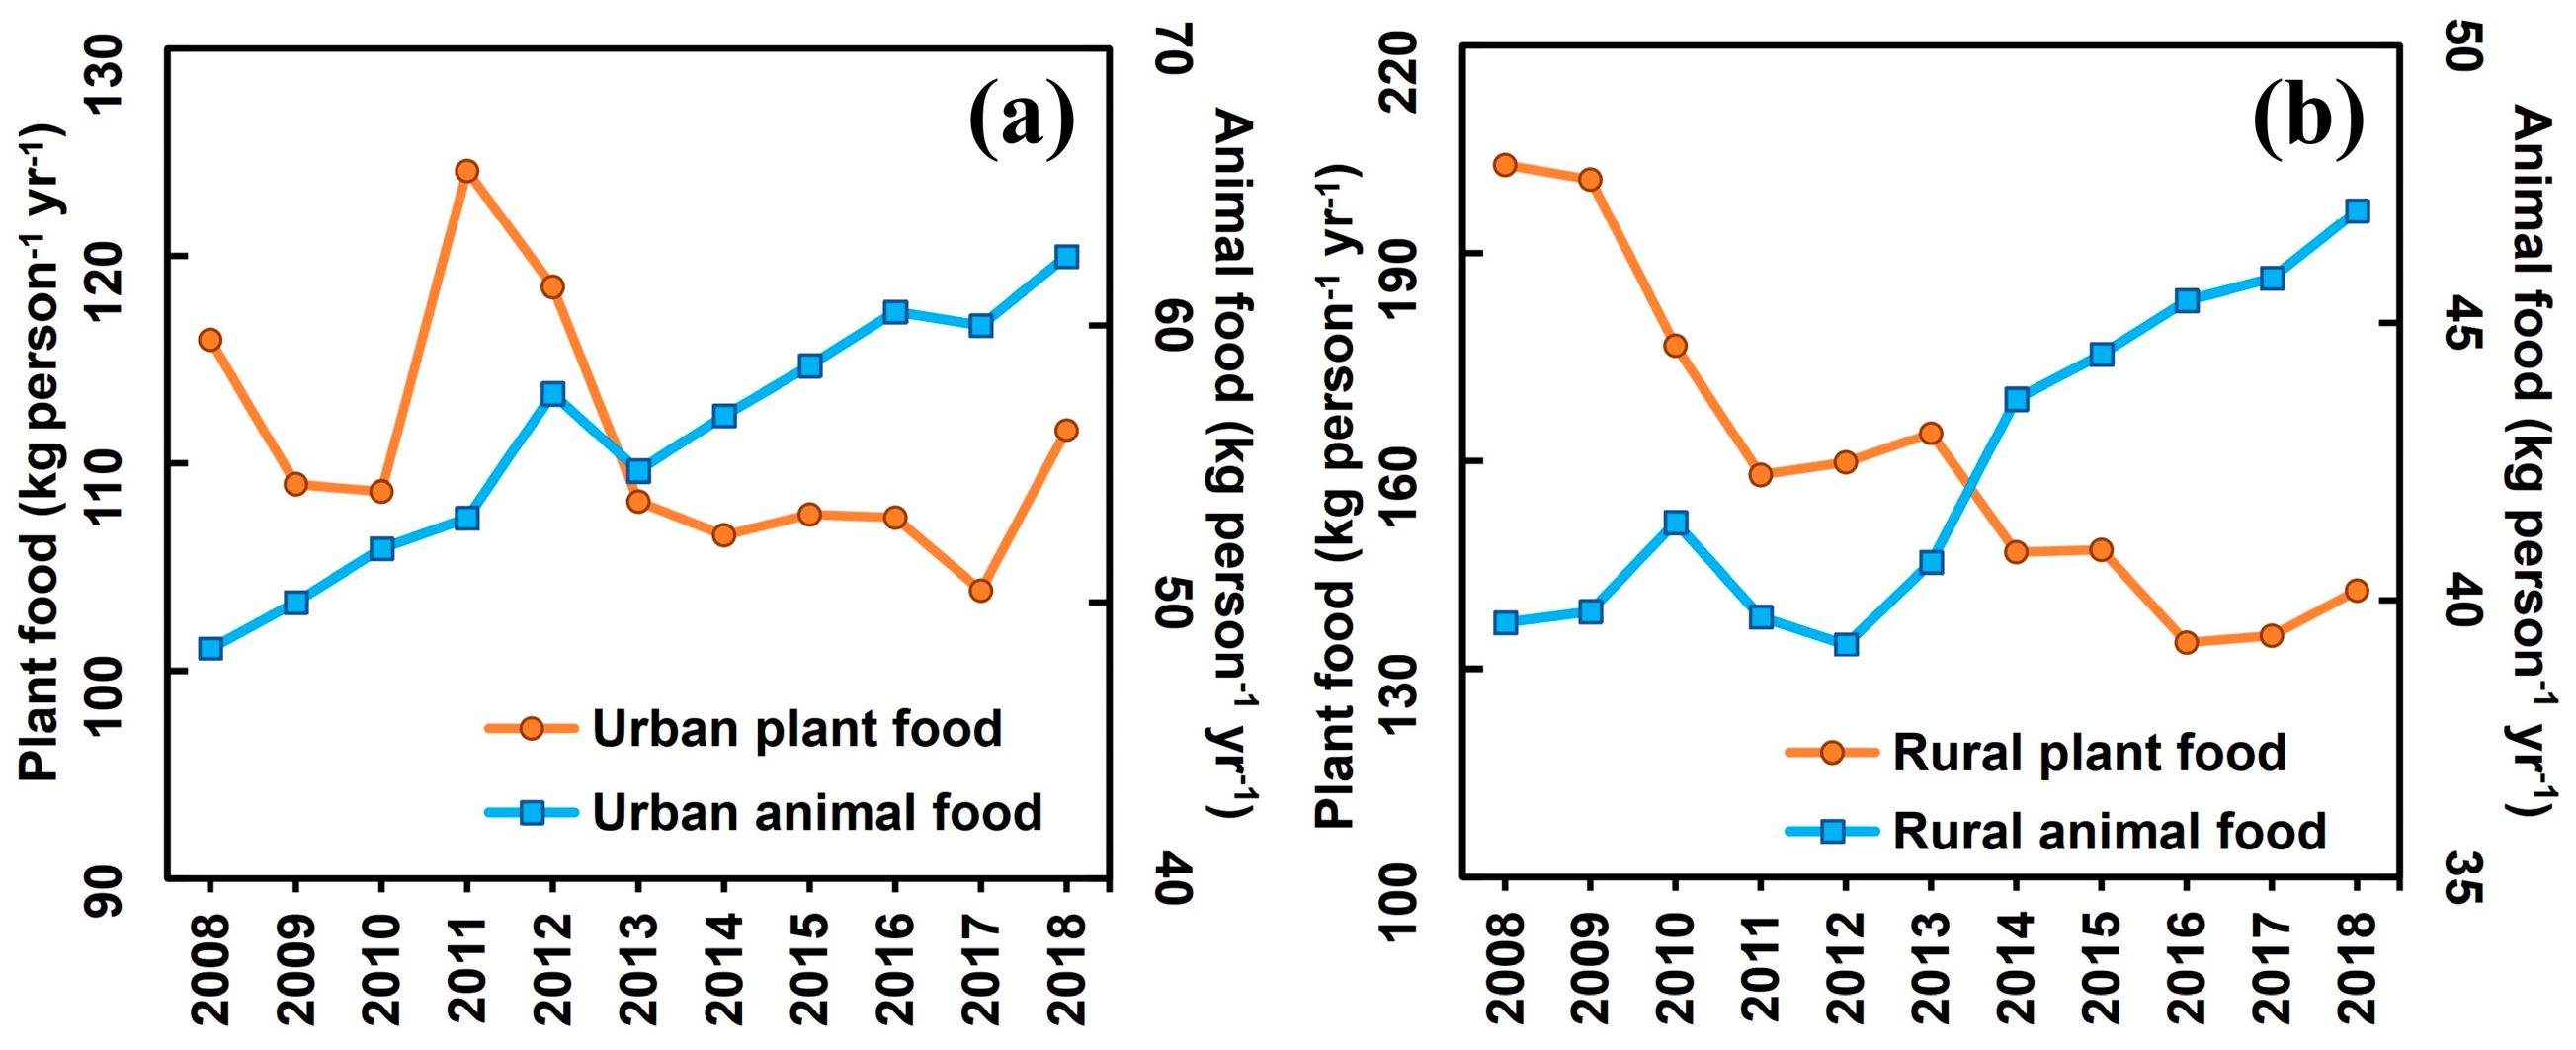
The change in diet structure has a direct impact on land use. With economic growth, there is an increasing demand for protein and fat in the population’s diet, resulting in a larger need for land resources [58]. In China, the area of land for animal sources needed for diet per capita gradually surpassed the area of land used for grains from 1961 to 2007 [59]. Figure 10 shows that there has been a significant shift in the diet structure of Liyang since the PCF was proposed. We observed a decline in per capita plant food consumption and a rise in per capita animal food consumption. Specifically, urban per capita plant food consumption decreased from 115.97 kg person−1 yr−1 to 111.62 kg person−1 yr−1, while animal food consumption increased from 48.32 kg person−1 yr−1 to 62.49 kg person−1 yr−1. In contrast, rural per capita plant food consumption dropped from 202.80 kg person−1 yr−1 to 141.40 kg person−1 yr−1, while animal food consumption increased from 39.60 kg person−1 yr−1 to 47.02 kg person−1 yr−1. Meanwhile, the consumption of local ingredients dominates the diet of both urban and rural residents [60]. Therefore, the shift towards less grain and more meat in the diet of the population will lead to a decrease in land for grain production and an increase in the land required for animal food production [59]. This shift in PCF is evident in the non-grain production of shrimp ponds. It is essential to note that changes in dietary structure were market-driven and resulted from supply and demand [61,62]. To some extent, it was reasonable to meet the population’s demand for meat consumption. Moderate non-grain production is necessary to adapt to changing diets in urban and rural areas. However, it should not lead to excessive non-grain production as a result of blind profit-seeking.
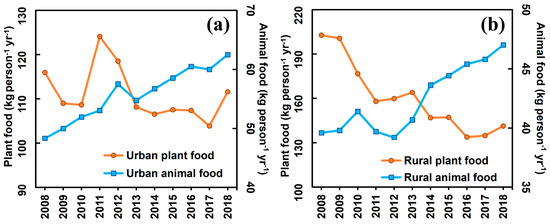
Figure 10.
Changes in per capita plant food and animal food consumption in urban and rural areas from 2008 to 2018 in Liyang. (a) Urban per capita food consumption and (b) rural per capita food consumption. We analyzed the data from the Jiangsu Statistical Yearbook, Changzhou Statistical Yearbook, and Liyang Statistical Yearbook to plot the changes in per capita grain and meat consumption in urban and rural areas of Liyang from 2008 to 2018.
5.2.2. PCF Non-Grain Production and Ecological Conservation
In China, there are policy incentives, such as afforestation and gain for green, that encourage non-grain production behavior [43]. Several studies have shown that forest land occupation is the dominant form of non-grain production in both PCF and arable land [8,12,20,45]. Our findings also suggest that c3 (forest land occupation) is the most prevalent form of PCF non-grain production in hilly villages (Figure 7f). Some of these forest lands may have been established due to policy incentives [63,64]. For example, in areas where drinking water sources need protection, parts of arable land have been returned to forest and grassland for environmental purposes [65]. The phenomenon of PCF non-grain production due to grain for green had also occurred in the drinking water source protection area of Tianmuhu Town, located in the southern hills of the study area. However, gain for green has played an important role in managing surface pollution [66]. Therefore, PCF non-grain production due to gain for green is acceptable if it is necessary to protect clean water. This trade-off approach to PCF non-grain production is the optimal choice based on regional resources and environmental considerations, as well as a correction of PCF.
5.3. Policy Direction
At present, efforts to address the issue of PCF non-grain production mainly focus on identifying the responsible parties and improving supervision [48,67]. Proposed solutions for non-grain production on arable land can serve as a reference for addressing the issue of PCF non-grain production. These solutions include strengthening institutional construction [6,7], increasing subsidies for grain cultivation [17,68], improving the market for agricultural services, enhancing the construction of agricultural infrastructure [13], and establishing a mechanism for trading non-grain production rights [69]. Meanwhile, these measures should be considered in the context of harmonization of ecological protection and urban construction [49,70]. Our analysis of PCF non-grain production in a rapidly urbanizing region of China indicated that addressing those issues would require locally tailored policies.
5.3.1. PCF Should Be Redefined
The availability of adjustable land has led to an apparent contradiction in the logical relationship between PCF and arable land (Figure 2). The origins of PCF non-grain production are heavily influenced by the availability of adjustable land. This can negatively impact the evaluation of PCF non-grain production and the maintenance of grain production behavior. The first step is to update the scope of PCF in accordance with the current land use status. We recommend excluding unrestored crop-growing land from the adjustable lands and instead including general arable land eligible for PCF (scenario SD to scenario ST). This means that part of the arable land currently in use will be considered as the redefined PCF. In addition, the urbanization rate is a significant factor that influences the PCF non-grain production (Figure 8). Therefore, any redefined PCF should consider the impact of urban expansion. It is important to note that the space available for urban development should be limited to the local carrying capacity of resources and the environment, instead of being expanded to its maximum potential [71]. The expansion of urban space will inevitably reduce the available space for PCF grain production. Hence, any redefined PCF must clarify the boundaries between PCF and urban development to prevent the frequent occupation of PCF by future urban expansion. It is to be expected that the Chinese government has resolved to overhaul the PCF (Figure 3). The non-cultivated land and unstable use of arable land from the current PCF should be gradually transferred to the stable use of arable land, while retaining the existing PCF within the urban boundary.
5.3.2. More Flexible PCF at Village Scale
The results of our study showed that the indicator of the PCF area in villages encouraged PCF non-grain production (Figure 8). The study also highlights the significance of the relationship between PCF and general arable land in driving non-grain production. Interestingly, we observed that forest land occupation and aquaculture pond occupation had a notable impact on the type of non-grain production in hilly and plain villages, respectively (Figure 7f). This implies that there is a need to consider the development of forest land and aquaculture ponds in relation to PCF and general arable land. PCF will be allocated in an area that is constant in a village’s arable land while retaining general arable land to meet the other agricultural development needs of the village. In light of the trade-offs between PCF and general arable land, it is essential to adopt more flexible PCF policies at the village scale. Usually, the proportion of PCF and general arable land establishment in villages can be determined by exploring the minimum food requirements and changes in the diet structure of the study area [46]. However, it is difficult to achieve a balance between PCF and general arable land due to conflicts with land allocation [72]. Moreover, there is a large demand for profitable non-grain production in rural areas. Therefore, it is unlikely to be flexible in terms of the amount and location of PCF. However, it is possible to achieve flexibility in terms of rights and interests, and the trading of PCF rights at the county level is a good option.
The trading of PCF rights should be understood as the trading of non-grain rights in arable land, and local governments should take the lead in establishing trading markets [73,74]. Within a county, Village A’s PCF can be traded with Village B’s general arable land. This transaction allows the use of non-grain rights to flow to villages that are the most efficient and have the highest returns or lowest costs of growing non-grain crops, in line with property rights theory [69]. As a result, Village A receives some general arable land to develop non-grain production while Village B receives PCF. The targeting of the total amount of PCF in Village B may also require government intervention, as the government-led redistribution of PCF does as much as possible to achieve social equity under conditions of resource inequity. This approach has the benefit of achieving a constant total PCF within the county while maximizing the economic benefits to the village. It is foreseeable that this approach could alleviate the current large PCF non-grain production.
5.3.3. More Diverse Economic Incentives at the Village Scale
Our study revealed that economic incentives (X2) play a crucial role in promoting PCF non-grain production (Figure 8). The laws of the market indicate that cash crops are generally more profitable than grain crops [75]. Therefore, it is important to address the issue of low returns from grain production in the PCF and make the cultivation of grain crops more profitable. To achieve this, the county government should consider implementing the following diverse economic incentives measures. First, a PCF grain production protection fund will be created, which is financed by government investment and social contributions. The fund is intended to provide incentives for PCF grain production. The amount of grain production subsidy that villages receive is directly linked to the proportion of PCF non-grain area. Second, the performance appraisal mechanism should be introduced for villages, ranking them annually based on their PCF area and other key indicators. These village performance appraisals are also linked to bonus payments. In addition, the trading of PCF rights is an important form of economic incentive. Together with existing agricultural subsidies, it makes grain production profitable in PCF. In this way, a system of economic incentives for PCF grain production will be created at the county level. On the one hand, villages and farmers are motivated to maintain PCF grain production to receive more subsidies and bonus payments. On the other hand, village governments monitor grain production behavior to improve their performance of appraisal and highlight their governance capacity. It is important to note that restraining PCF non-grain production can reduce the risk of farmers violating laws of agriculture or land. Although regulating policies can be challenging at the smallholder economy stage [76,77], it should not be overlooked.
6. Conclusions
This work attempts to break the boundary between PCF and arable land to reveal village-scale PCF non-grain production in rapidly urbanizing areas. It contributes to understanding the relationship between PCF non-grain production and arable land non-grain production, as well as to finding out the key to cracking the PCF non-grain production problem from the village scale. The main findings of the paper are as follows.
- (1)
- The PCF of Liyang consisted of arable land of PCF and adjustable land, with a ratio of nearly 7:3. The current non-crop-growing land and current unrestored crop-growing land accounted for 33.94% and 27.35% of the PCF, respectively. Within the arable land of PCF, forest land occupation and aquaculture pond occupation contributed to more than 25% of the PCF. Within the adjustable land, the proportion of land unsuitable for resumption of crop cultivation is close to 20% of the PCF.
- (2)
- The average PCF non-grain production for scenarios SD, SR, and ST, which showed the process of transitioning from a practical to a theoretical relationship between PCF and arable land, were 62.88%, 48.88%, and 39.23%, respectively. In particular, scenario SR was congruent with arable status. In this scenario, aquaculture pond occupation and forest land occupation played dominant roles in PCF non-grain production in plain and hilly villages, respectively.
- (3)
- The dominant drivers of PCF area, agricultural income per capita, and urbanization rate were able to explain 51.60%, 42.40%, and 35.30% of PCF non-grain production, respectively. PCF area had a positive effect on non-grain production, attributed to the relationship between PCF and general arable land in villages. Agricultural income per capita had a positive effect on non-grain production, attributed to the low comparative returns to grain production. Urbanization rate had a negative impact on non-grain production, attributed to the arable land reserved for development.
Author Contributions
Conceptualization, Y.S. (Yunjie Shi) and H.L.; methodology, Y.S. (Yunjie Shi), H.L., J.G., A.A. and Z.Z.; formal analysis, Y.S. (Yunjie Shi), H.L., J.G. and W.Z.; investigation, Y.S. (Yunjie Shi), H.L., J.G., A.A., J.P. and Y.S. (Yuyang Shao); data curation, Y.S. (Yunjie Shi), A.A., J.P., W.Z. and Y.S. (Yuyang Shao); writing—original draft preparation, Y.S. (Yunjie Shi); writing—review and editing, Y.S. (Yunjie Shi), H.L. and Z.Z.; visualization, Y.S. (Yunjie Shi), A.A., Z.Z. and J.P.; supervision, H.L.; project administration, H.L.; funding acquisition, H.L., J.G. and W.Z. All authors have read and agreed to the published version of the manuscript.
Funding
This research was funded by the Science and Technology Planning Project of Yunnan Provincial Department of Science and Technology, grant number 202202AE090034, and the National Key Research and Development Program of China, grant number 2023YFD1702101. Project of Science and Technology Department of Yunnan Province, grant number 202304BQ040005 and 202305AF150055.
Data Availability Statement
The authors do not have permission to share data.
Acknowledgments
The authors thank Yulong Fang from the Nanjing Institute of Geography and Limnology for their assistance with field sample survey.
Conflicts of Interest
The authors declare no conflicts of interest.
References
- Wu, Y.; Shan, L.; Guo, Z.; Peng, Y. Cultivated land protection policies in China facing 2030: Dynamic balance system versus basic farmland zoning. Habitat Int. 2017, 69, 126–138. [Google Scholar] [CrossRef]
- Wu, S.; Wang, D. Storing grain in the land: The gestation, delineation framework, and case of the two zones policy in China. Land 2023, 12, 806. [Google Scholar] [CrossRef]
- Cheng, Q.; Jiang, P.; Cai, L.; Shan, J.; Zhang, Y.; Wang, L.; Li, M.; Li, F.; Zhu, A.; Chen, D. Delineation of a permanent basic farmland protection area around a city centre: Case study of Changzhou City, China. Land Use Policy 2017, 60, 73–89. [Google Scholar] [CrossRef]
- Bren d’Amour, C.; Reitsma, F.; Baiocchi, G.; Barthel, S.; Güneralp, B.; Erb, K.H.; Haberl, H.; Creutzig, F.; Seto, K.C. Future urban land expansion and implications for global croplands. Proc. Natl. Acad. Sci. USA 2017, 114, 8939–8944. [Google Scholar] [CrossRef]
- Sheng, Y.; Song, L. Agricultural production and food consumption in China: A long-term projection. China Econ. Rev. 2019, 53, 15–29. [Google Scholar] [CrossRef]
- Kong, X. Problems, causes and countermeasures of arable land non-grain. China Land 2020, 11, 17–19. [Google Scholar] [CrossRef]
- Zhu, D. Economic mechanisms and governance paths for arable land non-grain. China Land 2021, 7, 9–11. [Google Scholar] [CrossRef]
- Su, Y.; Li, C.; Wang, K.; Deng, J.; Shahtahmassebi, A.R.; Zhang, L.; Ao, W.; Guan, T.; Pan, Y.; Gan, M. Quantifying the spatiotemporal dynamics and multi-aspect performance of non-grain production during 2000–2015 at a fine scale. Ecol. Indic. 2019, 101, 410–419. [Google Scholar] [CrossRef]
- Zhang, D.; Yang, W.; Kang, D.; Zhang, H. Spatial-temporal characteristics and policy implication for non-grain production of cultivated land in Guanzhong Region. Land Use Policy 2023, 125, 106466. [Google Scholar] [CrossRef]
- Zhu, Z.; Duan, J.; Li, S.; Dai, Z.; Feng, Y. Phenomenon of non-grain production of cultivated land has become increasingly prominent over the last 20 years: Evidence from Guanzhong Plain, China. Agriculture 2022, 12, 1654. [Google Scholar] [CrossRef]
- Zhang, Y.; Feng, Y.; Wang, F.; Chen, Z.; Li, X. Spatiotemporal differentiation and driving mechanism of cultivated land non-grain conversion in Guangdong Province. Resour. Sci. 2022, 44, 480–493. [Google Scholar] [CrossRef]
- Chen, W.; Liao, Y.; Kong, X.; Lei, M.; Wen, L.; Zhang, B. Characteristics, drivers and control of non-grain production on permanent basic farmland based on plot scale. Trans. Chin. Soc. Agric. Mach. 2023, 54, 114–124. [Google Scholar] [CrossRef]
- Wang, J.; Dai, C. Identifying the spatial-temporal pattern of cropland’s non-grain production and its effects on food security in China. Foods 2022, 11, 3494. [Google Scholar] [CrossRef] [PubMed]
- Gu, Z.; Jin, X.; Liang, X.; Liu, J.; Han, B.; Zhou, Y. Diversification of food production in rapidly urbanizing areas of China, evidence from southern Jiangsu. Sustain. Cities Soc. 2024, 101, 105121. [Google Scholar] [CrossRef]
- Chen, S.; Zhang, Y.; Zhu, Y.; Ma, L.; Zhao, J. The battle of crops: Unveiling the shift from grain to non-grain use of farmland in China? Int. J. Agric. Sustain. 2023, 21, 2262752. [Google Scholar] [CrossRef]
- Cheng, X.; Tao, Y.; Huang, C.; Yi, J.; Yi, D.; Wang, F.; Tao, Q.; Xi, H.; Ou, W. Unraveling the causal mechanisms for non-grain production of cultivated land: An analysis framework applied in Liyang, China. Land 2022, 11, 1888. [Google Scholar] [CrossRef]
- Yang, Q.; Zhang, D. The influence of agricultural industrial policy on non-grain production of cultivated land: A case study of the “one village, one product” strategy implemented in Guanzhong Plain of China. Land Use Policy 2021, 108, 105579. [Google Scholar] [CrossRef]
- Ren, G.; Song, G.; Wang, Q.; Sui, H. Impact of “non-Grain” in cultivated land on agricultural development resilience: A case study from the major grain-producing area of Northeast China. Appl. Sci. 2023, 13, 3814. [Google Scholar] [CrossRef]
- Zhou, S.; Zhao, X. Adjustment and optimization of permanent capital farmland based on comprehensive quality of arable land: A case study of Yiling District, Hubei Province. Nongcun Shiyong Jishu 2021, 8, 11–12. Available online: https://kns.cnki.net/kcms2/article/abstract?v=3uoqIhG8C44YLTlOAiTRKibYlV5Vjs7iy_Rpms2pqwbFRRUtoUImHS9kVDVpr6C68Ylj27C7OLz4sM_b_1mUHyg0tHwmLEC5&uniplatform=NZKPT (accessed on 31 March 2022).
- Zhang, Q. Assessment of the current situation of agricultural space arable land and permanent capital farmland protection: A case study of Longling County. Shanxi Agric. Econ. 2022, 3, 160–162. [Google Scholar] [CrossRef]
- Chen, F.; Liu, J.; Chang, Y.; Zhang, Q.; Yu, H.; Zhang, S. Spatial pattern differentiation of non-grain cultivated land and its driving factors in China. China Land Sci. 2021, 35, 33–43. [Google Scholar] [CrossRef]
- Qian, F.; Wang, Q.; Bian, Z.; Dong, X. Discussion about the permanent basic farmland planning and protection. Chin. J. Agric. Resour. Reg. Plan. 2013, 34, 22–27. [Google Scholar] [CrossRef]
- Zhang, Y. Insisting on green development to ensure high-quality development—Survey on the current situation of development land and permanent capital farmland protection in Cangwu County’s new county towns. NanFang ZiRan ZiYuan 2020, 1, 40–44. [Google Scholar] [CrossRef]
- Qiao, L. Reflections on the demarcation of permanent capital farmland based on the prioritization of arable land protection. China Land 2021, 9, 21–24. [Google Scholar] [CrossRef]
- Mao, Y. Survey and identification of arable land in the Third National Land Survey. West. Resour. 2021, 6, 166–168. [Google Scholar] [CrossRef]
- Su, Y.; Qian, K.; Lin, L.; Wang, K.; Guan, T.; Gan, M. Identifying the driving forces of non-grain production expansion in rural China and its implications for policies on cultivated land protection. Land Use Policy 2020, 92, 104435. [Google Scholar] [CrossRef]
- Wu, Y.; Zhang, P.; Yu, Y.; Xie, R. Progress review on and prospects for non-grain cultivated land in China from the perspective of food security. China Land Sci. 2021, 35, 116–124. [Google Scholar] [CrossRef]
- Liu, Y.; Zhou, Y. Reflections on China’s food security and land use policy under rapid urbanization. Land Use Policy 2021, 109, 105699. [Google Scholar] [CrossRef]
- Chen, Y.; Li, M.; Zhang, Z. Does the rural land transfer promote the non-grain production of cultivated land in China? Land 2023, 12, 688. [Google Scholar] [CrossRef]
- Liu, G.; Zhao, L.; Chen, H.; Zhou, Y.; Lin, H.; Wang, C.; Huang, H.; Li, X.; Yuan, Z. Does farmland transfer lead to non-grain production in agriculture?—An empirical analysis based on the differentiation of farmland renting-in objects. Sustainability 2022, 15, 379. [Google Scholar] [CrossRef]
- Yang, A.; Wang, Y. Spatiotemporal variations in farmland rents and its drivers in rural China: Evidence from plot-level transactions. Land 2022, 11, 229. [Google Scholar] [CrossRef]
- Zhu, J.; Li, X. Evaluation and policy enlightenment of permanent basic farmland protection: A case study of XX prefecture-level city in eastern China. Resour. Dev. Mark. 2021, 37, 405–409. [Google Scholar] [CrossRef]
- Qi, Y.; Hou, Y.; Li, Y.; Li, L.; Zhang, J.; Chang, Y.; Zhu, D. The price gap between state-owned and collective farmlands: Evidence from Xinjiang and Heilongjiang, China. Land Use Policy 2023, 124, 106460. [Google Scholar] [CrossRef]
- Meng, F. Whether the land management right of permanent capital farmland can be changed for other purposes after transferring it. China Land 2021, 9, 61. [Google Scholar] [CrossRef]
- Wang, Q.; Xiong, Y. The influence of policy fragmentation on the “non-grainization” of cultivated land and its countermeasures: Y Town, J District, Z City as a case study. J. Hunan Univ. Technol. (Soc. Sci. Ed.) 2022, 27, 17–23. [Google Scholar] [CrossRef]
- Su, M.; Guo, R.; Hong, W. Institutional transition and implementation path for cultivated land protection in highly urbanized regions: A case study of Shenzhen, China. Land Use Policy 2019, 81, 493–501. [Google Scholar] [CrossRef]
- Kong, X.; Dang, Y. Internal logic and reflection on the evolution of the permanent capital farmland system. China Land 2022, 5, 12–15. [Google Scholar] [CrossRef]
- Liao, L.; Long, H.; Gao, X.; Ma, E. Effects of land use transitions and rural aging on agricultural production in China’s farming area: A perspective from changing labor employing quantity in the planting industry. Land Use Policy 2019, 88, 104152. [Google Scholar] [CrossRef]
- Yu, H.; Liu, K.; Bai, Y.; Luo, Y.; Wang, T.; Zhong, J.; Liu, S.; Bai, Z. The agricultural planting structure adjustment based on water footprint and multi-objective optimisation models in China. J. Clean. Prod. 2021, 297, 126646. [Google Scholar] [CrossRef]
- He, X.; Zhong, J.; Lin, S.; Dai, R.; He, Z.; Shi, Q. Characteristics and driving mechanism of spatial differentiation of “Non-grain” cultivated land in karst trough valley area: Taking Wanshan District, Tongren, Guizhou as an example. Sci. Geogr. Sin. 2022, 42, 2207–2217. [Google Scholar] [CrossRef]
- Zhu, Z.; Dai, Z.; Li, S.; Feng, Y. Spatiotemporal evolution of non-grain production of cultivated land and its underlying factors in China. Int. J. Environ. Res. Public Health 2022, 19, 8210. [Google Scholar] [CrossRef] [PubMed]
- Chen, S.; Yu, S. Analysis on land use change and its driving force in the Yangtze River Delta region during 1985-2015. Forestry Econ. 2019, 41, 49–54. [Google Scholar] [CrossRef]
- Sun, Y.; Chang, Y.; Liu, J.; Ge, X.; Liu, G.J.; Chen, F. Spatial differentiation of non-grain production on cultivated land and its driving factors in coastal China. Sustainability 2021, 13, 13064. [Google Scholar] [CrossRef]
- Cheng, L.; Jiang, P.; Chen, W.; Li, M.; Wang, L.; Gong, Y.; Pian, Y.; Xia, N.; Duan, Y.; Huang, Q. Farmland protection policies and rapid urbanization in China: A case study for Changzhou City. Land Use Policy 2015, 48, 552–566. [Google Scholar] [CrossRef]
- Li, Y.; Zhao, B.; Huang, A.; Xiong, B.; Song, C. Characteristics and driving forces of non-grain production of cultivated land from the perspective of food security. Sustainability 2021, 13, 14047. [Google Scholar] [CrossRef]
- Shi, Y.; Li, H.; Akida, A.; Geng, J.; Zhang, W.; Pang, J. Unraveling safe boundaries for net anthropogenic nitrogen inputs: A case study focusing on village scale. J. Clean. Prod. 2024, 434, 140462. [Google Scholar] [CrossRef]
- Lichtenberg, E.; Ding, C. Assessing farmland protection policy in China. Land Use Policy 2008, 25, 59–68. [Google Scholar] [CrossRef]
- Liu, X.; Zhao, C.; Song, W. Review of the evolution of cultivated land protection policies in the period following China’s reform and liberalization. Land Use Policy 2017, 67, 660–669. [Google Scholar] [CrossRef]
- Chen, W.; Zhang, Q.; Kong, X.; Duan, X.; Zuo, X.; Tan, M.; Zhao, J.; Dong, T. Optimizing rules and empirical research of provincial permanent basic farmland layout based on the “Three-line” coordination. Trans. Chin. Soc. Agric. Eng. 2021, 37, 248–257. [Google Scholar] [CrossRef]
- Chang, Y.; Liu, J.; Zhang, Q.; Yu, H.; Bian, Z.; Chen, F. Spatial pattern differentiation of cultivated land non-grain conversion in major grain-producing areas. J. Agric. Resour. Environ. 2022, 39, 817–826. [Google Scholar] [CrossRef]
- Liang, X.; Jin, X.; Liu, J.; Yin, Y.; Gu, Z.; Zhang, J.; Zhou, Y. Formation mechanism and sustainable productivity impacts of non-grain croplands: Evidence from Sichuan Province, China. Land Degrad. Dev. 2023, 34, 1120–1132. [Google Scholar] [CrossRef]
- Zhao, X.; Zheng, Y.; Huang, X.; Kwan, M.P.; Zhao, Y. The effect of urbanization and farmland transfer on the spatial patterns of non-grain farmland in China. Sustainability 2017, 9, 1438. [Google Scholar] [CrossRef]
- Meng, F.; Tan, Y.; Chen, H.; Xiong, W. Spatial-temporal evolution patterns and influencing factors of “non-grain” utilization of cultivated land in China. China Land Sci. 2022, 36, 97–106. [Google Scholar] [CrossRef]
- Wu, Y.; Yuan, C.; Liu, Z.; Wu, H.; Wei, X. Decoupling relationship between the non-grain production and intensification of cultivated land in China based on Tapio decoupling model. J. Clean. Prod. 2023, 424, 138800. [Google Scholar] [CrossRef]
- Wang, J.; Xu, C. Geodetector: Principles and prospects. Acta Geogr. Sin. 2017, 72, 116–134. [Google Scholar] [CrossRef]
- Chen, Y.; Wang, G.; Wang, L. Change mechanism of China’s grain production from the perspective of peasant household’s decision behavior. Econ. Geogr. 2016, 36, 139–145. [Google Scholar] [CrossRef]
- Du, Z.; Hang, L. The impact of production-side changes in grain supply on China’s food security. Chin. Rural. Econ. 2020, 4, 2–14. Available online: http://crecrs-zgncjj.ajcass.org/Magazine/Show/71809 (accessed on 31 March 2022).
- Gerbens-Leenes, P.W.; Nonhebel, S.; Krol, M.S. Food consumption patterns and economic growth. Increasing affluence and the use of natural resources. Appetite 2010, 55, 597–608. [Google Scholar] [CrossRef] [PubMed]
- Yang, W.; Luan, Y.; Yang, C.; Cui, X. Changes in the land requirements for food from 1961 to 2007 in China. Resour. Sci. 2013, 35, 901–909. [Google Scholar]
- Zhao, M.; Shi, H.; Li, X.; Alfonso, M.; Yao, Y.; Wang, J.; Bi, Y. Multi-scale regional analysis for differences on residents’ food consumption and policy implications: An empirical study on family recipes in Yantai, Lanzhou, Xinxiang and Jiujiang. J. Nat. Resour. 2022, 37, 2636–2650. [Google Scholar] [CrossRef]
- Fukase, E.; Martin, W. Economic growth, convergence, and world food demand and supply. World Dev. 2020, 132, 104954. [Google Scholar] [CrossRef]
- Song, X.; Wang, X.; Li, X.; Zhang, W.; Scheffran, J. Policy-oriented versus market-induced: Factors influencing crop diversity across China. Ecol. Econ. 2021, 190, 107184. [Google Scholar] [CrossRef]
- Liu, C.; Huo, Y.; Xu, Y.; Huang, A.; Sun, P.; Lu, L. Changes in cultivated land and influencing factors before and after the implementation of grain for green project in Zhangjiakou City. J. Nat. Resour. 2018, 33, 1806–1820. [Google Scholar] [CrossRef]
- Zong, R.; Zeng, Y.; Fang, N.; Shi, Z. Spatially optimized cropland distribution promotes sustainable farming and vegetation restoration in mountainous regions. Land Degrad. Dev. 2022, 33, 3954–3964. [Google Scholar] [CrossRef]
- Wang, L.; Wang, S.; Zhou, Y.; Zhu, J.; Zhang, J.; Hou, Y.; Liu, W. Landscape pattern variation, protection measures, and land use/land cover changes in drinking water source protection areas: A case study in Danjiangkou Reservoir, China. Glob. Ecol. Conserv. 2020, 21, e00827. [Google Scholar] [CrossRef]
- Pueppke, S.G.; Zhang, W.; Li, H.; Chen, D.; Ou, W. An integrative framework to control nutrient loss: Insights from two hilly basins in China’s Yangtze River Delta. Water 2019, 11, 2036. [Google Scholar] [CrossRef]
- Wen, L.; Lin, Z. Legislative perfection of permanent basic farmland protection in China under the background of rural revitalization. J. Xi’an Univ. Financ. Econ. 2021, 34, 100–110. [Google Scholar] [CrossRef]
- Yi, F.; Sun, D.; Zhou, Y. Grain subsidy, liquidity constraints and food security—Impact of the grain subsidy program on the grain-sown areas in China. Food Policy 2015, 50, 114–124. [Google Scholar] [CrossRef]
- Xue, X.; Zhang, Y. Current situation, causes and countermeasures regarding non-grain growing of farmland in major grain-producing counties. Acad. J. Zhongzhou 2017, 8, 40–45. [Google Scholar] [CrossRef]
- Xu, X.; Peng, H.; Xu, Q.; Xiao, H.; Benoit, G. Land changes and conflicts coordination in coastal urbanization: A case study of the Shandong Peninsula in China. Coast. Manag. 2009, 37, 54–69. [Google Scholar] [CrossRef]
- Behnisch, M.; Krüger, T.; Jaeger, J.A. Rapid rise in urban sprawl: Global hotspots and trends since 1990. PLoS Sustain. Transform. 2022, 1, e0000034. [Google Scholar] [CrossRef]
- Yang, L.; Fang, C.; Chen, W.; Zeng, J. Urban-rural land structural conflicts in China: A land use transition perspective. Habitat Int. 2023, 138, 102877. [Google Scholar] [CrossRef]
- Zheng, H.; Liu, Y.; Zhao, J. Understanding water rights and water trading systems in China: A systematic framework. Water Secur. 2021, 13, 100094. [Google Scholar] [CrossRef]
- Nie, X.; Yang, M.; Chen, Z.; Li, W.; Zang, R.; Wang, H. Should government play a strict or lenient role? An evolutionary game analysis of implementing the forest ecological bank policy. Forests 2023, 14, 1002. [Google Scholar] [CrossRef]
- Li, M.; Gan, C.; Ma, W.L.; Jiang, W. Impact of cash crop cultivation on household income and migration decisions: Evidence from low-income regions in China. J. Integr. Agric. 2020, 19, 2571–2581. [Google Scholar] [CrossRef]
- Huang, Z. Is “family farms” the way to develop Chinese agriculture? Open Times 2014, 2, 176–194+9. [Google Scholar]
- Wilmsen, B.; Rogers, S.; van Hulten, A.; Yuefang, D. In the shadow of state-led agrarian reforms: Smallholder pervasiveness in rural China. Agric. Hum. Values 2024, 41, 75–90. [Google Scholar] [CrossRef]

Disclaimer/Publisher’s Note: The statements, opinions and data contained in all publications are solely those of the individual author(s) and contributor(s) and not of MDPI and/or the editor(s). MDPI and/or the editor(s) disclaim responsibility for any injury to people or property resulting from any ideas, methods, instructions or products referred to in the content. |
© 2024 by the authors. Licensee MDPI, Basel, Switzerland. This article is an open access article distributed under the terms and conditions of the Creative Commons Attribution (CC BY) license (https://creativecommons.org/licenses/by/4.0/).