Article

The Average Direct, Indirect and Total Effects of Environmental Concern on Pro-Environmental Behavior

by
Anastasia Hernández-Alemán
1,
Noelia Cruz-Pérez
2 and
Juan C. Santamarta
2,*
1
Institute of Tourism and Sustainable Economic Development (TiDeS), University of Las Palmas de Gran Canaria, 35001 Las Palmas, Gran Canaria, Spain
2
Departamento de Ingeniería Agraria y del Medio Natural, Universidad de La Laguna (ULL), 38200 La Laguna, Tenerife, Spain
*
Author to whom correspondence should be addressed.
Land 2024, 13(8), 1229; https://doi.org/10.3390/land13081229
Submission received: 9 July 2024 / Revised: 1 August 2024 / Accepted: 3 August 2024 / Published: 7 August 2024

Abstract

:
This research is framed in behavioral economics. This area tests the orthodox assumptions that individuals are rational, self-interested and possess all freely available information, and. Behavioral economics plays an important role for policymakers in areas such as environmental protection. We observe that despite being very concerned about environmental problems, the reality is that a great heterogeneity of behaviors is observed. Faced with the same level of concern, some citizens act coherently by adopting pro-environmental behaviors, while others do not. This latter response is supposed to generate cognitive dissonance. Accordingly, we expect that the levels of pro-environmental behavior should be more in line with observed levels of concern. Understanding pro-environmental behavior (PEB) is still a challenge. Insight into causal mechanisms of environmental concern on PEB could shed light on the effectiveness of environmental strategies such as land management, recycling, environmental taxes, water quality, human health, and prevention of further biodiversity loss. We employ a structural equation model to identify mechanisms through which environmental concern affects PEB. We prove that causal mechanisms between environmental concern dimensions, i.e., environmental concern in a broad sense, such as affection, cognitive, conative and active-are not independent. Additionally, we demonstrate that the average indirect effect (ACME), the average direct effect (ADE) and the average total effect (TE) of environmental concern on pro-environmental behavior depend on the baseline status of environmental concern in a narrow sense, i.e., worry or affection for environmental protection. The magnitude of the effects is also moderated by situational factors such as income, age, education, household size, and municipality size. This psychological construct (environmental concern) allows us to better understand the observed heterogeneity related to PEB which affects the economic efficiency of political measures.

1. Introduction

Environmental policy measures should be supported by environmental concern in order to capitalize on citizens’ favorable intentions and reach the highest cost-effectiveness from the policy measures [1,2,3,4,5,6,7,8,9]. Motivating individuals to behave in an environmentally responsible way constitutes a challenge [6]. Tapia-Fonllem et al. [10] discuss a wide group of variables that embody the concept of sustainable behaviors, considering pro-environmental behavior (PEB), a term used to emphasize efforts to protect the natural environment. Taking into account the data used in this study, we cannot guarantee that the pro-environmental behavior declared by the respondents has intentionality, is deliberate, or presents a clear direction to the solution of a social problem. Nor can we know if this behavior is, in part, a response to the needs of future generations. For all these reasons, we must specify that this work investigates pro-environmental behavior in a strict sense, through those acts and intentions that, consciously or unconsciously, help protect the environment. In our work, intentionality is reflected in the degree of acceptability, with respect to certain environmental policy measures that have financial or restrictive consequences, such as paying an environmental tax or restricting the use of private cars. Our data reveal acts of pro-environmental behavior, such as cycling or recycling, but we cannot know the satisfaction these acts provide to the respondent, the personal belief regarding the effectiveness of their contribution to the solution of an environmental problem, or that there is an altruistic motivation. Some of these acts may be done for personal benefit; for example, cycling because it is cheaper than private transport, one gets physical exercise, the journey is short, and there is appropriate infrastructure. Yet analyzing causal connection between acts that are environmentally friendly (PEB) and other dimensions of environmental concern (worry for the environment, acceptance of certain environmental policy measures, and degree of knowledge of environmental problems), we can identify the confounders, mediators, and which factors act as moderators to enhance pro-environmental behavior.
The main goal of this paper is to test how the causal mechanisms that trigger different dimensions of environmental concern cause pro-environmental behavior (PEB). Our second main goal is to measure the effects. The hypothesis that is tested with this analysis is whether the different dimensions of environmental concern act independently or not. If they are not independent, what are the causal mechanisms that are triggered in relation to pro-environmental behavior (active dimension). In this vein, we stress the important role that environmental concern plays in the efficiency of environmental policies. In a broad sense, environmental concern is affective dimension or worry for the environmental problems, attitudes and intentions (conative dimension), knowledge (cognitive dimension) and active dimension. Human behavior is conditioned by environmental concern, which links to lower water consumption, waste reduction, use of public transportation, and a wide range of pro-environmental behaviors targeted by public policies1. When worry for the environment is combined with knowledge and the willingness to accept public policy measures, pro-environmental behavior is enhanced. It should be explored the nudges toward promoting environmental concern through all its dimensions: affection (worry), active, cognitive (knowledge) and conative (attitudes and intentions). In our research, these last two elements (cognitive and conative) act as confounder and mediator, respectively, between affection for the environment and active behaviors to protect it. Knowledge of environmental problems causes an effect on environmental concern and pro-environmental behavior (confounder). Attitudes and intentions (conative dimension) are affected by environmental concern and cause an effect on pro-environmental behavior (mediator).
European reconstruction after the pandemic is based on the principles of a greener, more digital and more resilient next generation, which is reflected in different European legal texts. Specifically, the main aim of the European Green Deal is to improve the well-being and health of citizens and future generations. It is unlikely to reach its objectives without citizen involvement. Environmental attitude, which is defined as a psychological tendency [11], is affected by environmental concern in different ways. These include: the value attributed to the environment and its protection, personal beliefs, values, feelings of concern, worry, understanding of environmental problems, information and knowledge, social identity, and the willingness to act ecologically and to accept certain political interventions. Environmental concern is defined as the degree to which people are aware of environmental problems and support efforts to solve them or express a willingness to contribute personally to their solution [4]. That tendency or attitude plays a major role in explaining environmental behavior. Social psychology has played a very important role from a theoretical point of view. These theories have become the basis for understanding human behavior. However, even today there is a need to delve deeper into the causal mechanisms of psychological factors and human behavior in environmental protection [12,13]. There is a wide range of literature related to the theories of environmentally significant behavior, but the causal mechanisms that explain pro-environmental behavior are not so clear [6,13,14,15,16]. Ref. [17] reviews the evolution of the different theories, and the assumptions upon which they are based, from primitive models such as the behavioral change model, the environmentally responsible behavior model, and the reasoned/responsible action theory, to more recent models such as planned behavior theory, the environmental citizenship model, the model of human interaction with the environment, the value-belief-norm theory of environmentalism, health belief theory and the diffusion of innovation model.
At the empirical level, the literature focuses on analysis of public interventions that affect some of the dimensions of environmental concern [2,7,8,18,19,20,21,22,23,24,25]. Related to the active dimension, pro-environmental behavior includes recycling, public transport use, waste management, energy consumption, the purchase of green products and the use of electric appliances [18]. Ref. [2] focuses on the conative dimension of environmental concern, using a multilevel model to verify that the perception of group membership produces a double effect on the individual’s pro-environmental behavior (“uplift effect”, “amplification effect”). Ref. [8] prove that intrinsic, instrumental, and relational urban green space (UGS) values contribute directly or indirectly to the formation of personal norms for the conservation of UGS through environmental beliefs as mediators, with the most significant effect being relational value orientations. This result underpins pro-environmental behavior on the basis of moral obligation. Ref. [20] prove that not only the cognitive dimension but also the affective one, measured as level of worry, are associated with the willingness to pay for food free of residues derived from genetic modification in foods. They find a strong association between cognitive and affective processes, and sustainable behavior. Ref. [23] review the determinants of pro-environmental behavior to analyze land management policy. They hypothesize that pro-environmental behavior can be understood, predicted and altered based on certain factors. Ref. [25] emphasize the role of socio-psychological variables such as personality and peer pressure as signal transmitters of perceived risk and vulnerability. Other studies focus more on the cognitive aspect of environmental behavior than on attitudes [1,9,26]. In the literature, we find mixed empirical evidence based on different theoretical models. Ref. [27] argue that it is a challenge for environmental science to identify what motivates individuals to behave in sustainable ways. The studies identified above do not prove that causal mechanisms between the dimension of environmental concern in a broad sense (affection, cognitive, conative and active) are not independent; that is the hypothesis on which this work is based. For this purpose, we employ mediation analysis, which has been frequently used in the social sciences and psychology, to identify causal mechanisms underlying human behavior [28,29,30,31]. We are interested in which psychological constructs act as mediator, confounder and moderator in the path from environmental concern to pro-environmental behavior, and secondly, the assessment of this relationship. More specifically, our research discusses the average direct and indirect effects of environmental concern in a narrow sense (worry or affection for the environment) on pro-environmental behavior (PEB), hypothesizing about conative and, cognitive dimensions, and situational factors, as the mediator, confounder, and moderators, respectively.
In our empirical analysis, and under the assumption that citizens of a society are exposed to the same environmental situation, not all members develop equal levels of environmental concern and pro-environmental behavior. The data used in this study are self-reports of pro-environmental and intention items that have been proven to be useful in some domains. It has some limitations [32]. It is true that our memory is selective, and it is possible we may not precisely assess the frequency with which we recycle, but this characteristic of the memory is also part of the heterogeneity in our behavior. What we consider objective noise level is not always perceived in the same way. In our analysis it is interesting to consider all possible sources of heterogeneity. In addition, these data consider the situational context, opposite to laboratory experiments [2]. These data allow us to analyze the heterogeneity in environmental behavior in a representative sample of a society that is exposed to the same environmental problems. Frequently, and from different surveys, Spanish society shows a high level of environmental concern in terms of worry for environmental problems. In the study of the Sociological Research Centre in April of 2022, 89.1% of the sample (2357) recognize that they are witnessing climate change. Results show that 50.1% are very concerned about climate change; 41% are quite concerned; 0.4% are fairly concerned; 7% are not very concerned; and 1.1% are not concerned at all, out of a total of 2100 who answered they are witnessing climate change. A high degree of concern (very concerned and quite concerned) regarding the environmental situation in our country was declared by 91% of those surveyed. The issue is that, despite this high degree of concern for the environment, pro-environmental behavior is rather more heterogeneous. More interesting is to explain whether, and how much, this environmental concern causally affects pro-environmental behavior. In our dataset2, we observe that 77.42% of the sample (26,689) admits a maximum level of concern about the environment. It is also shown that the higher the level of concern, the higher the mean of environmental behavior (Table 1). Despite this positive association between environmental concern and pro-environmental behavior, it is proved that not all individuals who acknowledge the highest level of concern about environmental problems have an equal level of pro-environmental behavior. Our analysis examines the causal mechanisms between environmental concern dimensions and PEB. We prove that these causal mechanisms are not independent. In addition, we show that cognitive and conative dimensions mediate between environmental concern and PEB. This result partly explains the observed heterogeneity about pro-environmental behavior. Our second main empirical result is that the average direct and indirect effects of environmental concern on PEB are conditioned by the baseline status of environmental concern in a narrow sense (worry or affection for environmental problems). These effects are moderated by situational factors (income, age, education, household size and municipality size). Results have policy implications, in particular, related to the design of environmental strategies, and their effectiveness. Nudges intended to increase the level of different dimensions of environmental concern are needed to improve pro-environmental behavior.

2. Method

The aim of this paper is to give insight into causal mechanisms between dimensions of environmental concern (affective, conative, cognitive, and active). In the previous section, we showed positive associations. Then, we proved causal effects and hypothesized that these causal mechanisms are not independent. In addition, we are interested in the assessment of the effects. To do so, we used mediation analysis. We considered that environmental concern is a wide and complex psychological construct which involves beliefs, values, moral and social norms, and individual and social perceptions that are affected by knowledge and other situational or external factors.

2.1. Background

Okumah et al. [23] provide an overview of the five main behavior theories depicting various paths to understanding pro-environmental behavior (e.g., knowledge-awareness link, awareness-behavior link, knowledge-behavior link). We focused on the methodology to analyze dimensions that determine pro-environmental behavior, based on these theories. In Figure 1 and Figure 2, we present a theoretical framework following the suggestion of [31]. Causal mediation analysis is most used in epidemiology [33,34,35,36], but it is also used in a variety of scientific disciplines including psychology, political and social science [28,37,38]. The main goal of these disciplines is to identify causal mechanisms underlying human behavior and opinion formation [39]. They use cognition and emotion that mediate causal effects to explain the individual’s responses to a certain stimulus. We employed the experimental designs as a template for our observational data. As [40] points out, the goal of causal mediation is not only to identify the causal effects, but also to quantify them. Therefore, the contribution of this work is twice as significant, not only because it explores the causal mechanisms, but also because it covers a gap in the literature regarding the use of observational data as approximation for experimental designs. Three advantages are observed in the literature related to observational data [31,41]. First, the randomization of treatment is unnecessary because, under the appropriate assumptions, all necessary potential outcomes are observed for each unit. Our data are analyzed as if treatment had been randomly assigned, conditional upon measured pre-treatment variables (covariates). Therefore, it can be viewed as a conditionally randomized experiment. We can consider that counterfactual outcomes are deterministic due to a very large sample size. We assume that if the individual declares maximum environmental concern, the probability of high pro-environmental behavior is close to one, while for the counterfactual, the probability is close to zero. Second, the challenger is held constant either across time or space. Third, the external validity is not compromised. Unlike randomized experiments, observational data do not involve ethical concerns, excessive expense, or timeliness [36,40,41,42].

Designing Observational Study as Experimental

We can conceptualize an observational study as a conditionally randomized experiment if the following conditions hold [36]: (1) the values of treatment under comparison correspond to well-defined interventions that, in turn, correspond to the versions of treatment in the data. Here, this first condition implies assuming there is no interaction between individuals, so that the degree of concern of the reference person is not depending on other individuals’ treatment values. It also implies that there is only one version of the “degree of worry” about environmental problems. This condition is referred to as consistency3; (2) the conditional probability of receiving each value of treatment, though not decided by the investigators, depends only on measured covariates. This condition is referred to as exchangeability.
In support of our analysis, this survey was administrative, and there was a legal obligation to collaborate. The survey considered two basic units of observation: the main family dwelling and people aged 16 and over. Census sections were selected within each stratum with probability proportional to size4. Dwellings in each section were chosen by equal probability, by means of systematic sampling with random start. This procedure leads to self-weighted samples of dwellings in each stratum. A random procedure that assigns equal probability to all survivable family members is employed in order to choose the person selected for interview in each dwelling. The survey was stratified by age, gender, marital status, nationality, household type, income, employment status, education, municipality size, and region. The survey involved high statistical power for our specific study + 0.03   e r r o r . There were only 3% of non-responses related to the blocks of questions that referred to the dimensions of environmental concern.

2.2. Data Section

A cross-sectional microdata panel published by the Spanish National Statistics Institute was used (Households and Environment Survey, 2008)(See note 4 above). The survey aimed to research the habits, consumption patterns and attitudes of households and how they refer to the environment. It was composed of 26,689 households interviewed in person from a theoretical sample of 27,678 dwellings; 540 variables distributed in nine blocks, each one relating to an environmental area such as water, energy, waste, noise, bad smells, transportation and mobility, lifestyles, and consumption patterns, as well as socioeconomic characteristics. What it did not include that we would have wished for are psychological traits from the household’s selected person. From blocks eight and nine, we observed that those who acknowledged they were very concerned about environmental problems encompassed 77.42% of respondents (Table A1 of the Appendix A). Notwithstanding this high percentage, we found differences in behavior in relation to the environment, both in terms of climate change mitigation actions and preventive behavior. This heterogeneity was shown through most relevant items selection that compose the active dimension (PEB). So, in contrast to the homogeneity in terms of environmental concern (worry), a great heterogeneity was observed relating to environmental behavior. To check this heterogeneity, first, multiple correspondence analysis was employed; second, cluster analysis was applied [42,43]. The results imply four clusters of households. The four groups can be also distinguished by slight differences in socio-economic realities. In relation to the level of worry, clusters 1 and 3 show a higher frequency of the highest level than the other two clusters. Regarding motivation for non-participation in collective environmental activities, disinterest and indifference as the first motive occupies a higher percentage in clusters 2 and 4 than in clusters 1 and 3. These last clusters have bigger percentages in the highest level of income and education (university studies) (Table A2 of the Appendix A).
Most important for mediation analysis is the imbalance of the sample size to the level of environmental concern (worry), with 19,024 responses indicating the highest level of environmental concern (3 = much worry), compared to 1163 respondents indicating the lowest level (1 = nothing), and 4384 respondents choosing the middle level (2 = little). This imbalance could affect the conditional probability of the outcome (PEB) on treatment (concern, worry, or affective dimension). Consequently, we used a random subsample of equal size (1100 observations) per level of environmental concern. We tested six random different subsamples of equal size from the total sample (26,689), and the results are quite robust, with the statistics shown in Table 1. Thus, the mean level of pro-environmental behavior for the lowest level of environmental concern (nothing) is 15.74 (std. dev. = 6.03); for the intermediate level (little), the mean of PEB is 17.70 (std. dev. = 5.49); and for the highest level of environmental awareness (much), the mean of PEB is 20.06 (std. dev. = 4.89). Table A3 of the Appendix A summarizes the statistics of the variables involved in the mediation analysis, related to the subsample. For the mediation analysis, we focused on associations between different dimensions of environmental concern: affection or worry (Treatment), conative (Mediator), cognitive (C0 = environmental knowledge= confounder) and active (Y = PEB = outcome). These associations are the basis for the design of the causal diagrams (DAGs) in the following section, considering theoretical implications, both methodological and empirical. Positive associations and dependence relationships are observed between pro-environmental behavior and the rest of the environmental concern dimensions (Table 1 and Table 2). The χ2 Pearson’s test verifies the dependency between affective and active dimensions (Table 1). Then, it is known that the level of worry for environmental problems or affective dimension (T) and PEB (Y) are dependent or associated, which implies that:
P r [ Y = P E B i T = 1 ]     P r [ Y = P E B i T = 2 ]     P r [ Y = P E B i T = 3 ]          
The same positive associations and dependence relationships were observed between the cognitive, conative, affective, and active dimensions (Table 2). The cognitive dimension has a positive dependency relationship among the affective dimension (worry), conative dimension (attitude and intention) and pro-environmental behavior (PEB, active dimension).
Therefore, there is evidence that the effect of environmental concern on pro-environmental behavior could be affected or mediated by these associations which, however, at first, do not imply causality. Therefore, we estimated a generalized structural equation model (GSEM) to check causality relationships [43,44]. As we can see from the results in Table A4 of the Appendix A, most variables are significant, with a positive effect on PEB. The higher the income, the higher the PEB. Education is also highly significant. The lower the level of education (3 = illiterate and primary), the lower the PEB. Age, household size and municipality size are not significant. Signs of all the coefficients are as expected. The environmental concern (affective dimension) shows the greatest positive and significant coefficient to explain PEB (1.11). We do not know how this causal mechanism operates, and if causal mechanisms are independent, what is the gap in the literature reviewing behavioral theories to aid understanding of pro-environmental behavior.
To identify a variable as a mediator, which is the conative dimension in our case, two conditions must be satisfied. First, the variable (conative dimension) is significantly correlated with the predictor (affective dimension). This is proved using Pearson’s chi-square test and Pearson’s pairwise correlation coefficients at the 5% level of significance (Table 2). Second, the variable is significantly related to the outcome (PEB), proved using the same statistical test. If only the second condition is satisfied, the variable is included as a covariate or moderator such as age, income, education, household size and municipality size, but not as mediator. From the point of view of the Attitude-Behavior-Context Theory, we consider these last factors as situational or external factors.

2.3. Technical Point and Description of the Method

In this section we explain the empirical design in correspondence with the theoretical framework of the behavioral theories, in order to understand pro-environmental behavior [16,22]. We assume that an individual is exposed to a certain level of environmental concern through social norms, values and beliefs, perceptions, and situational factors. In our data, this level of exposure leads to one of the following three grades of concern (worry) about the environmental situation: 1 = nothing; 2 = a little; 3 = much, which represents the treatment or exposure variable (T) in our causal mediation analysis. The mediator lies in the causal path between treatment (worry) and outcome (PEB). The mediator must satisfy the two conditions mentioned in the previous section: (1) it is significantly correlated with the predictor (T); (2) it is significantly related to the outcome (Y) [39]. The mediator (M) is the conative dimension which represents the intention or willingness to accept (attitude and intentions) environmental policy measures. The mediator is a continuous variable composed of the sum of scores from a set of items related to specific environmental policy measures–the separation of household waste, regulation of water consumption, renewable energy, noise, environmental taxes, and private transport (Table A1 from Appendix A). The outcome (Y) that is the active dimension, is represented by pro-environmental behavior (PEB). It is a continuous variable composed of the sum of the following scores: 1 = never; 2 = sometimes; 3 = with some frequency, and 4 = whenever possible, for each item related to recycled paper, returnable packaging, rechargeable batteries, energy consumption, ecolabel products, and local products (Table A1 from Appendix A). The cognitive dimension (Co) (knowledge) is a confounder in our empirical design, because under the theoretical framework it causes the treatment (T, environmental concern), the mediator (M, conative dimension or attitude) and the outcome (Y). The cognitive dimension that is the confounder is a continuous variable composed of the sum of scores for each item referring to environmental campaign and environmental problem detection (Table A1 from Appendix A). Theoretically moderators cause outcome (Y), but do not cause treatment, and mediator [36]. Covariates (C) such as income, age, household size, municipality size, and level of education are the moderators in our empirical design (situational factors) (Table A2 from Appendix A). Definitions and frequencies of all the variables are shown in Table A1 and A2 of Appendix A. The relationship among these variables (T, M, Co, C, Y) is depicted in Figure 1 and Figure 2 under two scenarios.
Figure 1 represents the basic causal diagram. In this scenario, the treatment variable (T) causes the outcome (Y) in two ways: through the main mediator of interest (M), and directly. What constitutes a mediator is determined by the theoretical framework, bearing in mind that the mediator is, by definition, causally affected by the treatment and influences the outcome. From a psychological point of view, we first feel worried about environmental problems, and then the attitude and intention to act to solve them is triggered [2,3,4,6,11,14,16,20]. Attitudes and intentions act as mediators between the psychological constructs (environmental concern and pro-environmental behavior). Environmental concern (T) is an emotion, and the willingness to accept environmental policy measures is the conative dimension (M), representing the attitudes and intentions [18]. Figure 2 represents a more complex scenario in which the treatment variable (T) causes the outcome (Y) in three ways: through the main mediator of interest (M, attitudes and intentions or conative dimension), through the confounder variable (environmental knowledge, Co), and directly. The interest of the analysis refers not only to the causal effects but also to the mechanisms through which variables of interest cause the outcome [45,46,47,48,49].
Let Y i ( t , m ) denote the potential outcome that would have been observed had T been set to level t and M to m for individual i. Let M i ( t ) denote the potential value of the mediator for individual i under the treatment status T i = t . The consistency assumption is that when T = t, the counterfactual outcomes Y i ( t ) and M i ( t ) are equal to the observed outcomes Y and M respectively, and that when T = t and M = m, the counterfactual Ytm is equal to Y. The composition assumption is that   Y t = Y t M t   , i.e., we observe only one of the potential outcomes, and the observed outcome,   Y t , equals Y t M t   . Therefore, and because we are interested in the causal mediation effects rather than the controlled direct effect [35,49,50], the causal mediation effect and the total causal effect have the following relationship for individual i under the treatment status t (see Equation (1)) [34,37,39,51]:
τ i = δ i ( t ) + γ i ( 1 t )    
τ i is called the total causal effect of the treatment on the outcome; δ i ( t ) is the causal mediation effect, [ δ i ( t )   Y i ( t 1 ,   M i ( t 1 ) ) Y i ( t 0 ,   M i ( t 0 ) ) ] where t 1   t 0   . It is the difference between the potential outcome that would result under treatment status t [1,2,3] and the potential outcome that would occur if the treatment status is the same but the mediator takes a value that would result under the other treatment status, represented in Equation (2); γ i ( t ) represents the natural direct effect [51] and the pure/total direct effect [33]. It represents the causal effect of the treatment on the outcome when the mediator is set to the potential value that would occur under the treatment status t, represented in Equation (3). In our experimental manipulations, we first estimated a 2 × 2 factorial design in which each subject was exposed in a comparison of one condition relative to the other two conditions, as if the treatment variable were a binary variable. Second, we compared two values of the treatment variable to test that the average causal mediation effect (ACME), δ _ ( t ; t 0 ; t 1 ) , depends on the baseline treatment status t, and to prove how the total effect, τ i , is mediated by the cognitive dimension as a confounder variable (Co). The average causal mediation effect (ACME) that represents the indirect effects of the treatment on the outcome through the mediator, is as indicated in Equation (2):
δ _ ( t ; t 0 ; t 1 ) E ( δ i ( t ; t 0 ; t 1 ) )   E   { Y i ( t , M i ( t 1 )   ) Y i ( t ,   M i ( t 0 ) ) } δ i M ( t )  
δ i M ( t ) represents the effect of worry about environmental problems (T) on pro-environmental behavior (Y) that is mediated by tolerance to environmental policy measures (M). The average direct effect (ADE) of the treatment (T) on the outcome (Y), holding the mediator constant ( M _ ) , is defined as follows in Equation (3):
γ _ ( t ; t 0 ; t 1 ) E ( γ i ( t ; t 0 ; t 1 ) )   E   { Y i ( t 1 ,   M i ( t ) ) Y i ( t 0 ,   M i ( t ) ) }
Both effects add up to the average total causal effect, which represents the sum of the mediation effect under one treatment condition and the average direct effect under the other treatment condition, as represented by Equation (4):
τ   _ ( t ; t 0 ; t 1 ) = δ i _ ( t ) + γ i _   ( 1 t )            
These two components cannot be empirically separated without satisfying the strong assumption of the ignorability of the treatment that is sufficient for identifying the ACME, e. g., if the treatment is randomized, possibly conditional on pre-treatment confounders or covariates,   X i   [39]. The mediator is also required to be ignorable, given the observed treatment and pre-treatment covariates. The formal sequential ignorability assumptions are analyzed by [31,52]. As we have explained above, we designed our empirical analysis as a conditionally randomized experiment. This is shown by Figure 1 and Figure 2, depicted by the covariates (C). Thus, the ignorability assumptions are satisfied. Considering that the outcome ( Y i ) and the mediator ( M i ) are continuous variables, we estimate regression models for Y i and M i under pre-treatment covariates ( X i ), as follows in Equations (5) and (6):
E { t } = α 2   + β 2   T i + ξ   2 X i + ε i 1
E { t , m } = α 1   + β 1   T i + θ 1 M i + ξ   3 X i + ε i 2
As [36] prove, the average causal mediation effect (ACME) is equal to β 2 θ 1 , and the average direct effect (ADE) is equal to β 1   . We can extend the outcome model, E { t , m } , considering the interaction between the treatment or exposure variable and the mediator (see Equation (7)):
E { t , m ,   t m } = α 3   + β 3 T i + θ 3 M i + κ 4 T i   M i + ε i 3
while maintaining the linearity in parameters. Under the treatment ignorability, we can identify ACME as β 2   ( θ 3 + t     κ 4 ) , for t = t 0   ,   t 1 ; and the ADE identified as β 3 + κ 4 ( α 2   + β 2   t ) ; and the average total causal effect is β 2 θ 3 + β 3 + κ 4 ( α 2   + β 2   ) .  

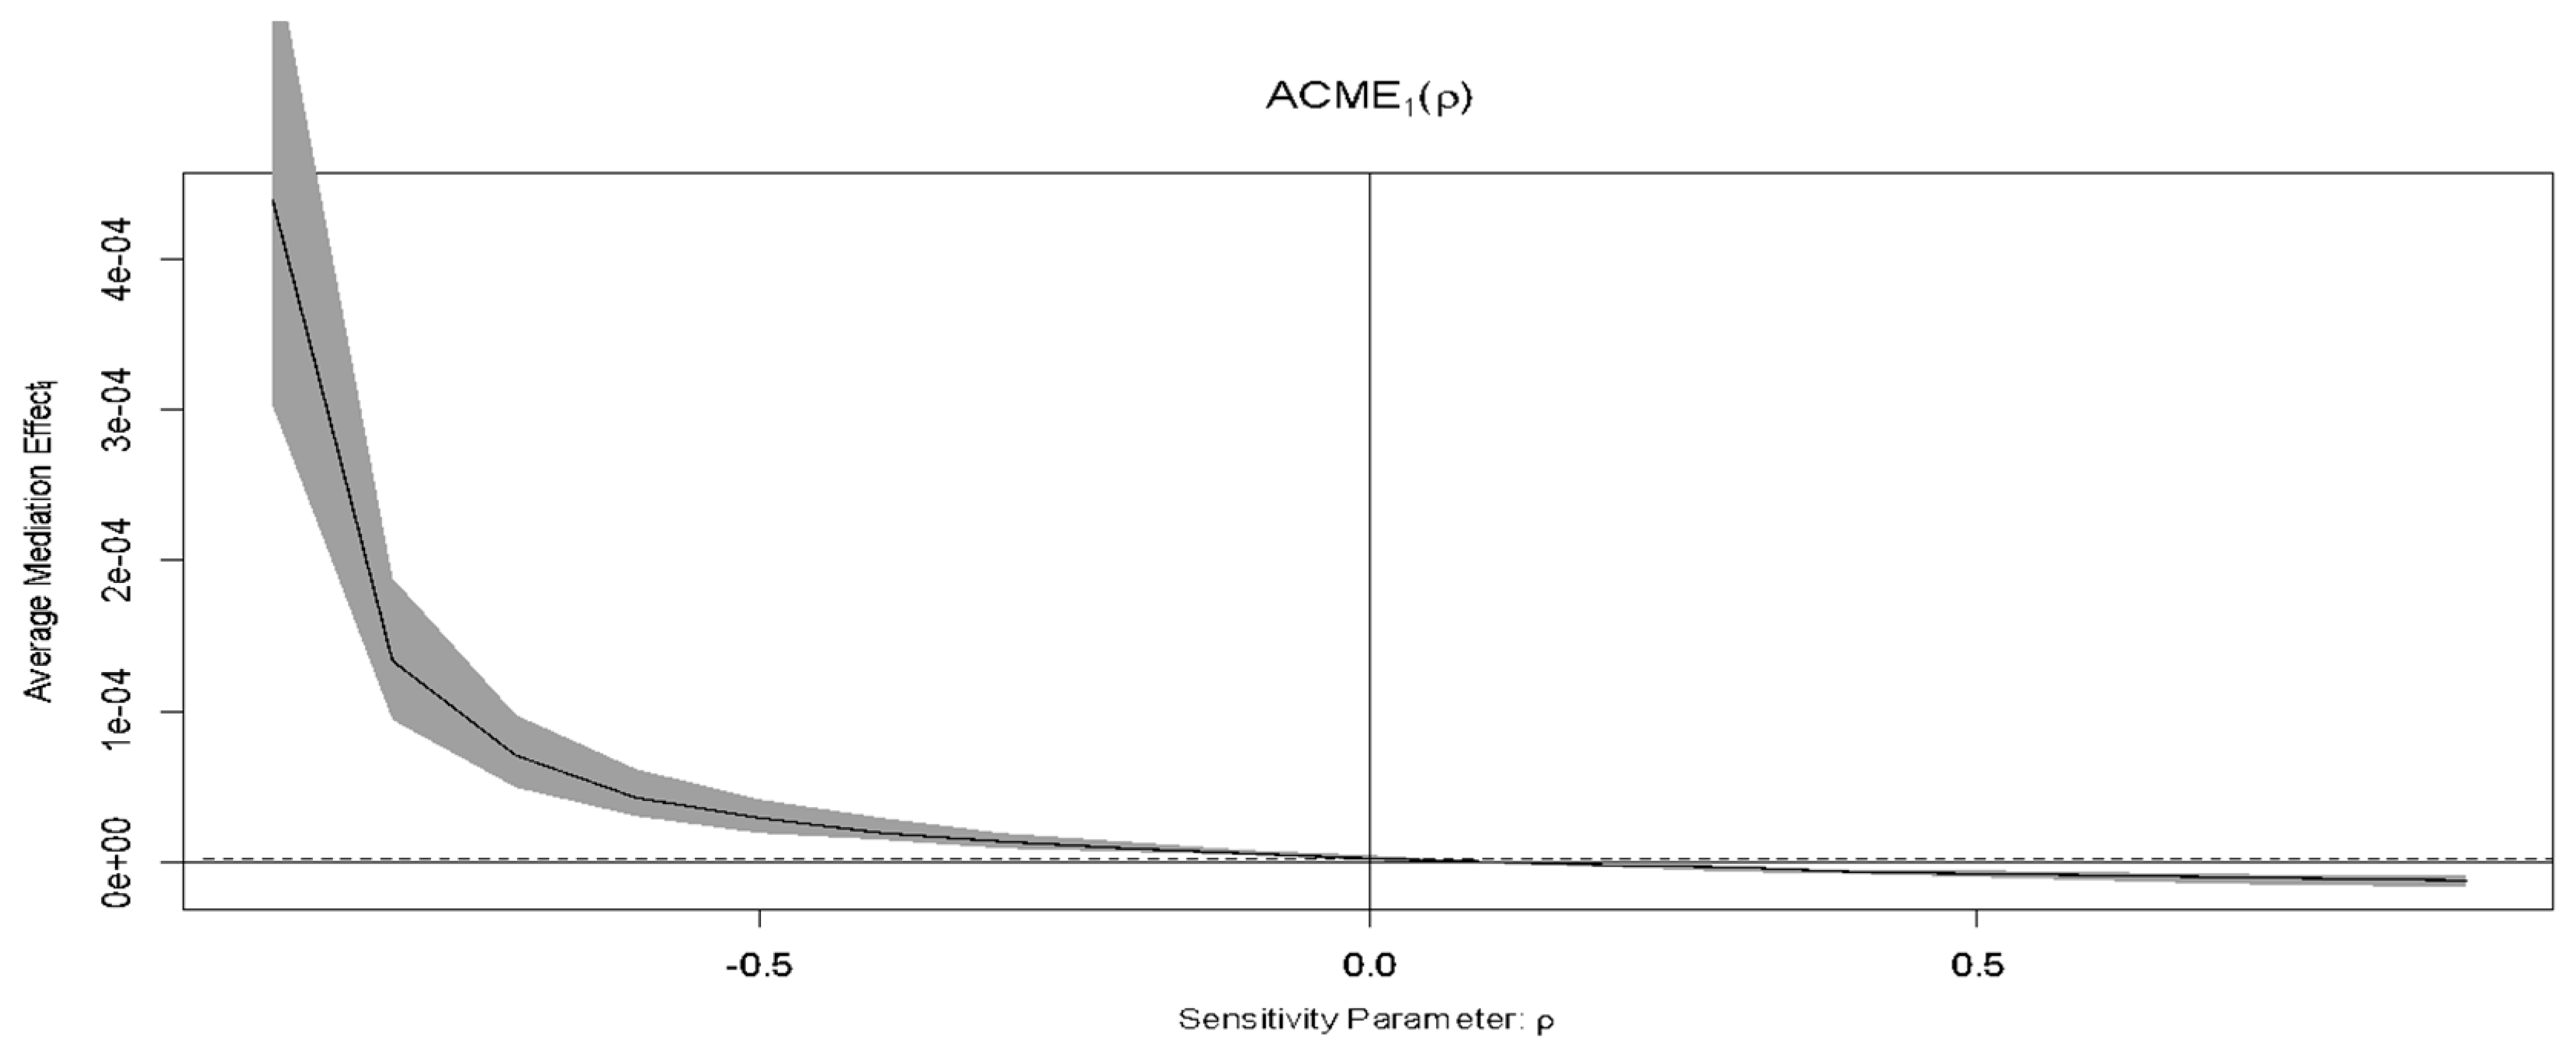
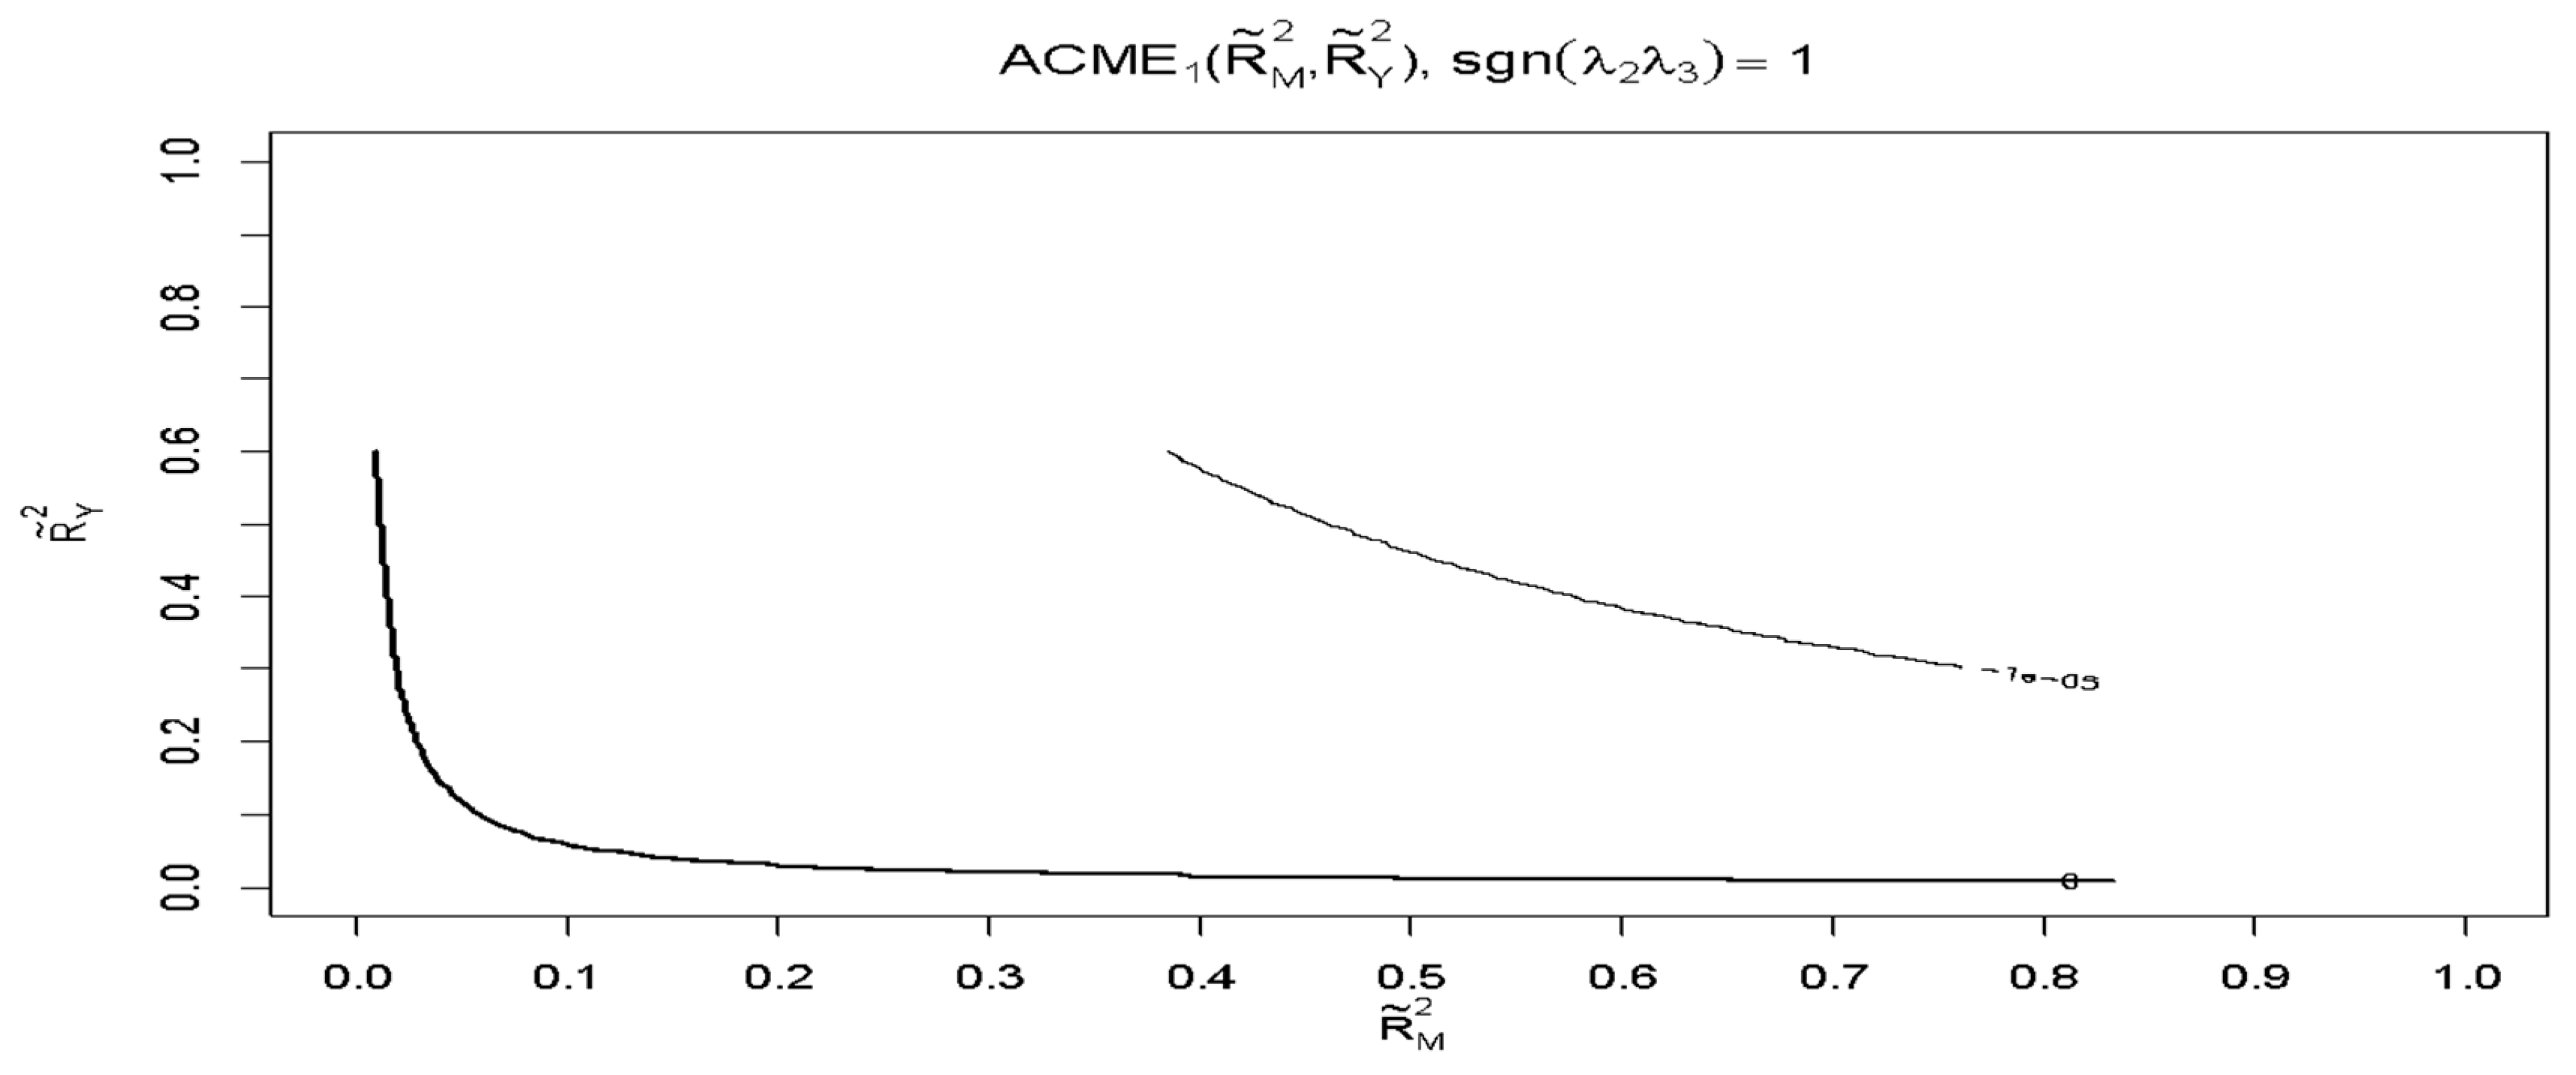
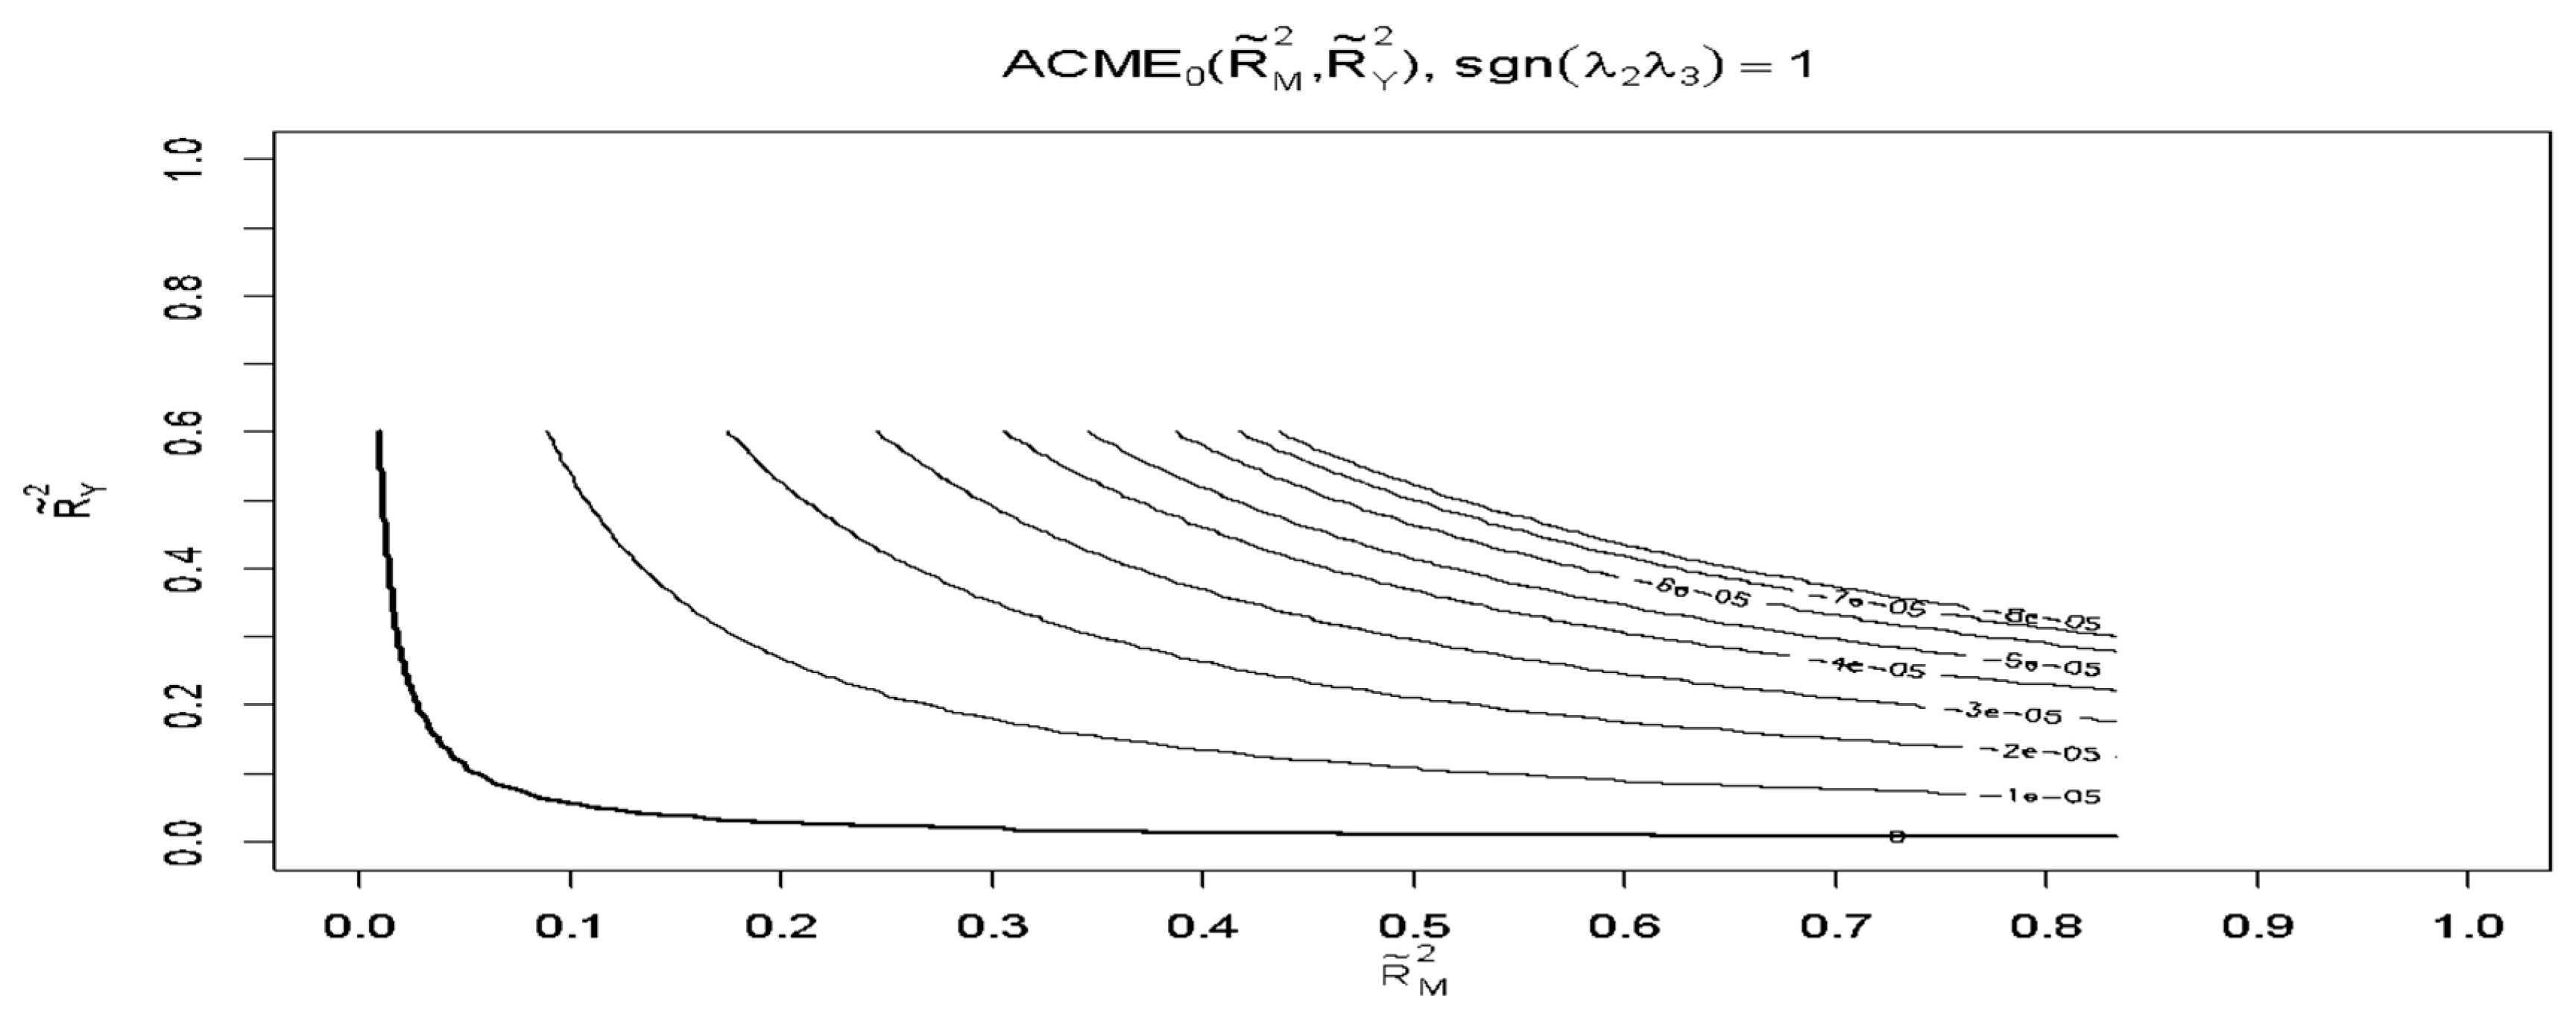
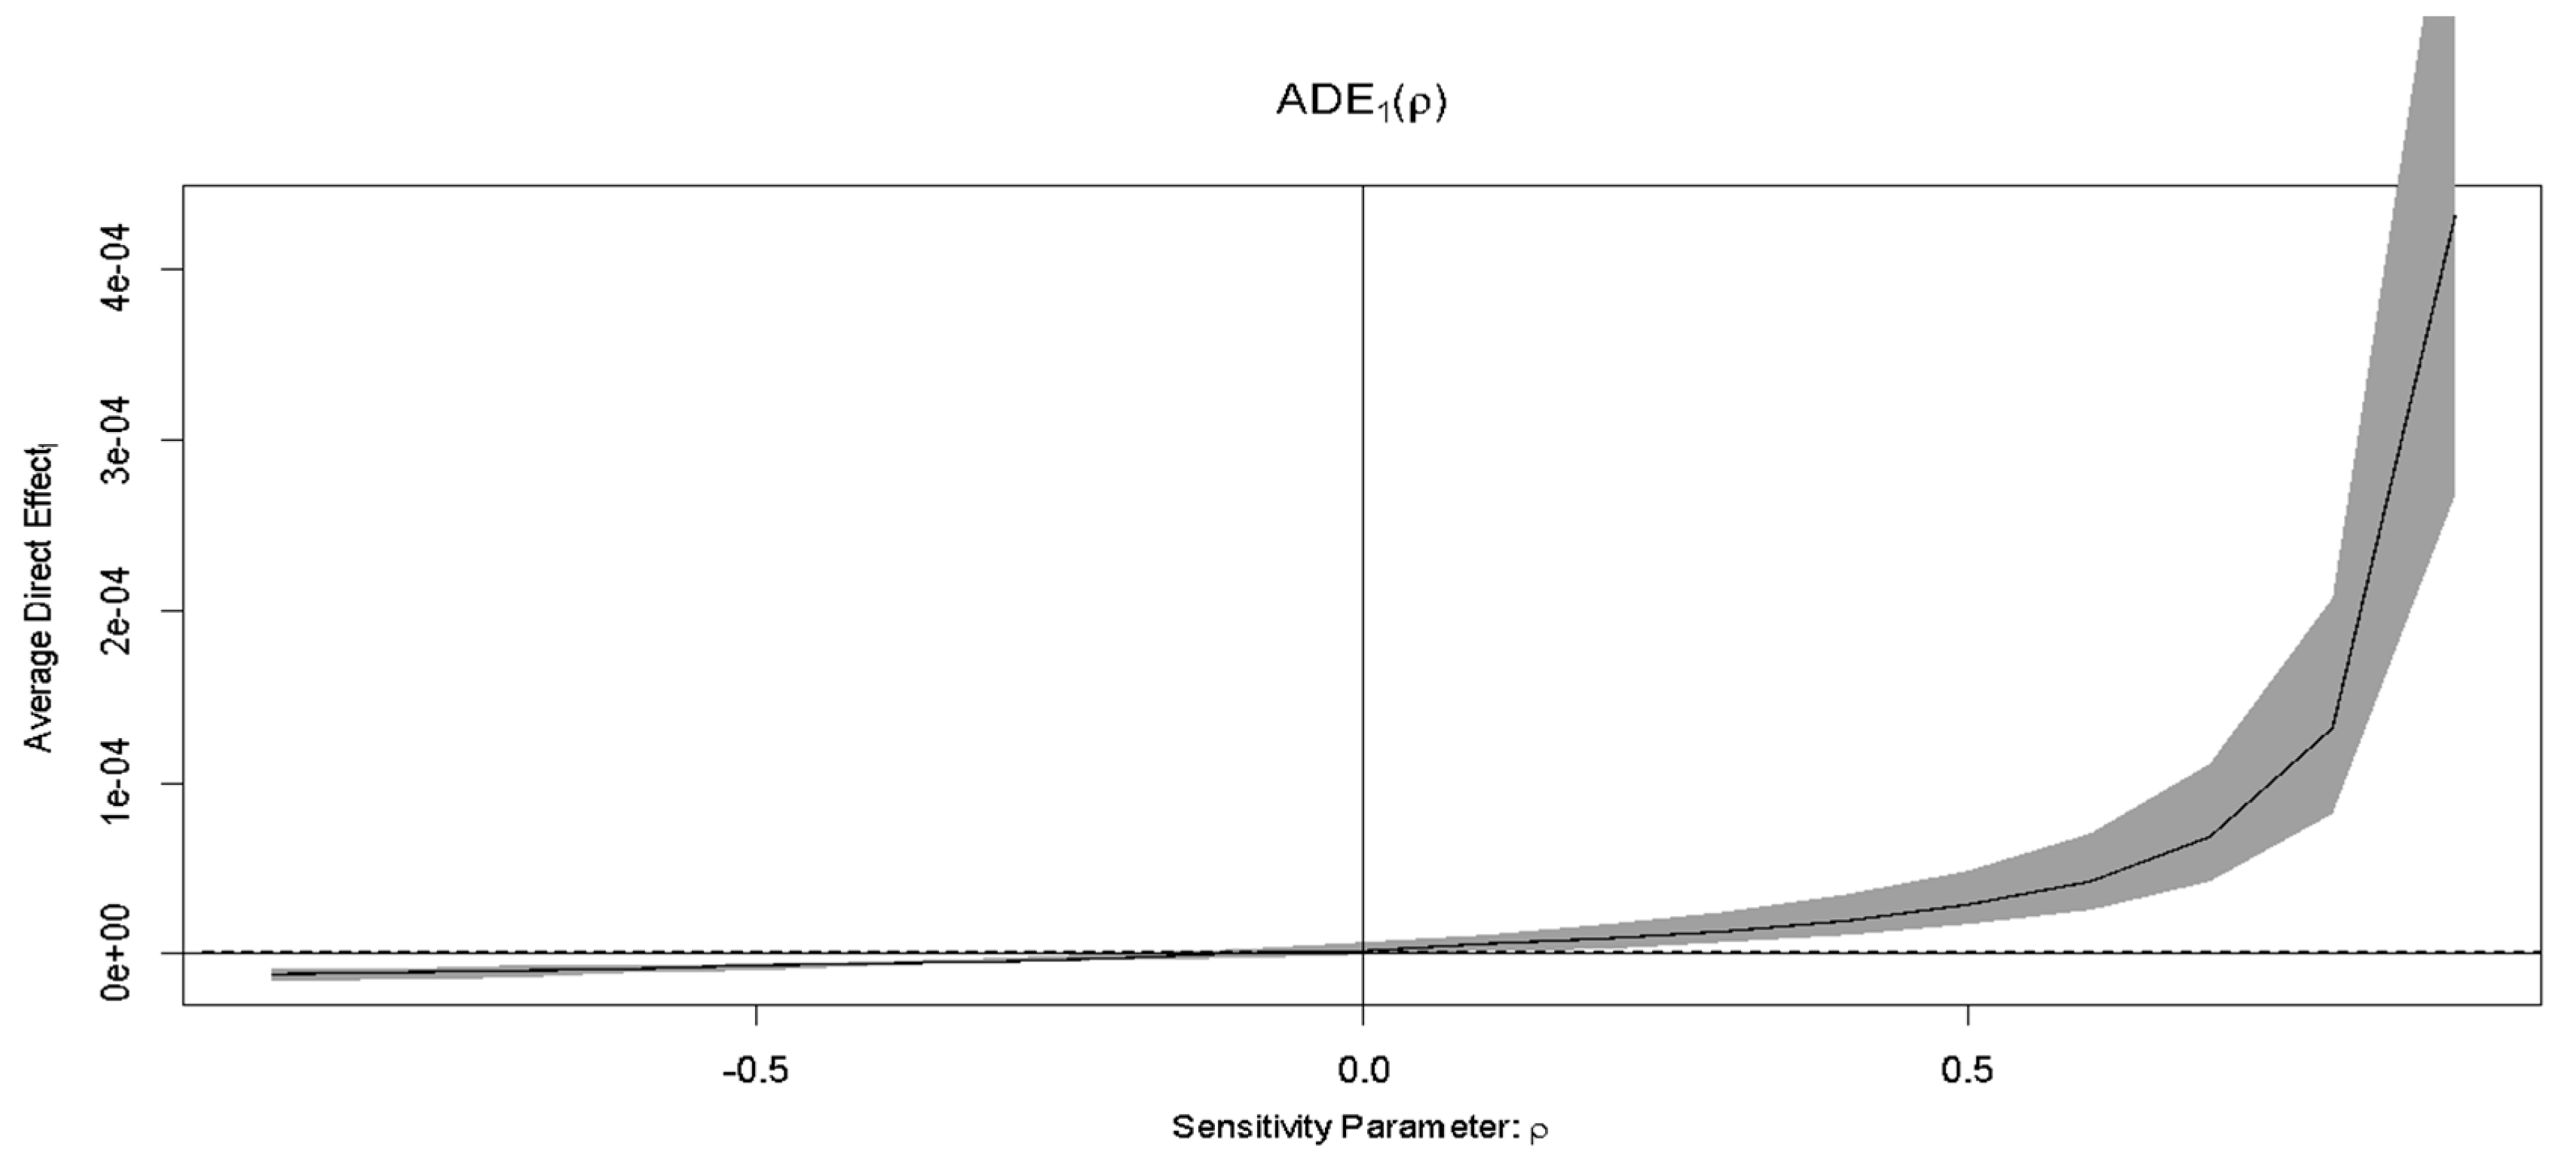
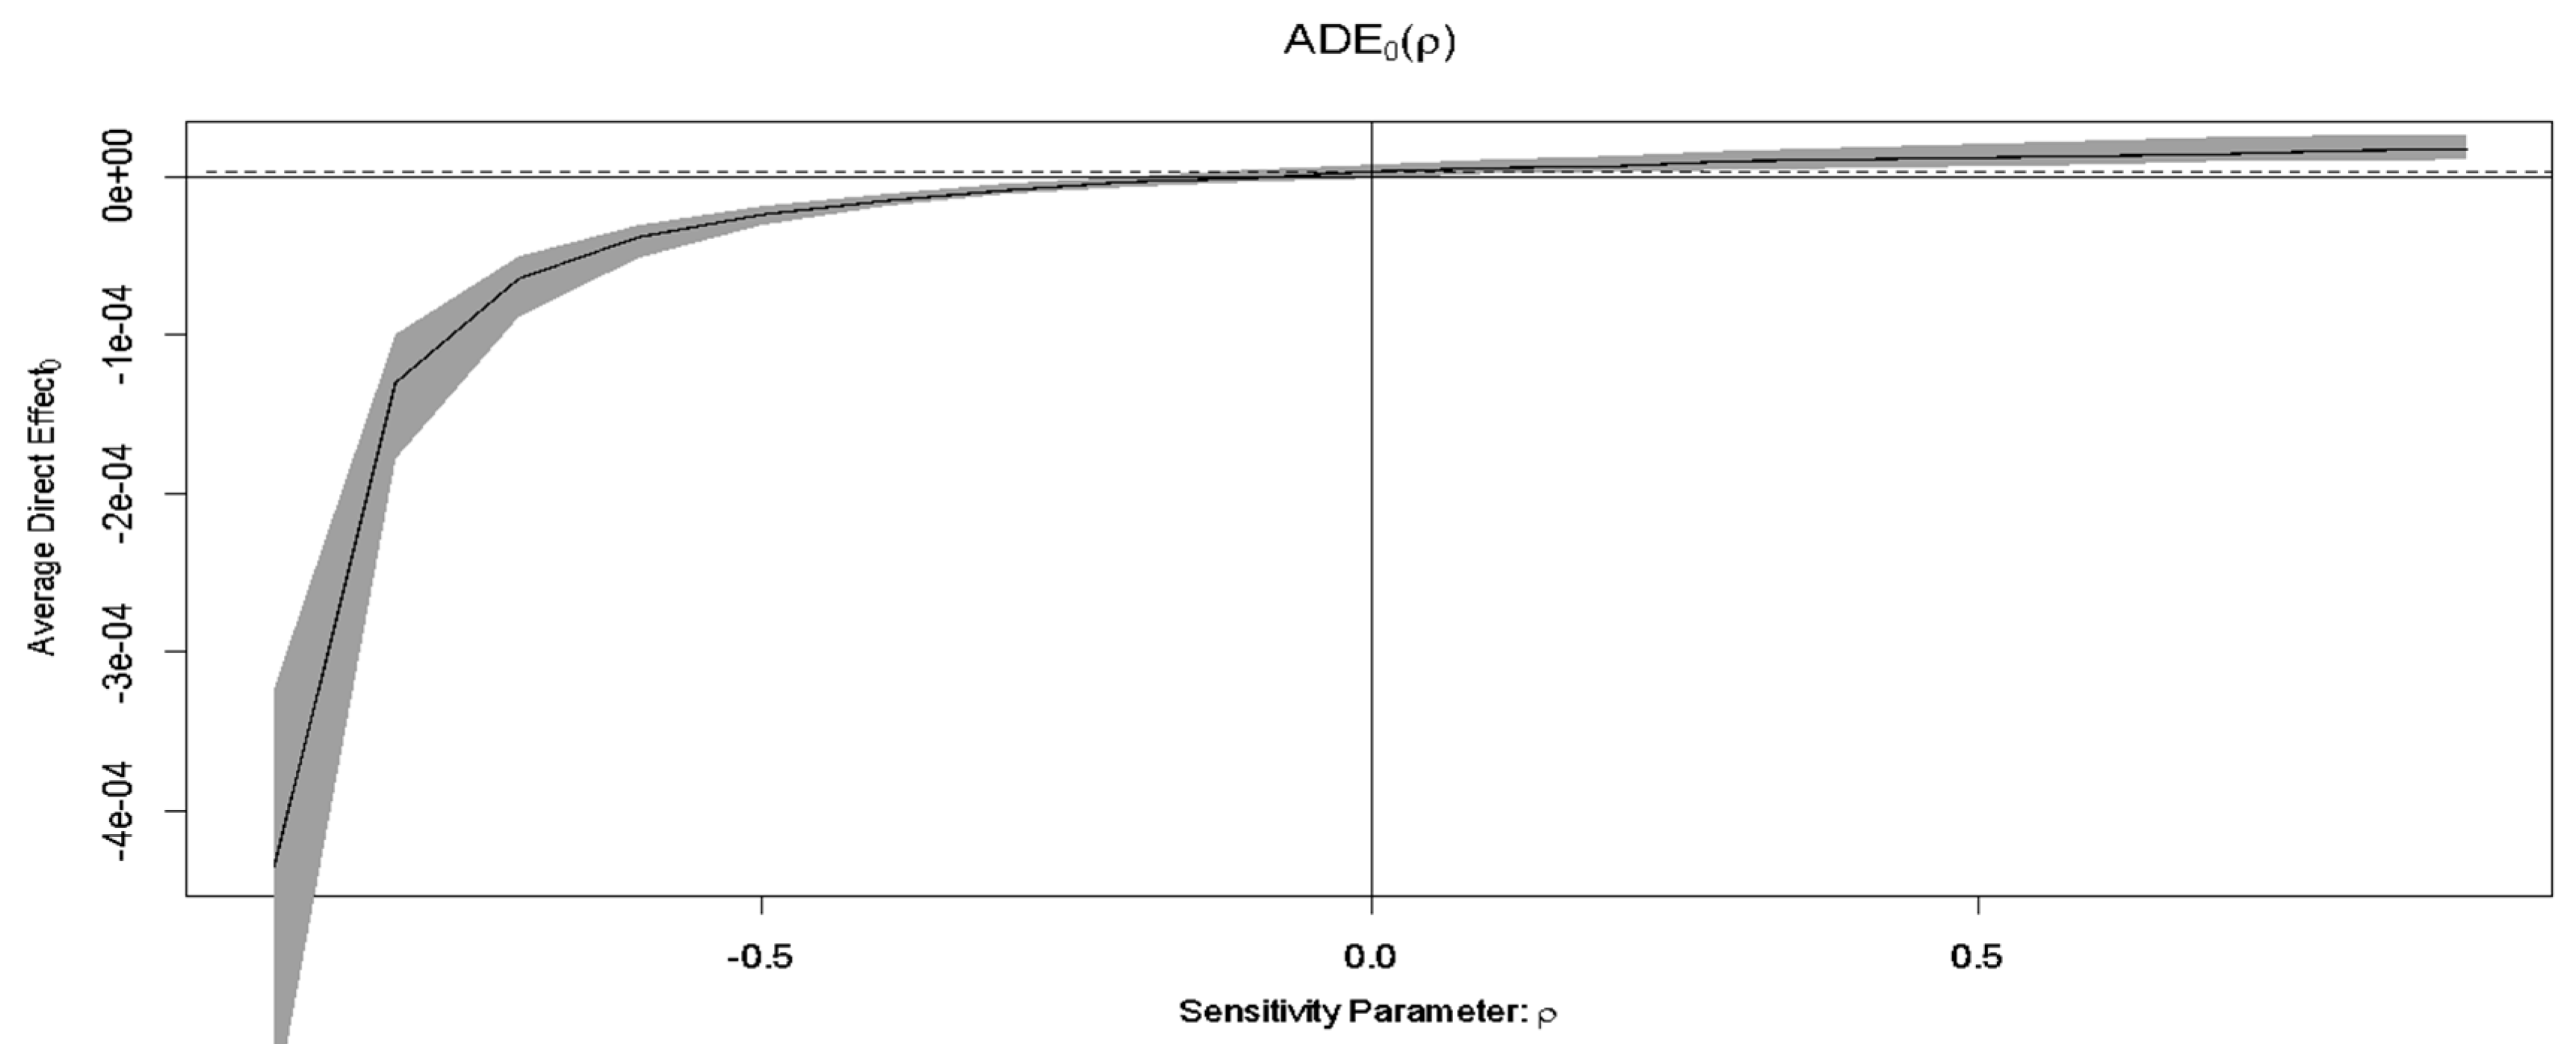
2.4. Sensitivity Analysis

Sensitivity analysis was performed due to the strong assumptions related to sequential ignorability [50]. In addition, implications for the linear structural equation model are also discussed in the literature [38,48].
The mediation analysis relies on the sequential ignorability assumption [39]. Under this assumption, the ACMEs are non-parametrically identified [37]. This last assumption is what justifies the sensitivity analysis due to excluded measured or unmeasured post-treatment confounders, as well as unmeasured pre-treatment confounders. This assumption rules out the possibility of multiple mediators that cause to each other. To address this possibility [39,52] developed a sensitivity analysis under the framework of the structural linear equations model. The method recognizes the fact that, under Equations (5) and (6), it is possible to summarize the degree of sequential ignorability violation by the correlation coefficient between the two error terms, i.e., ρ   C o r r ( ε i 1 , ε i 2 ) . They prove that the ACME can be identified given a value of ρ , and that the sequential ignorability implies that ρ = 0 . Thus, examining how the ACME varies as a function of ρ , we can analyze the robustness of the estimated structural equations, i.e., calculating how much the estimate of the ACME could change if the assumption is violated to a specific degree. The authors propose an alternative formulation of the sensitivity analysis that could be easier to interpret than before. This alternative relies on the idea that the error terms ( ε i 1 , ε i 2 ) can be decomposed into a common unobserved pre-treatment confounder (covariate) plus an independent random disturbance, i.e., ε i j = λ j U i + ε i j for j = 1, 2, corresponding with Equations (5) and (6). Thus, the degree of the sequential ignorability violation can be summarized by the importance of this common term with different coefficients explaining variations in the mediator (M) and the outcome (Y), which is represented as the partial coefficients of determination, i.e., R ˜ M 2 { V ( ε i 1 ) V ( ε i 1 ) } V ( M i ) and R ˜ Y 2 { V ( ε i 2 ) V ( ε i 2 ) } V ( Y i ) . They show that both effects (ACME, ADE) can also be expressed as a function of R ˜ M 2 and R ˜ Y 2 , making it possible to conduct the equivalent sensitivity analysis with respect to these alternative parameters. This sensitivity analysis is based on assumption of absence of post-treatment confounding, which is equivalent to assuming that there are not mediators that causally influence the mediator of interest (M).
We used R package for causal mediation analysis [53] developed by [54] which overcomes the limitations of the standard methods based on the product or difference of coefficients and allows us to carry out the sensitivity analysis.

3. Results

The average causal mediation effect (ACME), the average direct effect (ADE), the total effect (TE), and the proportion of total effect mediated (PM), along with confidence intervals (CI), are presented in Table 3, and in Figure 3 and Figure 4, corresponding with theoretical Figure 1 and Figure 2. The first result is that the affective dimension, or worry about environmental problems, has direct (ADE) and indirect (ACME) positive effects on pro-environmental behaviour (PEB) in all cases, as shown in the first and fourth columns. The PM is equal in both DAGs (25%) for the first hypothesis A, refering to the baseline status of environmental concern (worry). Yet, we observe some differences from the rest of the hypotheses BCDE (Table 3), referring to the baseline status of environmental concern (worry) and under different scenarios (DAG_1, DAG_2). Considering different hypotheses of the treatment level (T, environmental concern), we see that the lower the level of worry, the lower the effects on pro-environmental behaviour (Y, outcome, PEB). This is because the difference, as a result of comparing the two conditions refer to “treat.value” and “control.value” is positive. Another result is that ACME in DAG_1, column (1), without environmental knowledge (no confounder), and without covariates, is +0.54, which is equal to the result in the GSEM (Table A4 of Appendix A), but it is +0.44 under DAG_2 scenario, considering the cognitive dimension as a confounder, and without covariates. Thus, considering environmental knowledge as a confounder, all the effects are lower, as shown in DAG_2 (Figure 4), compared to DAG_1 (Figure 3) under all hypotheses. We can explain this result because of the low level of environmental knowledge in our data (Table A1 and Table A3 of the Appendix A). Seventy-four percent have not detected any environmental problems in his or her environment. We also find smaller effects in DAG_2, adjusting for covariates that act as moderators (situational factors), such as income, household type, education, age, and municipality size. This can be observed in rows D and E in Table 3 that refer to the hypotheses about the baseline status of environmental concern (worry). Both DAGs include the mediator (attitudes and intentions or conative dimension). The statistical significance of the interaction between treatment and mediator can be tested using the test.TMint under the null hypothesis of non-interaction, as shown in Table 4. An interaction term between the treatment (affective dimension) and the mediator (conative dimension) is added to the outcome model (pro-environmental behavior). The ACME and ADE, conditional on treatment status [control (=min level of worry equals 1) versus treated (=max level of worry equals 3)], are estimated with the interaction term. We plot the results in Graph 1 and Graph 2, respectively. The dotted dashed line corresponds to the mediator interaction term. The mediator (conative dimension) slightly reduces direct (ADE) and indirect (ACME) effects in both DAGs. In our data, the willingness to accept certain environmental policy measures (conative or mediator) is low [mean = 3.81; s. d. = 2.26; min = 0; max = 8, Table A3 of the Appendix A]. The test.TMint rejects the null hypothesis, [(ACME (3)) – (ACME (1)) = 0], which means that average mediation effect depends on the baseline treatment status for both DAGs. We prove that there is interaction between treatment (affective dimension) and mediator (conative dimension) that causes pro-environmental behavior.
Figure 3. DAG_1.
Figure 3. DAG_1.
Land 13 01229 g003
Figure 4. DAG_2.
Figure 4. DAG_2.
Land 13 01229 g004
Graph 1. Treatment and mediator interaction in DAG 1 (no confounder).
Land 13 01229 gr001
Graph 2. Treatment and mediator interaction in DAG 2 (confounder).
Land 13 01229 gr002
Eventually, we analysed the effect of the situational or external variables (Table A2 of Appendix A). The mediate function of Mediation R package was used to prove the moderated mediation effect of the covariates such as income, household type (Ht), municipality size (Ms), age, and level of education (Edu). The moderated mediation test (modmed) consists of directly testing the statistical significance of the difference in ACME and ADE between two chosen levels of pre-treatment covariates. The results are shown in Table 5. The first two columns under DAG_1 indicate the average indirect (ACME) and direct (ADE) effects of the covariate as a moderator for the average treatment level (affective dimension). The following two columns under DAG_1 show the average indirect (ACME) and direct (ADE) effects of the covariate for the maximum treatment level (t = 3); columns 6, 7, 8 and 9 display the ACME and ADE under DAG_2 scenario; finally, columns 5 and 10 under DAG_1 and DAG_2, respectively, refers to the results of the modmed-test which verifies, under the null hypothesis equals to zero, whether the differences of the average indirect [Diff1 = (ACME (covariate.1)) − (ACME (covariate.2)) = 0], and direct [Diff2 = (ADE (covariate.1)) − (ADE (covariate.2)) = 0] effects for the two values of the covariate significantly differ. We observe that the indirect (ACME) and direct (ADE) average effects of the average income under both DAG scenarios are positive (+0.51, and +0.46, respectively), as the most general result in the GSEM with the +0.78 (Table A4 of Appendix A). The coefficients are highly significant. However, causal mechanisms reveal some interesting differences. First, for the lowest level of income (Income_Low) less than 1000 €/month/net (Table A2 of Appendix A), and the highest level of treatment (t = 3), columns 3 and 4 of Table 5 under DAG_1 scenario, ACME (=1.73) and ADE (=4.56), are higher than for the average income, (ACME = 1.56, and ADE = 3.72, columns 3 and 4 respectively), and for the highest income (Income_High) (ACME = 1.13, and ADE = 1.71). Columns (5) under DAG_1 scenario verifies these differences through the modmed-test. The null hypothesis is rejected. The differences between ACME and ADE for the lowest household income and the highest household income are positive and significant under the same level of treatment (0.60, and 2.58, respectively). We can see in the GSEM (Table A4 of Appendix A) that the coefficient of income, which is usually a proxy of education has positive sign in relation to PEB (+0.78). Consequently, we interpret that the higher the income, the higher the pro-environmental behaviour. However, this is a half-truth, considering the causal mechanisms of income as moderator as discussed above. The average causal mediation effect (ACME), and average direct effect (ADE), of income on PEB are positive in all cases, but these effects are higher for the lowest level of income than for the highest level of income for both levels of treatment (average, highest), columns 1–4. Then, we can find that the higher the income, the higher the PEB because the coefficient is positive and significant, as in the GSEM estimation, but the mediation effects are higher for the lowest level of income than for the highest level of income. So, income has a diminishing marginal effect on PEB, which is consistent with human behavior in an economic sense because when our income level increases, consumption of goods (private car, air conditioning, travels, etc.) increases too. Another result is that ACME and ADE are higher for the maximum treatment level (environmental concern), columns 3 and 4 compared to columns 1 and 2. Thus, there is a need to promote greater environmental concern at higher income levels. This means that the lower effects of higher incomes on PEB are offset by higher levels of environmental awareness. The above results are confirmed under the DAG_2 scenario, columns 6 to 10, so that the direct (ADE) and indirect (ACME) effects of covariates on pro-environmental behavior (PEB) are greater when the level of exposure or affection for the environment is at the maximum level (t = 3). In the same way, low income has higher ACME and ADE than high income. Average effects under DAG_2 are smaller than those obtained in the DAG_1 scenario. This is due to the low-level of the environmental knowledge (cognitive dimension). The most important result of the mediation analysis is that, despite the positive causal effect of environmental concern (T) on pro-environmental behavior (PEB), the effects are mediated by the mediator (conative dimension or attitudes and intentions), confounder (cognitive dimension or knowledge), and moderators (covariates, external or situational variables). Thus, the traditional approach that assumes multiple mechanisms as causally independent of one another is not verified in our case study. Multiple causal mechanisms are not independent, and cause PEB.

Sensitivity Analysis

We employed the medsens function of the Mediation R package to perform the sensitivity analysis [35,37]. Graph 3, Graph 4, Graph 5 and Graph 6 show that ACMEs for each group [treatment (t = 3), and control (t = 1)] for a given value of ρ will vary from −0.9 to 0.9 by 0.1 increments. We also analyzed the estimated ADEs changes through the same procedure, as shown in Graph 7, Graph 8, Graph 9 and Graph 10. The summary function displays the values of ρ at which the confidence intervals contain zero for ACME and ADE. For both the treatment and control conditions, ACME and ADE equal zero when ρ is 0.1 (Graph 3, Graph 5, Graph 7 and Graph 9). R ˙ M , Y 2 for residual variance at which ACME equals zero for both treatment and control conditions is 0.01, and R ˜ M , Y 2 for total variance is 0.0062. We plotted the total variance of the sensitivity analysis in Graph 4, Graph 6, Graph 8 and Graph 10. The bold line represents the various combinations of the R ˜ 2 statistics for ACME and ADE equal zero, respectively. In this case the product equals 0.0062. Results are near zero. Thus, when the product of the original variance explained by the omitted confounding variables is 0.0062, the point estimate for ACME would be zero.
Graph 3. ACME for the treatment group (t = 3) as a function of ρ .
Land 13 01229 gr003
Graph 4. ACME for the treatment group (t = 3) as a function of R ˜ 2 .
Land 13 01229 gr004
Graph 5. ACME for the control group (t = 1) as a function of ρ .
Land 13 01229 gr005
Graph 6. ACME for the control group (t = 1) as a function of R ˜ 2 .
Land 13 01229 gr006
Graph 7. ADE for the treatment group (T = 3) as a function of ρ .
Land 13 01229 gr007
Graph 8. ADE for the treatment group (t = 3) as a function of R ˜ 2 .
Land 13 01229 gr008
Graph 9. ADE for the control group (t = 1) as a function of ρ .
Land 13 01229 gr009
Graph 10. ADE for the control group (T = 1) as a function of R ˜ 2 .
Land 13 01229 gr010

4. Discussion

This study covers the existing gap in the literature about the nature of the causal mechanisms between environmental concern and pro-environmental behavior. This analysis about causal mechanisms of environmental dimensions allows us to conclude that effects are not independent. This research allows us to prove that knowledge about environmental problems acts directly on environmental concern (affective dimension or worry), and on pro-environmental behavior (active dimension). Therefore, it has a double effect. Yet the data do not allow us to analyze some aspects of sustainable behavior, such as the degree of altruism related to pro-environmental behaviors, equity and commitment to future generations, belief in the effectiveness of pro-environmental acts as a solution to an environmental problem, or intrapersonal factors such as personality traits.
Our research discusses the average direct and indirect effects of environmental concern (worry or affection for the environment) on pro-environmental behavior (PEB), hypothesizing about the mediator, confounder, and moderators. For this purpose, observational data were used as an approximation to the experimental design. We proved that the conative dimension (attitudes and intentions) acts as a mediator, and the cognitive dimension as a confounder, as shown in Figure 2 and Figure 4. These results partly explain the observed heterogeneity about pro-environmental behavior. Despite being exposed to the same environmental problems, however, we do not have an equal level of knowledge about environmental problems. The intention to accept certain environmental policy measures is also not homogeneous. Moreover, we must add the fact that external and situational factors such as income, age, etc. act as moderators of environmental behavior.
Our second main empirical result is that the average direct and indirect effects are conditioned by the baseline status of environmental concern (worry). These effects are moderated by external or situational factors, as we can examine income, age, education, household size and municipality size. Finally, the sensitivity analysis demonstrates the robustness of our results which have policy implications, e. g., related to the design and effectiveness of environmental strategies. As shown in our results, average direct and indirect effects are greater when we have maximum level of worry about environmental problems. These effects could be reinforced by increasing the level of environmental knowledge and the willingness to accept environmental policy measures. This research allows for better understanding of the effects and interactions of the different dimensions of environmental concern, in order to enhance PEBs. For future research, it would be desirable to incorporate more psychological aspects, such as personality traits, into the analysis.

Author Contributions

Conceptualization, A.H.-A.; methodology, A.H.-A.; investigation, J.C.S. and N.C.-P.; resources, J.C.S.; software: N.C.-P.; writing—original draft preparation, A.H.-A.; writing—review and editing, N.C.-P.; visualization, J.C.S. All authors have read and agreed to the published version of the manuscript.

Funding

This research was funded by the European Union’s Horizon 2020 Research and Innovation Program under grant number 101037424, project ARSINOE (climate-resilient regions through systemic solutions and innovations).

Data Availability Statement

The data that support the findings of this study are available from the corresponding author, upon reasonable request.

Conflicts of Interest

The authors declare no conflicts of interest.

Appendix A

Table A1. Definition and frequencies of the items related to the environmental awareness dimensions. (Sample).
Item DefinitionsCategories
I1 Affective dimension (worry) (treatment): Are you concerned about the environmental
situation? *
nk/nanothinglittlemuch
Freq.%Freq.%Freq.%Freq.%
3271.338363.40438417.8419,02477.42
Conative dimension (M) (mediator) (tolerance, attitudes and intentions): the sum of 2 to 9
Would you be in favor of the following
environmental protection measures?
nk/nayesno
Freq.%Freq.%Freq.%
I2Mandatory, subject to a fine, the separation of household waste30.0112,71951.7611,84948.22
I3Regulate or restrict the abusive water consumption of each dwelling20.0119,53279.49503720.50
I4Establishing an environmental tax on the most polluting fuels10.0015,61163.53895936.46
I5Restrictive measures on the use of private transport20.0111,36346.2513,20653.75
I6Introduce an eco-tax on tourism30.01805532.7816,51367.21
I7Installation of a
renewable energy park (wind, solar) in your municipality despite the effect on the landscape
--17,57671.53699528.47
I8Pay more for the use of
alternative energies
30.01558722.7418,98177.25
I9Reduce noise on main roads (anti-noise panels, sound-reducing paving)10.0020,93085.18364014.81
Cognitive dimension (Co) (confounder): the sum of 10 and 11
I10 Environmental campaign: In the last year, have you been aware of any awareness-raising campaigns concerning environmental protection (water, energy, recycling, etc.)?nk/nayesno
Freq.%Freq.%Freq.%
7042.8714,76260.08910537.06
I11 Environmental problem detection: During 2007, have you detected any environmental problems in your environment?nk/nayesno
Freq.%Freq.%Freq.%
--643626.1918,13573.81
Active dimension or pro-environmental behavior (Y) (PEB, outcome): the sum of 12 to 17
Do you use any of the following
products?
Never
%
Sometimes %Somewhat
often %
Whenever possible %nk/na
%
I12 Recycled paper? 66.2218.677.855.022.24
I13 Returnable packaging? 72.0214.347.454.591.60
I14 Rechargeable batteries? 49.2020.9316.8311.621.42
Rate the importance they attach to the following elements when buying a new product (household appliance, food product, cleaning product, etc.):No importance
%
Little importance
%
Quite
importance %
Very importance
%
I15 Energy consumption/efficiency6.7415.3148.1529.80
I16 Eco-label/eco-guarantee
(organic food)
18.9629.9835.7015.35
I17 Local product/proximity of
products
18.7127.0134.6519.63
Source: Household and Environment Survey of the Spanish National Institute of Statistics. * Questions are answered by the household’s selected person; nk/na = Not known/no answer. N = 26,689 obs.
Table A2. Definition and frequencies of household socio-economic characteristics (%) (Sample).
VariablesCategoriesFrequencyCluster_1Cluster_2Cluster_3Cluster_4
Are you concerned
about the
environmental
situation? *
Much77.4281.9159.5889.4076.27
Little17.8416.3929.438.6619.24
nothing, nk/na4.731.7010.991.944.48
Household
income
[net, monthly]
1. Less than €110026.3313.5834.5723.9829.48
2. From €1101 to €180027.5327.7226.1628.8627.12
3. From 1801 to 2700 €.15.5519.8613.2316.5013.95
4. More than 2700 €9.5212.866.5611.288.15
5. na/nk21.0825.9719.4819.3721.30
Household
type
1. One-person household18.3012.8623.0015.6520.40
2. Single couple23.5419.8623.1923.8725.55
3. Parent-child household47.1157.1541.4449.6443.29
4. Household with others11.0510.1312.3710.8410.77
Education *1. University studies15.2121.9711.1718.1912.53
2. Baccalaureate and
vocational education
26.8736.3422.8128.7322.93
3. Illiterate up to 1st stage
secondary education
57.6241.6966.0253.0864.54
Municipality
size
(number of
inhabitants)
1. Provincial capitals and
municipalities > 100,000
38.6543.6136.7440.6135.35
2. From 50,001 to 100,0008.309.148.448.357.67
3. 20,001 to 50,00015.5616.8515.0915.4615.32
4. 10,000 to 20,00012.3311.5012.7412.1412.67
5. Less than 10,000 25.1518.8926.9923.4428.99
N26,6894462617081197938
Source: Household and Environment Survey of the Spanish National Institute of Statistics. * Questions are answered by the household’s selected person; nk/na = not known/no answer.
Table A3. Descriptive stats of the variables related to the selected person of the household (subsample).
Stats.AffectiveConativeCognitivePEBIncomeHousehold TypeEducationAgeMunicipality Size
mean23.810.6017.831.893.082.5760.122.94
T = 1-2.890.3415.741.603.072.7666.543.15
T = 2-3.690.5017.701.943.062.5858.712.94
T = 3-4.850.9720.062.103.102.3855.122.74
sd0.812.260.695.770.962.080.6717.951.67
T = 1-2.300.556.030.902.310.5317.581.72
T = 2-2.120.655.490.952.030.6617.791.64
T = 3-1.910.714.890.971.880.7516.551.64
p5024018233613
T = 1-3016123723
T = 2-4018233583
T = 3-5120233543
p2512014112451
T = 1-1011113531
T = 2-2013122441
T = 3-4017122421
p7535122343755
T = 1-5120243805
T = 2-5122343755
T = 3-6123343694
min1003111191
max38238483985
N3300 obs., [1100 per level of environmental concern (T)]
T = level of environmental awareness (affective, worry), treatment or exposure (1,2,3); sd = standard deviation; p = percentile; PEB = level of pro-environmental behavior.
Table A4. Generalized structural equation model corresponding to a randomly selected subsample.
VariablesGaussian Identity (OLS)Gaussian Identity (OLS)Ordered_logit
Ec. (1)Ec. (2)Ec. (3)
PEB (Y)(95% Conf.
Interval)
Cn (M)(95% Conf.
Interval)
Affective (T)( 95% Conf.
Interval)
Conative dim. (Cn)0.54 ***[0.45; 0.64]
(11.22)
Affective dim.1.11 ***[0.82; 1.39]0.88 ***[0.78; 0.97]
(7.60)(18.11)
Cognitive dim. (Co)0.64 ***[0.32; 0.97]0.31 ***[0.20; 0.42]1.06 ***[0.96; 1.16]
(3.90)(5.75)(20.63)
Income0.78 ***[0.53; 1.02]
(6.18)
Household_type0.03[−0.07; 0.13]
(0.57)
Education−0.60 ***[−0.93; −0.27]
(−3.59)
Age−0.003[−0.01; 0.009]
(−0.53)
Municipality size−0.031[−0.15; −0.091]
(−0.50)
_cons13.43 ***[11.89; 14.97]1.85 ***[1.65; 2.05]
(17.08)(18.26)
/cut1_ec.(3) −0.16 ***[−2.24; −0.07]
(−3.70)
/cut2_ec.(3) 1.39 ***[1.30; 1.49]
(28.29)
var(e.peb)_ec.(1)27.37 ***[26.01; 29.02]
(35.80)
var(e.cn)_ec(2)4.45 ***[4.28; 4.63]
(49.24)
N 263833003300
t statistics in parentheses; *** p < 0.001.

Notes

1
Available online: https://www.bhub.org/#?domain=environment (accessed on 20 March 2024).
2
Household and Environment Survey of the Spanish National Institute of Statistics.
3
Consistency and assumption of no interference between units.
4
5
Number of Monte Carlo draws for nonparametric bootstrap or quasi-Bayesian approximation.

References

  1. Bamberg, S. Changing environmentally harmful behaviors: A stage model of self-regulated behavioral change. J. Environ. Psychol. 2013, 34, 151–159. [Google Scholar] [CrossRef]
  2. Brieger, S.A. Social identity and environmental concern: The importance of contextual effects. Environ. Behav. 2019, 51, 828–855. [Google Scholar] [CrossRef]
  3. Casaló, L.V.; Escario, J.J.; Rodriguez-Sanchez, C. Analyzing differences between different types of pro-environmental behaviors: Do attitude intensity and type of knowledge matter? RCR Adv. 2019, 149, 56–64. [Google Scholar] [CrossRef]
  4. Dunlap, R.E.; Jones, R.E. Environmental concern: Conceptual and measurement issues. In Handbook of Environmental Sociology; Dunlap, R.E., Michelson, W., Eds.; Greenwood Press: Westport, CT, USA, 2002; pp. 482–542. [Google Scholar]
  5. Dunlap, R.E.; Van Liere, K.D.; Mertig, A.G.; Jones, R.E. Measuring Endorsement of the New Ecological Paradigm: A Revised NEP Scale. J. Soc. Issues 2000, 56, 425–442. [Google Scholar] [CrossRef]
  6. Gkargkavouzi, A.; Halkos, G.; Matsiori, S. How do motives and knowledge relate to intention to perform environmental behavior? Assessing the mediating role of constraints. Ecol. Econ. 2019, 165, 106394. [Google Scholar] [CrossRef]
  7. Malik, C.; Singhal, N. Consumer environmental attitude and willingness to purchase environmentally friendly products: An SEM approach. Vision 2017, 21, 152–161. [Google Scholar] [CrossRef]
  8. Su, K.; Ren, J.; Cui, C.; Hou, Y.; Wen, Y. Do Value Orientations and Beliefs Play a Positive Role in Shaping Personal Norms for Urban Green Space Conservation? Land 2022, 11, 262. [Google Scholar] [CrossRef]
  9. Weber, E.U. Breaking cognitive barriers to a sustainable future. Nat. Hum. Behav. 2017, 1, 0013. [Google Scholar] [CrossRef]
  10. Tapia-Fonllem, C.; Corral Verdugo, V.; Fraijo-Sing, B.; Durón-Ramos, M.F. Assessing sustainable behavior and its correlates: A measure of pro-ecological, frugal, altruistic and equitable actions. Sustainability 2013, 5, 711–723. [Google Scholar] [CrossRef]
  11. Eagly, A.H.; Chaiken, S. The Psychology of Attitudes; Harcourt Brace Jovanovich College Publishers: San Diego, CA, USA, 1993. [Google Scholar]
  12. Zhang, Y.; Zhao, Y.; Zhang, H.; Zheng, S.; Yao, Y. The Impact of Different Value Types on Environmentally Responsible Behavior: An Empirical Study from Residents of National Park Communities in China. Land 2024, 13, 81. [Google Scholar] [CrossRef]
  13. Giancola, M.; Palmiero, M.; D’Amico, S. The green adolescent: The joint contribution of personality and divergent thinking in shaping pro-environmental behaviours. J. Clean. Prod. 2023, 417, 138083. [Google Scholar] [CrossRef]
  14. Gray, D. Ecological Beliefs and Behaviors; Greenwood Press: Westport, CT, USA, 1985. [Google Scholar]
  15. Kals, E.; Schumacher, D.; Montada, L. Emotional affinity toward nature as a motivational basis to protect nature. Environ. Behav. 1999, 31, 178–202. [Google Scholar] [CrossRef]
  16. Levine, D.S.; Strube, M.J. Environmental attitudes, knowledge, intentions and behaviors among college students. J. Soc. Psychol. 2012, 152, 308–326. [Google Scholar] [CrossRef]
  17. Akintunde, E.A. Theories and concepts for human behavior in environmental preservation. J. Environ. Sci. Public Health 2017, 1, 120–133. [Google Scholar] [CrossRef]
  18. Li, D.; Zhao, L.; Ma, S.; Shao, S.; Zhang, L. What influences an individual’s pro-environmental behavior? A literature review. RCR Adv. 2019, 146, 28–34. [Google Scholar] [CrossRef]
  19. Casaló, L.V.; Escario, J.J. Heterogeneity in the association between environmental attitudes and pro-environmental behavior: A multilevel regression approach. J. Clean. Prod. 2018, 175, 155–163. [Google Scholar] [CrossRef]
  20. Grebitus, C.; Van Loo, E. Relationship between cognitive and affective processes, and willingness to pay for pesticide-free and GMO-free labeling. Agric. Econ. 2021, 53, 407–421. [Google Scholar] [CrossRef]
  21. Guagnano, G.A.; Stern, P.C.; Dietz, T. Influences on attitude-behavior relationships: A natural experiment with curbside recycling. Environ. Behav. 1995, 27, 699–718. [Google Scholar] [CrossRef]
  22. Halkos, G.; Matsiori, S. Environmental attitude, motivations and values for marine biodiversity protection. J. Behav. Exp. Econ. 2017, 69, 61–70. [Google Scholar] [CrossRef]
  23. Okumah, M.; Martin-Ortega, J.; Novo, P.; Chapman, P.J. Revisiting the Determinants of Pro-Environmental Behaviour to Inform Land Management Policy: A Meta-Analytic Structural Equation Model Application. Land 2020, 9, 135. [Google Scholar] [CrossRef]
  24. Paço, A.; Lavrador, T. Environmental knowledge and attitudes and behaviors towards energy consumption. J. Environ. Manag. 2017, 197, 384–392. [Google Scholar] [CrossRef] [PubMed]
  25. Sheeran, P.; Abraham, C. The health belief model. In Predicting Health Behaviour: Research and Practice with Social Cognition Models; Conner, M., Norman, P., Eds.; Open University Press: London, UK, 1996; pp. 23–61. [Google Scholar]
  26. Nielsen, K.S. From prediction to process: A self-regulation account of environmental behavior change. J. Environ. Psychol. 2017, 51, 189–198. [Google Scholar] [CrossRef]
  27. Langenbach, B.P.; Berger, S.; Baumgartner, T.S.; Knoch, D. Cognitive Resources Moderate the Relationship between Pro-Environmental Attitudes and Green Behavior. Environ. Behav. 2020, 52, 979–995. [Google Scholar] [CrossRef]
  28. Baron, R.M.; Kenny, D.A. The moderator–mediator variable distinction in social psychological research: Conceptual, strategic, and statistical considerations. J. Pers. Soc. Psychol. 1986, 51, 1173–1182. [Google Scholar] [CrossRef] [PubMed]
  29. Brader, T.; Valentino, N.A.; Suhat, E. What Triggers Public Opposition to Immigration? Anxiety, Group Cues, and Immigration. Am. J. Political Sci. 2008, 52, 959–978. [Google Scholar] [CrossRef]
  30. Bofah, E.A.; Hannula, M.S. Perceived Social Support Network and achievement: Mediation by Motivational Beliefs and Moderation by Gender. In Affect and Mathematics Education; Hannula, M., Leder, G., Morselli, F., Vollstedt, M., Zhang, Q., Eds.; ICME-13 Monographs; Springer: Cham, Switzerland, 2019; pp. 107–136. [Google Scholar] [CrossRef]
  31. Imai, K.; Keele, L.; Tingley, D.; Yamamoto, T. Unpacking the Black Box: Learning about Causal Mechanisms from Experimental and Observational Studies. Am. Political Sci. Rev. 2011, 105, 765–789. [Google Scholar] [CrossRef]
  32. Lange, F. Behavioral paradigms for studying pro-environmental behavior: A systematic review. Behav. Res. Methods 2023, 55, 600–622. [Google Scholar] [CrossRef] [PubMed]
  33. Robins, J.M. Semantics of causal DAG models and the identification of direct and indirect effects. In Highly Structured Stochastic Systems; Green, P.J., Hjort, N.L., Richardson, S., Eds.; Oxford Univ. Press: Oxford, UK, 2003; pp. 70–82. [Google Scholar]
  34. Robins, J.M.; Greenland, S. Identifiability and exchangeability for direct and indirect effects. Epidemiology 1992, 3, 143–155. [Google Scholar] [CrossRef] [PubMed]
  35. VanderWeele, T.J. Concerning the consistency assumption in causal inference. Epidemiology 2009, 20, 880–883. [Google Scholar] [CrossRef]
  36. Hernán, M.A.; Robins, J.M. Causal Inference: What If; Chapman & Hall/CRC: Boca Raton, FL, USA, 2020; Available online: https://www.hsph.harvard.edu/miguel-hernan/causal-inference-book (accessed on 1 February 2021).
  37. Imai, K.; Keele, L.; Tingley, D. A General Approach to Causal Mediation Analysis. Psychol. Methods 2010, 15, 309–334. [Google Scholar] [CrossRef]
  38. MacKinnon, D.P. Introduction to Statistical Mediation Analysis; Taylor & Francis: New York, NY, USA, 2008; p. 488. [Google Scholar]
  39. Imai, K.; Keele, T.; Yamamoto, T. Identification, Inference, and Sensitivity Analysis for Causal Mediation Effects. Stat. Sci. 2010, 25, 51–71. [Google Scholar] [CrossRef]
  40. Hernán, M.A. Causal analyses of existing databases: No power calculations required. J. Clin. Epidemiol. 2022, 144, 203–205. [Google Scholar] [CrossRef] [PubMed]
  41. Listl, S.; Jürges, H.; Watt, R.G. Causal inference from observational data. Community Dent. Oral Epidemiol. 2016, 44, 409–415. [Google Scholar] [CrossRef] [PubMed]
  42. Rubin, D. The design versus the analysis of observational studies for causal effects: Parallels with the design of randomized trials. Stat. Med. 2006, 26, 20–36. [Google Scholar] [CrossRef] [PubMed]
  43. Everitt, B.S.; Dunn, G. Applied Multivariate Data Analysis, 2nd ed.; Arnold: London, UK, 2001; p. 342. [Google Scholar] [CrossRef]
  44. Greenacre, M.J. Correspondence Analysis in Practice; Academic Press: London, UK, 1993. [Google Scholar]
  45. Hayes, A. Introduction to Mediation, Moderation, and Conditional Process Analysis: A Regression-Based Approach; The Guilford Press: New York, NY, USA, 2013; pp. 3–4. [Google Scholar]
  46. Pearl, J. The causal foundations of structural equation modeling. In Handbook of Structural Equation Modelling; Hoyle, R.H., Ed.; The Guildford Press: New York, NY, USA, 2012; pp. 68–91. [Google Scholar]
  47. Liu, P.; Teng, M.; Han, C. How does environmental knowledge translate into pro-environmental behaviors?: The mediating role of environmental attitudes and behavioral intentions. Sci. Total Environ. 2020, 728, 138126. [Google Scholar] [CrossRef] [PubMed]
  48. Rauwald, K.S.; Moore, C.F. Environmental attitudes as predictors of policy support across three countries. Environ. Behav. 2002, 34, 709–739. [Google Scholar] [CrossRef]
  49. VanderWeele, T.J. A unification of mediation and interaction. A 4-way decomposition. Epidemiology 2014, 25, 749–761. [Google Scholar] [CrossRef] [PubMed]
  50. VanderWeele, T.J. Explanation in Causal Inference: Methods for Mediation and Interaction; Oxford University Press: New York, NY, USA, 2015. [Google Scholar]
  51. Pearl, J. Direct and indirect effects. In Proceedings of the Seventeenth Conference on Uncertainty in Artificial Intelligence; Breese, J.S., Koller, D., Eds.; Morgan Kaufman: San Francisco, CA, USA, 2001; pp. 411–420. [Google Scholar]
  52. Imai, K.; Yamamoto, T. Identification and Sensitivity Analysis for Multiple Causal Mechanisms: Revisiting Evidence from Framing Experiments. Polit. Anal. 2013, 21, 141–171. [Google Scholar] [CrossRef]
  53. R Core Team. R: A Language and Environment for Statistical Computing; R Foundation for Statistical Computing: Vienna, Austria, 2014; Available online: https://www.R-project.org (accessed on 15 June 2021).
  54. Tingley, D.; Yamamoto, T.; Hirose, K.; Keele, L.; Imai, K. Mediation: R Package for Causal Mediation Analysis. J. Stat. Softw. 2014, 59, 1–38. [Google Scholar] [CrossRef]
Figure 1. Basic causal diagram (DAG_1).
Land 13 01229 g001
Figure 2. Causal diagram with a confounder (Co) (DAG_2).
Land 13 01229 g002
Table 1. Relationship between environmental concern and pro-environmental behavior.
Pro-Environmental
Behavior
Environmental Concern as the Treatment or Exposure Variable
NothingLittleMuch
Meanstd. dev.Meanstd. dev.Meanstd. dev.
PEB [min = 3; max = 38]15.746.0317.705.4920.064.89
N (3300 obs.)110011001100
χ2 Pearson’s test = 486.75; Pr. = 0.000; correlate = 0.30 *
* = 0.05 level of significance. Test under the null hypothesis of independence between the variables.
Table 2. Associations and correlations between environmental awareness dimensions.
VariablesStatisticsConative Dimension
[Mediator (M)]
Cognitive Dimension
[Confounder (C0)]
Affective dimension
(T)
χ2 Pearson’s test 1474.71 (pr. = 0.000)495.58 (pr. = 0.000)
Correlate0.35 *0.36 *
PEB (Y) (outcome)
(active dimension)
χ2 Pearson’s test 1760.42 (pr. = 0.000)290 (pr. = 0.000)
Correlate0.29 *0.24 *
Conative dimension
(M)
χ2 Pearson’s test 1-219,22 (pr. = 0.000)
Correlate-0.21 *
* = 0.05 level of significance. 1 test under the null hypothesis of independence between the variables.
Table 3. Causal mediation analysis, Quasi-Bayesian Confidence Intervals5. Random subsample.
Causal Effects
under Different
Hypothesis
DAG_1 DAG_2
no Confounder (no Cognitive), no Covariateswith Confounder (Cognitive), no Covariates
Estimate
(1)
95% CI
(2)
p-Value
(3)
Estimate
(4)
95% CI
(5)
p-Value
(6)
A. Estimations under the hypothesis of simple treatment and control conditions, i. e., the lowest level of affection (1) vs. the other two conditions (average)
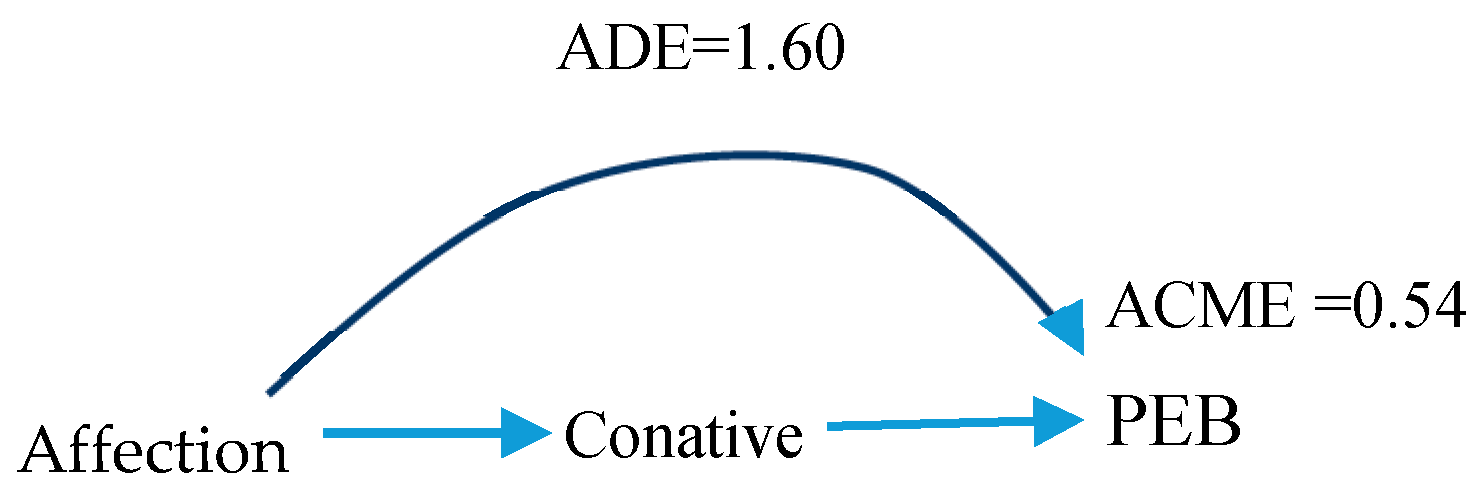
ACME0.54 [0.47–0.63]<2 × 10⁻¹⁶ ***0.44[0.34–0.52]<2 × 10⁻¹⁶ ***
ADE1.60[1.34–1.81]<2 × 10⁻¹⁶ ***1.31[1.05–1.52]<2 × 10⁻¹⁶ ***
TE2.14[1.90–2.43]<2 × 10⁻¹⁶ ***1.75[1.52–1.96]<2 × 10⁻¹⁶ ***
PM0.25[0.21–0.31]<2 × 10⁻¹⁶ ***0.25[0.19–0.30]<2 × 10⁻¹⁶ ***
B. Estimations under the hypothesis of the lowest value of the treatment as control (=1 = the lowest level of concern) compares to the highest level of the exposure (treatment = 3 = level of concern)
ACME1.07[0.89–1.31]<2 × 10⁻¹⁶ ***0.88[0.71–1.10]<2 × 10⁻¹⁶ ***
ADE3.26[2.79–3.72]<2 × 10⁻¹⁶ ***2.65[2.21–3.20]<2 × 10⁻¹⁶ ***
TE4.33[3.89–4.82]<2 × 10⁻¹⁶ ***3.54[3.10–4.05]<2 × 10⁻¹⁶ ***
PM0.24[0.20–0.31]<2 × 10⁻¹⁶ ***0.25[0.18–0.31]<2 × 10⁻¹⁶ ***
C. Estimations under the hypothesis of the intermediate value of the treatment as control (=2 = intermediate level of concern) compares to the highest level of the exposure (treatment = 3 = level of concern)
ACME0.53[0.43–0.64]<2 × 10⁻¹⁶ ***0.45[0.37–0.56]<2 × 10⁻¹⁶ ***
ADE1.61[1.33–1.84]<2 × 10⁻¹⁶ ***1.33[1.12–1.58]<2 × 10⁻¹⁶ ***
TE2.14[1.91–2.38]<2 × 10⁻¹⁶ ***1.78[1.57–2.02]<2 × 10⁻¹⁶ ***
PM0.24[0.20–0.30]<2 × 10⁻¹⁶ ***0.25[0.20–0.32]<2 × 10⁻¹⁶ ***
Sample3300 obs.
Adjusted for covariates: income, household type, education, age, and size of the municipality:
D. Estimations under the hypothesis of the lowest value of the treatment as control (=1 = the lowest level of concern) compares to the highest level of the exposure (treatment = 3 = level of concern)
ACME1.04[0.82–1.29]<2 × 10⁻¹⁶ ***0.96[0.76–1.15]<2 × 10⁻¹⁶ ***
ADE2.60[2.14–3.10]<2 × 10⁻¹⁶ ***2.24[1.63–2.78]<2 × 10⁻¹⁶ ***
TE3.64[3.16–4.16]<2 × 10⁻¹⁶ ***3.21[2.63–3.76]<2 × 10⁻¹⁶ ***
PM0.28[0.22–0.36]<2 × 10⁻¹⁶ ***0.29[0.23–0.39]<2 × 10⁻¹⁶ ***
E. Estimations under the hypothesis of the intermediate value of the treatment as control (=2 = intermediate level of concern) compares to the highest level of the exposure (treatment = 3 = level of concern)
ACME0.52[0.42–0.63]<2 × 10⁻¹⁶ ***0.47[0.37–0.58]<2 × 10⁻¹⁶ ***
ADE1.29[1.00–1.59]<2 × 10⁻¹⁶ ***1.10[0.79–1.40]<2 × 10⁻¹⁶ ***
TE1.81[1.57–2.13]<2 × 10⁻¹⁶ ***1.57[1.26–1.92]<2 × 10⁻¹⁶ ***
PM0.28[0.23–0.38]<2 × 10⁻¹⁶ ***0.30[0.24–0.37]<2 × 10⁻¹⁶ ***
Sample3300
ACME = average causal mediation effect (indirect effect); ADE= average direct effect; TE = total effect; PM = proportion of the total effect mediated; [ T E = τ i = δ i ( t ) + γ i ( 1 t ) ] ;   [ A C M E δ i ( t )   Y i ( t 1 ,   M i ( t 1 ) ) Y i ( t 0 ,   M i ( t 0 ) )   ] ; [ A D E   γ i ( 1 t ) ]   w h e r e   t 1   t 0   ; and the control. value sets to t 0   , and the treat.value sets t 1 ; T = treatment = affective dimension that takes the values 1, 2, and 3; M = mediator = conative dimension; Y = outcome = PEB; Sig. codes: *** 0.001. Sim.:100. Results are similar to nonparametric bootstrap confidence intervals with the percentile method.
Table 4. Treatment and mediator interaction, adjusting for covariates in the outcome model.
Causal Effects DAG_1 DAG_2
Estimate
(1)
95% CI
(2)
p-Value
(3)
Estimate
(4)
95% CI
(5)
p-Value
(6)
ACME [control]0.71[0.48–0.93]<2 × 10⁻¹⁶ ***0.65[0.42–0.88]<2 × 10⁻¹⁶ ***
ACME [treated]0.60[0.47–0.78]<2 × 10⁻¹⁶ ***0.55[0.40–0.70]<2 × 10⁻¹⁶ ***
ADE [control]1.48[1.10–1.94]<2 × 10⁻¹⁶ ***1.32[0.98–1.72]<2 × 10⁻¹⁶ ***
ADE [treated]1.38[1.05–1.75]<2 × 10⁻¹⁶ ***1.22[0.94–1.57]<2 × 10⁻¹⁶ ***
TE 2.09[1.61–2.59]<2 × 10⁻¹⁶ ***1.87[1.49–2.33]<2 × 10⁻¹⁶ ***
PM [control]0.34[0.26–0.42]<2 × 10⁻¹⁶ ***0.35[0.24–0.42]<2 × 10⁻¹⁶ ***
PM [treated]0.29[0.23–0.36]<2 × 10⁻¹⁶ ***0.29[0.23–0.36]<2 × 10⁻¹⁶ ***
ACME [average]0.66[0.48–0.86]<2 × 10⁻¹⁶ ***0.60[0.41–0.79]<2 × 10⁻¹⁶ ***
ADE [average]1.43[1.08–1.85]<2 × 10⁻¹⁶ ***1.27[0.96–1.65]<2 × 10⁻¹⁶ ***
PM [average]0.31[0.25–0.39]<2 × 10⁻¹⁶ ***0.32[0.24–0.38]<2 × 10⁻¹⁶ ***
TMint-test for the null hypothesis, [(ACME (3)) − (ACME (1)) = 0]; N = 2629 Obs.
(ACME (3)) − (ACME (1)) = −0.10, p-value = 0.1; alternative hypothesis: true ACME (3) − ACME (1) is not equal to 95 percent confidence interval: [−0.20; 0.018](ACME (3)) − (ACME (1)) = −0.09, p-value = 0.04; alternative hypothesis: true ACME (3) − ACME (1) is not equal to 95 percent confidence interval: [−0.18; −0.003]
ACME = average causal mediation effect (indirect effect); ADE = average direct effect; TE = total effect; PM = proportion of the total effect mediated. Sign. codes: *** 0.001. Sims.: 100. The covariates are considered (income, household type, education, age and size of the municipality).
Table 5. Moderated mediation of the covariates, using modmed test.
Covariates/
Moderators
DAG_1DAG_2
Average Effects for the Average
Treatment (Worry) Level
Adjusting for Treatment (Worry) to the Highest Level (t = 3)Modmed-Test on Average(5)Average Effects for the Average
Treatment (Worry) Level
Adjusting for Treatment (Worry) to the Highest Level (t = 3) Modmed-Test on Average
(10)
ACME
(1)
ADE
(2)
ACME
(3)
ADE
(4)
Diff1
Diff2
ACME
(6)
ADE
(7)
ACME
(8)
ADE
(9)
Diff1
Diff2
Income (mean)0.51 ***1.24 ***1.56 ***3.72 ***Income:
D i f f 1 4 1 = 0.60; [0.10]
CI [0.95] = [−0.65; 0.81]
D i f f 2 4 1 = 2.58 ; [2.2 × 10⁻¹⁶]
CI [0.95] = [−1.08; 3.13]
0.46 ***1.10 ***1.40 ***3.27 ***Income:
D i f f 1 4 1 = 0.14; [0.24]
CI [0.95] = [−0.10; 0.39]
D i f f 2 4 1 = 0.99; [0.02]
CI [0.95] = [−0.10; 0.39]
1. Income_Low0.56 ***1.53 ***1.73 ***4.56 ***0.51 ***1.40 ***1.53 ***4.17 ***
4. Income_High0.39 ***0.601.13 ***1.710.34 ***0.381.06 ***1.14 ***
Age
(average)
0.54 ***1.23 ***1.62 ***3.78 ***Age:
D i f f 1 > 55 < 55 = −0.07: [0.44]
CI [0.95] = [−0.25; 0.13]
D i f f 2 > 55 < 55 = 0.28; [0.30]
CI [0.95] = [−0.14; 0.71]
0.48 ***1.10 ***1.48 ***3.27 ***Age:
D i f f 1 > 55 < 55 = −0.06; [0.42]
CI [0.95] = [−0.30; 0.14]
D i f f 2 > 55 < 55 = 0.29 ; [0.26]
CI [0.95] = [−0.17; 0.75]
Age<550.54 ***1.14 ***1.58 ***3.58 ***0.47 ***0.93 ***1.43 ***2.96 ***
Age>550.45 ***1.42 ***1.37 ***4.32 ***0.41 ***1.211.20 ***3.71 ***
Householdt (mean)0.51 ***1.28 ***1.57 ***3.75 ***Household type:
D i f f 1 3 2 = 0.021; [0.72]
CI [0.95] = [−0.13; 0.15]
D i f f 2 3 2 = 0.22; [0.32]
CI [0.95] = [−0.15; 0.65]
0.47 ***1.11 ***1.43 ***3.31 ***Household type:
D i f f 1 3 2 = 0.03; [0.66]
CI [0.95] = [−0.13; 0.17]
D i f f 2 3 2 = 0.259; [0.30]
CI [0.95] = [−0.15; 0.73]
1. Househt,one person0.54 ***1.55 ***1.64 ***4.68 ***0.48 ***1.40 ***1.47 ***4.37 ***
2. Househt,couple0.52 ***1.31 ***1.57 ***3.94 ***0.48 ***1.17 ***1.45 ***3.56 ***
3. Househt,parents, children0.50 ***1.10 ***1.51 ***3.36 ***0.44 ***0.92 ***1.36 ***2.78 ***
4. Househt,other people0.49 ***0.92 ***1.44 ***2.70 ***0.43 ***0.66 *1.30 ***1.92 *
Education (mean)0.51 ***1.25 ***1.55 ***3.75 ***Education:
D i f f 1 2 1 = −0.11; [0.48]
CI [0.95] = [−0.38; 0.16]
D i f f 2 2 1 =   −0.57; [0.16]
CI [0.95] = [−1.21; 0.12]
D i f f 1 3 1 = −0.19; [0.10]
CI [0.95] = [−0.39; 0.03]
D i f f 2 3 1 = −1.22; [2.2 × 10⁻¹⁶]
CI [0.95]= [−1.83; −0.49]
D i f f 1 3 2 = −0.10; [0.24]
CI [0.95] = [−0.27; 0.03]
D i f f 2 3 2 = 0.58 ; [0.06]
CI [0.95] = [−0.99; 0.05]
0.46 ***0.11 ***1.41 ***3.31 ***Education:
D i f f 1 2 1 = −0.07; [0.56]
CI [0.95] = [−0.29; 0.13]
D i f f 2 2 1 = −0.63; [0.10]
CI [0.95] = [−1.39; 0.18]
D i f f 1 3 1 = −0.19; [0.12]
CI [0.95] = [−0.44; 0.08]
D i f f 2 3 1 = −1.26; [2.2 × 10⁻¹⁶]
CI [0.95] = [−2.02; −0.60] D i f f 1 3 2 = −0.11; [0.14]
CI [0.95] = [−0.26; 0.03] D i f f 2 3 2 = −0.57; [0.02]
CI [0.95] = [−1.09; −0.06]
1. Edu_university0.36 ***0.261.06 ***0.910.33 ***0.120.99 ***0.31
2. Edu_Bacc. + voc.1.35 ***2.71 ***1.35 ***2.71 ***0.40 ***0.73 ***1.25 ***2.26 ***
3. Edu_Illit. + prim.0.55 ***1.49 ***1.68 ***4.50 ***0.51 ***1.35 ***1.52 ***4.00 ***
Municipal size (mean)1.56 ***3.80 ***1.56 ***3.83 ***Municipality size:
D i f f 1 5 1 = −0.049; [0.64]
CI [0.95] = [−0.26; 0.17]
D i f f 2 5 1 = 0.049; [0.86]
CI [0.95] = [−0.47; 0.57]
D i f f 1 3 2 = 0.001; [0.98]
CI [0.95] = [−0.14; 0.13]
D i f f 2 3 2 = 0.017; [0.92]
CI [0.95] = [−0.43; 0.36]
D i f f 1 5 4 = −0.02; [0.78]
CI [0.95] = [−0.27; 0.18]
D i f f 2 5 4 = 0.033 ; [0.84]
CI [0.95] = [−0.50; 0.49]
0.48 ***1.10 ***1.43 ***3.29 ***Municipality size:
D i f f 1 5 1 = −0.03; [0.74]
CI [0.95] = [−0.24; 0.16]
D i f f 2 5 1 = 0.08; [0.80]
CI [0.95] = [−0.53; 0.64]
D i f f 1 4 2 = −0.02; [0.66]
CI [0.95] = [−0.16; 0.12]
D i f f 2 4 2 = 0.05; [0.84]
CI [0.95] = [−0.33; 0.44]
D i f f 1 5 4 = −0.03; [0.76]
CI [0.95] = [−0.26; 0.15]
D i f f 2 5 4 = 0.02; [0.99]
CI [0.95] = [−0.55; 0.59]
1. >100,0000.48 ***1.29 ***1.48 ***3.97 ***0.44 ***1.13 ***1.33 ***3.44 ***
2. [50,000–100,000]0.50 ***1.29 ***1.51 ***3.82 ***0.45 ***1.11 ***1.40 ***3.35 ***
3. [20,000–50,000]0.52 ***1.26 ***1.54 ***3.80 ***0.46 ***1.11 ***1.41 ***3.36 ***
4. [10,000–20,000]0.53 ***1.25 ***1.60 ***3.77 ***0.49 ***1.05 ***1.45 ***3.29 ***
5. <10,0000.55 ***1.22 ***1.63 ***3.70 ***0.51 ***1.05 ***1.51 ***3.19 ***
Sample2629
ACME = average causal mediation effect; ADE = average direct effect; modmed-tests for the null hypothesis are: Diff1 = [(ACME (cov.1)) − (ACME (cov.2)) = 0], and Diff2 = [(ADE (cov.1)) − (ADE (cov.2)) = 0]; [p-value > 0.05] means that the null hypothesis is rejected. Sign. codes: *** 0.001, * 0.05.
Disclaimer/Publisher’s Note: The statements, opinions and data contained in all publications are solely those of the individual author(s) and contributor(s) and not of MDPI and/or the editor(s). MDPI and/or the editor(s) disclaim responsibility for any injury to people or property resulting from any ideas, methods, instructions or products referred to in the content.

