Article

Optimizing Land Use to Mitigate Ecosystem Service Trade-Offs Using Multi-Scenario Simulation in the Luo River Basin

1
School of Surveying and Land Information Engineering, Henan Polytechnic University, Jiaozuo 454003, China
2
Research Centre of Arable Land Protection and Urban-Rural High-Quality Development of Yellow River Basin, Henan Polytechnic University, Jiaozuo 454003, China
3
School of Resources and Environment, Henan Polytechnic University, Jiaozuo 454003, China
*
Authors to whom correspondence should be addressed.
Land 2024, 13(8), 1243; https://doi.org/10.3390/land13081243
Submission received: 8 July 2024 / Revised: 1 August 2024 / Accepted: 7 August 2024 / Published: 8 August 2024

Abstract

:
For a long time in the past, China has implemented a large number of “Grain for Green” projects (GFGPs) to improve the ecological environment. However, it is still unclear whether excessive GFGPs will exacerbate the trade-off of ecosystem services (ESs). Additionally, it is a great challenge to explore the response mechanism of the trade-off relationship to changes in land use and to mitigate the trade-offs by optimizing land use. Taking a typical GFGP basin in the central Yellow River basin as an example, we identified the trade-off areas and measured the nonlinear trade-offs between ESs under different scenarios. This was carried out based on the synergistic potential of the production possibility frontier (PPF) and the first-order derivative. We also identified the optimal scenario for mitigating the trade-offs of ESs. The results showed that excessive GFGPs have intensified the ES trade-offs. The differences in land use types lead to spatial heterogeneity in the relationship of ESs. When carbon storage (CS) is 9.58 t/km2 and habitat quality (HQ) is 0.4, the relationship with water yield (WY) changes from trade-off to synergy, respectively, and the trade-off area is mainly distributed in cropland and construction land. Compared with 2020, the EP scenario has the highest synergy potential and the lowest trade-off intensity, and can alleviate the ES trade-off to the greatest extent.

1. Introduction

ESs are the utility of the natural environment on which humans rely for survival and maintenance. All benefits derived from the environment, whether indirect or immediate, are also referred to as ESs [1]. These ESs are affected by their diversity, natural factors, and human activities, and their relationship changes dynamically in spatial and temporal patterns [2]. Understanding trade-offs and synergies is important for attaining real growth that is sustainable [3].
Researchers have examined the temporal and spatial distribution of ESs [4,5] and the mechanisms of trade-offs and synergies [6]. Trade-off relationships are most common between provisioning and regulating services, and cultural and supporting services [7,8,9,10]. However, some research cases indicate synergies between provisioning and regulating services [11], and even similar services offer different relationship characteristics in other areas [12]. Qin’s study found that the synergistic effect between WY and crop production, and the trade-off effect between water storage and CS were the most significant in the Guanzhong-Tianshui Economic Zone [13]. Qiao’s study found trade-offs between freshwater supply, flood control, and regulating services in the Lake Tai basin [14]. Lan identifies trade-offs/synergies among provisioning, regulating, support, and cultural services, and the spatial heterogeneity of relationships between these services [15]. As time passes, trade-offs or synergies may vary [16,17]. Numerous studies have demonstrated improvements or degradations in areal trade-offs or synergies. As an illustration, synergies between NPP, WY, and soil conservation (SC) improved from 2000 to 2012 in the Sanjiangyuan area [18]. The primary causes of changes in ES trade-offs and synergies include geographic considerations as well as economic and social factors. The above studies show that ES trade-offs are highly complex. ES trade-off mitigation and optimization is a fundamental pathway for coordinating the multiple objectives of ecosystem management and achieving scientific decision-making in ecosystem management. Utilizing spatial simulation technology has become a popular approach for optimizing land use, offering a helpful framework for creating spatial planning. ESs are the aspects that are essential to human survival, and are created and preserved by ecosystems and ecological processes [19,20]. Scenario analysis can determine which scenarios maximize specific ESs and reveal potential differences in trade-offs between ESs at various temporal and geographical scales by setting up different reference scenarios that consider local conditions and incorporate the recommendations of researchers. Therefore, these analyses may assist decision-makers in making clear choices about management measures [21,22,23].
Most current research on the optimization of land-use patterns starts with specific ecological engineering approaches, including green engineering, to complete GFGPs and achieve a synergistic guarantee of food security and water conservation [24]. This involves optimizing ecological security patterns and landscape indices through planning constraints and multi-year land-use projections [25]. Finding sensible management solutions is a vital issue and involves optimizing ESs under different scenarios to address trade-offs between ESs arising from land use. Therefore, scenario simulations must be introduced to reconfigure land resources and optimize the spatial layout of land use [26,27]. Relevant studies have shown that, in the long term, ESs interact with each other and exhibit trade-off/synergistic relationships [28], but how the trade-off/synergistic relationship between ESs responds to land-use changes in different scenarios is unclear, and mitigating the trade-offs by optimizing land use is a major challenge for decision-makers. Meanwhile, ESs have strong spatial heterogeneity [29], and accurately identifying the trade-off areas of ecosystems is crucial for mitigating the strength of trade-offs in ESs and optimizing land use. The Luo River basin is at the forefront of China’s ecological civilization construction, and the basin’s GFGP area accounts for 48% of the fallowed area, which is a typical GFGP basin. However, there is a lack of research on the high complexity and spatial heterogeneity of trade-off/synergy relationships among ESs in GFGP basins, as well as a lack of trade-offs/synergies among ESs with different land covers, and on the characteristics of the nonlinear changes among ESs under multi-scenario differential studies.
In order to sort out the high complexity and spatial heterogeneity of trade-offs of ESs in GFGP basins, we take a typical basin in the middle reaches of the Yellow River as an example, and focus on revealing the characteristics of nonlinear changes of trade-offs/synergies among ESs based on the PPF curves and their first-order derivatives. Meanwhile, we find that the nonlinear changes in trade-offs/synergies are not a unilateral improvement or degradation in trade-offs or synergies, but involve the existence of a dynamic change in the relationship between trade-offs/synergies, shifting from trade-offs to synergies near a certain threshold. In addition, ESs can show diverse development trends due to natural environment changes, ecological conservation measures, and planning. Therefore, we explored the trade-off/synergistic effects of different land covers on ESs and the differentiation of nonlinear characteristics among ESs under different scenarios through a combination of multi-scenario simulation and PPF. We achieved three objectives based on the FLUS model and PPF: (1) Based on PPF curves and their first-order derivatives, we visualize the nonlinear change characteristics of the trade-off/synergy relationship among ESs, determine the threshold for ESs to change from trade-offs to synergies, and realize the trade-off/synergy partitioning. (2) Explore the differences caused by different land covers and different scenarios on the nonlinear characteristics of the trade-off/synergy relationship among ESs by combining multi-scenario simulation with PPF. (3) Specific scenarios were identified that could effectively mitigate the strength of the trade-offs between ESs, thereby implementing the optimal land use type configuration and spatial pattern distribution. This study can provide a reference for exploring the complexity and spatial heterogeneity of trade-off/synergistic relationships among ESs, analyzing the differentiation of nonlinear characteristics among ESs under multiple scenarios, and identifying optimal scenarios for mitigating the strength of trade-offs among ESs, which is of great significance for the realization of sustainability in the GFGP basin.

2. Materials and Methods

2.1. Study Area

The Luo River originates in Lantian County, Shaanxi Province, and Luanchuan County, Henan Province. The river is 447 km long, with a total area of 18,777 km2. The average perennial runoff is 1.399 billion m3. There are hills and mountains in the river’s higher stretches, with rocks rich in vegetation and grass and forests as the main vegetation. The basin is located at the junction of the second and third steps of China’s topography. The altitude of the Luo River basin varies greatly, with the high-altitude areas in the west belonging to the second of the three steps of China’s terrain, and the low-altitude areas in the east belonging to the third of the three steps of China’s terrain. It has a complex range of geomorphological types, with approximately 50.7% being mountainous, 39.9% hilly, and 9.4% plains. The basin is situated in the transition zone between the subtropical and warm temperate zones, and it falls within the continental monsoon climate zone. The average temperature ranges from 12 to 14 °C, with an average maximum precipitation of 600 to 900 mm. The majority of the precipitation occurs between the months of June and September. The basin spans the warm temperate deciduous broad-leaved forest area, subtropical deciduous broad-leaved forest area, and evergreen broad-leaved forest area, with diverse ecosystem types. The middle and upper reaches of the mountainous and hilly areas are mainly dominated by forests and grasslands, and the cultivated land is mainly distributed in river valleys, basins, and alluvial plains. The sloping cultivated land is an important part of the cultivated land, and the lower reaches of the river are alluvial plains, which are an important grain base in Henan Province. Since the comprehensive launch of the GFGPs, slope farmland reforestation has been the focus of ecological construction in the basin, and it is the representative basin of the fallow farmland reforestation project. With the acceleration of urbanization, the land use structure of the Luo River basin has changed significantly. A large amount of arable land and forest land has been encroached on by construction land in the past 20 years. Changes in land area, type, and pattern directly impact ESs. Unreasonable changes in land use structure are the main driver of the continuing ecological decline in the Luo River basin. Influenced by climate and human activities, the basin ecosystem is insufficiently safeguarded. The ecological environment is fragile, and the contradiction of ES trade-offs is prominent. This is typical for the study of ES trade-offs and optimization in the middle reaches of the Yellow River basin (Figure 1).

2.2. Data Source

Table S1 contains a list of all the data sources and the sources that were used. Land-use data were acquired from 1990 to 2021 and published by Professors Yang and Huang of Wuhan University (https://zenodo.org/record/8176941 (accessed on 7 April 2024)). The DEM data comes from the Geospatial data cloud (http://www.gscloud.cn (accessed on 7 April 2024)). The soil data comes from the World Soil Database (https://webarchive.iiasa.ac.at (accessed on 7 April 2024)). The precipitation data and the potential evapotranspiration data were gathered from the Spatial and Temporal Tripolar Environmental Big Data Platform (http://poles.tpdc.ac.cn/zh-hans/ (accessed on 7 April 2024)). The road network distribution data were gathered from Open Street Map (http://www.openstreetmap.org (accessed on 7 April 2024)).

2.3. Research Methods

ESs related to water resources are relatively prominent due to the dense distribution of the river network in the basin. However, the runoff from the basin has decreased and water resources are not sufficiently secure. Meanwhile, the study area is a typical GFGP basin, while the study area is a typical GFGP basin, with HQ and CS mainly originating from forests. Based on the basic characteristics of basin ecosystems and major ecological and environmental problems, and on the basis of an in-depth analysis of the formation mechanism of basin ESs, WY, and SC services related to water resources, HQ and CS services reflecting the basin ecological environment are selected. This study combines the InVEST model and PPF curves to identify the best scenario for optimizing land use to mitigate ES trade-offs. ESs were first assessed using the InVEST model and the USLE equation using data on land use types, rainfall, and soils [30]. We use PPF curves to study the nonlinear characteristics of trade-off/synergy [31], determine the ES trade-off region, and implement the trade-off/synergy visualization partition. Next, the FLUS model was used to predict the spatial layout of land use under multiple scenarios in the future [32]. By identifying the spatial heterogeneity of nonlinear changes in ecosystems and their trade-offs/synergies, we explored the characteristics of the response of the four services to land use changes under different scenarios. It is of great significance to alleviate ecosystem conflicts in the basin and improve the quality of the ecological environment (Figure 2).

2.3.1. Ecosystem Services Assessment

(1)
Water yield
The Luo River basin has a dense network of river systems and is rich in freshwater resources. The sprawl of urbanization has led to the conversion of many wetlands into urban and agricultural land, and industrial development has improved water consumption, resulting in a shortage of freshwater resources in the basin. One key measure of WY services is the overall quantity of water resources [33]. The formulas used for the evaluation of ESs are described in Supplementary S2.
(2)
Carbon storage
Ecosystems were assessed using the CS module of the InVEST model. The carbon module of the model uses each land use type as an assessment unit, and the mean density of four carbon reservoirs was multiplied by the area of each assessment unit to calculate carbon stock in the study area [34]. The formulas used for the evaluation of ESs are described in Supplementary S2.
(3)
Habitat quality
The InVEST model was applied to assess the HQ index of the Luo River basin. Threat factor sensitivity and threat intensity were determined to evaluate HQ of various land-use types [35].
(4)
Soil conservation
The primary factor causing degradation that humans depend on for survival is the breakdown of soil, which is becoming increasingly scarce. The overall benefit of conserving water and soil was calculated by determining the amount of soil erosion using three indicators: degradation in the amount of abandoned land, soil fertility, and the value of sediment deposition loss. Soil erosion was estimated using the USLE equation, which includes the rainfall element, surface cover element, soil erodibility element, soil and water conservation measures element, and topography element [36]. The formulas used for the evaluation of ESs are described in Supplementary S2.

2.3.2. Identification of Trade-Off Areas Based on Production Possibility Frontier

Based on Pearson’s correlation coefficient and GIS spatial computation, we assessed trade-offs between ESs. In this study, 1000 random points were created in the study area, and the values of different ESs at the random points were extracted for correlation analyses using the “Multi-finger Extraction to Points” tool. Based on the Pearson factor scores, the synergistic effects of trade-offs of ESs were measured and mapped [37]. The formulas used are described in Supplementary S2.
PPF is an economic model that represents the constraint curve between two variables [38]. Based on the Pareto efficiency criterion, the optimal joint point between ESs was determined to meet the Pareto efficiency criterion, and the PPF curve was formed. The points on the PPF curve are the optimal points between ESs in the study area, and the points inside are sub-optimal, and an improvement in one ES does not lead to a degradation in other ESs [39]. The formulas used are described in Supplementary S2.
The Pareto efficiency scheme requires determining the horizontal coordinate that corresponds to the maximum value of the vertical coordinate. In this study, CS and HQ were used as horizontal coordinates and WY as vertical coordinates, fitting PPF curves for different scenarios.
Based on the PPF, we identify the trade-off areas among the ESs in the extracted basins, then explore the synergistic potential of the PPFs of the ESs and changes in the intensity of the trade-offs and analyze the mechanism of the response of land use to the trade-offs. The synergistic potential reflects the potential of the two ESs to achieve better results [40]. The farther the PPF is from the origin, the higher the synergy potential. Quantifying the synergistic potential between Ess involves using the area enclosed by the PPF and the axes. The shortest distance between the point corresponding to the average value of the two ESs and the PPF curve represents the trade-off intensity index. The formulas used are described in Supplementary S2.

2.3.3. Scenario Setting

Based on the past land-use changes in the Luo River basin, the study set four development scenarios, namely natural development (ND: allow the interconversion of land use types), cropland protection (CP: restrictions on conversion of cropland to other land types), ecological protection (EP: restrictions on conversion of ecological land to cropland and constructed), and coordinated development (CD: the protection of ecological land is strengthened on the basis of the protection of cropland) (Figure 3). In the ND scenario, it is assumed that development trends, such as socio-economic trends, follow historical trends and do not change significantly. This is a representation of the current state of the basin as a baseline reference for other scenarios. In the CP scenario, the main consideration is the development trend of the overall ESs of the catchment and their trade-offs/synergies, provided that there is no loss of arable land. In the EP scenario, maximizing ES Positivity on the basis of guaranteeing that catchment supply services are not degraded, the focus is on ecological conservation to prevent ecological degradation and promote the development of various ESs. The CD scenario, at the same time, takes into account the protection of arable land and the prevention of ecological degradation, and promotes the moderate enhancement of the total amount of ESs on the basis of the moderate growth of the supply services of the basin, so as to achieve the basic coordination of the ecological functions of the basin.
The model simulates land-use changes under anthropogenic and natural influences and future land-use scenarios. The model’s underlying ideas come from cellular automata (CA) and are significantly better than those of conventional cellular automata [41]. When several land-use types are combined with the influence of both human activity and natural phenomena, such a mechanism can efficiently handle the ambiguity and complexity of those combinations. The FLUS model produces results that are close to the actual distribution of land use. The influence of natural and anthropogenic factors is considered in multicategory land-use change simulation [42]. Ten driving factors were selected from both natural and socioeconomic domains (Table S2 and Figure S1). Different transformation matrices were set according to different scenarios (Table S3) [43,44]. The corresponding value of the matrix was set to 0 when one site type was not allowed to be converted to another site type and to 1 when conversion was allowed. Neighborhood weights were used to consider the transfer probability of land-use types in conjunction with existing research results. With a parameter range of 0–1, the closer a neighborhood weight is to 1, the greater the land type’s capacity for expansion (Table S4). The study used the FLUS model to simulate 2020 data with 2010 land-use data and applied actual 2020 land data for validation. The validation results showed that the Kappa coefficient was 0.986, and the classification accuracy was 96.21%. This result indicated that the FLUS model meets the research needs and can simulate future land use in the Luo River basin.

3. Results

3.1. Spatial and Temporal Changes in Ecosystem Services

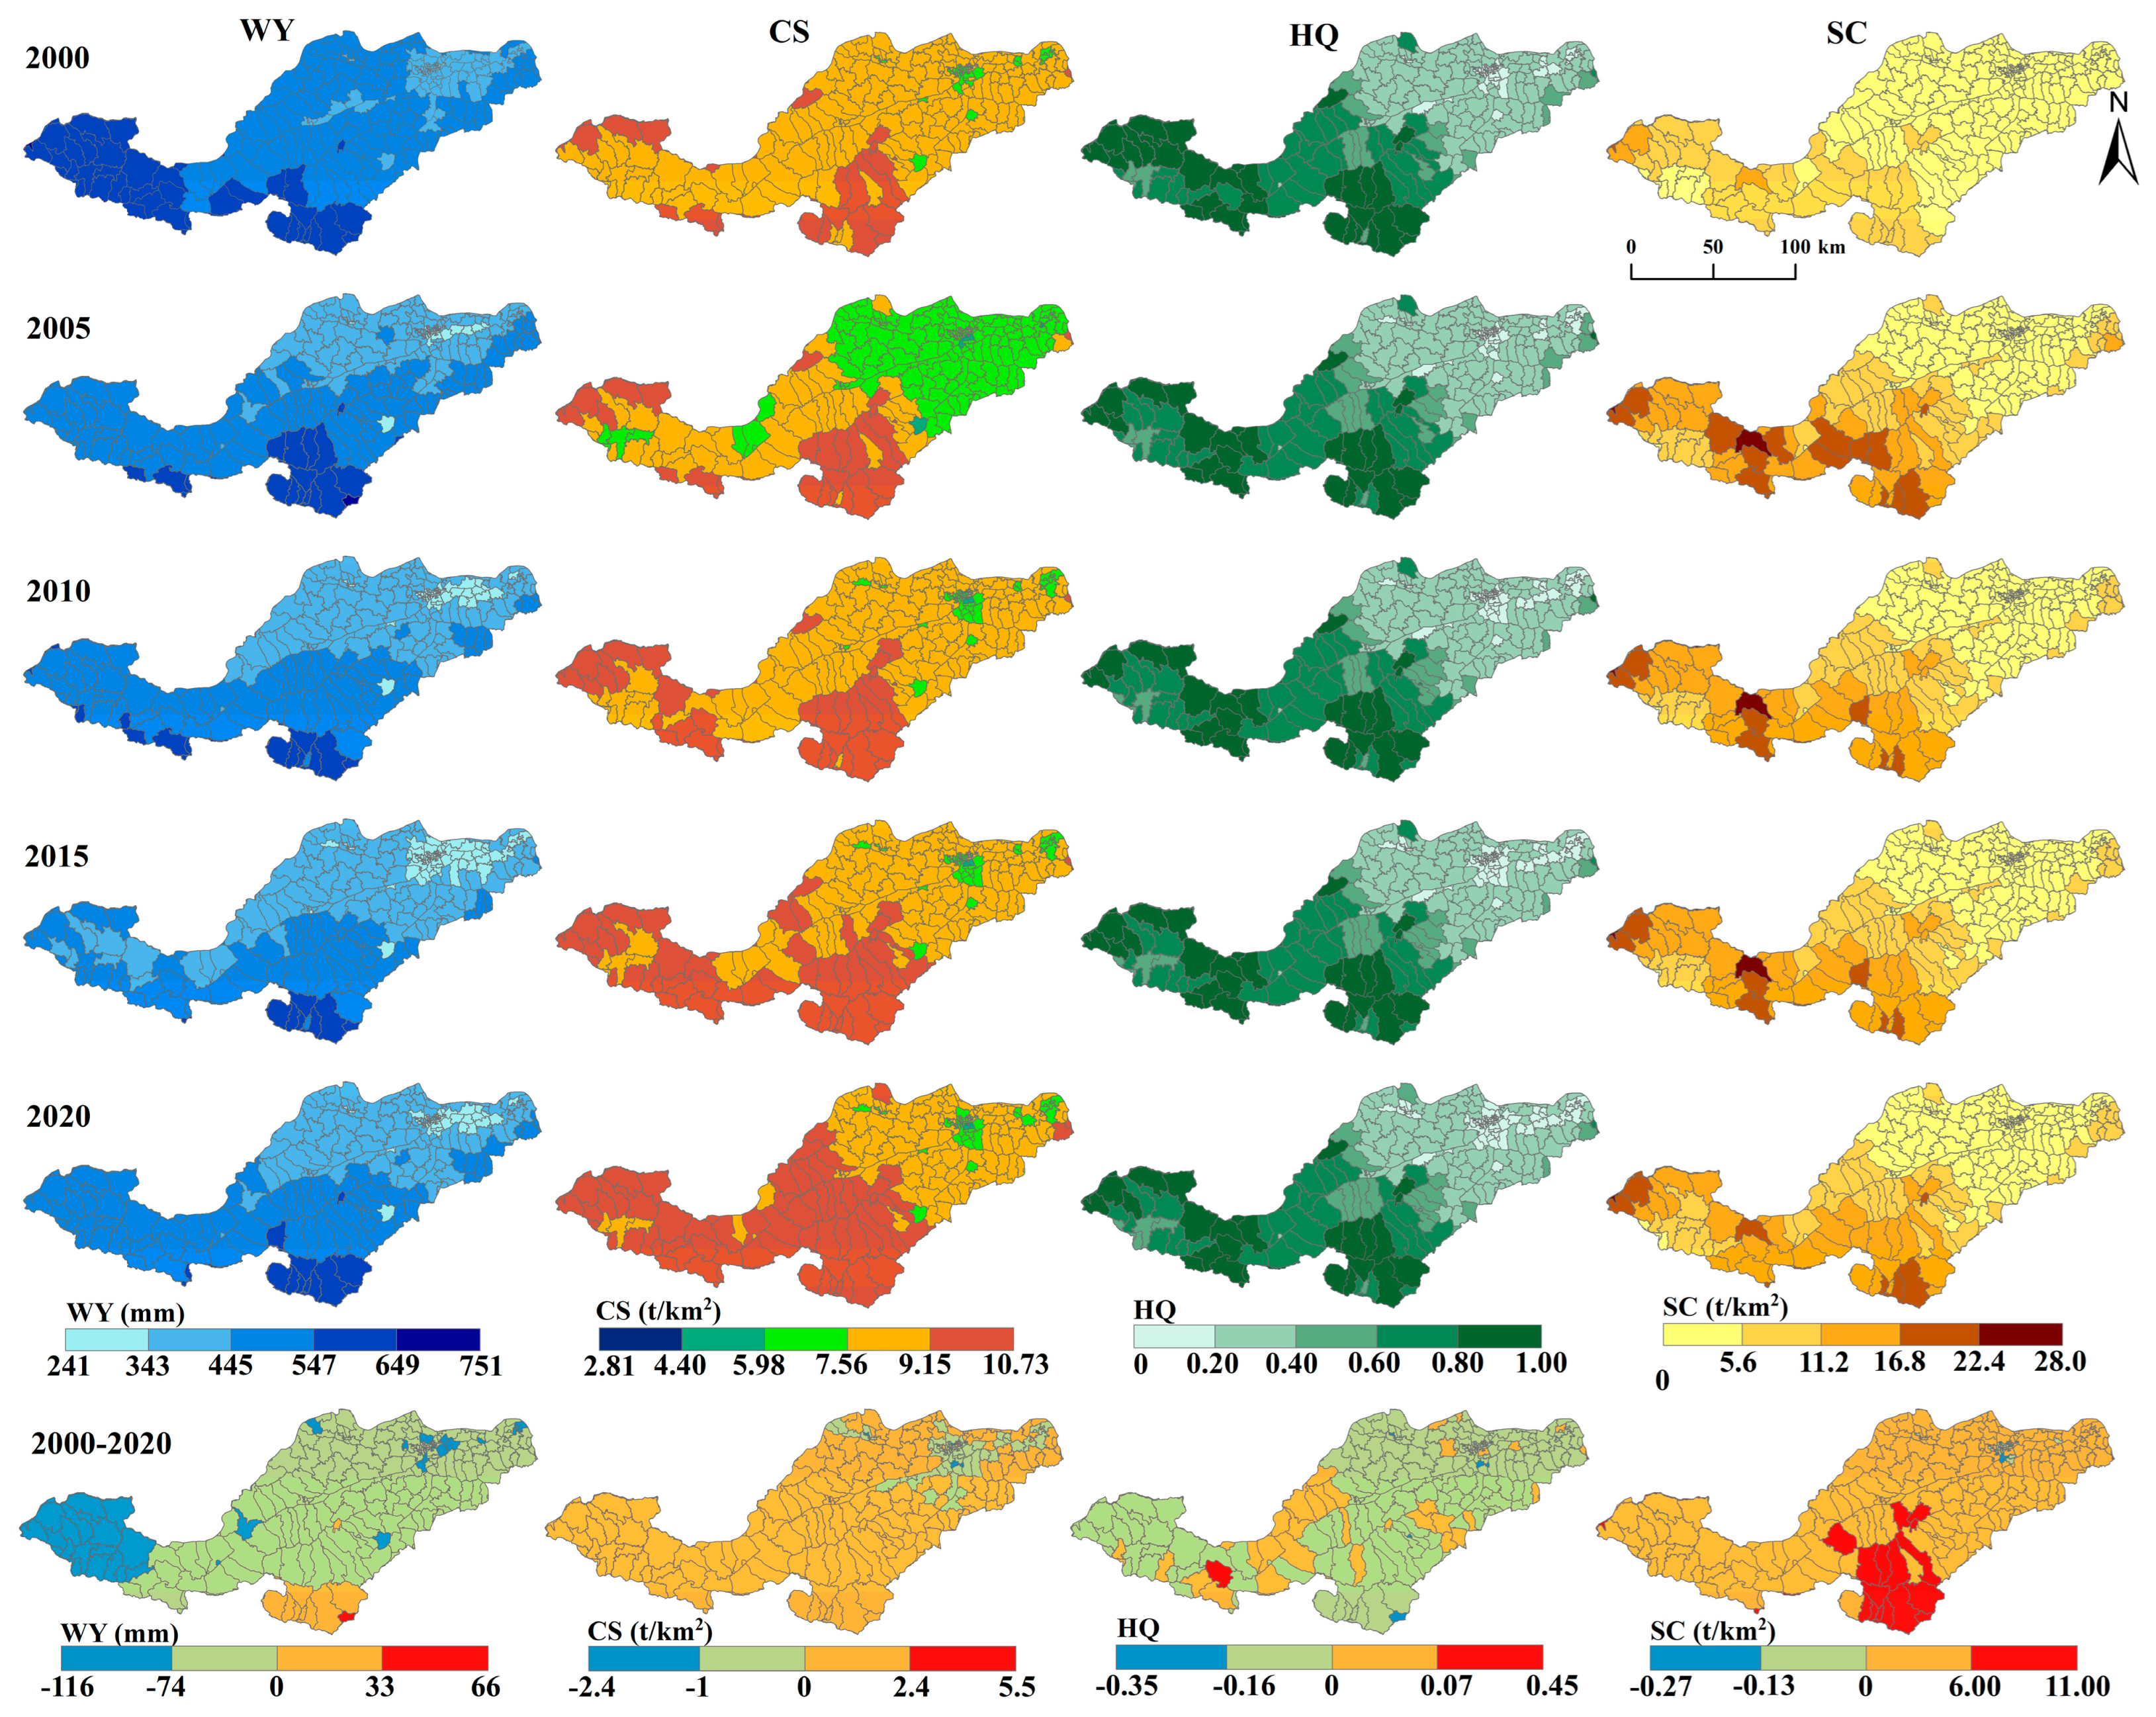
The ES supply in the Luo River basin presents spatial heterogeneity (Figure 4 and Figure S2). There was a general decreasing trend in WY, with a total degradation of 84.77 mm from 2000 to 2020, with the southern portion of the basin being home to the majority of the high-value sectors, and the northeast areas distributed the majority of low-value locations. With a total improvement of 0.68 t from 2000 to 2020, the general level of CS in the basin was high. HQ displays a pattern of spatial dispersion of “high in the southwest and low in the northeast”. There is a general upward trend in SC, with an improvement of 3.34 t from 2000 to 2020. The level of supply of the four services shows a distribution pattern of “high in the southwest and low in the northeast”. Between 2000 and 2020, WY shows a decreasing trend in most of the basin and degrades substantially in the western portion of the basin, showing only a small improvement in the southern portion. CS shows an increasing trend in most of the basin, with a decreasing trend only in the eastern portion of the basin, and is located primarily on construction land. HQ shows a decreasing trend in most of the basin and an increasing trend only in the center. SC showed a broad increasing trend, with a large improvement in the southern part of the basin.

3.2. Trade-Off Region Identification and Nonlinear Characterization

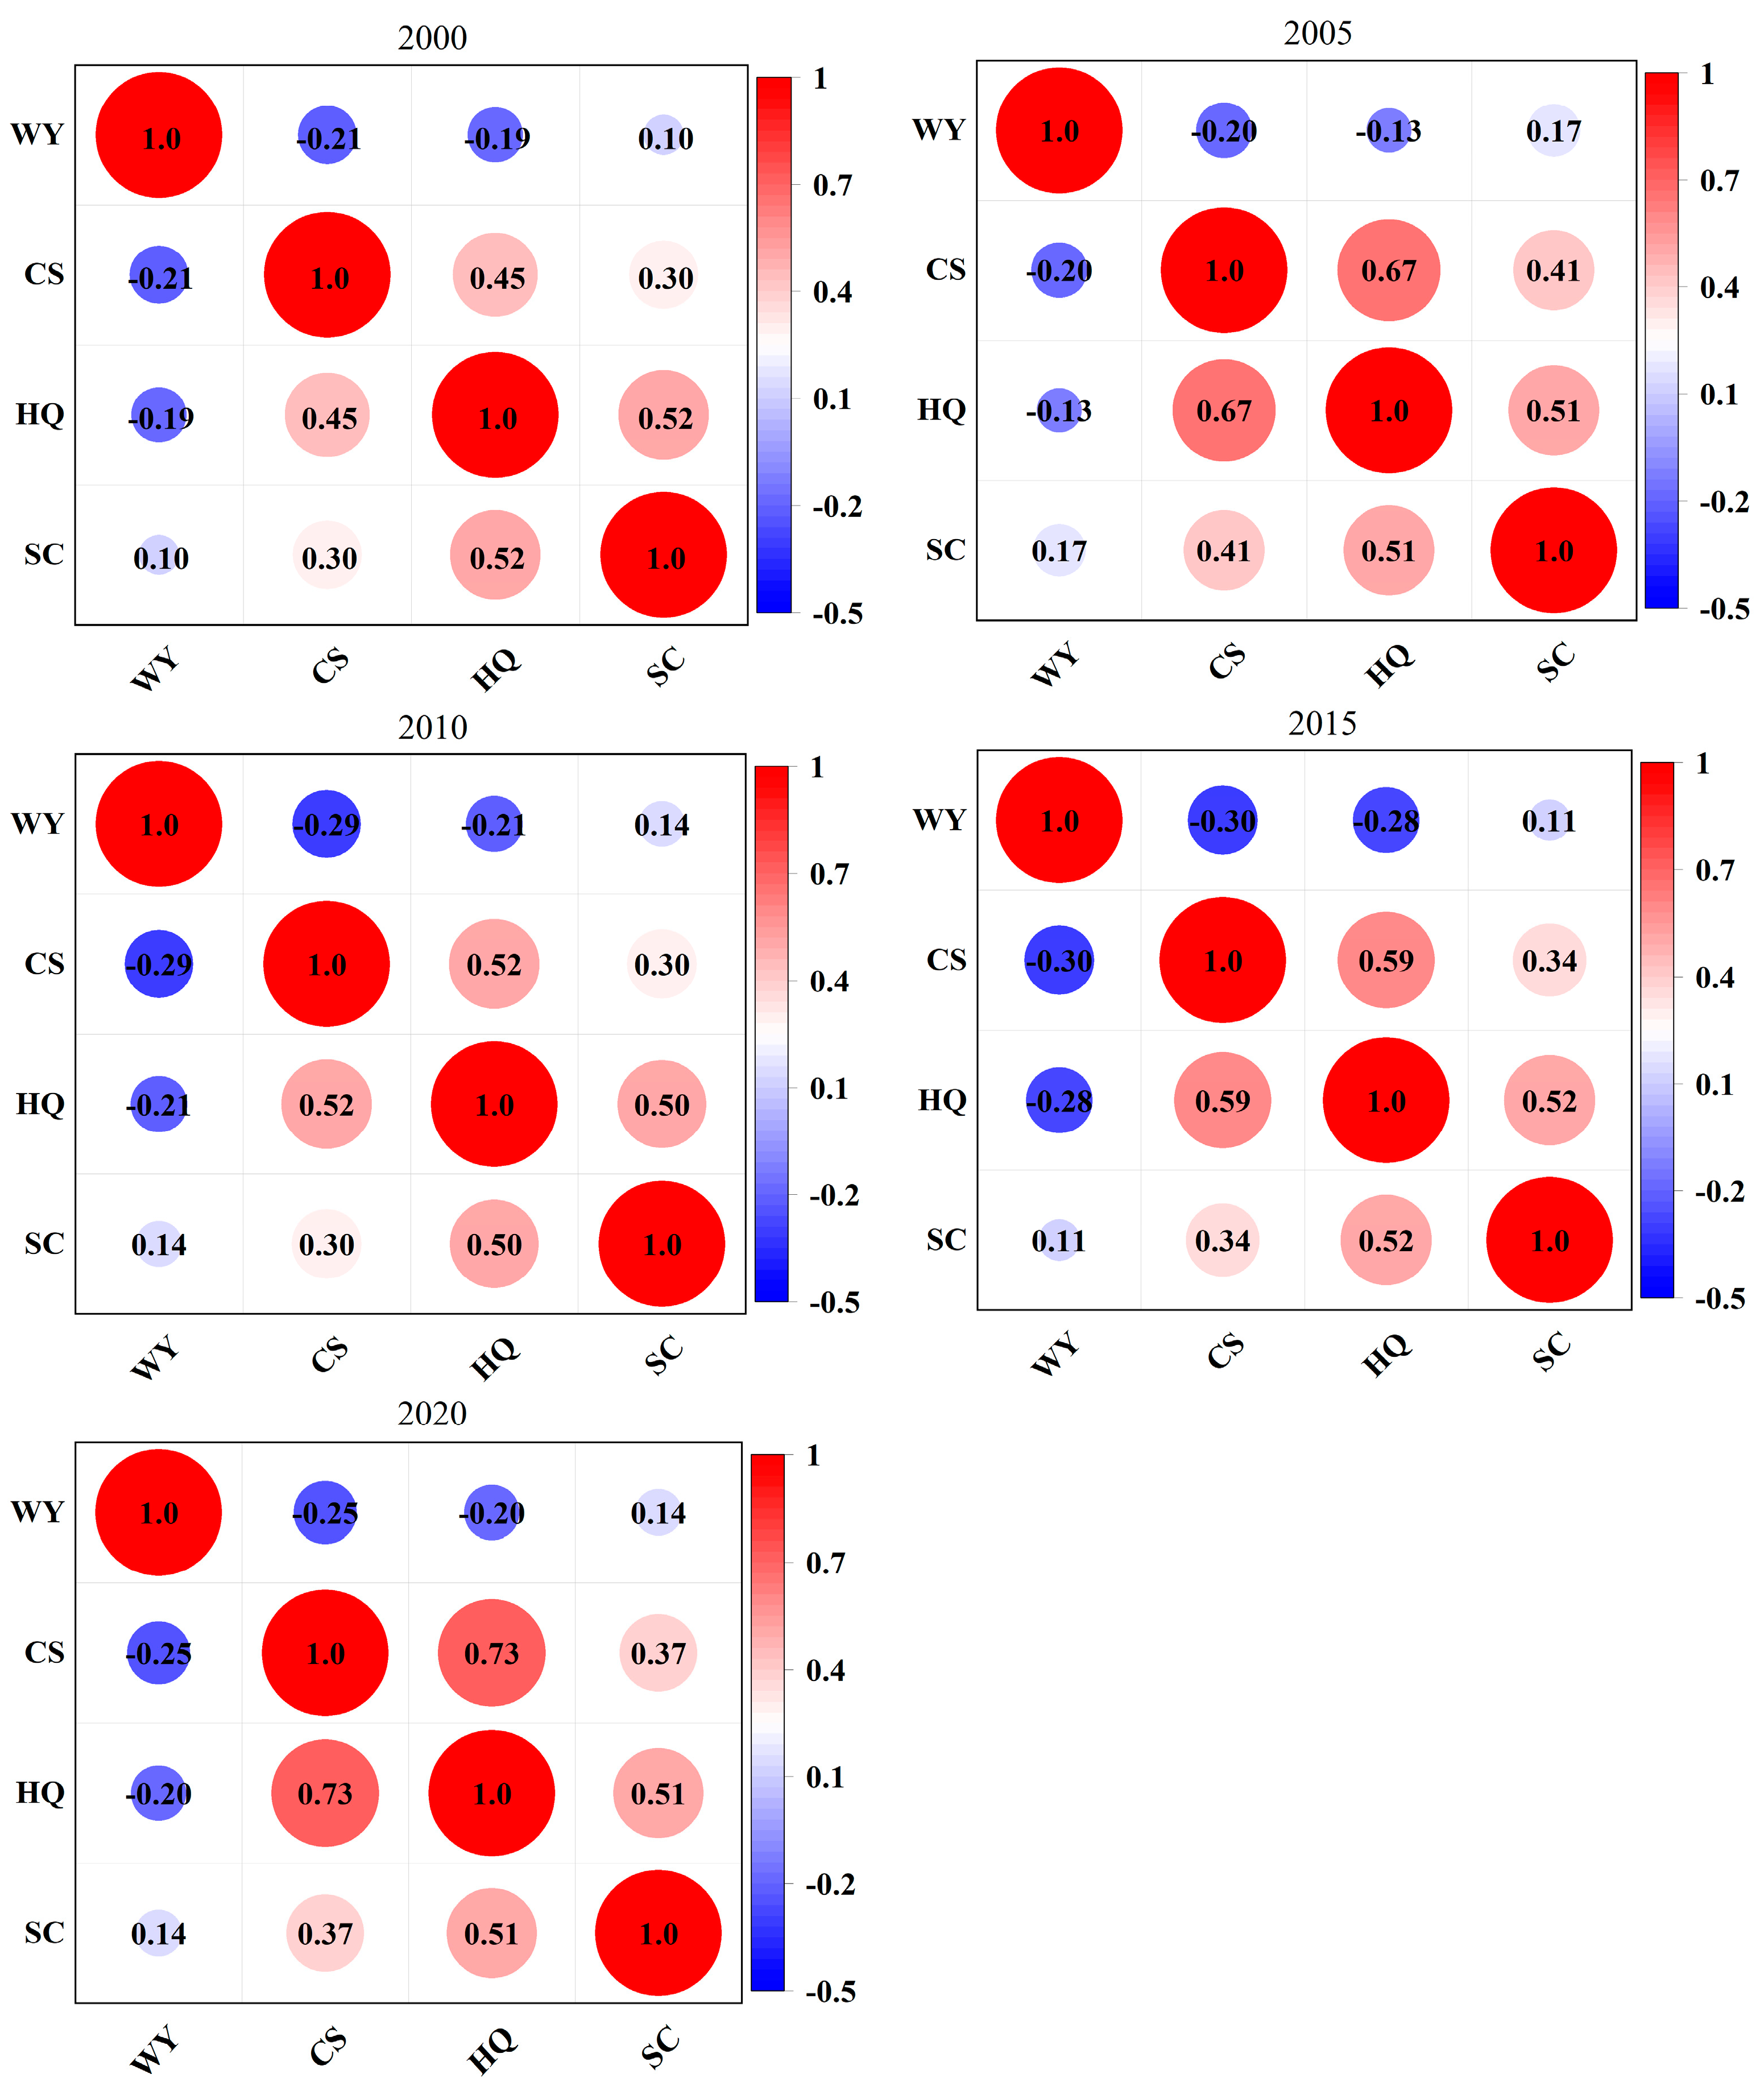
The outcomes demonstrated that the trade-off relationship between ESs was stable in the time dimension (Figure 5), with correlation coefficients of −0.21 ** and −0.19 ** between WY and CS, WY and HQ, respectively, showing a trade-off connection in 2000. In 2005, correlation coefficients between WY and CS, WY and HQ were −0.20 ** and −0.13 **, correspondingly, representing a trade-off. In 2010, the coefficients of the relationship between WY and CS and between WY and HQ were −0.29 ** and −0.21 **, showing a trade-off relationship. The coefficients of the relationship between WY and CS and between WY and HQ in 2015 were −0.30 ** and −0.28 **, showing a trade-off relationship. The coefficients of the relationship between WY and CS and between WY and HQ in 2020 were −0.25 ** and −0.20 **, showing a trade-off relationship. It can be seen that the strength of the trade-off between WY and CS and between WY and HQ has shown a strengthening trend in the last 20 years, and the other ESs show a stable synergistic relationship with each other.
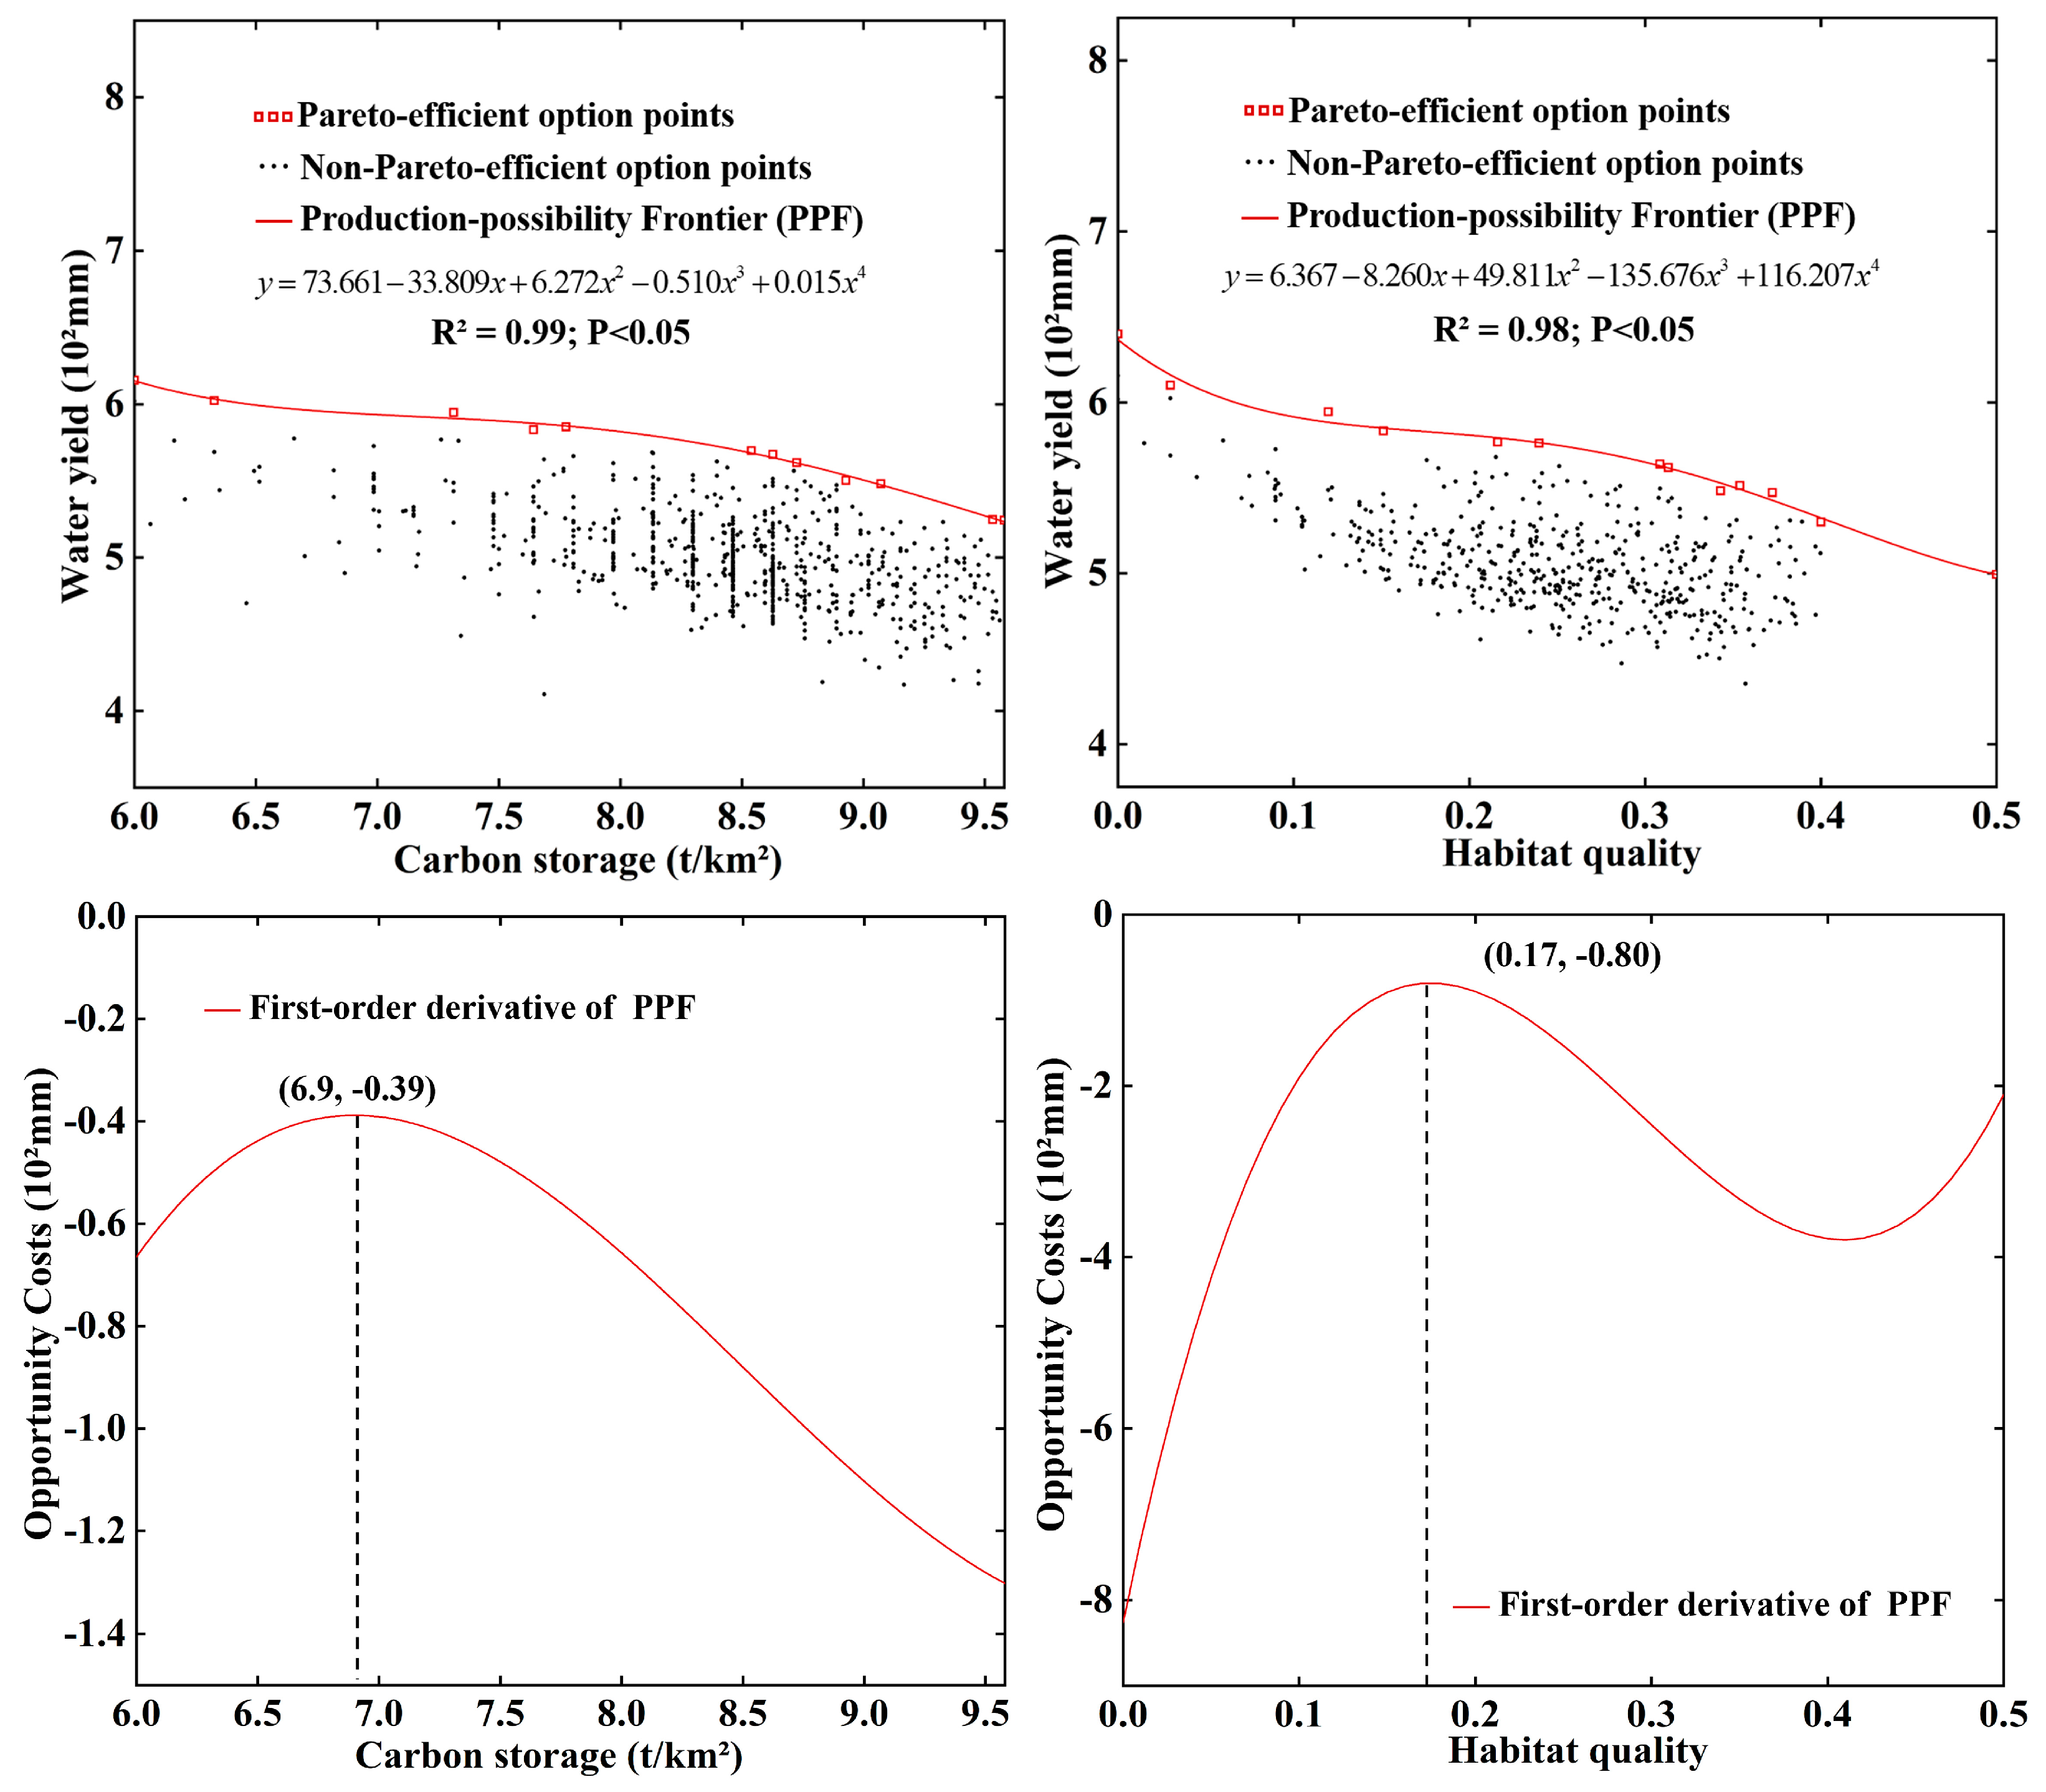
Based on the ESs that exhibit trade-offs, we will explore the nonlinear trade-off relationships among ESs, identify trade-off areas, analyze the response mechanism of land use to trade-offs, and reduce the trade-off intensity index among ESs. It can be seen that the PPF curves between WY and CS and WY and HQ in 2020 are increasing and decreasing. The PPF curve gradually degrades when the CS value is less than 9.58 t/km2 and the HQ value is less than 0.4. On the contrary, it gradually improves when the CS value is greater than 9.58 t/km2 and the HQ value is greater than 0.4. From the first-order derivatives, it can be seen that WY and CS as well as WY and HQ all show trade-offs and then synergies, and the trade-off transition points are 9.58 t/km2 and 0.4, respectively, extracting the areas where the option points exhibiting trade-offs are located. The areas in which WY and CS as well as WY and HQ exhibit trade-offs are mainly located in cropland and construction land, which are located in the northeastern part of the basin (Figure 6).
The PPF curve shows a convex and then a concave shape (Figure 7). In 2020, as CS and HQ improve, WY first degrades rapidly, then degrades slowly, and then degrades rapidly again. The opportunity cost of WY degrades and then improves as CS and HQ improve. According to the inflection point, it can be found that WY reduction is the smallest when the basin CS and HQ are 6.9 t/km2 and 0.17, respectively, with 39 mm and 80 mm. As CS and HQ improve, WY degrades more and more slowly before this threshold and more and more rapidly after it, so that the thresholds represent the most stable state of the relationship between WY and CS and between WY and HQ.

3.3. Multi-Scenario Modelling Projections

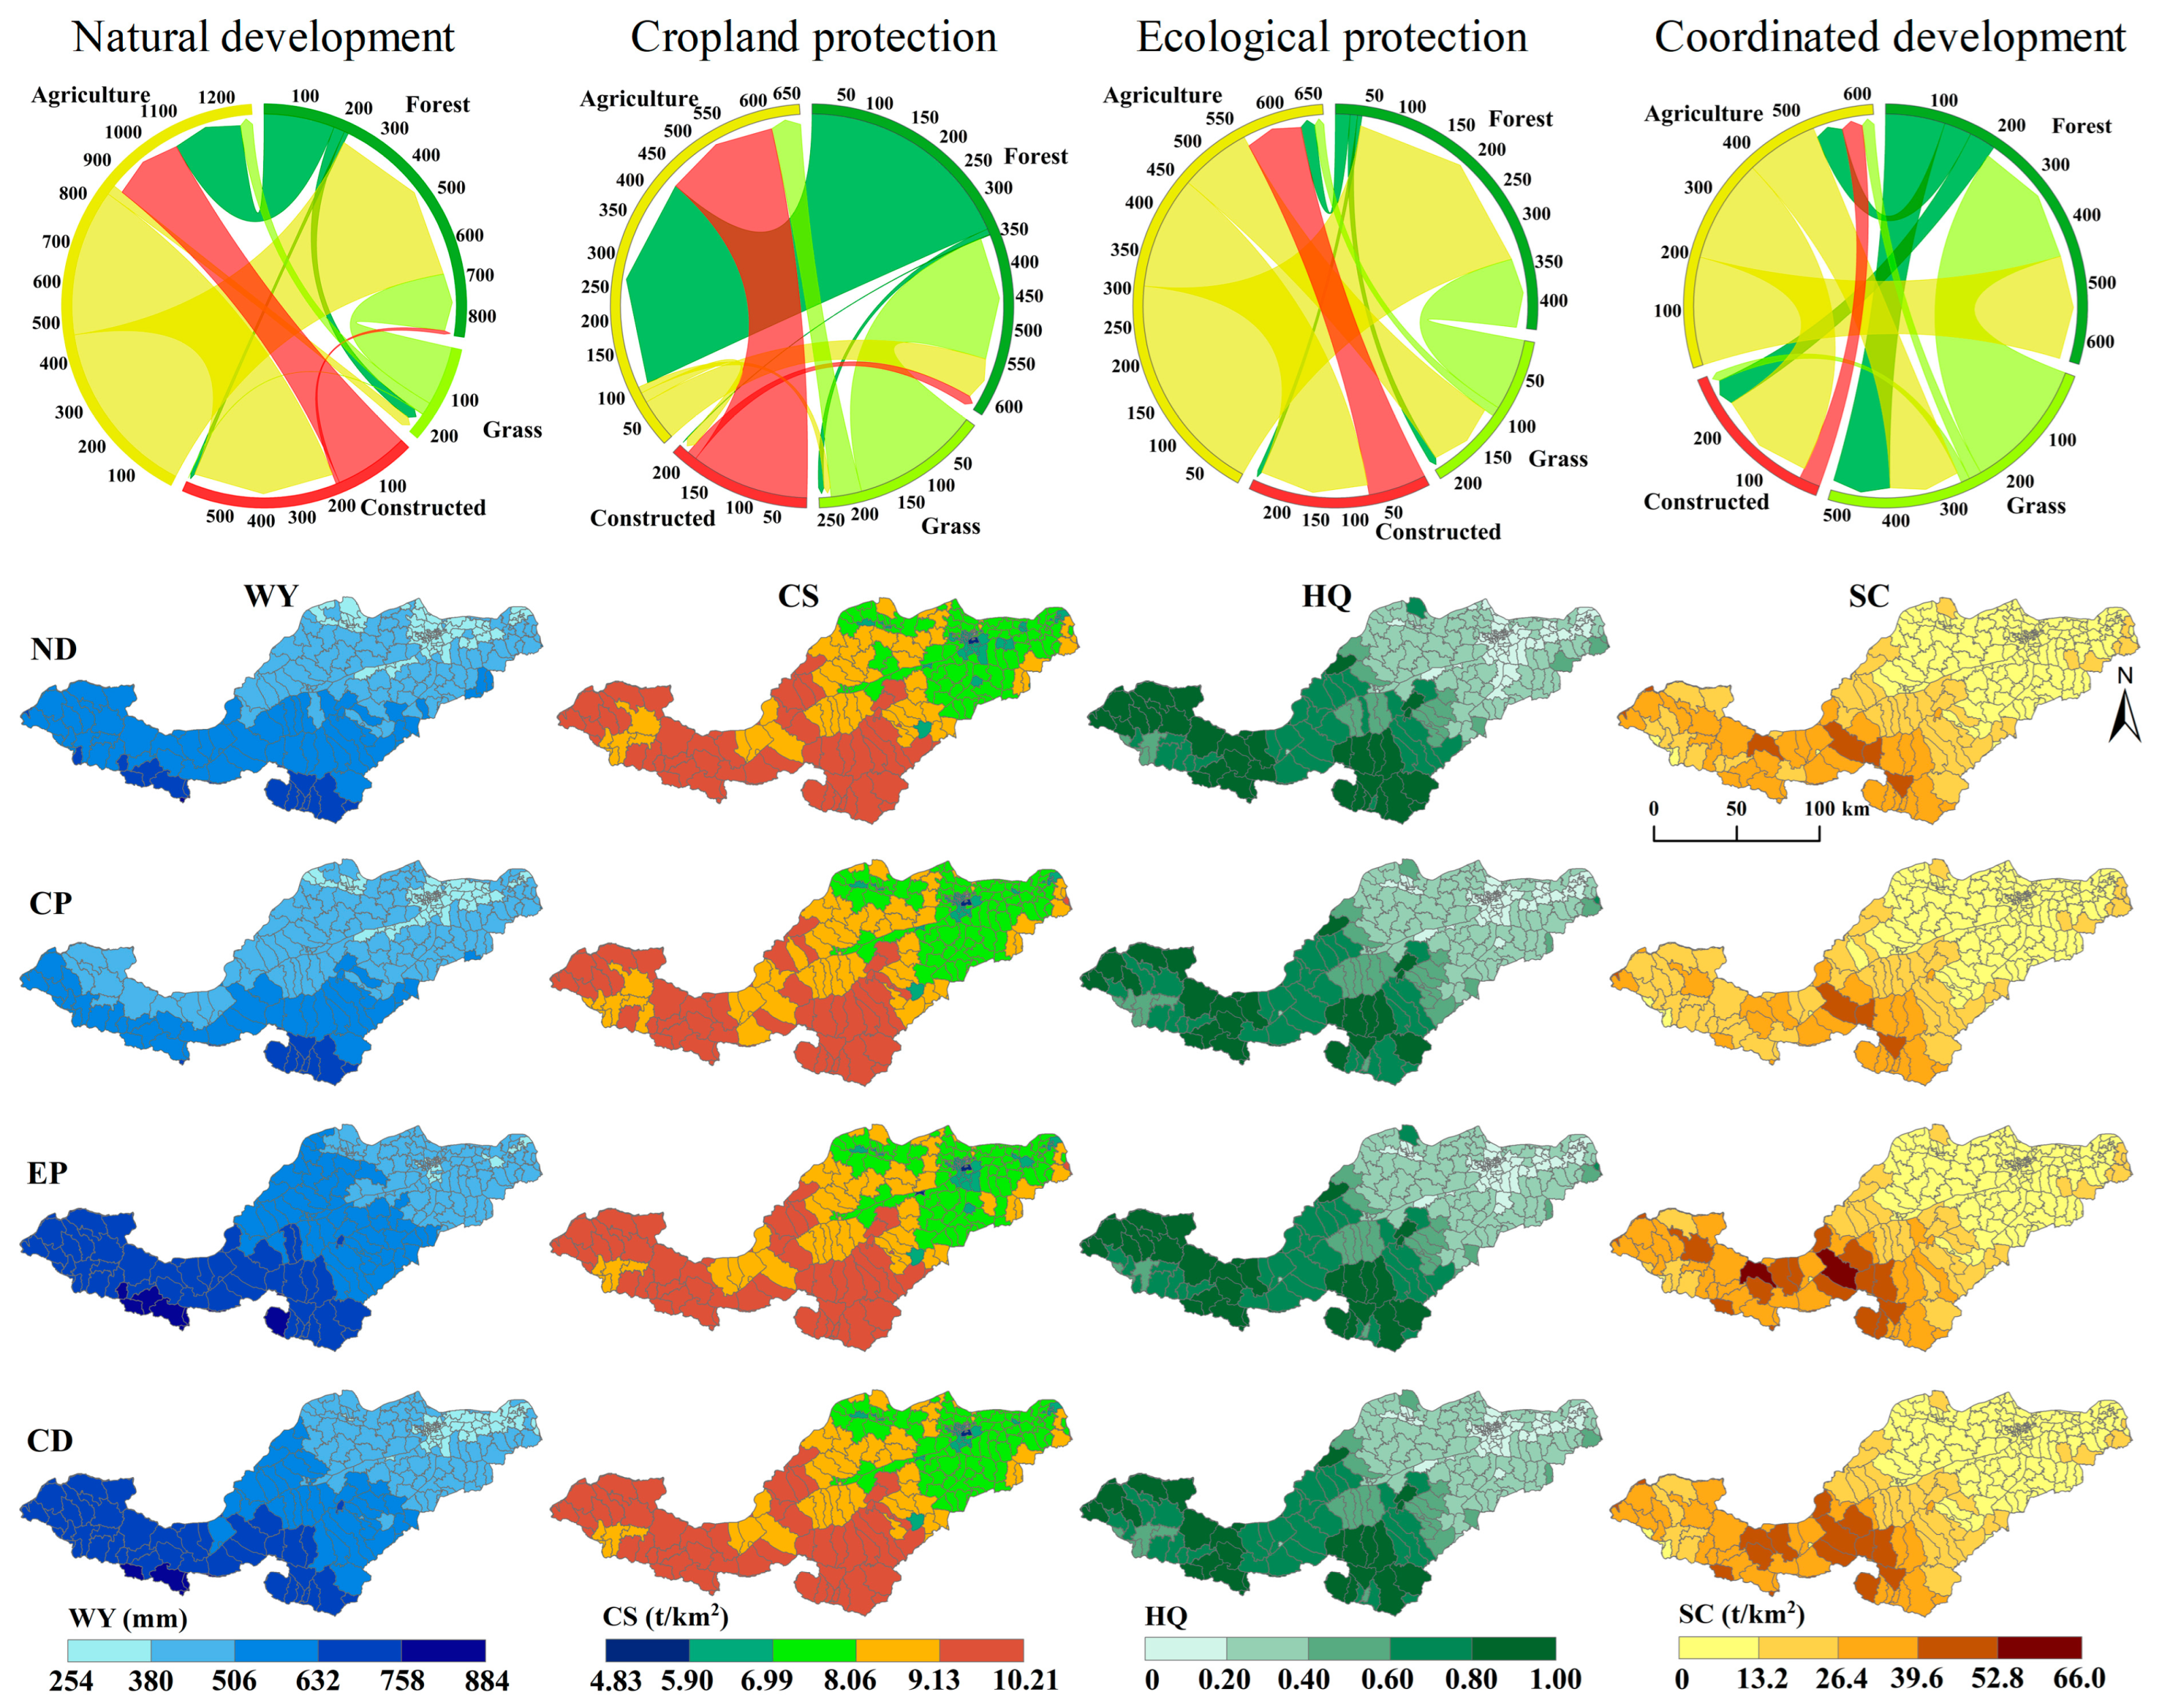
We simulate land use in the basin under four scenarios (ND, CP, EP, and CD) in 2030 (Figure 8 and Figure S3). Under the CP scenario, the area of cropland will improve by 484 km2, accounting for 2.58% of the total basin area. Under the ND, EP, and CD scenarios, the area of cropland will degrade by 463 km2, 444 km2, and 404 km2, accounting for 2.47%, 2.36%, and 2.15% of the area, respectively. Under the CP scenario, the area of forest land will degrade by 72 km2, accounting for 0.38% of the area, and improve by 405 km2, 366 km2, and 229 km2 under the ND, EP, and CD scenarios, accounting for 2.16%, 1.95%, and 1.22% of the area, respectively. The grassland area will degrade in all scenarios by 134 km2 in the ND scenario, 229 km2 in the CP scenario, 3 km2 in the EP scenario, and 39 km2 in the CD scenario, accounting for 0.71%, 1.22%, 0.02%, and 0.21% of the area, respectively. The water area did not change under all scenarios due to the setting of the basin limiting factor. Under the CP scenario, the constructed area degraded by 183 km2, accounting for 0.97% of the area. Under the ND, EP, and CD scenarios, the constructed area improved by 192 km2, 81 km2, and 214 km2, accounting for 1.02%, 0.43%, and 1.14% of the total area, respectively.
Under the ND scenario, the conversion of cropland to forest land (465 km2, 2.48%) was the highest. It was followed by the conversion of cropland to constructed land (383 km2, 2.04%), conversion of constructed land to cropland (194 km2, 1.03%), conversion of forest land to cropland (184 km2, 0.98%), and conversion of grassland to forest land (155 km2, 0.83%). Under the CP scenario, the conversion of forest land to cropland was the highest (343 km2, 1.83%). It was followed by grassland to forest land (200 km2, 1.07%) and constructed land to cropland (185 km2, 0.99%). Under the EP scenario, cropland conversion to forest land was the highest (304 km2, 1.62%). It was followed by conversion of cropland to constructed land (154 km2, 0.82%) > conversion of grassland to forest land (98 km2, 0.52%) > conversion of cropland to grassland (98 km2, 0.52%) > conversion of constructed land to cropland (79 km2, 0.42%). Under the CD scenario, grassland conversion to forest land was the highest (239 km2, 1.27%). It was followed by cropland converted to forest land (196 km2, 1.04%) > cropland converted to constructed land (188 km2, 1.00%) > cropland converted to grassland (131 km2, 0.70%) > woodland converted to grassland (108 km2, 0.58%). The overall pattern of land use is relatively consistent across the different scenarios, but there is considerable local differentiation. Under the ND and EP scenarios, the expansion of forest land is obvious and mainly originates from cropland, but the area of the GFGP under the EP scenario is greatly reduced compared with the ND scenario. In the CP scenario, arable land expands significantly and is mainly derived from grassland. In the CD scenario, there is a significant expansion of forest land, mainly from grassland and cropland.
Figure S4 reveals changes in the ES provisioning capacity of different scenarios in the Luo River basin from 2020 to 2030. Compared to the 2020 Luo River basin supply, the ND scenario shows a 2.32% improvement in WY supply, a 4.54% degradation in CS supply, a 5.99% improvement in HQ supply, and a 135.98% improvement in SC supply. The CP scenario shows a 3.75% degradation in WY capacity, a 4.77% decrease in CS capacity, a 1.27% improvement in HQ capacity, and an SC capacity improvement of 106.95%. In the EP scenario, WY capacity improves by 19.15%, CS capacity degrades by 4.57%, HQ capacity improves by 4.54%, and SC capacity improves by 172.20%. In the CD scenario, WY capacity improves by 11.64%, CS capacity degrades by 4.42%, HQ capacity improves by 2.54%, and SC capacity improves by 159.02%. In 2030, the highest WY was in the EP scenario, the highest CS was in the CD scenario, the highest HQ was in the ND scenario, and the highest SC was the in EP scenario. In summary, the effect of changes in land use patterns on ESs is significant, with the EP scenario having the most pronounced effect in increasing the supply level of ESs.

3.4. Changes in ES Trade-Offs under Different Scenarios

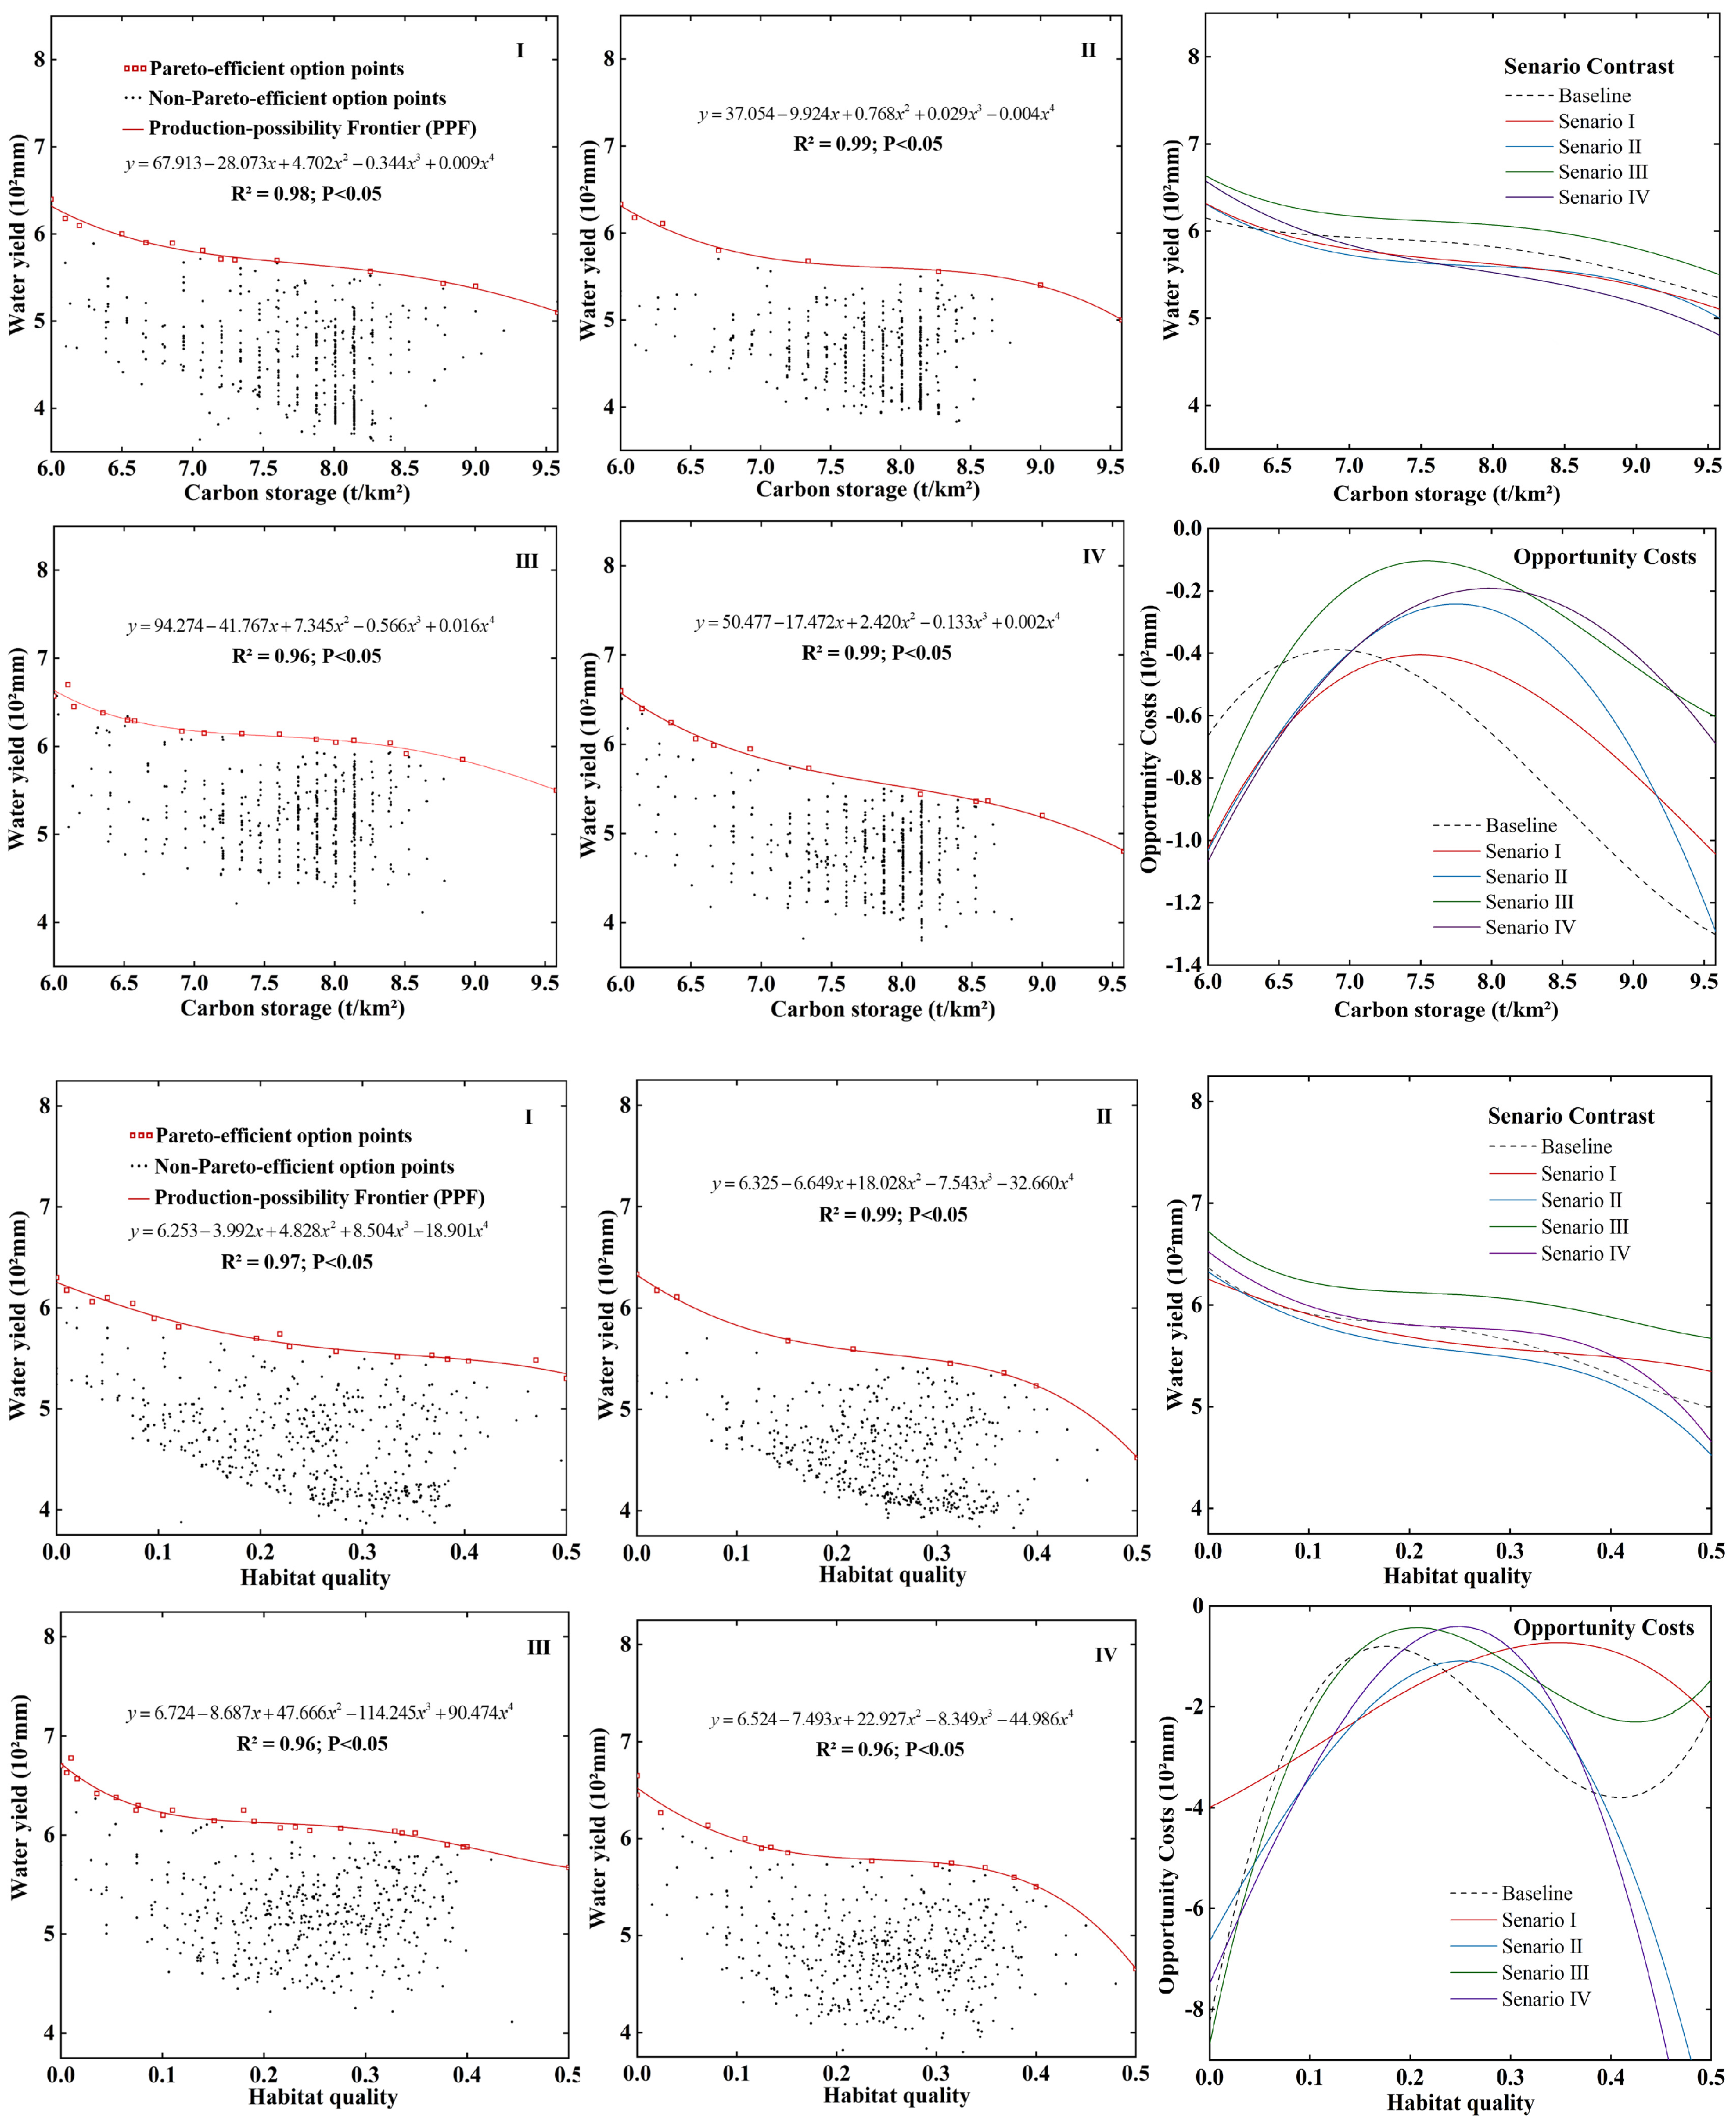
The PPFs of WY and CS for the four scenarios are optimally fitted by a quartic function. The PPFs are convex trade-offs before the inflection point and become concave trade-offs after the inflection point (Figure 9). Comparison with 2020 reveals a further improvement in WY for the EP scenario, an improvement in the WY values for the other three scenarios at the option points with low CS values, and a degradation in the WY values at the option points with high CS values. Compared to the 2020 first-order derivatives, the four scenarios degrade before the inflection point and improve after the inflection point, causing the PPF curves to steepen before the inflection point and flatten after the inflection point. Compared to 2020, the EP scenario has the smallest opportunity cost of 10.4 mm, and the ND scenario has the largest opportunity cost of 40.6 mm.
The PPFs of WY and HQ for the four scenarios are optimally fitted by a quartic function. The PPFs are convex trade-offs before the inflection point and become concave trade-offs after the inflection point (Figure 9). Comparison with 2020 reveals that the WY of the EP and CD scenarios is differently elevated, and the WY of the ND and CP scenarios is differently reduced. Compared to the first-order derivative in 2020, the ND and EP scenarios degrade before and improve after, resulting in the PPF becoming steeper before the inflection point and flatter after the inflection point. On the other hand, the CP and CD scenarios improve at the inflection point and degrade before and after the inflection point, resulting in the overall steepening of the PPF curve. In comparison to 2020, the CD scenario has the smallest opportunity cost of 40.7 mm, and the CP scenario has the largest opportunity cost of 109.1 mm, as measured by the HQ.
Compared to 2020 (Table 1 and Figure S5), in the four scenarios, synergy potential improved by 3.30–22.22%, and the trade-off intensity degraded by 11.59–33.34%. Both indicators show that the EP scenario was most effective in mitigating the intensity of the trade-off between WY and CS.
Compared to 2020 (Table 2 and Figure S6), with the synergy potential under the CP scenario decreasing by 2.51%, and under the other three scenarios, the synergy potential improves by 0.35–7.41%, and the trade-off intensity degrades by 6.45–40.32%. Both indicators show that the EP scenario was the most effective in mitigating the intensity of the trade-off between WY and HQ.

4. Discussion

4.1. ESs Quantification and Nonlinear Characterization of Trade-Offs/Synergies

Exploring trade-offs between ESs has emerged as a crucial approach to promoting sustainable regional development [45]. The typical basins in the middle reaches of the Yellow River face challenges such as low vegetation coverage, severe soil erosion, and a fragile ecological environment. Despite advancements driven by policies like GFGP and long-term ecological protection and construction efforts, the ecological environment has experienced overall improvement but has not undergone a fundamental transformation, which has become a bottleneck hindering the realization of the national strategy of “Ecological Protection and High-Quality Development of the Yellow River basin“ [46,47]. In the Luo River basin, trade-offs between WY and HQ, as well as WY and CS, have been observed. These findings align with research by La et al. [43,48,49]. Conversely, synergistic relationships have been identified between HQ and SC, as well as CS and SC, which differ from the conclusions drawn by LI et al. [50]. This disparity may be attributed to the presence of low-elevation areas in a portion of the Luo River basin, where elevation exerts a more pronounced impact on the trade-off and synergistic relationships among ESs. For the study of trade-off relationships, Li and Huang et al. used Spearman correlation analysis and spatial autocorrelation to explore the spatial heterogeneity of the trade-off/synergistic relationships among ESs and the spatial aggregation pattern of ESs, trends revealing a single change in the trade-offs between ESs [51,52]. Li et al. used a spatial superposition method based on a ranked hierarchical framework to quantify the ES trade-off/synergy relationship, revealing a static distinction between the ES trade-off/synergy relationship in space [53]. In comparison to prior studies, we emphasize the need to focus on unveiling the nonlinear characteristics of trade-offs and synergies among ESs. Quantifying the nonlinear nature of these relationships is crucial for understanding the complexity of ES trade-offs. Currently, the PPF method stands as the most commonly used approach to exploring the nonlinear characteristics of ES trade-offs [38]. Zhao et al. leveraged PPF curves to examine the nonlinear trade-off relationship between synergistic potential and trade-off strength among ESs [24,40]. Through PPF curves, our study reveals that the trade-off/synergy relationship between ESs is dynamic, with the potential for shifts from trade-offs to synergies around specific thresholds. These observations underscore the highly intricate nature of ES trade-offs. To address this complexity, we delineated trade-off areas and visualized trade-off/synergy partitions, elucidating the nonlinear aspects of trade-offs among ESs and accurately pinpointing the spatial heterogeneity of ES trade-off relationships. Our study can be used as a reference for subsequent studies of trade-off/synergy complexity and spatial heterogeneity of ESs and identification of trade-off/synergy partitions, offer valuable guidance for effectively mitigating trade-off intensity, optimizing land use, enhancing the ecological environment, and fostering the sustainable development of ESs.

4.2. Multi-Scenario Projections of Ecosystem Services

Understanding the characteristics of land structure changes across multiple scenarios and their impacts on ESs can guide the development of sustainable policies for ESs [54]. With rapid urbanization, changes in land-use types affect the structure and function of ESs, thereby influencing ESs and their interactions [55,56]. In most cases, socio-economic development inevitably leads to irrational land use structures that threaten the structure and function of ESs [57]. This finding is consistent with the observed deepening of the strength of the trade-off between ESs in the Luo River basin from year to year. Relevant studies have shown that the expansion of construction land has encroached upon vast areas of forested and cultivated land. This is the main source of the value of ESs, which directly contributes to the decline of ecosystem regulating services and thus to the weakening of ES stability [58,59]. Similarly, areas with high ESs in the Luo River basin are also clustered predominantly in forest and cropland. There is a discernible decline in the figures for WY and HQ year on year, which can be attributed to the ongoing encroachment of construction activities. However, how future land use change will affect changes in ESs, and thus trade-offs/synergies between ESs, is unclear. Multi-scenario simulations and dynamic valuations of ESs using the FLUS model revealed patterns of land cover change, total ES value [32], and trends in ES trade-offs/synergies [40]. Moreover, the nonlinear character of ES trade-offs/synergies in different scenarios is of particular importance to land-use planning. It is of paramount importance to consider not only the service levels in ecosystems across different scenarios, but also the impact of varying land covers on ESs within the same scenario, given the significant disparities in the quality of ESs across different land types. We combined multi-scenario simulations with PPF to explore the ES trade-offs/synergies induced by different land covers under the same scenario, and the nonlinear characteristics of the trade-off relationship between ESs in the trade-off areas under different scenarios. To our surprise, nonlinear ES relationship changes in trade-off areas and optimal scenarios exist to mitigate trade-off intensity. Based on the FLUS model and PPF curves, we explored the nonlinear characteristic differences in the trade-off/synergistic relationships among ESs under future land use changes to find the optimal scenario for mitigating the strength of trade-offs. Accordingly, implementing scenario-specific land-use type configurations and spatial pattern distributions can be effective in mitigating trade-off intensity between ESs. This study provides valuable guidance for the development of rational land-use planning and offers new perspectives for crafting future development scenarios aimed at achieving sustainable development of ESs.

4.3. Implications for the Sustainability of Ecosystem Services

The results of the study are of great significance for the sustainable development of ESs and the construction of a rational land-use structure in the study area, and can also provide a reference for other basins to explore the trade-offs/synergistic relationships among ESs.
(1) The decline in WY and HQ from 2000 to 2020 highlights the urgency of water resource protection and biodiversity conservation, and policy development should focus on water protection while increasing the number of species in the GFGP, avoiding large-scale single-species cultivation, implementing strict ecological environmental protection measures, improving biodiversity, and promoting the development of stability in ESs.
(2) The results of the study emphasize the necessity of revealing the complexity of the trade-off/synergy relationships between ESs. In addition, the quantification of the trade-off/synergy relationship should take into account the characteristics of the nonlinear changes between ESs while focusing on the dynamics of the trade-off/synergy relationship, determining the threshold for the transformation of trade-offs into synergies, and achieving spatial partitioning of trade-offs/synergistic relationships.
(3) The results of the study emphasize the importance of combining multi-scenario simulation with PPF, in particular, to identify the variability in the trade-off/synergy relationships of multi-scenario ESs through the combination of scenario simulation and PPF curves, and to identify the optimal scenario with the highest synergy potential and the lowest trade-off intensity.
(4) The trade-offs/synergies among ESs are an important aspect in assessing ecosystem services. It is worth noting that the trade-offs/synergies among ESs change with spatial variations as well as over time, and that changes in trade-offs/synergies can seriously affect the ecological restoration efficiency. Based on the combination of the FLUS model and PPF, the impacts of human activities and climate change on the trade-offs/synergies of ESs were comprehensively considered in order to elucidate the nonlinear change characteristics of the trade-offs/synergies among ESs at the spatial and temporal levels. It is a prerequisite for effective ecosystem management.

4.4. Limitations

This study focuses on identifying the trade-off areas between extracted ESs and exploring the synergistic potentials and changes in the intensity of trade-offs between ESs in the trade-off areas under different scenarios. However, there are still some shortcomings. In the simulation of four scenarios (ND, CP, EP, and CD) developed in this study, 10 driving factors were selected. Land use development had nonlinear characteristics, and there were uncontrollable factors, such as land policy, economic development planning, natural disasters, and the interference of anthropogenic interference. The selection of driving factors and simulation scenarios is not perfect, leading to the precision of the simulation’s findings being reduced. Meanwhile, this study aims to gain a deeper understanding of the response mechanism of basin trade-off intensity to land use changes. It focuses on exploring the synergistic potential and changes in trade-off intensity among ESs in the trade-off areas, without much exploration of the mechanism of land use changes in the synergistic area affecting the relationship among ESs. In future research, the number of driving factors and simulation scenarios should be reasonably improved, and further study of the patterns of land-use change on the strength of trade-offs/synergies in different regions should be realized to achieve coordinated and sustainable development of the area.

5. Conclusions

In this study, nonlinear changes in trade-offs/synergies among ESs were characterized based on PPF. Implementation of scenario-specific land-use type configurations and spatial pattern distributions that effectively mitigate the intensity of trade-offs in areas where they are most needed. The results showed that: (1) Trade-off between WY-CS and WY-HQ has intensified over the past 20 years. (2) Differences in land use types lead to spatial heterogeneity in the ESs relationship. We unveil the nonlinear characteristics of trade-offs and synergies among ESs. When CS is 9.58 t/km2 and HQ is 0.4, the relationship with WY changes from trade-off to synergy. We delineated trade-off areas and visualized trade-off/synergy partitions. The trade-off area is mainly distributed in cropland and construction land. (3) Based on scenario simulations and PPF curves, the impacts of different land cover changes on the ecological environment under the same scenario are explored. The optimal scenarios were identified, so as to accurately and effectively mitigate the intensity of the trade-offs and promote the sustainable development of the regional ecological environment at a higher level. This study provides an effective method for identifying trade-off areas and land-use planning, and provides a decision-making basis for mitigating the intensity of trade-offs between ESs and achieving sustainable development.

Supplementary Materials

The following supporting information can be downloaded at: https://www.mdpi.com/article/10.3390/land13081243/s1, Figure S1: Drivers of land-use change; Figure S2: Changes in the mean value of ecosystem service provisioning; Figure S3: Land use in 2030; Figure S4: Changes in ESs provisioning capacity under different scenarios, 2020–2030; Figure S5: Comparison of scenarios of changes in synergy potential and trade-off intensity; Figure S6: Comparison of scenarios of changes in synergy potential and trade-off intensity; Table S1: Six datasets were used to estimate four ESs.; Table S2: Description of the drivers of land-use change; Table S3: Basin Land-Use Type Conversion Matrix; Table S4: Neighbourhood weights; Supplementary S1: Data requirements; Supplementary S2: Introduction to Formulas; Supplementary S3: Spatial and temporal changes in the four ESs.

Author Contributions

Conceptualization, Y.D. and X.Q.; methodology, Y.D. and J.Z.; software, Y.Y. and L.L.; validation, Y.D. and X.Q.; formal analysis, X.Q. and Y.C.; investigation, Y.C. and J.Z.; resources, Y.Y. and L.L.; data curation, Y.D. and Y.C.; writing—original draft preparation, Y.D.; writing—review and editing, Y.D. and X.Q.; visualization, Y.D. and X.Q.; supervision, X.Q. and Y.Y.; project administration, X.Q. and T.Z.; funding acquisition, X.Q. All authors have read and agreed to the published version of the manuscript.

Funding

This research was funded by the National Key Natural Science Foundation of China (Grant No. U23A2016) and the National Natural Science Foundation of China (Grant No. 42271283).

Data Availability Statement

The original contributions presented in the study are included in the article and Supplementary Material.

Acknowledgments

The authors are particularly grateful to all researchers and institutes for providing data for this study. The authors are also very grateful to the editors and reviewers for their comments and suggestions for improving this study.

Conflicts of Interest

The authors declare no conflicts of interest.

References

  1. Costanza, R.; de Groot, R.; Farber, S.; Grasso, M.; Hannon, B.; Limburg, K.; Naeem, S.; VO’Neill, R.; Paruelo, J. The value of the world’s ecosystem services and natural capital. Ecol. Econ. 1998, 25, 3–15. [Google Scholar] [CrossRef]
  2. Li, S.; Zhang, C.; Liu, J.; Zhu, W.; Ma, C.; Wang, J. The tradeoffs and synergies of ecosystem services: Research progress, development trend, and themes of geography. Geogr. Res. 2013, 32, 1379–1390. [Google Scholar]
  3. Meng, H.; Zhou, Q.; Li, M.; Zhou, L.; Liu, B.; Peng, C. Study of the spatio-temporal changes in ecosystem services and trade-offs/synergies relationship in the Three Gorges Reservoir area. Ecol. Rural. Environ. 2021, 37, 566–575. [Google Scholar] [CrossRef]
  4. Hu, Q.; Chen, S. Tradeoffs-synergies Analysis among Ecosystem Services in Xiamen-Zhangzhou-Quanzhou Area. Areal Res. Dev. 2021, 40, 145–150. [Google Scholar] [CrossRef]
  5. Liu, Y.; Geng, W.; Shao, J.; Zhou, Z.; Zhang, P. Land use change and ecosystem service value response from the perspective of “ecological-prodection-living spaces”: A case study of lower Yellow River. Areal Res. Dev. 2021, 40, 129–135. [Google Scholar]
  6. Feng, Y.; Cao, Y.; Li, S.; Wang, S.; Liu, S. Trade-offs and synergies of ecosystem services: Development history and research characteristics. J. Agric. Resour. Environ. 2022, 39, 11–25. [Google Scholar] [CrossRef]
  7. Daryanto, S.; Fu, B.; Zhao, W. Evaluating the use of fire to control shrub encroachment in global drylands: A synthesis based on ecosystem service perspective. Sci. Total Environ. 2019, 648, 285–292. [Google Scholar] [CrossRef] [PubMed]
  8. Geneletti, D.; Scolozzi, R.; Adem Esmail, B. Assessing ecosystem services and biodiversity tradeoffs across agricultural landscapes in a mountain area. Int. J. Biodivers. Sci. Ecosyst. Serv. Manag. 2018, 14, 189–209. [Google Scholar] [CrossRef]
  9. Jia, X.; Fu, B.; Feng, X.; Hou, G.; Liu, Y. The tradeoff and synergy between ecosystem services in the Grain-for-Green areas in Northern Shaanxi, China. Ecol. Indic. 2014, 43, 103–113. [Google Scholar] [CrossRef]
  10. Schirpke, U.; Candiago, S.; Vigl, L.E.; Jäger, H.; Labadini, A.; Marsoner, T.; Meisch, C.; Tasser, E.; Tappeiner, U. Integrating supply, flow and demand to enhance the understanding of interactions among multiple ecosystem services. Sci. Total Environ. 2019, 651, 928–941. [Google Scholar] [CrossRef] [PubMed]
  11. Bai, Y.; Zhuang, C.; Ouyang, Z.; Zheng, H.; Jiang, B. Spatial characteristics between biodiversity and ecosystem services in a human-dominated basin. Ecol. Complex. 2011, 8, 177–183. [Google Scholar] [CrossRef]
  12. Fu, B.; Zhang, L. Land-use change and ecosystem services: Concepts, methods and progress. Prog. Geogr. 2014, 33, 441–446. [Google Scholar] [CrossRef]
  13. Qin, K.; Li, J.; Yang, X. Trade-off and synergy among ecosystem services in the Guanzhong-Tianshui Economic Area of China. Int. J. Environ. Res. Public Health 2015, 12, 14094–14113. [Google Scholar] [CrossRef] [PubMed]
  14. Qiao, X.; Gu, Y.; Zou, C.; Xu, D.; Wang, L.; Ye, X.; Yang, Y.; Huang, X. Temporal variation and spatial scale dependency of the trade-offs and synergies among multiple ecosystem services in the Taihu Lake Basin of China. Sci. Total Environ. 2019, 651, 218–229. [Google Scholar] [CrossRef] [PubMed]
  15. Lan, Y.; Sun, T.; Li, W. Trade-offs and synergies of farmland ecosystem services in Loess Plateau: A case study of Longdong Area, Northwest China. Trans. Chin. Soc. Agric. Eng. 2023, 39, 236–244. [Google Scholar] [CrossRef]
  16. Hou, Y.; Lü, Y.; Chen, W.; Fu, B. Temporal variation and spatial scale dependency of ecosystem service interactions: A case study on the central Loess Plateau of China. Landsc. Ecol. 2017, 32, 1201–1217. [Google Scholar] [CrossRef]
  17. Tilman, D. Causes, consequences and ethics of biodiversity. Nature 2000, 405, 208–211. [Google Scholar] [CrossRef] [PubMed]
  18. Han, Z.; Song, W.; Deng, X.; Xu, X. Trade-offs and synergies in ecosystem service within the three-rivers headwater area, China. Water 2017, 9, 588. [Google Scholar] [CrossRef]
  19. Daily, G.C. Nature’s services: Societal dependence on natural ecosystems (1997). In The Future of Nature; Yale University Press: New Haven, CT, USA, 2013; pp. 454–464. [Google Scholar] [CrossRef]
  20. Ouyang, Z.; Wang, X.; Miao, H. A primary study on Chinese terrestrial ecosystem services and their ecological-economic values. Acta Ecol. Sin. 1999, 19, 607–613. [Google Scholar]
  21. Dai, E.; Wang, X.; Zhu, J.; Zhao, D. Methods, tools and research framework of ecosystem service trade-offs. Geogr. Res. 2016, 35, 1005–1016. [Google Scholar] [CrossRef]
  22. Zheng, H.; Li, Y.; Ouyang, Z.; Luo, Y. Progress and perspectives of ecosystem services management. Acta Ecol. Sin. 2013, 33, 702–710. [Google Scholar] [CrossRef]
  23. Peng, J.; Hu, X.; Zhao, M.; Liu, Y.; Tian, L. Research progress on ecosystem service trade-offs: From cognition to decision-making. Acta Geogr. Sin. 2017, 72, 960–973. [Google Scholar] [CrossRef]
  24. Peng, J.; Wang, X.; Zheng, H.; Xu, Z. Applying production-possibility frontier based ecosystem services trade-off to identify optimal scenarios of Grain-for-Green Program. Landsc. Urban Plan. 2024, 242, 104956. [Google Scholar] [CrossRef]
  25. Liu, P.; Hu, Y.; Jia, W. Land use optimization research based on FLUS model and ecosystem services–setting Jinan City as an example. Urban Clim. 2021, 40, 100984. [Google Scholar] [CrossRef]
  26. Polasky, S.; Nelson, E.; Camm, J.; Csuti, B.; Fackler, P.; Lonsdorf, E.; Montgomery, C.; White, D.; Arthur, J.; Garber-Yonts, B. Where to put things? Spatial land management to sustain biodiversity and economic returns. Biol. Conserv. 2008, 141, 1505–1524. [Google Scholar] [CrossRef]
  27. Zheng, H.; Wang, L.; Wu, T. Coordinating ecosystem service trade-offs to achieve win–win outcomes: A review of the approaches. J. Environ. Sci. 2019, 82, 103–112. [Google Scholar] [CrossRef] [PubMed]
  28. Li, Q.; Bao, Y.; Wang, Z.; Chen, X.; Lin, X. Trade-offs and synergies of ecosystem services in karst multi-mountainous cities. Ecol. Indic. 2024, 159, 111637. [Google Scholar] [CrossRef]
  29. Liu, J.; Pei, X.; Zhu, W.; Jiao, J. Scenario modeling of ecosystem service trade-offs and bundles in a semi-arid valley basin. Sci. Total Environ. 2023, 896, 166413. [Google Scholar] [CrossRef] [PubMed]
  30. Chen, Y.; Qiao, X.; Yang, Y.; Zheng, J.; Dai, Y.; Zhang, J. Identifying the spatial relationships and drivers of ecosystem service supply–demand matching: A case of Yiluo River Basin. Ecol. Indic. 2024, 163, 112122. [Google Scholar] [CrossRef]
  31. Cord, F.; Bartkowski, B.; Beckmann, M.; Dittrich, A.; Hermans-Neumann, K.; Kaim, A.; Lienhoop, N.; Locher-Krause, K.; Priess, J.; Schröter-Schlaack, C.; et al. Towards systematic analyses of ecosystem service trade-offs synergies: Main concepts methods the road ahead. Ecosyst. Serv. 2017, 28, 264–272. [Google Scholar] [CrossRef]
  32. Li, W.; Chen, X.; Zheng, J.; Zhang, F.; Yan, Y.; Hai, W.; Han, C.; Liu, L. A Multi-Scenario Simulation and Dynamic Assessment of the Ecosystem Service Values in Key Ecological Functional Areas: A Case Study of the Sichuan Province, China. Land 2024, 13, 468. [Google Scholar] [CrossRef]
  33. Walter, E.W. How much are nature’s services worth. Science 1977, 197, 960–964. [Google Scholar] [CrossRef]
  34. Li, J.; Xia, S.; Yu, X.; Li, S.; Xu, C. Evaluation of carbon storage on terrestrial ecosystem in Hebei province based on InVEST model. J. Ecol. Rural Environ. 2020, 36, 854–861. [Google Scholar] [CrossRef]
  35. Kim, T.; Song, C.; Lee, W.; Kim, M.; Kim, J. Habitat quality valuation using InVEST model in Jeju Island. J. Korean Soc. Environ. Restor. Technol. 2015, 18, 1–11. [Google Scholar] [CrossRef]
  36. Liu, Y.; Zhao, W.; Jia, L. Soil conservation service: Concept, assessment, and outlook. Acta Ecol. Sin. 2019, 39, 432–440. [Google Scholar] [CrossRef]
  37. Peng, L.; Deng, W.; Huang, P.; Liu, Y. Evaluation of multiple ecosystem services landscape index and identification of ecosystem service bundles in Sichuan Basin. Acta Ecol. Sin. 2021, 41, 9328–9340. [Google Scholar] [CrossRef]
  38. Cavender-Bares, J.; Polasky, S.; King, E.; Balvanera, P. A sustainability framework for assessing trade-offs in ecosystem services. Ecol. Soc. 2015, 20. [Google Scholar] [CrossRef]
  39. Lester, S.; Costello, C.; Halpern, B.; Gaines, S.; White, C.; Barth, J. Evaluating tradeoffs among ecosystem services to inform marine spatial planning. Mar. Policy 2013, 38, 80–89. [Google Scholar] [CrossRef]
  40. Zhao, Y.; Wang, M.; Lan, T.; Xu, Z.; Wu, J.; Liu, Q.; Peng, J. Distinguishing the effects of land use policies on ecosystem services and their trade-offs based on multi-scenario simulations. Appl. Geogr. 2023, 151, 102864. [Google Scholar] [CrossRef]
  41. Wang, M.; Guo, X.; Wang, F.; Zhang, X. Dynamic change and predictive analysis of land use type in Changchun city based on FLUS model. J. Jilin Univ. (Earth Sci. Ed.) 2019, 49, 1795–1804. [Google Scholar] [CrossRef]
  42. Yang, Q.; Zhang, P.; Qiu, X.; Zhao, Z.; Zhao, R.; Zou, R. Spatiotemporal changes and trade-off analysis of ecosystem services in Ningxia Hui Autonomous Area. China Environ. Sci. 2023, 43, 5453–5465. [Google Scholar] [CrossRef]
  43. La, L.; Gou, M.; Li, L.; Wang, N.; Hu, J.; Liu, C.; Xiao, W. Spatiotemporal dynamics and scenarios analysis on trade-offs between ecosystem service in Three Gorges Reservoir area: A case study of Zigui County. J. Ecol. Rural Environ. 2021, 37, 1368–1377. [Google Scholar] [CrossRef]
  44. Yang, W.; Zhang, H. Ecosystem Service Value Assessment and Multi-Scenario Simulation of Fujiang River Basin Based on GeoSOS-FLUS. Res. Soil Water Conserv. 2022, 29, 253–262. [Google Scholar] [CrossRef]
  45. Wang, X.; Sun, Z.; Feng, X.; Ma, J.; Jia, Z.; Wang, X.; Zhou, J.; Zhang, X.; Yao, W.; Tu, Y. Identification of priority protected areas in Yellow River Basin and detection of key factors for its optimal management based on multi-scenario trade-off of ecosystem services. Ecol. Eng. 2023, 194, 107037. [Google Scholar] [CrossRef]
  46. Ren, B.; Du, Y. Strategy of Ecological Protection and High-Quality Development in the Middle Yellow River. Yellow River 2021, 43, 1–5. [Google Scholar]
  47. Wang, X.; Yang, D.; Feng, X.; Chen, C.; Zhou, C.; Zhang, X.; Ao, Y. Impacts of Ecological Restoration on Water Resources in Middle Reaches of Yellow River. Bull. Soil Water Conserv. 2020, 40, 205–212. [Google Scholar] [CrossRef]
  48. Chen, D.; Li, J.; Yang, X.; Liu, Y. Trade-offs and optimization among ecosystem services in the Weihe River basin. Acta Ecol. Sin. 2018, 38, 3260–3271. [Google Scholar] [CrossRef]
  49. Zeng, J.; Xu, J.; Li, W.; Dai, X.; Zhou, J.; Shan, Y.; Zhang, J.; Li, W.; Lu, H.; Ye, Y. Evaluating Trade-Off and Synergies of Ecosystem Services Values of a Representative Resources-Based Urban Ecosystem: A Coupled Modeling Framework Applied to Panzhihua City, China. Remote Sens. 2022, 14, 5282. [Google Scholar] [CrossRef]
  50. Li, G.; Cai, J. Spatial and Temporal Differentiation of Mountain Ecosystem Service Trade-Offs and Synergies: A Case Study of Jieshi Mountain, China. Sustainability 2022, 14, 4652. [Google Scholar] [CrossRef]
  51. Li, Y.; Luo, H. Trade-off/synergistic changes in ecosystem services and geographical detection of its driving factors in typical karst areas in southern China. Ecol. Indic. 2023, 154, 110811. [Google Scholar] [CrossRef]
  52. Huang, Q.; Chen, T.; Wang, Q.; Feng, Y. Differentiation characteristics of trade-off on ecosystem services and identification of ecological security pattern in karst mountainous areas: A case study of Guizhou Province. Sci. Geogr. Sin. 2024, 44, 1080–1091. [Google Scholar] [CrossRef]
  53. Li, Q.; Jia, Y.; Wang, H.; Wang, Z. Analysis of trade-off and synergy effects of ecosystem services in Hebei province from the perspective of ecological function area. ACTA Geogr. Sin. 2023, 78, 2833–2849. [Google Scholar] [CrossRef]
  54. Chen, W.; Wang, G.; Gu, T.; Fang, C.; Pan, S.; Zeng, J.; Wu, J. Simulating the impact of urban expansion on ecosystem services in Chinese urban agglomerations: A multi-scenario perspective. Environ. Impact Assess. Rev. 2023, 103, 107175. [Google Scholar] [CrossRef]
  55. Zheng, H.; Peng, J.; Qiu, S.; Xu, Z.; Zhou, F.; Xia, P.; Adalibieke, W. Distinguishing the impacts of land use change in intensity and type on ecosystem services trade-offs. J. Environ. Manag. 2022, 316, 115206. [Google Scholar] [CrossRef] [PubMed]
  56. Hasan, S.; Zhen, L.; Miah, M.; Ahamed, T.; Samie, A. Impact of land use change on ecosystem services: A review. Environ. Dev. 2020, 34, 100527. [Google Scholar] [CrossRef]
  57. Feng, X.; Yan, L.; Wang, J.; Yu, E.; Wang, S.; Wu, N.; Xiao, F. Impacts of land use transitions on ecosystem services: A research framework coupled with structure, function, and dynamics. Sci. Total Environ. 2023, 901, 166366. [Google Scholar] [CrossRef] [PubMed]
  58. Jiang, H.; Qin, M.; Wu, X.; Luo, D.; Ouyang, H.; Liu, Y. Spatiotemporal evolution and driving factors of ecosystem service bundle based on multi-scenario simulation in Beibu Gulf urban agglomeration, China. Environ. Monit. Assess. 2024, 196, 542. [Google Scholar] [CrossRef] [PubMed]
  59. Wang, J.; Zhou, W.; Pickett, S.; Yu, W.; Li, W. A multiscale analysis of urbanization effects on ecosystem services supply in an urban megaregion. Sci. Total Environ. 2019, 662, 824–833. [Google Scholar] [CrossRef] [PubMed]
Figure 1. Location of the study area.
Land 13 01243 g001
Figure 2. Research framework.
Land 13 01243 g002
Figure 3. Illustration of scenario settings.
Land 13 01243 g003
Figure 4. Spatial and temporal changes in the level of supply of the four ESs.
Land 13 01243 g004
Figure 5. Correlation analysis of ESs.
Land 13 01243 g005
Figure 6. Identify ES trade-off area based on production possibility frontier first-order derivative.
Land 13 01243 g006
Figure 7. Production possibility frontier and first-order derivative.
Land 13 01243 g007
Figure 8. Land flow maps for the four scenarios from 2020 to 2030, and the level of ES supply in 2030.
Land 13 01243 g008
Figure 9. Production-possibility frontiers and their first-order derivatives for WY and CS as well as WY and HQ. Scenarios I, II, III, and IV represent the ND, CP, EP, and CD scenarios.
Land 13 01243 g009
Table 1. Synergy potential and trade-off intensity of WY and CS under different scenarios.
ScenariosInflection PointSynergy PotentialTrade-Off IntensityChanges in
Synergy Potential
Changes in
Trade-Off Intensity
2020(6.90, −0.388)17.4640.69----
Scenario I(7.50, −0.406)18.0400.613.30%−11.59%
Scenario II(7.75, −0.242)19.0130.588.87%−15.94%
Scenario III(7.54, −0.104)21.3450.4622.22%−33.34%
Scenario IV(7.98, −0.192)20.6380.5318.17%−23.19%
Note: Scenarios I, II, III, and IV represent the ND, CP, EP, and CD scenarios.
Table 2. Synergy potential and trade-off intensity of WY and HQ under different scenarios.
ScenariosInflection PointSynergy PotentialTrade-Off IntensityChanges in
Synergy Potential
Changes in
Trade-Off Intensity
2020(0.17, −0.804)2.8330.62----
Scenario I(0.35, −0.729)2.8430.580.35%−6.45%
Scenario II(0.25, −1.091)2.7610.49−2.51%−20.97%
Scenario III(0.21, −0.430)3.0430.387.41%−40.32%
Scenario IV(0.25, −0.407)2.8690.441.27%−29.03%
Note: Scenarios I, II, III, and IV represent the ND, CP, EP, and CD scenarios.
Disclaimer/Publisher’s Note: The statements, opinions and data contained in all publications are solely those of the individual author(s) and contributor(s) and not of MDPI and/or the editor(s). MDPI and/or the editor(s) disclaim responsibility for any injury to people or property resulting from any ideas, methods, instructions or products referred to in the content.