Article

Optimizing Spatial Distribution of Retail Shops against Neighborhood Tree Canopy Shade Using Big Data Extracted from Streetscape

by
Yifeng Liu
1,2,
Zhanhua Cao
3,
Hongxu Wei
1,2,* and
Peng Guo
3,*
1
State Key Laboratory of Black Soils Conservation and Utilization, Northeast Institute of Geography and Agroecology, Chinese Academy of Sciences, Changchun 130102, China
2
University of Chinese Academy of Sciences, Beijing 100049, China
3
College of Environment and Bioresources, Dalian Minzu University, Dalian 116600, China
*
Authors to whom correspondence should be addressed.
Land 2024, 13(8), 1249; https://doi.org/10.3390/land13081249
Submission received: 7 June 2024 / Revised: 27 July 2024 / Accepted: 31 July 2024 / Published: 9 August 2024

Abstract

:
The visibility of retail frontages is critical for earning profits from spontaneous traffic visits to retail shops located along a street. The urban tree canopy plays a crucial role in enhancing the street-side environment, yet more is not always better when considering the placement of retail shops behind trees with big canopies. Related evidence in the literature is rarely provided, and an unclear relationship has been reported to exist between the number of shops for a specific retail type and the quantified ratio of the canopy shade in a street view. In this study, both big data crawling and deep learning were employed to unravel this relationship for retail shops in Changchun, Northeast China. The entire study area was divided into 6037 grid cells with a side length of ~0.6 km, wherein the number of shops of five retail types (food and beverage, shopping, life services, entertainment, and hotel) were quantified by computer counting their points of interest (POIs). The canopy shade was evaluated using the green view index (GVI) quantified through the ratio of canopy pixels divided by all the pixels in a street view image obtained through an online map API. A neighboring road network was categorized into four classes: class I road density mainly reduced the number of retail shops, and the road densities of classes III and IV accounted for more retail shops. The relationship between the number of retail shops and the GVI could be fitted with positive skewness curves for class II roads, where the critical peak of the GVI was estimated to be about 3.27%. The optimization scheme indicated that more retail shops should be placed along class I and II roads. In conclusion, more retail shops for food and beverage, shopping, and life services should be placed in the landscape neighboring big canopies.

1. Introduction

Retail shops in the forms of shopping malls, offline order platforms, and specialty stores together cater to the business landscape along streets and paths in a city [1]. Retailing plays a conjunctive role that links suppliers and consumers in a commercial relationship in the distribution of goods and services [2]. Retail business relies on the employment of the workforce; hence, it attracts a large portion of the urban population to attend as workers across a vast range of sales [3]. Urbanization results in a higher retail shop density due to the infrastructural advancements of enhanced transportation networks. This not only facilitates retail shopping with high accessibility but also simplifies the process of preparing reserves for sale [4]. In contrast, low-capital retail shops are usually found in locations with low foot traffic, where low visibility can be used to control the cost [5]. Therefore, the decision where to locate a retail shop matters for its fundamental success, and the placement of retail locations in a region is critical for the sustainability of the retail landscape [6].
Urban green space (UGS) plays an important part in the municipal landscape by providing ecosystem services to the public [7,8,9]. The forest canopy is the most visible greenness of the UGS in a street view and functions to reduce negative impacts on civilization and maintain ecological balance [10]. A well-maintained canopy can amplify the attention of visitors and activate their willingness for shopping [11]. Given that some urban forest trees are also planted along streets, overly dense canopies may inadvertently impair the visibility of neighboring shopfronts and potentially impact retail sales [12]. This happens more often in promenades with a long history and densely placed retail stores, where street views may be highly occupied by continuous canopies of old grown trees (Figure 1) [13]. For traffic-independent business, however, the canopy shade may not be so well cared for by managers. These together lead to a potential conflict in the competition of commercial space visibility between the urban tree canopy and retail shopfront for some special business types. The mitigation or resolution of this conflict is critical for retail shop placement and can help to formulate optimization strategies for retail shops.
The urban forest canopy provides ecological contributions to air quality elevation, heat island alleviation, and diverse species conservation [14,15,16]. UGS may also result in canopy shade granularity over neighboring retail shop frontals [12,14,17]. Therefore, the success of a shop with its front shaded by tree canopies is determined more by its business type than by the shading area ratio. The canopy size of an urban tree is determined by a synthesis of the tree species, planting density, pruning regime, and maintenance rotation [18,19,20,21]. The canopy shade for shopfronts can be a fixed factor that is determined by the road class and district attributes [22,23]. Hence, quantifying the numbers of shops of known business types is a necessary precondition for suggesting the optimal shop placement.
The relationship between the number of retail shops and the tree canopy shade has attracted the attention of scholars. Some believe that full greening not only directly enhances the spatial comfort of retail areas but also indirectly optimizes consumers’ shopping experiences and behaviors. Gadish et al. (2023) indicated that green infrastructure functions to regulate the microclimate by providing additional shading effects that promote the cool island effect and thus attract more foot traffic [24]. This relationship was also explored from the perspectives of both consumers and merchants, whose replies showed that a big canopy and neighboring retail shops can coexist as a complement to each other [12]. Although these studies offer valuable ideas and insights, most of their results are low in accuracy due to limits to conventional methodologies for data collection and quantitative analysis. These weaknesses might further lead to bias in documented data and inaccuracy in quantification. Therefore, the key to solving this issue is to employ a new set of novel technologies to accurately obtain data and precisely quantify two key factors, i.e., the number of retail types and the tree canopy shading ratio. Big data crawling and deep learning analysis are two cutting-edge techniques that can fulfill the abovementioned requirements.
A street view is a source of digital pixels that show objects in an image and can be used to establish a big data pool about the green view index (GVI) of a street view [25]. This parameter is an innovative metric that was designed to quantify and assess the presence and extent of greenery or vegetation in an urban landscape, particularly from the perspective of a pedestrian’s experience on the street [26]. Recent research utilized the GVI as an advanced complement to understanding the proportion of the street view occupied by urban greenery [27]. Previous studies focused on the utilization of the GVI in three key areas: first, the evaluation of the impact of urban greenery on businesses and streets [28,29,30,31,32]; second, the simplification of an intricate relationship between the urban greenery and psychological benefits into a quantified response of psychological perceptions to the amount of nature in sight [25,33]; and finally, the role of urban green spaces in mitigating health issues, specifically in relation to respiratory health and psychological health [30,34,35,36]. The employment of GVI aligns with research on urban greenery due to its specific advantages. It is perceived from a pedestrian’s perspective and measures the extent to which retail visibility is shaded by tree canopies in the sight of a potential consumer [25]. Moreover, GVI data are readily accessible, which facilitates the construction of extensive databases for analyzing real-world conditions that correspond to specific coordinates [29]. Its pixel-based analytical approach ensures high accuracy by eliminating subjective biases [13], which makes the GVI an ideal tool for estimating the canopy shade over a shopfront.
For a comprehensive quantification and categorization of retail stores, it is crucial to precisely locate the position of each store and discern its type and scale. To achieve this, point of interest (POI) data are essential. A POI is defined as a specific point on a map or geographic information system (GIS) that marks a geographical location of particular significance or interest [37]. Recent research effectively utilized POIs to delve into various facets of urban landscapes that show attractiveness across a wide range of locations. For example, POIs were flexibly used for mapping the geographical distribution of typical plots that reflect changes in urban land uses and businesses [38,39,40]. It was also used to analyze the spatial distribution of urban infrastructures with varied services to meet anthropogenic needs [41,42,43]. Additionally, POI data were instrumental in assessing the patterns of urban socio-economic parameters for public services, such as instances in Nanjing and Chongqing [37,44,45,46]. Mapping retail shop positions using POIs would be a reliable approach that is readily accessible to plots on a geographical scale across a city.
By integrating POIs with the GVI, we could comprehensively investigate the impact of urban tree canopies on the number of retail shops for each business type. Their relationships could be assessed using the current spatial placements of shopfronts behind large canopies. This allows for future optimization according to the current positions based on factors regarding the retail type, road category, and regional attributes of the host municipal district. In this study, Changchun was chosen as the city case study, where the GVI was extracted from all street view images crawled from all four types of streets, roads, and paths across all municipal districts. The coordinates of all types of retail shops were collected and pooled using the geographical information attached to their POI; hence, the numbers of retail shops could be placed along all transport access routes for all types of businesses on a municipal scale. Our objectives were to (i) determine the relationship between the GVI and the POI for every retail type, (ii) evaluate the rationality of the placements of existing street-side retail stores subjected to street tree canopy shade, and (iii) put forth optimization schemes for retail business placement in newly urbanized regions. Considering that an appropriate increase in urban greenery can promote commercial activities [12], it was surmised that a higher visibility of the shopfront can generally enhance sales for a retail shop [4]. The findings and conclusions of our study will be useful for decision makers from urban planning and business development departments as a theoretical reference for the spatial placement of retail shops.

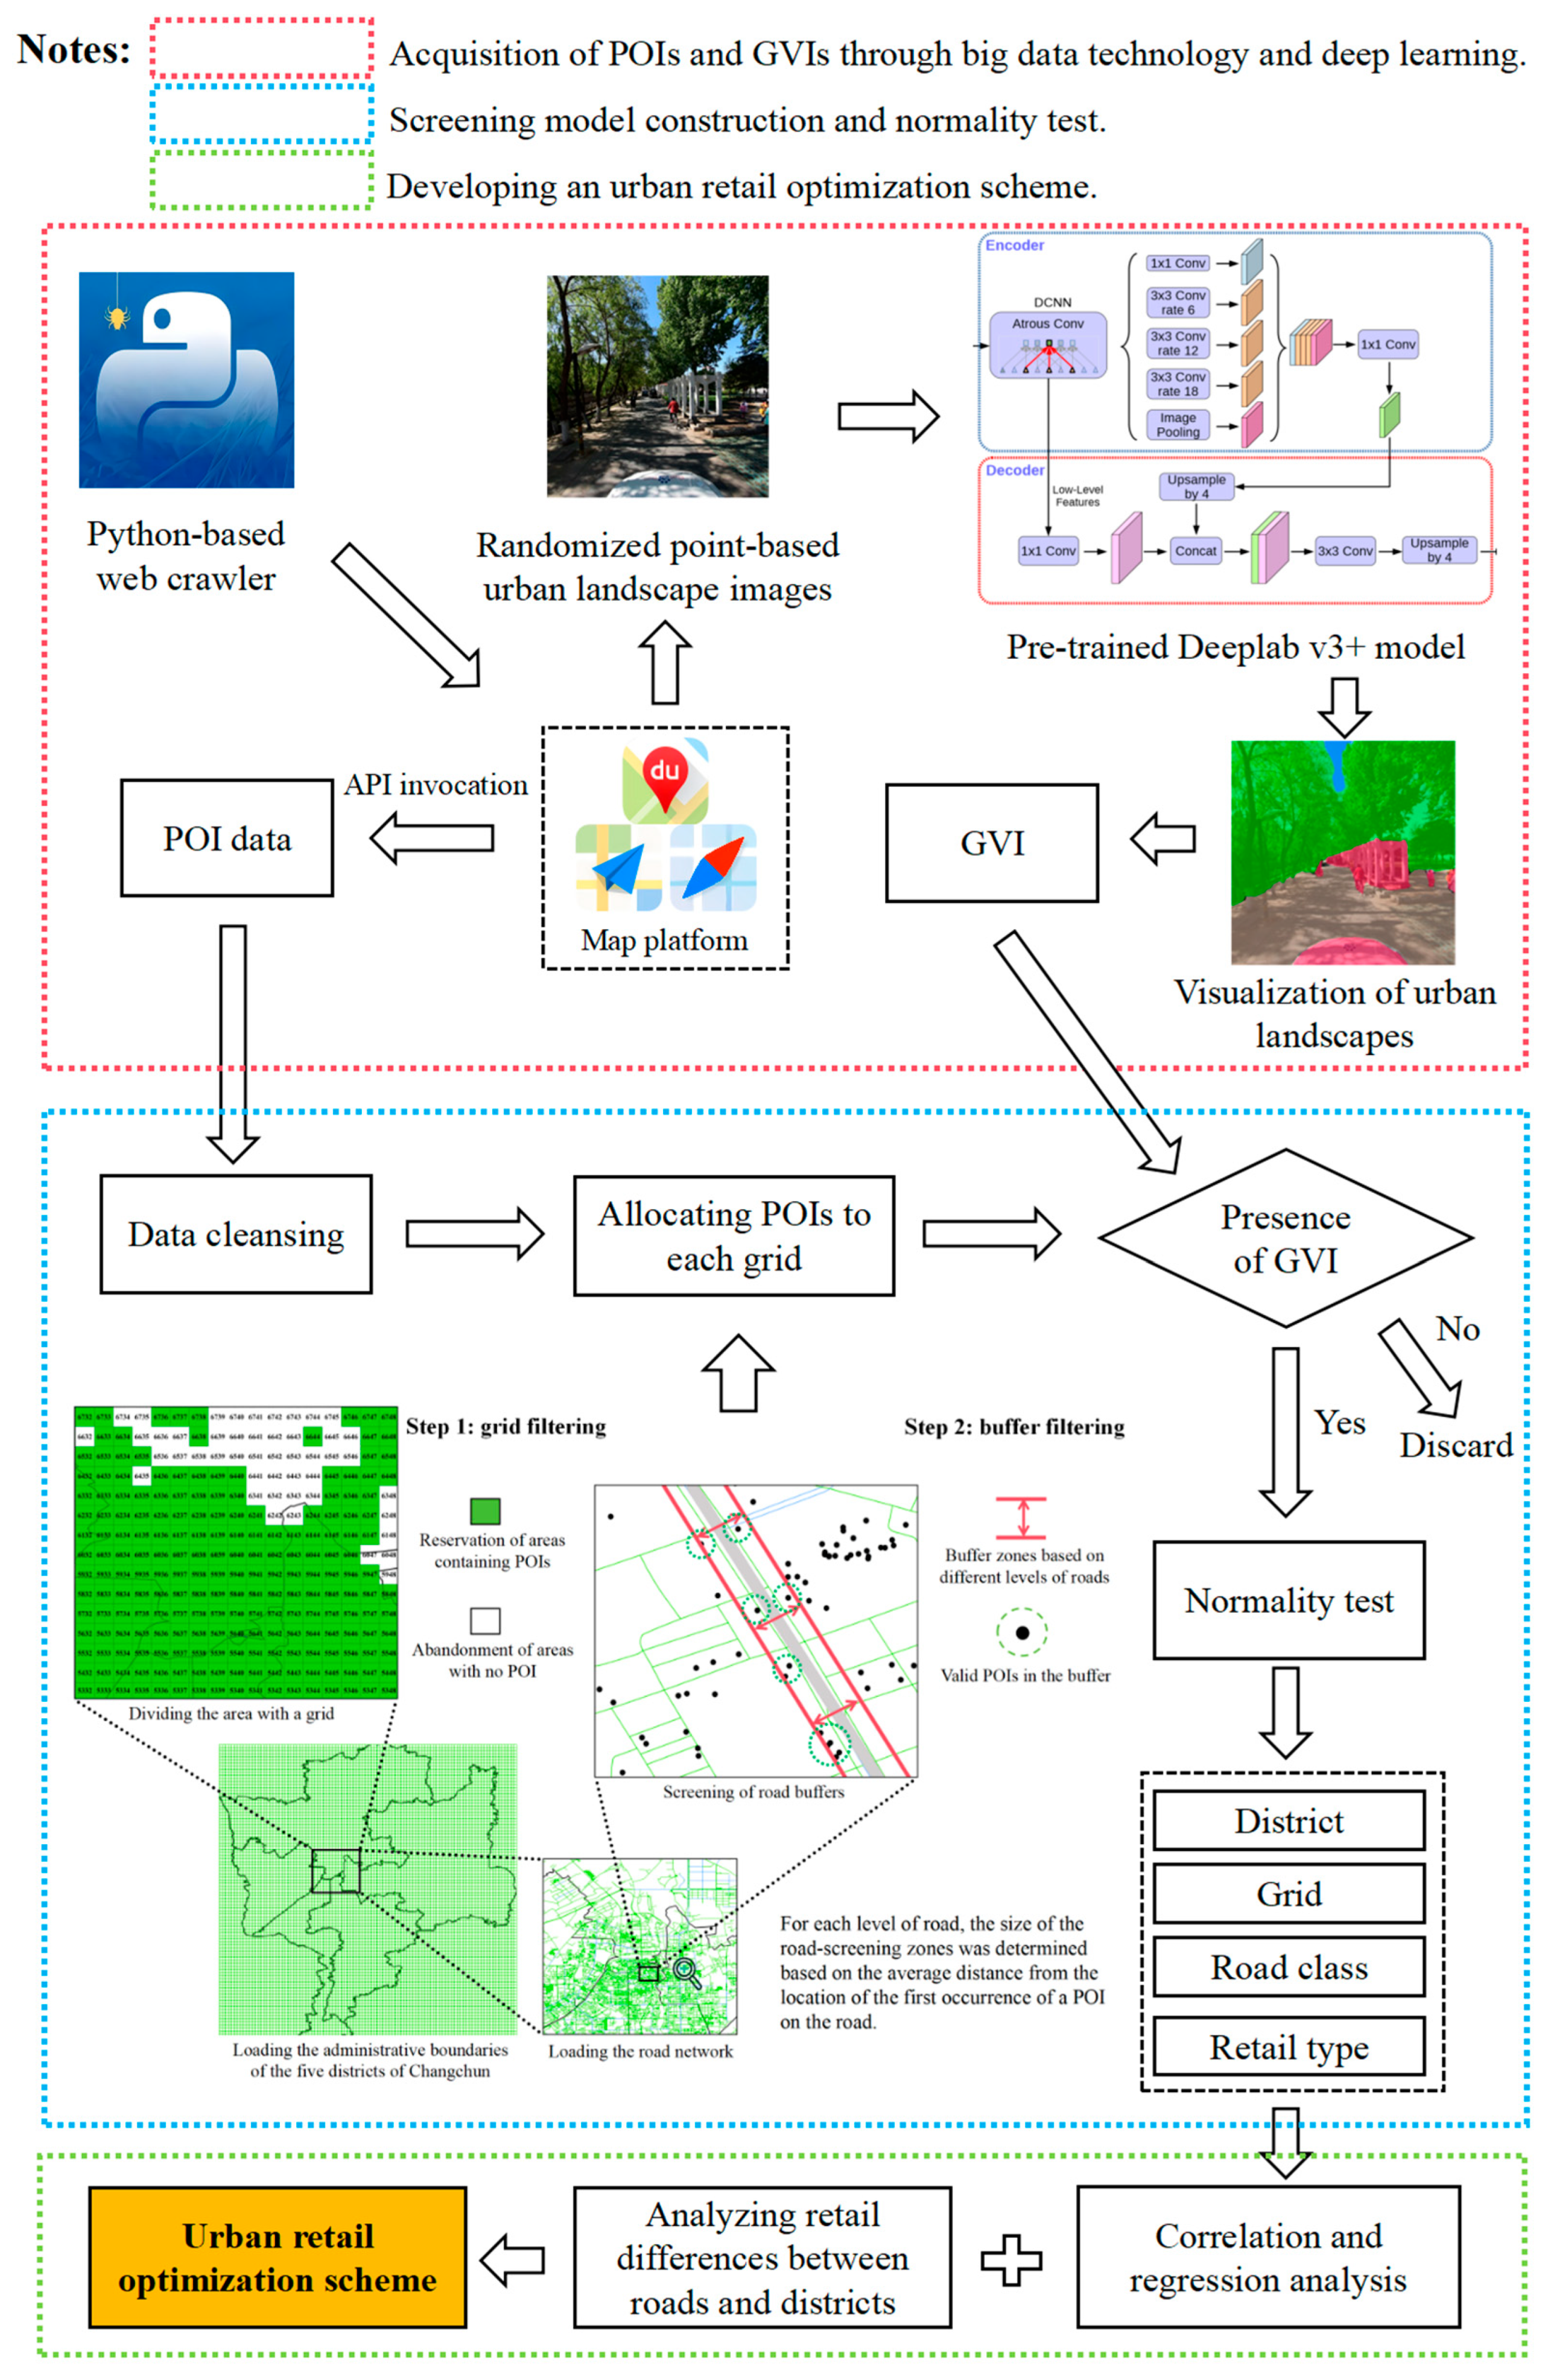
2. Materials and Methods

The technical flowchart of the study is shown in Figure 2. This study enhanced the spectrum and accuracy of data collection by incorporating big data scraping and deep learning technologies. Specifically, we calculated the GVIs using street view images and analyzed them in conjunction with the POIs through deep learning models. This generated a more precise quantification of the retail number data and further clarified their relationship with the canopy shade and retail shop distribution. These methodological innovations enabled us to overcome the limitations of conventional approaches and provide research results with essential empirical meaning.

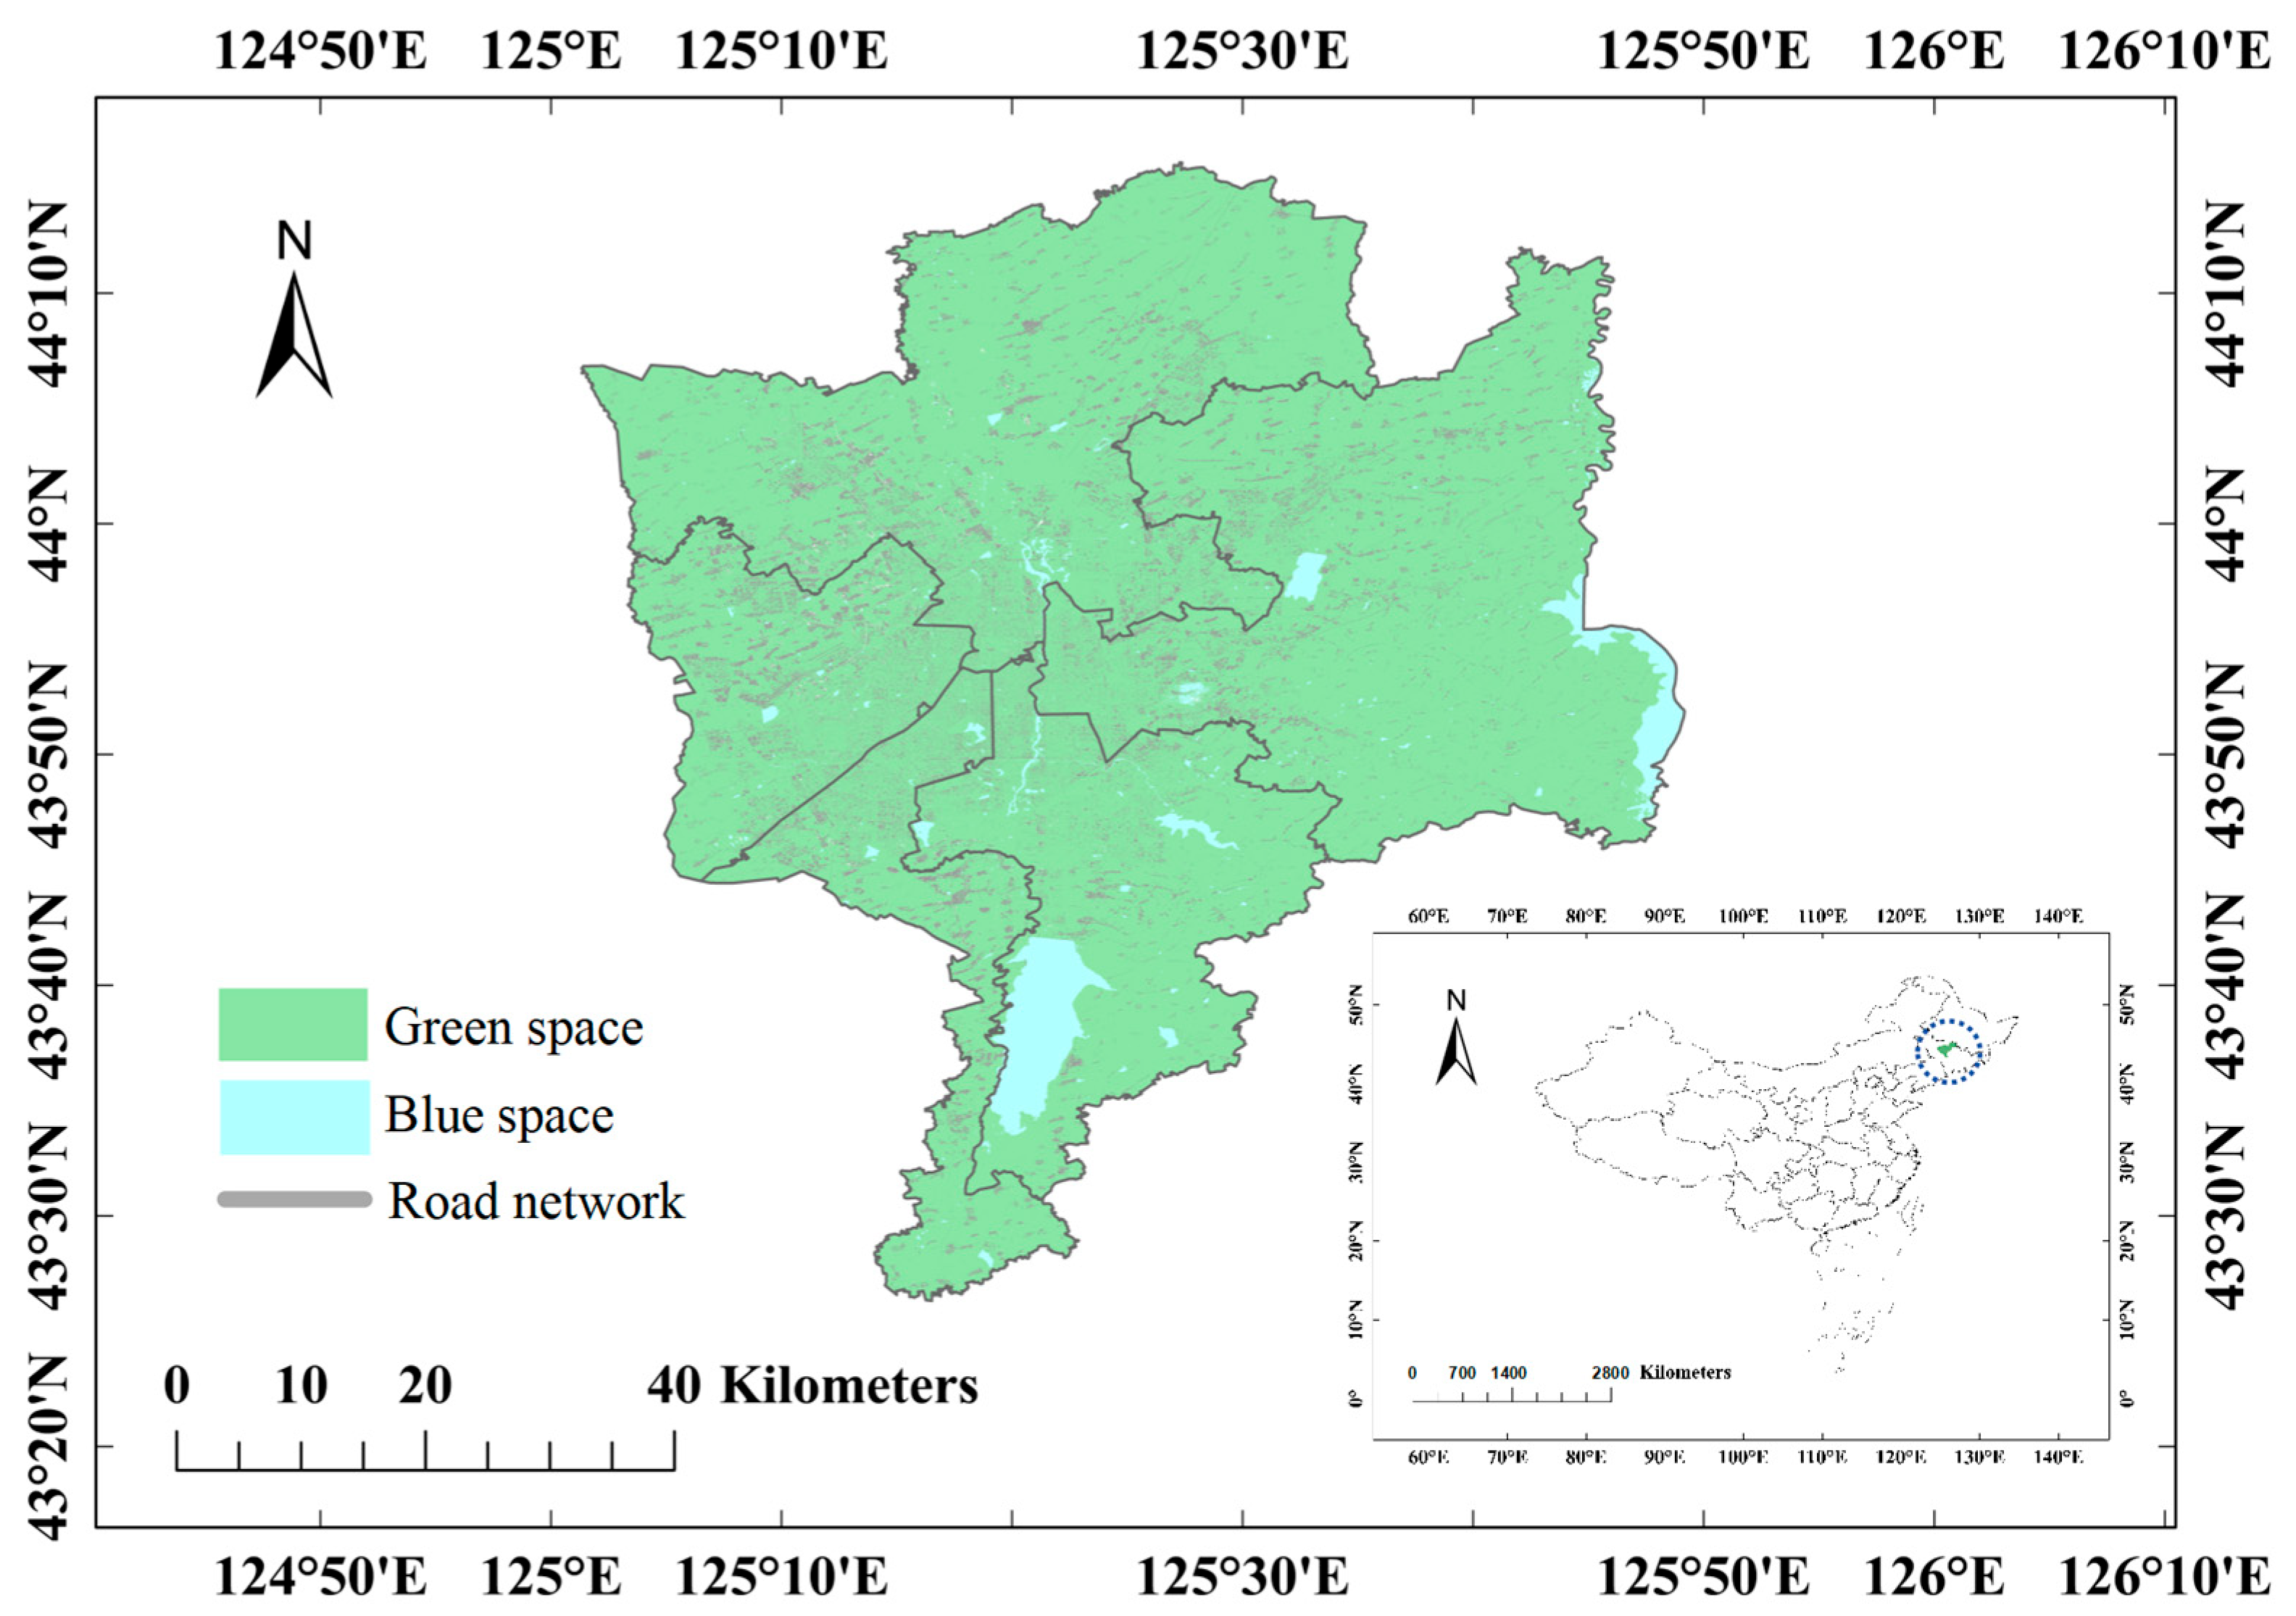
2.1. Study Area and Sampling Plots

Known for its rich cultural heritage resources and vibrant economic environment, Changchun was chosen as the study area, with five municipal districts involved, namely Chaoyang, Erdao, Kuancheng, Lvyuan, and Nanguan (Figure 3). The selection of five districts was based on the following three criteria: First, these districts encompassed the main economic activity areas of Changchun, including the commercial districts, residential areas, and industrial zones, which represented the different characteristics of urban economic activities. Second, these districts exhibited commercial diversity in their urban layouts, including old city areas, newly developed areas, and suburban areas, and thus, they reflected different stages of urban development. Additionally, the geographical locations and environmental characteristics of these districts were varied and facilitated a comprehensive study of the relationship between the urban tree canopy shade and the retail shop distribution. For instance, Chaoyang District had more commercial centers, while Erdao and Kuancheng Districts more accurately reflected the characteristics of the residential and industrial areas. For the ease of sampling and spatial analysis, we divided the entire research area into 6037 grid cells, each with a side length of approximately 0.6 km. We retained the cells that contained both a POI and GVI, which amounted to 1116 cells. This study focused on the number of POIs and the GVIs in the grids of these five districts of Changchun.

2.2. Data Processing for Road Network across Administrative Districts

The road data used in this study were derived from the SinoLC-1 dataset, which is China’s unique national-scale land cover map with a resolution of 1 m. This dataset was created using a deep learning framework and open-access data, including global land cover products, Open Street Map (OSM), and Google Earth imagery, and covered the entire land surface area of China, which is approximately 9.6 million square kilometers [47]. In the relevant literature, roads are usually divided into four classes based on function, designed speed, roadbed width, lane width, and pavement type [48]. Studies were conducted using different classes of roads to detect traffic states in lanes and streets with varied vehicle flows [49,50,51]. Four classes of road networks were selected from five administrative districts in Changchun. The advantage of using the SinoLC-1 dataset lay in its high resolution and accuracy, extensive coverage, and credibility at the national scale. The overall accuracy and kappa coefficient of the dataset were validated through visual interpretation and statistical validation, making it a highly reliable source for urban landscape analysis [52]. The administrative boundaries of the five districts of Changchun were sourced from the 2023 version of the Gaode Map. Web crawlers were used to download the vector data of the administrative boundaries through an application programming interface (API) connected to the Gaode Map, with the coordinate system of the vector data corrected.

2.3. POI Crawling for Retail Shops

In this study, we developed a web crawler program using Python (Python Software Foundation, Wilmington, DE, USA) that was aimed at gathering retail POI data from various mapping platforms. Online maps from Baidu, Gaode, and Tencent were employed as the sources of POIs. Employing Python’s Scrapy and BeautifulSoup libraries, we formulated an efficient web-crawling strategy, and we utilized tools such as Selenium and Puppeteer to acquire dynamically loaded data. Additionally, we devised strategies to address the limitations of API requests and access restrictions to acquire data through the API of these mapping platforms. Our experiment involved parsing the HTML content of the websites and the JSON content from the API to extract the commercial POI information. Given the large volume of POI data, we used the appropriate databases (such as SQL and NoSQL) for data storage, and data-processing frameworks (like Pandas) for efficient data cleansing and analysis [53]. Throughout this experiment, we strictly adhered to the terms of service and data usage policies of the relevant websites. Special care was taken with the POIs that involved personal information to ensure compliance with data privacy and ethical standards. This study utilized a dataset of POI spatial data from Changchun, which was collected in November 2023. This dataset encompassed 11 categories of POIs, including business, hotel, food and beverage, shopping, life services, entertainment, medical services, and attractions, which collectively represent the primary activities within a city. This study focused on data related to the retail shops extracted from this dataset. Retail shops were categorized into five subcategories based on the secondary classification of POI data: food and beverage, shopping, life services, entertainment, and hotel. The distribution of retail shops in these five districts of Changchun is illustrated in Figure 4, which shows that retail shops in the research areas were not evenly distributed but were mainly concentrated in the central city area and radiated outward, and the number of retail shops decreased from the city center to other areas. Figure 5 shows typical real-world bird’s-eye views of the distributions of POIs in Changchun. The extraction of POIs considered the heterogeneous characteristics of typical urban functional types, and thereby offered more detailed insights into the intricate relationships within the urban functional spaces.
To ensure the accuracy and relevance of the research data, the selection of POIs in this study followed these criteria: First, we selected five major retail categories, namely, food and beverage, shopping, life services, entertainment, and hotels, as these five categories were uniformly used by the platforms to describe retail activities. Second, we used data from major mapping platforms, such as Baidu, Tencent, and Gaode, to ensure the comprehensiveness and representativeness of the data. These platforms had wide coverage and a high update frequency for local retail shops, which provided comprehensive POI information. Additionally, to reduce the data bias, we cross-validated the data from different platforms to ensure the accuracy of each POI’s location and classification information. We imported the retail POIs into a geographic information system (GIS) for the spatial analysis. The selection of POIs was based on the administrative divisions of five districts in Changchun and a network of four classes of roads, with predefined road-filtering zones for each road class. The aim was to retain valid POIs within the area, which were specifically those situated near roads. The filtering zone size for each road class was determined based on the average distance from the first densely clustered community of POIs to the road (Figure 2). Accordingly, we set the filtering zone sizes for the roads of classes I, II, III, and IV at 16, 20, 32, and 58 m, respectively. Each POI coordinate was assigned a corresponding road attribute. Subsequently, the retention and classification processes were applied to the regional grids. To ensure the accuracy of the experiment, only grid cells with GVIs were considered. After filtering out other cells, a total of 1116 valid cells were retained. Following the filtration of all effective cells and POI coordinates, a spatial join operation was conducted to quantify the distribution of the five categories of POI coordinates in the area. These data were then combined with the POIs’ road attributes to filter out the number of each type of POI next to each road class within each cell in each district.

2.4. GVI Estimate for Urban Forest Canopy

Web crawler technology was utilized to obtain urban road landscape images from the Baidu map platform at random locations in five districts in Changchun. This allowed us to construct a dataset of urban landscape photos that covered different districts, roads, and angles in Changchun. This dataset improved the model’s ability to generalize when dealing with a variety of urban road landscapes [27]. We performed data-preprocessing operations, including image resizing, normalization, and data enhancement. Additionally, we applied targeted image-processing techniques, such as color enhancement and contrast adjustment, to effectively address image quality issues, such as unclear images in low light or high contrast. We also utilized the pre-trained Deeplab v3+ model, which is a highly efficient deep learning semantic segmentation model for comprehending complex cityscape images. The model accurately assigns each pixel of an image to a specific category. The model’s design combines an encoder–decoder structure with atrous spatial pyramid pooling (ASPP), which enhances its ability to comprehend image features, resolution, and edge information [54]. To enhance its performance on urban landscape images, we tuned the model by adjusting the hyperparameters to a fine scale using customized loss functions and optimizers, among other techniques. To adapt to the specific characteristics of the urban road landscape images, we used the model to predict the pixel points of the green vegetation in the images and calculate the GVI for each image, which quantified the urban forest canopy.

2.5. Data Analysis and Statistics
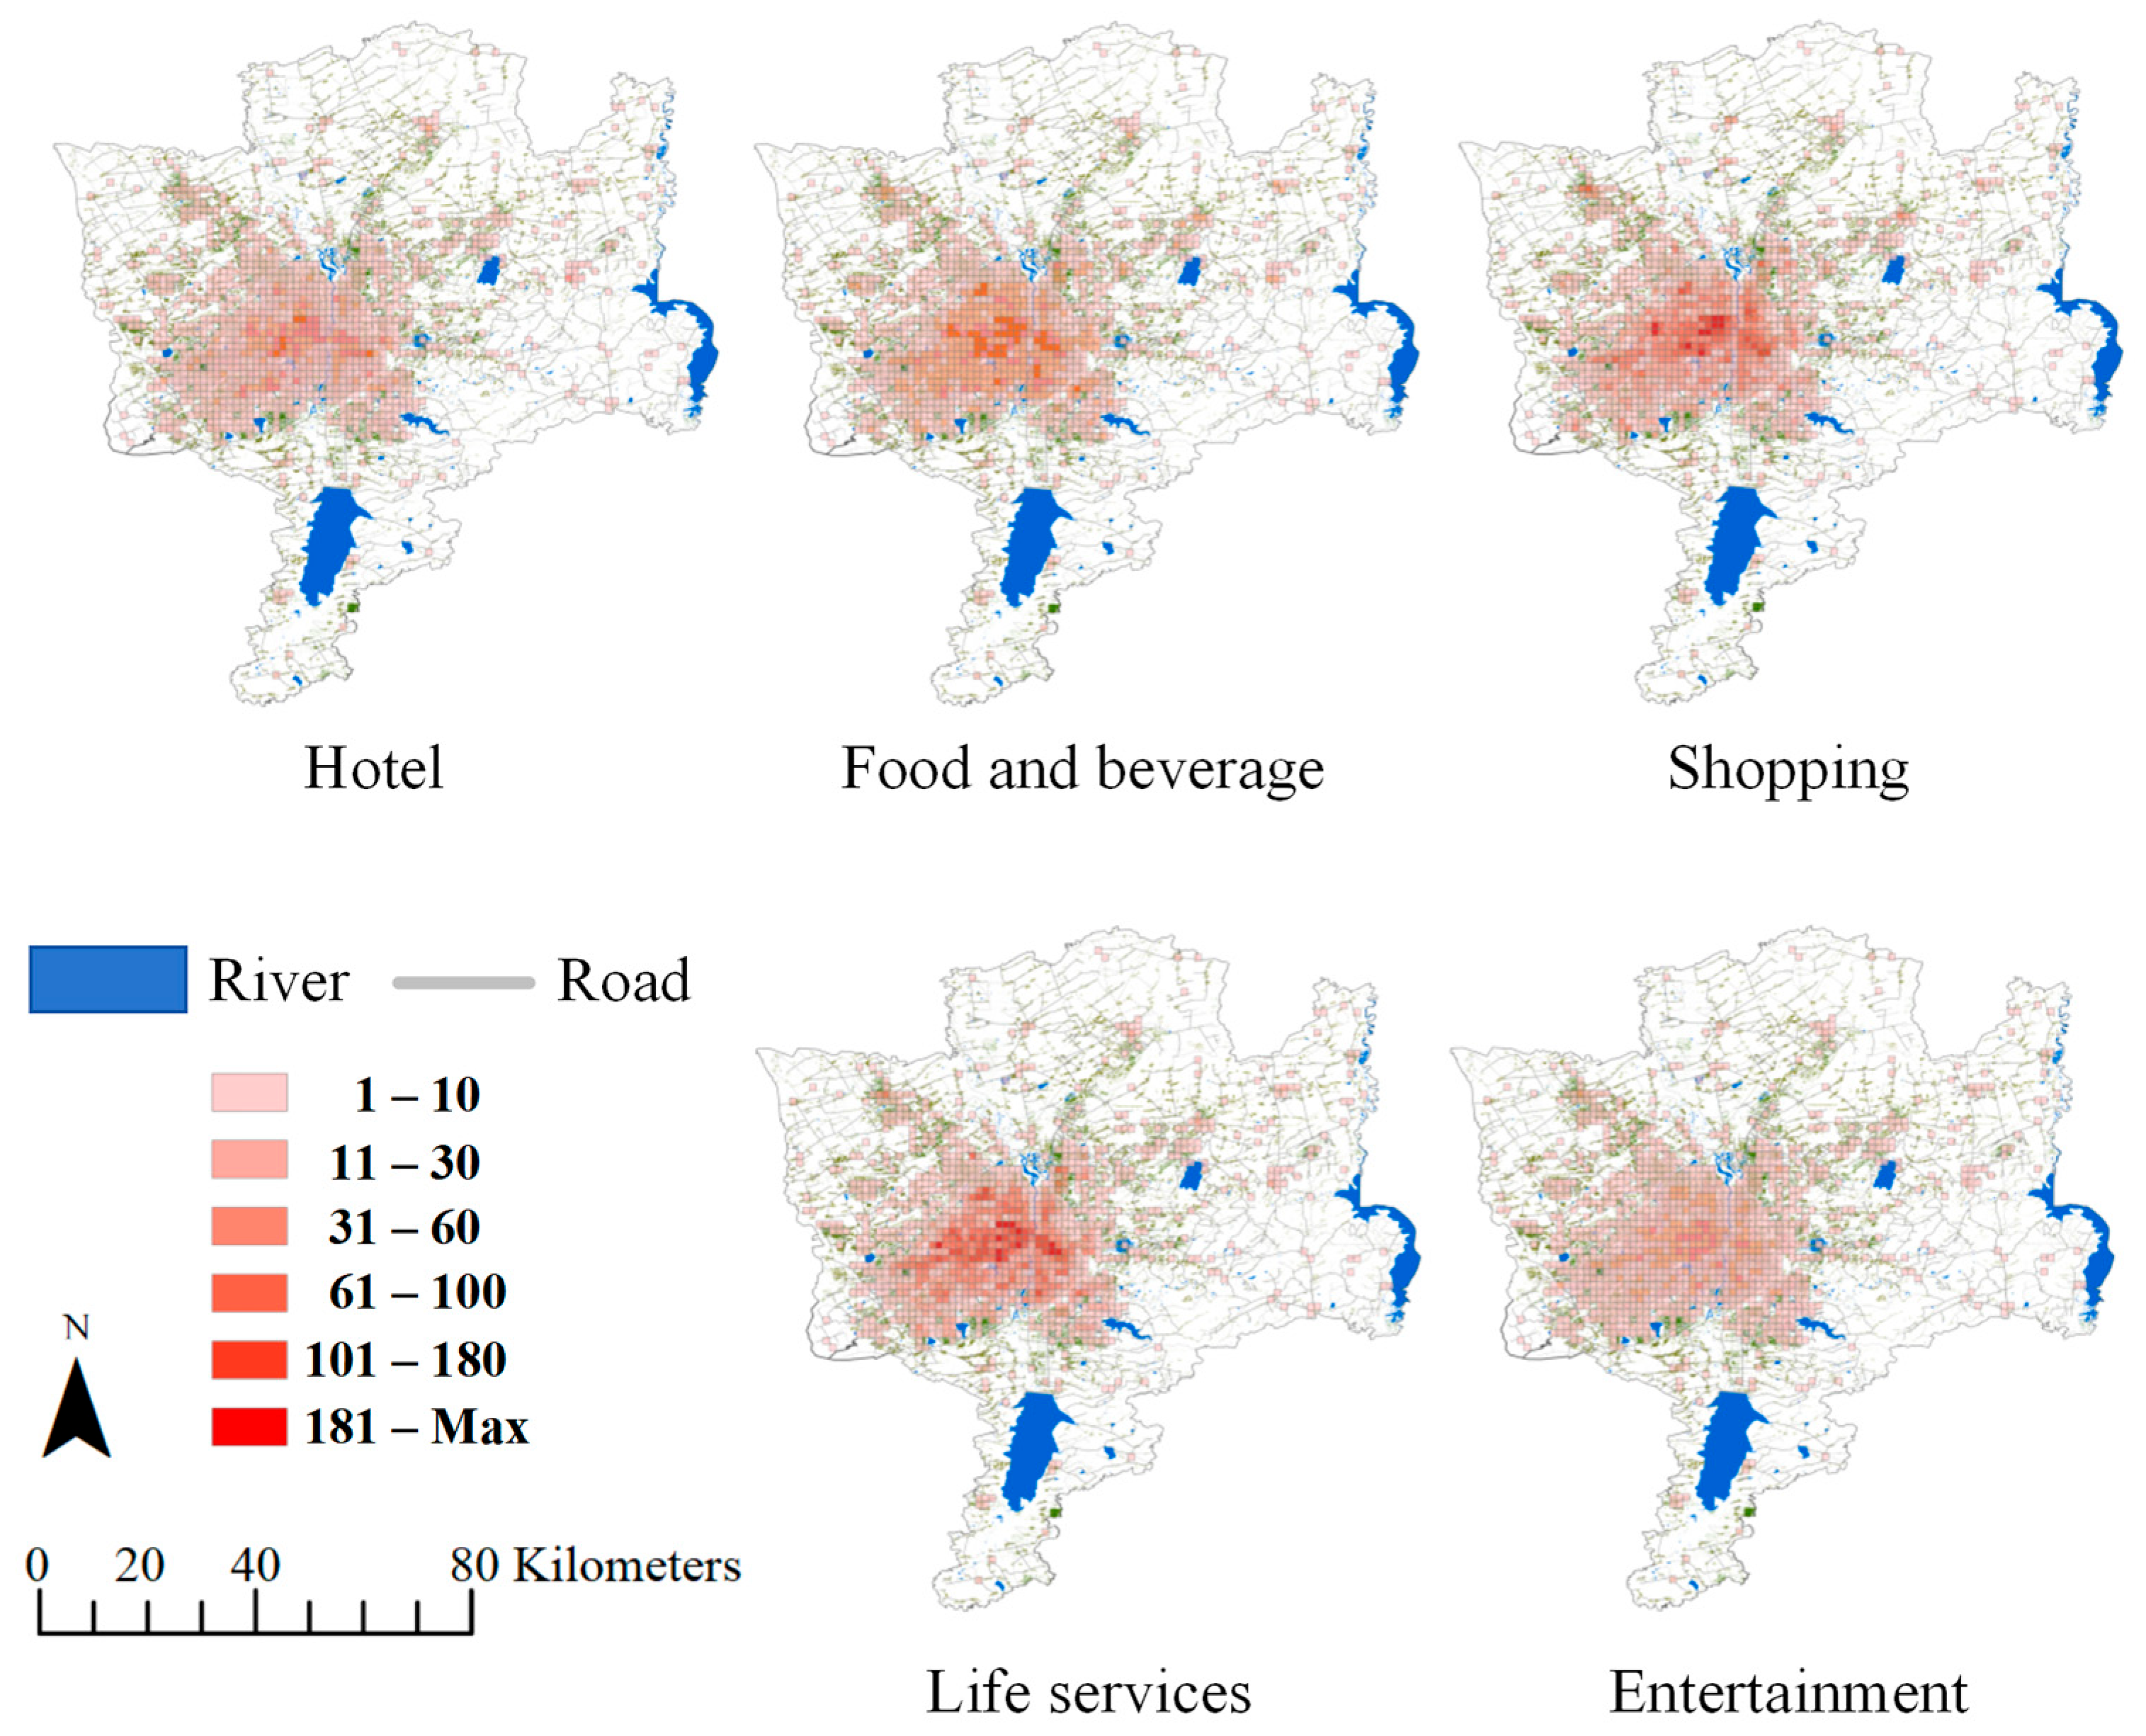
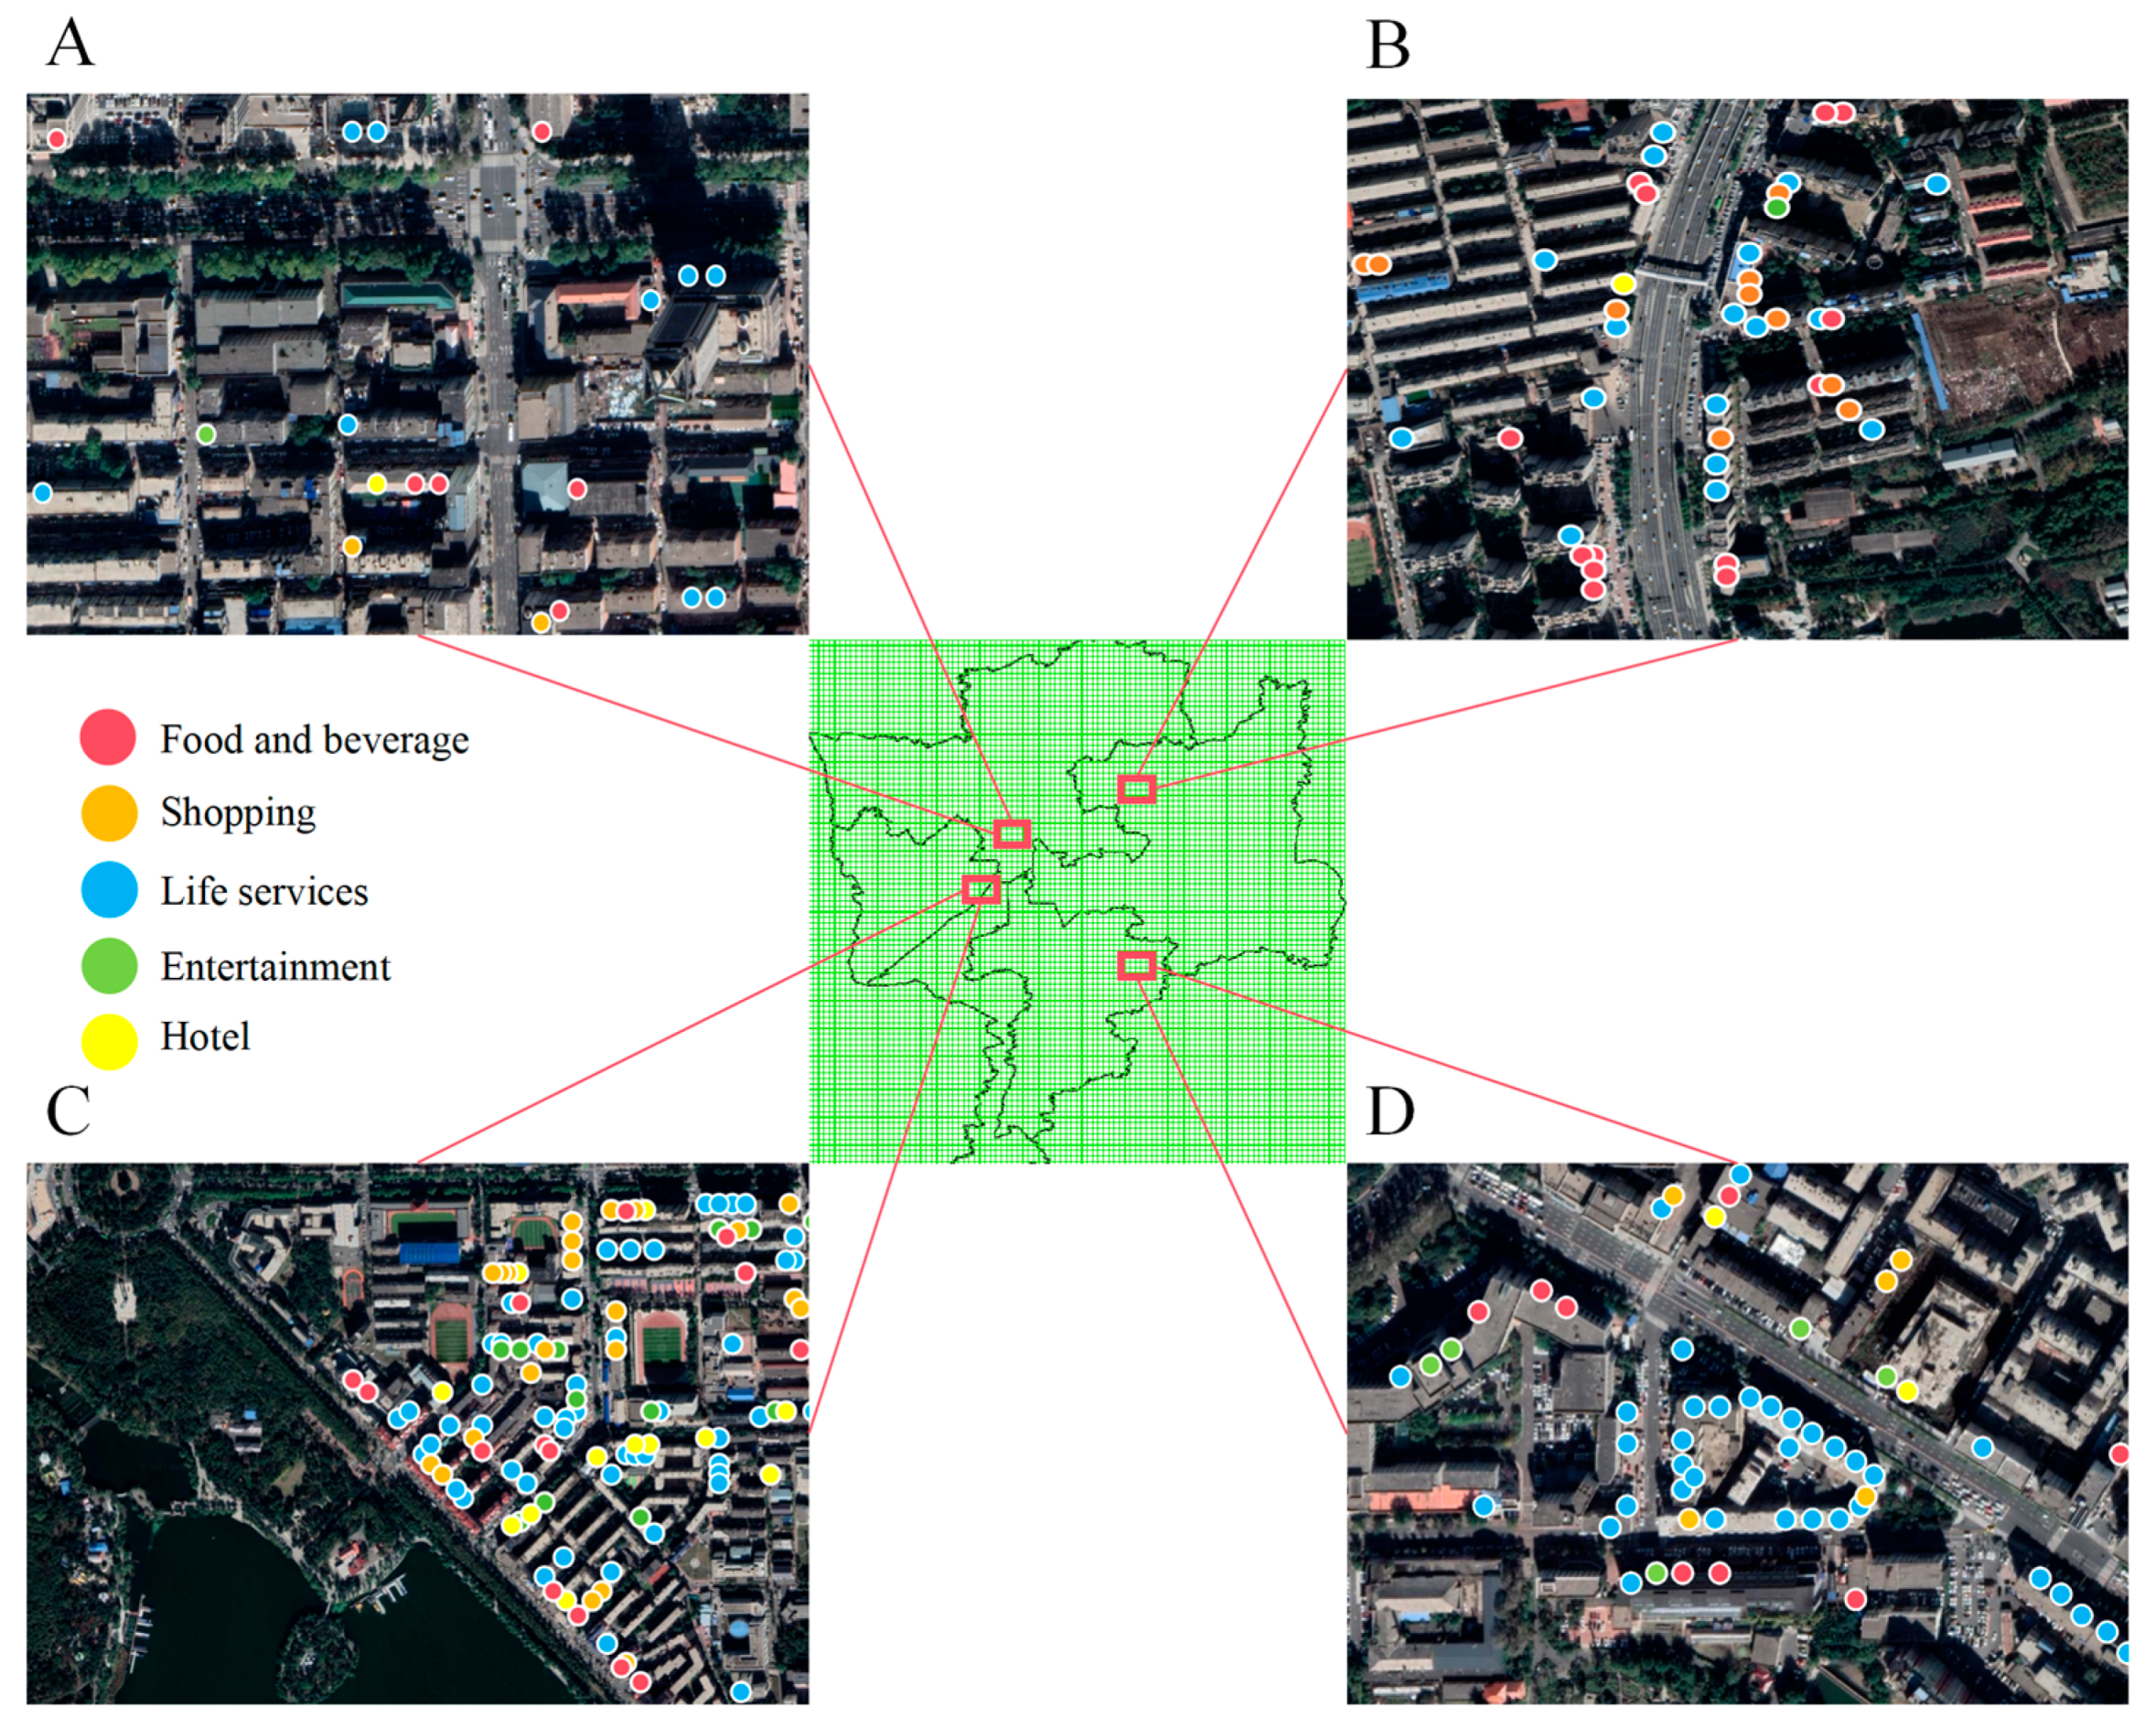
All statistical analyses were conducted using SPSS (IBM Corporation, Armonk, NY, USA). By employing the Shapiro–Wilk test, this study ascertained that most of the data did not follow a normal distribution (p < 0.05) (Figure 6). Consequently, this research utilized the Spearman rank correlation analysis to investigate the relationships between the retail shop types and the GVIs. This non-parametric method is suitable for data that do not conform to a normal distribution, and it effectively delineated the distribution trends of the retail shops within their urban settings. Additionally, regression analysis was employed to explore the causal relationship between the number of retail shops and the GVI, which is a critical aspect for understanding urban planning and development strategies. Furthermore, variance analysis was used to compare the differences in the quantities of retail shops across different road classes and administrative districts, which gave a deeper understanding of the specific impacts of roads and administrative divisions on the retail shop distribution. This analysis aimed to reveal the intricate relationship between the number of retail shops adjacent to roads and the urban GVI, as well as the potential influence of the road class and administrative district on the retail shop distribution. This underscored the role of urban infrastructure and administrative planning in shaping these patterns.

3. Results

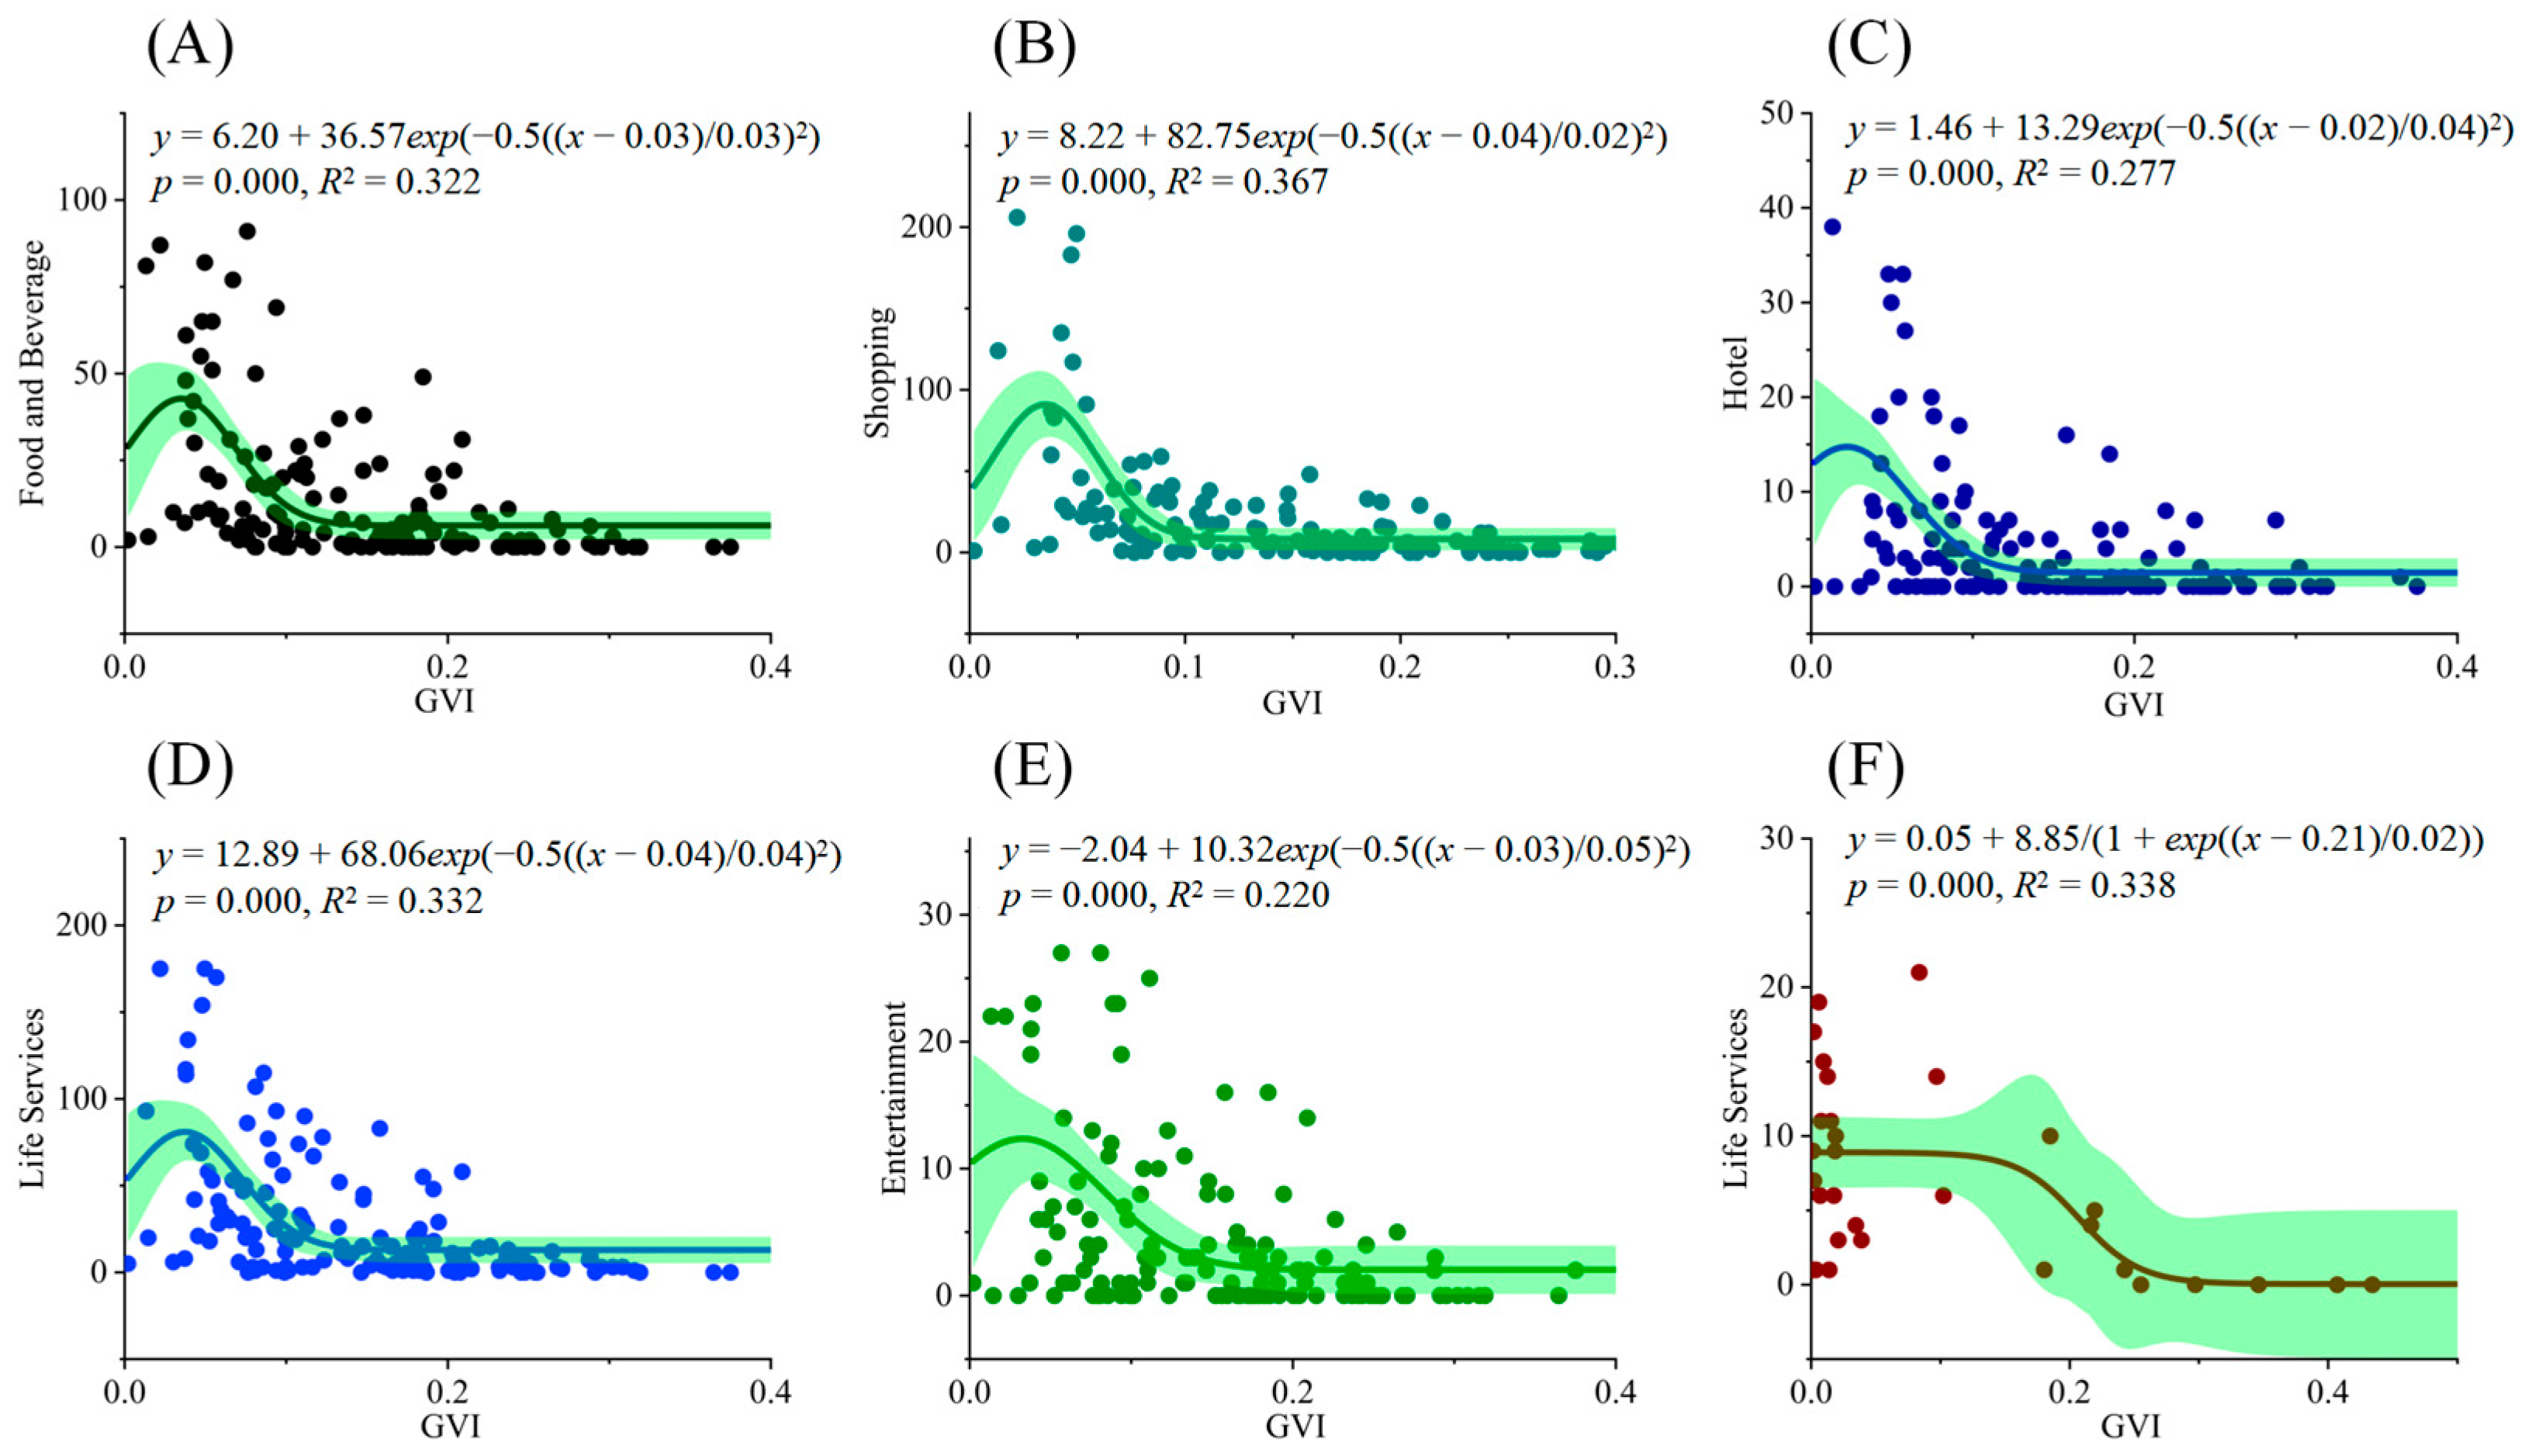
3.1. Correlation between GVI and Retail POI

Table 1 demonstrates the correlations between the numbers of five types of retail shops and the GVI values, which presented a negative correlation overall, except for the hotels alongside class I roads in Erdao District, which showed a positive correlation with the GVI. The parts of the table that display correlations and have a larger coefficient of determination (R2 > 0.2) are shown in Figure 7, which displays the best regression fit lines for these cases. The relationship between the number of retail shops and the GVI could be fitted by non-linear models described by positive skewness curves, where the critical peak of the GVI was estimated to be about 3.27% (Figure 7A–E). Along class III roads, the retail shops that provided life services did not decline with the increase in the GVI while the GVI was under 15.26% (Figure 7F).

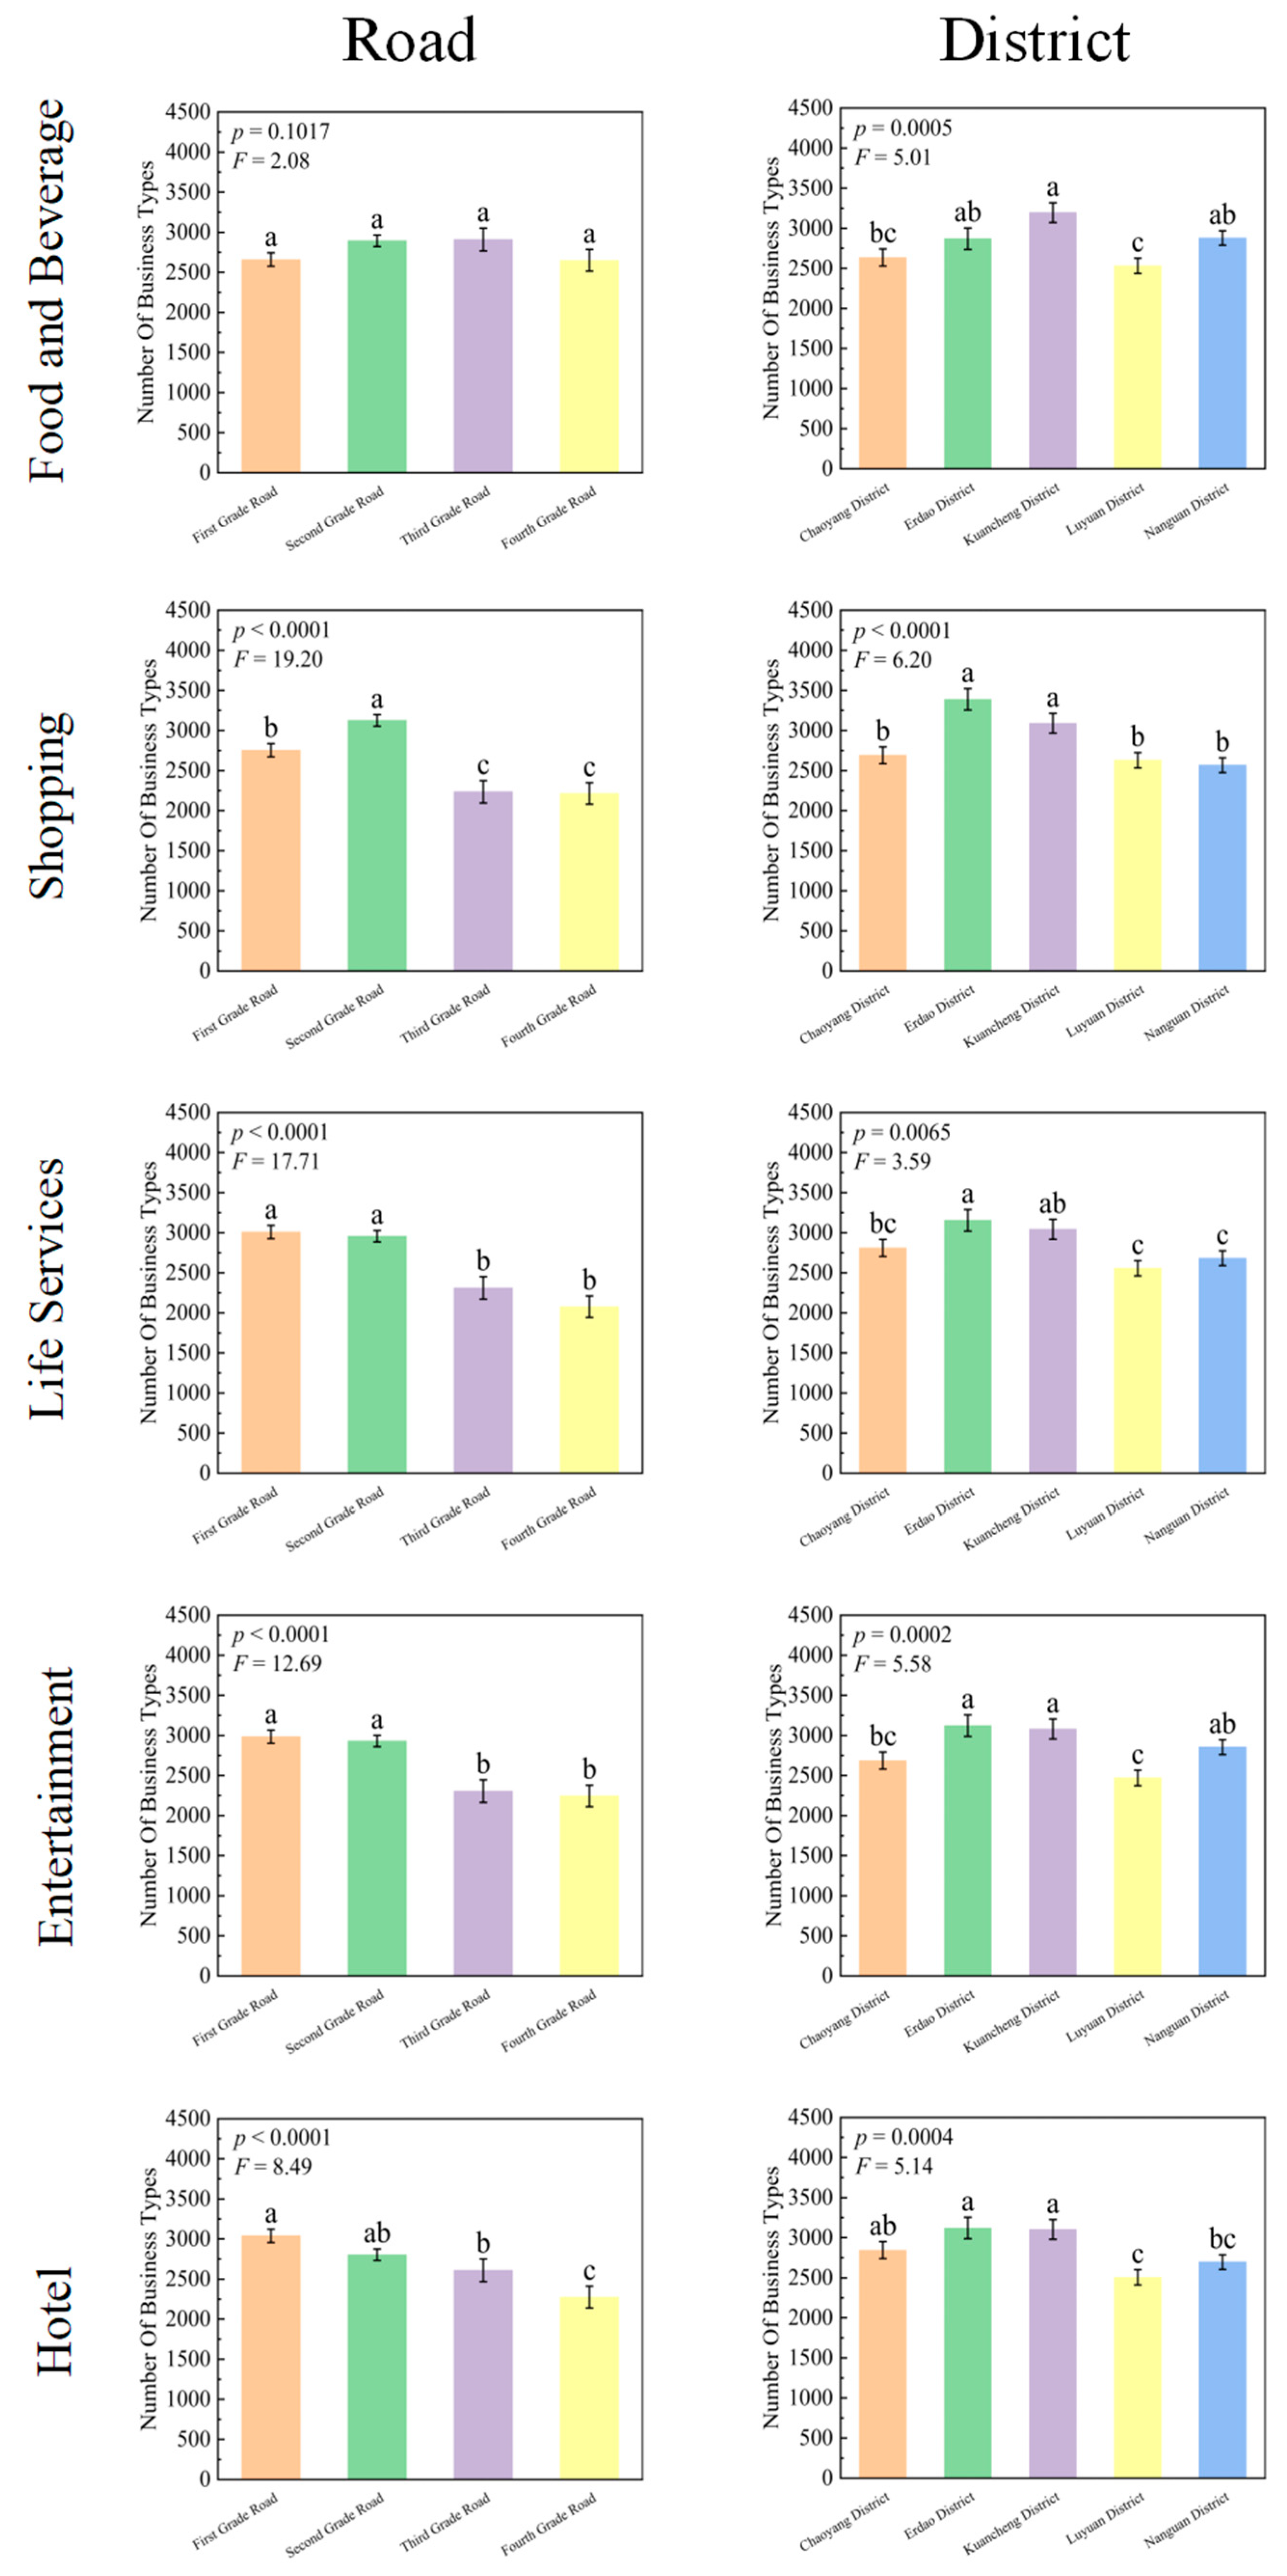
3.2. Road Length and Administrative Variation in Retail POI

Across all retail categories, there was a visible variance in the numbers of retail shops across different districts (Figure 8). Erdao and Kuancheng both had a relatively high number of each retail type. Chaoyang had a relatively low number of each retail type. The number of retail shops also varied by road class, but the pattern was different from that observed in the districts. Class I and II roads both had a relatively high number of each retail type, while class IV roads had a relatively low number of each retail type.

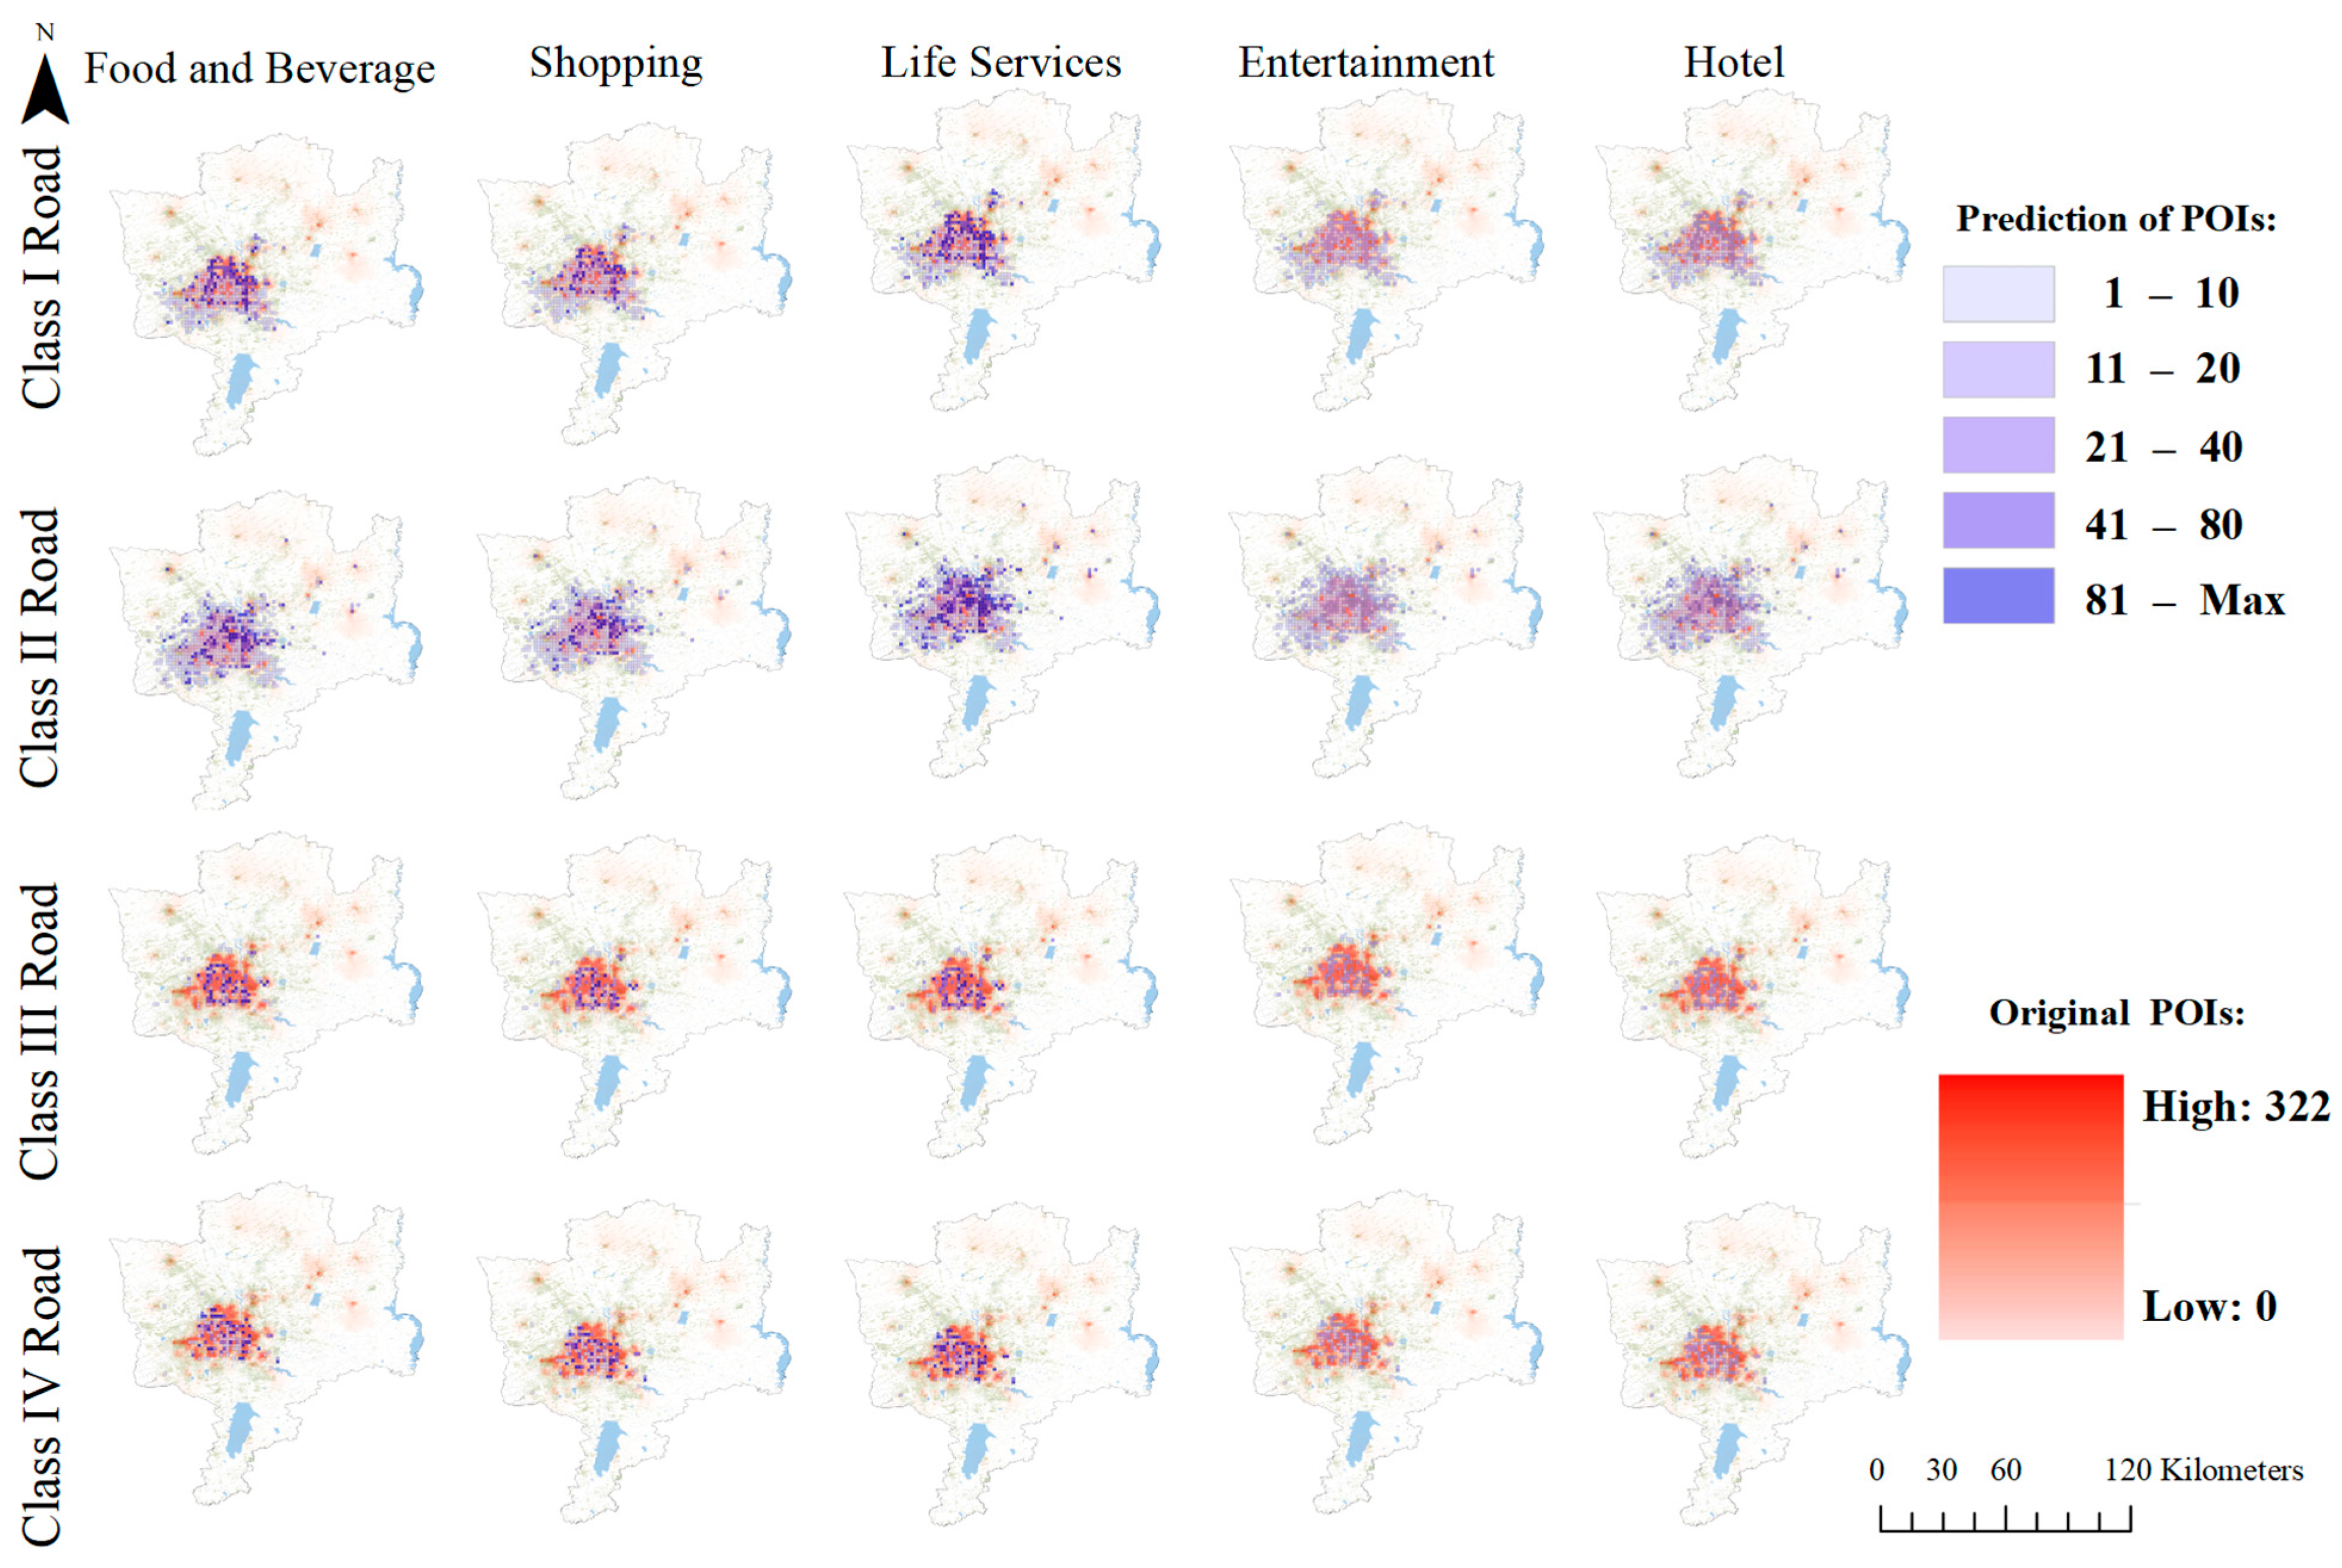
3.3. Spatial Optimization Scheme for Number of Retail Shops against GVI

We utilized the best regression fit function based on the number of various retail types and GVIs to predict the quantity of each retail category, as shown in Figure 9. Subsequently, we calculated the differences between the predicted and actual values for each grid cell and divided these differences into seven intervals, with each one represented by a different color, as illustrated in Figure 10, which makes it clearer how the actual number of retail sales in the region compared with the projected number of sales. There were significant differences between the actual and projected retail numbers in the study area. In terms of the retail categories, the cell differences for entertainment and hotel mostly approached zero (between −10 and 10), which was close to the optimization scheme. The cell differences for food and beverage, shopping, and life services showed a few negative values (between −60 and −11) and many positive values (between 11 and 60), indicating the greatest deviation from the optimization scheme. In terms of roads, the cell differences for class I and II roads tended to be close to zero, with some deviations, whereas for class III and IV roads, the cell differences exhibited a large number of positive values, indicating significant deviations.

4. Discussion

4.1. Relationship between Retail POI and GVI

Our research demonstrated a non-linear relationship between the GVI and the quantity of retail shops that was characterized by an initial increase followed by a decrease, with the retail quantity peaking when the GVI value was around 3.27%. This correlation suggests that both excessive and insufficient urban tree canopies might negatively impact the growth and development of retail quantities. In contrast, previous studies confirmed the positive impact of urban green space on the development of roadside retail [55,56,57]. However, these studies may have overlooked the potential constraints urban tree canopies can impose on different retail locations and operations, where an excessive tree canopy can shade street-level retail storefronts and directly impact the visibility of visitors through random traffic [4,58]. An appropriate amount of urban tree canopy (GVI ranging from 2.00 to 3.27%) not only directly enhances the spatial comfort of urban retail areas but also indirectly optimizes consumers’ shopping experiences and behaviors [4,59,60]. Although urban tree canopies and adjacent retail stores can coexist beneficially, excessive urban tree canopies (GVI > 8%) might obscure storefronts, and thus affect the visibility of retail shops and lead to a decrease in retail quantity [12,56,58]. Our research also found that the number of life service retail shops alongside class III roads in Erdao District drastically decreased when the GVI reached 17.23%. Retail shops that offered life services along class III roads, due to their nature, were mostly located in areas that surrounded residential zones where they could quickly provide services. Their sales and quantity might not be affected by the increase in urban canopy, as their geographical location is a decisive factor instead [61]. However, when the urban canopy becomes overly dense, these retail stores might also be obscured, making them less visible and immediately discoverable by people, thereby affecting their sales quantity. Our study underscored the significant role of urban tree canopies in retail quantity growth and distinguished road types into four functional levels by considering all types of retail, which is an approach that was not adopted by most previous studies.

4.2. Variations in Retail POI between Different Levels of Roads across Districts

The variance analysis indicated significant differences in the quantity of retail across different districts and road classes. Such disparities suggest that the quantity of retail was influenced by the roads and districts, which aligned with conclusions from prior research [23,57,62]. The levels of economic activity, residents’ income, and purchasing power vary across districts, which affect the quantity and type of retail businesses [63]. Districts with stronger economies and higher consumer spending levels are likely to have more high-end retail stores. Conversely, areas with weaker economies might predominantly feature retailers that cater to daily consumer needs. Furthermore, different road levels typically signify varied traffic volumes and accessibility [64]. Higher-level roads (class I and II roads) often connect major commercial areas, residential zones, and other key locations, which attract more retail businesses due to the convenience of transportation [65]. In contrast, lower-level roads (class III and IV roads) may attract more local or small-scale retailers that serve smaller, more distinctive markets [4].

4.3. Optimization of Regional Retail Placement against GVI

Most retail optimization schemes display significant deviations, indicating that the current distribution of retail within cities may be suboptimal. Our investigations suggest that this could be influenced by several factors. Retail shops that are primarily individually owned tend to select their type and location based on personal preference, potentially without fully considering urban environmental factors. This subjective decision-making may lead to irrational layouts. Furthermore, the development of urban greening sometimes follows rather than precedes the establishment of retail shops. This complicates the integration of the urban tree canopy with retail spaces. The optimization scheme indicates that more retail shops are expected to be placed along class I and II roads, as these roads are the main arteries of urban areas that carry higher traffic volumes and have a broader coverage [66]. The higher traffic volume signifies more potential customers, which makes these locations attractive for retailers due to their increased visibility [4]. Consequently, the strategic placement of retail shops along these roads can leverage the traffic flow to attract customers, thereby boosting sales and ensuring business viability. Additionally, the optimization plan indicates that the current number of retail shops along class III roads seems to be sufficient, which suggests a reduction in the deployment of new retail shops in these areas. Class III roads in cities often accommodate a mix of commercial, residential, and institutional land uses, which demonstrates the necessity to provide a diverse range of retail services to meet the varied needs of the urban population. On the other hand, our findings necessitate an increase in the placement of food and beverage, shopping, and life services retail stores along class IV roads; based on the greenery optimization scheme, this has not yet reached saturation, and currently, the number of entertainment venues and hotels along these roads is disproportionately high. Class IV roads typically lie within the inner areas of cities, which might have been originally designated more for commercial, leisure, and tourism purposes, hence the abundance of entertainment and hotel facilities [67,68]. However, these designations overlook the daily needs of residents. As urban areas expand and develop, the commercial potential of these inner-city areas is gradually recognized. However, space limitations in these urban interiors may restrict the establishment of new dining, shopping, and life service retail stores. Previous research rarely addressed retail optimization based on road classifications, which presents a gap in urban planning and development strategies.

4.4. Limitations and Perspectives

This study analyzed the relationship between street tree canopy shade and the distribution of retail shops in Changchun using big data and deep learning. There were some limitations to the research that may affect the current findings and may be overcome in future works. First, the accuracy and comprehensiveness of the POI counting could have been affected by the data quality of different map platforms since these data are time-sensitive and may not reflect the latest retail dynamics. Second, the calculation of the GVI could have been limited by the accuracy of the deep learning model, and factors such as the resolution, lighting conditions, contrast, and timeliness of the street view images could have also affected the accuracy and reliability of the GVI. Additionally, this study only selected five administrative districts in Changchun as research subjects; although these areas were representative, the results may not be fully applicable to other cities or regions. We must acknowledge that this study did not fully consider external variables, such as economic changes and local policies, that could have potentially impacted the relationship between the tree canopy and retail shops; these factors may play important roles in practical applications. Therefore, future research could consider a larger range of urban samples and increase the comparative analysis across different types of cities to enhance the generalizability of the research results. At the same time, integrating more external variables can be important, such as economic development trends, changes in local policies, and infrastructure construction; these would help to deeply explore the comprehensive impacts of these factors on the tree canopy shade and retail development. Furthermore, with the continuous advancement of remote sensing technology and machine learning algorithms, higher-precision data acquisition and analysis methods will help to improve the accuracy and reliability of this future research. Through these efforts, more scientific guidance can be provided to retailers and urban planners to optimize the layout of urban greenery and the distribution of retail shops, which can achieve a win-win situation that provides both urban ecological benefits and economic benefits.

5. Conclusions

In the case of Changchun, not all types of retail shops were affected by the canopy shade along the roadsides. Our study indicates that both excessively high (GVI > 0.08) and low (GVI < 0.02) urban canopy levels had certain negative impacts on the growth and development of retail quantities. Specifically, food and beverage and shopping stores located alongside class I and II roads were more likely to be affected by tree cover, whereas those situated near class III and IV roads that were offering food and beverage and lifestyle services were less impacted. Moreover, the optimization recommendations suggest that the number of food and beverage, shopping, and lifestyle services in urban areas needs to be appropriately optimized, and suburbs require an increase in the variety and number of retail shops to ensure the maximization of urban canopy benefits. Future research can further explore the temporal dynamics of the canopy shade and retail store distribution, as well as the relationship between consumer behavior, canopy shade, and retail visibility. For planners, we recommend selecting tree species that are appropriate for retail areas to avoid over-shading store displays; this involves selecting species with smaller crowns or engaging in regular tree pruning in commercial areas. For retailers, we recommend directing customers’ attention to store locations by installing guide signs and optimizing store layouts to enhance visibility and customer traffic.

Author Contributions

Conceptualization, H.W. and P.G.; methodology, Y.L. and H.W.; software, Y.L. and Z.C.; validation, H.W., Y.L. and Z.C.; formal analysis, Y.L.; investigation, Y.L. and Z.C.; resources, H.W.; data curation, Y.L., Z.C. and H.W.; writing—original draft preparation, Y.L.; writing—review and editing, H.W.; visualization, Y.L.; supervision, H.W. and P.G.; project administration, H.W. and P.G.; funding acquisition, H.W. and P.G. All authors have read and agreed to the published version of the manuscript.

Funding

This study was funded by the National Natural Science Foundation of China (grant numbers 41971122, 41861017, and 31600496) and Fundamental Research Funds for the Central Universities (grant number 04442024091).

Data Availability Statement

The raw data supporting the conclusions of this article will be made available by the authors upon request.

Acknowledgments

Reviewers and editors are acknowledged for their contributions to the corresponding work.

Conflicts of Interest

The authors declare no conflicts of interest.

References

  1. Yang, L.; Li, X.Y.; Zhong, N. Omnichannel retail operations with mixed fulfillment strategies. Int. J. Prod. Econ. 2022, 254, 17. [Google Scholar] [CrossRef]
  2. Grewal, D.; Roggeveen, A.L.; Nordfält, J. The Future of Retailing. J. Retail. 2017, 93, 1–6. [Google Scholar] [CrossRef]
  3. Sazvar, Z.; Sepehri, M. An integrated replenishment-recruitment policy in a sustainable retailing system for deteriorating products. Socio-Econ. Plan. Sci. 2020, 69, 15. [Google Scholar] [CrossRef]
  4. Kang, C.D. Spatial access to pedestrians and retail sales in Seoul, Korea. Habitat Int. 2016, 57, 110–120. [Google Scholar] [CrossRef]
  5. Lian, H.T.; Li, G.M. Correlation Analysis of Retail Space and Shopping Behavior in a Commercial Street Based on Space Syntax: A Case of Shijiazhuang, China. Buildings 2023, 13, 32. [Google Scholar] [CrossRef]
  6. Formánek, T.; Sokol, O. Location effects: Geo-spatial and socio-demographic determinants of sales dynamics in brick-and-mortar retail stores. J. Retail. Consum. Serv. 2022, 66, 16. [Google Scholar] [CrossRef]
  7. Wei, H.; Hauer, R.J.; Sun, Y.; Meng, L.; Guo, P. Emotional perceptions of people exposed to green and blue spaces in forest parks of cities at rapid urbanization regions of East China. Urban For. Urban Green. 2022, 78, 127772. [Google Scholar] [CrossRef]
  8. Wang, H.; Feng, Y.L.; Ai, L.J. Progress of carbon sequestration in urban green space based on bibliometric analysis. Front. Environ. Sci. 2023, 11, 11. [Google Scholar] [CrossRef]
  9. Liu, O.Y.; Russo, A. Assessing the contribution of urban green spaces in green infrastructure strategy planning for urban ecosystem conditions and services. Sust. Cities Soc. 2021, 68, 19. [Google Scholar] [CrossRef]
  10. Shiraishi, K. The inequity of distribution of urban forest and ecosystem services in Cali, Colombia. Urban For. Urban Green. 2022, 67, 9. [Google Scholar] [CrossRef]
  11. He, Q.; Wang, Y.; Qiu, Q.; Su, Y.; Wang, Y.; Wei, H.X.; Li, J.Y. Joint effects of air PM2.5 and socioeconomic dimensions on posted emotions of urban green space visitors in cities experiencing population urbanization: A pilot study on 50 cities of East China. Sci. Total Environ. 2023, 861, 14. [Google Scholar] [CrossRef]
  12. Joye, Y.; Willems, K.; Brengman, M.; Wolf, K. The effects of urban retail greenery on consumer experience: Reviewing the evidence from a restorative perspective. Urban For. Urban Green. 2010, 9, 57–64. [Google Scholar] [CrossRef]
  13. Hamylton, S.M.; Morris, R.H.; Carvalho, R.C.; Roder, N.; Barlow, P.; Mills, K.; Wang, L. Evaluating techniques for mapping island vegetation from unmanned aerial vehicle (UAV) images: Pixel classification, visual interpretation and machine learning approaches. Int. J. Appl. Earth Obs. Geoinf. 2020, 89, 14. [Google Scholar] [CrossRef]
  14. Lefcheck, J.S.; Byrnes, J.E.K.; Isbell, F.; Gamfeldt, L.; Griffin, J.N.; Eisenhauer, N.; Hensel, M.J.S.; Hector, A.; Cardinale, B.J.; Duffy, J.E. Biodiversity enhances ecosystem multifunctionality across trophic levels and habitats. Nat. Commun. 2015, 6, 7. [Google Scholar] [CrossRef]
  15. Mohajerani, A.; Bakaric, J.; Jeffrey-Bailey, T. The urban heat island effect, its causes, and mitigation, with reference to the thermal properties of asphalt concrete. J. Environ. Manag. 2017, 197, 522–538. [Google Scholar] [CrossRef]
  16. Zhang, Q.; Zheng, Y.X.; Tong, D.; Shao, M.; Wang, S.X.; Zhang, Y.H.; Xu, X.D.; Wang, J.N.; He, H.; Liu, W.Q.; et al. Drivers of improved PM2.5 air quality in China from 2013 to 2017. Proc. Natl. Acad. Sci. USA 2019, 116, 24463–24469. [Google Scholar] [CrossRef]
  17. Pyles, M.V.; Magnago, L.F.S.; Borges, E.R.; van den Berg, E.; Carvalho, F.A. Land use history drives differences in functional composition and losses in functional diversity and stability of Neotropical urban forests. Urban For. Urban Green. 2020, 49, 8. [Google Scholar] [CrossRef]
  18. Georgi, L.; Kunz, M.; Fichtner, A.; Bienert, A.; Maas, H.G.; von Oheimb, G. Effects of tree diversity on canopy space occupation vary with tree size and canopy space definition in a mature broad-leaved forest. Agric. For. Meteorol. 2022, 323, 14. [Google Scholar] [CrossRef]
  19. Xu, S.S.; Xu, K.; Zou, G.W.; Yan, J.; Peng, Z.; Zhang, W.W.; Zhang, Y.F.; Han, Y.J.; Wang, J.F.; Chang, J.F. Density management strategy for overstory and understory of urban woodland based on ecological size-density allometry. Urban For. Urban Green. 2021, 66, 8. [Google Scholar] [CrossRef]
  20. Xu, R.; Dai, J.; Luo, W.; Yin, X.; Li, Y.; Tai, X.; Han, L.; Chen, Y.; Lin, L.; Li, G.; et al. A photothermal model of leaf area index for greenhouse crops. Agric. For. Meteorol. 2010, 150, 541–552. [Google Scholar] [CrossRef]
  21. Kneeshaw, D.D.; Prevost, M. Natural canopy gap disturbances and their role in maintaining mixed-species forests of central Quebec, Canada. Can. J. For. Res. 2007, 37, 1534–1544. [Google Scholar] [CrossRef]
  22. Anderson, E.C.; Locke, D.H.; Pickett, S.T.A.; LaDeau, S.L. Just street trees? Street trees increase local biodiversity and biomass in higher income, denser neighborhoods. Ecosphere 2023, 14, 15. [Google Scholar] [CrossRef]
  23. Zheng, J.; Dong, S.C.; Hu, Y.J.; Li, Y. Comparative analysis of the CO2 emissions of expressway and arterial road traffic: A case in Beijing. PLoS ONE 2020, 15, 15. [Google Scholar] [CrossRef]
  24. Gadish, I.; Saaroni, H.; Pearlmutter, D. A predictive analysis of thermal stress in a densifying urban business district under summer daytime conditions in a Mediterranean City. Urban Clim. 2023, 48, 16. [Google Scholar] [CrossRef]
  25. Chiang, Y.C.; Liu, H.H.; Li, D.Y.; Ho, L.C. Quantification through deep learning of sky view factor and greenery on urban streets during hot and cool seasons. Landsc. Urban Plan. 2023, 232, 11. [Google Scholar] [CrossRef]
  26. Zhang, F.; Zhou, B.L.; Liu, L.; Liu, Y.; Fung, H.H.; Lin, H.; Ratti, C. Measuring human perceptions of a large-scale urban region using machine learning. Landsc. Urban Plan. 2018, 180, 148–160. [Google Scholar] [CrossRef]
  27. Li, X.J.; Zhang, C.R.; Li, W.D.; Ricard, R.; Meng, Q.Y.; Zhang, W.X. Assessing street-level urban greenery using Google Street View and a modified green view index. Urban For. Urban Green. 2015, 14, 675–685. [Google Scholar] [CrossRef]
  28. Zhu, H.Z.; Nan, X.E.; Yang, F.; Bao, Z.Y. Utilizing the green view index to improve the urban street greenery index system: A statistical study using road patterns and vegetation structures as entry points. Landsc. Urban Plan. 2023, 237, 16. [Google Scholar] [CrossRef]
  29. Wu, J.Y.; Wang, B.H.; Ta, N.; Zhou, K.; Chai, Y.W. Does street greenery always promote active travel? Evidence from Beijing. Urban For. Urban Green. 2020, 56, 14. [Google Scholar] [CrossRef]
  30. Zhang, L.Q.; Tan, P.Y.; Richards, D. Relative importance of quantitative and qualitative aspects of urban green spaces in promoting health. Landsc. Urban Plan. 2021, 213, 13. [Google Scholar] [CrossRef]
  31. Yang, J.C.; Rong, H.; Kang, Y.H.; Zhang, F.; Chegut, A. The financial impact of street-level greenery on New York commercial buildings. Landsc. Urban Plan. 2021, 214, 12. [Google Scholar] [CrossRef]
  32. Huang, D.K.; Tian, M.; Yuan, L. Sustainable design of running friendly streets: Environmental exposures predict runnability by Volunteered Geographic Information and multilevel model approaches. Sustain. Cities Soc. 2023, 89, 9. [Google Scholar] [CrossRef]
  33. Ki, D.; Lee, S. Analyzing the effects of Green View Index of neighborhood streets on walking time using Google Street View and deep learning. Landsc. Urban Plan. 2021, 205, 11. [Google Scholar] [CrossRef]
  34. Yu, H.Y.; Zhou, Y.; Wang, R.Y.; Qian, Z.M.; Knibbs, L.D.; Jalaludin, B.; Schootman, M.; McMillin, S.E.; Howard, S.W.; Lin, L.Z.; et al. Associations between trees and grass presence with childhood asthma prevalence using deep learning image segmentation and a novel green view index. Environ. Pollut. 2021, 286, 8. [Google Scholar] [CrossRef]
  35. Sun, P.J.; Song, Y.; Lu, W. Effect of Urban Green Space in the Hilly Environment on Physical Activity and Health Outcomes: Mediation Analysis on Multiple Greenery Measures. Land 2022, 11, 19. [Google Scholar] [CrossRef]
  36. Wu, H.T.; Gai, Z.Q.; Guo, Y.X.; Li, Y.W.; Hao, Y.; Lu, Z.N. Does environmental pollution inhibit urbanization in China? A new perspective through residents’ medical and health costs. Environ. Res. 2020, 182, 9. [Google Scholar] [CrossRef]
  37. Liu, K.; Yin, L.; Lu, F.; Mou, N.X. Visualizing and exploring POI configurations of urban regions on POI-type semantic space. Cities 2020, 99, 10. [Google Scholar] [CrossRef]
  38. Wu, H.; Lin, A.Q.; Xing, X.D.; Song, D.X.; Li, Y. Identifying core driving factors of urban land use change from global land cover products and POI data using the random forest method. Int. J. Appl. Earth Obs. Geoinf. 2021, 103, 13. [Google Scholar] [CrossRef]
  39. Huang, C.; Xiao, C.L.; Rong, L.S. Integrating Point-of-Interest Density and Spatial Heterogeneity to Identify Urban Functional Areas. Remote Sens. 2022, 14, 17. [Google Scholar] [CrossRef]
  40. Lu, J.L.; Zheng, X.; Nervino, E.; Li, Y.Z.; Xu, Z.H.; Xu, Y.B. Retail store location screening: A machine learning-based approach. J. Retail. Consum. Serv. 2024, 77, 15. [Google Scholar] [CrossRef]
  41. Zhang, W.J.; Zhao, Y.J.; Cao, X.Y.; Lu, D.M.; Chai, Y.W. Nonlinear effect of accessibility on car ownership in Beijing: Pedestrian-scale neighborhood planning. Transport. Res. Part D-Transport. Environ. 2020, 86, 13. [Google Scholar] [CrossRef]
  42. Li, S.Y.; Lyu, D.J.; Liu, X.P.; Tan, Z.Z.; Gao, F.; Huang, G.P.; Wu, Z.F. The varying patterns of rail transit ridership and their relationships with fine-scale built environment factors: Big data analytics from Guangzhou. Cities 2020, 99, 12. [Google Scholar] [CrossRef]
  43. Li, F.Z.; Li, F.Y.; Li, S.J.; Long, Y. Deciphering the recreational use of urban parks: Experiments using multi-source big data for all Chinese cities. Sci. Total Environ. 2020, 701, 14. [Google Scholar] [CrossRef]
  44. Shi, K.F.; Chang, Z.J.; Chen, Z.Q.; Wu, J.P.; Yu, B.L. Identifying and evaluating poverty using multisource remote sensing and point of interest (POI) data: A case study of Chongqing, China. J. Clean. Prod. 2020, 255, 12. [Google Scholar] [CrossRef]
  45. Ji, Y.J.; Ma, X.W.; He, M.J.; Jin, Y.C.; Yuan, Y.F. Comparison of usage regularity and its determinants between docked and dockless bike-sharing systems: A case study in Nanjing, China. J. Clean. Prod. 2020, 255, 11. [Google Scholar] [CrossRef]
  46. Yu, H.S.; Yang, J.; Li, T.; Jin, Y.; Sun, D.Q. Morphological and functional polycentric structure assessment of megacity: An integrated approach with spatial distribution and interaction. Sustain. Cities Soc. 2022, 80, 9. [Google Scholar] [CrossRef]
  47. Zhang, X.Q.; Qi, Y.; Li, H.Y.; Sun, S.F.; Yin, Q.W. Assessing effect of best management practices in unmonitored watersheds using the coupled SWAT-BiLSTM approach. Sci. Rep. 2023, 13, 15. [Google Scholar] [CrossRef]
  48. Wang, S.C.; Yu, J.C.; Ma, J.F. Identifying the heterogeneous effects of road characteristics on Motorcycle-Involved crash severities. Travel Behav. Soc. 2023, 33, 13. [Google Scholar] [CrossRef]
  49. Chen, B.; Ye, Z.N.; Chen, Z.S.; Xie, X. Bridge vehicle load model on different grades of roads in China based on Weigh-in-Motion (WIM) data. Measurement 2018, 122, 670–678. [Google Scholar] [CrossRef]
  50. Buyukkinaci, B.; Onaygil, S.; Guler, O.; Yurtseven, M.B. Determining minimum visibility levels in different road lighting scenarios. Light. Res. Technol. 2018, 50, 1045–1056. [Google Scholar] [CrossRef]
  51. Alaswadko, N.; Hassan, R. The performance evaluation of heavy and light duty pavements in Victoria/Australia. Int. J. Pavement Eng. 2022, 23, 998–1007. [Google Scholar] [CrossRef]
  52. Wang, Y.Z.; Sun, Y.H.; Cao, X.Y.; Wang, Y.H.; Zhang, W.K.; Cheng, X.L. A review of regional and Global scale Land Use/Land Cover (LULC) mapping products generated from satellite remote sensing. ISPRS J. Photogramm. Remote Sens. 2023, 206, 311–334. [Google Scholar] [CrossRef]
  53. Pfeil, U.; Arjan, R.; Zaphiris, P. Age differences in online social networking—A study of user profiles and the social capital divide among teenagers and older users in MySpace. Comput. Hum. Behav. 2009, 25, 643–654. [Google Scholar] [CrossRef]
  54. Chen, L.C.; Papandreou, G.; Kokkinos, I.; Murphy, K.; Yuille, A.L. DeepLab: Semantic Image Segmentation with Deep Convolutional Nets, Atrous Convolution, and Fully Connected CRFs. IEEE Trans. Pattern Anal. Mach. Intell. 2018, 40, 834–848. [Google Scholar] [CrossRef]
  55. Wu, Z.F.; Ren, Y. The influence of greenspace characteristics and building configuration on depression in the elderly. Build. Environ. 2021, 188, 10. [Google Scholar] [CrossRef]
  56. Wan, P.; Zhang, J.; Liu, Y.W.; Jiang, X.X. Location Optimization of Offline Physical Stores Based on MNL Model under BOPS Omnichannel. J. Theor. Appl. Electron. Commer. Res. 2022, 17, 1633–1654. [Google Scholar] [CrossRef]
  57. Sevtsuk, A. Location and Agglomeration: The Distribution of Retail and Food Businesses in Dense Urban Environments. J. Plan. Educ. Res. 2014, 34, 374–393. [Google Scholar] [CrossRef]
  58. Wolf, K.L. Business district streetscapes, trees, and consumer response. J. For. 2005, 103, 396–400. [Google Scholar] [CrossRef]
  59. Plant, L.; Sipe, N. Adapting and applying evidence gathering techniques for planning and investment in street trees: A case study from Brisbane, Australia. Urban For. Urban Green. 2016, 19, 79–87. [Google Scholar] [CrossRef]
  60. Atkin, D.; Faber, B.; Gonzalez-Navarro, M. Retail Globalization and Household Welfare: Evidence from Mexico. J. Polit. Econ. 2018, 126, 1–73. [Google Scholar] [CrossRef]
  61. Reigadinha, T.; Godinho, P.; Dias, J. Portuguese food retailers—Exploring three classic theories of retail location. J. Retail. Consum. Serv. 2017, 34, 102–116. [Google Scholar] [CrossRef]
  62. Wang, E.R. Understanding the ‘retail revolution’ in urban China: A survey of retail formats in Beijing. Serv. Ind. J. 2011, 31, 169–194. [Google Scholar] [CrossRef]
  63. Kang, C.D. Effect of neighborhood income and consumption on retail viability: Evidence from Seoul, Korea. Habitat Int. 2019, 94, 10. [Google Scholar] [CrossRef]
  64. Adebayo, A.A.; Greenhalgh, P.; Muldoon-Smith, K.; Oyedokun, T. Towards Attaining Sustainable Retail Property Locations: The Relationships between Supply, Demand, and Accessibility of Retail Spaces. Sustainability 2022, 14, 15. [Google Scholar] [CrossRef]
  65. Jang, M.; Kang, C.D. Retail accessibility and proximity effects on housing prices in Seoul, Korea: A retail type and housing submarket approach. Habitat Int. 2015, 49, 516–528. [Google Scholar] [CrossRef]
  66. Daunfeldt, S.O.; Rudholm, N.; Rämme, U. Congestion charges and retail revenues: Results from the Stockholm road pricing trial. Transp. Res. Part A Policy Pract. 2009, 43, 306–309. [Google Scholar] [CrossRef]
  67. Aliedan, M.M.; Sobaih, A.E.; Elshaer, I.A. Influence of Cities-Based Entertainment on Tourist Satisfaction: Mediating Roles of Destination Image and Experience Quality. Sustainability 2021, 13, 14. [Google Scholar] [CrossRef]
  68. Peng, X.X.; Liu, M.X.; Hu, Q.S.; He, X.R. A multiscale perspective on place attachment and pro-environmental behavior in hotel spaces. J. Hosp. Tour. Manag. 2023, 55, 435–447. [Google Scholar] [CrossRef]
Figure 1. Typical streetscapes showing retail shopfronts shaded by neighborhood tree canopies in four cities in China.
Land 13 01249 g001
Figure 2. The technical roadmap of the study.
Land 13 01249 g002
Figure 3. Map of study area in Changchun with spatial distributions of five municipal districts.
Land 13 01249 g003
Figure 4. Spatial distributions of densities in five types of retail shops in study area grids.
Land 13 01249 g004
Figure 5. Typical distributions of shops of five retail types around communities (A), suburban ring roads (B), urban green and blue spaces (C), and downtown institutions (D) in Changchun on Google Maps.
Land 13 01249 g005
Figure 6. Histograms of data distributions for (AE) five retail types and (F) green view index (GVI).
Land 13 01249 g006
Figure 7. Fitted curves with large coefficients of determination (R2 > 0.2). (A) Food and beverage by class II roads in Nanguan District; (B) shopping by class II roads in Nanguan District; (C) hotels by class II roads in Nanguan District; (D) life services by class II roads in Nanguan District; (E) entertainment by class II roads in Nanguan District; (F) life services by class III road in Lvyuan District. Dots of different colors indicate the relationship between retail type and GVI in corresponding coordinate system.
Land 13 01249 g007
Figure 8. Differences in the quantities of retail shops between different road classes and administrative districts. Error bars present the standard errors. Different letters mark significant differences according to Duncan’s test at the 0.05 level.
Land 13 01249 g008
Figure 9. Spatial distributions of the predicted numbers of shops in five retail types overlapping those initially distributed at the start of this study in streetscapes extracted according to five road network levels.
Land 13 01249 g009
Figure 10. Spatial distributions of the numbers of shops calculated by subtracting the predicted values from the measured values in streetscapes along five road network levels in Changchun.
Land 13 01249 g010
Table 1. Summary of correlation coefficient data from correlation analysis.
Road ClassesCoefficientsDistricts of Changchun
ChaoyangErdaoKuanchengLvyuanNanguan
Food and Beverage
Class Ip0.0050.0790.1150.0040.004
R−0.282−0.288−0.235−0.300−0.267
R20.0800.0830.0550.0900.071
Class IIp0.0000.0060.0980.0030.000
R−0.350−0.266−0.156−0.226−0.489
R20.1230.0710.0240.0510.239
Class IIIp0.6860.4300.1400.1130.386
R−0.087−0.252−0.361−0.285−0.139
R20.0080.0640.1300.0810.019
Class IVp0.0310.8830.5550.1160.336
R−0.395−0.053−0.200−0.267−0.136
R20.1560.0030.0400.0710.018
Shopping
Class Ip0.0330.0140.2650.0570.009
R−0.214−0.394−0.169−0.200−0.242
R20.0450.1550.0280.0400.058
Class IIp0.0000.0030.1840.0000.000
R−0.356−0.283−0.126−0.305−0.451
R20.1260.0800.0160.0930.203
Class IIIp0.9700.6320.1030.0150.236
R0.008−0.154−0.397−0.425−0.189
R20.0000.0230.1570.1810.035
Class IVp0.5620.7810.1200.9290.221
R−0.110−0.101−0.497−0.015−0.173
R20.0120.0100.2470.0000.030
Life Services
Class Ip0.0010.0110.1070.0060.000
R−0.339−0.409−0.240−0.286−0.388
R20.1140.1670.0580.0820.151
Class IIp0.0000.0220.0340.0020.000
R−0.381−0.222−0.199−0.236−0.515
R20.1450.0490.0400.0550.265
Class IIIp0.6290.4010.0810.0020.201
R−0.104−0.267−0.422−0.524−0.204
R20.0110.0710.1780.2750.042
Class IVp0.1480.5830.3390.5880.968
R−0.2710.198−0.319−0.093−0.006
R20.0730.0390.1020.0000.000
Entertainment
Class Ip0.0330.0130.9260.4320.033
R−0.215−0.399−0.014−0.083−0.197
R20.0460.1590.0000.0000.039
Class IIp0.0010.0060.0610.0420.000
R−0.300−0.266−0.177−0.157−0.421
R20.0900.0710.0310.0250.177
Class IIIp0.2990.3940.5000.1050.397
R0.221−0.271−0.170−0.292−0.136
R20.0490.0730.0290.0850.018
Class IVp0.3170.8870.3050.1700.787
R−0.1890.052−0.319−0.234−0.038
R20.0360.0000.1020.0550.000
Hotel
Class Ip0.0310.2040.2980.0290.004
R−0.217−0.211−0.157−0.228−0.267
R20.0470.0450.0250.0520.071
Class IIp0.0060.1530.0910.0040.000
R−0.252−0.14−0.160−0.224−0.421
R20.0640.0200.0260.0500.177
Class IIIp0.0530.3880.1550.0100.231
R0.400−0.274−0.349−0.449−0.191
R20.1600.0750.1220.1620.036
Class IVp0.7010.0250.8400.2560.911
R−0.0730.697−0.069−0.196−0.016
R20.0000.1960.0000.0380.000
Disclaimer/Publisher’s Note: The statements, opinions and data contained in all publications are solely those of the individual author(s) and contributor(s) and not of MDPI and/or the editor(s). MDPI and/or the editor(s) disclaim responsibility for any injury to people or property resulting from any ideas, methods, instructions or products referred to in the content.

