
Data Quality of National Monitoring Schemes: Filling the Gap between Specialists and the General Public


Abstract
:1. Introduction
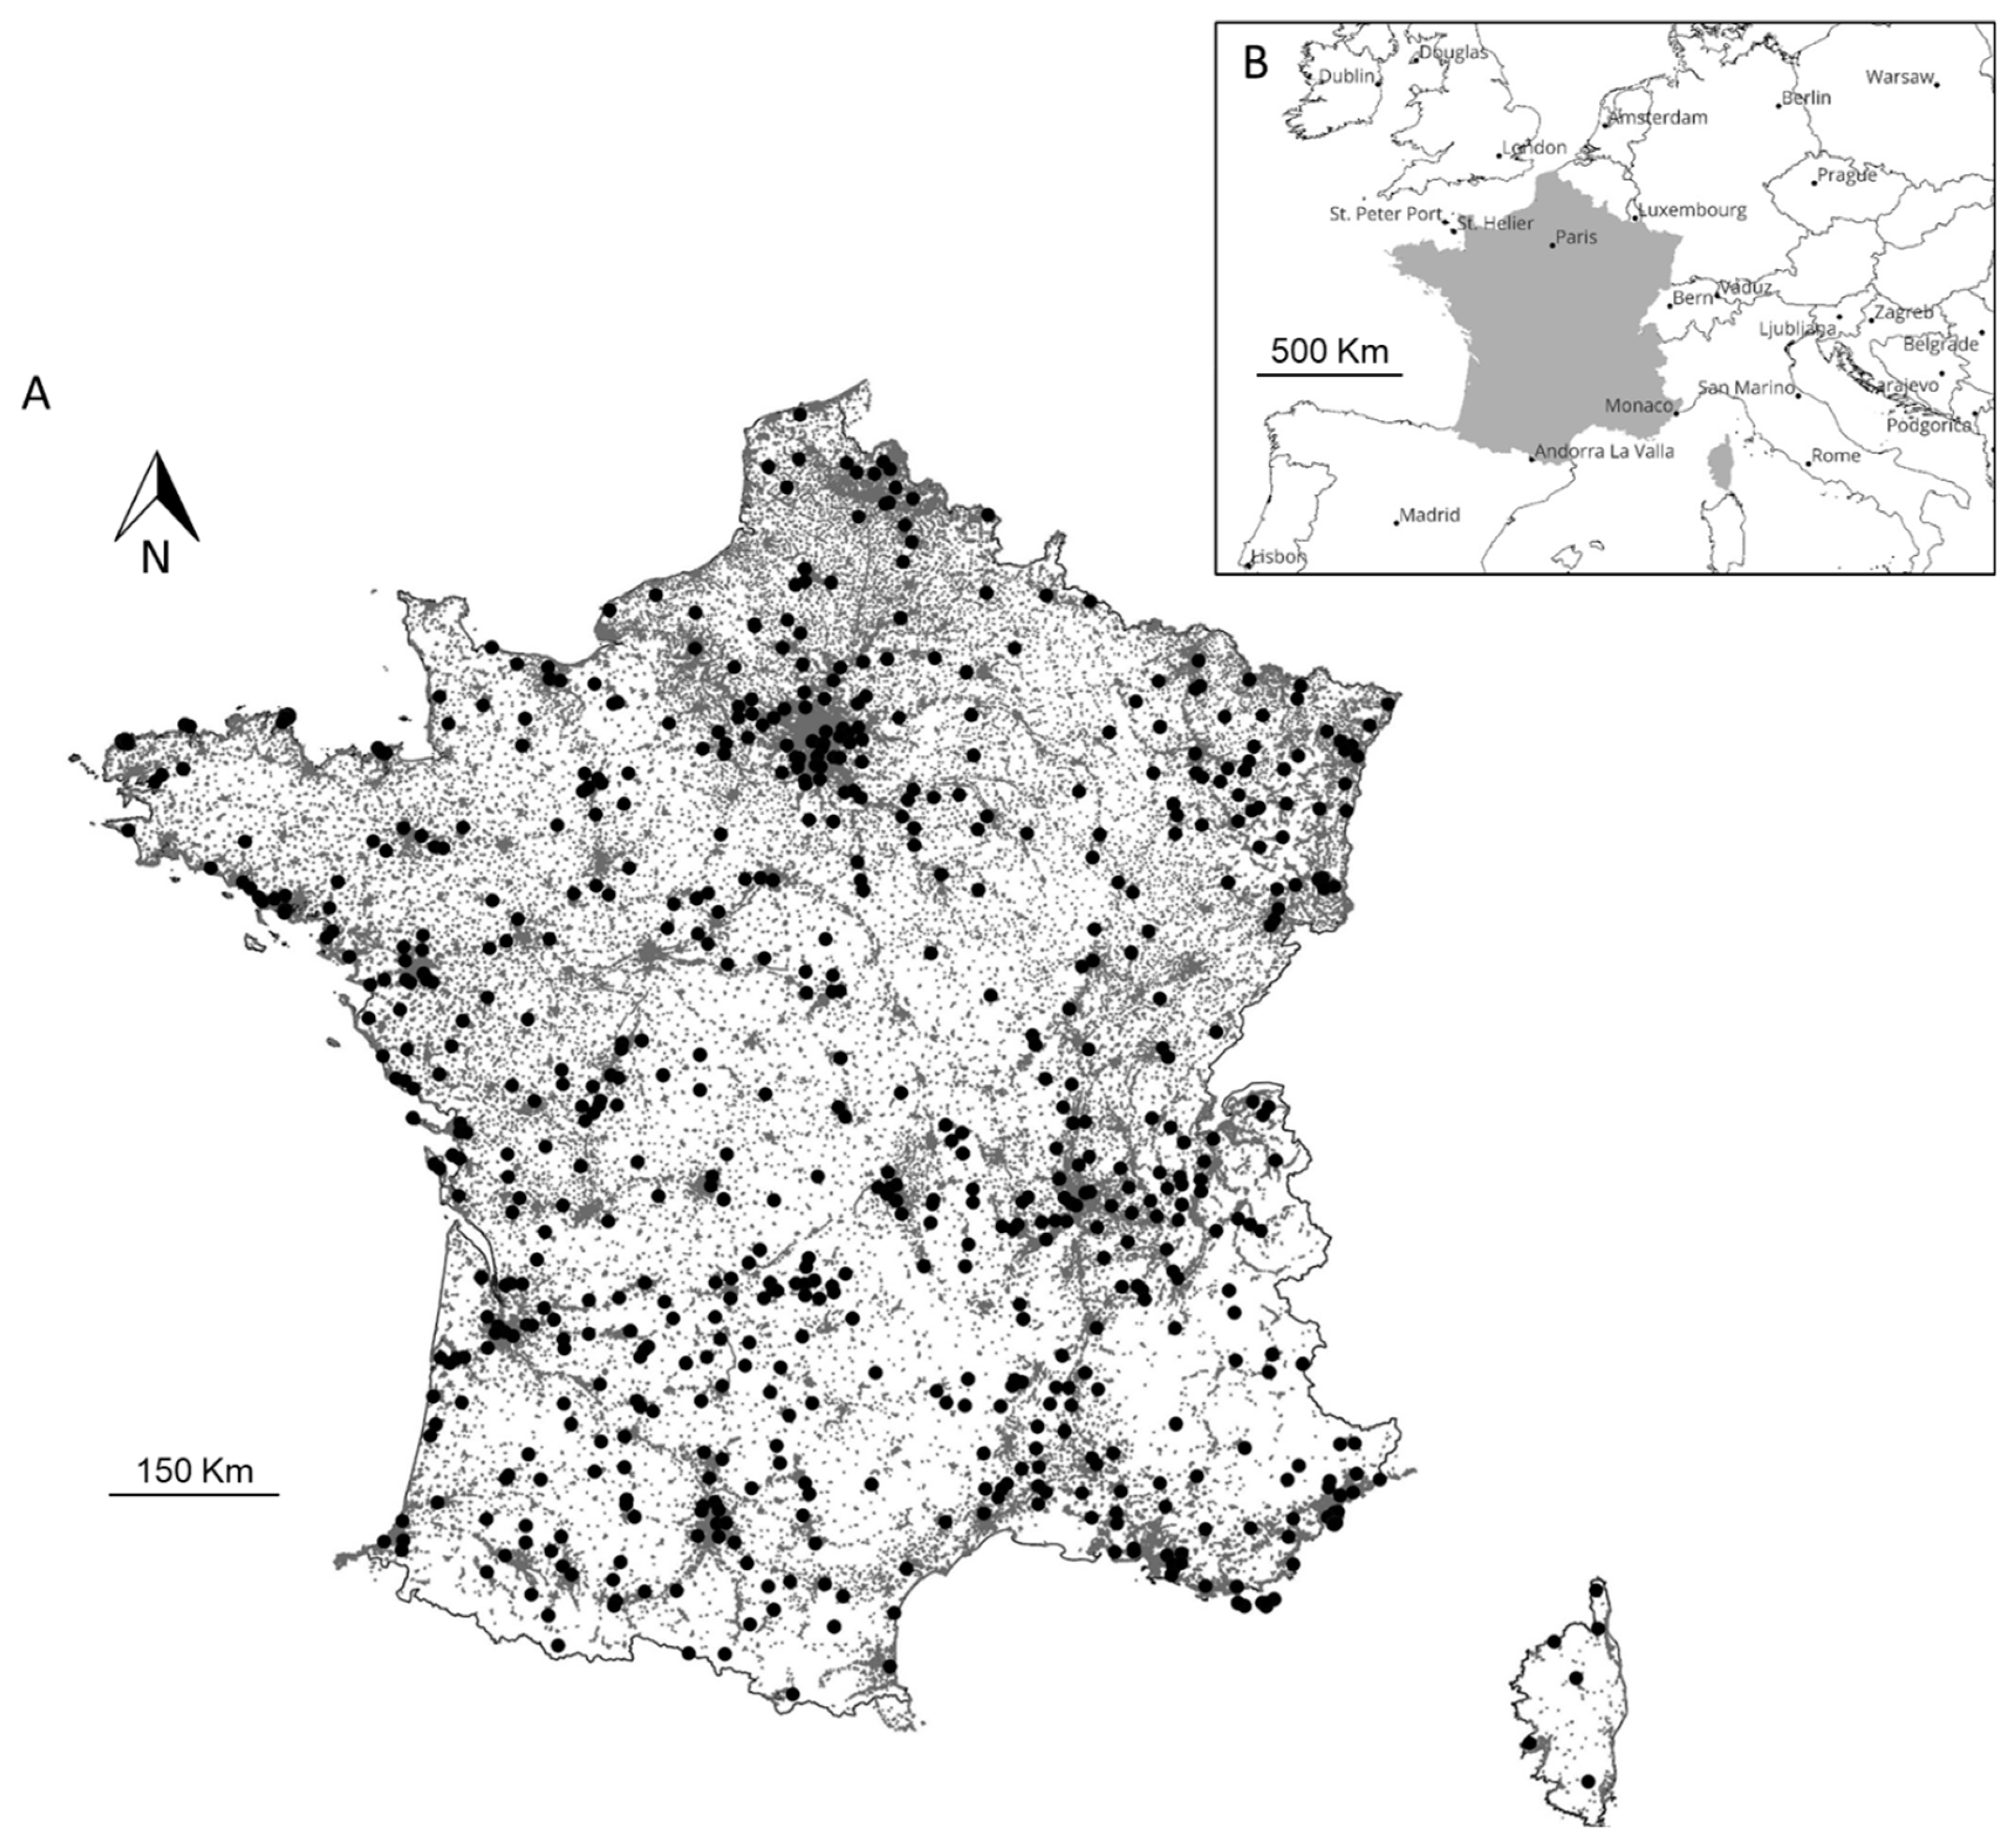
2. Materials and Methods
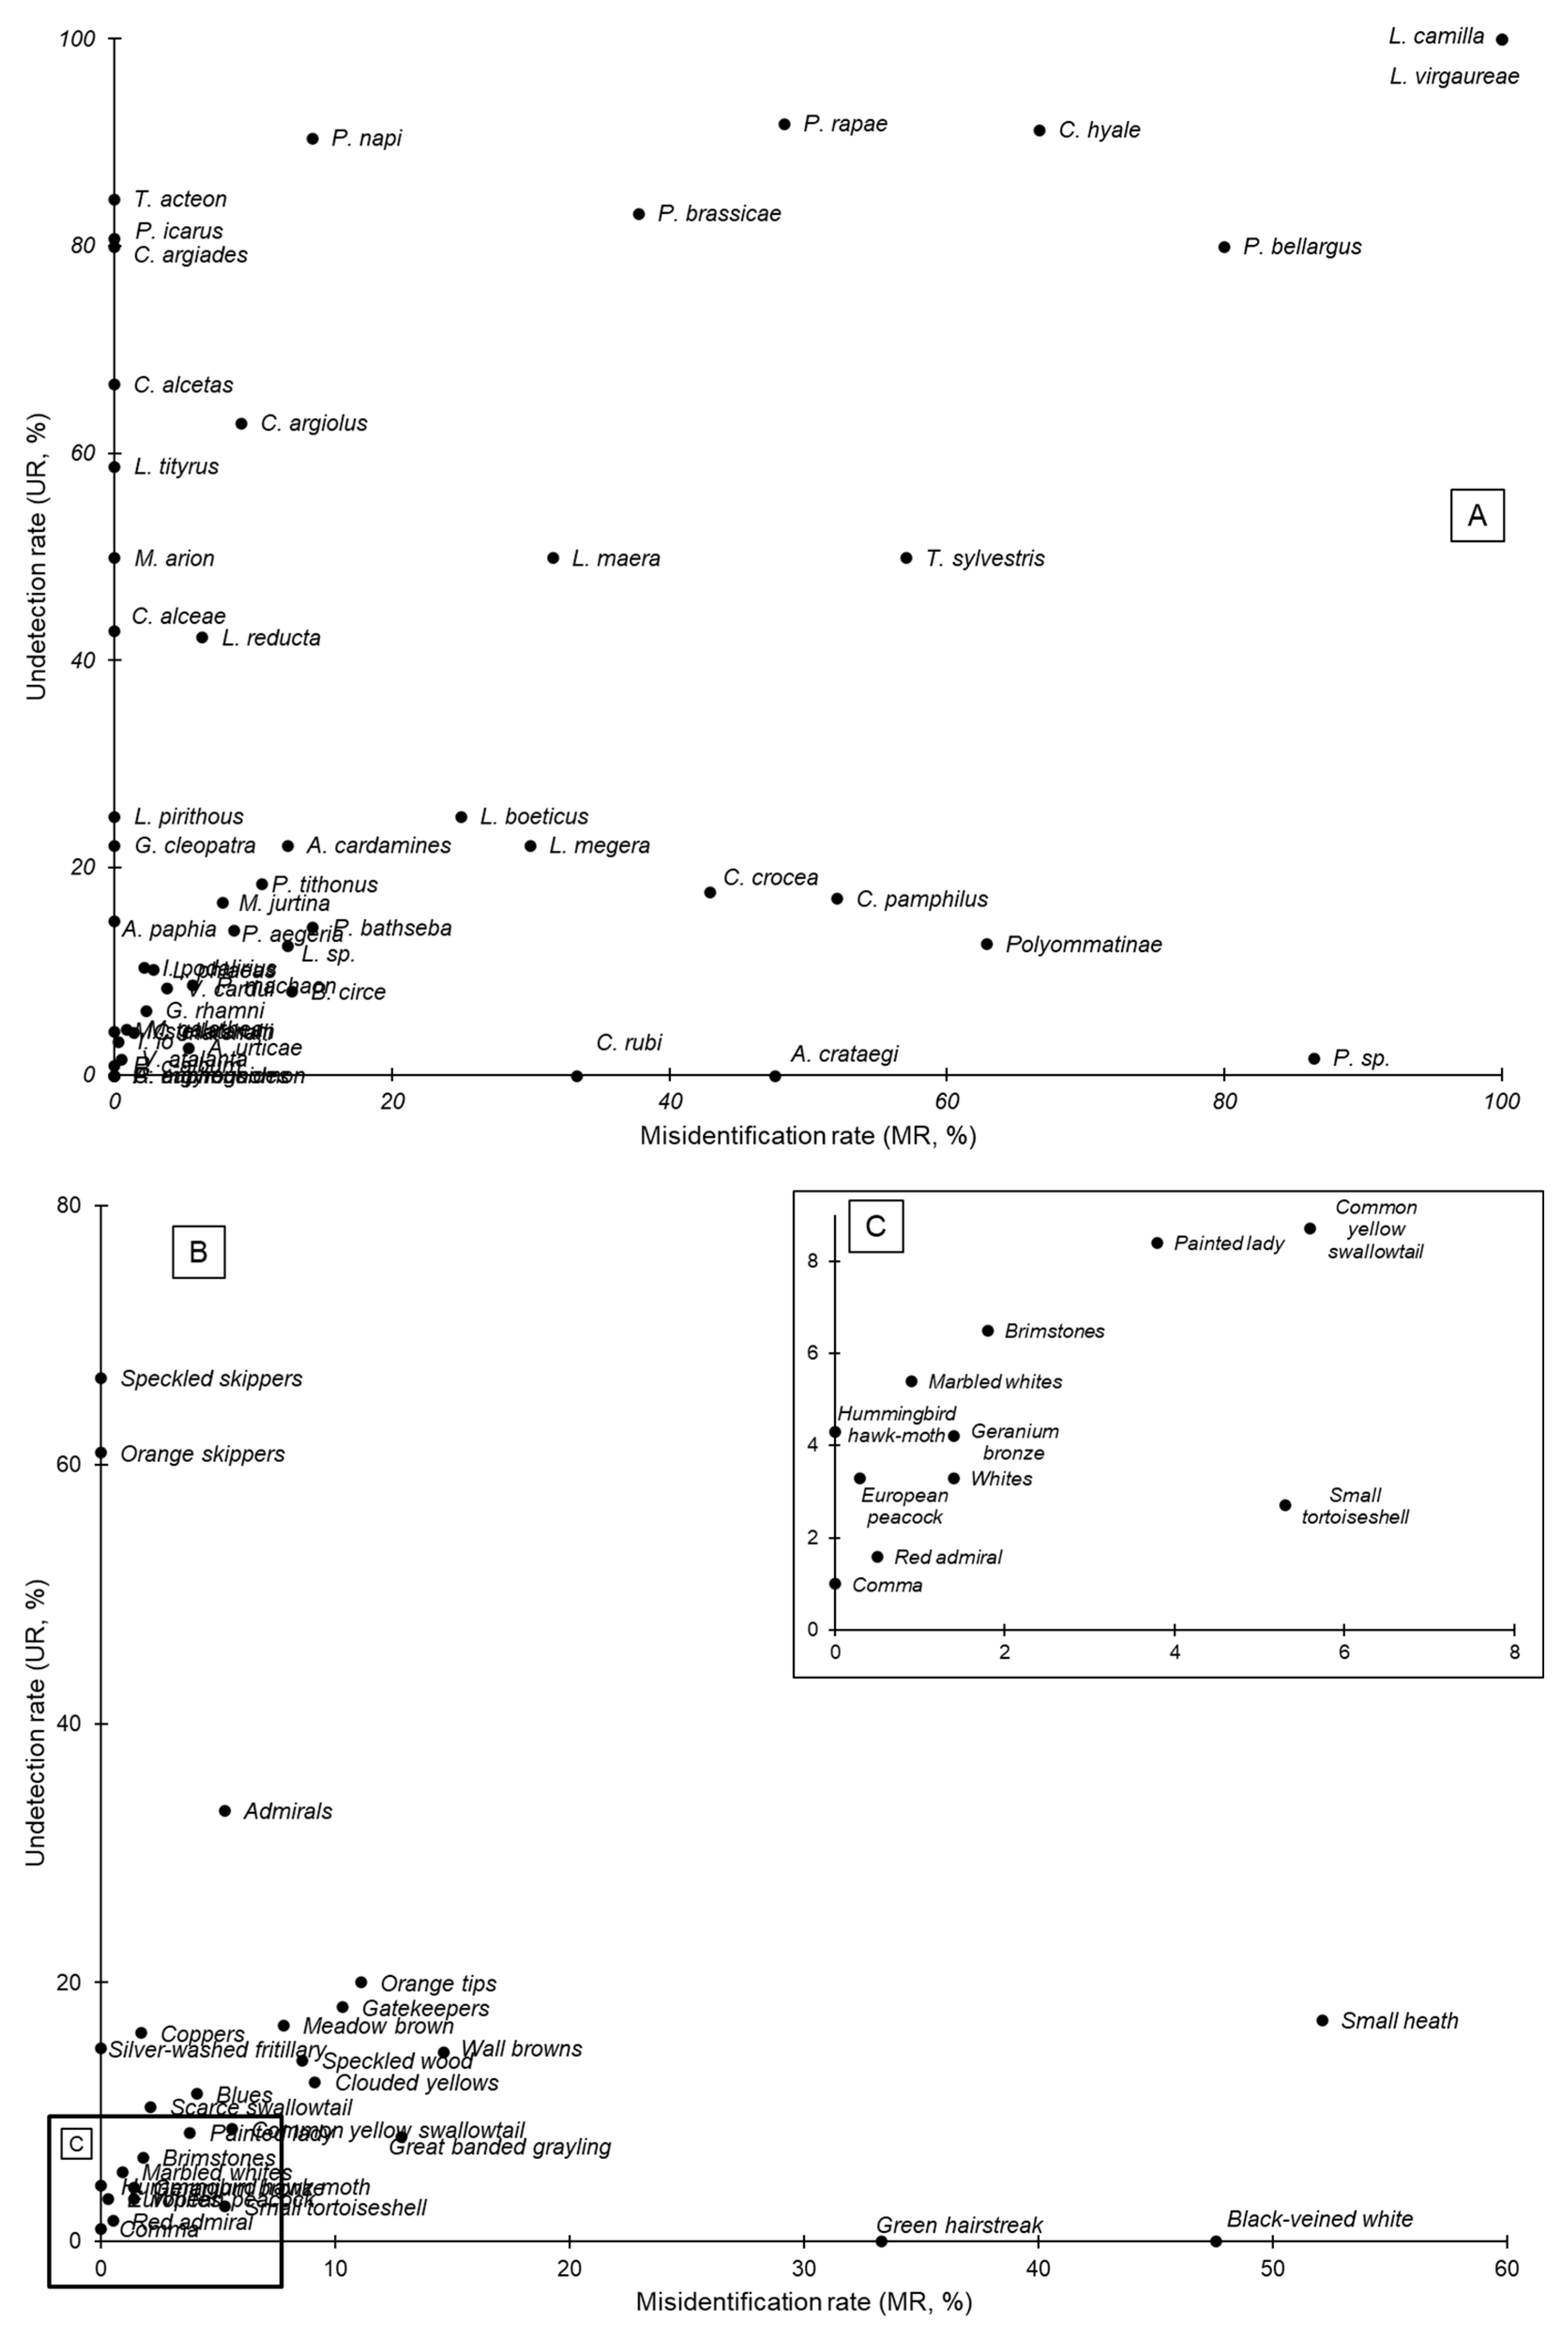
3. Results
4. Discussion
Author Contributions
Funding
Data Availability Statement
Acknowledgments
Conflicts of Interest
References
- Biggs, J.; Ewald, N.; Valentini, A.; Gaboriaud, C.; Dejean, T.; Griffiths, R.A.; Foster, J.; Wilkinson, J.W.; Arnell, A.; Brotherton, P.; et al. Using eDNA to Develop a National Citizen Science-Based Monitoring Programme for the Great Crested Newt (Triturus cristatus). Biol. Conserv. 2015, 183, 19–28. [Google Scholar] [CrossRef]
- Westgate, M.J.; Scheele, B.C.; Ikin, K.; Hoefer, A.M.; Beaty, R.M.; Evans, M.; Osborne, W.; Hunter, D.; Rayner, L.; Driscoll, D.A. Citizen Science Program Shows Urban Areas Have Lower Occurrence of Frog Species, but Not Accelerated Declines. PLoS ONE 2015, 10, e0140973. [Google Scholar] [CrossRef] [PubMed]
- Bergerot, B. The Citizen Science Paradox. Land 2022, 11, 1151. [Google Scholar] [CrossRef]
- Burgess, H.K.; DeBey, L.B.; Froehlich, H.E.; Schmidt, N.; Theobald, E.J.; Ettinger, A.K.; HilleRisLambers, J.; Tewksbury, J.; Parrish, J.K. The Science of Citizen Science: Exploring Barriers to Use as a Primary Research Tool. Biol. Conserv. 2017, 208, 113–120. [Google Scholar] [CrossRef]
- Bonney, R.; Cooper, C.B.; Dickinson, J.; Kelling, S.; Phillips, T.; Rosenberg, K.V.; Shirk, J. Citizen Science: A Developing Tool for Expanding Science Knowledge and Scientific Literacy. BioScience 2009, 59, 977–984. [Google Scholar] [CrossRef]
- Nolan, V.; Reader, T.; Gilbert, F.; Atkinson, N. The Ancient Tree Inventory: A Summary of the Results of a 15 Year Citizen Science Project Recording Ancient, Veteran and Notable Trees across the UK. Biodivers. Conserv. 2020, 29, 3103–3129. [Google Scholar] [CrossRef]
- Theobald, E.J.; Ettinger, A.K.; Burgess, H.K.; DeBey, L.B.; Schmidt, N.R.; Froehlich, H.E.; Wagner, C.; HilleRisLambers, J.; Tewksbury, J.; Harsch, M.A.; et al. Global Change and Local Solutions: Tapping the Unrealized Potential of Citizen Science for Biodiversity Research. Biol. Conserv. 2015, 181, 236–244. [Google Scholar] [CrossRef]
- Bonney, R.; Phillips, T.B.; Ballard, H.L.; Enck, J.W. Can Citizen Science Enhance Public Understanding of Science? Public Underst. Sci. 2016, 25, 2–16. [Google Scholar] [CrossRef]
- Bell, S.; Marzano, M.; Cent, J.; Kobierska, H.; Podjed, D.; Vandzinskaite, D.; Reinert, H.; Armaitiene, A.; Grodzinska-Jurczak, M.; Mursic, R. What Counts? Volunteers and Their Organisations in the Recording and Monitoring of Biodiversity. Biodivers. Conserv. 2008, 17, 3443–3454. [Google Scholar] [CrossRef]
- Silvertown, J.; Cook, L.; Cameron, R.; Dodd, M.; McConway, K.; Worthington, J.; Skelton, P.; Anton, C.; Bossdorf, O.; Baur, B.; et al. Citizen Science Reveals Unexpected Continental-Scale Evolutionary Change in a Model Organism. PLoS ONE 2011, 6, e18927. [Google Scholar] [CrossRef]
- Callaghan, C.T.; Poore, A.G.B.; Major, R.E.; Rowley, J.J.L.; Cornwell, W.K. Optimizing Future Biodiversity Sampling by Citizen Scientists. Proc. R. Soc. B-Biol. Sci. 2019, 286, 20191487. [Google Scholar] [CrossRef]
- Danielsen, F.; Pirhofer-Walzl, K.; Adrian, T.P.; Kapijimpanga, D.R.; Burgess, N.D.; Jensen, P.M.; Bonney, R.; Funder, M.; Landa, A.; Levermann, N.; et al. Linking Public Participation in Scientific Research to the Indicators and Needs of International Environmental Agreements. Conserv. Lett. 2014, 7, 12–24. [Google Scholar] [CrossRef]
- Schmeller, D.S.; Henry, P.Y.; Julliard, R.; Gruber, B.; Clobert, J.; Dziock, F.; Lengyel, S.; Nowicki, P.; Deri, E.; Budrys, E.; et al. Advantages of Volunteer-Based Biodiversity Monitoring in Europe. Conserv. Biol. 2009, 23, 307–316. [Google Scholar] [CrossRef] [PubMed]
- Engel, S.R.; Voshell, J.R., Jr. Volunteer Biological Monitoring: Can It Accurately Assess the Ecological Condition of Streams? Am. Entomol. 2002, 48, 164–177. [Google Scholar] [CrossRef]
- Kremen, C.; Ullman, K.S.; Thorp, R.W. Evaluating the Quality of Citizen-Scientist Data on Pollinator Communities. Conserv. Biol. 2011, 25, 607–617. [Google Scholar] [CrossRef]
- Holt, B.G.; Rioja-Nieto, R.; Aaron MacNeil, M.; Lupton, J.; Rahbek, C. Comparing Diversity Data Collected Using a Protocol Designed for Volunteers with Results from a Professional Alternative. Methods Ecol. Evol. 2013, 4, 383–392. [Google Scholar] [CrossRef]
- Vantieghem, P.; Maes, D.; Kaiser, A.; Merckx, T. Quality of Citizen Science Data and Its Consequences for the Conservation of Skipper Butterflies (Hesperiidae) in Flanders (Northern Belgium). J. Insect Conserv. 2017, 21, 451–463. [Google Scholar] [CrossRef]
- Root, T.L.; Alpert, P. Volunteers and the NBS. Science 1994, 263, 1205. [Google Scholar] [CrossRef]
- McDonough MacKenzie, C.; Murray, G.; Primack, R.; Weihrauch, D. Lessons from Citizen Science: Assessing Volunteer-Collected Plant Phenology Data with Mountain Watch. Biol. Conserv. 2017, 208, 121–126. [Google Scholar] [CrossRef]
- Fore, L.S.; Paulsen, K.; O’Laughlin, K. Assessing the Performance of Volunteers in Monitoring Streams. Freshw. Biol. 2001, 46, 109–123. [Google Scholar] [CrossRef]
- Easa, P.S.; Asari, P.K.S.; Basha, S.C. Status and Distribution of the Endangered Lion-Tailed Macaque Macaca Silenus in Kerala, India. Biol. Conserv. 1997, 80, 33–37. [Google Scholar] [CrossRef]
- Van Swaay, C.A.M.; Nowicki, P.; Settele, J.; van Strien, A.J. Butterfly Monitoring in Europe: Methods, Applications and Perspectives. Biodivers. Conserv. 2008, 17, 3455–3469. [Google Scholar] [CrossRef]
- Foster-Smith, J.; Evans, S.M. The Value of Marine Ecological Data Collected by Volunteers. Biol. Conserv. 2003, 113, 199–213. [Google Scholar] [CrossRef]
- Newman, C.; Buesching, C.D.; Macdonald, D.W. Validating Mammal Monitoring Methods and Assessing the Performance of Volunteers in Wildlife Conservation-“Sed Quis Custodiet Ipsos Custodies?”. Biol. Conserv. 2003, 113, 189–197. [Google Scholar] [CrossRef]
- Krabbenhoft, C.A.; Kashian, D.R. Citizen Science Data Are a Reliable Complement to Quantitative Ecological Assessments in Urban Rivers. Ecol. Indic. 2020, 116, 106476. [Google Scholar] [CrossRef]
- Henry, P.Y.; Lengyel, S.; Nowicki, P.; Julliard, R.; Clobert, J.; Celik, T.; Gruber, B.; Schmeller, D.; Babij, V.; Henle, K. Integrating Ongoing Biodiversity Monitoring: Potential Benefits and Methods. Biodivers. Conserv. 2008, 17, 3357–3382. [Google Scholar] [CrossRef]
- Bonter, D.N.; Cooper, C.B. Data Validation in Citizen Science: A Case Study from Project FeederWatch. Front. Ecol. Environ. 2012, 10, 305–307. [Google Scholar] [CrossRef]
- Bird, T.J.; Bates, A.E.; Lefcheck, J.S.; Hill, N.A.; Thomson, R.J.; Edgar, G.J.; Stuart-Smith, R.D.; Wotherspoon, S.; Krkosek, M.; Stuart-Smith, J.F.; et al. Statistical Solutions for Error and Bias in Global Citizen Science Datasets. Biol. Conserv. 2014, 173, 144–154. [Google Scholar] [CrossRef]
- Serret, H.; Deguines, N.; Jang, Y.; Lois, G.; Julliard, R. Data Quality and Participant Engagement in Citizen Science: Comparing Two Approaches for Monitoring Pollinators in France and South Korea. Citiz. Sci. Theory Pract. 2019, 4, 22. [Google Scholar] [CrossRef]
- Van Eupen, C.; Maes, D.; Herremans, M.; Swinnen, K.R.R.; Somers, B.; Luca, S. The Impact of Data Quality Filtering of Opportunistic Citizen Science Data on Species Distribution Model Performance. Ecol. Model. 2021, 444, 109453. [Google Scholar] [CrossRef]
- Kosmala, M.; Wiggins, A.; Swanson, A.; Simmons, B. Assessing Data Quality in Citizen Science. Front. Ecol. Environ. 2016, 14, 551–560. [Google Scholar] [CrossRef]
- Baker, E.; Drury, J.P.; Judge, J.; Roy, D.B.; Smith, G.C.; Stephens, P.A. The Verification of Ecological Citizen Science Data: Current Approaches and Future Possibilities. Citiz. Sci. Theory Pract. 2021, 5, e75506. [Google Scholar] [CrossRef]
- New, T.R. Are Lepidoptera an Effective ‘umbrella Group’ for Biodiversity Conservation? J. Insect Conserv. 1997, 1, 5–12. [Google Scholar] [CrossRef]
- Parmesan, C. Butterflies as Bioindicators for Climate Change Effects. In Butterflies: Ecology and Evolution Taking Flight; Boggs, C.L., Watt, W.B., Ehrlich, P.R., Eds.; The University of Chicago Press: Chicago, IL, USA, 2003; pp. 541–560. [Google Scholar]
- Thomas, J.A. Monitoring Change in the Abundance and Distribution of Insects Using Butterflies and Other Indicator Groups. Philos. Trans. R. Soc. B-Biol. Sci. 2005, 360, 339–357. [Google Scholar] [CrossRef]
- Bergerot, B.; Fontaine, B.; Renard, M.; Cadi, A.; Julliard, R. Preferences for exotic flowers do not promote urban life in butterflies. Landsc. Urban Plan. 2010, 96, 98–107. [Google Scholar] [CrossRef]
- Muratet, A.; Fontaine, B. Contrasting Impacts of Pesticides on Butterflies and Bumblebees in Private Gardens in France. Biol. Conserv. 2015, 182, 148–154. [Google Scholar] [CrossRef]
- Banner, K.M.; Irvine, K.M.; Rodhouse, T.J.; Wright, W.J.; Rodriguez, R.M.; Litt, A.R. Improving Geographically Extensive Acoustic Survey Designs for Modeling Species Occurrence with Imperfect Detection and Misidentification. Ecol. Evol. 2018, 8, 6144–6156. [Google Scholar] [CrossRef] [PubMed]
- Chambert, T.; Grant, E.H.C.; Miller, D.A.W.; Nichols, J.D.; Mulder, K.P.; Brand, A.B. Two-Species Occupancy Modelling Accounting for Species Misidentification and Non-Detection. Methods Ecol. Evol. 2018, 9, 1468–1477. [Google Scholar] [CrossRef]
- Miller, D.A.; Nichols, J.D.; McClintock, B.T.; Grant, E.H.C.; Bailey, L.L.; Weir, L.A. Improving Occupancy Estimation When Two Types of Observational Error Occur: Non-Detection and Species Misidentification. Ecology 2011, 92, 1422–1428. [Google Scholar] [CrossRef]
- Cosquer, A.; Raymond, R.; Prévot-Julliard, A.-C. Observations of everyday biodiversity: A new perspective for conservation? Ecol. Soc. 2012, 17, 2–15. [Google Scholar] [CrossRef]
- Deguines, N.; de Flores, M.; Loïs, G.; Julliard, R.; Fontaine, C. Fostering Close Encounters of the Entomological Kind. Front. Ecol. Environ. 2018, 16, 202–203. [Google Scholar] [CrossRef]
- Scott, W.A.; Hallam, C.J. Assessing Species Misidentification Rates through Quality Assurance of Vegetation Monitoring. Plant Ecol. 2003, 165, 101–115. [Google Scholar] [CrossRef]
- Gardiner, M.M.; Allee, L.L.; Brown, P.M.; Losey, J.E.; Roy, H.E.; Smyth, R.R. Lessons from Lady Beetles: Accuracy of Monitoring Data from US and UK Citizen-Science Programs. Front. Ecol. Environ. 2012, 10, 471–476. [Google Scholar] [CrossRef] [PubMed]

| French Garden Butterfly Observatory Level | Species Level | |||||||||||
|---|---|---|---|---|---|---|---|---|---|---|---|---|
| Family | Scientific Name | FGBO Groups | Ns | Nm | Nv | MR | UR | Ns | Nm | Nv | MR | UR |
| Heliconiidae | Argynnis paphia (Linnaeus, 1758) | Silver-washed fritillary | 87 | 74 | 74 | 0.0 | 14.9 | 87 | 74 | 74 | 0.0 | 14.9 |
| Hesperiidae | Ochlodes sylvanus (Esper, 1777) | Orange skippers | 23 | 9 | 9 | 0.0 | 60.9 | 4 | 0 | 0 | NA | 100.0 |
| Thymelicus acteon (Rottemburg, 1775) | 13 | 2 | 2 | 0.0 | 84.6 | |||||||
| Thymelicus sylvestris (Poda, 1761) | 6 | 3 | 7 | 57.1 | 50.0 | |||||||
| Carcharodus alceae (Esper, 1780) | Speckled skippers | 12 | 4 | 4 | 0.0 | 66.7 | 7 | 4 | 4 | 0.0 | 42.9 | |
| Pyrgus sp. | 5 | 0 | 0 | NA | 100.0 | |||||||
| Limenitidae | Limenitis camilla (Linnaeus, 1764) | Admirals | 27 | 18 | 19 | 5.3 | 33.3 | 1 | 0 | 3 | 100.0 | 100.0 |
| Limenitis reducta (Staudinger, 1901) | 26 | 15 | 16 | 6.3 | 42.3 | |||||||
| Lycaenidae | Cacyreus marshalli (Butler, 1898) | Geranium bronze | 72 | 69 | 70 | 1.4 | 4.2 | 72 | 69 | 70 | 1.4 | 4.2 |
| Callophrys rubi (Linnaeus, 1758) | Green hairstreak | 2 | 2 | 3 | 33.3 | 0 | 2 | 2 | 3 | 33.3 | 0 | |
| Celastrina argiolus (Linnaeus, 1758) | Blues | 264 | 234 | 244 | 4.1 | 11.4 | 27 | 10 | 11 | 9.1 | 63.0 | |
| Cupido alcetas (Hoffmannsegg, 1804) | 3 | 1 | 1 | 0.0 | 66.7 | |||||||
| Cupido argiades (Pallas, 1771) | 5 | 1 | 1 | 0.0 | 80.0 | |||||||
| Cupido minimus (Fuessly, 1775) | 1 | 1 | 1 | 0.0 | 0 | |||||||
| Lampides boeticus (Linnaeus, 1767) | 4 | 3 | 4 | 25.0 | 25.0 | |||||||
| Leptotes pirithous (Linnaeus, 1767) | 12 | 9 | 9 | 0.0 | 25.0 | |||||||
| Maculinea arion (Linnaeus, 1758) | 2 | 1 | 1 | 0.0 | 50.0 | |||||||
| Plebejus argyrognomon (Bergsträsser, 1779) | 1 | 1 | 1 | 0.0 | 0 | |||||||
| Polyommatinae (subfamily) | 79 | 69 | 186 | 62.9 | 12.7 | |||||||
| Polyommatus icarus (Rottemburg, 1775) | 125 | 24 | 24 | 0.0 | 80.8 | |||||||
| Polyommatus bellargus (Rottemburg, 1775) | 5 | 1 | 5 | 80.0 | 80.0 | |||||||
| Lycaena phlaeas (Linnaeus, 1761) | Coppers | 137 | 115 | 117 | 1.7 | 16.1 | 118 | 106 | 109 | 2.8 | 10.2 | |
| Lycaena tityrus (Poda, 1761) | 17 | 7 | 7 | 0.0 | 58.8 | |||||||
| Lycaena virgaureae (Linnaeus, 1758) | 2 | 0 | 1 | 100.0 | 100.0 | |||||||
| Nymphalidae | Aglais urticae (Linnaeus, 1758) | Small tortoiseshell | 37 | 36 | 38 | 5.3 | 2.7 | 37 | 36 | 38 | 5.3 | 2.7 |
| Inachis io (Linnaeus, 1758) | European peacock | 302 | 292 | 293 | 0.3 | 3.3 | 302 | 292 | 293 | 0.3 | 3.3 | |
| Polygonia c-album (Linnaeus, 1758) | Comma | 99 | 98 | 98 | 0.0 | 1.0 | 99 | 98 | 98 | 0.0 | 1.0 | |
| Vanessa atalanta (Linnaeus, 1758) | Red admiral | 185 | 182 | 183 | 0.5 | 1.6 | 185 | 182 | 183 | 0.5 | 1.6 | |
| Vanessa cardui (Linnaeus, 1758) | Painted lady | 83 | 76 | 79 | 3.8 | 8.4 | 83 | 76 | 79 | 3.8 | 8.4 | |
| Papilionidae | Iphiclides podalirius (Linnaeus, 1758) | Scarce swallowtail | 106 | 95 | 97 | 2.1 | 10.4 | 106 | 95 | 97 | 2.1 | 10.4 |
| Papilio machaon Linnaeus, 1758 | Common yellow swallowtail | 92 | 84 | 89 | 5.6 | 8.7 | 92 | 84 | 89 | 5.6 | 8.7 | |
| Pieridae | Anthocharis cardamines (Linnaeus, 1758) | Orange tips | 10 | 8 | 9 | 11.1 | 20.0 | 9 | 7 | 8 | 12.5 | 22.2 |
| Anthocharis euphenoides (Staudinger, 1869) | 1 | 1 | 1 | 0.0 | 0 | |||||||
| Colias crocea (Fourcroy, 1785) | Clouded yellows | 57 | 50 | 55 | 9.1 | 12.3 | 34 | 28 | 49 | 42.9 | 17.7 | |
| Colias hyale (Linnaeus, 1758) | 23 | 2 | 6 | 66.7 | 91.3 | |||||||
| Gonepteryx cleopatra (Linnaeus, 1767) | Brimstones | 232 | 217 | 221 | 1.8 | 6.5 | 9 | 7 | 7 | 0.0 | 22.2 | |
| Gonepteryx rhamni (Linnaeus, 1758) | 223 | 209 | 214 | 2.3 | 6.3 | |||||||
| Leptidea sp. | Whites | 514 | 497 | 504 | 1.4 | 3.3 | 8 | 7 | 8 | 12.5 | 12.5 | |
| Pieris brassicae (Linnaeus, 1758) | 137 | 23 | 37 | 37.8 | 83.2 | |||||||
| Pieris napi (Linnaeus, 1758) | 126 | 12 | 14 | 14.3 | 90.5 | |||||||
| Pieris rapae (Linnaeus, 1758) | 186 | 15 | 29 | 48.3 | 91.9 | |||||||
| Pieris sp. | 57 | 56 | 416 | 86.5 | 1.7 | |||||||
| Aporia crataegi (Linnaeus, 1758) | Black-veined white | 11 | 11 | 21 | 47.6 | 0.0 | 11 | 11 | 21 | 47.6 | 0 | |
| Satyridae | Brintesia circe (Fabricius, 1775) | Great banded grayling | 37 | 34 | 39 | 12.8 | 8.1 | 37 | 34 | 39 | 12.8 | 8.1 |
| Coenonympha pamphilus (Linnaeus, 1758) | Small heath | 41 | 34 | 71 | 52.1 | 17.1 | 41 | 34 | 71 | 52.1 | 17.1 | |
| Lasiommata megera (Linnaeus, 1767) | Wall browns | 89 | 76 | 89 | 14.6 | 14.6 | 63 | 49 | 70 | 30.0 | 22.2 | |
| Lasiommata maera (Linnaeus, 1758) | 26 | 13 | 19 | 31.6 | 50.0 | |||||||
| Maniola jurtina (Linnaeus, 1758) | Meadow brown | 384 | 320 | 347 | 7.8 | 16.7 | 384 | 320 | 347 | 7.8 | 16.7 | |
| Melanargia galathea (Linnaeus, 1758) | Marbled whites | 112 | 106 | 107 | 0.9 | 5.4 | 111 | 106 | 107 | 0.9 | 4.5 | |
| Melanargia lachesis (Hübner, 1790) | 1 | 0 | 0 | NA | 100.0 | |||||||
| Pararge aegeria (Linnaeus, 1758) | Speckled wood | 86 | 74 | 81 | 8.6 | 14.0 | 86 | 74 | 81 | 8.6 | 14.0 | |
| Pyronia tithonus (Linnaeus, 1771) | Gatekeepers | 277 | 227 | 253 | 10.3 | 18.1 | 270 | 220 | 246 | 10.6 | 18.5 | |
| Pyronia bathseba (Fabricius, 1793) | 7 | 6 | 7 | 14.3 | 14.3 | |||||||
| Sphingidae | Macroglossum stellatarum (Linnaeus, 1758) | Hummingbird hawk-moth | 208 | 199 | 199 | 0.0 | 4.3 | 208 | 199 | 199 | 0.0 | 4.3 |
| Total counts | 3586 | 3241 | 3413 | 5.0 | 9.6 | 3586 | 2699 | 3413 | 20.9 | 24.7 | ||
Disclaimer/Publisher’s Note: The statements, opinions and data contained in all publications are solely those of the individual author(s) and contributor(s) and not of MDPI and/or the editor(s). MDPI and/or the editor(s) disclaim responsibility for any injury to people or property resulting from any ideas, methods, instructions or products referred to in the content. |
© 2024 by the authors. Licensee MDPI, Basel, Switzerland. This article is an open access article distributed under the terms and conditions of the Creative Commons Attribution (CC BY) license (https://creativecommons.org/licenses/by/4.0/).
Share and Cite
Bergerot, B.; Fontaine, B. Data Quality of National Monitoring Schemes: Filling the Gap between Specialists and the General Public. Land 2024, 13, 1252. https://doi.org/10.3390/land13081252
Bergerot B, Fontaine B. Data Quality of National Monitoring Schemes: Filling the Gap between Specialists and the General Public. Land. 2024; 13(8):1252. https://doi.org/10.3390/land13081252
Chicago/Turabian StyleBergerot, Benjamin, and Benoît Fontaine. 2024. "Data Quality of National Monitoring Schemes: Filling the Gap between Specialists and the General Public" Land 13, no. 8: 1252. https://doi.org/10.3390/land13081252