Article

Coupled Coordination and the Spatial Connection Network Analysis of New Urbanization and Ecological Resilience in the Urban Agglomeration of Central Guizhou, China

School of Public Administration, Guizhou University, Guiyang 550025, China
*
Author to whom correspondence should be addressed.
Land 2024, 13(8), 1256; https://doi.org/10.3390/land13081256 (registering DOI)
Submission received: 3 July 2024 / Revised: 7 August 2024 / Accepted: 8 August 2024 / Published: 9 August 2024

Abstract

:
This study evaluates the new urbanization (NU) quality and the ecological resilience (ER) of 33 districts and counties in the Urban Agglomeration of Central Guizhou from 2010 to 2020. For this purpose, we used a modified coupled coordination degree (CCD) model, spatial autocorrelation analysis, and trend surface analysis to analyze the spatiotemporal evolutionary characteristics of the CCD of NU and ER. Meanwhile, we used a modified gravity model and social network analysis to investigate the spatial connection network (SCN) characteristics of the CCD of NU and ER. The results show that (1) the general NU quality has increased significantly in the Urban Agglomeration of Central Guizhou. There is, however, a downward trend in ER. (2) For the CCD of NU and ER in the Urban Agglomeration of Central Guizhou, there is coupling dissonance, with a double U-shaped arc, characterized by west > north > south > east > central. (3) The network density increases and then decreases. Network connectivity is 1, and network efficiency decreases and then increases. (4) During the study period, the SCN is characterized by significant core–edge characteristics; there are no “island nodes” in the SCN.

1. Introduction

The rapid economic recovery and growth of the post-WWII era saw large numbers of people migrate from rural to urban areas, greatly accelerating global urbanization. According to the UN’s World Urbanization Prospects, 2018, the global urbanization rate rose from 24% in 1950 to 55% in 2018, even exceeding 82% in North America. Since the founding of the People’s Republic of China, and especially since the “reform and opening-up,” accompanied by rapid market economy development, China’s urbanization level has increased by leaps and bounds, from 10.6% in 1949 and 17.9% in 1978 to 66.16% in 2023 [1,2]. At the same time, rapid urbanization is often accompanied by air, water, and soil pollution and environmental deterioration [3,4], putting pressure on the carrying capacity of resources and the environment. Thus, coordinating urban development with environmental protection is a pressing issue that has attracted considerable attention [5,6]. The Future Earth Program and the 2030 Agenda for Sustainable Development both focus on the coupling and coordination of urbanization and the environment, emphasizing the need for urbanization to proceed in harmony with the environment and adapt to the carrying capacity of resources. Against the background of China’s construction of “ecological civilization” and its NU strategy, the coordination of NU and ER is considered essential for achieving high-quality, sustainable development [7]. This underscores the importance of exploring the spatiotemporal evolution and SCN of the CCD of NU and ER.
Resilience, which originally referred to the ability of metals to recover from external effects, was introduced into the field of ecology by Canadian ecologist Holling in the mid-to-late 20th century [8,9]. ER can reflect the adaptive capacity of urban ecosystems in NU processes and is a key element and important parameter for measuring urban resilience [10]. It has been used to measure an ecosystem’s ability to automatically absorb, sustain, and restore equilibrium after a sudden shock. It also pertains to the relationship between human activity and ecosystems [11], which has great import for coping with ecological disorder and promoting sustainable development. In recent years, with increasingly frequent natural disasters and outbreaks such as COVID-19, there has been growing research interest in resilience from various perspectives [12], such as ecosystems [13], landscape structure [14], infrastructure [15], and climate change [16]. Currently, it is mainly evaluated based on the methods of “resistance-adaptability-recovery” [17], “scale-density-morphology” [18], and “pressure-state-response” [19,20].
NU takes meeting the people’s aspirations for a better life as its starting point, with urban–rural integration, industry–city interaction, harmonious development, and ecological livability as its basic features [21,22]. Coupled and coordinated NU–ER development can enhance regional sustainability [23]. The environment is the material basis for promoting urbanization, and people can achieve the sustained development of urbanization through continuous demands on the ecological system [24]. However, unchecked urbanization will inevitably harm ecosystems [18], which need to be made more resilient to cope with external effects. Research on urbanization and ER has shifted from a result-oriented [4,25] focus on urbanization’s environmental effects to a relationship-oriented focus on how urbanization and the environment develop in a coordinated manner [26,27]. Specifically, taking anthropogenic effects on the environment as the entry point [11,22,28], current research focuses, first, on the intrinsic connection and mechanism of NU and ER [27,29,30]. Second, in terms of research methods, CCD [31], Tobit [7,32], spatial measurement [30], gray correlation [33] and geo-detector [29] models are widely employed. Third, the research scale mostly focused on provinces [34], river basins [30,35], cities [26] and urban agglomerations [10]. Fourth, regarding results, studies mainly find that there are many positive correlations [36], negative restrictions, and stage effects between urbanization and the environment. Nevertheless, existing research on NU and ER has the following problems: First, studies focus more on the NU–ER relationship in a particular region while ignoring SCN characteristics among different regions. Second, in terms of methods, most studies employ traditional CCD and gravity models but rarely use modified models. Third, in terms of scale, studies pay more attention to river basins or urban agglomerations with strong economic development and less attention to, for example, the urban agglomeration of central Guizhou, which is an economically less developed and more ecologically fragile area in Southwest China.
No longer confined to analyzing the interactions between different systems in a specific region, studies have begun to focus on the interactions and linkages between cities. Ma et al., for example, analyzed the strength of spatial connections between tourism urbanization and the environment in cities in western China using CCD and gravity models [20]; Chen et al. analyzed the spatial connections of green agricultural development in 31 Chinese provinces using a modified gravity model and social network analysis (SNA) [37]; Bai et al. used SNA to explore the SCN structure of carbon emissions among China’s provinces [38]. While such studies emphasized the effects of geospatial connections, fewer studies have focused on NU in terms of ER, which is mainly implied in studies of urban resilience [39], ecological security [40], and ecological efficiency [26], among other areas. It is also rare for studies to consider the characterization of geospatial connection networks.
As important geographical units in globalization and urbanization [41], urban agglomerations have developed rapidly, but they also pose great challenges to ecosystem stability and sustainability. The Urban Agglomeration of Central Guizhou, located in southwestern China, has received less research attention because of its slower urbanization, lower economic development level, and fragile environment. The Urban Agglomeration of Central Guizhou has long been the core region of Guizhou Province’s economy and NU. Its active flow of resources, high levels of human activity, and rapid urbanization have increased the load on its fragile environment [42]. In light of the above, this study takes the Urban Agglomeration of Central Guizhou as the study area and obtains land-use, socioeconomic, and DEM data from 2010 to 2020 for analysis. First, we evaluate NU quality using the analytical hierarchy process (AHP), mean-square error (MSE), the Lagrangian function, and Euclidean distance. Second, we construct a three-dimensional ER assessment model based on resistance–adaptability–recovery to assess the ER level. Third, we analyze the spatiotemporal evolution characteristics of the CCD of NU and ER and the spatial clustering characteristics using a modified CCD model, spatial autocorrelation analysis, and trend surface analysis. Finally, the SCN of the CCD of NU and ER is analyzed using a modified gravity model and SNA in terms of integral, individual, and core–edge characteristics. This can provide a scientific basis for identifying key areas that promote or hinder coupled and coordinated NU–ER development in the Urban Agglomeration of Central Guizhou. It can also serve as a reference for stimulating endogenous dynamics, enhancing ER capacity, releasing synergistic effects among cities, and achieving high-level, high-quality coordinated sustainable development.

2. Materials and Methods

2.1. Study Area and Data Sources

2.1.1. Study Area

The Urban Agglomeration of Central Guizhou is located in the center of Guizhou Province, China (104.87°–108.20° E, 25.43°–28.49° N) (Figure 1). Its scope includes Guiyang, Zunyi, Bijie, An’shun, Qiandongnan, Qiannan, and 33 districts and counties in six prefecture-level cities and states, with a land area of 53,800 km2, accounting for 30% of Guizhou’s total land area. Located in the southwest inland hinterland of the Yangtze River and the upper reaches of the Pearl River, backed by the Chengdu–Chongqing Economic Zone and facing the developed eastern regions near Southeast Asia, the Urban Agglomeration of Central Guizhou has obvious location advantages. The Urban Agglomeration of Central Guizhou is mountainous and hilly, with a large area of karst land and a complex topography, a concentrated distribution of mineral resources, good transportation facilities, and a good industrial base. However, its environment is fragile, easily damaged by human activity, and difficult to repair [43]. Given this dual characteristic of an excellent environment that is also fragile [44], it is important for Guizhou Province to promote NU and ER coupling and coordinated development. Since the implementation of the Urban Agglomeration of Central Guizhou Development Plan in 2017, the local government has proposed 743 major projects for a total investment of CNY 3.5 trillion yuan. It is anticipated that the Urban Agglomeration of Central Guizhou will become a new type of green urbanization area with high livability by 2030. Thus, attention needs to be paid to enhancing disaster prevention and mitigation and promoting the coordinated development of NU and ER in the economic–industrial transformation and high-quality development of the Urban Agglomeration of Central Guizhou.

2.1.2. Data Sources

This study employs land-use data, socioeconomic data, DEM data, and administrative district data. Data sources include the following: 30 m × 30 m DEM data from the Chinese Academy of Sciences Geospatial Data Cloud website (https://www.gscloud.cn, accessed on 6 April 2024) and three-phase 30 m × 30 m land-use data (2010, 2015, 2020) sourced from the Resource and Environment Science and Data Center of the Chinese Academy of Sciences (https://www.resdc.cn, accessed on 18 April 2024.). The three-phase land-use data are generated by manual visual interpretation using Landsat-MSS/TM/ETM and Landsat 8 remote-sensing imagery as the main data source, including six primary and 25 secondary types and both primary and secondary land-use classifications. The accuracy of the first- and second-level land-use classifications is more than 90%. Administrative division data come from the standard map with review number GS (2019) 1822 downloaded from the website of the Standard Map Service of the Ministry of Natural Resources of China; there is no modification of the base map. Socioeconomic data come from the Guizhou Provincial Statistical Yearbook, Guizhou Provincial National Economic and Social Development Bulletin, and the statistical yearbooks of each prefecture-level city.

2.2. Methods

2.2.1. Construction of Evaluation Indicator System for NU

With the development of NU research, its evaluation standard has developed from a single urbanization indicator to a set of wide-ranging indicators. Referring to related studies [45,46,47], we consider the characteristics of the study area and follow the principles of comprehensiveness, representativeness, objectivity, and accessibility in the selection of indicators. We divide NU into five criteria layers: demographic, spatial, social, ecological, and economic. To reflect China’s new development concepts of urbanization, this covers areas such as economic growth, spiritual culture, people-oriented development, social equity, and the environment. We construct the index system for measuring the NU level of the Urban Agglomeration of Central Guizhou through 13 index layers, including urbanization rate and urban population density (Table 1).
We use combined subjective–objective assignment to avoid subjective arbitrariness. First, to eliminate the effect of magnitude, the original data are uniformly standardized using the method of polar deviation [10]. Second, subjective empowerment is performed using AHP [48], which is calculated to pass the consistency test (CI = 0.048, RI = 1.56, CR = 0.031 < 0.1). Objective empowerment is performed using MSE [49].
Finally, referring to relevant research findings [50,51], we use the Lagrangian function to establish the optimization decision model. The Euclidean distance function is used to ensure that the degree of difference between subjective and objective preference coefficients is consistent. The ideal combination weights are obtained (Table 1), and the specific formulas are as follows:
W j = a W a j + b W b j a + b = 1
where a and b are the subjective and objective preference degree coefficients, respectively; W a j and W b j are the AHP and MSE weights, respectively; and W j is the final ideal combination weight.
D W a j , W b j = j = 1 n W a j W b j 2 D ( W a j , W b j ) 2 = a b 2
Finally, a = 0.58 and b = 0.42 are calculated and brought into Equation (1) to obtain the ideal combination weights (Table 1).

2.2.2. Three-Dimensional Model for Evaluating ER: Resistance–Adaptability–Recovery

Referring to previous studies [52,53], we construct an ER assessment model with three aspects: resistance, adaptability, and recovery. The details are as follows:
  • Resistance
Resistance indicates the ability of regional ecosystems to resist external disturbances and damages. Regional ecosystem resilience (P) [34] is measured by selecting ecosystem values such as climate change, gas regulation, water conservation, soil formation and protection, waste treatment, and biodiversity in terms of multiple ecological elements, such as water, soil, and gas.
We use the equivalent coefficient of the value of ecosystem services as the ecosystem service value coefficient. The ecosystem service value equivalent factor is the relative contribution rate of the potential ecosystem service value, which is equal to 1/7 of the value of food per hectare per year [54]. The ecosystem service value of the Urban Agglomeration of Central Guizhou is calculated using the following formula:
P = E S V = A k × V C f k
where E S V is the ecosystem service value of the urban agglomeration, A k is the urban agglomeration of land use type k, and V C f k is the f ecosystem value coefficient of land use type k, whose coefficients refer to the relevant research results [55].
2.
Adaptability
The landscape pattern index can reflect a landscape’s ecological spatial patterns. It is widely used in landscape ecological zoning, ecological planning, ecological monitoring, ecological forecasting, and ecological effect assessment. It is useful for the purposeful and timely regulation of ecological landscape space. Thus, we use the landscape pattern index to evaluate the resilience of ecosystems in terms of landscape heterogeneity and landscape connectivity [56]. Landscape heterogeneity and landscape connectivity describe two aspects of the landscape ecosystem structure and are not substitutes for each other. Thus, their weights can be assumed to be equal. Table 2. shows the specific indicators.
3.
Recovery
Ecosystem recovery (also called ecological resilience) refers to the ability and potential of an ecosystem to maintain and recover from an external attack that damages the system’s functioning and structure.
Land-use types that closely resemble natural ecosystems are more likely to recover when exposed to external pressures (e.g., climatic or geologic hazards) while human-dominated built-up land types are less resilient in the face of external pressures, thus suffering greater damage. Referring to the ecological elasticity model and coefficients proposed by Peng [56], the specific calculation model is as follows:
R = A k × R C k
where R is the ecosystem resilience, A k is the area of land use type k , and R C k is the ecological resilience coefficient of land use type k . Since resistance, adaptability, and recovery are calculated using different units, we use the polar deviation method to standardize them. To calculate the ER level, the specific formula is as follows:
R e s i l i e n c e = A × P × R 3
where A is the adaptation, P is the resistance, and R is the recovery.

2.2.3. Modified CCD Model

We use a modified CCD model to calculate the CCD of NU and ER. The traditional CCD model has a validity problem. Wang et al. [57] considered that coupling degree C is not evenly distributed between [0,1] and therefore proposed a modified CCD model. Referring to related studies [57,58], we use the modified CCD model to evaluate the CCD of NU and ER. The modified CCD model is
C = 1 i > j , j = 1 n U i U j 2 m = 1 n 1 m × i = 1 n U i m α x U i 1 n 1
T = i = 1 n a i × U i
i = 1 n a i = 1
D = C × T
where C represents the degree of coupling, indicating the effect of the interaction between NU and ER; U 1 and U 2 indicates the comprehensive evaluation index values of NU and ER, respectively; T indicates the overall coordination index, reflecting the extent to which the overall level of coordination between NU and ER contributes to the degree of coordination: a i is the relative importance of the NU system and the ER system, referring to relevant researches [59], both are given a value of 0.5. D represents CCD, indicating the degree of NU and ER coupling.

2.2.4. Spatial Autocorrelation Analysis

Spatial autocorrelation can better analyze the CCD of NU and ER in terms of spatial clustering characteristics. Global Moran’s I can judge whether there is spatial correlation between regions, and local Moran’s I can reflect local spatial clustering. Thus, in this study, we identify the spatial heterogeneity and clustering dynamics of the CCD of NU and ER using global and local Moran’s I.
  • The global Moran’s I index
    I = i = 1 n j = 1 n W i j x i x ¯ x j x ¯ i = 1 n j = 1 n W i j i = 1 n x i x ¯
  • The local Moran’s I index
    I i = n x i x ¯ j = 1 , j i n W i j x i x ¯ i = 1 n x i x ¯ 2
where n is the number of counties, x i and x j are the CCD of regions i and j ; x ¯ is the average CCD of all counties; W i j is the neighboring space weight matrix. If counties i and j have a common boundary, W i j is 1, otherwise it takes 0; The results of the global Moran’s I calculation are used in a Z-test. When |Z| > 2.58, then it passes the p < 0.01 significance test.

2.2.5. Modified Gravity Model

Referring to the relevant research results [37,38], we use a modified gravity model to analyze the SCN characteristics of the CCD of NU and ER in the Urban Agglomeration of Central Guizhou. The calculation formula is as follows:
R i j = K i j p i G i C i 3 p j C j G j 3 D i j 2 ,   K i j = C i C i + C j ,   D i j = d i j g i g j ,
where R i j indicates the strength of the SCN of the CCD of NU and ER of county i to county j , K i j indicates the contribution of county i to the strength of the SCN of the CCD of NU and ER in county j , and D i j indicates the economic–geographical distance between region i and region j . p , C , G , and g indicate the number of populations, the CCD of NU and ER, the gross regional product, and the per capita GDP, respectively. d i j indicates the geographical distance between regions i and j .

2.2.6. Trend Surface Analysis

Trend surface analysis uses regression analysis to fit a two-dimensional nonlinear function. In terms of overall interpolation, given a large number of discrete points of information, spatial trend asymptotic characterization can be used to explore the spatial trend and distribution pattern of the research object. We take CCD as the observation value and use trend surface analysis to simulate the spatiotemporal heterogeneity characteristics of the CCD of the NU and ER of the Urban Agglomeration of Central Guizhou from 2010 to 2020. Let ( x i , y i ) be the spatial location of the ith county and district. Then Z i ( x i , y i ) is the trend function of the ith county and district, where the X-axis represents the east–west direction and the Y-axis represents the north–south direction.

2.2.7. SNA

SNA is widely used to analyze the linkage structure of various networks. Some researchers have already introduced SNA into the analysis of interregional spatial network structures to examine their overall network characteristics [38,60], density, and structure. Accordingly, we use network density, network relevance, and network efficiency to describe the integral network characteristics of the CCD of NU and ER. We analyze the individual characteristics of SCN according to degree centrality, proximity centrality, and intermediary centrality. We use core–edge analysis to reveal the core or edge position of districts and counties in the SCN.

3. Results

3.1. Spatiotemporal Evolutionary Characteristics of NU and ER

3.1.1. Spatiotemporal Evolutionary Characteristics of NU

Using the natural breakpoint method, we divide the NU quality of the Urban Agglomeration of Central Guizhou in 2010, 2015, and 2020 into low-level zones (0.00–0.27), lower-level zones (0.27–0.34), general-level zones (0.34–0.39), higher-level zones (0.39–0.45), and high-level zones (>0.45).
According to the time series (Figure 2d), the average value of NU quality in the Urban Agglomeration of Central Guizhou from 2010 to 2020 rose from 0.313 in 2010 to 0.441 in 2020, showing a steady increase overall. Kaili, Guiding, Kaiyang, Huaxi, and Bozhou are in the top five in terms of the NU quality growth rate during the period 2010–2015, and Xixiu, Pingba, Longli, Fuquan, and Zhen’ning are in the top five from 2015 to 2020 (Figure 2d). It is worth noting, however, that the NU quality in Nanming, Yunyan, Honghuagang, and Huichuan is higher than that in the other regions during the study period (Figure 2d). This is mainly because these regions are richer in mineral resources, have relatively good transportation facilities, have a better industrial base, and are more densely populated. In terms of type, from 2010 to 2020, the low-level region (0.00–0.27) declined from 33.3% in 2010 to 15.2% in 2015 and disappeared in 2020, during which time it mainly included the regions of Puding, Zhen’ning, and Huishui (Figure 2a–c). The high-level region (>0.45) increased from 6% in 2010 to 39.4% in 2020, in which period, it mainly included Nanming, Yunyan, and Huichuan (Figure 2a–c), showing a significant increase. We can see that during the study period, the NU quality of the Urban Agglomeration of Central Guizhou increased overall, and regional imbalance was significantly reduced.
Regarding the spatial pattern (Figure 2a–c), the NU quality of the Urban Agglomeration of Central Guizhou is obvious in the structure of the central–northern high-level region, and the geospatial gap has been reduced. In 2010, the high-level region mainly comprised the central and northern regions of Honghuagang, Nanming, and Yunyan; the low-level region mainly comprised the southwestern areas of Puding, Zijin, and Xixiu (Figure 2a). In 2015, the higher- and high-level regions expanded in central areas such as Baiyun and Huaxi and northern areas such as Bozhou and Suiyang (Figure 2b). In 2020, the higher- and high-level regions significantly expanded in the northern and central areas (Figure 2c) while the low-level region disappeared, indicating that NU quality in the Urban Agglomeration of Central Guizhou improved during the study period, especially in the central and northern regions.

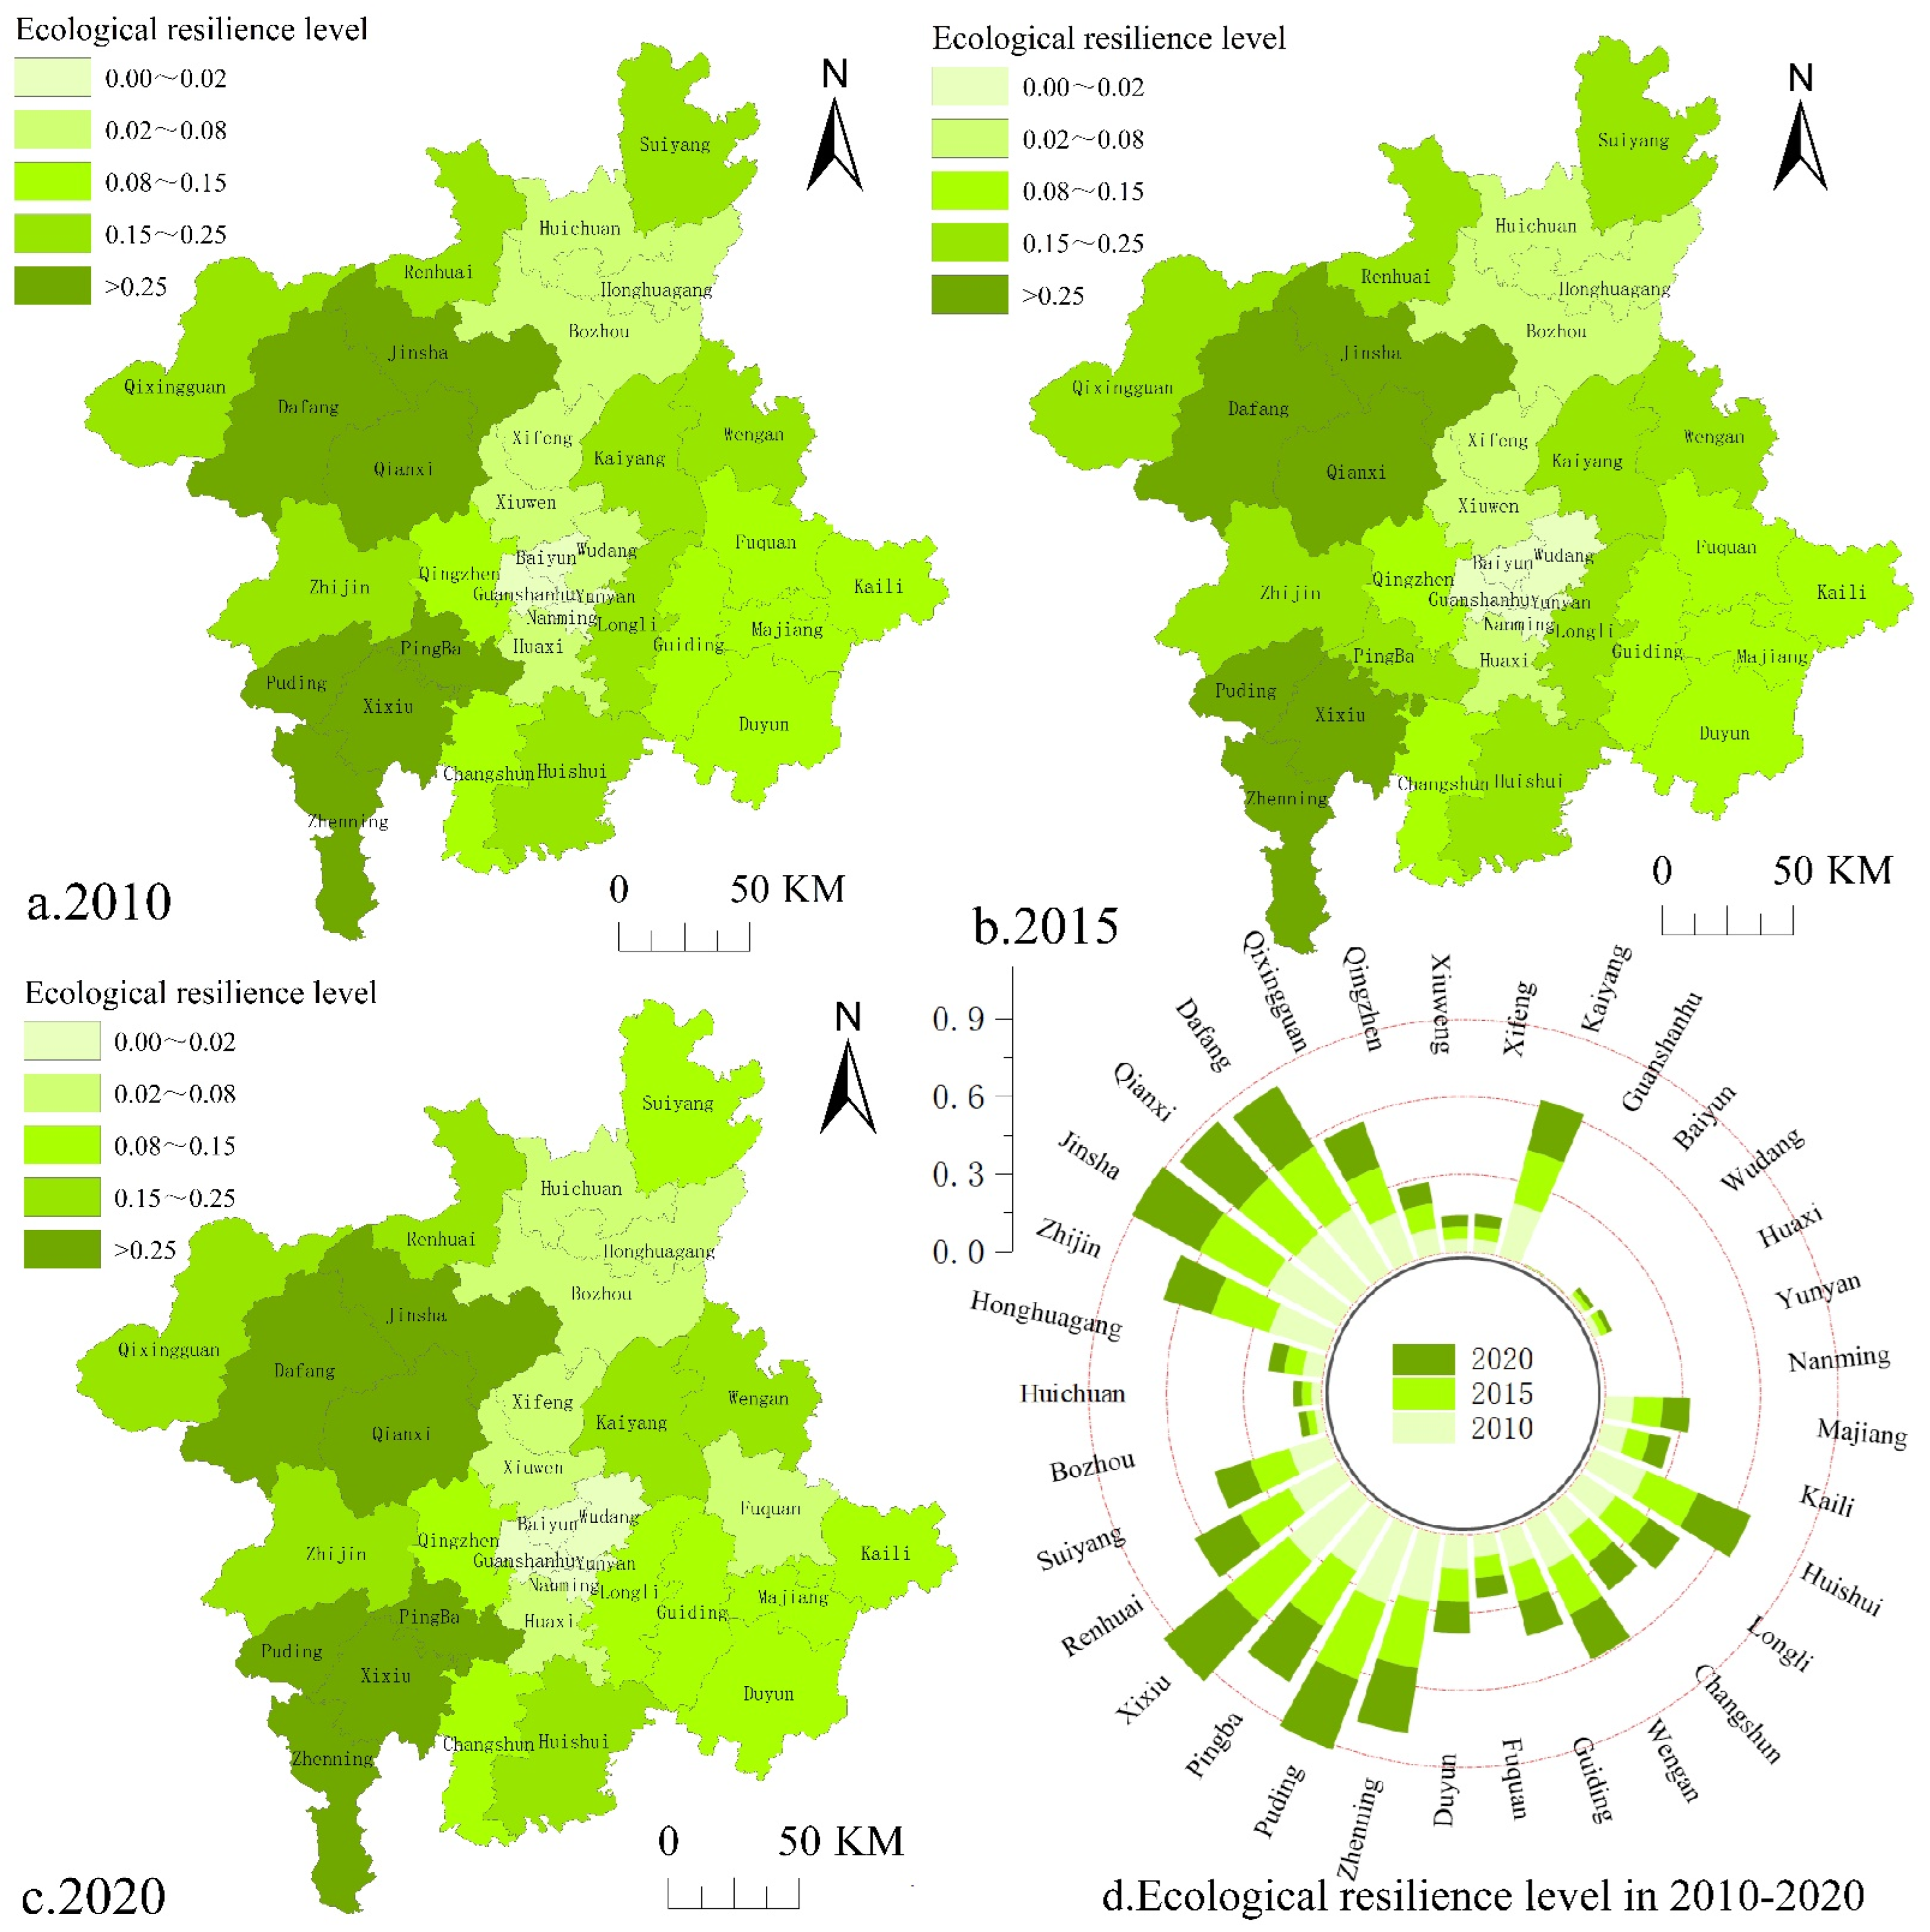
3.1.2. Spatiotemporal Evolutionary Characteristics of ER Level

Using the natural breakpoint method, we divide the ER level of the Urban Agglomeration of Central Guizhou in 2010, 2015, and 2020 into low-level regions (0.00–0.02), lower-level regions (0.02–0.08), general-level regions (0.08–0.15), higher-level regions (0.15–0.25), and high-level regions (>0.25).
According to the time series (Figure 3d), during the period 2010–2020, the average value of the ER level in the Urban Agglomeration of Central Guizhou decreased from 0.1437 in 2010 to 0.1357 in 2020, showing an overall decreasing trend. From 2010 to 2015, the level ER of Kaili, Baiyun, Nanming, Yunyan, and Huaxi was negative, and the negative growth rate was in the top five (Figure 3d). During the period 2015–2020, the negative growth rate of ER level was significantly faster in Nanming, Yunyan, Guanshanhu, Baiyun, and Huaxi and was in the top five for negative growth rate (Figure 3d). It is worth noting, however, that Dafang, Qianxi, Jinsha, Xixiu, and Puding have higher levels of ER than the other regions during the study period (Figure 3d). This is mainly because these regions are higher in elevation, have less human activity, and are less likely to disturb the ecosystem. In terms of type, there is little change from 2010 to 2020. The main type is the low-level region (0.00–0.02), increasing from 12.1% in 2010 to 15.2% in 2020; this mainly includes Nanming, Yunyan, Baiyun, and Guanshanhu. The general-level region (0.08–0.15) rises from 21.2% in 2010 to 24.2% in 2020, it mainly includes Fuquan, Majiang, and Kaili among others. The higher-level region (0.15–0.25) rises from 24.2% in 2010 to 27.3% in 2015 before falling to 18.2%, and it mainly includes Suiyang, Zijin, Kaiyang, and others. In general, the ER level of the Urban Agglomeration of Central Guizhou remains relatively stable during the 10-year period but still shows a slight downward trend.
Spatially (Figure 3a–c), the ER level of the Urban Agglomeration of Central Guizhou from 2010 to 2020 shows a pattern of low levels in the north-central area and high levels in the northwestern and southeastern areas. From 2010 to 2015, high and relatively high levels of ER are distributed mainly in Qianxi, Dafang, Jinsha, and Qixing’guan. This is because of their high levels of forest cover, high terrains, and weak interference from human activity. The low- and lower-level regions are mainly located in Guanshanhu, Yunyan, Nanming, Huaxi, and Honghuagang. This is attributable to their high levels of economic development, frequent human activity, and high levels of ecosystem destruction.

3.2. Spatiotemporal Evolutionary and Spatial Clustering Characteristics of the CCD

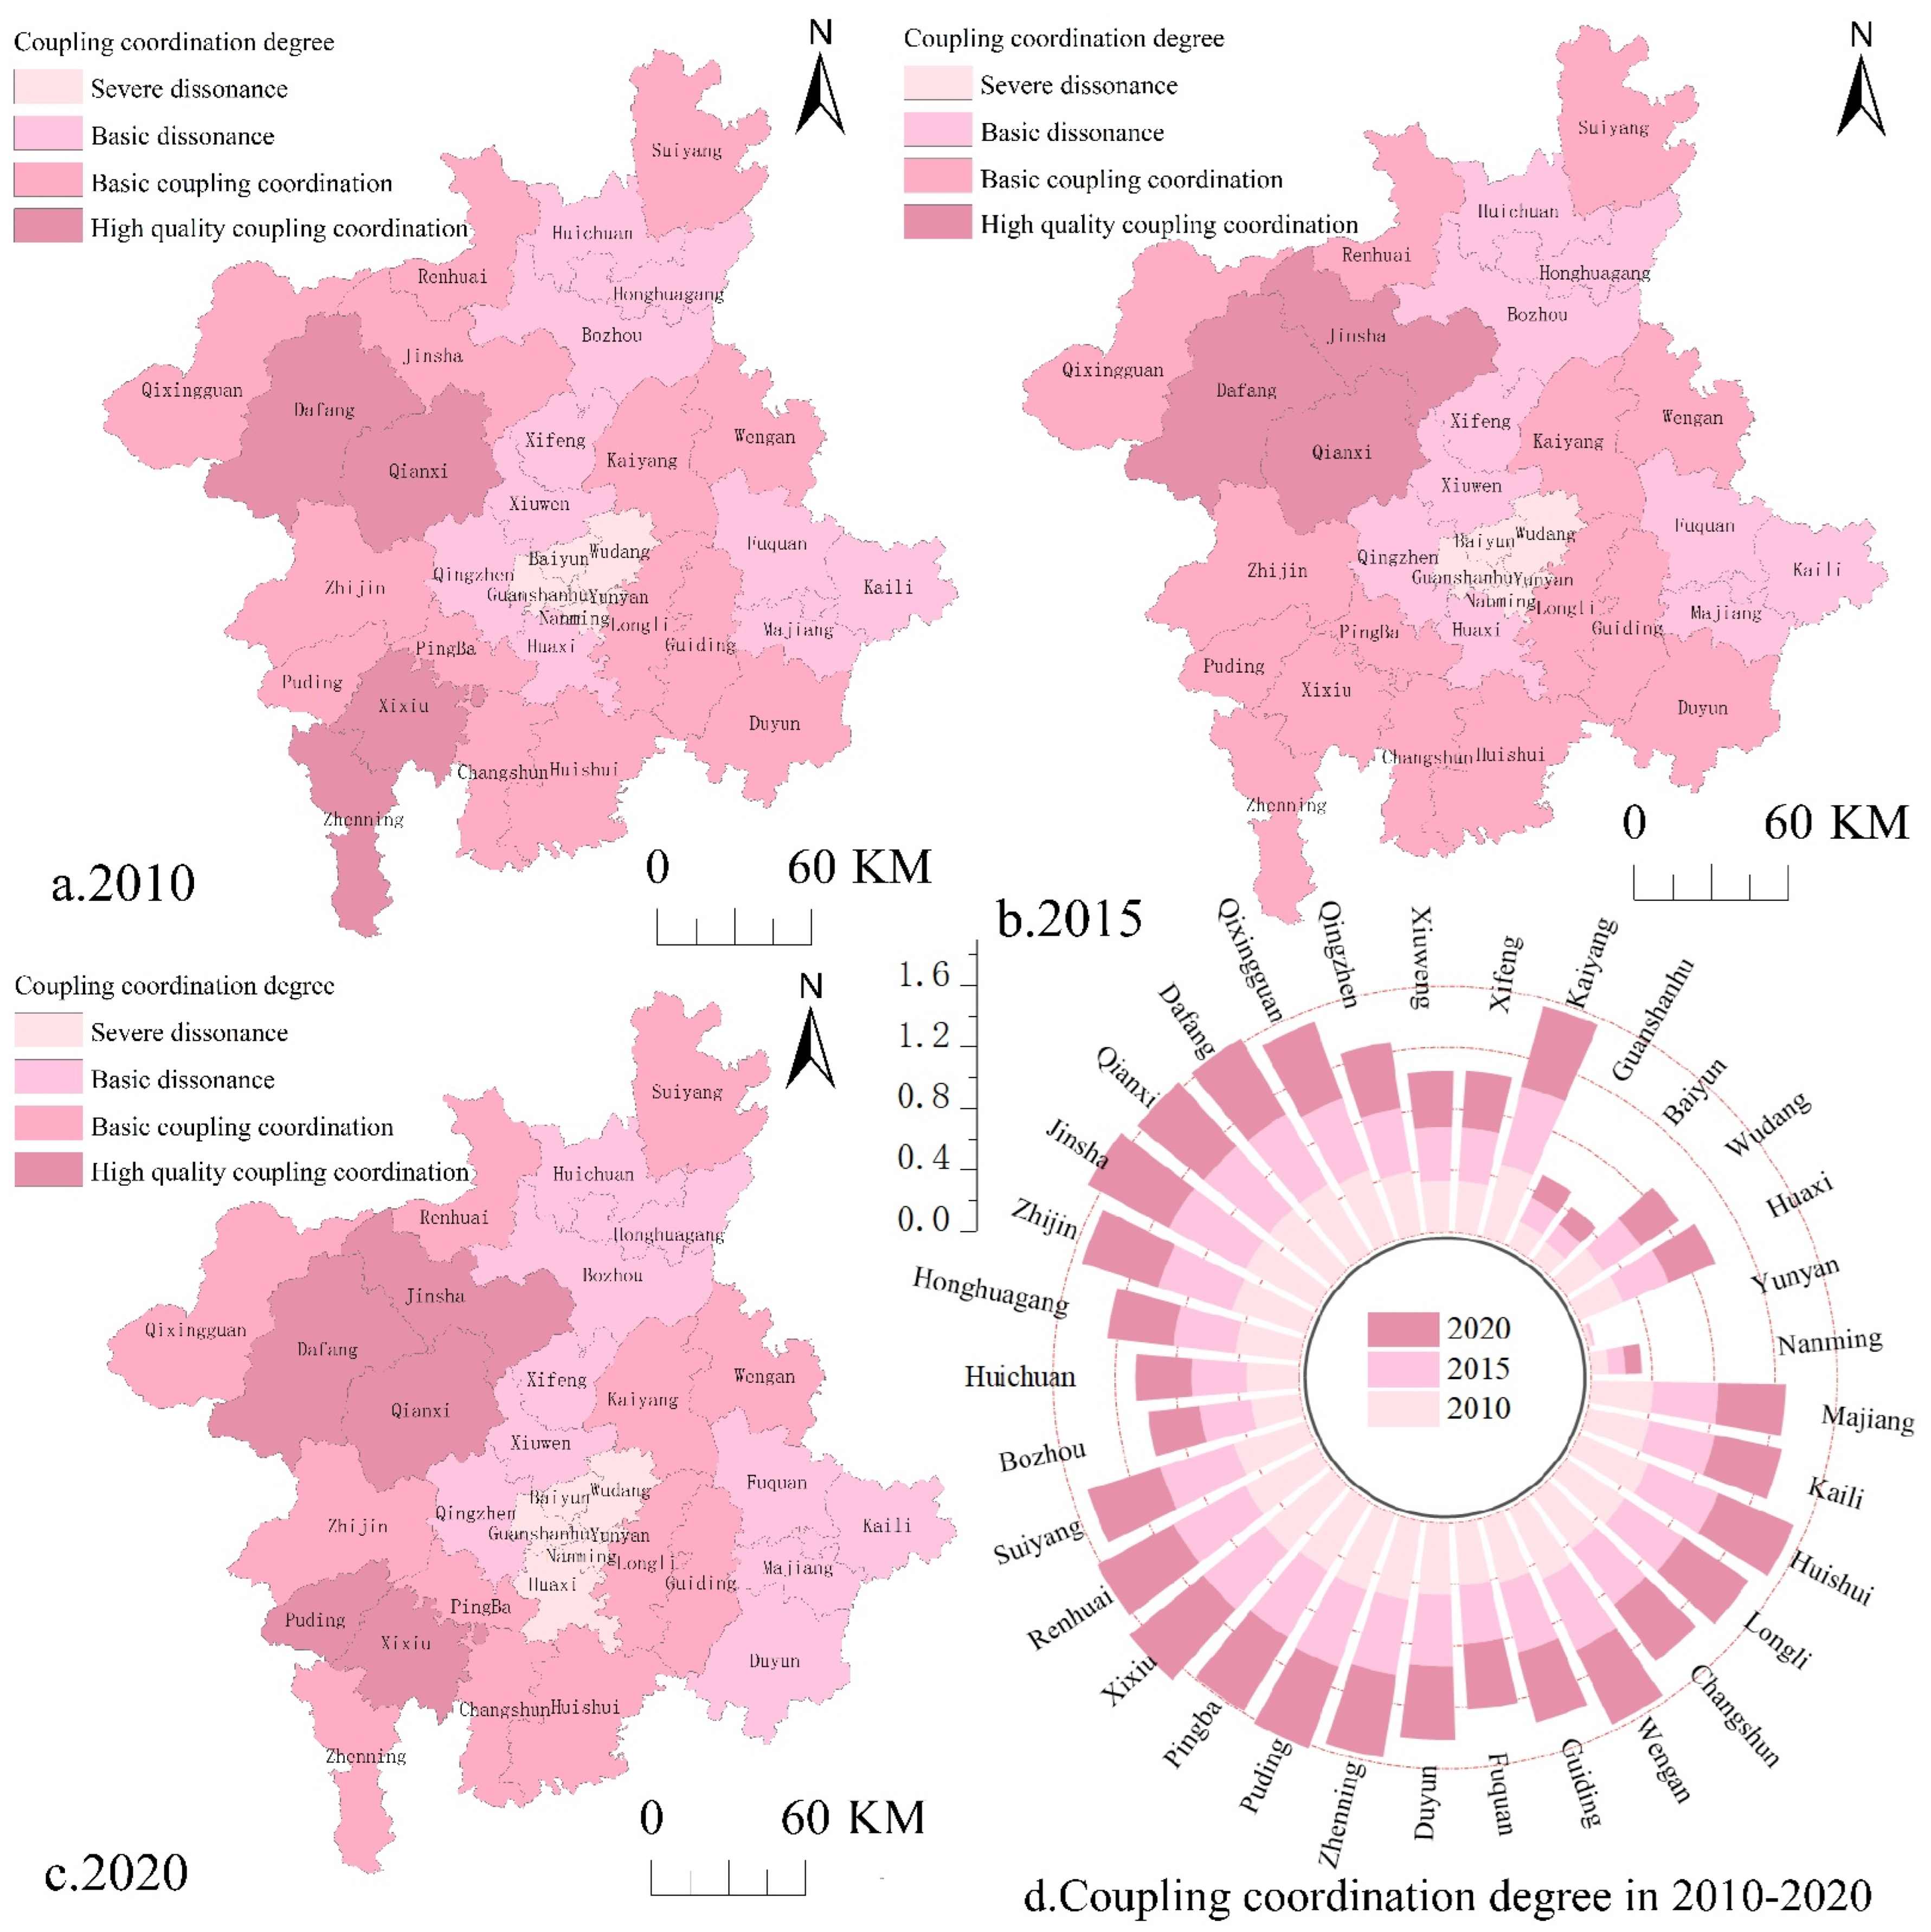
3.2.1. Spatiotemporal Evolutionary Characteristics of the CCD

Using the natural breakpoint method, we classify the CCD of NU and ER in the Urban Agglomeration of Central Guizhou in 2010, 2015, and 2020 as severe coupling dissonance (<0.2), basic coupling dissonance (0.2–0.35), basic coupling coordination (0.35–0.5), and high coupling coordination (>0.5).
According to the time series (Figure 4d), between 2010 and 2020, the average value of the CCD of NU and ER in the Urban Agglomeration of Central Guizhou decreased from 0.345 in 2010 to 0.338 in 2020, which is relatively stable, but with a decreasing trend. During the period 2010–2015, Huaxi, Xifeng, Xiwen, Dafang, Qianxi, Jinsha, Huichuan, Bozhou, Puding, and Majiang showed positive growth in CCD while the rest showed negative growth. From 2010 to 2015, only Huaxi, Xifeng, Xiwen, Dafang, Qianxi, Jinsha, Huichuan, Bozhou, Puding, and Majiang showed positive growth in the CCD, while the rest of the regions showed negative growth. Xixiu, Zhenning, and Kaili all had a greater degree of negative growth than the rest of the regions. From 2015 to 2020, only Xifeng, Qianxi, Bozhou, Xixiu, Puding, Zhenning, Changshun, and Huishui showed positive growth in CCD while the rest showed negative growth. The degree of negative growth was greater than that in other regions, including Nanming, Yunyan, Guanshanhu, Zhijin, and Honghuagang. In terms of type, in 2010, affected by the “mismatched” development of high NU and low ER, regions such as Baiyun, Guanshanhu, Nanming, and Yunyan showed severe coupling dissonance while Dafang, Qianxi, and Zhenning showed high coupling coordination owing to their ecological advantages and relatively high levels of economic development. Huichuan, Bozhou, and Kaili showed basic coupling dissonance, and Pingba, Suiyang, and Kaiyang showed basic coordination.
There was little change in 2015 compared with 2010, with only Zhenning decreasing from high coupling coordination (0.514) to basic coupling coordination (0.479) and Jinsha moving up from basic coupling coordination (0.492) to high coupling coordination (0.543). In 2020, except for the eight regions of Xifeng, Qianxi, Bozhou, Xixiu, Puding, Zhenning, Changshun, and Huishui, there was a decreasing trend in the CCD of the remaining regions. The remaining regions showed a decreasing trend in CCD. Overall, the CCD showed a trend of “bad growth and good decline”; that is, the number of dissonant regions is increasing, and the number of coordinated regions is decreasing.
Regarding the spatial pattern (Figure 4a–c), the low-value region in terms of the CCD of NU and ER in the Urban Agglomeration of Central Guizhou expands from the central area to the northeast and southeast, and the high-value region is mainly distributed in the northwest and southwest. This is mainly influenced by topography, natural resource environment, and regional economic development. In 2010, regions with severe coupling dissonance were mainly concentrated in the central region, including Yunyan and Guanshanhu, while high coupling coordination was mainly found in the northwestern and southwestern areas, such as Dafang, Qianxi, Xixiu, and Zhenning. In 2015, regions with severe and basic coupling dissonance remained relatively stable, and the high coupling coordination region was reduced to Xixiu and Zhenning. In 2020, the severe and basic coupling dissonance regions expanded to the south, and the high coupling coordination region added Puding in the southwest. In summary, there was a decreasing trend in the CCD of NU and ER in the Urban Agglomeration of Central Guizhou during the 10-year study period.

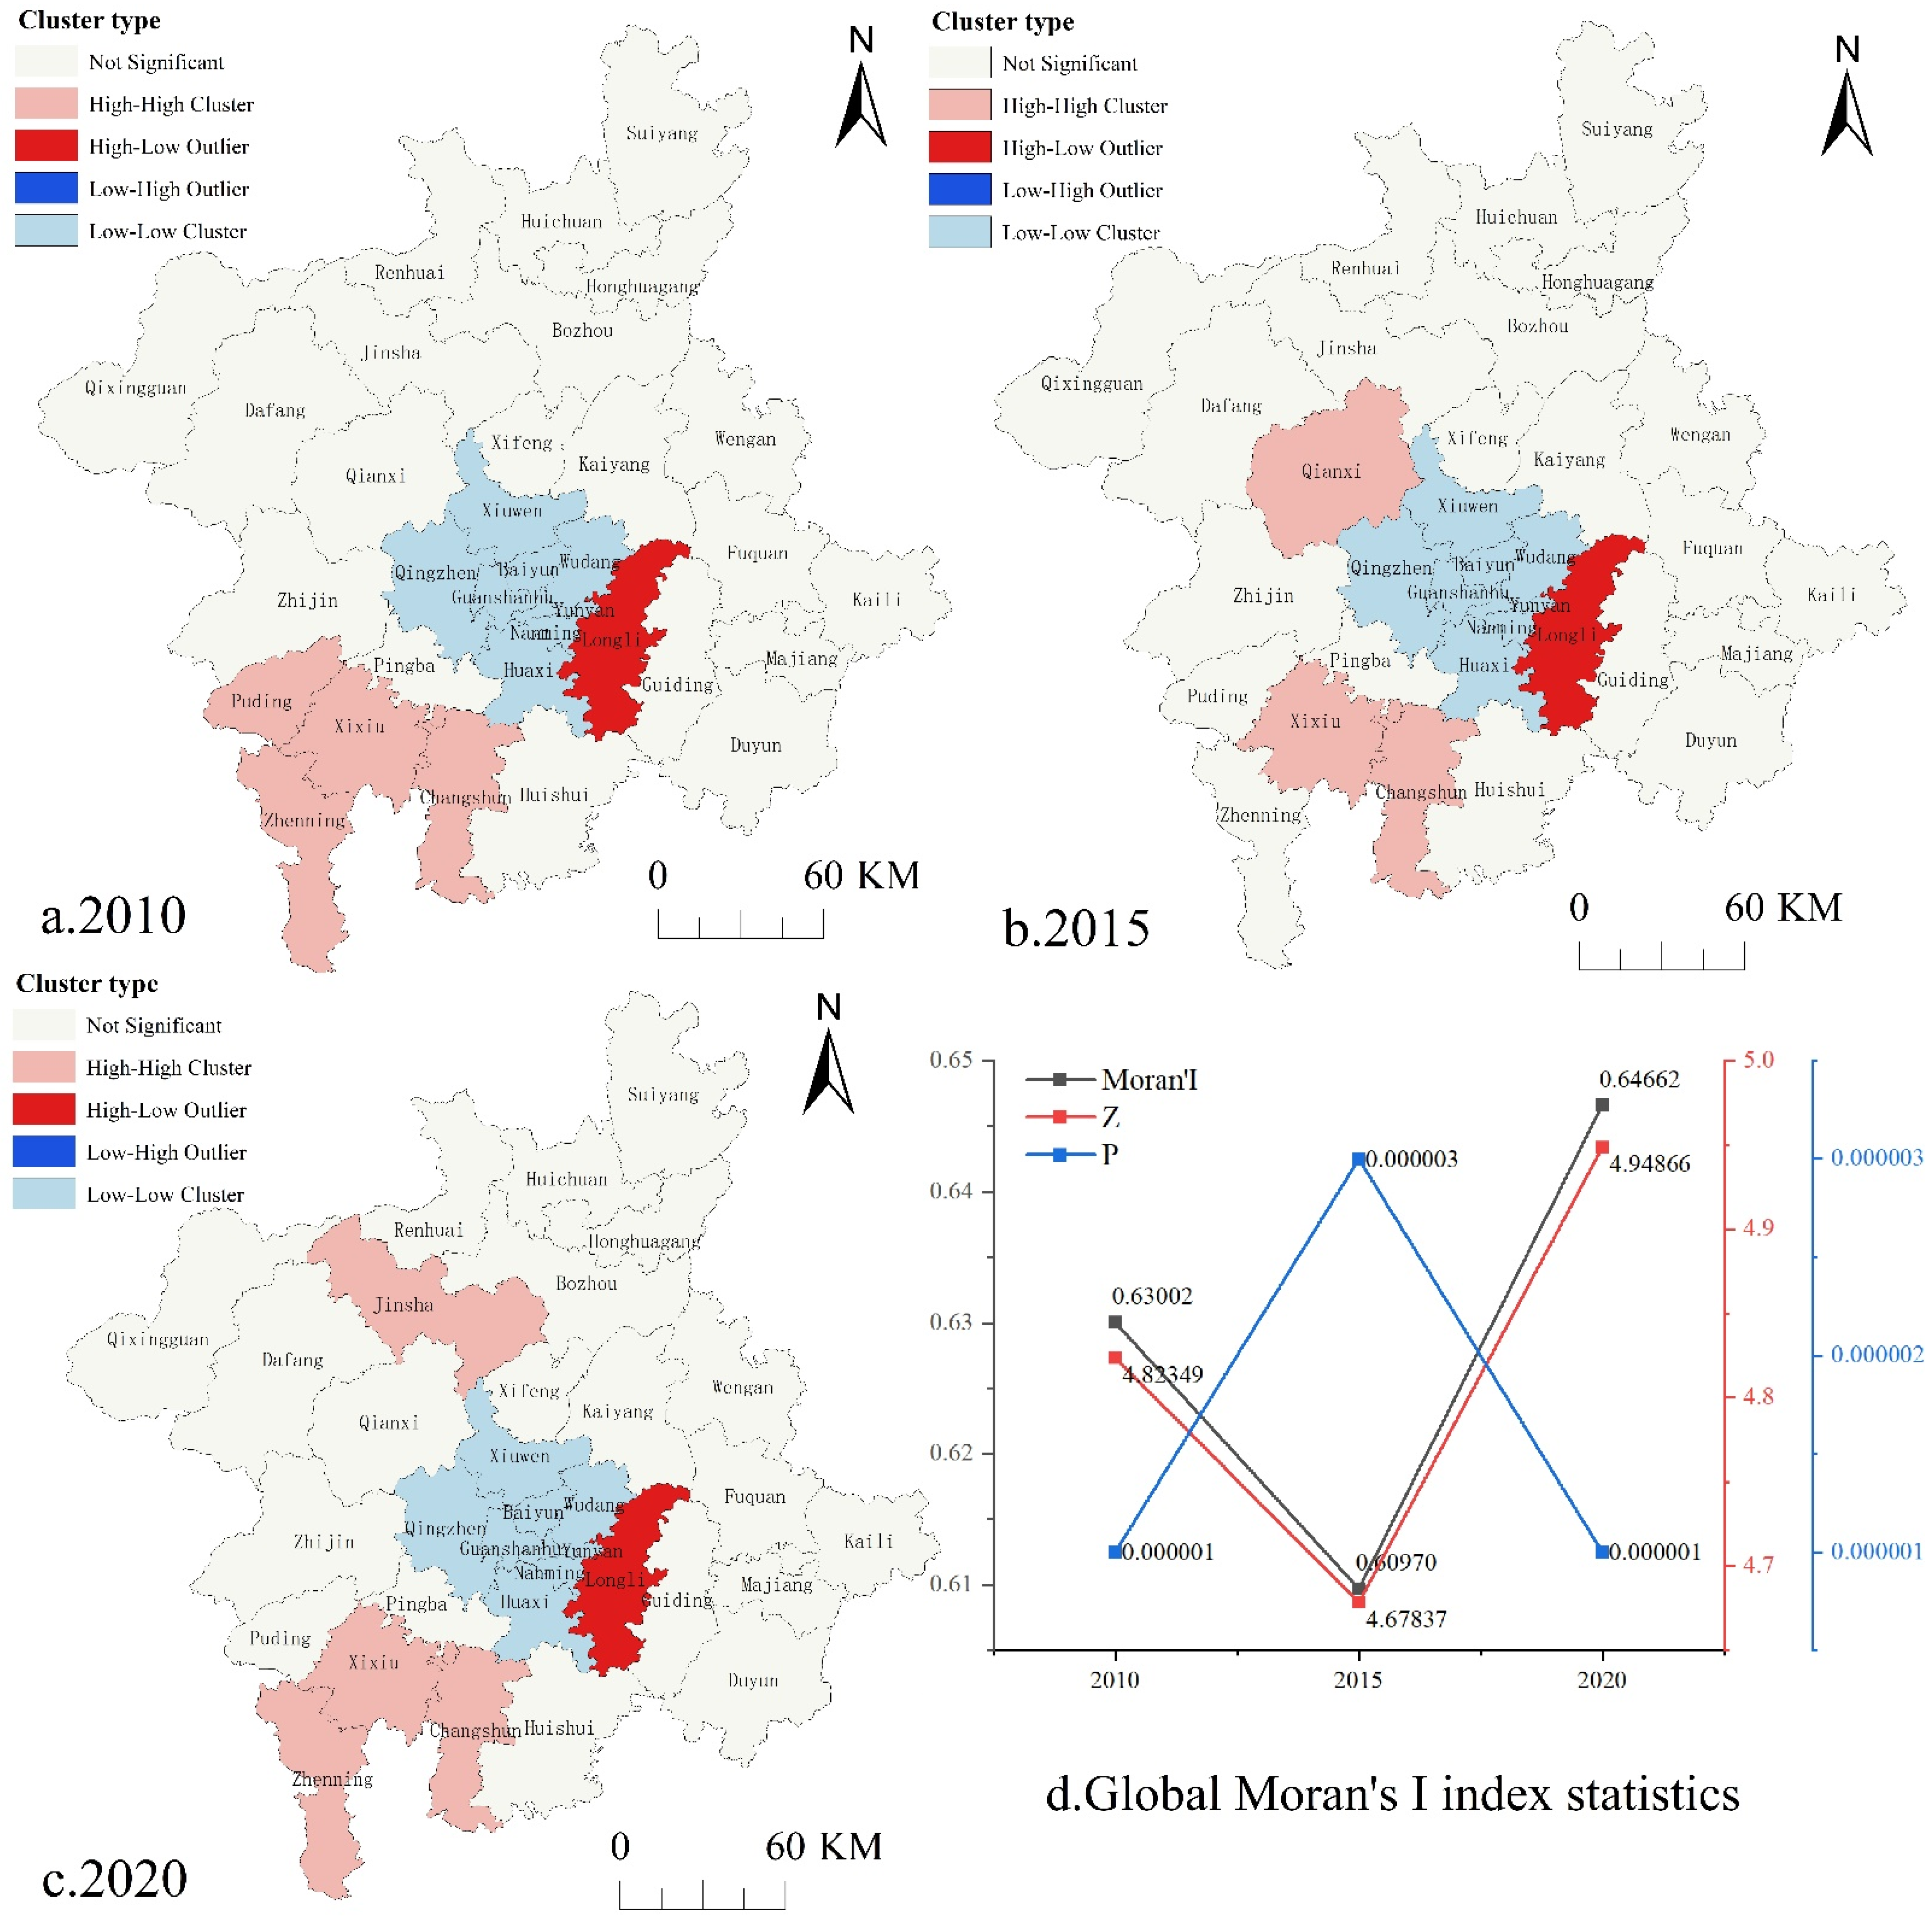
3.2.2. Spatial Clustering Characteristics of the CCD

We use GeoDa 1.14.0 to analyze the spatial clustering characteristics of the CCD of NU and ER. The results indicate that the Moran’s I of CCD is greater than 0 from 2010 to 2020 and passes the 99% confidence test (Z > 2.58, p < 0.01). This indicates that CCD presents an obvious positive correlation in space, and the spatial clustering feature is significant. The Z-value decreases and then increases from 2010 to 2020, indicating that the spatial clustering of CCD tends to strengthen during that time (Figure 5d).
We located the Moran’s I to obtain the LISA clustering map of the CCD of NU and ER of the Urban Agglomeration of Central Guizhou from 2010 to 2020 (Figure 5a–c). The high-high agglomerations are more stably distributed in Puding, Xixiu, Changshun, and Zhenning, which are close to Guiyang, with good transportation, industrial development, environmental protection measures, and ER. A more stable distribution of high-low agglomeration is found in Longli, which is close to Guiyang and has a more developed economy but a lower level of ER. Low-low agglomeration is more stable in Baiyun, Huaxi, Nanming, Yunyan, Wudang, Guanshanhu, and other central regions. These regions have more advanced socioeconomic development, and NU quality is far above average. However, the rapid expansion of urban construction encroaches on ecological space, triggering environmental problems, and the ER level is far below average.

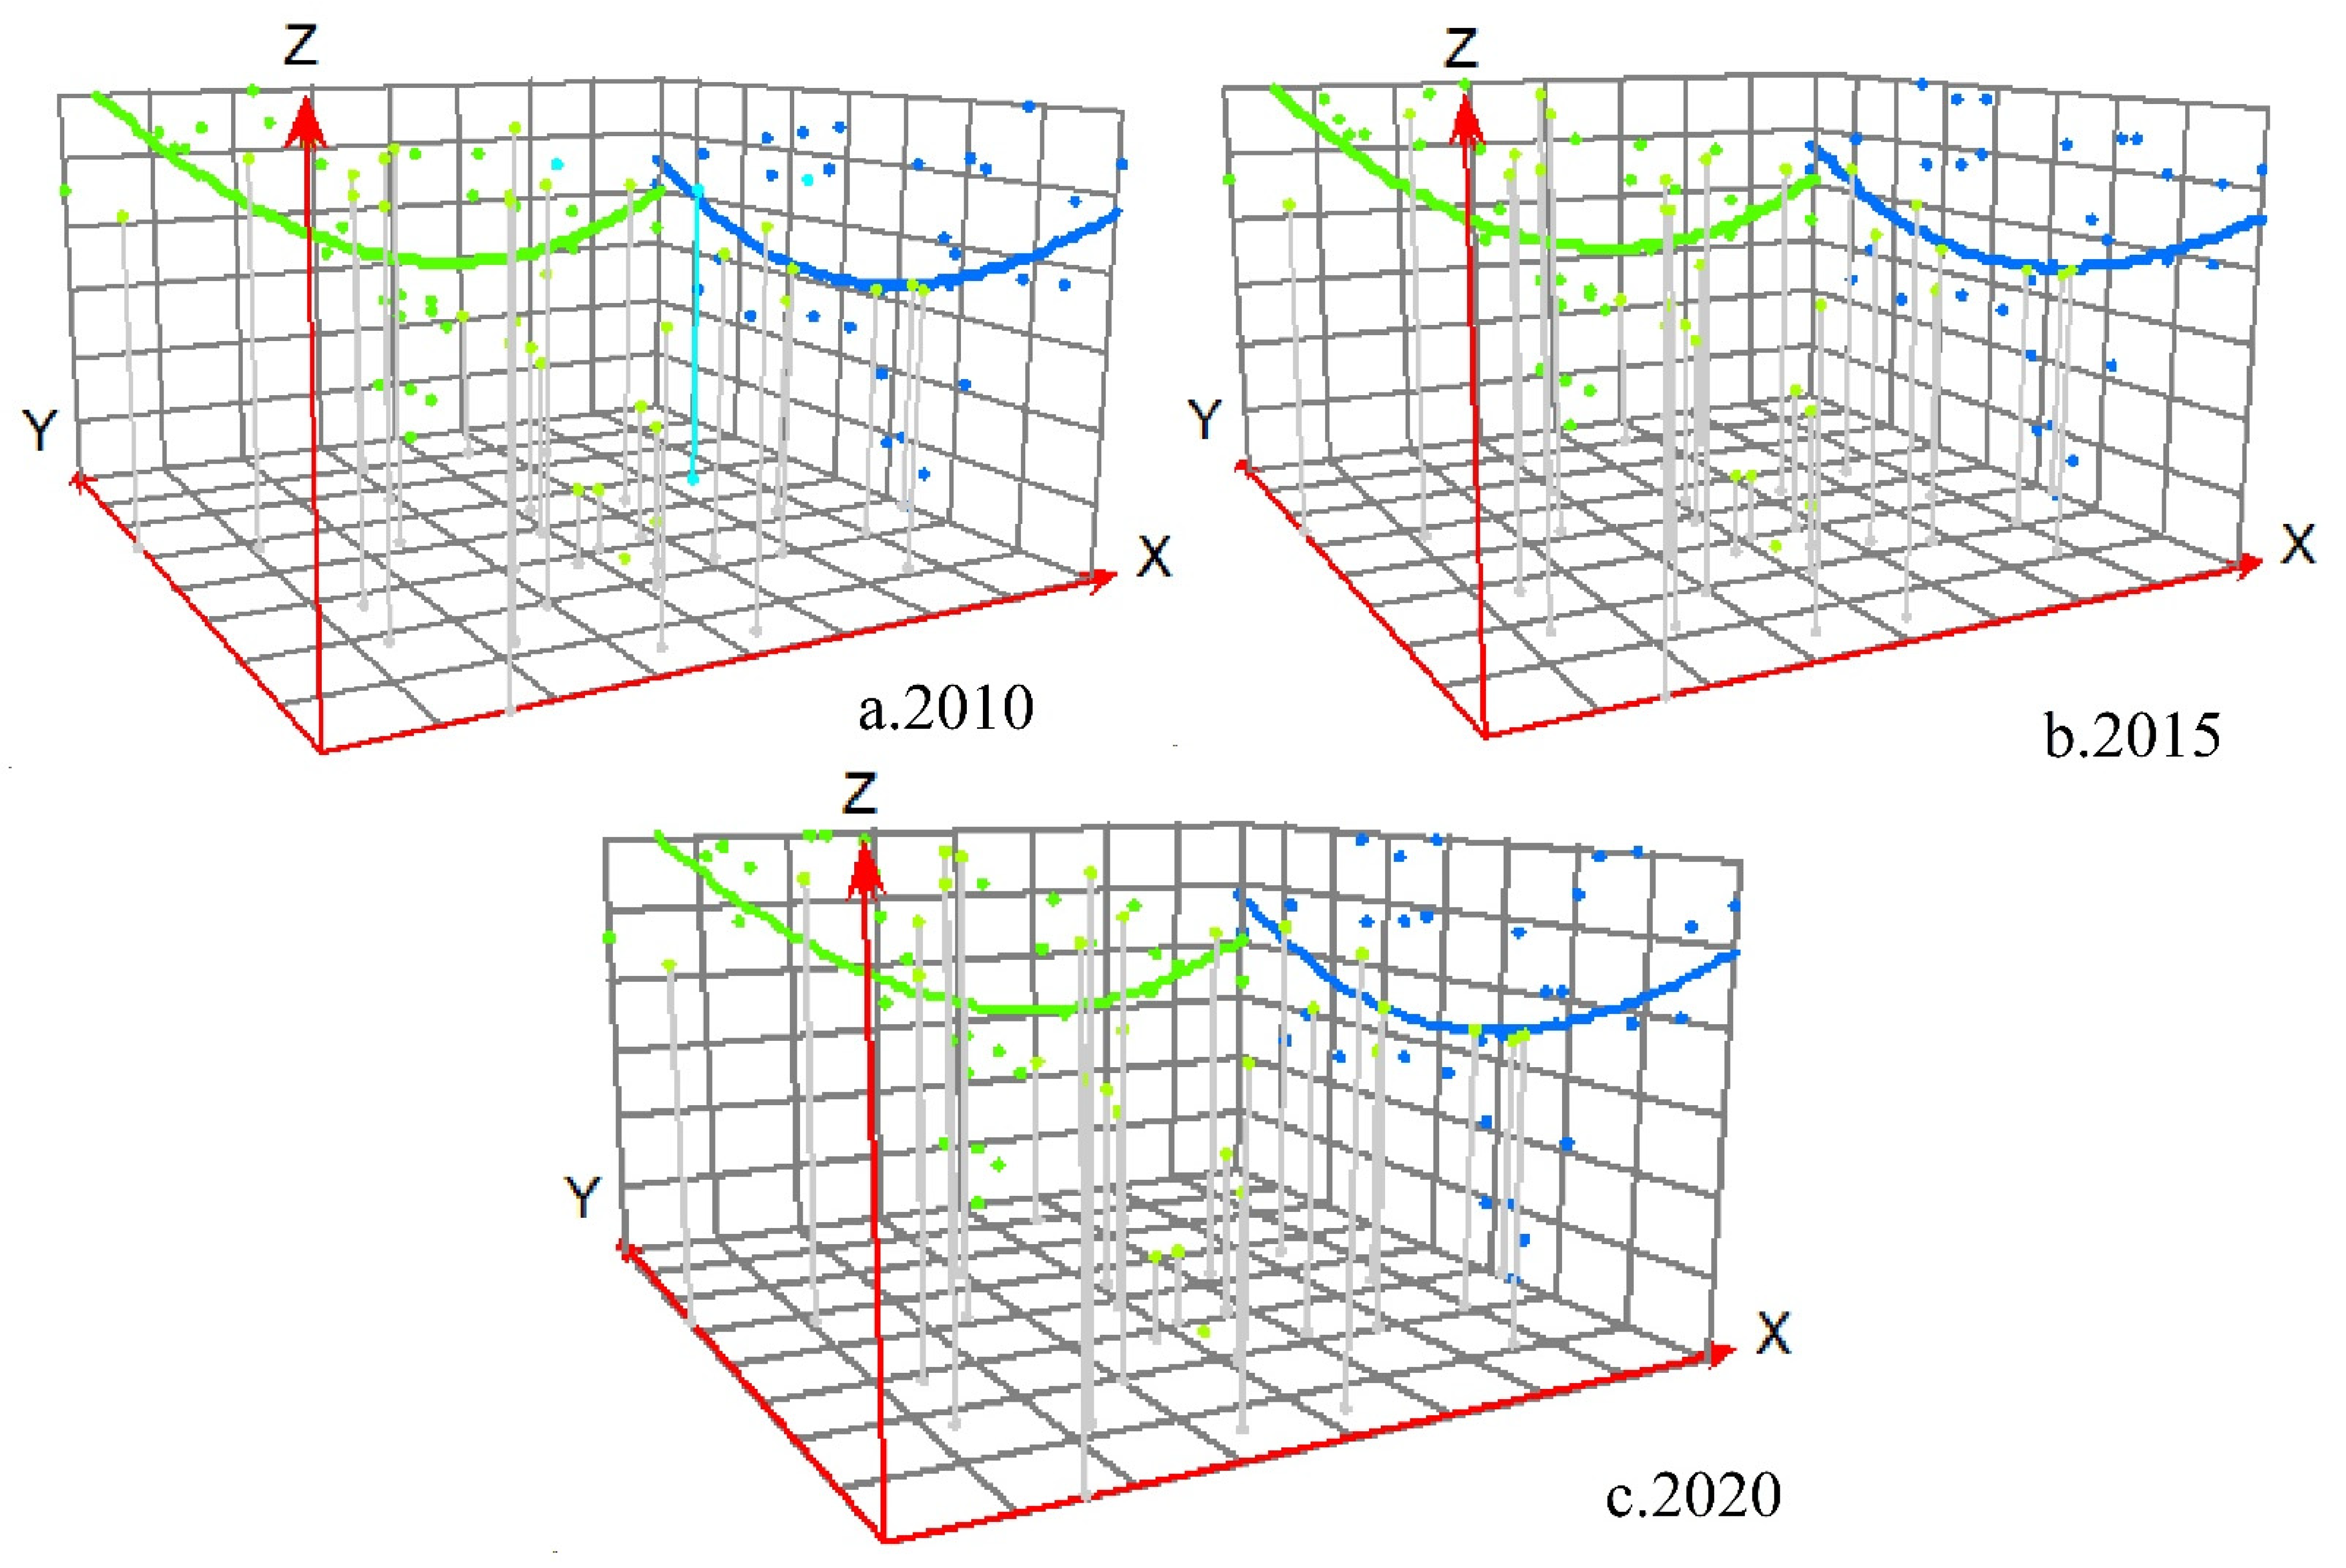
3.2.3. Trend Surface Analysis of the CCD

We use the trend surface analysis tool in ArcGIS 10.8 to visualize and analyze the CCD of NU and ER in the Urban Agglomeration of Central Guizhou and identify the trends in spatial distribution. The X-axis represents the east–west direction, and the Y-axis represents the north–south direction. The green curve represents the trend forecast for the east–west direction of the CCD of NU and ER, and the blue curve represents the trend forecast for the north–south direction. From 2010 to 2020, the CCD of NU and ER in the Urban Agglomeration of Central Guizhou showed a double U-shaped arc in space. The overall spatial pattern was high in the west and low in the east, and low in the north and high in the south—that is, west > north > south > east > central (Figure 6). Over time, the U-shaped structure weakens, the level of the west increases, the difference between east and west does not change much, and the gap between north and south is reduced. Overall, spatial non-balance remains prominent.

3.3. SCN Characterization of the CCD

The spatial connection of the CCD of NU and ER between the districts and counties in the Urban Agglomeration of Central Guizhou is not limited to the traditional geospatial scope of proximity but forms a complex cross-regional spatial network pattern (Figure 7). This affects the coupling and coordination process of NU and ER among the different districts and counties, calling for an analysis of the SCN of the CCD of NU and ER.
In 2010, Renhuai and Bozhou were at the core of the SCN, and Nanming and Yunyan were more connected to other regions (Figure 7). In 2015, Renhuai, Bozhou, Huaxi and Kaiyang were at the core of the SCN. Yunyan, Nanming, Guanshanhu, Weng’an, and Xiuwen occupied important positions in each bureau. Spatial connections between the central and northern parts of the Urban Agglomeration of Central Guizhou increased while connections between the southeastern and southwestern areas remained relatively stagnant. This reflects an unbalanced characteristic of being dense in the central and northern areas and sparse in the eastern and western areas. In 2020, the core region status of each bureau became more obvious, when regions such as Qixingguan, Weng’an, and Pingba were gradually associated with other regions. This pushed the formation of a complex intertwined and distributed network pattern in the northwestern, southwestern, and southeastern parts of the Urban Agglomeration of Central Guizhou.

3.3.1. Integral Characterization of the SCN

First, from 2010 to 2020, network density increased from 0.7367 to 0.7576 and then decreased to 0.6477 (Figure 8). Thus, the spatial connection strength of the CCD of NU and ER among the districts and counties increased first and then decreased. However, the higher level of network density indicates that the spatial connection between the districts and counties is more active, gradually forming a complicated SCN. Network density in 2020 showed a decreasing trend compared with 2015 (Figure 8). This could be attributable to the more rapid development of transportation facilities, economic levels, and information networks, leading to a frequent exchange of factors such as population flow, information flow, and economic flow between regions. However, this also increased the intensity of interregional connections, making it difficult to determine the SCN nodes with a specific node, which affects the growth of network density.
Second, the network connections from 2010 to 2020 were all 1, indicating that SCN was very close, with significant spatial relationships and spatial spillover effects. SCN was also relatively stable, with no “island nodes” in the networks. Network efficiency decreased from 0.2802 to 0.2581 in 2010 and then increased to 0.3750 in 2020 (Figure 8). This indicates that the connection lines in the network increase and then decrease, and in recent years, the connection paths among the districts and counties of the Urban Agglomeration of Central Guizhou have become more diversified, and network connection and stabilization have improved.

3.3.2. Individual Characterization of the SCN

We used Ucinet 6.186 software to calculate the SCN individual characteristic indicators of the CCD of NU and ER in the Urban Agglomeration of Central Guizhou to more deeply explore the role attributes and functions of the districts and counties in the SCN structure (Figure 9).
  • Degree centrality analysis
In 2010, 2015 and 2020, the average value of degree centrality of the SCN in the Urban Agglomeration of Central Guizhou was 47.15, 48.48 and 41.45, respectively. Nanming, Yunyan, Huaxi, Honghuagang, Bozhou and other central and northern regions have above average values of degree centrality (Figure 9). This is mainly because the economies of these regions are relatively developed, urbanization is more rapid, and factors such as population and resources are clustered in these regions, thus having a driving effect on other regions. The degree centrality of Kaili, Jinsha, Qianxi, Duyun, and Qixingguan is below the average value. The main reasons include relatively poor transportation facilities and geographic remoteness, as well as the poor flow of population, information, and other elements. While the degree centrality of SCN tended to increase and then decrease from 2010 to 2020, the degree centrality of a few counties, such as Longli and Puding, continued to increase This suggests that these counties have to some extent dispersed the absolute influence of Guiyang.
2.
Proximity centrality analysis
The proximity centrality of SCN in the Urban Agglomeration of Central Guizhou from 2010 to 2020 tended to increase and then decrease. The average values of the proximity centrality of SCN in 2010, 2015, and 2020 were 80.01, 81.53, and 74.84, respectively. The proximity centrality of central regions such as Nanming, Yunyan, Huaxi, and Wudang has long been above the mean (Figure 9). This is mainly because these regions have strong ties with other regions through the inflow of factors such as population, information, and resources, as well as the export of technology and capital to other regions. The proximity centrality of the regions of Kaili, Suiyang, and Puding is lower.
3.
Intermediary centrality analysis
There is an upward trend in the intermediary centrality of SCN from 2010 to 2020. The mean values of the intermediary centrality of SCN in 2010, 2015, and 2020 were 5.06, 4.66, and 6.92, respectively. The intermediary centrality of central regions such as Nanming, Yunyan, and Huaxi was above the mean value (Figure 9), indicating that these regions have strong mediation in the SCN. The intermediary centrality levels of Kaili, Majiang, Qianxi, and Duyun were below the mean value, which might be caused by the lower level of economic development and geographic remoteness. It is worth noting that there was a significant increase in the intermediary centrality of Kaili, Huishui, and Longli, indicating that the hub role of these regions has significantly increased.

3.3.3. Core–Edge Analysis

During the 10-year study period, the density of the core region of the SCN decreases by 0.007, and the density of the core–edge region decreases by 0.170 (Table 3). The density of the edge region of the SCN generally increases and then decreases, and it changes with the density of the core region. This shows that the spatial connection of the CCD of NU and ER in the Urban Agglomeration of Central Guizhou is gradually diversified, and the intensity of spatial connection is characterized by a large concentration in the center and small concentration in the periphery (Figure 10). The network density of Nanming, Yunyan, Huaxi, Kaili, Longli, and Suiyang counties increased significantly during the period 2010–2020. This suggests that in the coupled and coordinated SCN system of NU and ER, the strength of the connection between these districts and counties gradually increased, mainly influenced by geographical location and economic development.

4. Discussion

4.1. Spatiotemporal Evolutionary Characteristics of the CCD of NU and ER

The external economics of rapid urbanization can lead to pollution, environmental damage, soil and water contamination, rising temperatures, and declining land productivity [61,62], thus affecting regional ER levels.
Our results show that the CCD of NU and ER in the Urban Agglomeration of Central Guizhou exhibits basic coupling dissonance, showing a west > north > south > east > central pattern (Figure 6). Meanwhile, we find that the NU quality in the Urban Agglomeration of Central Guizhou continues to increase, and quality is the highest in the central region and lower in the western region. However, there is a downward trend in the ER level, which is the lowest in the central region and higher in the western region. This aligns with research on the Yangtze River [10] and Pearl River Delta [27] areas. At the same time, NU quality and ER level have a spatial overlap between their high- and low-level zones. We can conclude that rapid urbanization harms regional ecosystems [3,5], affecting levels of sustainability, suitability, and resistance, which will inevitably affect coupled and coordinated NU–ER development. The CCD of NU and ER has long been dominated by low-low agglomeration in the central region and high-high agglomeration in the southwestern area (Figure 5). This is because the central region is rich in mineral resources, transportation facilities are more complete, industry development is better, and the population is more concentrated [63]. With the capital city of Guiyang located in the central region, it receives strong policy support from the government, and its level of economic development is higher. However, its long-term pattern of unsustainable industrial development has put more pressure on the environment [64,65]. The western and southwestern regions, meanwhile, have fragile environments and complex topographies, with high terrains in the west and low terrains in the east [66]. Since 2000, the government has pushed forward soil erosion control projects and the return of farmland to forests and grasslands [67], showing improved environmental protection efforts.
Therefore, we suggest that while aiming to enhance NU, the government should also pay attention to protecting the environment and improving ER. For example, environmental protection zones should be strictly delineated, ecological restoration projects should be implemented, and the development mode should be transformed through industrial restructuring and the cultivation of new industries to promote the coupled and coordinated development of industry, urbanization, and the natural environment. At the same time, the government should intensify its efforts in terms of environmental management; the protection of air, water, and soil; and the reduction in ecosystem load via green development.

4.2. Characteristics of the SCN of the CCD

In the context of informatization, industrialization, and urbanization, interregional interaction is no longer bound by traditional geospatial proximity but forms a wider, more complex SCN [20]. Our results show that the CCD of NU and ER in the Urban Agglomeration of Central Guizhou forms a complex cross-regional SCN pattern. There are also imbalances characterized by strong connections between the central and northern areas and weak connections between the eastern and western areas. This may be related to the special topography and distribution of resources in Guizhou Province, and linked to the strategy of western development and ecological strategy. During the period 2010–2020, the SCN of the CCD of NU and ER in the Urban Agglomeration of Central Guizhou had a network connection of 1. In 2015, network density begins to show a decreasing trend compared with 2020, and network efficiency increases from 0.2802 in 2010 to 0.3750 in 2020. This indicates that the spatial connection between districts and counties is close and that CCD has obvious spatial spillover effects. This is mainly because of externalities in economic and social development. Further, the central regions of Nanming, Yunyan, and Wudang have high degree centrality, approximation centrality, and intermediary centrality, indicating that they have a strong agglomeration of regional elements and are at the core of the SCN. This is because these regions have a more frequent flow of people, goods, and resources, as well as higher levels of economic development and better transportation facilities, influenced by the combined effects of geographic location and economic development conditions [43].
We suggest, then, that the government should make full use of the complex SCN characteristics of the CCD of NU and ER and give full play to the intermediary and bridging roles of core regions such as Nanming, Yunyan, Honghuagang, and Kaili. Second, we should continue to enhance the economic strength of the growth poles along with environmental protection and governance while increasing the agglomeration capacity of Xixiu, Puding, Changshun, Longli, Qixingguan, and other areas. This can promote the coordinated development of the western, north-central, and southern regions. We should also strengthen the exchanges and links between neighboring districts and counties, give full play to the neighborhood bureau effect, and overcome administrative boundaries. This can facilitate the formation of a new pattern of ecological and economic coupling and coordinated development between districts and counties with complementary advantages and efficient coordination. Finally, we should strengthen the construction of intercity infrastructure to shorten commuting distances between cities and promote the connected development of neighboring districts and counties. We should pay attention to the ecological and economic spillover effects of core counties and strengthen the function diversion of core counties and the acceptance capacity of marginal counties to improve the SCN of the CCD of the NU and ER of the Urban Agglomeration of Central Guizhou.

4.3. Limitations and Future Research

We used the modified CCD model to evaluate the CCD of NU and ER in the Urban Agglomeration of Central Guizhou, and introduced the modified gravitational model and social network analysis to explore the SCN characteristics of the CCD of NU and ER in depth from the integral, individual, and core–edge perspectives. We provided both new and improved models for the assessment of coupled coordination and explored new content of related research on NU and ER. However, owing to data availability and changes in the administrative divisions in the Urban Agglomeration of Central Guizhou, most of our data came from the Guizhou Provincial Statistical Yearbook and the statistical yearbooks of prefectural cities in 2010, 2015, and 2020. This makes it difficult to carry out a long time-series study. Future work could use remote sensing or other new models to investigate coupled and coordinated NU–ER development. Moreover, we do not consider regional differences, spatial transformation, and convergence in the CCD of NU and ER. In the future, a theoretical framework of the evolution of regional SCN should be constructed to provide further support for high-quality sustainable regional development.

5. Conclusions

This study takes the 33 districts and counties of the Urban Agglomeration of Central Guizhou as the research object. Using AHP, MSE, the Lagrangian function, Euclidean distance, a modified CCD model, spatial autocorrelation analysis, trend surface analysis, a modified gravitational model, and SNA, we analyzed the spatiotemporal evolution characteristics of NU quality, ER level, and the CCD of NU and ER in the Urban Agglomeration of Central Guizhou. We examined the SCN characteristics of the coupling and coordination of NU and ER in terms of the integral, individual, and core–edge aspects. The conclusions are as follows:
  • From 2010 to 2020, NU quality in the Urban Agglomeration of Central Guizhou gradually increases, but there is a downward trend in the ER level and a spatial overlap between their high-level and low-level zones.
  • During the study period, the CCD of NU and ER in the Urban Agglomeration of Central Guizhou shows an overall decreasing trend and basic coupling dissonance. The overall pattern is west > north > south > east > central, showing a double U-shaped arc. Spatially, there is a positive correlation, dominated by the low-low agglomeration in the central region and high-high agglomeration in the southwestern region.
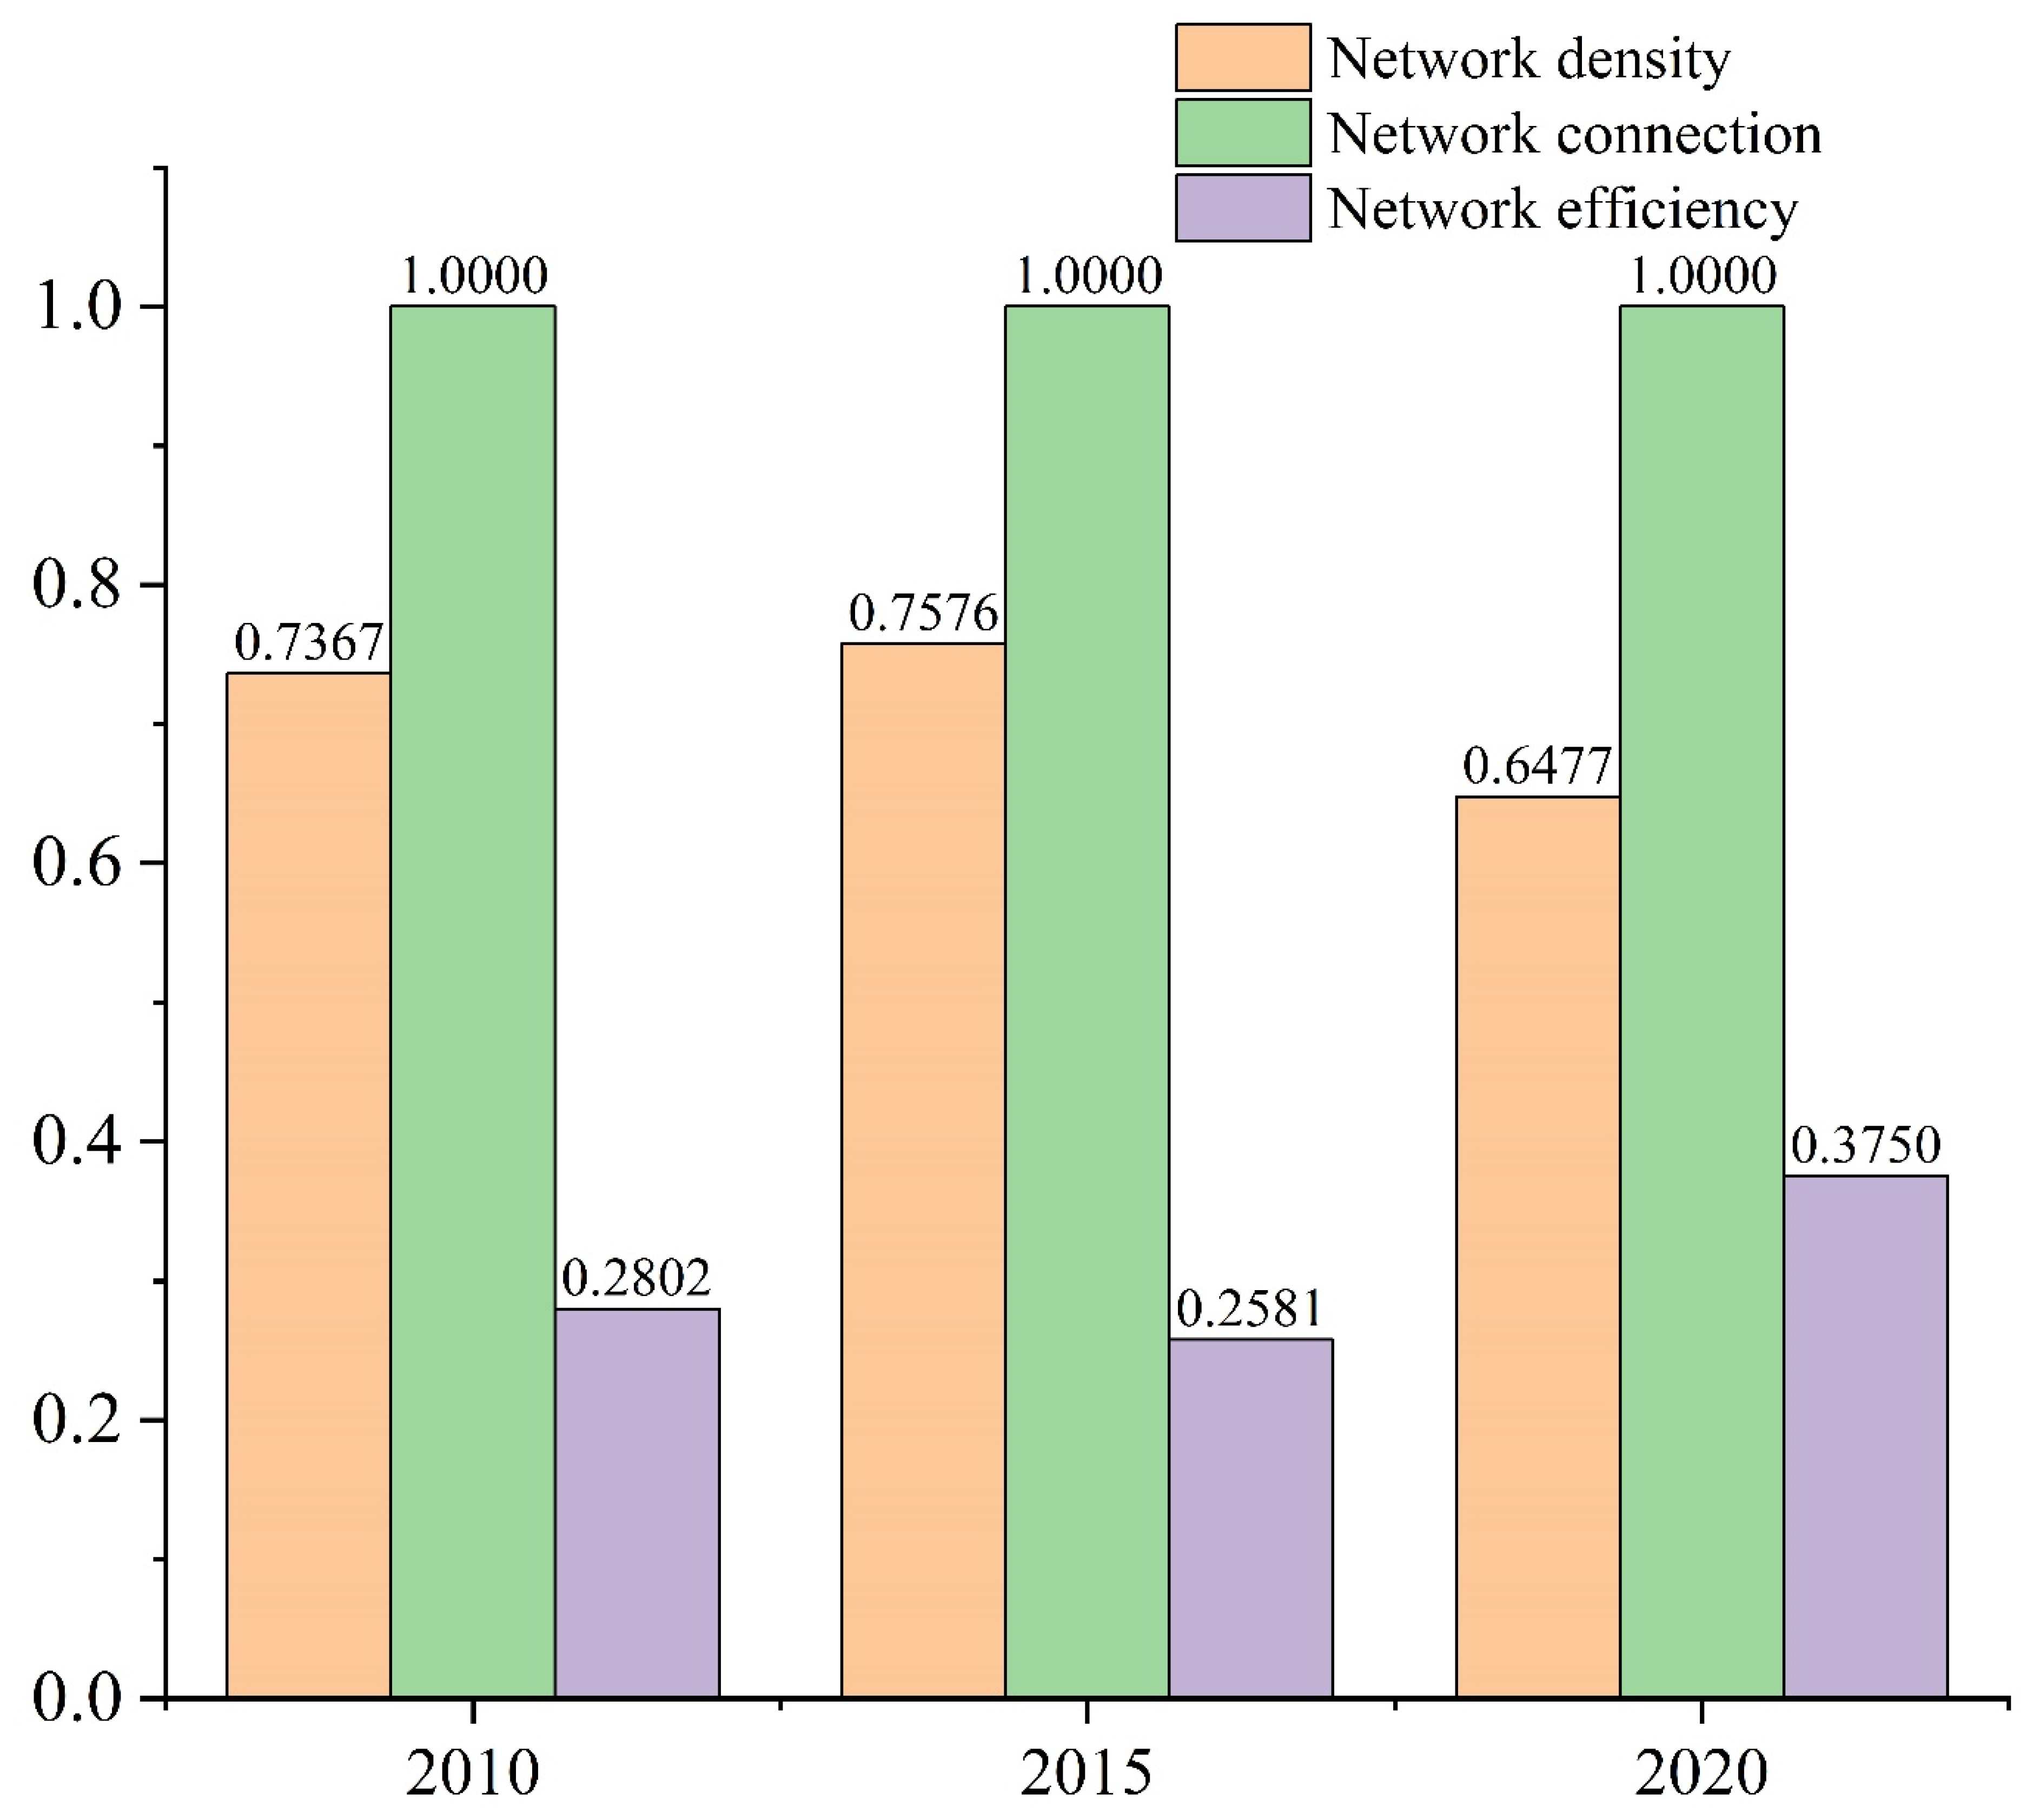
  • During the study period, the SCN of the CCD of NU and ER showed active, dense, and complex characteristics, with no “island nodes” in the network. The network density increased from 0.7367 in 2010 to 0.7576 in 2015 and then decreased to 0.6477 in 2020. The network connection was 1, and network efficiency decreased from 0.2802 in 2010 to 0.2581 and then increased to 0.3750 in 2020.
  • During the study period, the SCN of the CCD of NU and ER in the Urban Agglomeration of Central Guizhou has a significant core–edge characteristic. Nanming, Yunyan, Wudang, and other districts and counties have high degree centrality, proximity centrality, and intermediary centrality and have been in the core of the network for a long time. This indicates that the center of the SCN has strong control over regional elements.
Based on our analysis, we can conclude that rapid urbanization harms regional ecosystems, affecting their sustainability, suitability, and resistance. This also inevitably affects coupled and coordinated NU–ER development, jointly influenced by geography, natural features, and levels of economic development. At the same time, coupled and coordinated NU–ER development is no longer confined to the traditional geospatial scope of proximity but rather forms a cross-regional, broader, more complex, and more frequent SCN pattern. Accordingly, we suggest that while promoting industrialization and urbanization, governments should fully consider natural regional conditions so that development is not only in harmony with the environment but also compatible with the carrying capacity of resources and the environment. At the same time, we should make full use of the complex SCN features of the CCD of NU and ER to form a new pattern of coordinated economic–environmental development with complementary advantages and efficient synergies. This study provides a scientific basis for benign NU–ecosystem construction in the Urban Agglomeration of Central Guizhou and related policymaking. It can also help guide environmental protection and high-quality sustainable development in related areas.

Author Contributions

Conceptualization, H.R. and C.W.; methodology, C.W.; software, C.W.; survey, C.W.; writing—original draft preparation, C.W.; data curation, H.R.; writing—review and editing, C.W. and H.R.; supervision, H.R.; capital acquisition, H.R. All authors have read and agreed to the published version of the manuscript.

Funding

This research was funded by the General Project of Humanities and Social Sciences Research of Guizhou University, grant number GDYB2022023.

Data Availability Statement

Data are contained within the article.

Conflicts of Interest

The authors declare no conflicts of interest.

References

  1. Yu, B. Ecological effects of new-type urbanization in China. Renew. Sust. Energy Rev. 2021, 135, 110239. [Google Scholar] [CrossRef]
  2. Wang, S.; Fang, C.; Guan, X.; Pang, B.; Ma, H. Urbanisation, energy consumption, and carbon dioxide emissions in China: A panel data analysis of China’s provinces. Appl. Energy 2014, 136, 738–749. [Google Scholar] [CrossRef]
  3. Chen, W.; Chi, G. Urbanization and ecosystem services: The multi-scale spatial spillover effects and spatial variations. Land Use Policy 2022, 114, 105964. [Google Scholar] [CrossRef]
  4. Deng, X.; Huang, J.; Rozelle, S.; Zhang, J.; Li, Z. Impact of urbanization on cultivated land changes in China. Land Use Policy 2015, 45, 1–7. [Google Scholar] [CrossRef]
  5. Bai, X.; McPhearson, T.; Cleugh, H.; Nagendra, H.; Tong, X.; Zhu, T.; Zhu, Y. Linking Urbanization and the Environment: Conceptual and Empirical Advances. Annu. Rev. Environ. Resour. 2016, 42, 215–240. [Google Scholar] [CrossRef]
  6. Reid, W.V.; Chen, D.; Goldfarb, L.; Hackmann, H.; Lee, Y.T.; Mokhele, K.; Ostrom, E.; Raivio, K.; Rockstrom, J.; Schellnhuber, H.J.; et al. Environment and development. Earth system science for global sustainability: Grand challenges. Science 2010, 330, 916–917. [Google Scholar] [CrossRef] [PubMed]
  7. Chang, Q.; Sha, Y.; Chen, Y. The Coupling Coordination and Influencing Factors of Urbanization and Ecological Resilience in the Yangtze River Delta Urban Agglomeration, China. Land 2024, 13, 111. [Google Scholar] [CrossRef]
  8. Scheffer, M.; Carpenter, S.R.; Dakos, V.; van Nes, E.H. Generic Indicators of Ecological Resilience: Inferring the Chance of a Critical Transition. Annu. Rev. Ecol. Evol. Syst. 2015, 46, 145–167. [Google Scholar] [CrossRef]
  9. Hoiling, C.S. Resilience and stability of ecological systems. Annu. Rev. Ecol. Evol. Syst. 1973, 4, 1–23. [Google Scholar] [CrossRef]
  10. Xiao, S.; Duo, L.; Guo, X.; Zou, Z.; Li, Y.; Zhao, D. Research on the coupling coordination and driving role of urbanization and ecological resilience in the middle and lower reaches of the Yangtze River. PeerJ 2023, 11, 15869. [Google Scholar] [CrossRef] [PubMed]
  11. Folke, C. Resilience. Ecol. Soc. 2016, 21, 44. [Google Scholar] [CrossRef]
  12. Bautista-Puig, N.; Benayas, J.; Mañana-Rodríguez, J.; Suárez, M.; Sanz-Casado, E. The role of urban resilience in research and its contribution to sustainability. Cities 2022, 126, 103715. [Google Scholar] [CrossRef]
  13. Wang, X.; Palazzo, D.; Carper, M. Ecological wisdom as an emerging field of scholarly inquiry in urban planning and design. Landsc. Urban Plan. 2016, 155, 100–107. [Google Scholar] [CrossRef]
  14. Ahern, J. Urban landscape sustainability and resilience: The promise and challenges of integrating ecology with urban planning and design. Landsc. Ecol. 2013, 28, 1203–1212. [Google Scholar] [CrossRef]
  15. Jin, L.; Kim, M.; Chon, J. Modeling the resilient supply of ecosystem function for climate change adaptive management in Wetland City. J. Environ. Manag. 2022, 322, 115788. [Google Scholar] [CrossRef]
  16. Voskamp, I.M.; Van de Ven, F.H.M. Planning support system for climate adaptation: Composing effective sets of blue-green measures to reduce urban vulnerability to extreme weather events. Build. Environ. 2015, 83, 159–167. [Google Scholar] [CrossRef]
  17. Huang, J.; Zhong, P.; Zhang, J.; Zhang, L. Spatial-temporal differentiation and driving factors of ecological resilience in the Yellow River Basin, China. Ecol. Indic. 2023, 154, 110763. [Google Scholar] [CrossRef]
  18. Feng, X.; Xiu, C.; Bai, L.; Zhong, Y.; Wei, Y. Comprehensive evaluation of urban resilience based on the perspective of landscape pattern: A case study of Shenyang city. Cities 2020, 104, 102722. [Google Scholar] [CrossRef]
  19. Zheng, J.; Hu, Y.; Boldanov, T.; Bazarzhapov, T.; Meng, D.; Li, Y.; Dong, S. Comprehensive assessment of the coupling coordination degree between urbanization and ecological environment in the Siberian and Far East Federal Districts, Russia from 2005 to 2017. PeerJ 2020, 8, e9125. [Google Scholar] [CrossRef] [PubMed]
  20. Ma, M.; Tang, J. Interactive coercive relationship and spatio-temporal coupling coordination degree between tourism urbanization and eco-environment: A case study in Western China. Ecol. Indic. 2022, 142, 109149. [Google Scholar] [CrossRef]
  21. Chen, M.; Liu, W.; Lu, D. Challenges and the way forward in China’s new-type urbanization. Land Use Policy 2016, 55, 334–339. [Google Scholar] [CrossRef]
  22. Chen, M.; Ye, C.; Lu, D.; Sui, Y.; Guo, S. Cognition and construction of the theoretical connotations of new urbanization with Chinese characteristics. J. Geogr. Sci. 2019, 29, 1681–1698. [Google Scholar] [CrossRef]
  23. Yang, Q.; Yang, D.; Li, P.; Liang, S.; Zhang, Z. Resilient City: A Bibliometric Analysis and Visualization. Discret. Dyn. Nat. Soc. 2021, 2021, 5558497. [Google Scholar] [CrossRef]
  24. Wu, C.; Cenci, J.; Wang, W.; Zhang, J. Resilient City: Characterization, Challenges and Outlooks. Buildings 2022, 12, 516. [Google Scholar] [CrossRef]
  25. Li, J.; Li, F.; Li, J. Does new-type urbanization help reduce haze pollution damage? Evidence from China’s county-level panel data. Environ. Sci. Pollut. Res. 2022, 29, 47123–47136. [Google Scholar] [CrossRef] [PubMed]
  26. Bai, Y.; Deng, X.; Jiang, S.; Zhang, Q.; Wang, Z. Exploring the relationship between urbanization and urban eco-efficiency: Evidence from prefecture-level cities in China. J. Clean. Prod. 2018, 195, 1487–1496. [Google Scholar] [CrossRef]
  27. Wang, S.; Cui, Z.; Lin, J.; Xie, J.; Su, K. The coupling relationship between urbanization and ecological resilience in the Pearl River Delta. J. Geogr. Sci. 2022, 32, 44–64. [Google Scholar] [CrossRef]
  28. Fan, X.; Hao, X.; Hao, H.; Zhang, J.; Li, Y. Comprehensive Assessment Indicator of Ecosystem Resilience in Central Asia. Water 2021, 13, 124. [Google Scholar] [CrossRef]
  29. Wang, S.; Li, Z.; Long, Y.; Yang, L.; Ding, X.; Sun, X.; Chen, T. Impacts of urbanization on the spatiotemporal evolution of ecological resilience in the Plateau Lake Area in Central Yunnan, China. Ecol. Indic. 2024, 160, 111836. [Google Scholar] [CrossRef]
  30. Ding, W.; Liu, J. Nonlinear and spatial spillover effects of urbanization on air pollution and ecological resilience in the Yellow River Basin. Environ. Sci. Pollut. Res. 2023, 30, 43229–43244. [Google Scholar] [CrossRef] [PubMed]
  31. Wang, L.; Yuan, M.; Li, H.; Chen, X. Exploring the coupling coordination of urban ecological resilience and new-type urbanization: The case of China’s Chengdu–Chongqing Economic Circle. Environ. Technol. Innov. 2023, 32, 103372. [Google Scholar] [CrossRef]
  32. Zhao, J.; Liu, Y.; Zhu, Y.; Qin, S.; Wang, Y.; Miao, C. Spatiotemporal differentiation and influencing factors of the coupling and coordinated development of new urbanization and ecological environment in the Yellow River Basin. Resour. Sci. 2020, 42, 159–171. [Google Scholar] [CrossRef]
  33. Zhang, L.; Gao, S.; Wei, B.; Li, Y.; Li, H.; Wang, L.; Ye, B. Effects of urbanization on rural drinking water quality in Beijing, China. Sustainability 2017, 9, 461. [Google Scholar] [CrossRef]
  34. Liao, Z.; Zhang, L. Spatio-temporal pattern evolution and dynamic simulation of urban ecological resilience in Guangdong Province, China. Heliyon 2024, 10, e25127. [Google Scholar] [CrossRef]
  35. Deng, Z.; Chen, Y.; Jiang, F.; Zhang, Y.; Xie, Z.; Zhao, Y.Z.L. Spatio-temporal study on coupling coordination between urbanization and eco-resilience in the Erhai Lake Basin. All Earth 2024, 1, 1–20. [Google Scholar] [CrossRef]
  36. Zou, C.; Zhu, J.; Lou, K.; Yang, L. Coupling coordination and spatiotemporal heterogeneity between urbanization and ecological environment in Shaanxi Province, China. Ecol. Indic. 2022, 141, 109152. [Google Scholar] [CrossRef]
  37. Chen, Z.; Sarkar, A.; Rahman, A.; Li, X.; Xia, X. Exploring the drivers of green agricultural development (GAD) in China: A spatial association network structure approaches. Land Use Policy 2022, 112, 105827. [Google Scholar] [CrossRef]
  38. Bai, C.; Zhou, L.; Xia, M.; Feng, C. Analysis of the spatial association network structure of China’s transportation carbon emissions and its driving factors. J. Environ. Manag. 2020, 253, 109765. [Google Scholar] [CrossRef] [PubMed]
  39. Feng, X.; Lei, J.; Xiu, C.; Li, J.; Bai, L.; Zhong, Y. Analysis of Spatial Scale Effect on Urban Resilience: A Case Study of Shenyang, China. Chin. Geogr. Sci. 2020, 30, 1005–1021. [Google Scholar] [CrossRef]
  40. Jiao, Z.; Wua, Z.; Wei, B.; Luo, Y.; Lin, Y.; Xue, Y.; Li, S.; Gao, F. Introducing big data to measure the spatial heterogeneity of human activities for optimizing the ecological security pattern: A case study from Guangzhou City, China. Ecol. Indic. 2023, 150, 110203. [Google Scholar] [CrossRef]
  41. Fang, C.; Yu, D. Urban agglomeration: An evolving concept of an emerging phenomenon. Landsc. Urban Plan. 2017, 162, 126–136. [Google Scholar] [CrossRef]
  42. Zeng, C.; Wu, S.; Zhou, H.; Cheng, M. The impact of urbanization growth patterns on carbon dioxide emissions: Evidence from Guizhou, West of China. Land 2022, 11, 1211. [Google Scholar] [CrossRef]
  43. Lu, Q.; Zhao, C.; Huang, H. Comparative study on the temporal and spatial evolution of the ecosystem service value of different Karst Landform types: A case study in Guizhou Province, China. Appl. Sci. 2022, 12, 12801. [Google Scholar] [CrossRef]
  44. Yuan, Q.; Li, R. The negative impacts of human activities on the ecological corridor in the karst highly urbanized area are gradually diminishing: A case study from the karst mountain cities in Southwest China. Ecol. Indic. 2023, 157, 111257. [Google Scholar] [CrossRef]
  45. Xu, H.; Zhang, W. The causal relationship between carbon emissions and land urbanization quality: A panel data analysis for Chinese provinces. J. Clean. Prod. 2016, 137, 241–248. [Google Scholar] [CrossRef]
  46. Shang, J.; Wang, Z.; Li, L.; Chen, Y.; Li, P. A study on the correlation between technology innovation and the new-type urbanization in Shaanxi province. Technol. Forecast. Soc. 2018, 135, 266–273. [Google Scholar] [CrossRef]
  47. Zhang, W.; Wang, M.Y. Spatial-temporal characteristics and determinants of land urbanization quality in China: Evidence from 285 prefecture-level cities. Sustain. Cities Soc. 2018, 38, 70–79. [Google Scholar] [CrossRef]
  48. Zhou, G.; Gu, Y.; Yuan, H.; Gong, Y.; Wu, Y. Selecting sustainable technologies for disposal of municipal sewage sludge using a multi-criterion decision-making method: A case study from China. Resour. Conserv. Recycl. 2020, 161, 104881. [Google Scholar] [CrossRef]
  49. Gupta, H.V.; Kling, H.; Yilmaz, K.K.; Martinez, G.F. Decomposition of the mean squared error and NSE performance criteria: Implications for improving hydrological modelling. J. Hydrol. 2009, 377, 80–91. [Google Scholar] [CrossRef]
  50. Su-ling, H.; Feng-qiong, Z.; Jin-liang, W. Ecological sensitivity evaluation of Longnan County based on AHP and MSE weighting method. Chin. J. Ecol. 2021, 40, 2927–2935. [Google Scholar]
  51. Feng, Z.; Hongwei, Z. “AHP+entropy weight method” based CW-TOPSIS model for predicting rock burst. China Saf. Sci. 2017, 27, 128–133. [Google Scholar]
  52. Chen, C.; Xu, L.; Zhao, D.; Xu, T.; Lei, P. A new model for describing the urban resilience considering adaptability, resistance and recovery. Saf. Sci. 2020, 128, 104756. [Google Scholar] [CrossRef]
  53. Chuyu, X.; Zhaoyingzi, D.; Bin, C. Spatio-temporal analysis and simulation of urban ecological resilience: A case study of Hangzhou. Acta Ecol. Sin. 2022, 42, 116–126. [Google Scholar]
  54. Gao, X.; Shen, J.; He, W.; Zhao, X.; Li, Z.; Hu, W.; Wang, J.; Ren, Y.; Zhang, X. Spatial-temporal analysis of ecosystem services value and research on ecological compensation in Taihu Lake Basin of Jiangsu Province in China from 2005 to 2018. J. Clean. Prod. 2021, 317, 128241. [Google Scholar] [CrossRef]
  55. Guilin, L.; Luocheng, Z.; Qian, Z. Spatial and temporal dynamics of land use and its influence on ecosystem service value in Yangtze River Delta. Acta Ecol. Sin. 2014, 34, 3311–3319. [Google Scholar]
  56. Peng, J.; Liu, Y.; Wu, J.; Lv, H.; Hu, X. Linking ecosystem services and landscape patterns to assess urban ecosystem health: A case study in Shenzhen City, China. Landsc. Urban Plan. 2015, 143, 56–68. [Google Scholar] [CrossRef]
  57. Shu-Jia, W.; Wei, K.; Liang, R.; Dan-dan, Z.; Bin-ting, D. Research on misuses and modification of coupling coordination degree model in China. J. Nat. Resour. 2021, 36, 793–810. [Google Scholar]
  58. Xiaoxiao, X.; Xiaoli, Z.; Weichen, G.; Qiqi, Z. Research on the spatiotemporal evolution of modern marine cities based on the entropy weight TOPSIS method-obstacle degree model-modified coupling coordination degree model. Bull. Mar. Sci. 2024, 1–17. [Google Scholar]
  59. He, J.; Wang, S.; Liu, Y.; Ma, H.; Liu, Q. Examining the relationship between urbanization and the eco-environment using a coupling analysis: A case study of Shanghai, China. Ecol. Indic. 2017, 77, 185–193. [Google Scholar] [CrossRef]
  60. Lv, K.; Feng, X.; Kelly, S.; Zhu, L.; Deng, M. A study on embodied carbon transfer at the provincial level of China from a social network perspective. J. Clean. Prod. 2019, 225, 1089–1104. [Google Scholar] [CrossRef]
  61. Du, Y.; Wan, Q.; Liu, H.; Liu, H.; Kapsar, K.; Peng, J. How does urbanization influence PM2.5 concentrations? Perspective of spillover effect of multi-dimensional urbanization impact. J. Clean. Prod. 2019, 220, 974–983. [Google Scholar] [CrossRef]
  62. Gurney, K.R.; Romero-Lankao, P.; Seto, K.C.; Hutyra, L.R.; Duren, R.; Kennedy, C.; Grimm, N.B.; Ehleringer, J.R.; Marcotullio, P.; Hughes, S.; et al. Climate change: Track urban emissions on a human scale. Nature 2015, 525, 179–181. [Google Scholar] [CrossRef]
  63. Hu, C.; Wu, W.; Zhou, X.; Wang, Z. Spatiotemporal changes in landscape patterns in karst mountainous regions based on the optimal landscape scale: A case study of Guiyang City in Guizhou Province, China. Ecol. Indic. 2023, 150, 110211. [Google Scholar] [CrossRef]
  64. Liu, Y.; Huang, X.; Yang, H.; Zhong, T. Environmental effects of land-use/cover change caused by urbanization and policies in Southwest China Karst area: A case study of Guiyang. Habitat Int. 2014, 44, 339–348. [Google Scholar] [CrossRef]
  65. Liu, S.; Wang, Z.; Wu, W.; Yu, L. Effects of landscape pattern change on ecosystem services and its interactions in karst cities: A case study of Guiyang City in China. Ecol. Indic. 2022, 145, 109646. [Google Scholar] [CrossRef]
  66. Xue, X.; Wang, Z.; Hou, S. NDVI-Based vegetation dynamics and response to climate changes and human activities in Guizhou Province, China. Forests 2023, 14, 753. [Google Scholar] [CrossRef]
  67. Yuan, L.; Liu, W.; Su, S.; Chen, Z. The rocky desertification management in Guizhou province under the localized governance system. Front. Environ. Sci. 2022, 10, 1065663. [Google Scholar] [CrossRef]
Figure 1. Geographic map of the Urban Agglomeration of Central Guizhou.
Land 13 01256 g001
Figure 2. Spatiotemporal pattern of NU quality in the Urban Agglomeration of Central Guizhou, 2010–2020.
Land 13 01256 g002
Figure 3. Spatiotemporal pattern of ER level in the Urban Agglomeration of Central Guizhou, 2010–2020.
Land 13 01256 g003
Figure 4. Spatiotemporal pattern of the CCD of NU and ER in the Urban Agglomeration of Central Guizhou, 2010–2020.
Land 13 01256 g004
Figure 5. Statistical values of global Moran’s I and the LISA clustering of the CCD, 2010–2020.
Land 13 01256 g005
Figure 6. Trend surface analysis of the CCD, 2010–2020.
Land 13 01256 g006
Figure 7. Spatial connection structure of the CCD of NU and ER, 2010–2020.
Land 13 01256 g007
Figure 8. Integral characteristics of SCN of the CCD, 2010–2020.
Land 13 01256 g008
Figure 9. Individual characteristics of SCN of the CCD, 2010–2020.
Land 13 01256 g009
Figure 10. Core–edge spatial structure of the CCD, 2010–2020.
Land 13 01256 g010
Table 1. NU quality measurement indicator system.
Guideline LayerIndicator Layer/UnitTypeAHP
Weights
MSE
Weights
Combination
Weights
Urbanization of populationUrbanization rate (%)+0.09970.09800.0990
Urban population density (person/km2)+0.09970.07080.0876
Number of rural employees (million)0.03320.09340.0585
Spatial urbanizationPopulation density (persons/km2)+0.03650.06580.0488
Building land area (km2)+0.14580.08030.1183
Urbanization of societyDisposable income per urban resident (CNY)+0.10640.09070.0998
Number of students enrolled in general secondary schools (persons)+0.02660.06540.0429
Full-time teachers in general secondary schools (persons)+0.02660.05860.0400
Ecological urbanizationForest cover (%)+0.06630.08960.0761
PM2.5(ug/m3)0.03320.08940.0568
Economic urbanizationGDP per capita (CNY)+0.04660.05270.0492
Gross regional product (million dollars)+0.13970.06080.1066
Percentage of output value of secondary and tertiary industries (%)+0.13970.08440.1165
Note: “+” refers to a positive indicator, and “−” refers to a negative indicator.
Table 2. Indicator system for measuring the level of adaptability.
TypologyLandscape Pattern IndexWeights
Landscape heterogeneityShannon’s diversity index (SHDI)0.2
Area-weighted mean patch fractal dimension (AWMPFD)0.1
Landscape contagion index (CONTAG)0.2
Landscape connectivityPatch cohesion (COHESION)0.25
Landscape fragility (LFI)0.25
Table 3. Core–edge density matrix of the CCD, 2010–2020.
Network Density Matrix201020152020
EdgeEdgeCoreEdgeCoreEdge
Edge0.8010.8220.950.7580.7310.652
Edge0.8220.0910.7580.2880.6520.156
Disclaimer/Publisher’s Note: The statements, opinions and data contained in all publications are solely those of the individual author(s) and contributor(s) and not of MDPI and/or the editor(s). MDPI and/or the editor(s) disclaim responsibility for any injury to people or property resulting from any ideas, methods, instructions or products referred to in the content.

