
Analyzing the Relationship between Green Infrastructure and Air Quality Issues—South Korean Cases


Abstract
1. Introduction
1.1. Background
1.2. Research Review
2. Research Method
3. Analysis and Result
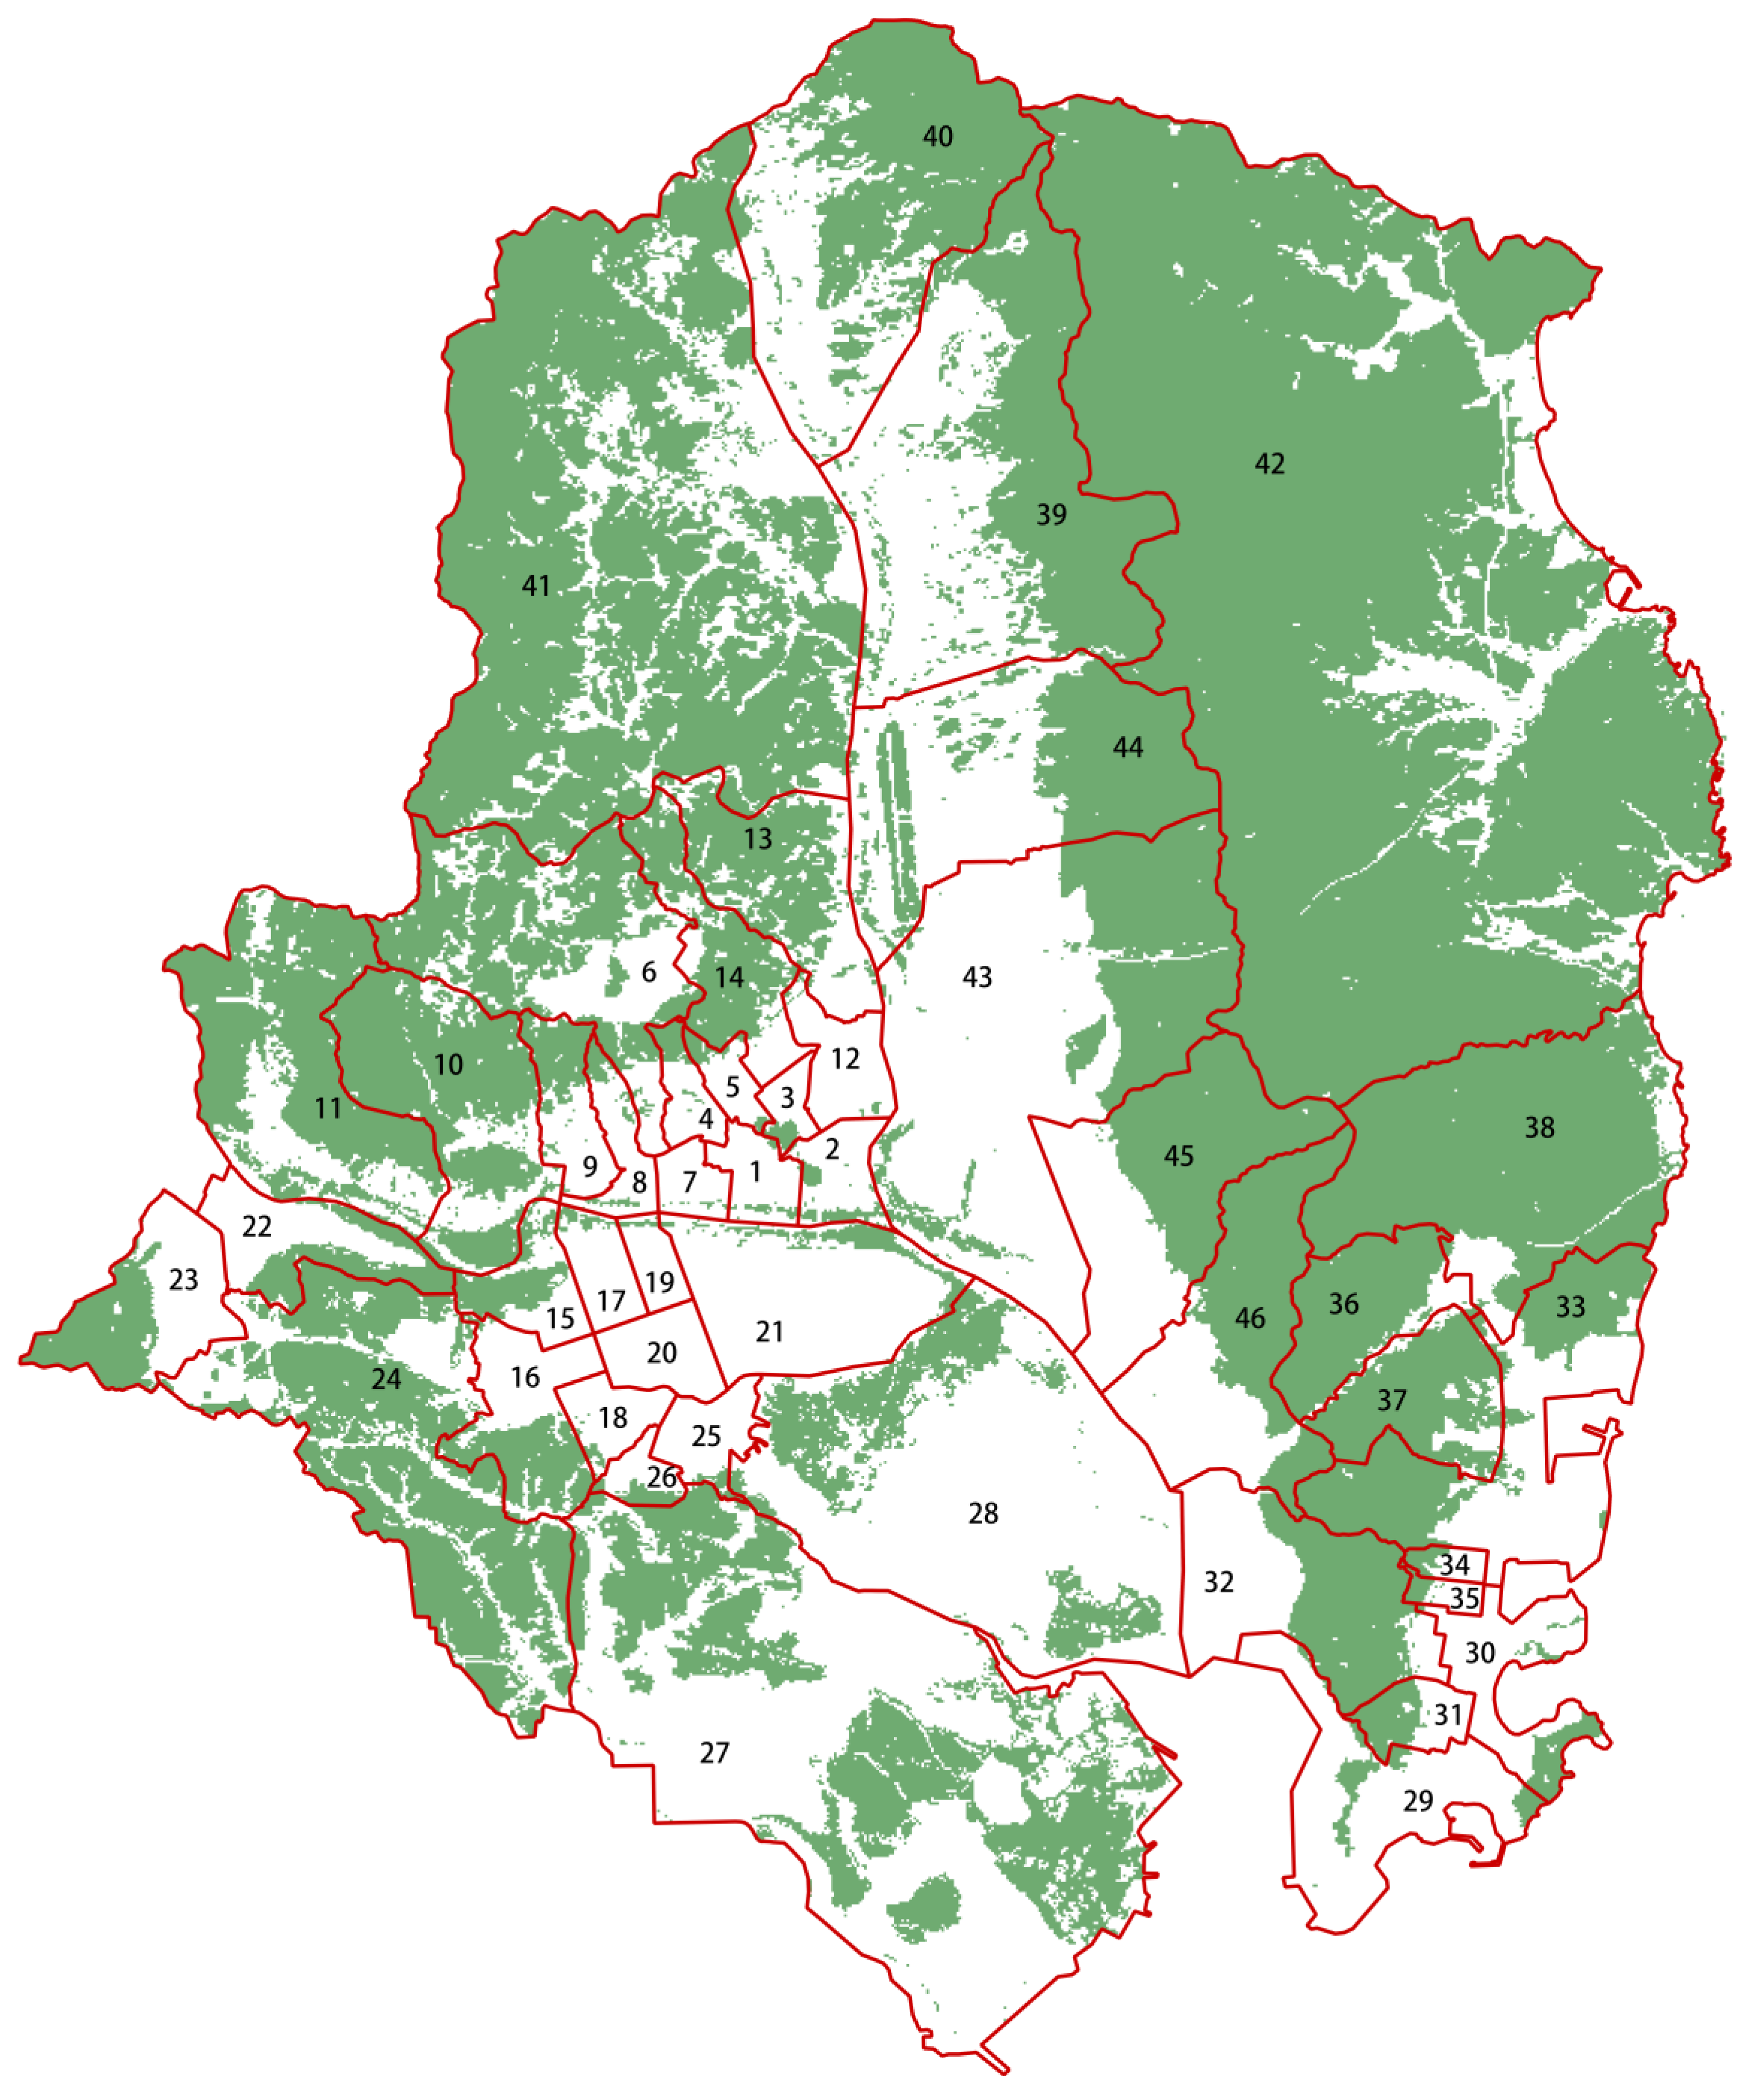
3.1. Measurement of Infrastructure Area and Analysis of Air Pollution Information in Ulsan City
3.1.1. Greenfield Infrastructure Area Analysis
3.1.2. Residential Type Analysis
- Single-family residence
- b.
- Apartment
- c.
- Townhouse and multi-unit residence
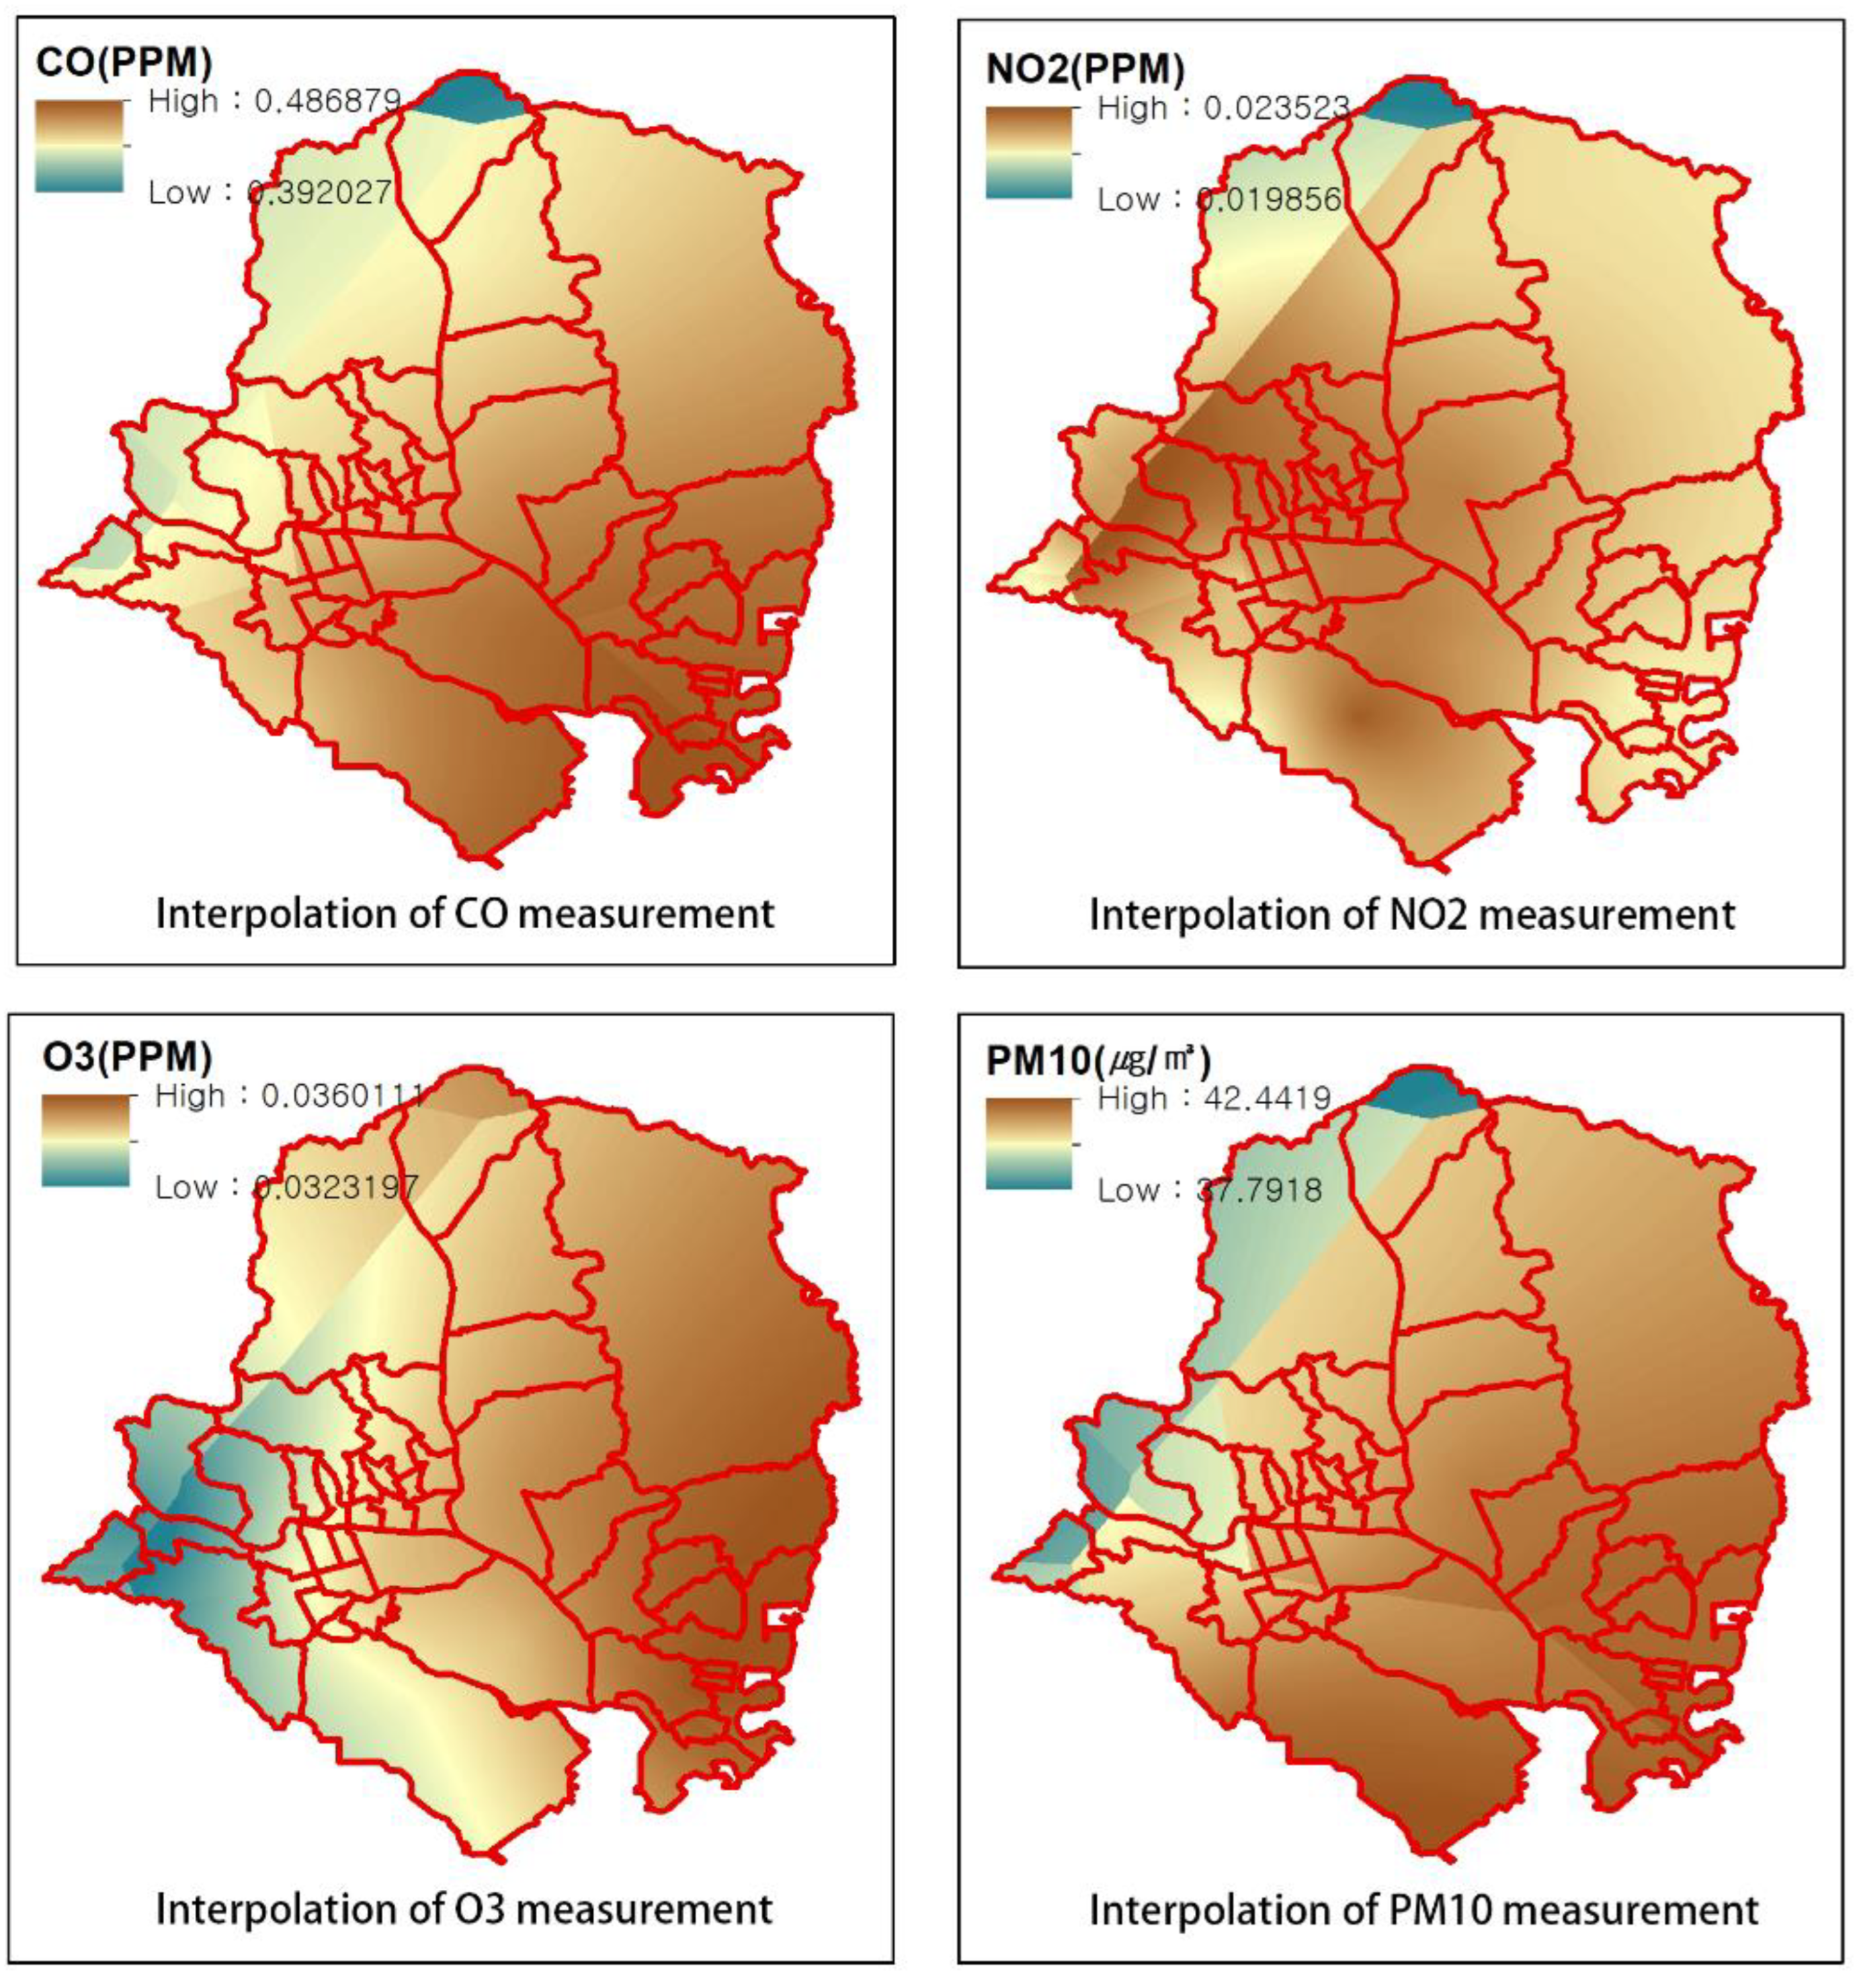
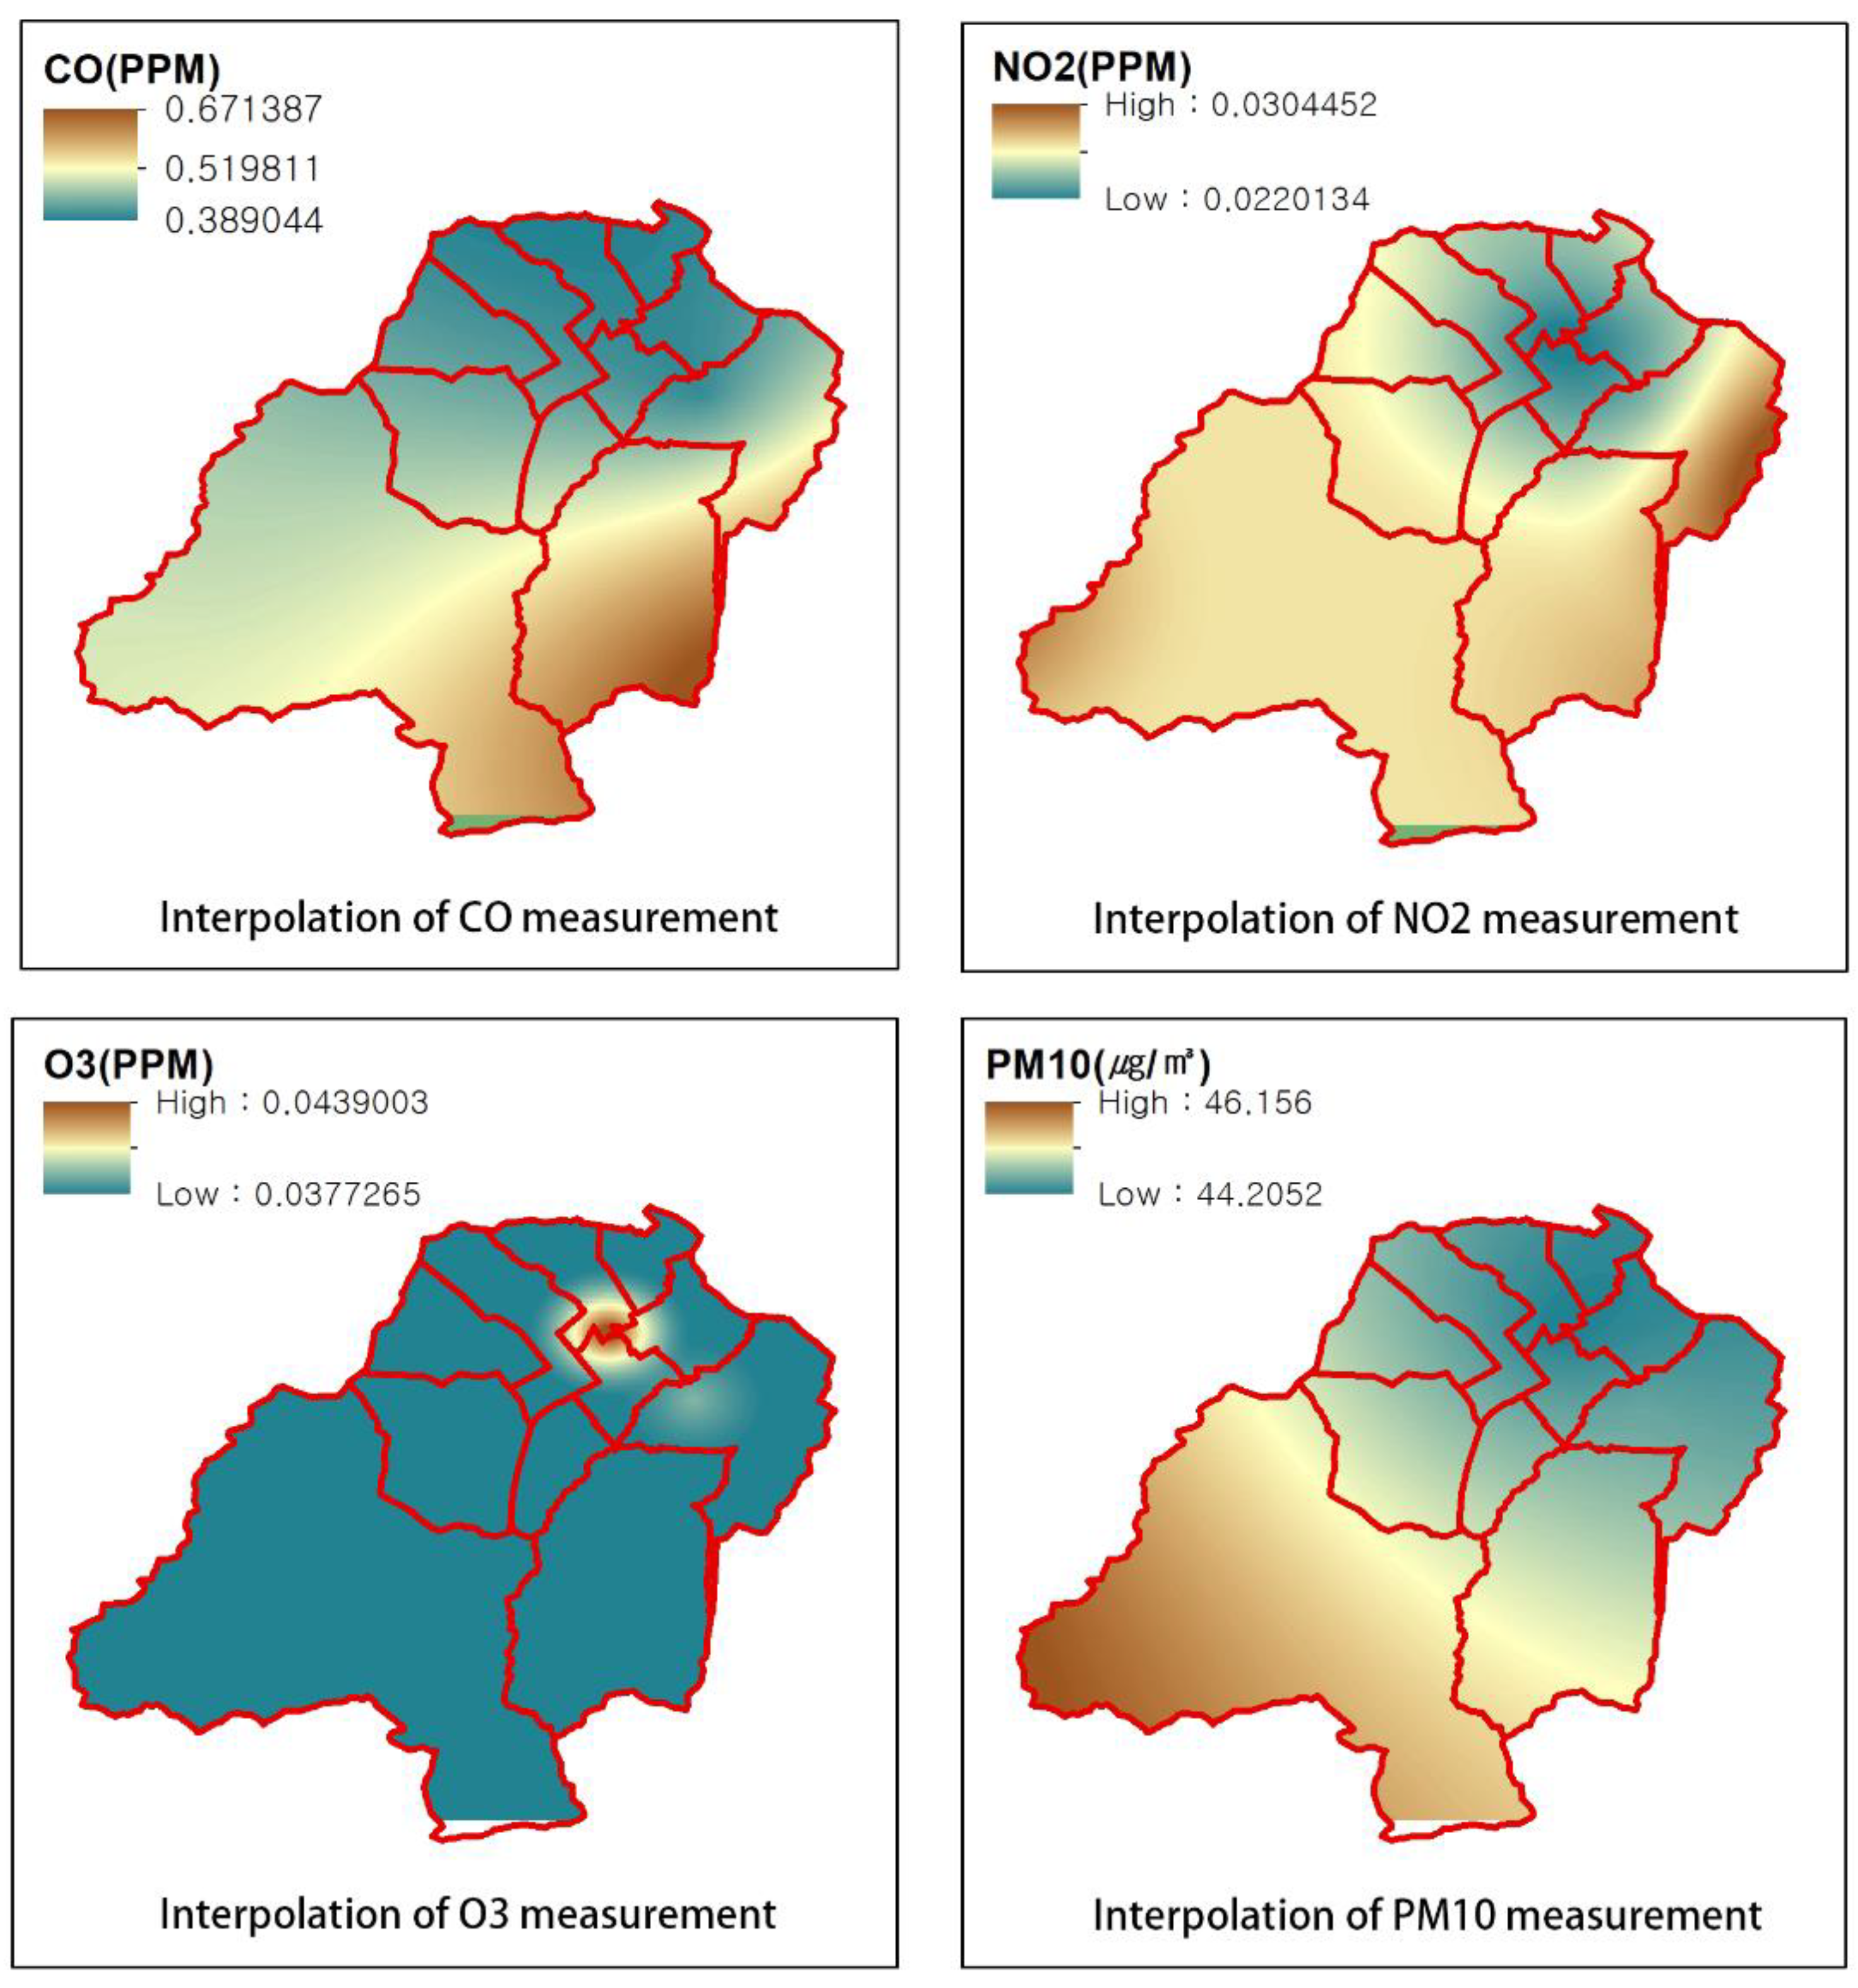
3.1.3. Analysis of Air Pollutants
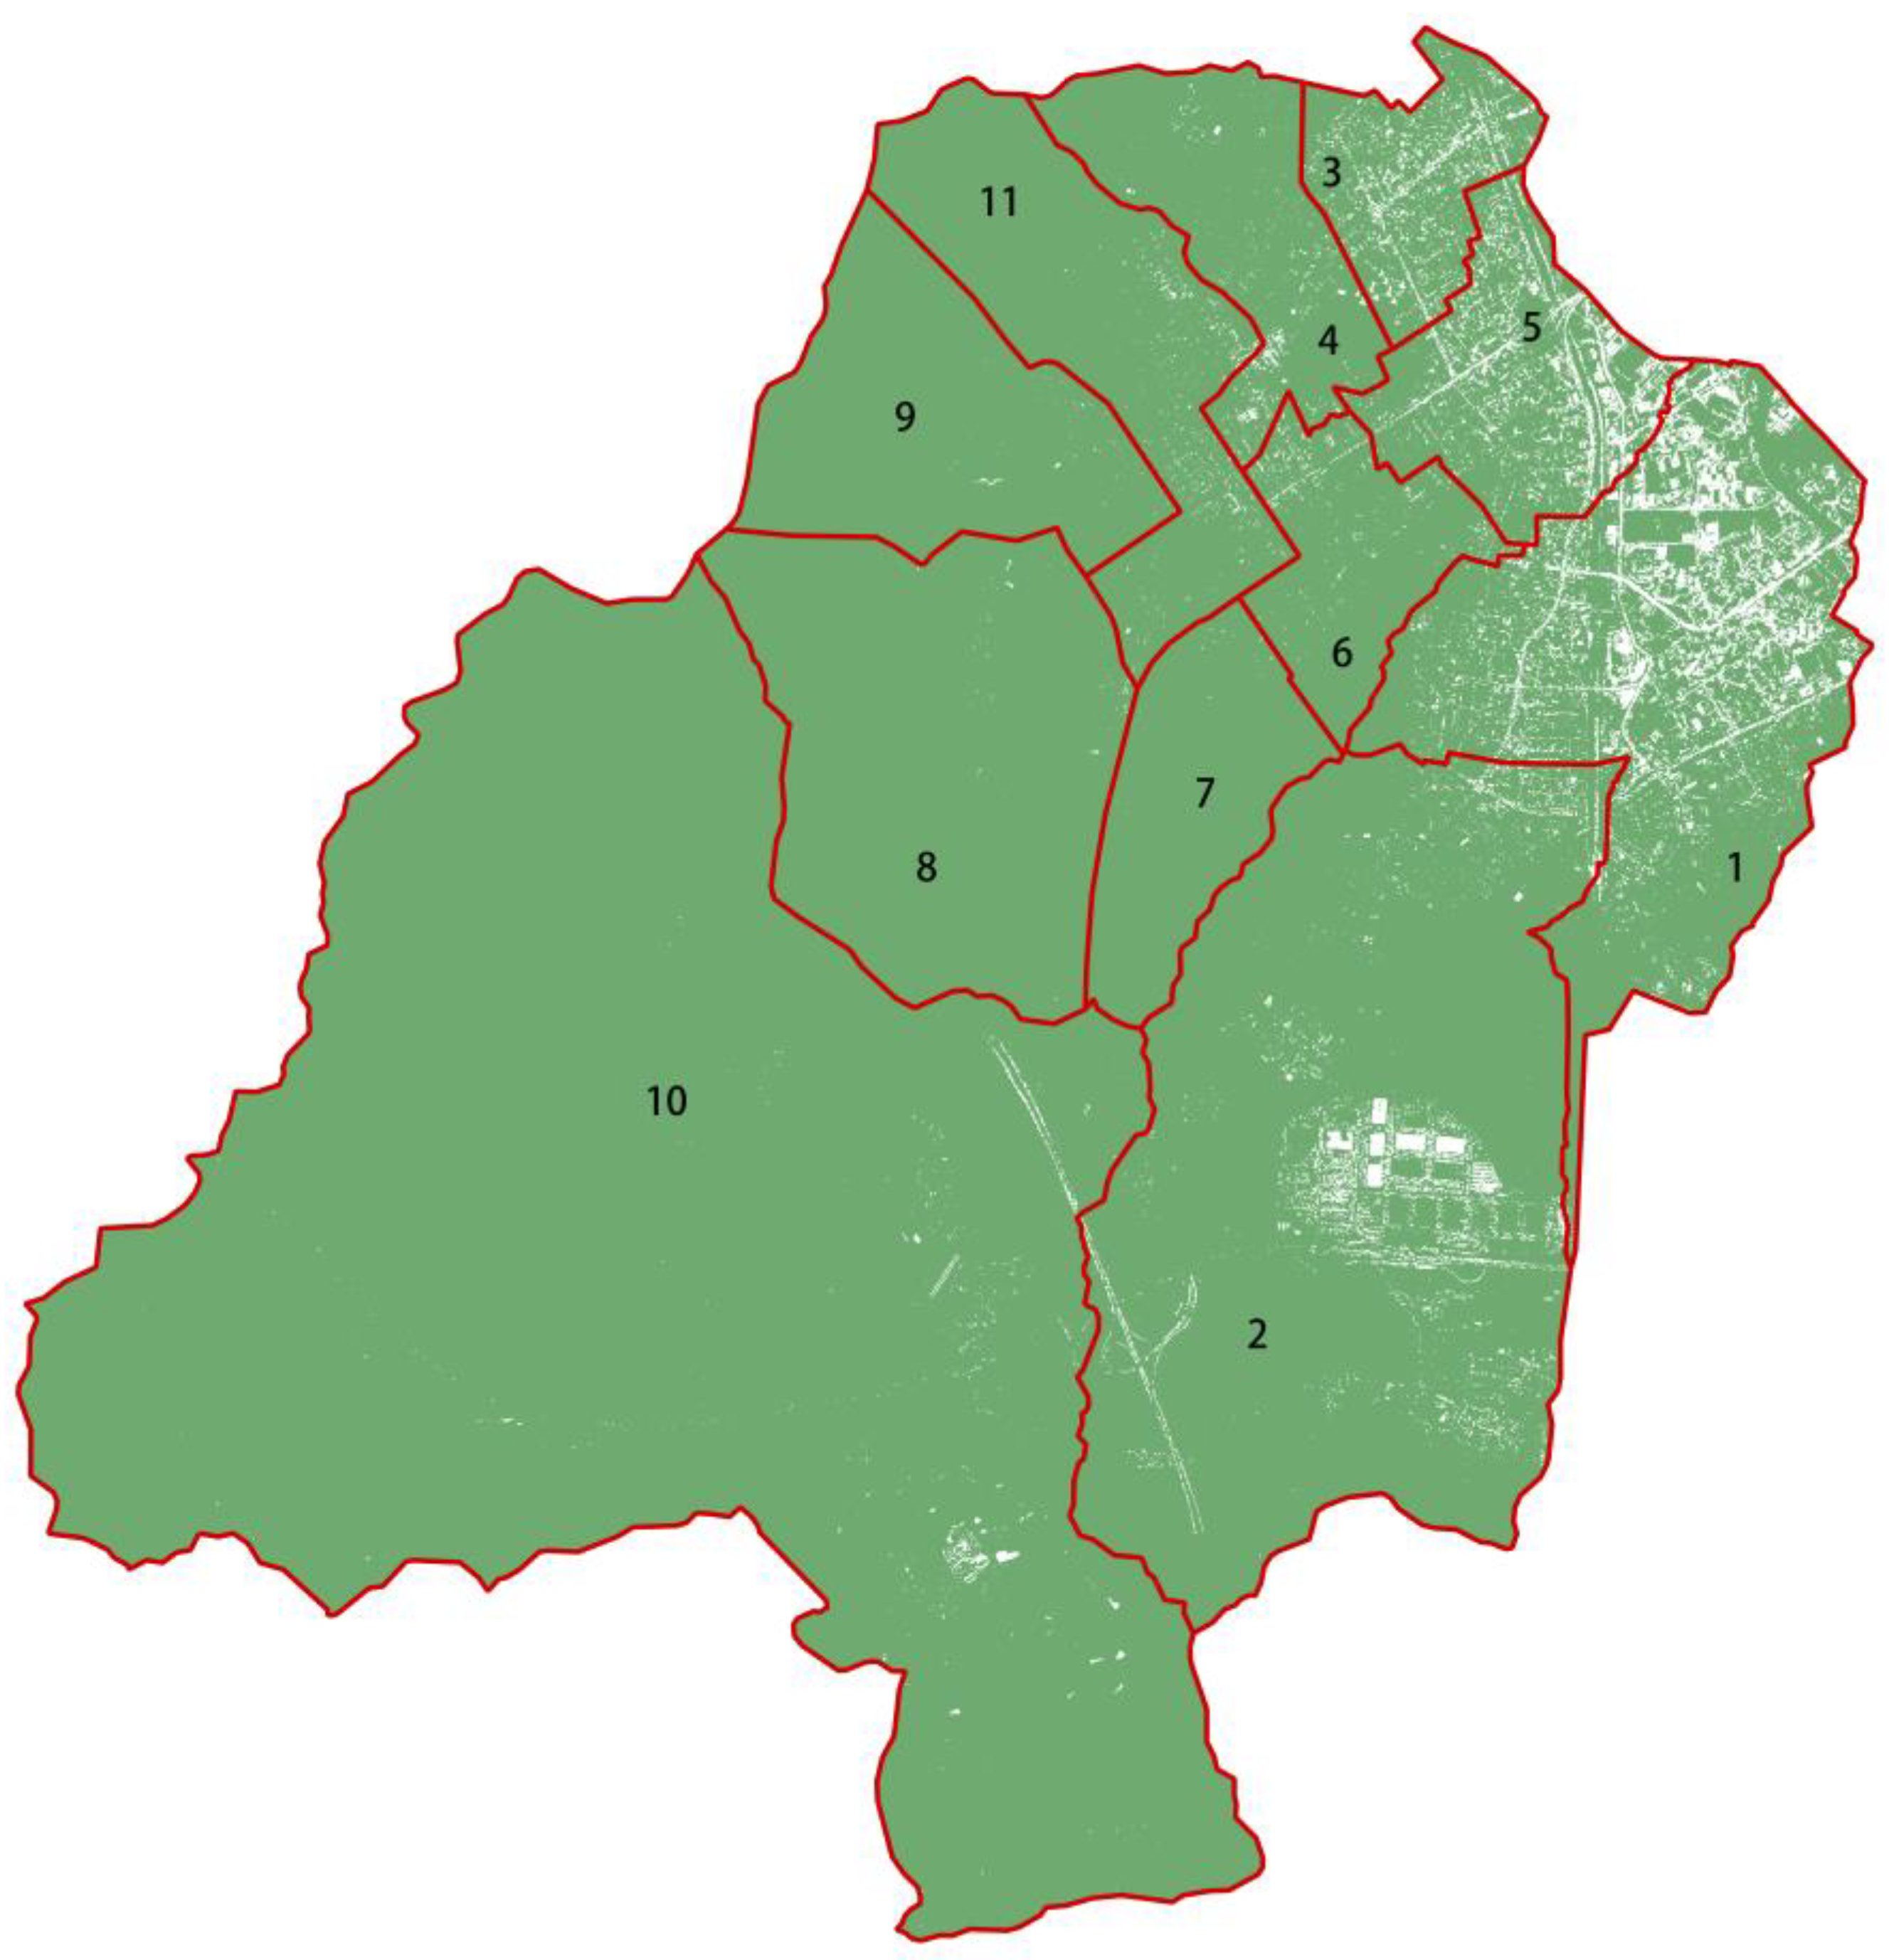
3.2. Measurement of Infrastructure Area and Analysis of Air Pollution Information in Junpo City
3.2.1. GI, Population and Dwelling Type Analysis
3.2.2. Air Pollution Analysis
3.3. Multivariate Regression Analysis
4. Conclusions
Author Contributions
Funding
Data Availability Statement
Conflicts of Interest
References
- Abubeker, K.M.; Baskar, S. Wireless sensor and wireless body area network assisted biosensor network for effective monitoring and prevention of non-ventilator hospital-acquired pneumonia. Front. Sustain. Cities 2022, 4, 13. [Google Scholar] [CrossRef]
- World Health Organization. Billions of People Still Breathe Unhealthy Air: New WHO Data. Available online: https://www.who.int/news/item/04-04-2022-billions-of-people-still-breathe-unhealthy-air-new-who-data (accessed on 1 May 2024).
- World Health Organization. WHO Ambient Air Quality Database, 2022 Update: Status Report. World Health Organization. 2023. Available online: https://iris.who.int/handle/10665/368432 (accessed on 5 August 2024).
- Chen, H.S.; Lin, Y.C.; Chiueh, P.T. Nexus of ecosystem service-human health-natural resources: The nature-based solutions for urban PM2.5 pollution. Sustain. Cities Soc. 2023, 91, 11. [Google Scholar] [CrossRef]
- Eisenman, T.S.; Churkina, G.; Jariwala, S.P.; Kumar, P.; Lovasi, G.S.; Pataki, D.E.; Weinberger, K.R.; Whitlow, T.H. Urban trees, air quality, and asthma: An interdisciplinary review. Landsc. Urban Plan. 2019, 187, 47–59. [Google Scholar] [CrossRef]
- Yao, Y.B.; Wang, Y.F.; Ni, Z.B.; Chen, S.Q.; Xia, B.C. Improving air quality in Guangzhou with urban green infrastructure planning: An i-Tree Eco model study. J. Clean Prod. 2022, 369, 13. [Google Scholar] [CrossRef]
- Elmqvist, T.; Setälä, H.; Handel, S.N.; van der Ploeg, S.; Aronson, J.; Blignaut, J.N.; Gómez-Baggethun, E.; Nowak, D.J.; Kronenberg, J.; de Groot, R. Benefits of restoring ecosystem services in urban areas. Curr. Opin. Environ. Sustain. 2015, 14, 101–108. [Google Scholar] [CrossRef]
- Danilina, N.; Tsurenkova, K.; Berkovich, V. Evaluating Urban Green Public Spaces: The Case Study of Krasnodar Region Cities, Russia. Sustainability 2021, 13, 24. [Google Scholar] [CrossRef]
- Chen, H.S.; Tam, K.I.; Zhao, Y.L.; Yuan, L.; Wang, W.Y.; Lin, M.R.S.; Chiang, P.C. Development of Environmental Action Plans for Adaptation to Climate Change: A Perspective of Air Quality Management. Aerosol Air Qual. Res. 2023, 23, 17. [Google Scholar] [CrossRef]
- Li, X.Q.; Stringer, L.C.; Dallimer, M. The Impacts of Urbanisation and Climate Change on the Urban Thermal Environment in Africa. Climate 2022, 10, 21. [Google Scholar] [CrossRef]
- Pandey, B.; Ghosh, A. Urban ecosystem services and climate change: A dynamic interplay. Front. Sustain. Cities 2023, 5, 34. [Google Scholar] [CrossRef]
- Newman, G.; Shi, T.Q.; Yao, Z.; Li, D.Y.; Sansom, G.; Kirsch, K.; Casillas, G.; Horney, J. Citizen Science-Informed Community Master Planning: Land Use and Built Environment Changes to Increase Flood Resilience and Decrease Contaminant Exposure. Int. J. Environ. Res. Public Health 2020, 17, 13. [Google Scholar] [CrossRef]
- Ko, S.; Lee, D. Effectiveness of Green Infrastructure Location Based on a Social Well-Being Index. Sustainability 2021, 13, 18. [Google Scholar] [CrossRef]
- Rigolon, A.; Browning, M.; McAnirlin, O.; Yoon, H. Green Space and Health Equity: A Systematic Review on the Potential of Green Space to Reduce Health Disparities. Int. J. Environ. Res. Public Health 2021, 18, 27. [Google Scholar] [CrossRef]
- Roe, J.; Mondschein, A.; Neale, C.; Barnes, L.; Boukhechba, M.; Lopez, S. The Urban Built Environment, Walking and Mental Health Outcomes Among Older Adults: A Pilot Study. Front. Public Health 2020, 8, 15. [Google Scholar] [CrossRef]
- Wolf, K.L.; Lam, S.T.; McKeen, J.K.; Richardson, G.R.A.; van den Bosch, M.; Bardekjian, A.C. Urban Trees and Human Health: A Scoping Review. Int. J. Environ. Res. Public Health 2020, 17, 30. [Google Scholar] [CrossRef] [PubMed]
- Benedict, M.A.; McMahon, E.T. Green Infrastructure: Linking Landscapes and Communities; Island press: Washington, DC, USA, 2012. [Google Scholar]
- Ahern, J. Green infrastructure for cities: The spatial dimension. Cities Future Towards Integr. Sustain. Water Landsc. Manag. 2007, 13, 267–283. [Google Scholar]
- Gill, S.E.; Handley, J.F.; Ennos, A.R.; Pauleit, S. Adapting cities for climate change: The role of the green infrastructure. Built. Environ. 2007, 33, 115–133. [Google Scholar] [CrossRef]
- Fletcher, T.D.; Shuster, W.; Hunt, W.F.; Ashley, R.; Butler, D.; Arthur, S.; Trowsdale, S.; Barraud, S.; Semadeni-Davies, A.; Bertrand-Krajewski, J.-L. SUDS, LID, BMPs, WSUD and more–The evolution and application of terminology surrounding urban drainage. Urban Water J. 2015, 12, 525–542. [Google Scholar] [CrossRef]
- Chen, Y.; Wang, Y.P.; Zhou, D. Knowledge Map of Urban Morphology and Thermal Comfort: A Bibliometric Analysis Based on CiteSpace. Buildings 2021, 11, 23. [Google Scholar] [CrossRef]
- He, C.; Qiu, K.Y.; Alahmad, A.; Pott, R. Particulate matter capturing capacity of roadside evergreen vegetation during the winter season. Urban For. Urban Green. 2020, 48, 17. [Google Scholar] [CrossRef]
- Weerakkody, U.; Dover, J.W.; Mitchell, P.; Reiling, K. The impact of rainfall in remobilising particulate matter accumulated on leaves of four evergreen species grown on a green screen and a living wall. Urban For. Urban Green. 2018, 35, 21–31. [Google Scholar] [CrossRef]
- Xu, H.Y.; Zhao, G.H. Assessing the Value of Urban Green Infrastructure Ecosystem Services for High-Density Urban Management and Development: Case from the Capital Core Area of Beijing, China. Sustainability 2021, 13, 19. [Google Scholar] [CrossRef]
- Wuyts, K.; Smets, W.; Lebeer, S.; Samson, R. Green infrastructure and atmospheric pollution shape diversity and composition of phyllosphere bacterial communities in an urban landscape. FEMS Microbiol. Ecol. 2020, 96, 14. [Google Scholar] [CrossRef]
- Muyshondt, B.; Wuyts, K.; Van Mensel, A.; Smets, W.; Lebeer, S.; Aleixo, C.; Ortí, M.A.; Casanelles-Abella, J.; Chiron, F.; Giacomo, P.; et al. Phyllosphere bacterial communities in urban green areas throughout Europe relate to urban intensity. FEMS Microbiol. Ecol. 2022, 98, 12. [Google Scholar] [CrossRef] [PubMed]
- Hui, C.X.; Dan, G.; Alamri, S.; Toghraie, D. Greening smart cities: An investigation of the integration of urban natural resources and smart city technologies for promoting environmental sustainability. Sustain. Cities Soc. 2023, 99, 28. [Google Scholar] [CrossRef]
- Jain, M.; Nagpal, A. Relationship Between Environmental Sustainability and Human Development Index: A Case of Selected South Asian Nations. Vision 2019, 23, 125–133. [Google Scholar] [CrossRef]
- Zinia, N.J.; McShane, P. Urban ecosystems and ecosystem services in megacity Dhaka: Mapping and inventory analysis. Urban Ecosyst. 2021, 24, 915–928. [Google Scholar] [CrossRef]
- Jaron, A.; Borucka, A.; Delis, P.; Sekrecka, A. An Assessment of the Possibility of Using Unmanned Aerial Vehicles to Identify and Map Air Pollution from Infrastructure Emissions. Energies 2024, 17, 15. [Google Scholar] [CrossRef]
- Miao, C.P.; Cui, A.W.; Xiong, Z.P.; Hu, Y.M.; Chen, W.; He, X.Y. Vertical evaluation of air quality improvement by urban forest using unmanned aerial vehicles. Front. Ecol. Evol. 2022, 10, 10. [Google Scholar] [CrossRef]
- Liu, X.; Shi, X.Q.; He, H.D.; Li, X.B.; Peng, Z.R. Vertical distribution characteristics of particulate matter beside an elevated expressway by unmanned aerial vehicle measurements. Build. Environ. 2021, 206, 14. [Google Scholar] [CrossRef]
- Liu, X.; Shi, X.Q.; Li, X.B.; Peng, Z.R. Quantification of multifactorial effects on particle distributions at urban neighborhood scale using machine learning and unmanned aerial vehicle measurement. J. Clean Prod. 2022, 378, 11. [Google Scholar] [CrossRef]
- Nordman, E.E.; Isely, E.; Isely, P.; Denning, R. Benefit-cost analysis of stormwater green infrastructure practices for Grand Rapids, Michigan, USA. J. Clean Prod. 2018, 200, 501–510. [Google Scholar] [CrossRef]
- Sturiale, L.; Scuderi, A. The Role of Green Infrastructures in Urban Planning for Climate Change Adaptation. Climate 2019, 7, 24. [Google Scholar] [CrossRef]
- Tiwary, A.; Kumar, P. Impact evaluation of green-grey infrastructure interaction on built-space integrity: An emerging perspective to urban ecosystem service. Sci. Total Environ. 2014, 487, 350–360. [Google Scholar] [CrossRef] [PubMed]
- Karteris, M.; Theodoridou, I.; Mallinis, G.; Tsiros, E.; Karteris, A. Towards a green sustainable strategy for Mediterranean cities: Assessing the benefits of large-scale green roofs implementation in Thessaloniki, Northern Greece, using environmental modelling, GIS and very high spatial resolution remote sensing data. Renew. Sustain. Energ. Rev. 2016, 58, 510–525. [Google Scholar] [CrossRef]
- Tella, A.; Balogun, A.L. GIS-based air quality modelling: Spatial prediction of PM10 for Selangor State, Malaysia using machine learning algorithms. Environ. Sci. Pollut. Res. 2022, 29, 86109–86125. [Google Scholar] [CrossRef] [PubMed]
- Zhou, Y.J.; Liu, H.L.; Zhou, J.X.; Xia, M. GIS-Based Urban Afforestation Spatial Patterns and a Strategy for PM2.5 Removal. Forests 2019, 10, 17. [Google Scholar] [CrossRef]
- Fernández, I.C.; Wu, J.G. A GIS-based framework to identify priority areas for urban environmental inequity mitigation and its application in Santiago de Chile. Appl. Geogr. 2018, 94, 213–222. [Google Scholar] [CrossRef]
- Badach, J.; Szczepanski, J.; Bonenberg, W.; Gebicki, J.; Nyka, L. Developing the Urban Blue-Green Infrastructure as a Tool for Urban Air Quality Management. Sustainability 2022, 14, 29. [Google Scholar] [CrossRef]
- Castillo, M.D.; Anenberg, S.C.; Chafe, Z.A.; Huxley, R.; Johnson, L.S.; Kheirbek, I.; Malik, M.; Marshall, J.D.; Naidoo, S.; Nelson, M.L.; et al. Quantifying the Health Benefits of Urban Climate Mitigation Actions: Current State of the Epidemiological Evidence and Application in Health Impact Assessments. Front. Sustain. Cities 2021, 3, 16. [Google Scholar] [CrossRef]
- Hegeman, E.E.; Levin, P.S. Using human health disparities and salmon health to guide spatial prioritization of green stormwater infrastructure. Landsc. Urban Plan. 2023, 240, 10. [Google Scholar] [CrossRef]
- Wang, R.Y.; Dong, P.X.; Dong, G.P.; Xiao, X.; Huang, J.W.; Yang, L.C.; Yu, Y.J.; Dong, G.H. Exploring the impacts of street-level greenspace on stroke and cardiovascular diseases in Chinese adults. Ecotox. Environ. Saf. 2022, 243, 10. [Google Scholar] [CrossRef] [PubMed]
- Martinez, A.D.; Labib, S.M. Demystifying normalized difference vegetation index (NDVI) for greenness exposure assessments and policy interventions in urban greening. Environ. Res. 2023, 220, 12. [Google Scholar] [CrossRef] [PubMed]
- Gruwald, L.; Heusinger, J.; Weber, S. A GIS-based mapping methodology of urban green roof ecosystem services applied to a Central European city. Urban For. Urban Green. 2017, 22, 54–63. [Google Scholar] [CrossRef]
- Tran, T.J.; Helmus, M.R.; Behm, J.E. Green infrastructure space and traits (GIST) model: Integrating green infrastructure spatial placement and plant traits to maximize multifunctionality. Urban For. Urban Green. 2020, 49, 11. [Google Scholar] [CrossRef]
- Li, K.M.; Li, C.L.; Hu, Y.M.; Xiong, Z.P.; Wang, Y.H. Quantitative estimation of the PM2.5 removal capacity and influencing factors of urban green infrastructure. Sci. Total Environ. 2023, 867, 11. [Google Scholar] [CrossRef]


| Data Source | Information |
|---|---|
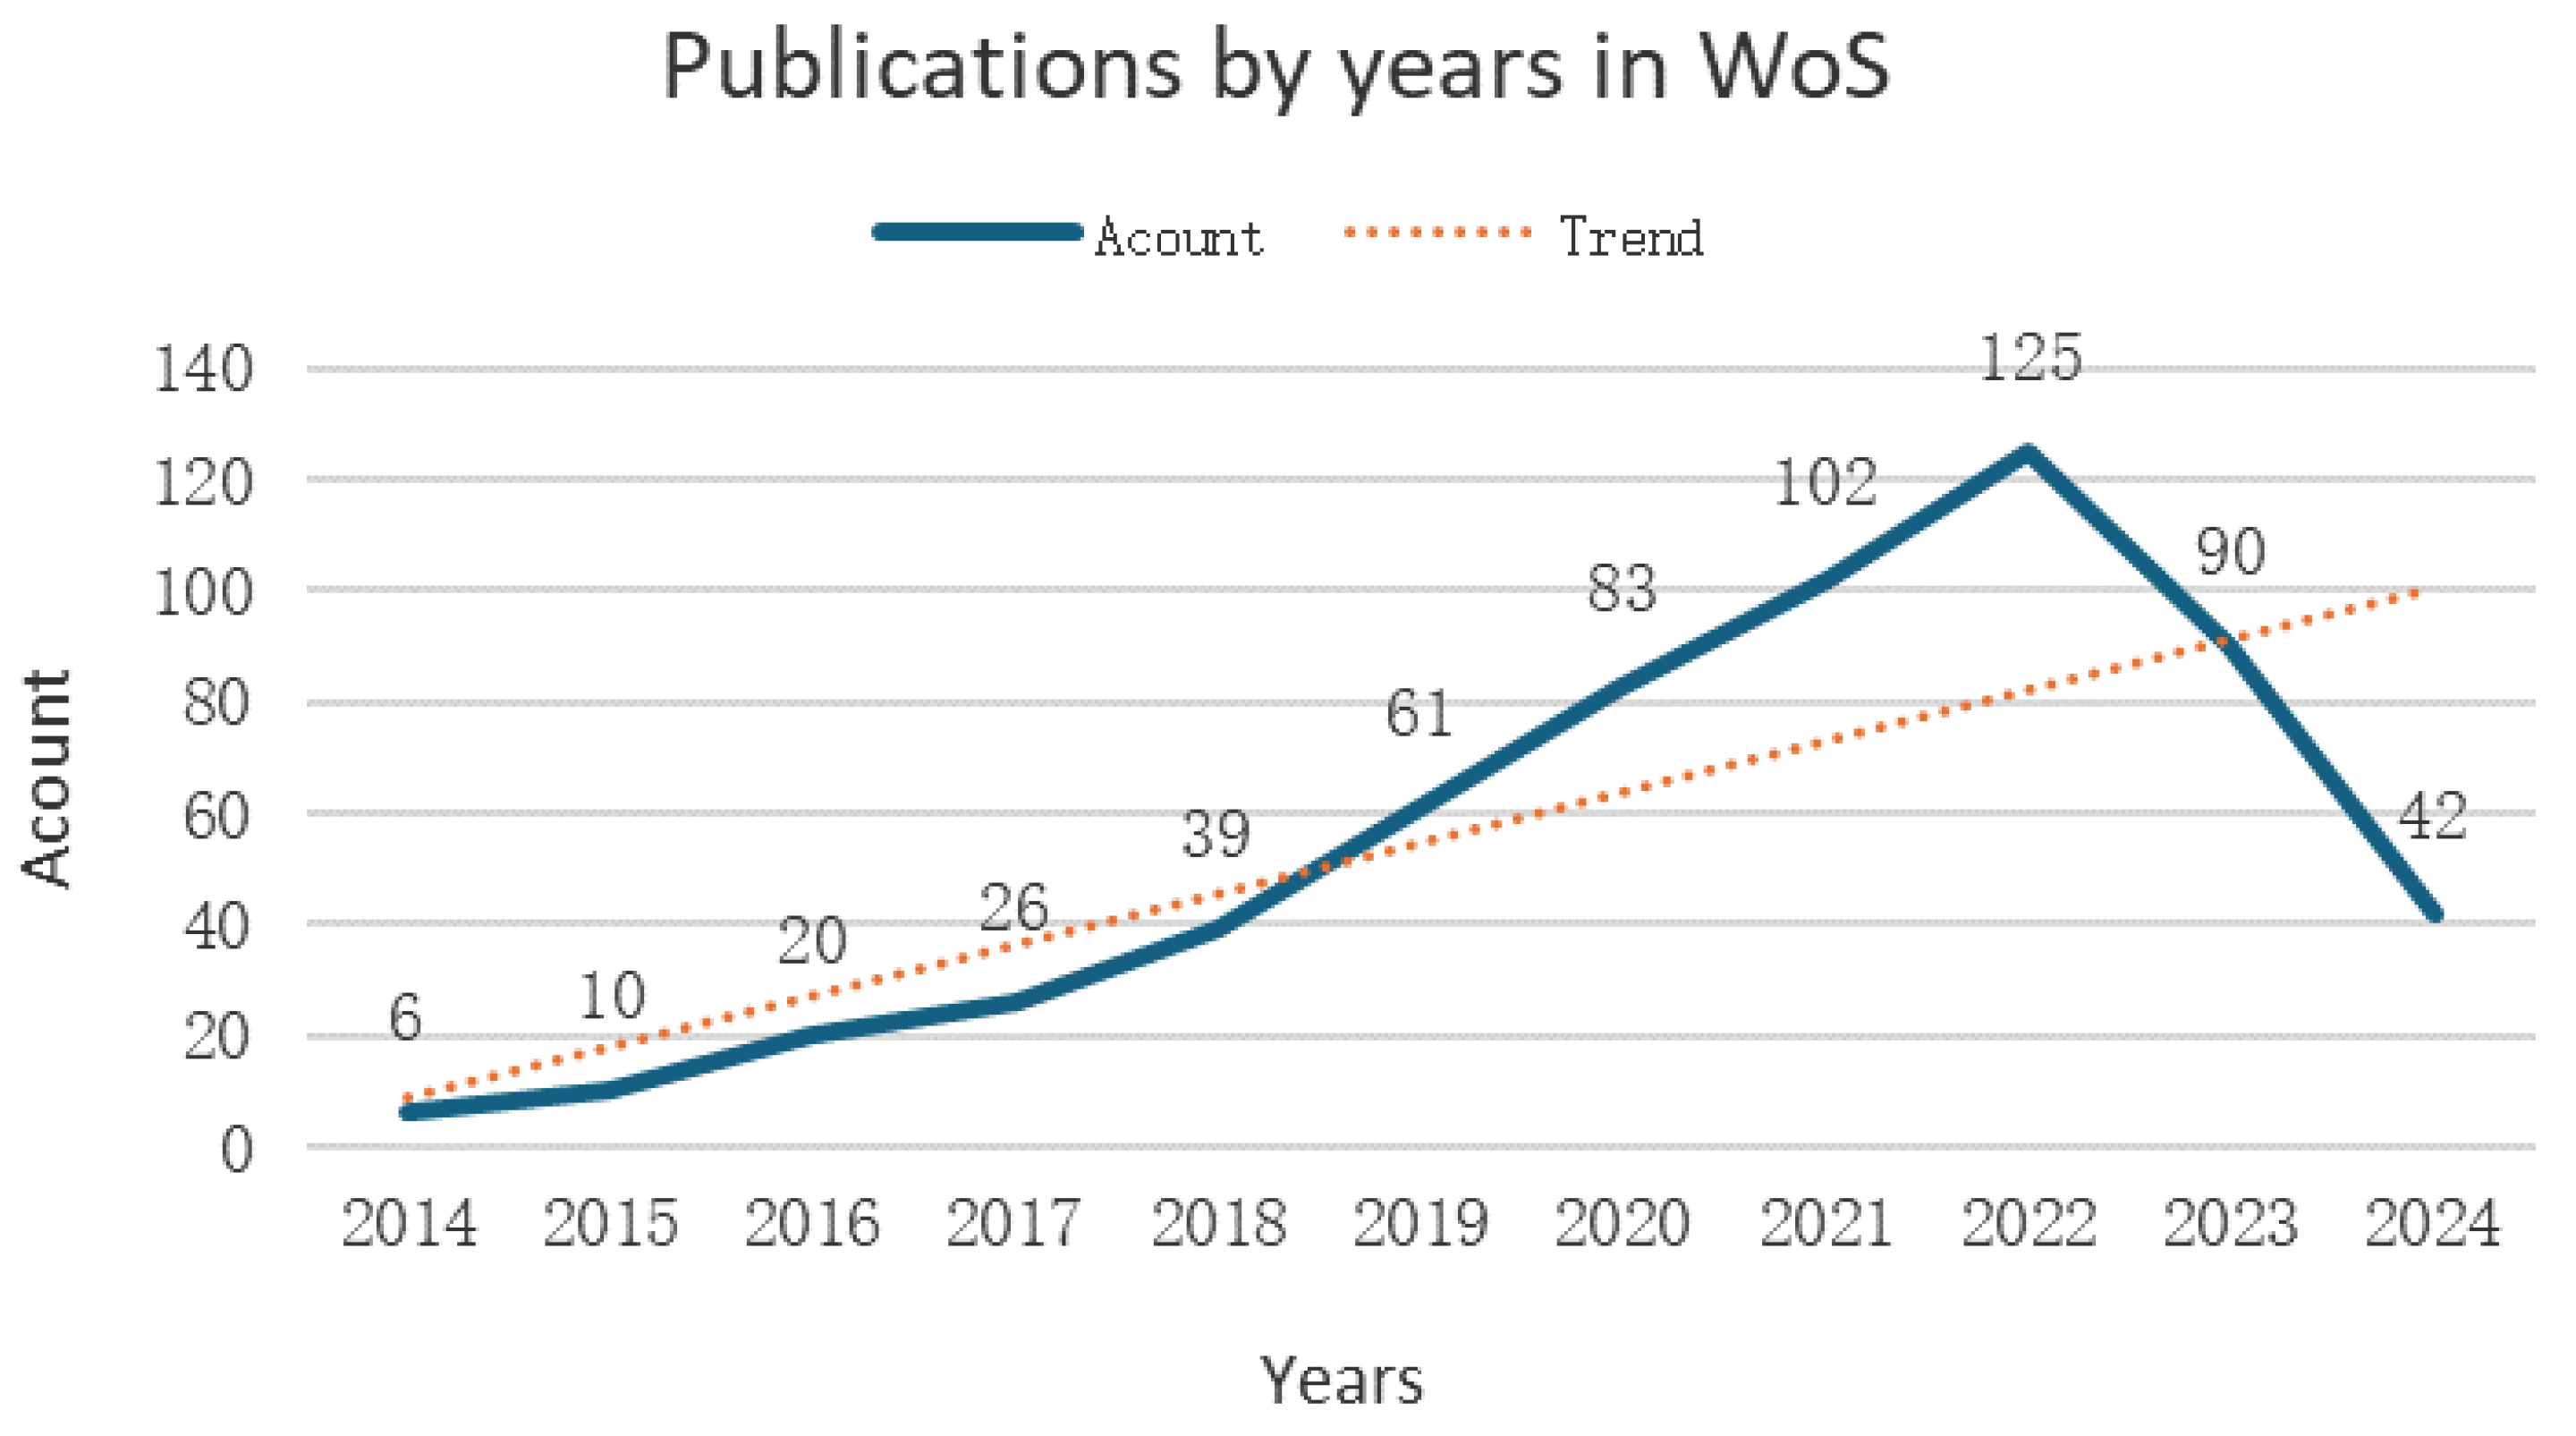
| Covered period | For January 2014 to May 2024 |
| Countries/Regions | 198 |
| Publications | 604 |
| Journal | 177 |
| Institutions | 1747 |
| Number of authors | 2408 |
| Code | Location | GI | GI-Percentage | Total Population | Single-Family Residence | Apartment | Townhouse | Multi-Unit Residence |
|---|---|---|---|---|---|---|---|---|
| 1 | Hakseong-dong | 0.15 km2 | 16.15% | 1062 | 1126 | 1253 | 153 | 355 |
| 2 | Bangu1-dong | 0.18 km2 | 15.98% | 19,213 | 1335 | 2893 | 119 | 814 |
| 3 | Bangu2-dong | 0.07 km2 | 12.92% | 9682 | 932 | 1062 | 112 | 257 |
| 4 | Boksan1-dong | 0.20 km2 | 26.53% | 9154 | 917 | 1733 | 42 | 209 |
| 5 | Boksan2-dong | 0.14 km2 | 22.69% | 10,216 | 614 | 1971 | 0 | 176 |
| 6 | Bukjeong-dong | 4.31 km2 | 57.35% | 21,581 | 744 | 4396 | 101 | 989 |
| 7 | Okgyo-dong | 0.09 km2 | 12.85% | 7843 | 1058 | 737 | 71 | 208 |
| 8 | Seongnam-dong | 0.19 km2 | 18.21% | 7843 | 1058 | 737 | 71 | 208 |
| 9 | Ujeong-dong | 0.62 km2 | 40.80% | 22,058 | 1312 | 4991 | 202 | 237 |
| 10 | Taehwa-dong | 2.50 km2 | 43.21% | 35,274 | 809 | 10,008 | 152 | 473 |
| 11 | Daun-dong, | 2.86 km2 | 37.37% | 27,965 | 2846 | 2549 | 205 | 132 |
| 12 | Byeongyeong1-dong | 0.21 km2 | 14.88% | 25,354 | 1504 | 4353 | 257 | 797 |
| 13 | Byeongyeong2-dong | 2.22 km2 | 55.27% | 21,623 | 982 | 4347 | 360 | 1736 |
| 14 | Yaksa-dong | 1.83 km2 | 63.63% | 8558 | 228 | 2579 | 0 | 190 |
| 15 | Sinjeong1-dong | 0.21 km2 | 13.66% | 19,085 | 1445 | 3243 | 368 | 377 |
| 16 | Sinjeong2-dong | 0.87 km2 | 31.06% | 25,526 | 760 | 6392 | 390 | 392 |
| 17 | Sinjeong3-dong | 0.10 km2 | 10.04% | 17,264 | 1307 | 2784 | 64 | 320 |
| 18 | Sinjeong4-dong | 0.12 km2 | 12.89% | 23,840 | 1014 | 5811 | 206 | 351 |
| 19 | Sinjeong5-dong | 0.04 km2 | 7.00% | 8722 | 823 | 665 | 94 | 510 |
| 20 | Dal-dong | 0.13 km2 | 10.73% | 29,136 | 968 | 7488 | 290 | 978 |
| 21 | Samsan-dong | 0.90 km2 | 17.58% | 50,573 | 1353 | 11,150 | 105 | 2252 |
| 22 | Samho-dong | 0.37 km2 | 14.33% | 25,510 | 1525 | 4284 | 67 | 841 |
| 23 | Mugeo-dong | 1.08 km2 | 33.65% | 40,097 | 967 | 9200 | 88 | 963 |
| 24 | Ok-dong | 3.10 km2 | 26.91% | 25,861 | 550 | 7171 | 141 | 163 |
| 25 | Daehyeon-dong | 0.25 km2 | 22.03% | 28,816 | 954 | 7934 | 177 | 390 |
| 26 | Suam-dong | 0.25 km2 | 42.78% | 16,942 | 202 | 4999 | 182 | 164 |
| 27 | Seonam-dong | 8.98 km2 | 33.02% | 16,510 | 530 | 5036 | 76 | 233 |
| 28 | Yaeumjangsaengpo-dong | 3.60 km2 | 22.24% | 13,481 | 2158 | 863 | 56 | 323 |
| 29 | Bangeo-dong | 0.54 km2 | 11.77% | 44,904 | 2488 | 7417 | 442 | 2096 |
| 30 | Ilsan-dong | 0.61 km2 | 25.51% | 7386 | 988 | 377 | 31 | 98 |
| 31 | Hwajeong-dong | 0.36 km2 | 35.79% | 17,427 | 985 | 5220 | 223 | 445 |
| 32 | Daesong-dong | 2.56 km2 | 46.01% | 14,657 | 832 | 2470 | 78 | 270 |
| 33 | Jeonha1-dong | 2.84 km2 | 40.03% | 17,167 | 790 | 3469 | 90 | 250 |
| 34 | Jeonha2-dong | 0.08 km2 | 21.74% | 11,703 | 361 | 2769 | 142 | 109 |
| 35 | Jeonha3-dong | 0.07 km2 | 19.11% | 11,703 | 361 | 2769 | 142 | 109 |
| 36 | Nammok1-dong | 2.52 km2 | 84.94% | 10,845 | 545 | 2204 | 157 | 171 |
| 37 | Nammok2-dong | 2.38 km2 | 80.03% | 26,874 | 180 | 8312 | 65 | 338 |
| 38 | Nammok3-dong | 9.52 km2 | 89.58% | 14,195 | 493 | 4062 | 19 | 140 |
| 39 | Nongso1-dong | 9.14 km2 | 60.71% | 30,311 | 1252 | 7198 | 68 | 568 |
| 40 | Nongso2-dong | 7.07 km2 | 61.24% | 32,563 | 539 | 9805 | 184 | 102 |
| 41 | Nongso3-dong | 25.52 km2 | 80.56% | 42,076 | 679 | 12,608 | 15 | 0 |
| 42 | Gangdong-dong | 55.38 km2 | 90.23% | 9246 | 1243 | 2251 | 0 | 23 |
| 43 | Hyomun-dong | 8.21 km2 | 49.18% | 28,905 | 1453 | 5834 | 70 | 326 |
| 44 | Songjeong-dong | 5.26 km2 | 54.79% | 20,759 | 829 | 4789 | 32 | 152 |
| 45 | Yangjeong-dong | 4.95 km2 | 71.99% | 12,469 | 552 | 2577 | 19 | 286 |
| 46 | Yeompo-dong | 3.97 km2 | 64.13% | 12,335 | 695 | 2746 | 32 | 232 |
| City | Measurement Station | Longitude | Latitude | NO2 | O3 | CO | PM10 |
|---|---|---|---|---|---|---|---|
| Ulsan | Seongnam-dong | 35.556351 | 129.320408 | 0.024 | 0.034 | 0.4 | 38 |
| Bugok-dong | 35.497029 | 129.339448 | 0.028 | 0.033 | 0.5 | 44 | |
| Yeocheon-dong | 35.515610 | 129.367078 | 0.022 | 0.033 | 0.5 | 38 | |
| Yaeum-dong | 35.528798 | 129.326199 | 0.024 | 0.037 | 0.6 | 44 | |
| Sinjeong-don | 35.534730 | 129.307803 | 0.018 | 0.036 | 0.5 | 34 | |
| Hyomun-don | 35.560323 | 129.370907 | 0.024 | 0.036 | 0.5 | 49 | |
| Daesong-dong | 35.503176 | 129.418395 | 0.020 | 0.039 | 0.5 | 40 | |
| Mugeo-dong | 35.550988 | 129.260735 | 0.027 | 0.027 | 0.4 | 33 | |
| Samsan-dong | 35.544427 | 129.331829 | 0.023 | 0.036 | 0.4 | 38 | |
| Nongso-dong | 35.625695 | 129.355301 | 0.021 | 0.035 | 0.4 | 40 | |
| Deoksin-ri | 35.434733 | 129.314198 | 0.017 | 0.034 | 0.4 | 36 | |
| Samnam-myeon | 35.558404 | 129.113764 | 0.014 | 0.037 | 0.4 | 32 | |
| Hwasan-ri | 35.437639 | 129.338119 | 0.026 | 0.032 | 0.6 | 52 | |
| Sangnam-ri | 35.493191 | 129.305943 | 0.018 | 0.034 | 0.3 | 51 | |
| Pohang | Jangheung-dong | 35.980208 | 129.374773 | 0.019 | 0.034 | 0.4 | 39 |
| Jangryang-dong | 36.070705 | 129.380467 | 0.013 | 0.039 | 0.3 | 34 | |
| Daedo-dong | 36.018835 | 129.365866 | 0.015 | 0.047 | 0.7 | 34 | |
| Daesong-myeon | 35.968521 | 129.359955 | 0.007 | 0.042 | 0.3 | 33 | |
| 3gongdan | 35.963107 | 129.376841 | 0.016 | 0.036 | 0.8 | 44 | |
| Gyeongju | Seonggeon-dong | 35.850795 | 129.207356 | 0.012 | 0.037 | 0.2 | 26 |
| Code | Location | GI | GI-Percentage | Total Population | Single-Family Residence | Apartment | Townhouse | Multi-Unit Residence |
|---|---|---|---|---|---|---|---|---|
| 1 | Gunpo1-dong | 1547.01 km2 | 81.60% | 36,864 | 993 | 4834 | 475 | 3103 |
| 2 | Gunpo2-dong | 3308.64 km2 | 95.78% | 55,740 | 518 | 13,800 | 44 | 1395 |
| 3 | Sanbon1-dong | 378.91 km2 | 87.66% | 22,009 | 822 | 2945 | 153 | 1686 |
| 4 | Sanbon2-dong | 648.93 km2 | 97.83% | 29,264 | 154 | 8405 | 0 | 142 |
| 5 | Geumjeong-dong | 520.79 km2 | 81.23% | 19,329 | 668 | 1367 | 249 | 2467 |
| 6 | Jaegung-dong | 464.89 km2 | 97.70% | 21,416 | 180 | 6110 | 16 | 985 |
| 7 | Ogeum-dong | 583.70 km2 | 99.92% | 24,176 | 0 | 8540 | 0 | 0 |
| 8 | Suri-dong | 1572.20 km2 | 99.91% | 18,817 | 0 | 7134 | 0 | 0 |
| 9 | Gungnae-dong | 914.20 km2 | 99.86% | 21,630 | 0 | 6774 | 0 | 0 |
| 10 | Daeya-dong | 8571.69 km2 | 99.72% | 9707 | 192 | 1936 | 0 | 957 |
| 11 | Gwangjeong-dong | 974.29 km2 | 98.93% | 26,769 | 96 | 7942 | 0 | 93 |
| City | Measurement | Longitude | Latitude | NO2 | O3 | CO | PM10 |
|---|---|---|---|---|---|---|---|
| Gunpo | Dangdong | 37.353688 | 126.945154 | 0.005 | 0.024 | 0.039 | 47 |
| Sanbon-dong | 37.361671 | 126.935176 | 0.005 | 0.022 | 0.044 | 38 | |
| Uiwang | Gocheon-dong | 37.344683 | 126.968304 | 0.004 | 0.034 | 0.035 | 43 |
| Bugok-dong | 37.319317 | 126.950400 | 0.004 | 0.028 | 0.038 | 46 | |
| Anyang | Anyang 6-dong | 37.390002 | 126.930581 | 0.004 | 0.023 | 0.042 | 47 |
| Anyang 2-dong | 37.405053 | 126.917844 | 0.003 | 0.028 | 0.035 | 44 | |
| Burim-dong | 37.394300 | 126.956855 | 0.004 | 0.028 | 0.032 | 40 | |
| Hogye-dong | 37.381172 | 126.952598 | 0.005 | 0.027 | 0.041 | 46 | |
| Ansan | Bugok-dong | 37.331911 | 126.861041 | 0.005 | 0.031 | 0.036 | 49 |
| Gojan-dong | 37.321864 | 126.830857 | 0.005 | 0.025 | 0.034 | 42 | |
| Wongok-dong | 37.331600 | 126.801840 | 0.006 | 0.023 | 0.036 | 50 | |
| Hoseong-dong | 37.304720 | 126.833281 | 0.004 | 0.022 | 0.041 | 50 |
| Model Statistics | PM10 | NO2 | O3 | CO | ||||
|---|---|---|---|---|---|---|---|---|
| Modified R2 | 0.693 | 0.504 | 0.568 | 0.172 | ||||
| F probability | 0.000 | 0.000 | 0.000 | 0.058 | ||||
| Significant variable | Coefficient | Note percentage | Coefficient | Note percentage | Coefficient | Note percentage | Coefficient | Note percentage |
| Total population | 1.455 × 10⁻⁵ | 0.907 | 1.088 × 10⁻⁷ | 0.312 | 6.255 × 10⁻⁹ | 0.960 | 8.269 × 10⁻⁶ | 0.011 ** |
| Single-family residence | 0.006 | 0.035 ** | 4.703 × 10⁻⁶ | 0.063 * | 7.078 × 10⁻⁶ | 0.018 ** | 0.000 | 0.149 |
| Apartment | 0.008 | 0.009 *** | 5.037 × 10⁻⁶ | 0.042 ** | 8.527 × 10⁻⁶ | 0.004 *** | 0.000 | 0.077 * |
| Townhouse | 0.006 | 0.060 ** | 2.982 × 10⁻⁶ | 0.290 | 7.221 × 10⁻⁶ | 0.032 *** | 0.000 | 0.188 |
| Multi-unit residence | 0.009 | 0.004 *** | 5.698 × 10⁻⁶ | 0.023 ** | 9.362 × 10⁻⁶ | 0.002 *** | 0.000 | 0.084 * |
| NDVI_GI | 2.787 × 10⁻⁹ | 0.983 | −1.925 × 10⁻¹⁰ | 0.085 * | 6.698 × 10⁻¹¹ | 0.602 | 2.641 × 10⁻⁹ | 0.411 |
| NDVI_NON | 6.113 × 10⁻⁷ | 0.008 *** | 3.536 × 10⁻¹⁰ | 0.070 * | 3.905 × 10⁻¹⁰ | 0.086 * | 1.512 × 10⁻⁸ | 0.009 *** |
Disclaimer/Publisher’s Note: The statements, opinions and data contained in all publications are solely those of the individual author(s) and contributor(s) and not of MDPI and/or the editor(s). MDPI and/or the editor(s) disclaim responsibility for any injury to people or property resulting from any ideas, methods, instructions or products referred to in the content. |
© 2024 by the authors. Licensee MDPI, Basel, Switzerland. This article is an open access article distributed under the terms and conditions of the Creative Commons Attribution (CC BY) license (https://creativecommons.org/licenses/by/4.0/).
Share and Cite
Liao, J.; Kim, H.Y. Analyzing the Relationship between Green Infrastructure and Air Quality Issues—South Korean Cases. Land 2024, 13, 1263. https://doi.org/10.3390/land13081263
Liao J, Kim HY. Analyzing the Relationship between Green Infrastructure and Air Quality Issues—South Korean Cases. Land. 2024; 13(8):1263. https://doi.org/10.3390/land13081263
Chicago/Turabian StyleLiao, Jianfeng, and Hwan Yong Kim. 2024. "Analyzing the Relationship between Green Infrastructure and Air Quality Issues—South Korean Cases" Land 13, no. 8: 1263. https://doi.org/10.3390/land13081263
APA StyleLiao, J., & Kim, H. Y. (2024). Analyzing the Relationship between Green Infrastructure and Air Quality Issues—South Korean Cases. Land, 13(8), 1263. https://doi.org/10.3390/land13081263