Article

Comparative Study of the Impacts of Maize and Soybean on Soil and Water Conservation Benefits during Different Growth Stages in the Loess Plateau Region

1
College of Forestry, Shanxi Agricultural University, Jinzhong 030801, China
2
State Key Laboratory of Soil Erosion and Dryland Farming on the Loess Plateau, Institute of Soil and Water Conservation, Northwest A&F University, Yangling 712100, China
*
Author to whom correspondence should be addressed.
Land 2024, 13(8), 1264; https://doi.org/10.3390/land13081264
Submission received: 21 May 2024 / Revised: 7 August 2024 / Accepted: 11 August 2024 / Published: 12 August 2024
(This article belongs to the Topic Slope Erosion Monitoring and Anti-erosion)

Abstract

:
Maize (Zea mays L.) and soybean (Glycine max L. Merr.) are prevalent summer crops planted widely in the Loess Plateau region of China, which is particularly susceptible to severe soil erosion on the sloping farmland. However, which crop exhibits superior soil and water conservation capabilities while maintaining economic viability, and how their performance in soil and water conservation is affected by slope gradient and rainfall intensity remains unclear. The objective of this study was to compare the impacts of maize and soybean on regulating runoff and sediment through rainfall simulation experiments, and explore the main control factors of soil and water conservation benefits. Five slope gradients (8.7, 17.6, 26.8, 36.4, and 46.6%) and two rainfall intensities (40 and 80 mm h−1) were applied at five respective crop growth stages. Both maize and soybean effectively reduced soil and water losses compared with bare ground, although increasing slope gradient and rainfall intensity weakened the vegetation effect. Compared with slope gradient and rainfall intensity, vegetation coverage was the main factor affecting the performance of maize and soybean in conserving soil and water. The average time delay benefit (TDB), runoff reduction benefit (RRB), and sediment reduction benefit (SRB) of soybean (246.48 ± 11.71, 36.34 ± 2.51, and 54.41 ± 3.42%) were significantly higher (p < 0.05) than those of maize (100.06 ± 6.81, 25.71 ± 1.76, and 43.70 ± 2.91%, respectively) throughout growth. After planting, the increasing rates of vegetation coverage, TDB, RRB, and SRB with time were consistently higher with soybean than maize. Moreover, under the same vegetation coverage, the TDB, RRB, and SRB of soybean were also consistently higher than those of maize. In conclusion, these findings indicate that soybean outperformed maize in terms of soil and water conservation benefits under the experimental conditions, making it more suitable for cultivation on sloping farmland. This finding offers crucial guidance for the cultivation of dry farming in regions plagued by severe soil erosion, facilitating a balance between economic objectives and ecological imperatives.

1. Introduction

Soil erosion on sloping farmland is a serious environmental problem worldwide, threatening the sustainable development of agriculture and the economy [1,2]. However, in mountainous and hilly regions, sloping farmland is often the main carrier of agricultural production [3], posing problems such as a high slope gradients, low soil fertility, a thin soil layer, poor irrigation facilities, and frequent soil disturbance [4,5,6,7]. All these issues culminate in disproportionately high economic input and low output, as well as significant soil erosion and land degradation [8,9]. In the past century, serious soil erosion has occurred in the Loess Plateau region of China (especially on sloping farmland), resulting in the deposition of sediments in local reservoirs, rivers, and lakes [2,10]. To address this issue, the Chinese government implemented the “Grain for Green” project in 1999 [11], the main purpose of which is to convert sloping farmland with a gradient above 25° into forest or grassland [12]. Since its implementation, vegetation coverage on the Loess Plateau has increased substantially from 31.6% in 1999 to 60% in 2020, resulting in effective control of subsequent soil erosion [13,14]. Moreover, the annual sediment load in the Yellow River has decreased sharply from 1.6 Gt to less than 0.2 Gt [15].
The positive effects of vegetation restoration on soil and water conservation are evident. However, it is important to note that the influence of vegetation on soil and water conservation can vary depending on multiple factors, which can be summarized as short and long term [16]. In the short term, vegetation provides direct coverage of the land surface through a canopy or litter layer, reducing soil and water losses by preventing the detachment of surface soil by raindrops and runoff [17]. The vegetation canopy redistributes rainfall (i.e., interception, stemflow, and throughfall) and reduces the kinetic energy of raindrops, while the litter layer eliminates the energy of raindrops and protects the soil surface [18]. In addition, the vegetation canopy and litter layer greatly increase soil surface roughness, delay runoff, and reduce runoff velocity, all of which help reduce runoff energy and promote rainfall infiltration [19]. In the long term, vegetation improves the physical and chemical properties of the soil as well as the local microclimate, reducing the occurrence of soil erosion [20,21]. For example, the root system directly increases the shear strength and non-capillary porosity of soil [22]. Moreover, root secretions promote the formation of water-stable aggregates, decreasing the erodibility of soil [23]. Overall, vegetation-based measures are less expensive and more environmentally friendly than engineering measures and should therefore be a priority in soil erosion management [5].
The effects of field crops on soil and water conservation cannot be ignored, even though they are less influential than forest and grass coverage [24]. Farmland is extremely vulnerable to soil erosion, mainly because of its single vegetation type, simple vegetation structure (e.g., lack of a litter layer), and frequent human disturbance [2,6,25,26]. Field crops tend to be annual herbaceous plants with a growing season of only a few months, resulting in significant changes in the vegetation coverage throughout the year [27]. As a result, serious soil erosion is likely to occur, especially during the fallow period when the soil surface is almost devoid of vegetation [28]. However, field crops are also the only vegetation type that can provide protection in farmland areas, and through reasonable selection they can play an important role in conserving soil and water [29]. Based on rainfall simulations, Lin et al. [30] revealed that wheat reduced runoff by 43.8–83.4% and sediment by 86.7–98.2% on sloping farmland from the tillering to the ripening stage compared with bare ground. Moreover, Sharma et al. [31] found that intercropping of cowpea/okra and maize reduced runoff by 26% and soil losses by 43% compared with maize monocropping in northern India. In addition, numerous studies have revealed the role of cover crops in effectively reducing soil erosion and nutrient losses in farmland and orchards [32,33].
The performance of field crops in conserving soil and water differs among species and is influenced by many factors. Planting density is the most direct factor affecting the role of crops in reducing soil and water losses [34]. In general, soil erosion under low-density crops such as maize and soybean is thought to be much higher than under high-density crops such as winter wheat and oil-seed rape [35]. Moreover, root type is an important factor affecting the suitability of different crops for erosion control [23,36,37]. For example, De Baets et al. [38] reported that cover crops with fine-branched roots such as ryegrass and rye are more effective in preventing soil losses caused by concentrated flow than those with thick roots such as white mustard and fodder radish. Factors such as crop morphology, the harvesting method, and stubble retention conditions also affect the erosion-control function of field crops [17,39]. In South Korea, Arnhold et al. [24] found that radish caused more soil erosion than bean, potato, and cabbage due to its shorter growth period, higher rate of soil disturbance at harvest, and lower amount of remaining residue. In addition, environmental factors such as slope gradient and rainfall intensity strongly affect the performance of field crops in soil and water conservation [40]. In line with this, Lin et al. [30] found that the effects of wheat in reducing runoff were substantially influenced by both slope gradient and rainfall intensity, while the effects on sediment were only influenced by slope gradient.
Maize and soybean are common summer crops planted widely on the Loess Plateau, where summer rainstorms cause serious soil erosion on sloping farmland [2,41,42]. However, few studies have compared the effects of these two crops in regulating runoff and sediment systematically, and it remains unclear how their performance in conserving soil and water is affected by slope gradient and rainfall intensity. Thus, to determine which crop is more suitable for erosion control on sloping farmland, we compared the effects of maize and soybean at different growth stages in regulating runoff and sediment under different slope gradients and rainfall intensities using rainfall simulation experiments. The results provide useful data for the selection of summer crops for soil and water conservation on sloping farmland in the Loess Plateau.

2. Materials and Methods

2.1. Study Site

The study site was located on the southern margin of the Loess Plateau (107°59′–108°08′ E, 34°14′–34°20′ N), and had an average elevation of 468 m. The climate here is a semi-humid continental monsoon, with an annual precipitation of 641 mm. Precipitation mainly occurs in the summer in the form of heavy short-term storms, with 60–70% concentrated in July, August, and September [43]. Subsequently, soil erosion in this region is mainly caused by these summer rainstorms. The average annual temperature is 12.9 °C, and the average monthly temperature varies from −1.2 °C in January to 26.1 °C in July. Gullies and ridges are the typical geomorphic landscapes on the Loess Plateau, with slope gradients varying from 24.9 to 53.2% [44]. According to the World Reference Base for Soil Resources [45], soils here are classified as Eum-Orthic Anthrosols, developed on the Quaternary wind-accumulated Loess parent material under the influence of farming activities (e.g., cultivation and fertilization) during the process of soil formation. The basic physical and chemical properties of the soil in the study site are listed in Table 1.

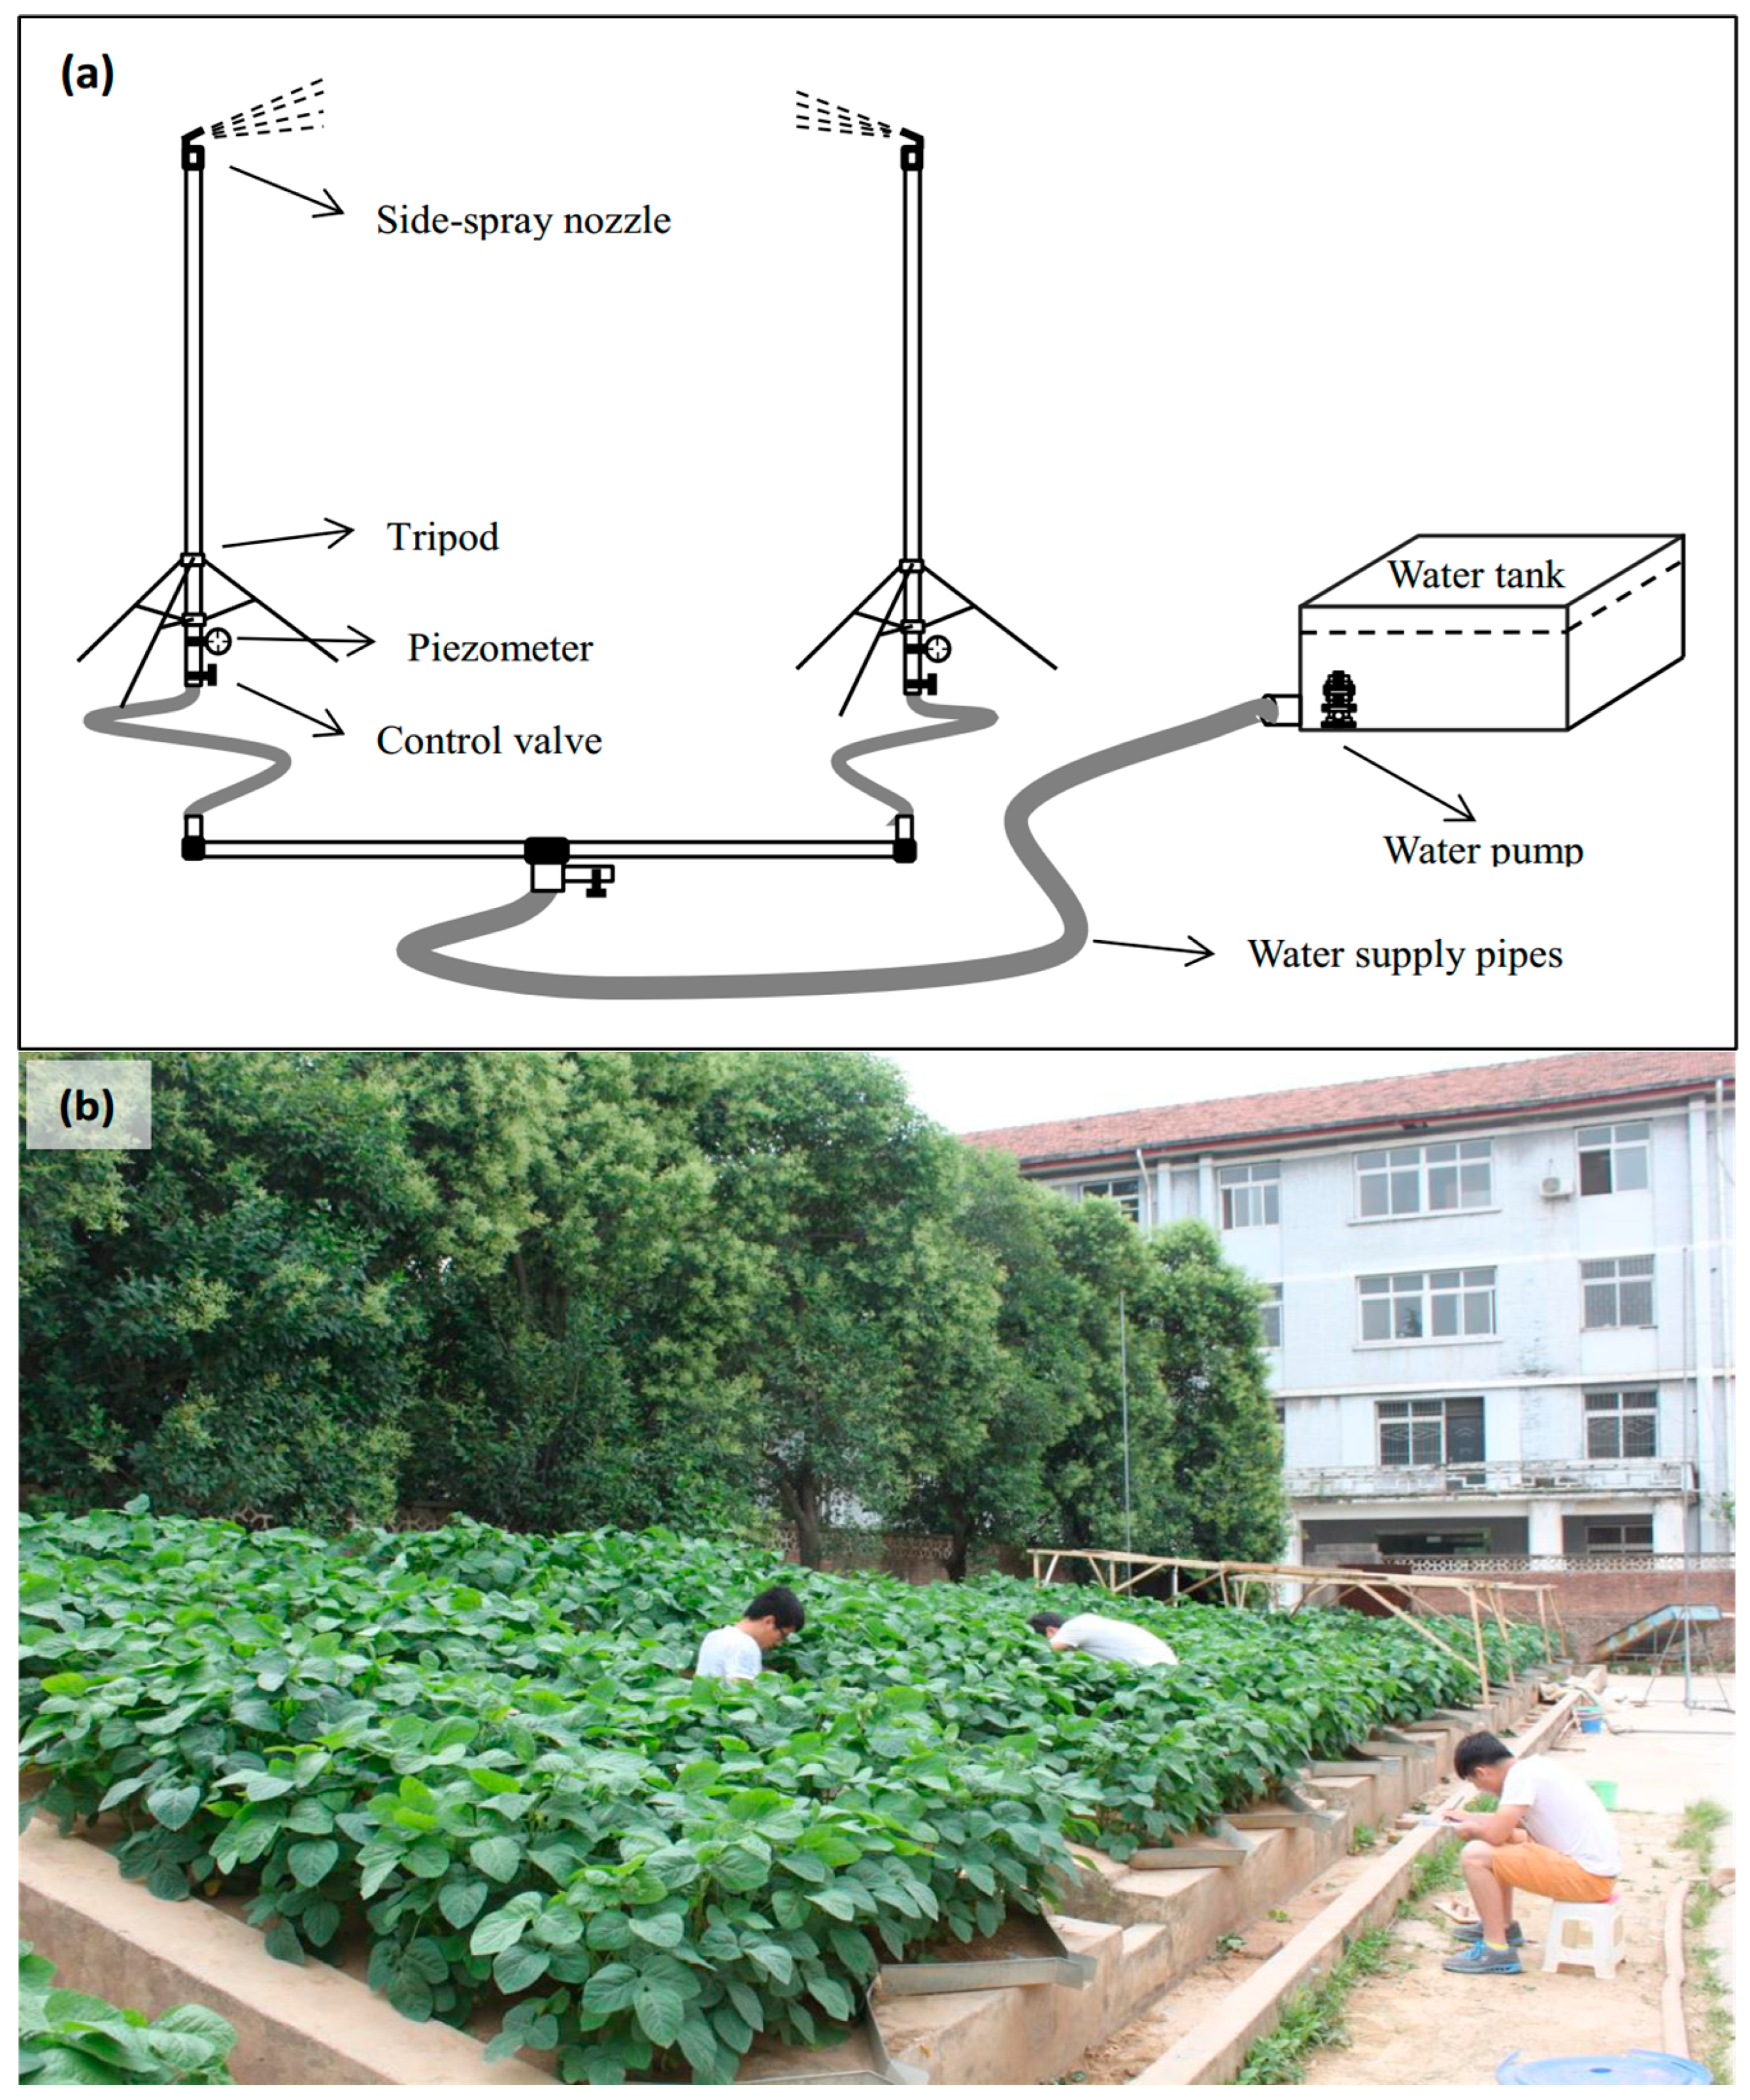
2.2. Experimental Setup and Materials

All experiments were conducted in runoff plots belonging to the Soil and Water Conservation Engineering Laboratory, College of Natural Resources and Environment, Northwest A&F University (Yangling, Shaanxi Province, China).
Rainfall simulation was carried out using a side-spray rainfall system created by the Institute of Soil and Water Conservation, the Chinese Academy of Sciences and the Ministry of Water Resources of the People’s Republic of China [30]. The rainfall system was composed of six parts: a tripod, side-spray nozzle, water pressure control valve, water tan, water pump, and water supply pipe (Figure 1a). Each tripod was 7 m in height with a side-spray nozzle installed on top. During operation, two tripods were placed outside the upper and lower edges of the runoff plot at an interval of 5 m. Rainfall intensity could be adjusted to between 30 and 120 mm h−1 by changing the size of the nozzle or altering the water pressure through rotating control valves. The effective rainfall area was 20 m2, with a rainfall uniformity coefficient [46] greater than 80%.
The runoff plots were constructed in 2009, and have since been used for long-term crop cultivation and soil erosion research. The plots are 4 m long (vertical projection length) and 1 m wide (Figure 1b), with a slope gradient designed to have five levels (5.2, 8.7, 17.6, 26.8, and 36.4%) according to the topographic characteristics and slope gradient distribution of the Loess Plateau [43,44]. Each slope gradient was applied to four plots. The soil in the plots was collected from the topsoil (0–20 cm) of local farmland.
Seeds of maize (Zea mays L. cv. “Zhengdan 958”) and soybean (Glycine max L. Merr. cv. “Zhonghuang 13”) were dibble-planted, with row spacing of 60 and 40 cm and plant spacing of 25 and 20 cm, respectively. The planting densities were 66,700 and 125,000 plants per hectare, respectively. The date of planting, emergence, and harvest are summarized in Table 2. All management practices (e.g., tillage and fertilization) were consistent with local farming activities. For both crops, five growth stages were selected for the simulated rainfall experiments. For maize these were the third leaf (V3), sixth leaf (V6), ninth leaf (V9), tasseling (VT), and blister (R2) stages [47], and for soybean they were the second trifoliolate (V2), fifth trifoliolate (V5), full bloom (R2), full pod (R4), and full seed (R6) stages [48].

2.3. Experimental Design

On the Loess Plateau, soil erosion is mainly caused by intense summer storms, which have a rainfall intensity greater than 60 mm h−1 [43,44]. The rainfall intensities used in the simulation experiments were therefore set at 40 and 80 mm h−1, to represent normal and high intensity rainfall, respectively. Under each slope gradient, two runoff plots were constructed to represent each rainfall intensity. The dates of the simulated rainfall on each runoff plot during the different growth stages of maize and soybean are listed in Table 2. To prevent the impact of natural rainfall and antecedent soil moisture, all plots were covered during natural rainfall and the mass water content of the surface soil (0–10 cm) was maintained at 15–20% by spraying water or air curing before each simulated rainfall event. As a control, simulated rainfall on bare ground was carried out before the planting of maize.
Each rainfall simulation event lasted one hour and consisted of five steps: (1) the start time of runoff was recorded, (2) runoff and sediment samples were collected for 1 min at 2 min intervals from the start of runoff to the end of rainfall, (3) the volume of each runoff and sediment sample was measured using a 1000 mL standard cylinder, (4) the supernatant was removed after runoff and sediment samples were settled for 24 h, and (5) the sediment samples were oven-dried for 12 h at 105 °C, then weighed.

2.4. Parameter Measurements and Calculations

Vegetation coverage was measured using a photographic method [29,30]. Briefly, several photos in JPG format were taken perpendicularly at a fixed height (2 m above the top of plant) using a digital camera at each growth stage of maize and soybean. Post-processing was performed using Image J2x software (Rawak Software Inc., Dresden, Germany), allowing the area of vegetation and non-vegetation pixels in each photo to be counted. The percentage of vegetation pixels in a photo was determined as the vegetation coverage. The coverage data of maize and soybean at each growth stage are provided in Table 2.
To compare the performance of maize and soybean in soil and water conservation, seven indicators were used to quantify the effects of each crop in regulating runoff and sediment under each experimental condition [30]. Time to runoff (TR, min) represents the generation time of the runoff on each runoff plot after the initiation of simulated rainfall. Initial loss of rainfall (ILR, mm) represents the amount of rainfall needed to fall on the ground before runoff generation; this rainfall is usually consumed by vegetation interception, evaporation, depression storage, and infiltration. Runoff volume (RV, L m−2) and sediment yield (SY, g m−2) represent the amount of runoff and sediment yield during each simulated rainfall event, respectively. The time delay benefit (TDB, %), runoff reduction benefit (RRB, %), and sediment reduction benefit (SRB, %) quantify the benefits of maize and soybean in conserving soil and water. The TDB is the percentage of TR and ILR increased by crop coverage compared with bare ground, directly reflecting the ability of each crop to intercept rainfall and delay runoff generation. Similarly, the RRB and SRB represent the percentage of runoff and sediment reduced by crop coverage compared with bare ground, respectively, and can be used to compare the performance of each crop in reducing runoff and sediment yield. The formulas used to calculate the ILR, TDB, RRB, and SRB are as follows:
I L R = T R × I 60
T D B = T R v T R b T R b × 100 %
R R B = R V b R V v R V b × 100 %
S R B = S Y b S Y v S Y b × 100 %
where I is the rainfall intensity (mm h−1); TRb, RVb, and SYb are the time to runoff (min), the runoff volume (L m−2), and sediment yield (g m−2) of bare ground, respectively, and TRv, RVv, and SYv are the respective values of vegetated ground (i.e., maize and soybean).

2.5. Statistical Analysis

The SPSS v19.0 (SPSS Inc., Chicago, IL, USA) was used for data analysis and Sigma Plot v12.0 (Systat Software Inc., San Jose, CA, USA) was used for graph drawing. One-way analysis of variance (ANOVA) followed by Duncan’s multiple range test was used to determine the differences between treatments. Nonlinear regression and stepwise multiple regression were used to analyze the relationship between the independent and dependent variables. In the obtained multiple linear regression equation, the standardized regression coefficient (SRC) was used to determine the relative importance of each independent variable [49].

3. Results

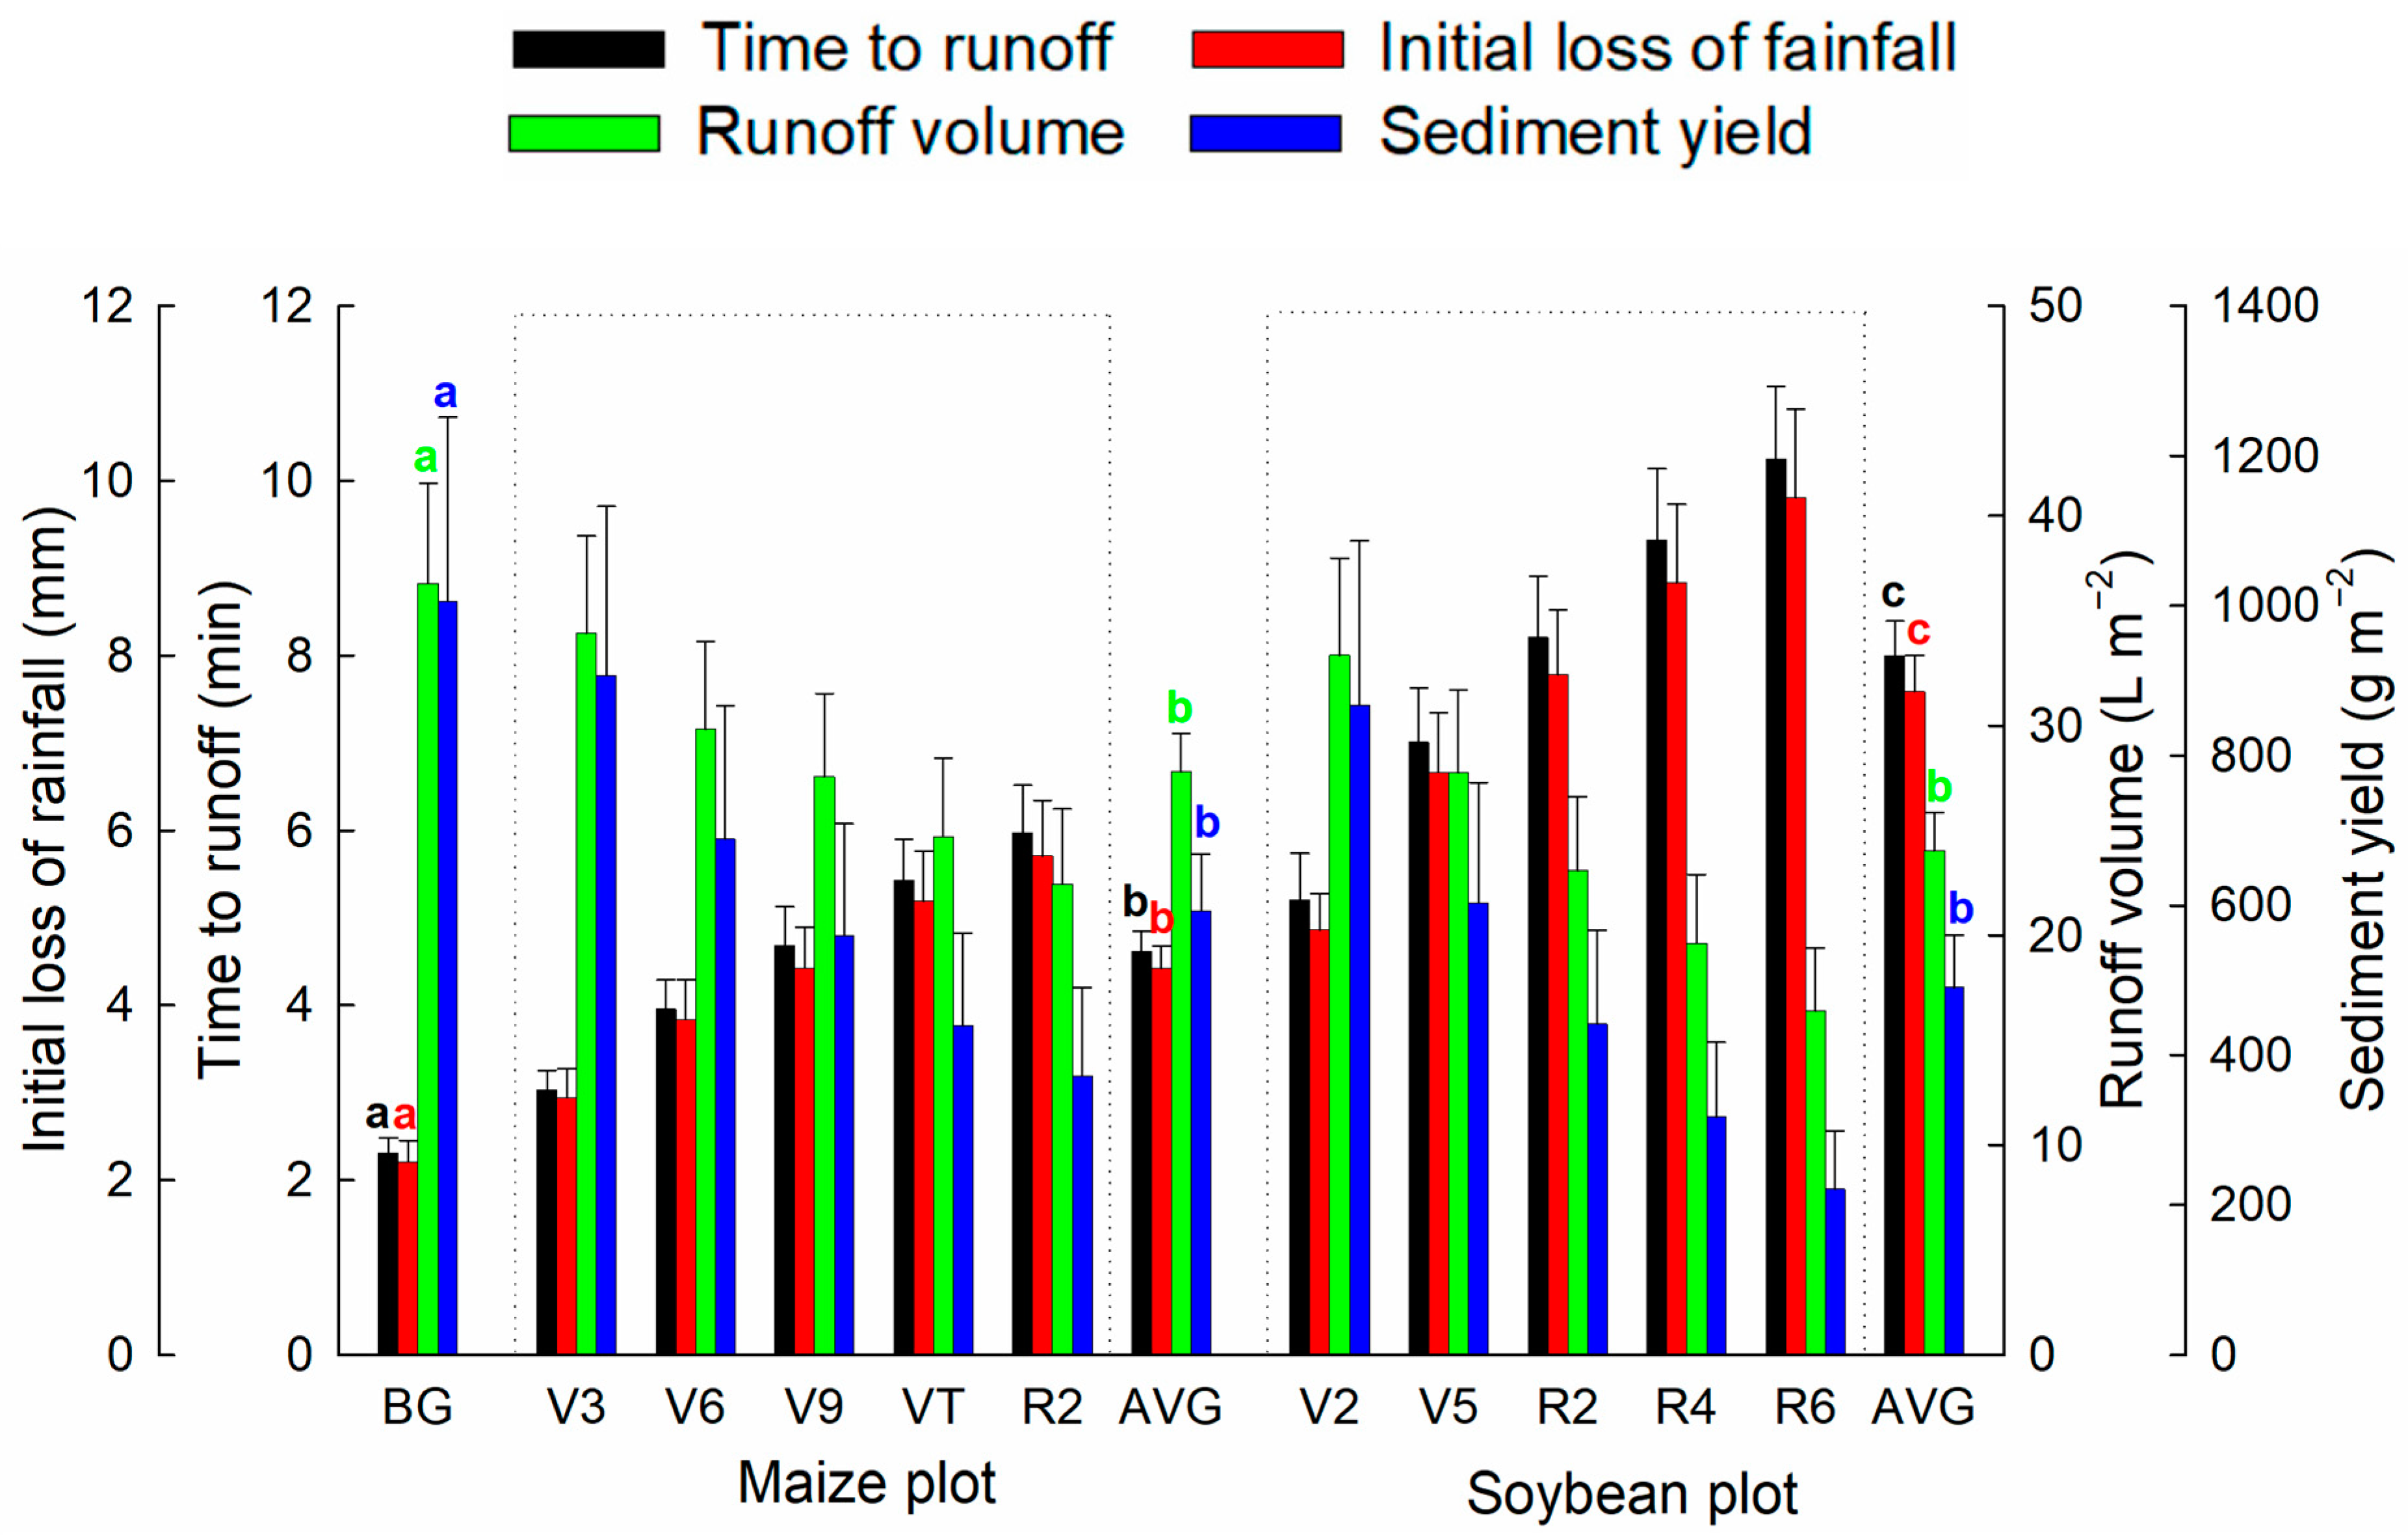
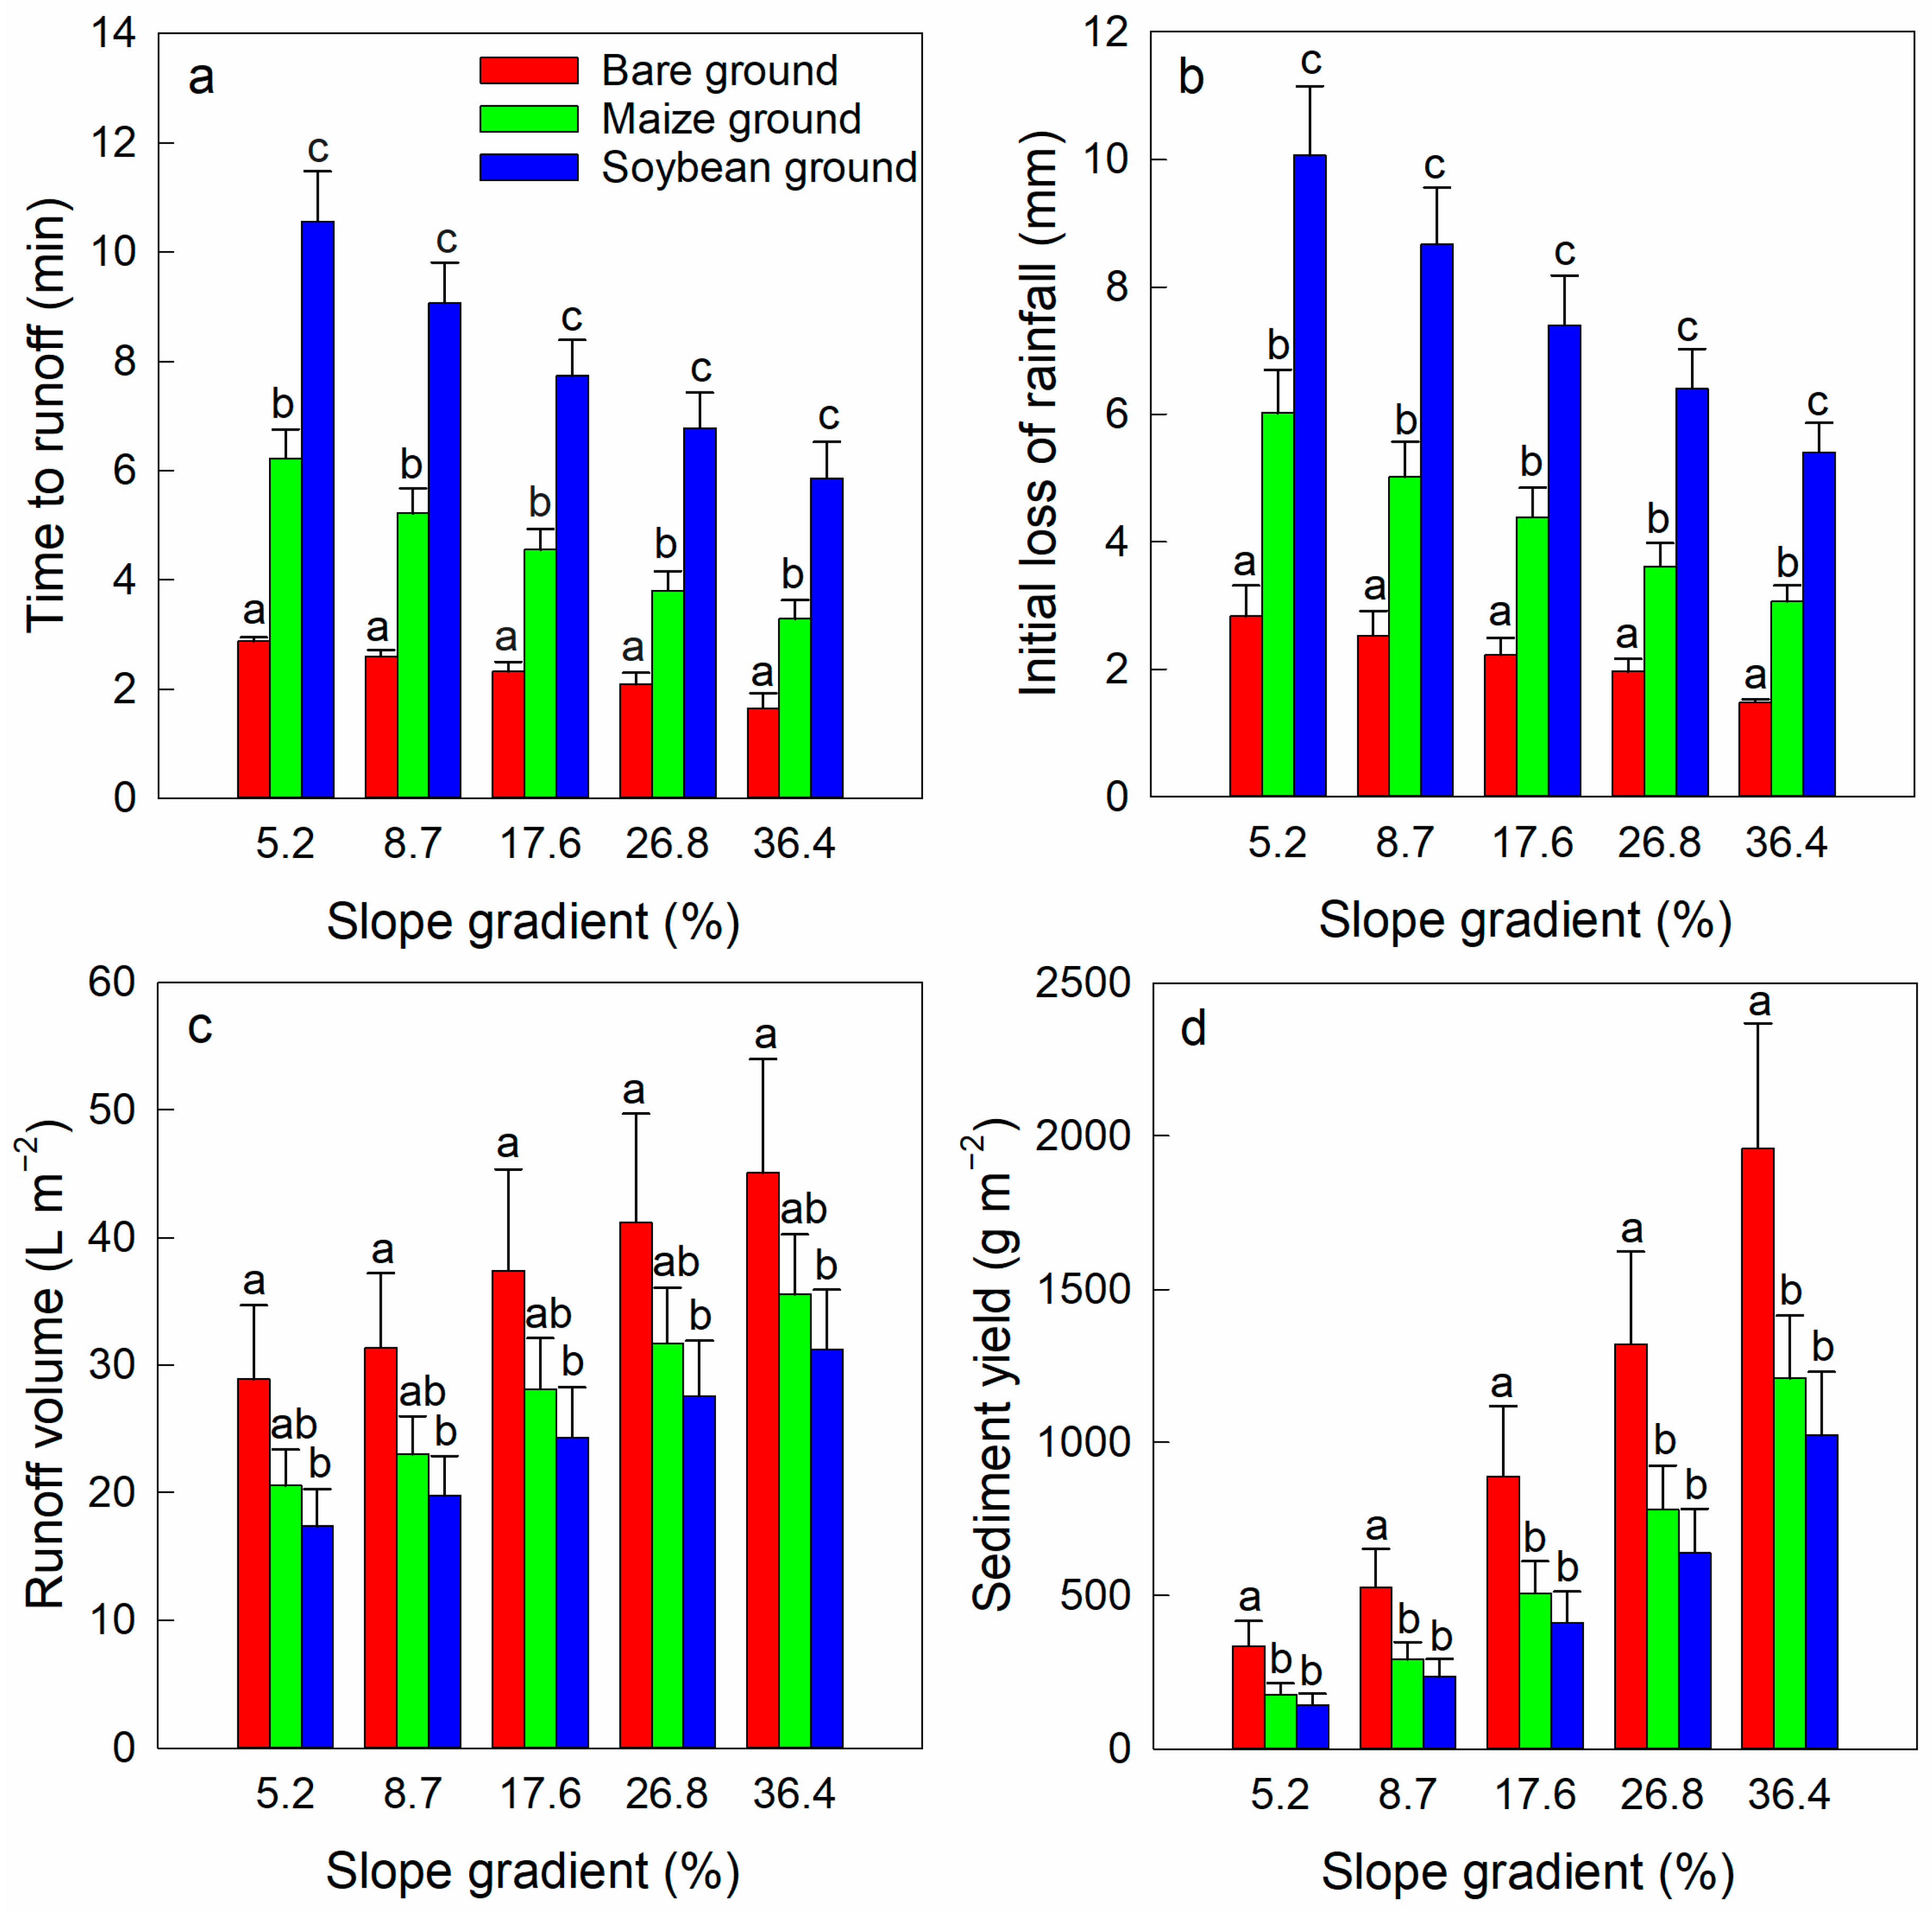
3.1. Runoff Generation and Sediment Yield

With growth and an increase in vegetation coverage, both TR and ILR showed an upward trend, while RV and SY showed a downward trend (Figure 2). The average TR and ILR of the soybean plots (8.00 ± 0.39 min and 7.59 ± 0.41 mm) were significantly higher than those of the maize plots (4.62 ± 0.23 min and 4.42 ± 0.26 mm), and both values were significantly higher (p < 0.05) on vegetated ground than on bare ground (2.31 ± 0.18 min and 2.21 ± 0.24 mm). Meanwhile, the average RV and SY of the soybean plots (24.05 ± 1.81 L m−2 and 490.35 ± 70.17 g m−2) were slightly, but not significantly, lower than those of the maize plots (27.79 ± 1.83 L m−2 and 593.37 ± 75.24 g m−2), and both values were significantly higher (p < 0.05) on vegetated ground than on bare ground (36.79 ± 4.77 L m−2 and 1006.20 ± 245.21 g m−2).
With an increase in slope gradient from 5.2 to 36.4%, the TR and ILR of bare ground, maize plots, and soybean plots showed a downward trend, while the RV and SY showed an upward trend (Figure 3). Within this range of slope gradients, the TR and ILR of the soybean plots were significantly longer and higher (p < 0.05) than those of the maize plots, and both indicators were longer and higher (p < 0.05) on vegetated than bare ground, respectively. Under all slope gradients, the SY of bare ground was significantly higher (p < 0.05) than that of the maize and soybean plots; however, the RV of bare ground was only significantly higher (p < 0.05) than that of the soybean plots. The RV and SY of the maize plots were consistently higher than those of the soybean plots at slope gradients of 5.2–36.4%, albeit not significantly.
With an increase in rainfall intensity from 40 to 80 mm h−1, the ILR, RV, and SY of bare ground, maize plots, and soybean plots all showed an upward trend, with only the TR showing a downward trend (Figure 4). Under both rainfall intensities, the TR and ILR of the soybean plots were significantly longer and higher (p < 0.05) than those of the maize plots, and both were longer and higher (p < 0.05) on vegetated than bare ground, respectively. In addition, the RV and SY of bare ground were significantly higher (p < 0.05) than those of vegetated ground, while the values of the soybean plots were slightly, but not significantly, higher than those of the maize plots.
Through nonlinear regression analysis, it was possible to express the relationship between the dependent (i.e., TR, ILR, RV, and SY) and independent variables (i.e., slope gradient, rainfall intensity, and vegetation coverage) using the following power function:
V = m C n 1 S n 2 I n 3
where V is the dependent variable (TR, ILR, RV, or SY); C, S, and I are vegetation coverage, slope gradient, and rainfall intensity, respectively, and m, n1, n2, and n3 are fitting the parameters for bare ground, maize plots, and soybean plots, respectively (Table 3).
The correlation between variables was subsequently determined using the values (positive or negative) of the fitting parameters (Table 3). In all cases, the TR and ILR were negatively correlated with slope gradient, while the RV and SY were positively correlated with the gradient. In addition, the ILR, RV, and SY were positively correlated while only the TR was negatively correlated with rainfall intensity. In both the maize and soybean plots, the TR and ILR were positively correlated while the RV and SY were negatively correlated with vegetation coverage.

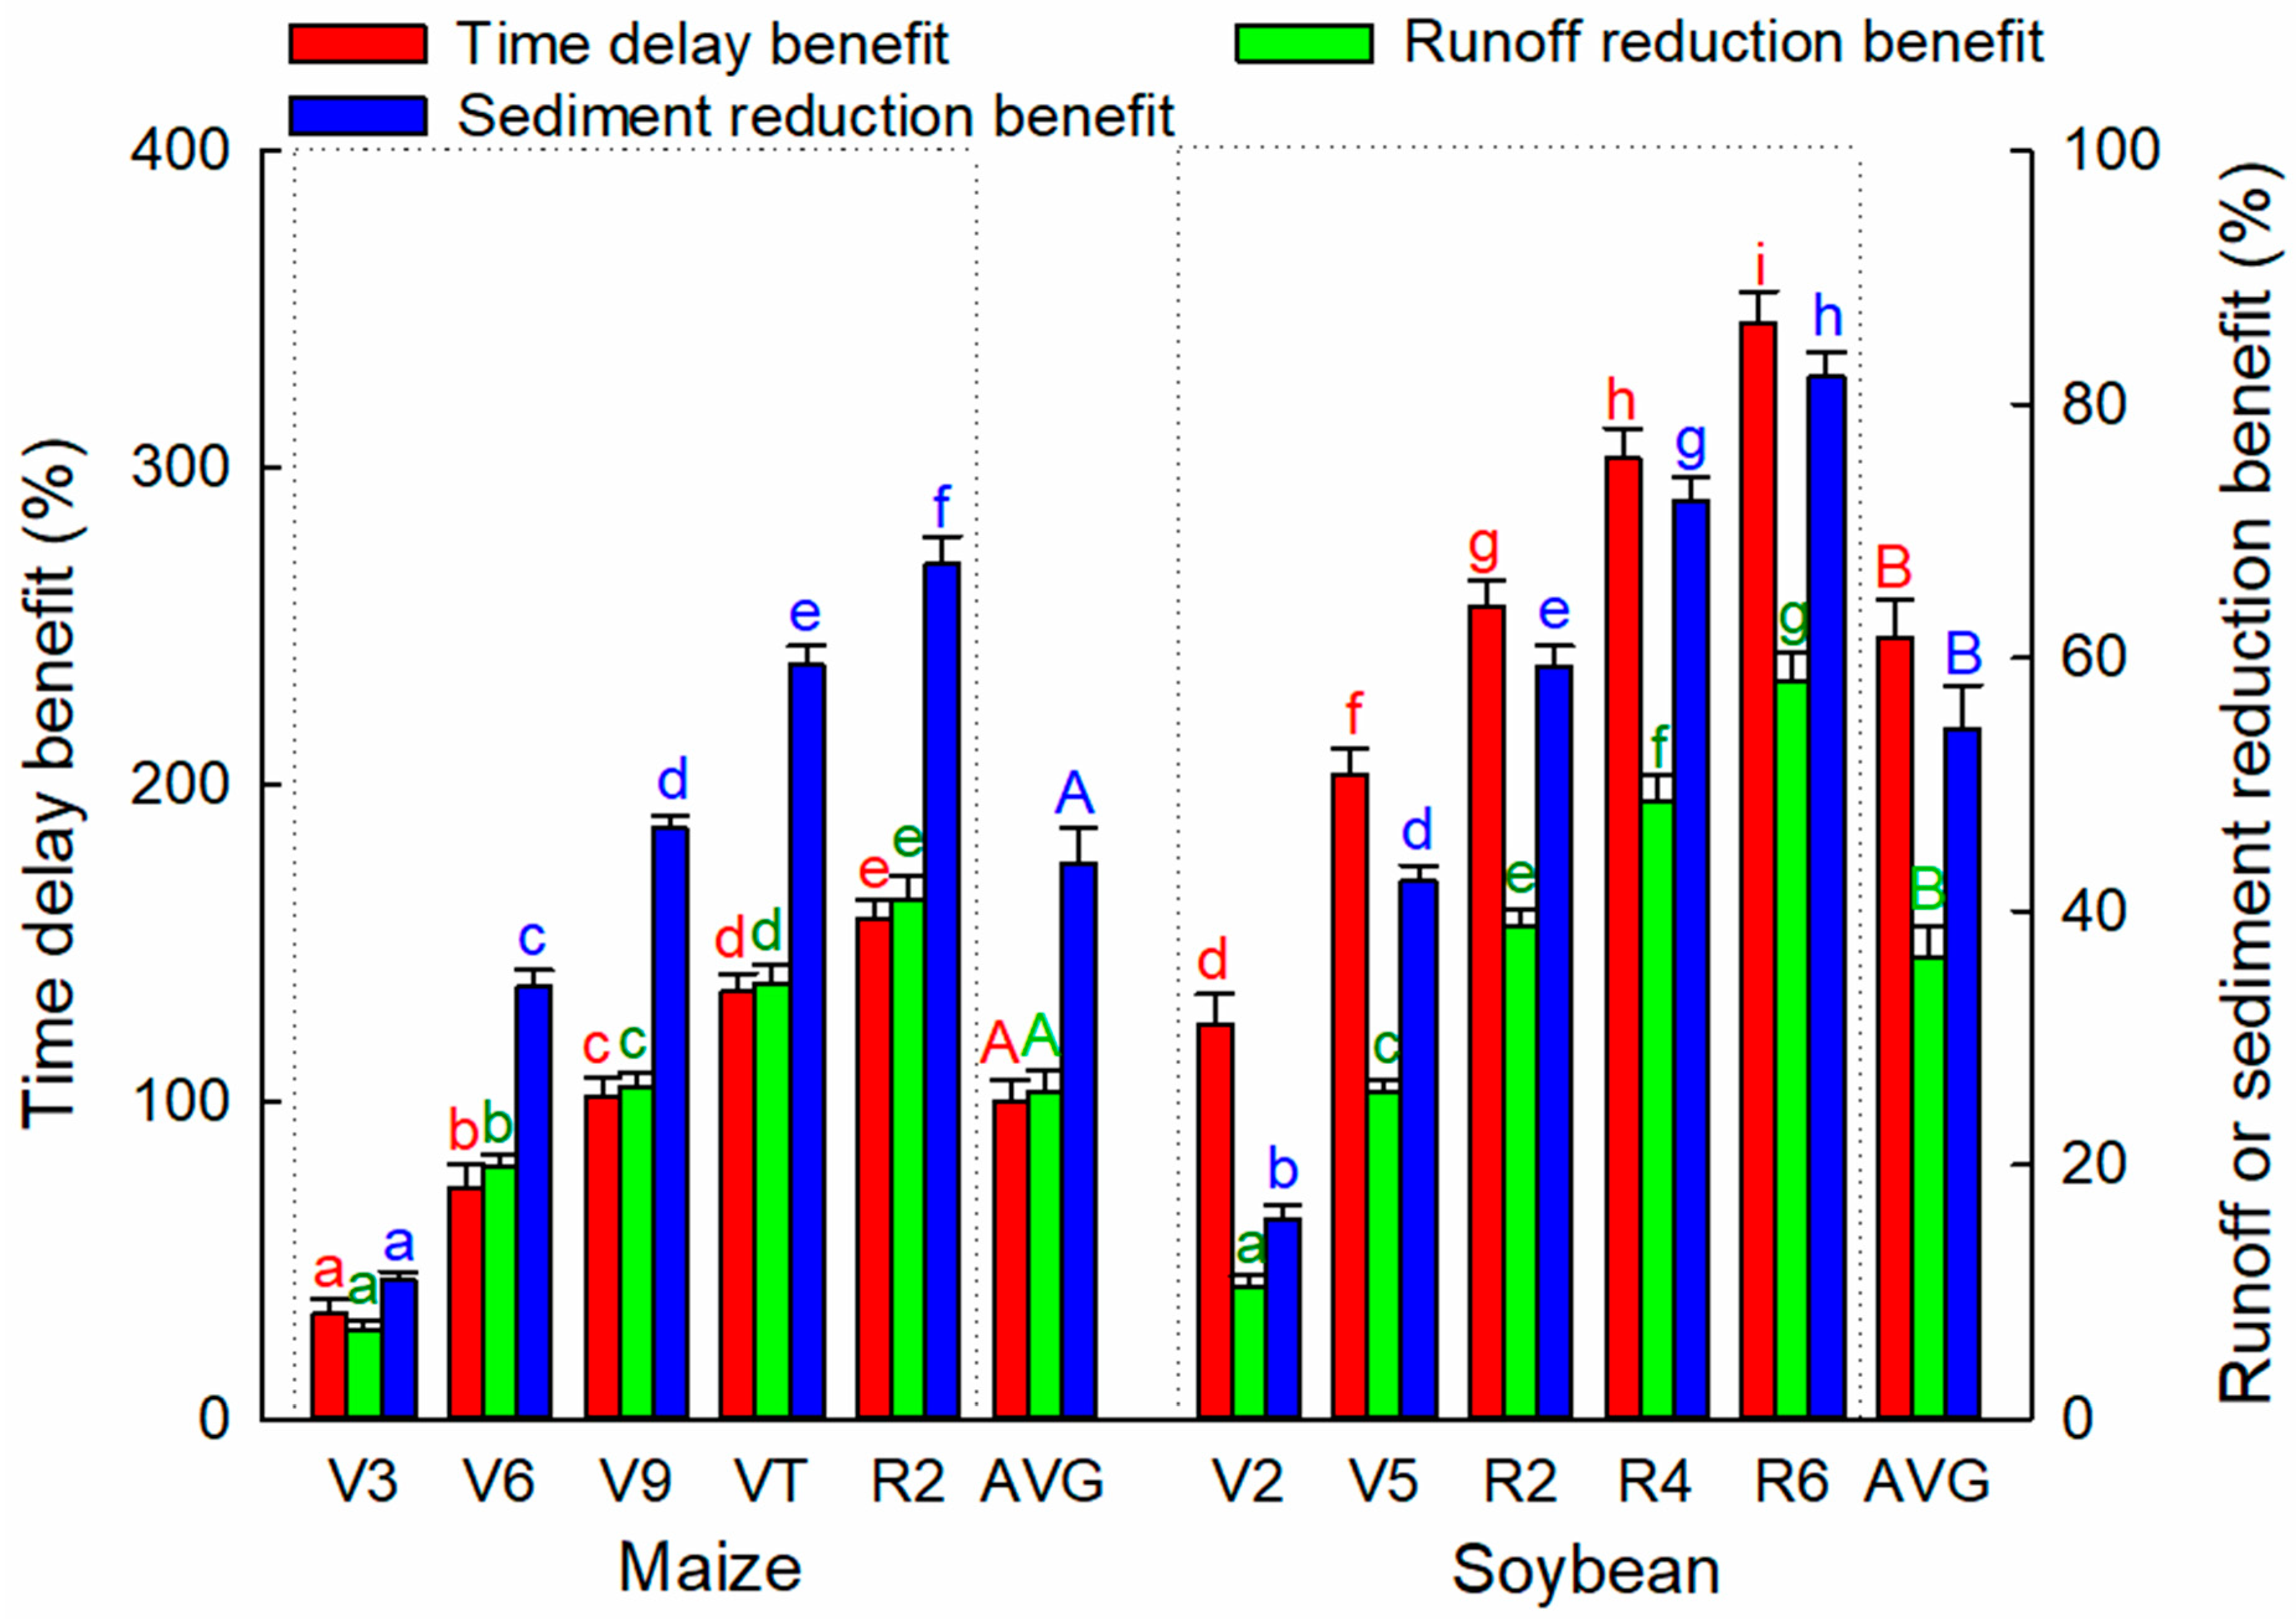
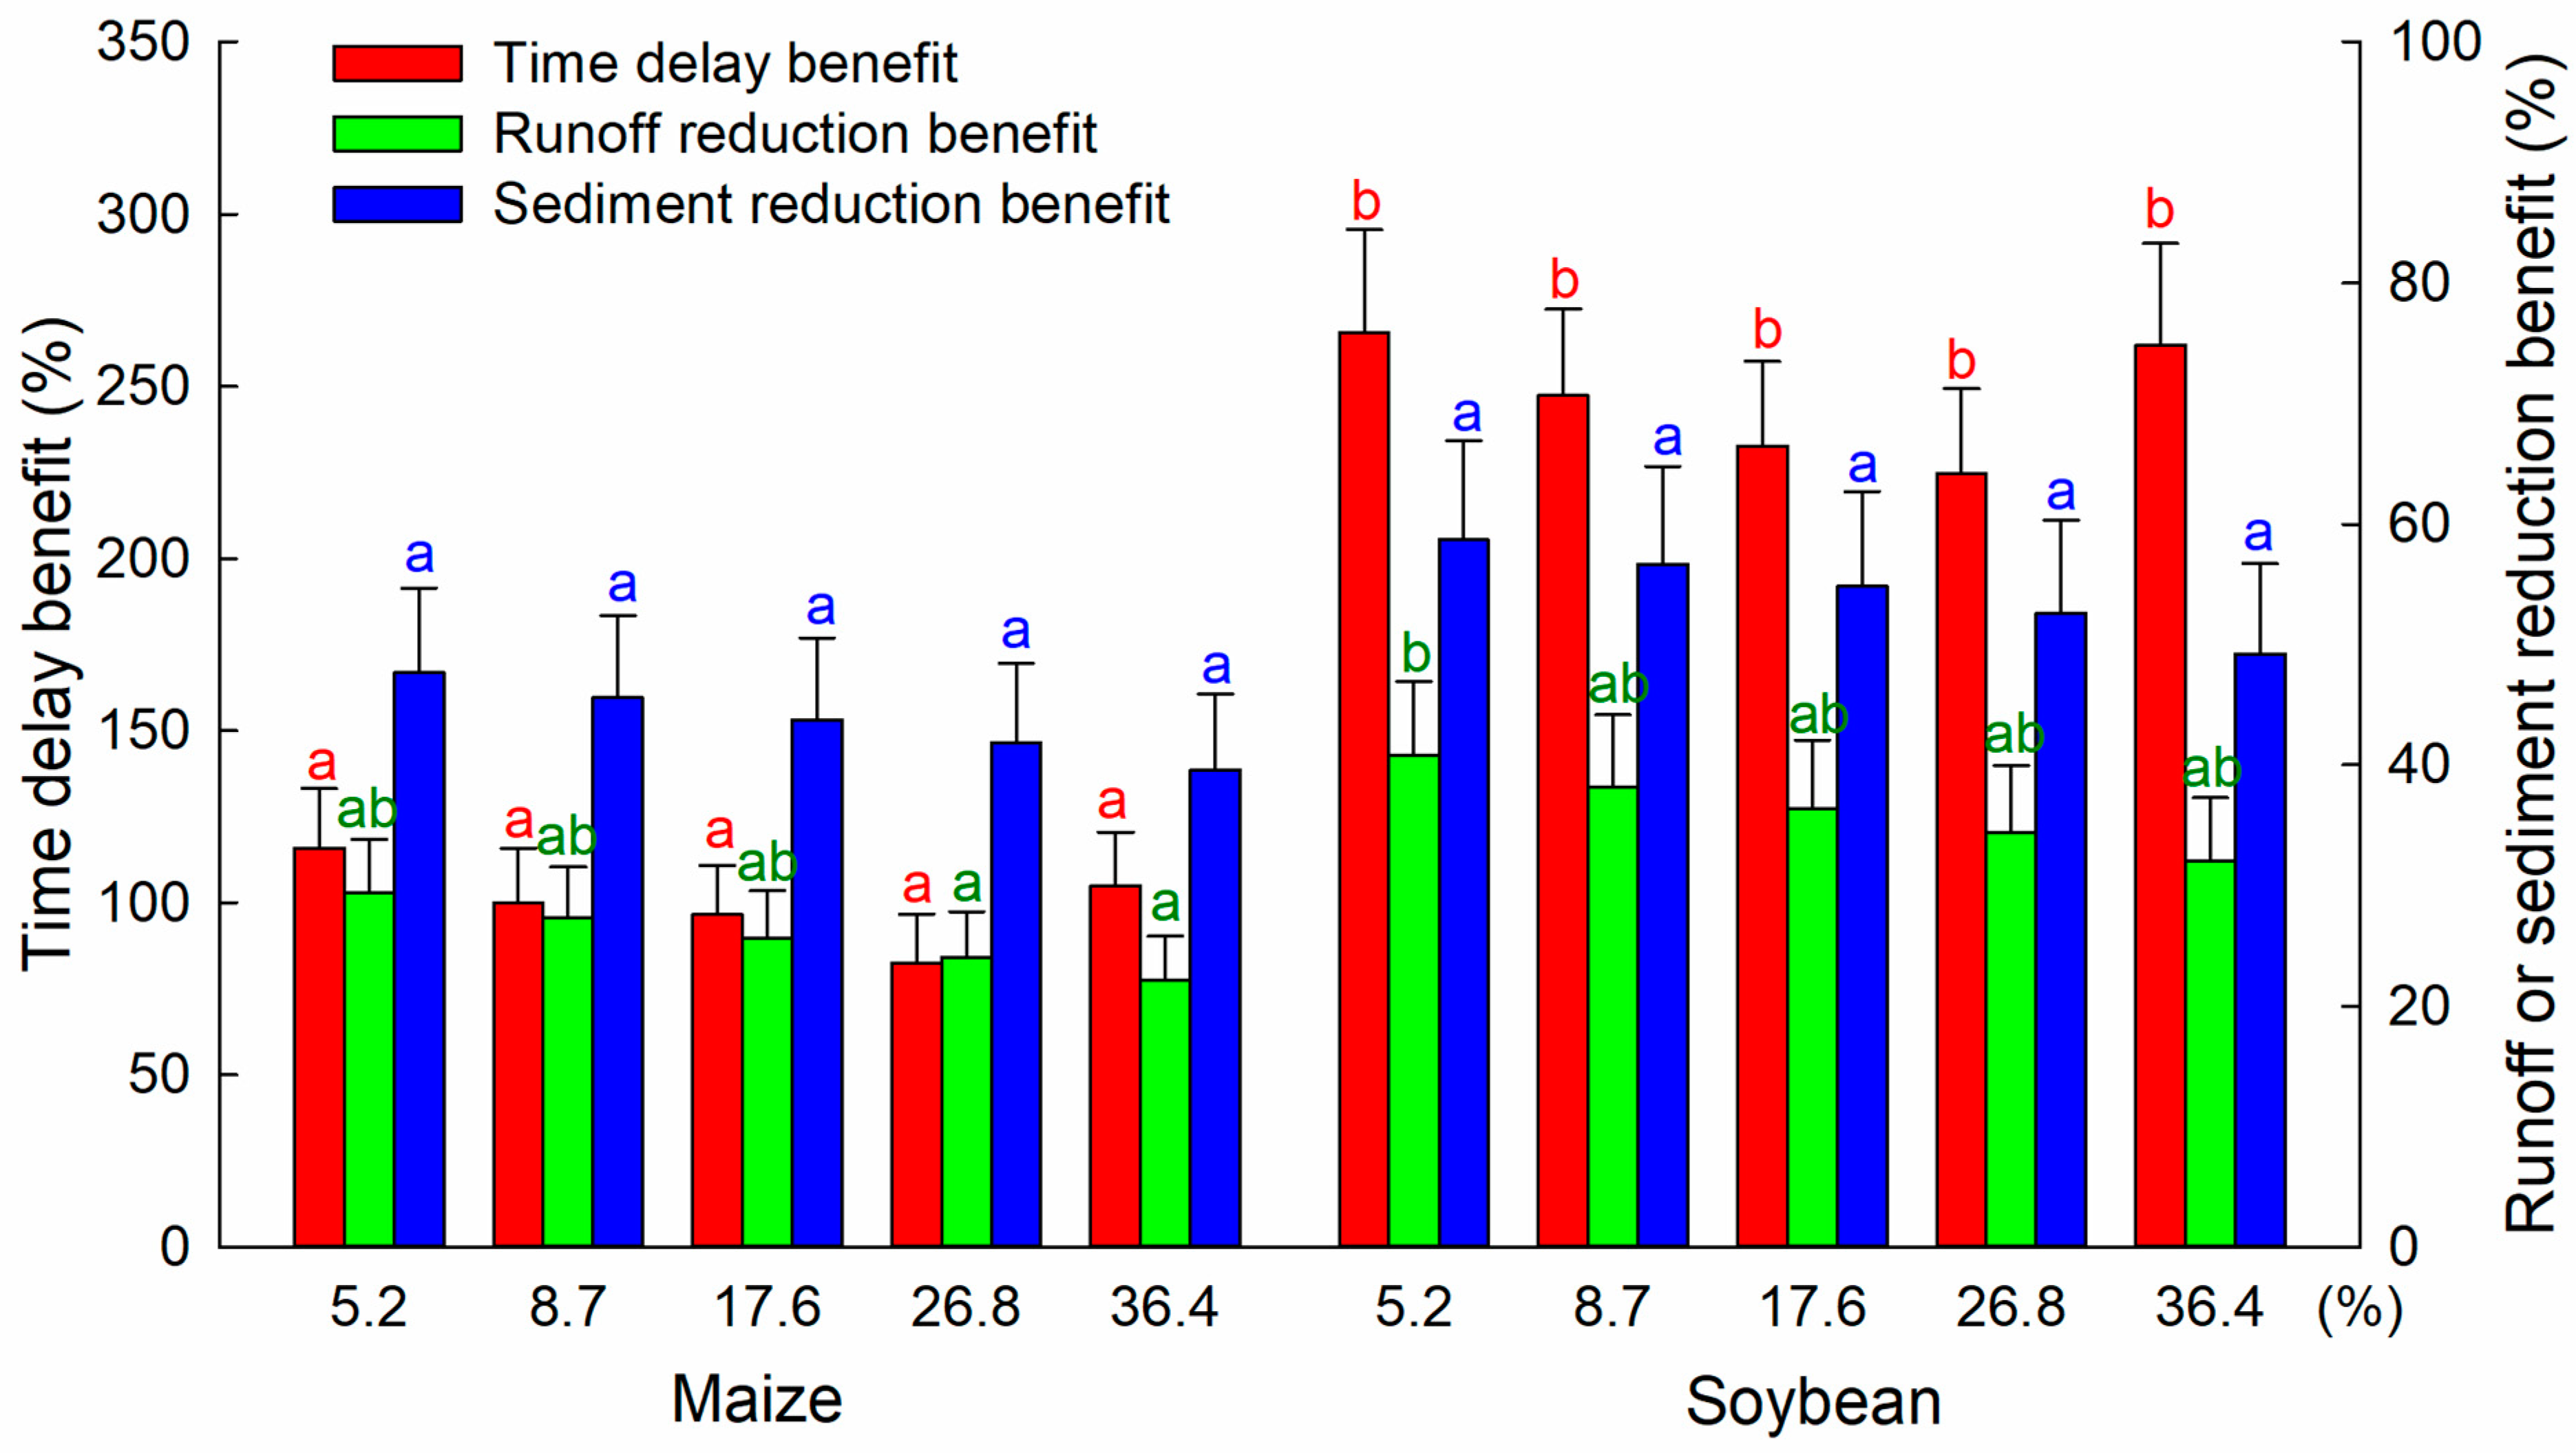
3.2. Soil and Water Conservation Benefits

The TDB, RRB, and SRB all increased significantly (p < 0.05) with the growth of maize and soybean (Figure 5). In the maize plots, the TDB, RRB, and SRB were approximately 4.76-, 5.78-, and 6.12-fold higher at the R2 stage (33.11 ± 4.59, 7.09 ± 0.59, and 11.02 ± 0.61%) than the V3 stage (157.54 ± 5.83, 41.01 ± 1.90, and 67.47 ± 2.10%), respectively. Meanwhile, in the soybean plots, the TDB, RRB, and SRB were approximately 2.78-, 5.60-, and 5.24-fold higher at the R6 stage (345.68 ± 9.85, 58.10 ± 2.35, and 82.19 ± 1.95%) than the V2 stage (124.43 ± 9.32, 10.37 ± 0.97, and 15.69 ± 1.08%), respectively. Comparisons between the two crops revealed that the average TDB, RRB, and SRB of the soybean plots (246.48 ± 11.71, 36.34 ± 2.51, and 54.41 ± 3.42%) were significantly higher (p < 0.05) from the V2 to R6 stage than those of the maize plots (100.06 ± 6.81, 25.71 ± 1.76, and 43.70 ± 2.91%) from the V3 to R2 stage. In addition, the SRB was consistently higher than the RRB at each growth stage for both maize and soybean, with a higher increasing rate of the SRB than the RRB with time.
With an increase in the slope gradient from 5.2 to 36.4%, both the RRB and SRB of maize and soybean showed a downward trend (Figure 6). The TDB of maize and soybean also decreased with increasing slope gradient from 5.2 to 26.8%; however, the value was higher at a slope gradient of 36.4% than 26.8%. When compared between the two crops, the TDB, RRB, and SRB of soybean were all higher than those of maize, but only the difference in the TDB was significant (p < 0.05). In addition, in both the maize and soybean plots, the SRB was always higher than the RRB at each slope gradient.
With an increase in rainfall intensity from 40 to 80 mm h−1, the RRB and SRB of both maize and soybean showed a downward trend (Figure 7). The TDB of soybean also decreased with increasing rainfall intensity, whereas the change in the TDB of maize was limited. Overall, no significant differences in the TBD, RRB, and SRB were found under either rainfall intensity in both the maize and soybean plots. Comparisons between the two crops revealed that the TDB, RRB, and SRB of soybean were all higher than those of maize under both rainfall intensities, with significant differences in the TDB and RRB (p < 0.05). Similarly, in both the maize and soybean plots, the SRB was higher than the RRB under each rainfall intensity.
Based on stepwise multiple regression analysis, the relationships between the dependent (TDB, RRB, and SRB) and independent variables (vegetation coverage, slope gradient, and rainfall intensity) were expressed as linear regression equations (Table 4). According to the regression coefficient values (positive or negative) of the independent variables, the RRB and SRB of both maize and soybean were positively correlated with vegetation coverage and negatively correlated with slope gradient and rainfall intensity. Only the TDB was positively correlated with vegetation coverage. Table 4 also gives the standardized regression equations of each dependent variable. By comparing the absolute SRC value of each independent variable, it was revealed that vegetation coverage was the main factor affecting the TDB, RRB, and SRB of both maize and soybean. That is, the slope gradient and rainfall intensity were less influential than the vegetation coverage.

3.3. Changes of Soil and Water Conservation Benefits

In July, the vegetation coverage of maize was higher than that of soybean during early and mid-growth stages (Figure 8), while in early August the vegetation coverage of maize was very close to that of soybean. However, after mid-August, the vegetation coverage of soybean gradually surpassed that of maize. Due to these differences in vegetation coverage, the RRB and SRB of maize exceeded those of soybean in their early growth stages only (early July). Meanwhile, in the mid- to lategrowth stages, the RRB and SRB of soybean were consistently higher than those of maize, and this difference increased with time. Across the entire growth period, the TDB of soybean was consistently higher than that of maize by approximately 2-fold. With the growth of maize and soybean, the increasing rate of vegetation coverage changed from high to low. A similar trend was also observed in terms of the increasing rates of TDB, RRB, and SRB for both crops. Moreover, the increasing rates of vegetation coverage, TDB, RBB, and SRB with time were consistently higher for soybean than maize.
The TDB, RRB, and SRB of maize and soybean all increased linearly with increasing vegetation coverage (Figure 9). Under the same rate of vegetation coverage, the TDB, RRB, and SRB of soybean were consistently higher than those of maize, and the difference increased with increasing vegetation coverage. Of these three indicators, the TDB showed the greatest difference between maize and soybean, and that of maize was approximately half that of soybean. In addition, the increasing rates of TDB, RRB, and SRB with vegetation coverage were also higher for soybean than for maize.

4. Discussion

4.1. Effects of Maize and Soybean in Regulating Runoff and Sediment

Based on the two-year rainfall simulation experiments, we found that the SRB of both maize and soybean was much higher than that of the RRB under simulated rainfall. This suggests that both crops performed better in terms of reducing sediment than runoff. This finding is also consistent with a study by Zhao et al. [29], which found that the SRB of ryegrass, alfalfa, and spring wheat was much higher than that of the RRB on Loess slopes under simulated rainfall conditions. This phenomenon is mainly due to the lack of a litter layer in farmland, since litter plays an important role in intercepting rainfall, retaining runoff, protecting the soil surface, and increasing rainfall infiltration [19,50]. With field crops such as maize and soybean, the capacity to regulate runoff is mainly realized by canopy interception of rainfall and stem retention of runoff [16]. Studies have also shown that the effect of field crops (e.g., maize, soybean, and wheat) on intercepting rainfall is very limited, usually to less than 2 mm per incident of rainfall and occurring mainly during the early stages of rainfall [51,52]. In addition, low-density crops such as soybean and maize have a much weaker runoff retention capacity than high-density crops such as wheat [35,53]. Moreover, although the growth of field crops could improve the physical and chemical properties of soil, the infiltration capacity of soil is not optimized or maintained due to frequent human disturbance (e.g., tillage and irrigation) and crop replacement [6,26,54,55]. Therefore, the poor performance in reducing runoff is a common problem with most field crops, highlighting the importance of improving this in order to regulate runoff and thereby prevent and control soil erosion on sloping farmland [5].
The average TDB, RRB, and SRB of soybean from stages V2 to R6 were much higher than those of maize from stages V3 to R2, suggesting that under our experimental conditions soybean performed better than maize in regulating runoff and sediment. This result is also consistent with those of Basic et al. [53], who found that soybean was more effective in reducing soil erosion than maize on sloping farmland in central Croatia. However, Laflen and Moldenhauer [56] found that soil losses were greater with soybean than maize in both a maize−soybean rotation and a continuous maize cropping system in Iowa, USA. The main reason for these contrasting results is thought to be the different planting densities employed. In the current study, the planting density of soybean was a little higher than that of maize, and both were higher than the planting densities used by Laflen and Moldenhauer [56]. Crop planting density is therefore a key factor affecting vegetation coverage in the field [34]. Thus, assuming crop yield is unaffected, reasonably close planting could effectively improve the performance of crops in water and soil conservation, thereby reducing soil erosion on sloping farmland [57].
Under similar vegetation coverage, we found that the TDB, RRB, and SRB of soybean were consistently higher than those of maize. In addition, the TDB of soybean was almost 2-fold that of maize throughout growth. These findings suggest that vegetation coverage is not the only factor affecting the performance of crops in regulating runoff and sediment. These differences in the performance of maize and soybean could also be attributed to their distinct morphological structure [58]. For example, the special V-shaped connection structure of the stems and leaves of maize can easily convert rainfall intercepted by the leaves into stemflow, causing a concentration of surface runoff [18]. As revealed by Martello et al. [59], nearly 78% of rainfall is intercepted by maize leaves and converted to stemflow, with only 22% directly hitting the ground. This concentrated surface runoff not only aggravates soil detachment, but also increases the start time of runoff in the field [60]. The height of soybean plants (<1 m) compared to that of maize (2 m) is also influential. For example, the energy of raindrops dropping from maize leaves will be much higher due to the larger falling height, thereby increasing the splash on the surface soil [17]. This can be clarified by examining the difference in slope erosion traces between maize and soybean after simulated rainfall. In the current study, erosion rills running in a downward direction at the base of the maize plants and splash erosion pits between the plants were very common after simulated rainfall, yet this was rarely seen in the soybean plots (Figure 10). Due to its unique morphological structure, maize is inferior to soybean in regulating runoff and sediment, suggesting that soybean is the better choice for planting on sloping farmland prone to soil erosion.

4.2. Factors Affecting the Performance of Maize and Soybean in Conserving Soil and Water

With increasing slope gradient and rainfall intensity, both the RRB and SRB of maize and soybean showed a decreasing trend, suggesting that an increasing slope gradient and rainfall intensity decrease the effectiveness of field crops in reducing soil and water losses in the field. Similar results were found by Shen et al. [61] on maize plots in Northeast China, while Marzen et al. [62] revealed the effect of extreme rainstorms and steep slope conditions on the performance of field crops in conserving soil and water. In the present study, the RRB and SRB of both maize and soybean at a slope gradient of 36.4% and under an 80 mm h−1 rainfall intensity did not significantly differ from those at a gradient of 5.2% and under a 40 mm h−1 rainfall intensity. These findings suggest that both maize and soybean remained effective in reducing runoff and sediment even on steep slopes and under heavy rainfall. We also found that the average TDB of both maize and soybean was higher at a gradient of 36.4% than at gradients of 17.6 and 26.8%. This result indicates that the effects of vegetation in delaying runoff generation are more obvious on steep slopes than gentle slopes. A similar result was reported by Lin et al. [30], who revealed that the effects of wheat in regulating runoff and sediment were more sensitive to vegetation coverage changes on large slope gradients and under high rainfall intensities. Thus, under more extreme conditions (i.e., a steep slope and heavy rainstorms), crops play a more important role in regulating runoff and sediment due to the effects of vegetation coverage [63,64].
Compared with slope gradient and rainfall intensity, vegetation coverage was the main factor affecting the TDB, RRB, and SRB of maize and soybean. Thus, to reduce the negative effects of increasing rainfall intensity and slope gradient on the performance of field crops in regulating runoff and sediment, priority should be given to crops that offer high vegetation coverage [37,65]. A number of studies on natural vegetation have revealed a threshold level of coverage in the relationship between vegetation cover and soil erosion [2,66]. Below this threshold, erosion rates decrease sharply with increasing vegetation coverage, remaining stable and changing only slightly above this threshold [67]. In the present study, the TDB, RRB, and SRB were linearly correlated with vegetation coverage with both maize and soybean, and no threshold coverage was observed. One plausible reason for this is that, unlike natural vegetation such as grass and forest, the effects of field crops in regulating runoff and sediment are mainly dependent on aboveground vegetation in the absence of a litter layer [30]. Moreover, the relatively weak performance of field crops in regulating runoff leads to a failure to prevent soil and water losses, even when the vegetation coverage is higher than 90%. Therefore, while increasing the vegetation coverage of field crops can reduce soil and water losses, this alone will not prevent the occurrence of soil erosion [24].
Overall, field crops alone cannot effectively reduce runoff and sediment on sloping farmland [9]. Additional conservation measures such as tillage practices, planting strategies, and mulching measures are therefore needed to reduce and control soil erosion on sloping farmland [24,68,69]. Tillage practices such as contour furrowing and ridge and reservoir tillage effectively increase soil surface roughness, improve the depression storage capacity, and thereby reduce the field runoff and sediment yield [70,71,72]. Moreover, field management practices aimed at increasing vegetation coverage, such as intercropping, agroforestry, planting of cover crops [31,73], and mulching with plastic film, residue, stubble, and gravel [55,68,74] could also help reduce soil erosion on sloping farmland. However, every issue possesses two sides and correspondingly, imprudent field management practices could yield adverse outcomes. Using contour tillage as a case study, certain researchers have discovered that under specific conditions, such as heavy rainfall and steep slopes, contour tillage may heighten the likelihood of soil erosion. Prior to implementation, we should thoroughly understand the risks and benefits of field management practices. In agricultural production practice, we should make full use of field crops and additional conservation measures to control soil and water losses [24] in order to effectively control serious soil erosion on sloping farmland.

4.3. Crop Selection for Soil and Water Conservation

On the Loess Plateau, soil erosion mainly occurs on sloping farmland because of specific conditions such as the high slope gradient and frequent soil disturbance [4,5,7]. There are three main sources of soil erosion on sloping farmland: soil erosion during the fallow period and crop seedling stage, when no effective vegetation cover exists [28,75]; soil erosion during the planting, growing, and harvesting of field crops, which result in the displacement of soil due to farming activities such as tillage [76], and soil erosion caused by extreme rainfall events [9,77]. Therefore, the key to preventing and controlling soil erosion on sloping farmland is improving land cover during the fallow period and crop seedling stage, reducing soil disturbance during agricultural production, and increasing the ability of field crops to cope with extreme weather [2,26,77].
Field crops are usually the only vegetation cover in the field, thus optimal selection is critical for the control of soil erosion on sloping farmland [29]. In agricultural production, the selection of field crops is often based on historical planting habits, climate conditions, and the economic value, while the performance in soil and water conservation is often ignored [78]. The effects of field crops in regulating runoff and sediment varies among different crop types, mainly due to the resulting vegetation coverage, morphological structure, and root type [16]. In the present study, vegetation coverage was the main factor affecting the performance of maize and soybean in terms of soil and water conservation, suggesting that crops with high vegetation coverage are favorable for erosion control on sloping farmland [79]. According to Zheng et al. [18], the planting of maize can promote the confluence of runoff and increase the amount of splash erosion on sloping farmland due to its unique morphological structure. Meanwhile, De Baets et al. [38] found that cover crops with fine-branched roots are more effective than crops with thick roots in preventing soil losses resulting from concentrated flow erosion. Therefore, when selecting field crops for erosion control, vegetation coverage, morphological structure, and root type should all be taken into consideration [17]. The establishment of a comprehensive index system for evaluating the soil and water conservation capacity of field crops would also be beneficial, aiding crop selection in agricultural production as well as soil erosion control on sloping farmland.
Furthermore, the selection of crops should take into full account the local climate and environmental conditions. On the Loess Plateau, approximately 70% of total cultivable land lies in rain-fed areas, with only 30% of total cultivable land falling in irrigated areas [43]. In rain-fed areas, which tend to be mountainous or hilly, monoculture cropping systems are prevalent, and common field crops include spring wheat, spring maize, and spring soybean. Spring wheat is usually planted in late March and harvested in late July, whereas spring soybean and maize are planted in late April or early May and harvested in late September or early October [80]. In irrigated areas, which tend to consist of flat terrain or riverside regions, the main cropping system is winter wheat−summer maize rotation or winter wheat−summer soybean rotation. Winter wheat is usually planted in mid-October and harvested in early June the following year, while summer maize and summer soybean are usually sown in mid-June and harvested in early October [30]. Because the growth period of maize and soybean cover the rainy season in the Loess Plateau region, these two crops play a more important role in soil erosion control than wheat. In addition, as shown here, soybean performed better than maize in regulating runoff and sediment, especially in terms of delaying runoff generation. Therefore, soybean is more suitable for planting on sloping farmland in the Loess plateau region from the perspectives of soil and water conservation.

4.4. Future Studies

In this study, we investigated the effects of maize and soybean in regulating runoff and sediment, attributing their capacity to conserve soil and water to the high rates of vegetation coverage in mid- to late growth. However, we did not consider the role of underground roots. It is worth noting that reductions in soil erosion result from the combined effects of aboveground vegetation and underground roots [21,36,38]. For example, Gyssels et al. [81] revealed that plant roots are as important as vegetation cover in terms of rill and ephemeral gully erosion. In the future, crop roots therefore need to be taken as an independent indicator, and the effects of aboveground vegetation and underground roots on soil erosion evaluated separately and in combination.
In addition, future research should focus on the comprehensive effects of field crops and field management practices on soil erosion. Compared with forest and grass, field crops are less effective in regulating runoff due to the lack of a litter layer in farmland [24]. Improving the effects of field crops on regulating runoff is critical to controlling soil erosion on sloping farmland. Specific field management practices such as tillage (e.g., reservoir tillage and furrow-ridge tillage), planting (e.g., intercropping and agroforestry), and mulching (e.g., residue and stubble) should therefore be combined in the management of runoff volume and increased rainfall infiltration [24,69,74]. Taking maize and soybean as examples, their effects on regulating runoff and sediment were limited in the early growth stage, when wheat stubble from the preceding crop could play an important role. Wheat stubble itself was found to reduce runoff by 35.7% and sediment by 68.2% [30]. Therefore, exploring the anti-erosion mechanisms of field crops under specific field management practices is necessary for the prevention and control of soil erosion on sloping farmland.
To ensure the ideal experimental conditions, this study was carried out on small runoff plots (4 × 1 m) under artificial simulated rainfall conditions, and no tillage or irrigation practices were applied during crop growth. The growing environment of crops in the field is more complex and diverse, and the dominant soil erosion processes on a larger scale may differ from those on small runoff plots [70,82]. Meanwhile, there are certain differences between simulated rainfall and natural rainfall in terms of rainfall type, rainfall energy, and raindrop spectrum (i.e., raindrop size distribution raindrop size) [83]. Thus, the results of the current study need to be validated on a larger spatial scale. Additionally, in this study, the experiments with maize and soybean were carried out in two different years, and variations in climate conditions and soil structure could have potentially influenced the outcomes of these experiments. However, despite the limitations, the results of this study enhance our understanding of the performance of maize and soybean in conserving soil and water under different slope gradients and rainfall intensities. The experimental data will help guide the selection of field crops for soil erosion control on sloping farmland, highlighting the need to consider their performance in regulating runoff and sediment. Yet, more work is needed to optimize field management practices in agricultural production in order to prevent soil erosion and promote sustainable agriculture worldwide.

5. Conclusions

In this study, maize and soybean effectively delayed runoff generation, increased initial rainfall losses, and reduced soil and water losses compared with bare ground; however, their performance was weakened by an increasing slope gradient and rainfall intensity. Compared with the slope gradient and rainfall intensity, vegetation coverage was a more important factor affecting the performance of maize and soybean in runoff and sediment conservation. Due to its distinct morphological structure, soybean performed better than maize, especially in delaying runoff generation. Moreover, the increasing rates of vegetation coverage and the TDB, RBB, and SRB of soybean with time were consistently higher than those of maize. Meanwhile, the SRB of both maize and soybean were consistently higher than the RRB. Compared with natural vegetation, the relatively weak runoff regulation ability of maize and soybean is an important factor limiting their performance in soil and water conservation. However, proper field management practices such as tillage, planting, and mulching could effectively remedy this deficiency. Our findings suggest that soybean is a better choice than maize for planting on sloping farmland that is prone to soil erosion. Soybean provides more rapid protection of the soil surface, thereby controlling the occurrence of soil erosion more effectively. More work is needed to fully understand the anti-erosion mechanisms of field crops, combined with field management practices, in order to optimize soil and water conservation on sloping farmland in the Loess Plateau region.

Author Contributions

Data curation, methodology, formal analysis, software, visualization, writing—original draft, Q.X.; funding acquisition, investigation, project administration, resources, writing—review & editing, Q.L.; supervision, funding acquisition, writing—review & editing, validation, F.W. All authors have read and agreed to the published version of the manuscript.

Funding

This research was funded by This work was supported by the Science and technology innovation fund of Shanxi Agricultural University (Grant No. 2020BQ54), the Award for Excellent Doctoral to work in Shanxi (Grant No. SXBYKY2021006), the Science and Technology Innovation Project of Shanxi Higher Education (Grant No. 2021L139), and the National Natural Science Foundation of China (Grant No. 41977065).

Data Availability Statement

The raw data are not publicly available due to the privacy and continuity of this research.

Acknowledgments

We would like to thank undergraduates Yue Liang, Chen Xie, Xianju Yu and Bo Li for their help during this experiment.

Conflicts of Interest

The authors declare no conflict of interest.

References

  1. Cerdà, A.; Flanagan, D.C.; le Bissonnais, Y.; Boardman, J. Soil Erosion and Agriculture. Soil Tillage Res. 2009, 106, 107–108. [Google Scholar] [CrossRef]
  2. Chen, J.; Xiao, H.; Li, Z.; Liu, C.; Wang, D.; Wang, L.; Tang, C. Threshold Effects of Vegetation Coverage on Soil Erosion Control in Small Watersheds of the Red Soil Hilly Region in China. Ecol. Eng. 2019, 132, 109–114. [Google Scholar] [CrossRef]
  3. Prosdocimi, M.; Cerdà, A.; Tarolli, P. Soil Water Erosion on Mediterranean Vineyards: A Review. Catena 2016, 141, 1–21. [Google Scholar] [CrossRef]
  4. Espigares, T.; Moreno-de las Heras, M.; Nicolau, J.M. Performance of Vegetation in Reclaimed Slopes Affected by Soil Erosion. Restor. Ecol. 2011, 19, 35–44. [Google Scholar] [CrossRef]
  5. Liu, X.; Zhang, S.; Zhang, X.; Ding, G.; Cruse, R.M. Soil Erosion Control Practices in Northeast China: A Mini-Review. Soil Tillage Res. 2011, 117, 44–48. [Google Scholar] [CrossRef]
  6. Rodrigo Comino, J.; Quiquerez, A.; Follain, S.; Raclot, D.; Le Bissonnais, Y.; Casalí, J.; Giménez, R.; Cerdà, A.; Keesstra, S.D.; Brevik, E.C.; et al. Soil Erosion in Sloping Vineyards Assessed by Using Botanical Indicators and Sediment Collectors in the Ruwer-Mosel Valley. Agric. Ecosyst. Environ. 2016, 233, 158–170. [Google Scholar] [CrossRef]
  7. Chalise, D.; Kumar, L.; Kristiansen, P. Land Degradation by Soil Erosion in Nepal: A Review. Soil Syst. 2019, 3, 12. [Google Scholar] [CrossRef]
  8. Lal, R. Soil Degradation by Erosion. Land Degrad. Dev. 2001, 12, 519–539. [Google Scholar] [CrossRef]
  9. Rutebuka, J.; Kagabo, D.M.; Verdoodt, A. Farmers’ Diagnosis of Current Soil Erosion Status and Control within Two Contrasting Agro-Ecological Zones of Rwanda. Agric. Ecosyst. Environ. 2019, 278, 81–95. [Google Scholar] [CrossRef]
  10. Wang, Z.; Chen, Z.; Yu, S.; Zhang, Q.; Wang, Y.; Hao, J. Erosion-Control Mechanism of Sediment Check Dams on the Loess Plateau. Int. J. Sediment Res. 2021, 36, 668–677. [Google Scholar] [CrossRef]
  11. Zhou, D.; Zhao, S.; Zhu, C. The Grain for Green Project Induced Land Cover Change in the Loess Plateau: A Case Study with Ansai County, Shanxi Province, China. Ecol. Indic. 2012, 23, 88–94. [Google Scholar] [CrossRef]
  12. Deng, L.; Kim, D.-G.; Li, M.; Huang, C.; Liu, Q.; Cheng, M.; Shangguan, Z.; Peng, C. Land-Use Changes Driven by ‘Grain for Green’ Program Reduced Carbon Loss Induced by Soil Erosion on the Loess Plateau of China. Glob. Planet. Chang. 2019, 177, 101–115. [Google Scholar] [CrossRef]
  13. Chen, Y.; Wang, K.; Lin, Y.; Shi, W.; Song, Y.; He, X. Balancing Green and Grain Trade. Nat. Geosci. 2015, 8, 739–741. [Google Scholar] [CrossRef]
  14. He, L.; Guo, J.; Zhang, X.; Liu, B.; Guzmán, G.; Gómeza, J.A. Vegetation Restoration Dominated the Attenuated Soil Loss Rate on the Loess Plateau, China over the Last 50 Years. Catena 2023, 228, 107149. [Google Scholar] [CrossRef]
  15. Wang, X.; Wang, B.; Xu, X.; Liu, T.; Duan, Y.; Zhao, Y. Spatial and Temporal Variations in Surface Soil Moisture and Vegetation Cover in the Loess Plateau from 2000 to 2015. Ecol. Indic. 2018, 95, 320–330. [Google Scholar] [CrossRef]
  16. Durán Zuazo, V.H.; Rodríguez Pleguezuelo, C.R. Soil-Erosion and Runoff Prevention by Plant Covers. A Review. Agron. Sustain. Dev. 2008, 28, 65–86. [Google Scholar] [CrossRef]
  17. Lacombe, G.; Valentin, C.; Sounyafong, P.; de Rouw, A.; Soulileuth, B.; Silvera, N.; Pierret, A.; Sengtaheuanghoung, O.; Ribolzi, O. Linking Crop Structure, Throughfall, Soil Surface Conditions, Runoff and Soil Detachment: 10 Land Uses Analyzed in Northern Laos. Sci. Total Environ. 2018, 616–617, 1330–1338. [Google Scholar] [CrossRef] [PubMed]
  18. Zheng, J.; Fan, J.; Zhang, F.; Yan, S.; Xiang, Y. Rainfall Partitioning into Throughfall, Stemflow and Interception Loss by Maize Canopy on the Semi-Arid Loess Plateau of China. Agric. Water Manag. 2018, 195, 25–36. [Google Scholar] [CrossRef]
  19. Sun, J.; Yu, X.; Li, H.; Chang, Y.; Wang, H.; Tu, Z.; Liang, H. Simulated Erosion Using Soils from Vegetated Slopes in the Jiufeng Mountains, China. Catena 2016, 136, 128–134. [Google Scholar] [CrossRef]
  20. Wells, T.; Hancock, G.R.; Martinez, C.; Dever, C.; Kunkel, V.; Gibson, A. Differences in Soil Organic Carbon and Soil Erosion for Native Pasture and Minimum till Agricultural Management Systems. Sci. Total Environ. 2019, 666, 618–630. [Google Scholar] [CrossRef]
  21. Zhang, B.; Zhang, G.; Zhu, P.; Yang, H. Temporal Variations in Soil Erodibility Indicators of Vegetation-Restored Steep Gully Slopes on the Loess Plateau of China. Agric. Ecosyst. Environ. 2019, 286, 106661. [Google Scholar] [CrossRef]
  22. De Baets, S.; Poesen, J.; Knapen, A.; Barberá, G.G.; Navarro, J.A. Root Characteristics of Representative Mediterranean Plant Species and Their Erosion-Reducing Potential during Concentrated Runoff. Plant Soil 2007, 294, 169–183. [Google Scholar] [CrossRef]
  23. Vannoppen, W.; Vanmaercke, M.; De Baets, S.; Poesen, J. A Review of the Mechanical Effects of Plant Roots on Concentrated Flow Erosion Rates. Earth-Sci. Rev. 2015, 150, 666–678. [Google Scholar] [CrossRef]
  24. Arnhold, S.; Lindner, S.; Lee, B.; Martin, E.; Kettering, J.; Nguyen, T.T.; Koellner, T.; Ok, Y.S.; Huwe, B. Conventional and Organic Farming: Soil Erosion and Conservation Potential for Row Crop Cultivation. Geoderma 2014, 219–220, 89–105. [Google Scholar] [CrossRef]
  25. El Kateb, H.; Zhang, H.; Zhang, P.; Mosandl, R. Soil Erosion and Surface Runoff on Different Vegetation Covers and Slope Gradients: A Field Experiment in Southern Shaanxi Province, China. Catena 2013, 105, 1–10. [Google Scholar] [CrossRef]
  26. Alliaume, F.; Rossing, W.A.H.; Tittonell, P.; Jorge, G.; Dogliotti, S. Reduced Tillage and Cover Crops Improve Water Capture and Reduce Erosion of Fine Textured Soils in Raised Bed Tomato Systems. Agric. Ecosyst. Environ. 2014, 183, 127–137. [Google Scholar] [CrossRef]
  27. Chen, Z.; Wang, L.; Wei, A.; Gao, J.; Lu, Y.; Zhou, J. Land-Use Change from Arable Lands to Orchards Reduced Soil Erosion and Increased Nutrient Loss in a Small Catchment. Sci. Total Environ. 2019, 648, 1097–1104. [Google Scholar] [CrossRef]
  28. Rong, L.; Duan, X.; Zhang, G.; Gu, Z.; Feng, D. Impacts of Tillage Practices on Ephemeral Gully Erosion in a Dry-Hot Valley Region in Southwestern China. Soil Tillage Res. 2019, 187, 72–84. [Google Scholar] [CrossRef]
  29. Zhao, X.; Huang, J.; Wu, P.; Gao, X. The Dynamic Effects of Pastures and Crop on Runoff and Sediments Reduction at Loess Slopes under Simulated Rainfall Conditions. Catena 2014, 119, 1–7. [Google Scholar] [CrossRef]
  30. Lin, Q.; Xu, Q.; Wu, F.; Li, T. Effects of Wheat in Regulating Runoff and Sediment on Different Slope Gradients and under Different Rainfall Intensities. Catena 2019, 183, 104196. [Google Scholar] [CrossRef]
  31. Sharma, N.K.; Singh, R.J.; Mandal, D.; Kumar, A.; Alam, N.M.; Keesstra, S. Increasing Farmer’s Income and Reducing Soil Erosion Using Intercropping in Rainfed Maize-Wheat Rotation of Himalaya, India. Agric. Ecosyst. Environ. 2017, 247, 43–53. [Google Scholar] [CrossRef]
  32. Ruiz-Colmenero, M.; Bienes, R.; Marques, M.J. Soil and Water Conservation Dilemmas Associated with the Use of Green Cover in Steep Vineyards. Soil Tillage Res. 2011, 117, 211–223. [Google Scholar] [CrossRef]
  33. Novara, A.; Cerdà, A.; Gristina, L. Sustainable Vineyard Floor Management: An Equilibrium between Water Consumption and Soil Conservation. Curr. Opin. Environ. Sci. Health 2018, 5, 33–37. [Google Scholar] [CrossRef]
  34. Zheng, J.; Fan, J.; Zhang, F.; Yan, S.; Guo, J.; Chen, D.; Li, Z. Mulching Mode and Planting Density Affect Canopy Interception Loss of Rainfall and Water Use Efficiency of Dryland Maize on the Loess Plateau of China. J. Arid Land 2018, 10, 794–808. [Google Scholar] [CrossRef]
  35. Basic, F.; Kisic, I.; Butorac, A.; Nestroy, O.; Mesic, M. Runoff and Soil Loss under Different Tillage Methods on Stagnic Luvisols in Central Croatia. Soil Tillage Res. 2001, 62, 145–151. [Google Scholar] [CrossRef]
  36. Quijano-Baron, J.; Saco, P.M.; Rodriguez, J.F. Modelling the Effects of above and Belowground Biomass Pools on Erosion Dynamics. CATENA 2022, 213, 106123. [Google Scholar] [CrossRef]
  37. Aziz, S.; Islam, M.S. Erosion and Runoff Reduction Potential of Vetiver Grass for Hill Slopes: A Physical Model Study. Int. J. Sediment Res. 2023, 38, 49–65. [Google Scholar] [CrossRef]
  38. De Baets, S.; Poesen, J.; Meersmans, J.; Serlet, L. Cover Crops and Their Erosion-Reducing Effects during Concentrated Flow Erosion. Catena 2011, 85, 237–244. [Google Scholar] [CrossRef]
  39. Kuhwald, M.; Busche, F.; Saggau, P.; Duttmann, R. Is Soil Loss Due to Crop Harvesting the Most Disregarded Soil Erosion Process? A Review of Harvest Erosion. Soil Tillage Res. 2022, 215, 105213. [Google Scholar] [CrossRef]
  40. Ochoa, P.A.; Fries, A.; Mejía, D.; Burneo, J.I.; Ruíz-Sinoga, J.D.; Cerdà, A. Effects of Climate, Land Cover and Topography on Soil Erosion Risk in a Semiarid Basin of the Andes. Catena 2016, 140, 31–42. [Google Scholar] [CrossRef]
  41. Fu, B.; Wang, S.; Liu, Y.; Liu, J.; Liang, W.; Miao, C. Hydrogeomorphic Ecosystem Responses to Natural and Anthropogenic Changes in the Loess Plateau of China. Annu. Rev. Earth Planet. Sci. 2017, 45, 223–243. [Google Scholar] [CrossRef]
  42. Bai, L.; Wang, N.; Jiao, J.; Chen, Y.; Tang, B.; Wang, H.; Chen, Y.; Yan, X.; Wang, Z. Soil Erosion and Sediment Interception by Check Dams in a Watershed for an Extreme Rainstorm on the Loess Plateau, China. Int. J. Sediment Res. 2020, 35, 408–416. [Google Scholar] [CrossRef]
  43. Zheng, F.; Wang, B. Soil Erosion in the Loess Plateau Region of China. In Restoration and Development of the Degraded Loess Plateau, China; Springer: Tokyo, Japan, 2014; pp. 77–92. [Google Scholar]
  44. Fu, B. Soil Erosion and Its Control in the Loess Plateau of China. Soil Use Manag. 1989, 5, 76–82. [Google Scholar] [CrossRef]
  45. IUSS Working Group. WRB World Reference Base for Soil Resources 2014, Update 2015. International Soil Classification System for Naming Soils and Creating Legends for Soil Maps. World Soil Resource; Reports No. 106; FAO: Rome, Italy, 2015. [Google Scholar]
  46. Christiansen, J.E. The Uniformity of Application of Water by Sprinkler Systems. Agric. Eng. 1941, 22, 89–92. [Google Scholar]
  47. Mcwilliams, D.A.; Berglund, D.R.; Endres, G.J. Corn Growth and Management Quick Guide; North Dakota State University: Fargo, ND, USA, 1999; Volume A-1173. [Google Scholar]
  48. McWilliams, D.A.; Berglund, D.R.; Endres, G.J. Soybean Growth and Management Quick Guide; North Dakota State University: Fargo, ND, USA, 1999; Volume A-1174. [Google Scholar]
  49. Thayer, J.D. Interpretation of Standardized Regression Coefficients in Multiple Regression. In Proceedings of the Annual Meeting of the American Educational Research Association, Chicago, IL, USA, 3–7 April 1991. [Google Scholar]
  50. Sun, L.; Zhang, G.H.; Liu, F.; Luan, L.L. Effects of Incorporated Plant Litter on Soil Resistance to Flowing Water Erosion in the Loess Plateau of China. Biosyst. Eng. 2016, 147, 238–247. [Google Scholar] [CrossRef]
  51. Kang, Y.; Wang, Q.-G.; Liu, H.-J. Winter Wheat Canopy Interception and Its Influence Factors under Sprinkler Irrigation. Agric. Water Manag. 2005, 74, 189–199. [Google Scholar] [CrossRef]
  52. Ma, B.; Gale, W.J.J.; Ma, F.; Wu, F.Q.; Li, Z.B.; Wang, J. Transformation of Rainfall by a Soybean Canopy. Trans. ASABE 2013, 56, 1285–1293. [Google Scholar] [CrossRef]
  53. Basic, F.; Kisic, I.; Mesic, M.; Nestroy, O.; Butorac, A. Tillage and Crop Management Effects on Soil Erosion in Central Croatia. Soil Tillage Res. 2004, 78, 197–206. [Google Scholar] [CrossRef]
  54. Hamza, M.A.; Anderson, W.K. Soil Compaction in Cropping Systems. Soil Tillage Res. 2005, 82, 121–145. [Google Scholar] [CrossRef]
  55. Mhazo, N.; Chivenge, P.; Chaplot, V. Tillage Impact on Soil Erosion by Water: Discrepancies Due to Climate and Soil Characteristics. Agric. Ecosyst. Environ. 2016, 230, 231–241. [Google Scholar] [CrossRef]
  56. Laflen, J.M.; Moldenhauer, W.C. Soil and Water Losses from Corn-Soybean Rotations. Soil Sci. Soc. Am. J. 1979, 43, 1213–1215. [Google Scholar] [CrossRef]
  57. Zhou, P.; Luukkanen, O.; Tokola, T.; Nieminen, J. Effect of Vegetation Cover on Soil Erosion in a Mountainous Watershed. Catena 2008, 75, 319–325. [Google Scholar] [CrossRef]
  58. Burylo, M.; Rey, F.; Bochet, E.; Dutoit, T. Plant Functional Traits and Species Ability for Sediment Retention during Concentrated Flow Erosion. Plant Soil 2012, 353, 135–144. [Google Scholar] [CrossRef]
  59. Martello, M.; Ferro, N.; Bortolini, L.; Morari, F. Effect of Incident Rainfall Redistribution by Maize Canopy on Soil Moisture at the Crop Row Scale. Water 2015, 7, 2254–2271. [Google Scholar] [CrossRef]
  60. Liu, H.; Zhang, R.; Zhang, L.; Wang, X.; Li, Y.; Huang, G. Stemflow of Water on Maize and Its Influencing Factors. Agric. Water Manag. 2015, 158, 35–41. [Google Scholar] [CrossRef]
  61. Shen, H.; He, Y.; Hu, W.; Geng, S.; Han, X.; Zhao, Z.; Li, H. The Temporal Evolution of Soil Erosion for Corn and Fallow Hillslopes in the Typical Mollisol Region of Northeast China. Soil Tillage Res. 2019, 186, 200–205. [Google Scholar] [CrossRef]
  62. Marzen, M.; Iserloh, T.; de Lima, J.L.M.P.; Fister, W.; Ries, J.B. Impact of Severe Rain Storms on Soil Erosion: Experimental Evaluation of Wind-Driven Rain and Its Implications for Natural Hazard Management. Sci. Total Environ. 2017, 590–591, 502–513. [Google Scholar] [CrossRef] [PubMed]
  63. Wang, Z.-J.; Jiao, J.; Rayburg, S.; Wang, Q.; Su, Y. Soil Erosion Resistance of “Grain for Green” Vegetation Types under Extreme Rainfall Conditions on the Loess Plateau, China. Catena 2016, 141, 109–116. [Google Scholar] [CrossRef]
  64. Wu, W.; Chen, G.; Meng, T.; Li, C.; Feng, H.; Si, B.; Siddique, K.H.M. Effect of Different Vegetation Restoration on Soil Properties in the Semi-Arid Loess Plateau of China. Catena 2023, 220, 106630. [Google Scholar] [CrossRef]
  65. Yang, X.; Sun, W.; Li, P.; Mu, X.; Gao, P.; Zhao, G. Reduced Sediment Transport in the Chinese Loess Plateau Due to Climate Change and Human Activities. Sci. Total Environ. 2018, 642, 591–600. [Google Scholar] [CrossRef]
  66. Blanco Sepúlveda, R.; Aguilar Carrillo, A. Soil Erosion and Erosion Thresholds in an Agroforestry System of Coffee (Coffea arabica) and Mixed Shade Trees (Inga spp. and Musa spp.) in Northern Nicaragua. Agric. Ecosyst. Environ. 2015, 210, 25–35. [Google Scholar] [CrossRef]
  67. Jiang, C.; Zhang, H.; Zhang, Z.; Wang, D. Model-Based Assessment Soil Loss by Wind and Water Erosion in China’s Loess Plateau: Dynamic Change, Conservation Effectiveness, and Strategies for Sustainable Restoration. Glob. Planet. Chang. 2019, 172, 396–413. [Google Scholar] [CrossRef]
  68. Barton, A.P.; Fullen, M.A.; Mitchell, D.J.; Hocking, T.J.; Liu, L.; Wu Bo, Z.; Zheng, Y.; Xia, Z.Y. Effects of Soil Conservation Measures on Erosion Rates and Crop Productivity on Subtropical Ultisols in Yunnan Province, China. Agric. Ecosyst. Environ. 2004, 104, 343–357. [Google Scholar] [CrossRef]
  69. van Zelm, R.; van der Velde, M.; Balkovic, J.; Čengić, M.; Elshout, P.M.F.; Koellner, T.; Núñez, M.; Obersteiner, M.; Schmid, E.; Huijbregts, M.A.J. Spatially Explicit Life Cycle Impact Assessment for Soil Erosion from Global Crop Production. Ecosyst. Serv. 2018, 30, 220–227. [Google Scholar] [CrossRef]
  70. Raclot, D.; Le Bissonnais, Y.; Louchart, X.; Andrieux, P.; Moussa, R.; Voltz, M. Soil Tillage and Scale Effects on Erosion from Fields to Catchment in a Mediterranean Vineyard Area. Agric. Ecosyst. Environ. 2009, 134, 201–210. [Google Scholar] [CrossRef]
  71. Liu, Q.J.; Shi, Z.H.; Yu, X.X.; Zhang, H.Y. Influence of Microtopography, Ridge Geometry and Rainfall Intensity on Soil Erosion Induced by Contouring Failure. Soil Tillage Res. 2014, 136, 1–8. [Google Scholar] [CrossRef]
  72. Salem, H.M.; Valero, C.; Muñoz, M.Á.; Gil-Rodríguez, M. Effect of Integrated Reservoir Tillage for In-Situ Rainwater Harvesting and Other Tillage Practices on Soil Physical Properties. Soil Tillage Res. 2015, 151, 50–60. [Google Scholar] [CrossRef]
  73. Odhiambo, H.O.; Ong, C.K.; Deans, J.D.; Wilson, J.; Khan, A.A.H.; Sprent, J.I. Roots, Soil Water and Crop Yield: Tree Crop Interactions in a Semi-Arid Agroforestry System in Kenya. Plant Soil 2001, 235, 221–233. [Google Scholar] [CrossRef]
  74. Prosdocimi, M.; Tarolli, P.; Cerdà, A. Mulching Practices for Reducing Soil Water Erosion: A Review. Earth-Sci. Rev. 2016, 161, 191–203. [Google Scholar] [CrossRef]
  75. Labrière, N.; Locatelli, B.; Laumonier, Y.; Freycon, V.; Bernoux, M. Soil Erosion in the Humid Tropics: A Systematic Quantitative Review. Agric. Ecosyst. Environ. 2015, 203, 127–139. [Google Scholar] [CrossRef]
  76. Oshunsanya, S.O.; Yu, H.; Li, Y. Soil Loss Due to Root Crop Harvesting Increases with Tillage Operations. Soil Tillage Res. 2018, 181, 93–101. [Google Scholar] [CrossRef]
  77. Fu, S.; Yang, Y.; Liu, B.; Liu, H.; Liu, J.; Liu, L.; Li, P. Peak Flow Rate Response to Vegetation and Terraces under Extreme Rainstorms. Agric. Ecosyst. Environ. 2020, 288, 106714. [Google Scholar] [CrossRef]
  78. Duan, L.; Huang, M.; Zhang, L. Differences in Hydrological Responses for Different Vegetation Types on a Steep Slope on the Loess Plateau, China. J. Hydrol. 2016, 537, 356–366. [Google Scholar] [CrossRef]
  79. Chen, H.; Zhang, X.; Abla, M.; Lv, D.; Yan, R.; Ren, Q.; Ren, Z.; Yang, Y.; Zhao, W.; Lin, P.; et al. Effects of Vegetation and Rainfall Types on Surface Runoff and Soil Erosion on Steep Slopes on the Loess Plateau, China. Catena 2018, 170, 141–149. [Google Scholar] [CrossRef]
  80. Huang, Y.; Chen, L.; Fu, B.; Huang, Z.; Gong, J. The Wheat Yields and Water-Use Efficiency in the Loess Plateau: Straw Mulch and Irrigation Effects. Agric. Water Manag. 2005, 72, 209–222. [Google Scholar] [CrossRef]
  81. Gyssels, G.; Poesen, J.; Bochet, E.; Li, Y. Impact of Plant Roots on the Resistance of Soils to Erosion by Water: A Review. Prog. Phys. Geogr. Earth Environ. 2005, 29, 189–217. [Google Scholar] [CrossRef]
  82. Parsons, A.J. How Reliable Are Our Methods for Estimating Soil Erosion by Water? Sci. Total Environ. 2019, 676, 215–221. [Google Scholar] [CrossRef]
  83. Ries, J.B.; Iserloh, T.; Seeger, M.; Gabriels, D. Rainfall Simulations—Constraints, Needs and Challenges for a Future Use in Soil Erosion Research. Z. Fur Geomorphol. Suppl. 2013, 57, 1–10. [Google Scholar] [CrossRef]
Figure 1. The side-spray rainfall simulation system (a) and experimental runoff plots (b) used in this study.
Land 13 01264 g001
Figure 2. Average time to runoff (TR), initial loss of rainfall (ILR), runoff volume (RV), and sediment yield (SY) at different growth stages of maize and soybean. BG denotes bare ground; V3, V6, V9, VT, and R2 denote the third leaf, sixth leaf, ninth leaf, tasseling, and blister stages of maize, respectively; V2, V5, R2, R4 and R6 denote the second trifoliolate, fifth trifoliolate, full bloom, full pod, and full seed stages of soybean, respectively; AVG denotes the average value for all growth stages of maize or soybean. Means of each variable category sharing the same lowercase letter are not significantly different (p > 0.05).
Land 13 01264 g002
Figure 3. Average time to runoff (a), initial loss of rainfall (b), runoff volume (c), and sediment yield (d) on bare ground, maize plots, and soybean plots on different slope gradients. Maize plots feature maize at the third leaf (V3) to blister (R2) stages, and soybean plots feature soybean at the second trifoliolate (V2) to full seed (S11.1) stages. Means sharing the same lowercase letter are not significantly different at the same slope gradients (p > 0.05).
Land 13 01264 g003
Figure 4. Average time to runoff (a), initial loss of rainfall (b), runoff volume (c), and sediment yield (d) on bare ground, maize plots, and soybean plots under different rainfall intensities. Maize plots feature maize at the third leaf (V3) to blister (R2) stages, and soybean plots feature soybean at the second trifoliolate (V2) to full seed (S11.1) stages. Means sharing the same lowercase letter are not significantly different under the same rainfall intensity (p > 0.05).
Land 13 01264 g004
Figure 5. Average time delay benefit (TDB), runoff reduction benefit (RRB), and sediment reduction benefit (SRB) of maize and soybean at different growth stages. V3, V6, V9, VT, and R2 denote the third leaf, sixth leaf, ninth leaf, tasseling, and blister stages of maize, respectively; V2, V5, R2, R4 and R6 respectively denote the second trifoliolate, fifth trifoliolate, full bloom, full pod, and full seed stages of soybean, and AVG denotes the average value for all growth stages of maize or soybean. Means of the same benefit category sharing the same lowercase letter are not significantly different at various growth stages (p > 0.05, Duncan’s multiple range test). Means of the same benefit category sharing the same uppercase letter are not significantly different (p > 0.05).
Land 13 01264 g005
Figure 6. Average time delay benefit (TDB), runoff reduction benefit (RRB), and sediment reduction benefit (SRB) of maize and soybean on different slope gradients. The growth period spans the third leaf (V3) to blister (R2) stages in the maize plots, and the second trifoliolate (V2) to full seed (S11.1) stages in the soybean plots. Means of each benefit category sharing the same lowercase letter are not significantly different under various slope gradients (p > 0.05).
Land 13 01264 g006
Figure 7. Average time delay benefit (TDB), runoff reduction benefit (RRB), and sediment reduction benefit (SRB) of maize and soybean under different rainfall intensities. The growth period spans the third leaf (V3) to blister (R2) stages in the maize plots, and the second trifoliolate (V2) to full seed (S11.1) stages in the soybean plots. Means of each treatment sharing the same lowercase letter are not significantly different under various rainfall intensities (p > 0.05).
Land 13 01264 g007
Figure 8. Changes in vegetation coverage, the time delay benefit (TDB), runoff reduction benefit (RRB), and sediment reduction benefit (SRB) of maize and soybean with time.
Land 13 01264 g008
Figure 9. Changes in the time delay benefit (TDB), runoff reduction benefit (RRB) and sediment reduction benefit (SRB) of maize and soybean with vegetation coverage.
Land 13 01264 g009
Figure 10. Erosion rills found at the base of maize plants (a) and splash erosion pits between plants (b).
Land 13 01264 g010
Table 1. Basic physical and chemical properties of the soil at the study site.
Particle Size Distribution (%)TexturePorositySOMTNTPCEC
2–0.02 mm0.02–0.002 mm<0.002 mm(%)(g kg−1)(g kg−1)(g kg−1)(cmol kg−1)
30.0 ± 0.741.8 ± 0.528.2 ± 0.2Clay loam49.36 ± 3.7013.66 ± 0.580.93 ± 0.030.54 ± 0.0218.31 ± 0.86
Note: SOM, TN, TP, and CEC represent soil organic matter, total nitrogen, total phosphorus, and cation exchange capacity, respectively.
Table 2. Planting, emergence, and harvest dates of maize and soybean, their vegetation coverage, and growth stages selected for artificial simulated rainfall on runoff plots.
VegetationGrowth StageVegetation Coverage (%)Date (Day/Month/Year)
MaizePlanting09 June 2015
Emergence-16 June 2015
Third leaf (V3)16.7 ± 1.42 July 2015 *
Sixth leaf (V6)40.9 ± 1.614 July 2015 *
Ninth leaf (V9)62.1 ± 1.426 July 2015 *
Tasseling (VT)80.3 ± 2.39 August 2015 *
Blister (R2)91.5 ± 2.02 September 2015 *
Harvest-2 October 2015
SoybeanPlanting011 June 2016
Emergence-19 June 2016
Second trifoliolate (V2)20.3 ± 1.58 July 2016 *
Fifth trifoliolate (V5)45.4 ± 1.619 July 2016 *
Full bloom (R2)70.2 ± 1.92 August 2016 *
Full pod (R4)86.9 ± 2.616 August 2016 *
Full seed (R6)97.8 ± 2.11 September 2016 *
Harvest-5 October 2016
Note: - means no vegetation coverage data were collected; * is artificial simulated rainfall time.
Table 3. Nonlinear regression results of time to runoff (TR), initial loss of rainfall (ILR), runoff volume (RV), and sediment yield (SY) using the predictors of slope gradient, rainfall intensity, and vegetation coverage.
VegetationDependent Variablen1n2n3mR2
Bare groundTR0.000−0.226−0.33516.1470.847
ILR0.000−0.2910.6740.3040.911
RV0.0000.2361.0490.2600.998
SY0.0000.9531.1720.4990.991
MaizeTR0.423−0.299−0.3617.9950.961
ILR0.402−0.3260.6410.1540.961
RV−0.2080.2871.1410.2590.988
SY−0.4151.0411.2870.6810.979
SoybeanTR0.425−0.276−0.42415.9500.971
ILR0.453−0.2980.5780.2470.969
RV−0.3560.2981.1940.3200.972
SY−0.6171.0671.3221.0350.966
Note: m, n1, n2, and n3 are fitting parameters, R2 is the goodness of fit.
Table 4. Stepwise multiple regression results of time delay benefit (TDB), runoff reduction benefit (RRB) and sediment reduction benefit (SRB) of maize and soybean using the predictors of vegetation coverage (C), slope gradient (S), and rainfall intensity (I).
VegetationRegression EquationStandardized Regression EquationR2Fp
MaizeTDB = 1.634C + 4.794TDB = 0.924C0.855281.968p < 0.001
RRB = 0.434C − 0.216S − 0.119I + 11.639RRB = 0.947C − 0.201S − 0.192I0.974583.172p < 0.001
SRB = 0.736C − 0.242S − 0.116I + 12.352SRB = 0.975C − 0.137S − 0.114I0.983894.109p < 0.001
SoybeanTDB = 2.736C + 71.057TDB = 0.939C0.882357.894p < 0.001
RRB = 0.598C − 0.257S − 0.173I + 13.252RRB = 0.957C − 0.168S − 0.197I0.983887.377p < 0.001
SRB = 0.832C − 0.282S − 0.150I + 15.386SRB = 0.977C − 0.135S − 0.125I0.9891356.465p < 0.001
Note: R2 is the goodness of fit, F is the significant F-statistic value of the regression equation, p is the probability of the F value, and p < 0.001 indicates the regression equation was highly significant.
Disclaimer/Publisher’s Note: The statements, opinions and data contained in all publications are solely those of the individual author(s) and contributor(s) and not of MDPI and/or the editor(s). MDPI and/or the editor(s) disclaim responsibility for any injury to people or property resulting from any ideas, methods, instructions or products referred to in the content.

