Article

Soil Quality Assessment and Influencing Factors of Different Land Use Types in Red Bed Desertification Regions: A Case Study of Nanxiong, China

1
School of Earth Sciences and Engineering, Sun Yat-Sen University, Zhuhai 519082, China
2
Guangdong Provincial Key Laboratory of Geological Processes & Mineral Resources Survey, Zhuhai 519082, China
3
Natural Resources Bureau of Nanxiong City, Nanxiong 512400, China
4
Guangdong Institute of Environmental Geological Exploration, Guangzhou 510080, China
5
School of Geography and Remote Sensing, Guangzhou University, Guangzhou 510006, China
*
Author to whom correspondence should be addressed.
Land 2024, 13(8), 1265; https://doi.org/10.3390/land13081265
Submission received: 3 July 2024 / Revised: 1 August 2024 / Accepted: 8 August 2024 / Published: 12 August 2024

Abstract

:
Soil environmental issues in the red bed region are increasingly conspicuous, underscoring the critical importance of assessing soil quality for the region’s sustainable development and ecosystem security. This study examines six distinct land use types of soils—agricultural land (AL), woodland (WL), shrubland (SL), grassland (GL), bare rock land (BRL), and red bed erosion land (REL)—in the Nanxiong Basin of northern Guangdong Province. This area typifies red bed desertification in South China. Principal component analysis (PCA) was employed to establish a minimum data set (MDS) for calculating the soil quality index (SQI), evaluating soil quality, analyzing influencing factors, and providing suggestions for ecological restoration in desertification areas. The study findings indicate that a minimal data set comprising soil organic matter (SOM), pH, available phosphorus (AP), exchangeable calcium (Ca2+), and available copper (A-Cu) is most suitable for evaluating soil quality in the red bed desertification areas of the humid region in South China. Additionally, we emphasize that exchangeable salt ions and available trace elements should be pivotal considerations in assessing soil quality within desertification areas. Regarding comprehensive soil quality indicators across various land use types, the red bed erosion soils exhibited the lowest quality, followed by those in bare rock areas and forest land. Within the minimal data set, Ca2+ and pH contributed the most to overall soil quality, underscoring the significance of parent rock mineral composition in the red bed desertification areas. Moreover, the combined effects of SOM, A-Cu, and AP on soil quality indicate that anthropogenic land management and use, including fertilization methods and vegetation types, are crucial factors influencing soil quality. Our research holds significant implications for the scientific assessment, application, and enhancement of soil quality in desertification areas.

1. Introduction

Over the last few decades, salinization and land desertification have grown into serious environmental issues that have an impact on the ability of China’s national economy to develop sustainably. Consequently, the state has made substantial efforts to combat karst rocky desertification, soil erosion on the Loess Plateau, and salinization in the North China Plain [1]. Unfortunately, not enough attention has been paid to land deterioration in the humid red beds of South China thus far. A variety of red continental sedimentary rocks, such as argillaceous, sandstone, siltstone, and conglomerate, make up the red beds. They cover an area of about 8.26 × 10⁵ km2, accounting for 8.61% of the total land area, with 60% distributed in southern China [2].
The soil structure in the red bed area is poor, with rapid weathering and erosion processes. Although the soil formation rate is fast, organic matter accumulation is slow [3]. The parent material is loose, lacking clay and cementation between soil particles. The hot and rainy climate characteristics of southern China exacerbate this situation, causing the soil to be easily washed away by surface runoff. This further reduces vegetation coverage, diminishes the soil’s water conservation function, and leads to severe soil erosion. This phenomenon and process is known as “red beds desertification” [4,5]. The deterioration of soil quality in the red bed desertification area will lead to a decline in the stability of the regional ecosystem and even the loss of agricultural use value. This significantly impedes the ability of the local ecology and socioeconomic sector to develop sustainably. Thus, a scientific assessment of the soil quality in the red bed desertification area is required.
Soil quality is broadly defined as “the capacity of soils to sustain biological productivity, preserve environmental quality, and promote plant and animal health within ecosystems and land-use boundaries” [6]. Since the concept of soil quality was introduced, numerous studies on soil quality assessment and its monitoring tools, including soil quality cards [7], test box methods [8], index methods [9], and multivariate indicator kriging methods, have been rapidly conducted in various countries [10]. Among these, the soil quality index method has become a more commonly used approach in recent years. Researchers have often utilized the soil quality index method to assess the quality of soils within a single land-use type, such as agricultural systems [11], forest systems [12], grassland systems [13], and wetland systems [14].
The soil quality assessment system includes physical, biological, and chemical indicators. Chemical indicators often have significant advantages because they are quantifiable and closely related to plant nutrition, which can indirectly reflect soil physical conditions and microbial quality [15]. Abraham et al. argue that pH determines the nutrient availability and physical conditions of the soil, thereby controlling the diversity of microorganisms in the soil [16]. Additionally, cation exchange capacity (CEC) is a sensitive indicator for determining soil nutrient retention capacity, fertility, and long-term productivity [17]. Nitrogen, phosphorus, and potassium are considered essential soil nutrients because they limit soil productivity by affecting various soil properties, plant growth, and soil microbial activity [18,19,20,21]. Soil organic matter has a multifaceted positive impact on the health and quality of (agricultural) ecosystems, and is therefore recognized as a highly desirable and complex soil variable [22,23]. It is evident from many previous studies that chemical indicators play a vital role in the comprehensive assessment of soil quality.
The extensive selection of measurement metrics often results in significant time and financial costs for sampling and measurement [24]. Therefore, it is essential to reduce the indicators to the smallest possible data set for assessing soil quality [10]. Initially, the selection of the minimum data set (MDS) was typically based on expert judgment [6]. However, more recently, methods such as principal component analysis (PCA), redundancy analysis (RDA) [25], and multiple regression have become more common for data dimensionality reduction.
Although the challenges posed by land desertification in the humid areas of South China have not received equal attention at the national policy level, in recent years, many scholars have begun to recognize the importance of assessing the quality of red bed soils and have conducted extensive research on this topic. These studies have, to varying degrees, addressed gaps in previous land management strategies in red bed desert areas. For example, they have analyzed the soil quality of red soil tillage layers in southern China using clustering and principal component analysis (PCA) [26]. Additionally, they have calculated the soil quality index and soil degradation index for different land use modes in the red bed region of southern China through PCA, investigating the influencing factors [27]. Yan et al. also explored the spatial differentiation of soil moisture and organic matter in the red bed region and identified their influencing factors [1,28,29].
Studies on soil quality in the red beds have primarily focused on single land use types or individual fixed soil attributes, with few addressing the differences in soil quality across various land use types in the red bed region or identifying the main factors affecting soil quality in red bed desertification areas. Therefore, this paper selected six different land use types in a typical red bed desertification area in the Nanxiong Basin, a humid zone in South China, and assessed soil quality by establishing a minimum data set. The objectives of this study were to (i) establish an objective MDS for assessing soil quality in the humid red bed desertification area, (ii) calculate the soil quality index (SQI) and assess soil quality across different land use types in the study area, and (iii) determine the individual contributions of the selected MDS components to soil quality in the study area and analyze their influencing factors. We hope that this study will provide ecological restoration suggestions and improvement directions for the red bed desertification areas in humid regions.

2. Materials and Methods

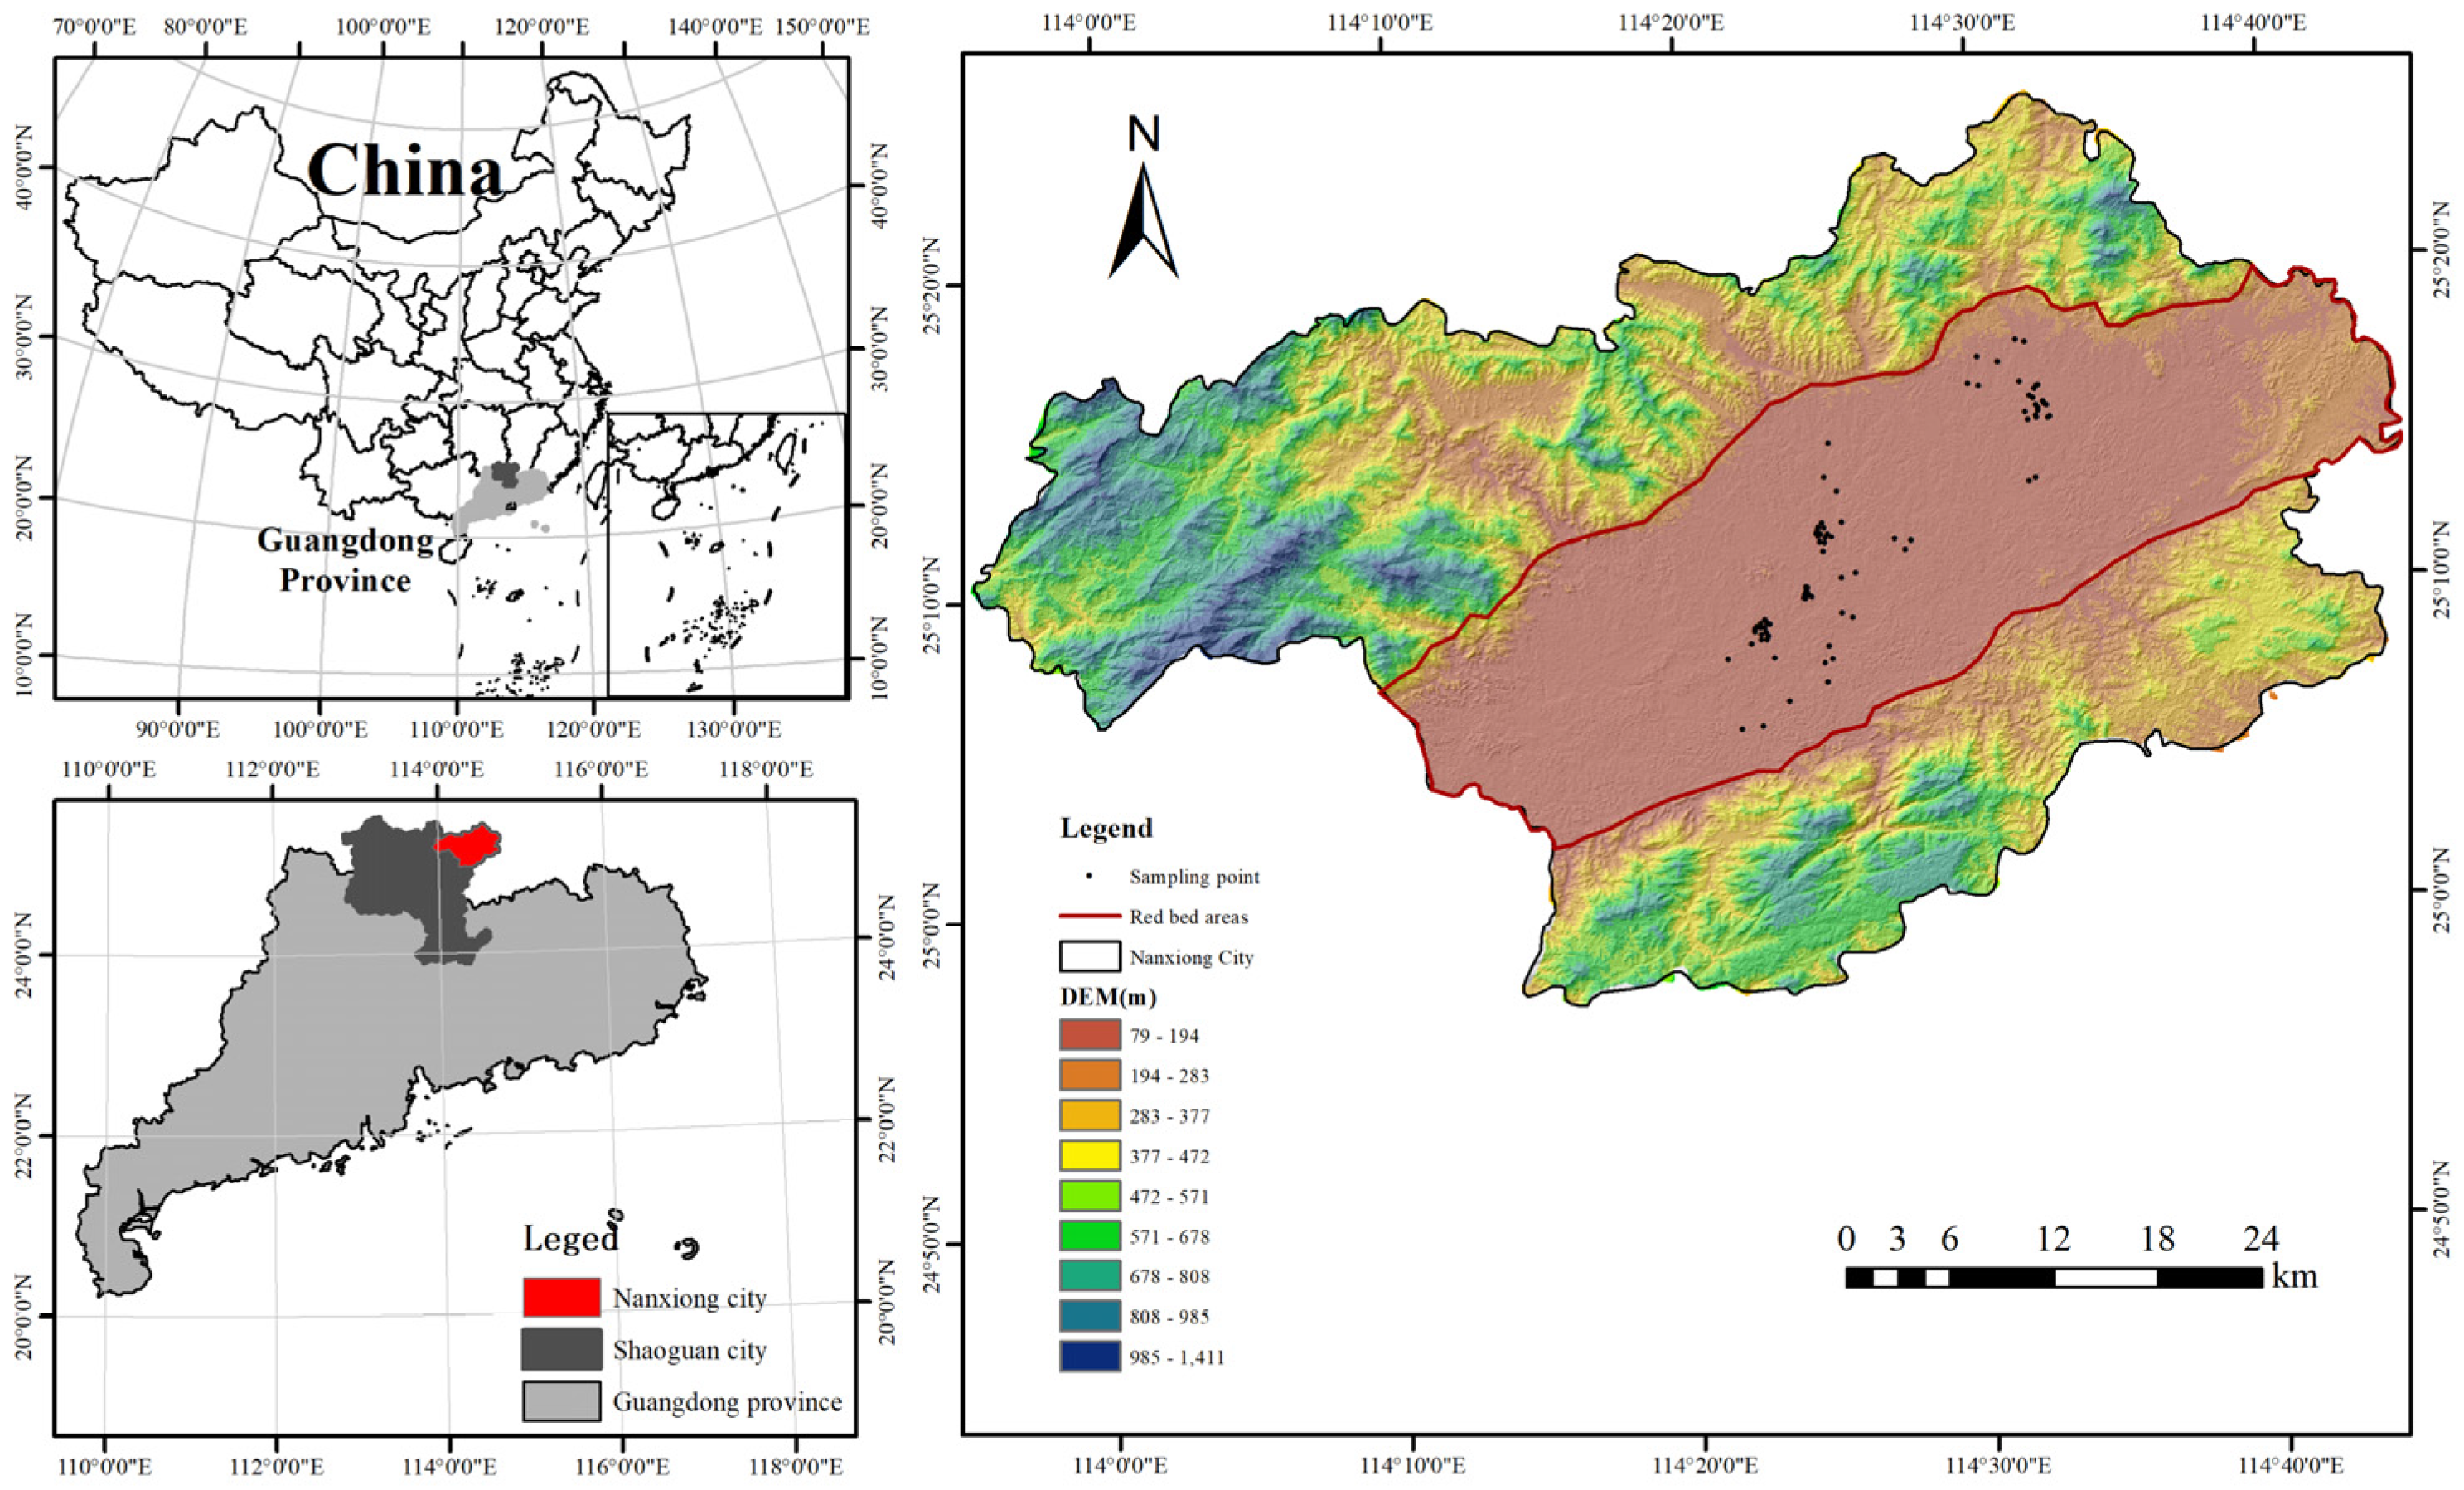
2.1. Overview of the Study Area

The study area is located in Nanxiong City (113°55′−114°44′ E, 24°56′−25°25′ N) in northeastern Guangdong Province, China (Figure 1). Greater heights in the northwest and lower elevations in the southeast define the area’s general terrain. The central part of the area comprises red-layered hills formed from red terrestrial debris accumulated during the Cretaceous and Paleocene periods, creating the long and narrow Nanxiong Basin. The study area has a subtropical monsoon climate, with the northeast monsoon prevailing in winter, and the southwest and southeast monsoons in summer. Winters are short, summers are long, and the average annual temperature is approximately 20.6 °C. Annual rainfall ranges from 900 to 2100 mm, with the period from May to October receiving over 60% of the yearly total. The elevation of the basin varies from 79 to 568 m above sea level. Due to its inland location, low latitude, and distance from the sea, the area is less affected by typhoons. The natural soil in the study area is a calcareous purple soil developed in purplish-red sand shale or argillaceous rock, which is rich in iron ions [30]. This purple soil accumulates organic matter slowly, has poor water retention and drought tolerance, and exhibits high soil temperatures, all of which impose certain limitations on vegetation growth and recovery [4].

2.2. Soil Sample Collection

Six land types have been identified in the Nanxiong Basin, Guangdong Province, a typical red bed desertification area: agricultural land (AL), woodland (WL), shrubland (SL), grassland (GL), bare rock land (BRL), and red bed erosion land (REL), based on the actual land use at the time of sampling. A total of 87 sample plots, each measuring 20 m × 20 m, were selected. Within each plot, three sampling points were established using a random distribution method. A 5 cm diameter soil auger was used to retrieve soil columns (0–10 cm depth) at each sampling location. Due to the high diversity of crops in agricultural land (including vegetables, Nicotiana tabacum, and Chinese herbal medicine) and different tree species in woodland (such as Pinus massoniana, Acacia confusa, Leucaena leucocephala, and mixed forest), additional samples were collected to capture this variability. Specifically, 18 additional soil samples were collected from 6 agricultural land plots, and 12 additional samples were collected from 4 woodland plots. In total, 291 soil samples were gathered. The soil samples, weighing roughly 1.0 kg apiece, were packed into polyethylene bags and sent to the laboratory. Samples were cleaned in the lab to get rid of debris like plant litter and roots, and after that, they were dried and put through a 2 mm mesh screen to measure the physical and chemical characteristics of the soil. The six land types and their characteristics are shown in Table 1.
During the sampling stage, vegetation surveys were conducted concurrently in each sample plot. The typical vegetation types were recorded, and the degree of desertification in the basin was classified into four grades based on the grading method proposed by Shen et al., as detailed in Table 2 below [31].
Eleven physical and chemical characteristics of soil were identified: alkaline hydrolyzable nitrogen (AN), available phosphorus (AP), available potassium (AK), exchangeable calcium (Ca2+), exchangeable magnesium (Mg2+), available copper (A-Cu), available zinc (A-Zn), available iron (A-Fe), pH, soil organic matter (SOM), and soil moisture content (W%).

2.3. Soil Sample Experimental Methods

The determination of soil physicochemical properties was undertaken using the methods mentioned by Lu (1999) as a reference [32]. Briefly, soil organic matter (SOM) was determined using the external heating method with potassium dichromate-concentrated sulfuric acid [33]. Soil pH was measured using the glass electrode method with a water-to-soil ratio of 2.5:1 [34]. Soil moisture content (W%) was determined by drying the sample in an oven at 105 °C [35]. The content of alkaline hydrolyzable nitrogen (AN) was assessed using the alkaline hydrolysis diffusion method. Available phosphorus (AP) was measured through the hydrochloric acid-ammonium fluoride extraction method followed by molybdenum-antimony colorimetry [36]. Available potassium (AK), exchangeable calcium (Ca2+), and exchangeable magnesium (Mg2+) contents were determined using ammonium acetate extraction and measured by Flame Atomic Absorption Spectrophotometrics [37]. Available copper (A-Cu), available zinc (A-Zn), and available iron (A-Fe) were measured using Diethylenetriamine Penta-acetic Acid (DTPA) extraction and Flame Atomic Absorption Spectrophotometrics to evaluate the available trace elements in the soil [38].

2.4. Soil Quality Evaluation Methods

Three phases are usually involved in the soil quality index method: (1) using data reduction to identify relevant soil indicators; (2) scoring the indicators that are chosen; and (3) creating a soil quality index [12,39].
Initially, principal component analysis (PCA) is employed to extract the principal components (PCs) with eigenvalues >1 in order to decrease the dimensionality of the chosen indicators. Groupings of indicators are created when loading factors on a primary component are above 0.5. If an indicator has loadings less than 0.5 on at least two principal components, it will be assigned to the group with the highest loading value. Alternatively, if an indicator has loadings ≥0.5 on multiple principal components, it will be grouped with the component that has a lower correlation with other indicators [40]. Since PCA only considers the loading of an indicator on a single principal component, the Norm value is calculated to prevent the loss of information of the indicator on other principal components with eigenvalues ≥1. The length of the indicator’s vector constant mode in the multidimensional space made up of the principal components is represented by the Norm value. Greater combined loading of the indicator on all principal components is shown by a larger Norm value, which denotes a stronger capacity to comprehend the combined data [41].
N i k = i = 1 k u i k 2 · λ k
where   N i k is the composite loading of each variable in i on the first kth principal components with eigenvalues ≥1; u i k is the loading of each indicator in i on the kth principal component; and λ k is the eigenvalue of the kth principal component.
The indicators in each group whose Norm values fell within 10% of the maximum Norm value in the group were chosen to be included in the minimum data set (MDS) after the Norm values of each indicator within the group were calculated individually. When deciding which indicators to keep in a group, the Pearson correlation coefficient is used. If the correlation coefficient between the indicators is less than 0.5, all of the indicators are kept; if it equals or exceeds 0.5, the indicator with the larger Norm value is selected to be included in the MDS.
The second step involves establishing an affiliation function between the indicators and soil productivity, taking into account the positive and negative effects of the evaluation indicators on soil quality. An S-type affiliation function indicates a positive correlation between the evaluation indicators and soil function within a certain range. An inverse S-type affiliation function indicates a negative correlation. A parabolic function suggests an optimal range of suitability (Table 3). SOM, AN, AP, AK, Ca2+, Mg2+, A-Cu, A-Zn, and A-Fe were positively correlated with the quality of the tillage layer, defined as an S-type affiliation function. W% and pH had an optimal range of appropriateness with the quality of the tillage layer, defined as a parabolic affiliation function.
The common factor variance obtained in the process of principal component analysis can reflect the degree of contribution of the corresponding indicator to the overall variance. The larger its value, the greater the contribution to the overall variance. The weight of each indicator is equal to the proportion of its common factor variance to the sum of the common factor variances of all indicators [43].
Ultimately, the index of soil quality was computed. A higher number denotes greater soil quality. The soil quality index (SQI) incorporates the indices used to evaluate soil quality. The formula is as follows:
S Q I = i = 1 n w i · N i
where w i is the weight of the ith evaluation indicator; N i is the degree of affiliation of the ith evaluation indicator; and n is the number of evaluation indicators.
Using the equidistant division approach, the soil quality of the red beds in the research region was divided into three groups: Class I (0.66 ≤ MDS-SQI < 1), most suitable for vegetation growth; Class II (0.33 ≤ MDS-SQI < 0.66), suitable for crops, albeit with some limitations; Class III (MDS-SQI < 0.33), characterized by serious limitations on vegetation growth.

2.5. Data Analysis

Data statistics and analysis were performed using Microsoft Excel 2016. IBM Statistics SPSS 26 was used for Pearson correlation and principal component analyses. Linear regression analysis and graph plotting were conducted using Origin, while ArcMap 10.8 was employed for mapping the study area and the location of sampling points. Elevation data come from Computer Network Information Center (2024) [44]; China map data come from China (2024) [45].

3. Results

3.1. Characteristics of Red Bed Soil in Different Land Use Types

The statistics for 11 soil properties across 6 different land use types in the study area are presented in Table 4. The average soil organic matter content did not vary significantly among different land use types, with agricultural land exhibiting the lowest average and red bed erosion land showing relatively higher levels. Soil pH ranged from 4.52 to 9.36 in the typical red bed area, with woodland having the lowest average pH (6.86, weakly acidic) and red bed erosion land having the highest (8.60, weakly alkaline). Soil water content varied notably among land use types, with agricultural land having the highest mean value (17.26%) and red bed erosion land showing the lowest (2.71%). Alkali hydrolyzable nitrogen (AN), available phosphorus (AP), and available potassium (AK) had their highest mean values in agricultural soils (90.92 mg/kg, 31.14 mg/kg, and 196.58 mg/kg, respectively), while red bed erosion land soil had the lowest mean values for AN and AP (16.86 mg/kg and 0.84 mg/kg, respectively). Exchangeable calcium was highest in shrubland (6774.34 mg/kg) and lowest in woodland (3838.73 mg/kg), whereas exchangeable magnesium was highest in agricultural land (93.53 mg/kg) and lowest in bare rock land (40.38 mg/kg).
The mean values of trace elements available copper (A-Cu), available zinc (A-Zn), and available iron (A-Fe) were highest in agricultural land (1.13 mg/kg, 1.22 mg/kg, and 41.47 mg/kg, respectively) and lowest in red bed erosion land (0.07 mg/kg, 0.11 mg/kg, and 0.79 mg/kg, respectively).

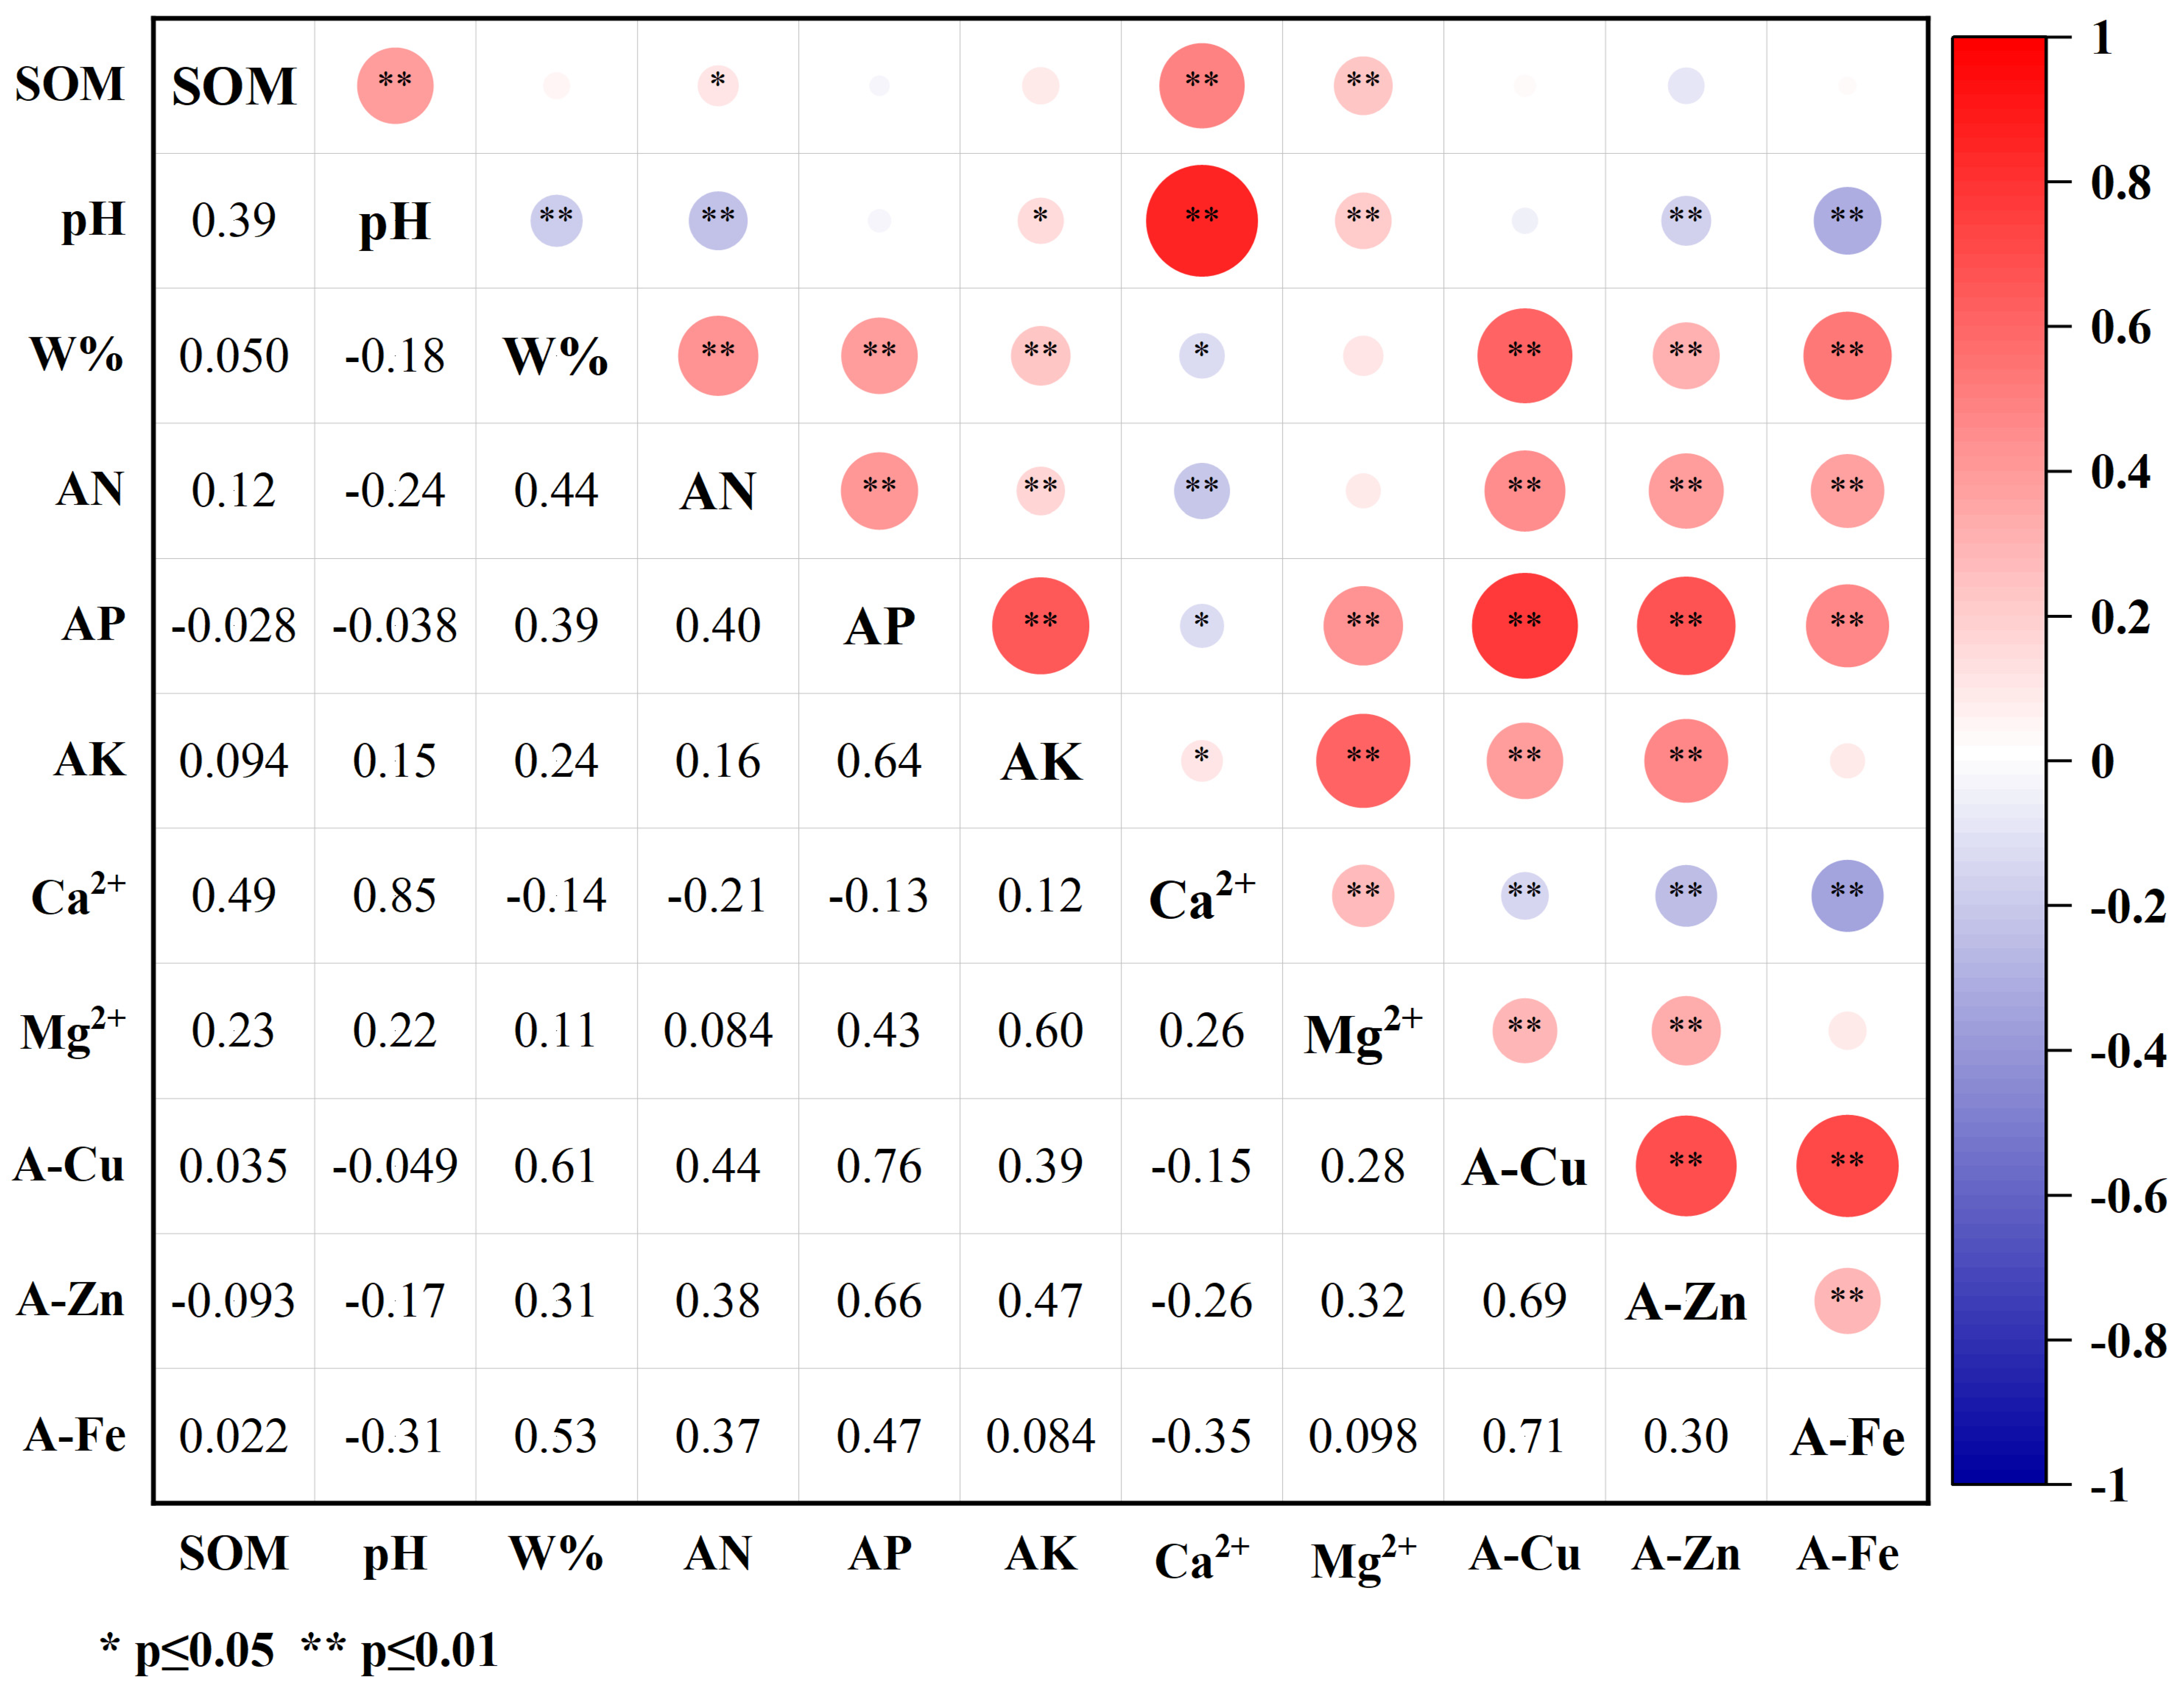
3.2. Correlation Analysis of Soil Quality Indices

The correlation analysis among soil indicators is depicted in Figure 2. There were highly significant correlations (p < 0.01) observed among most of the soil evaluation indices. Specifically, pH exhibited highly significant correlations with Ca2+, Mg2+, W (%), AN, A-Zn, and A-Fe. Additionally, W (%) displayed highly significant positive correlations with AN, AP, AK, A-Cu, A-Zn, and A-Fe, suggesting a close relationship between the fundamental physicochemical properties of soil and nutrient content. Significant positive correlations were also found between AN, AP, AK, Ca2+, Mg2+, and trace elements in soil nutrient indices. Furthermore, highly significant positive correlations were observed between AN, AP, and AK, as well as between SOM, Ca2+, and Mg2+, indicating mutual influence among soil nutrient indices and trace elements. Notably, highly significant positive correlations were observed between the soil trace elements A-Cu, A-Zn, and A-Fe, suggesting close interaction among these trace elements.

3.3. Establishment of MDS Based on Principal Component Analysis

The soil indicators from various land use types underwent principal component analysis, and the findings are presented in Table 5. The eigenvalues of the three components of the soil quality evaluation indices exceeded 1, with PC1 explaining 36.887% of the variance, PC2 explaining 22.896%, and PC3 explaining 11.532%. Together, these three components contributed cumulatively to 71.315% of the variance, meeting the criteria for information extraction.
In PC1, soil water content, alkaline dissolved nitrogen, available phosphorus, available potassium, available copper, available zinc, and available iron exhibited loading factors ≥0.50, with available copper demonstrating the highest Norm value (1.819), and available phosphorus being within 10 percent of its Norm value. PC2 encompassed pH, exchangeable calcium, and exchangeable magnesium, with exchangeable calcium displaying the highest Norm value (1.515), and its Norm value being within 10% of pH. Although the loading factor of organic matter in both PC2 and PC3 was ≥0.50, it exhibited a significant positive correlation with pH, exchangeable calcium, and exchangeable magnesium. Therefore, in adherence to the principle of “if the loading of an index on different principal components is ≥0.50, then it will be classified into a group with lower correlation with other indexes”, organic matter was separately categorized into PC3.
Therefore, the final selection for inclusion in the MDS comprised available phosphorus and available copper in PC1, pH and exchangeable calcium in PC2, and organic matter exclusively in PC3, totaling five indicators. The weights of these indicators in the MDS were calculated as follows: organic matter, 0.125; pH, 0.207; available phosphorus, 0.221; exchangeable calcium, 0.224; and available copper, 0.223, in that order (Table 6).

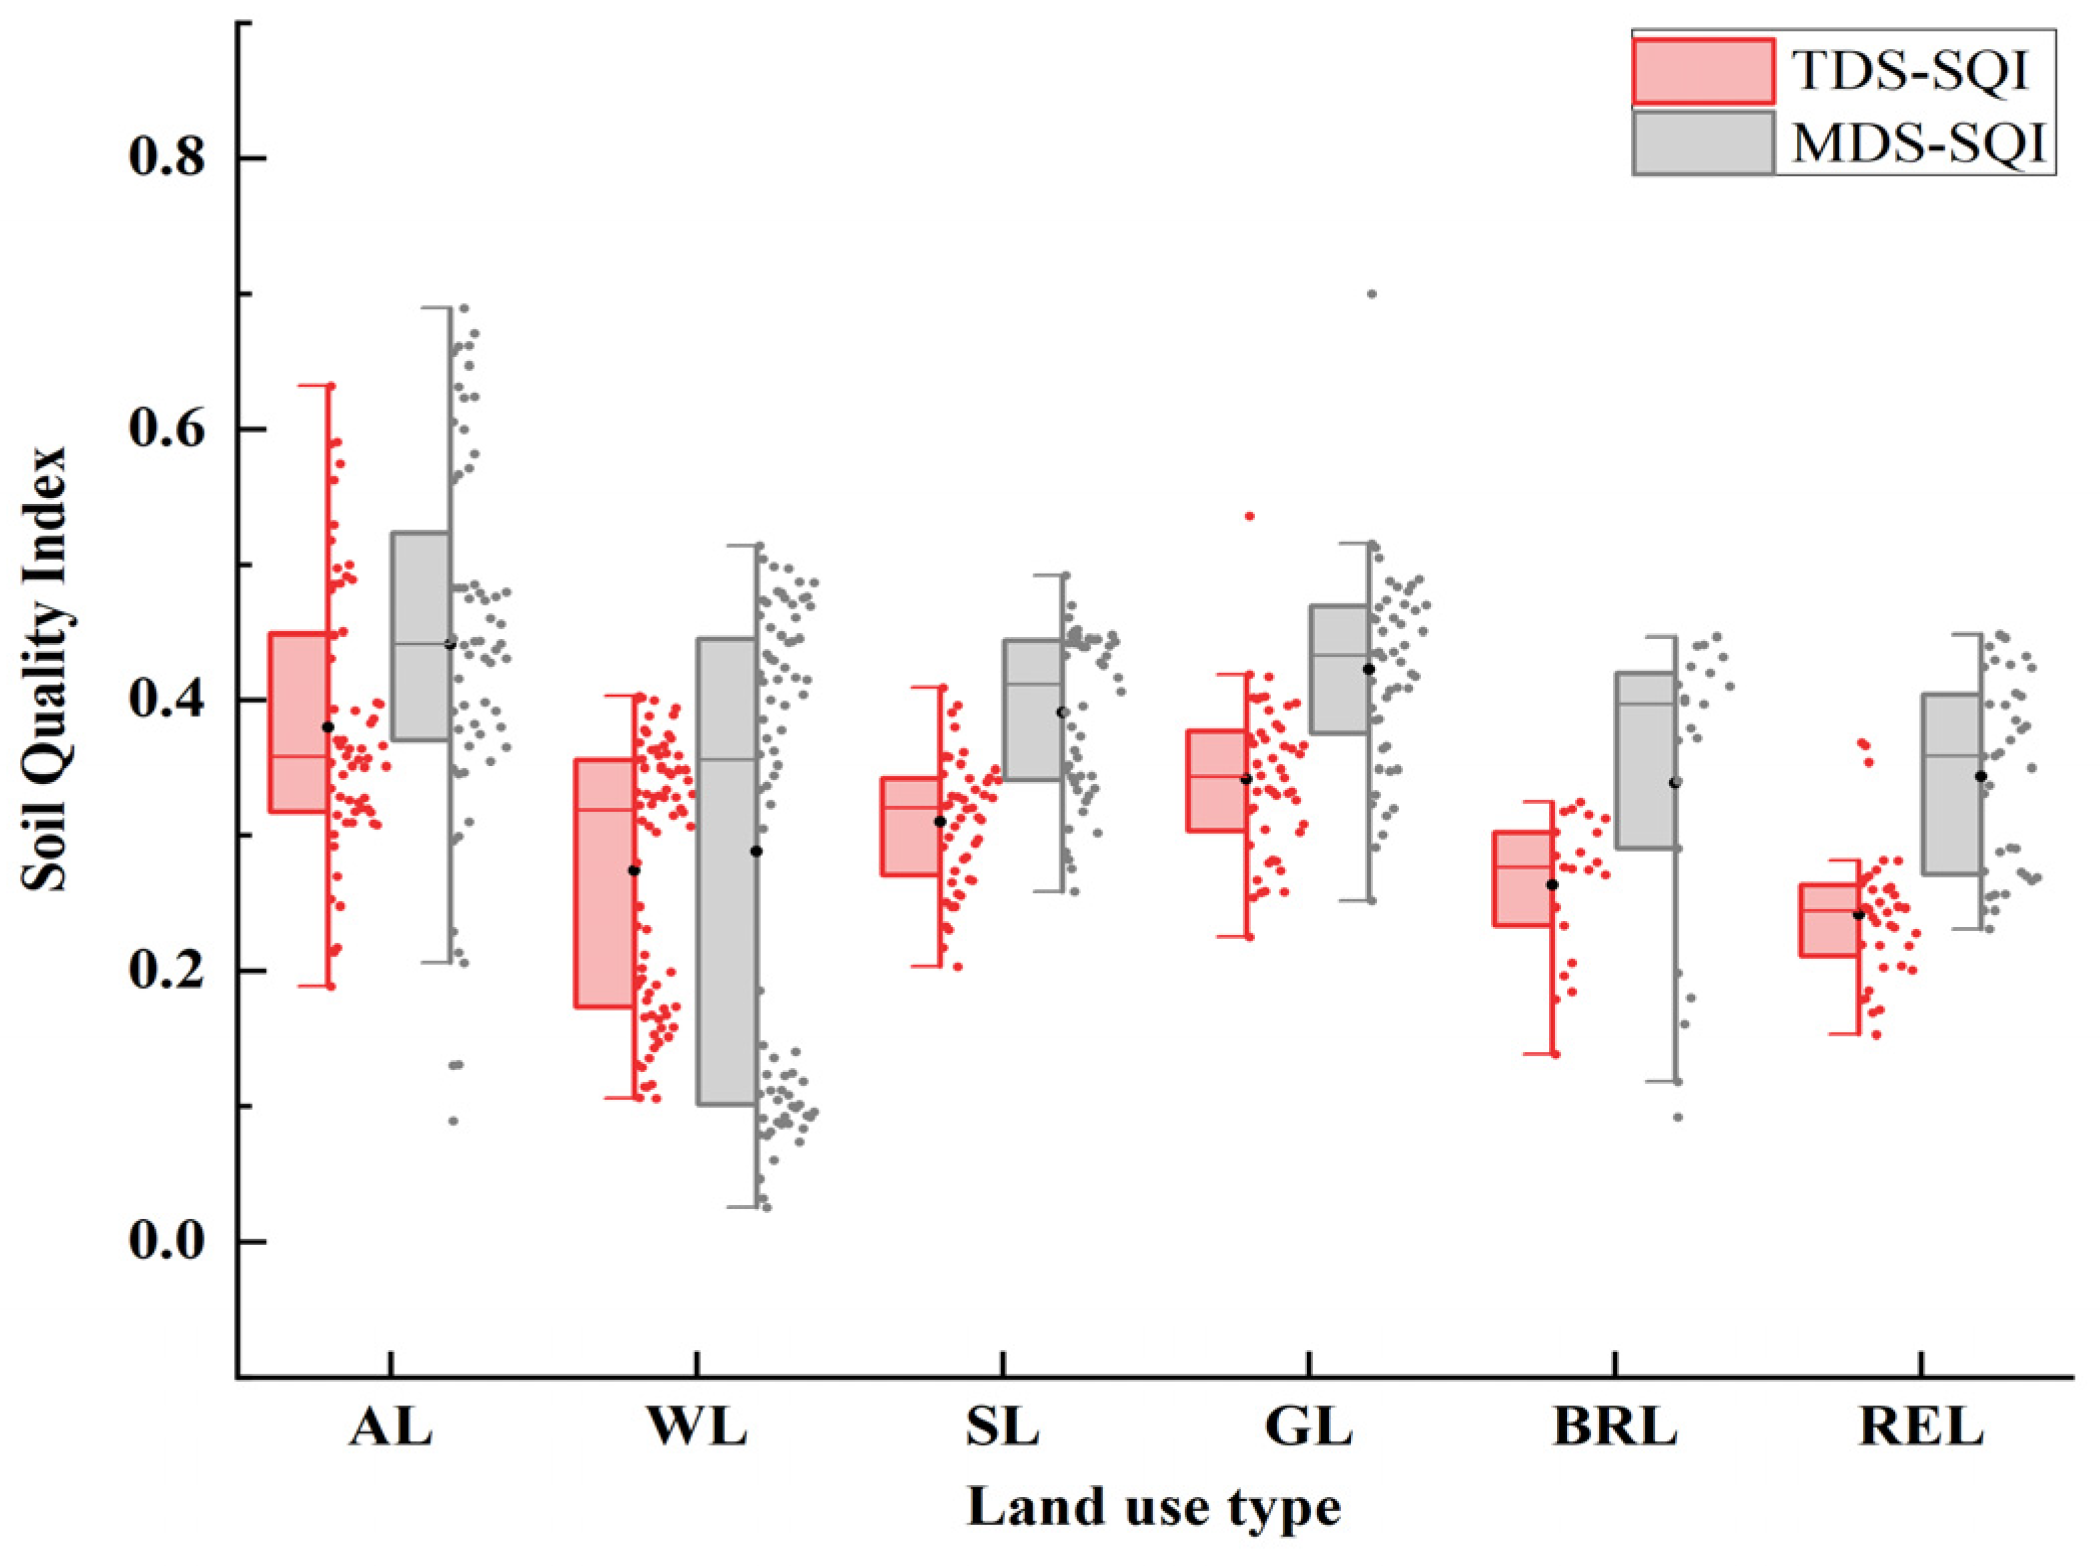
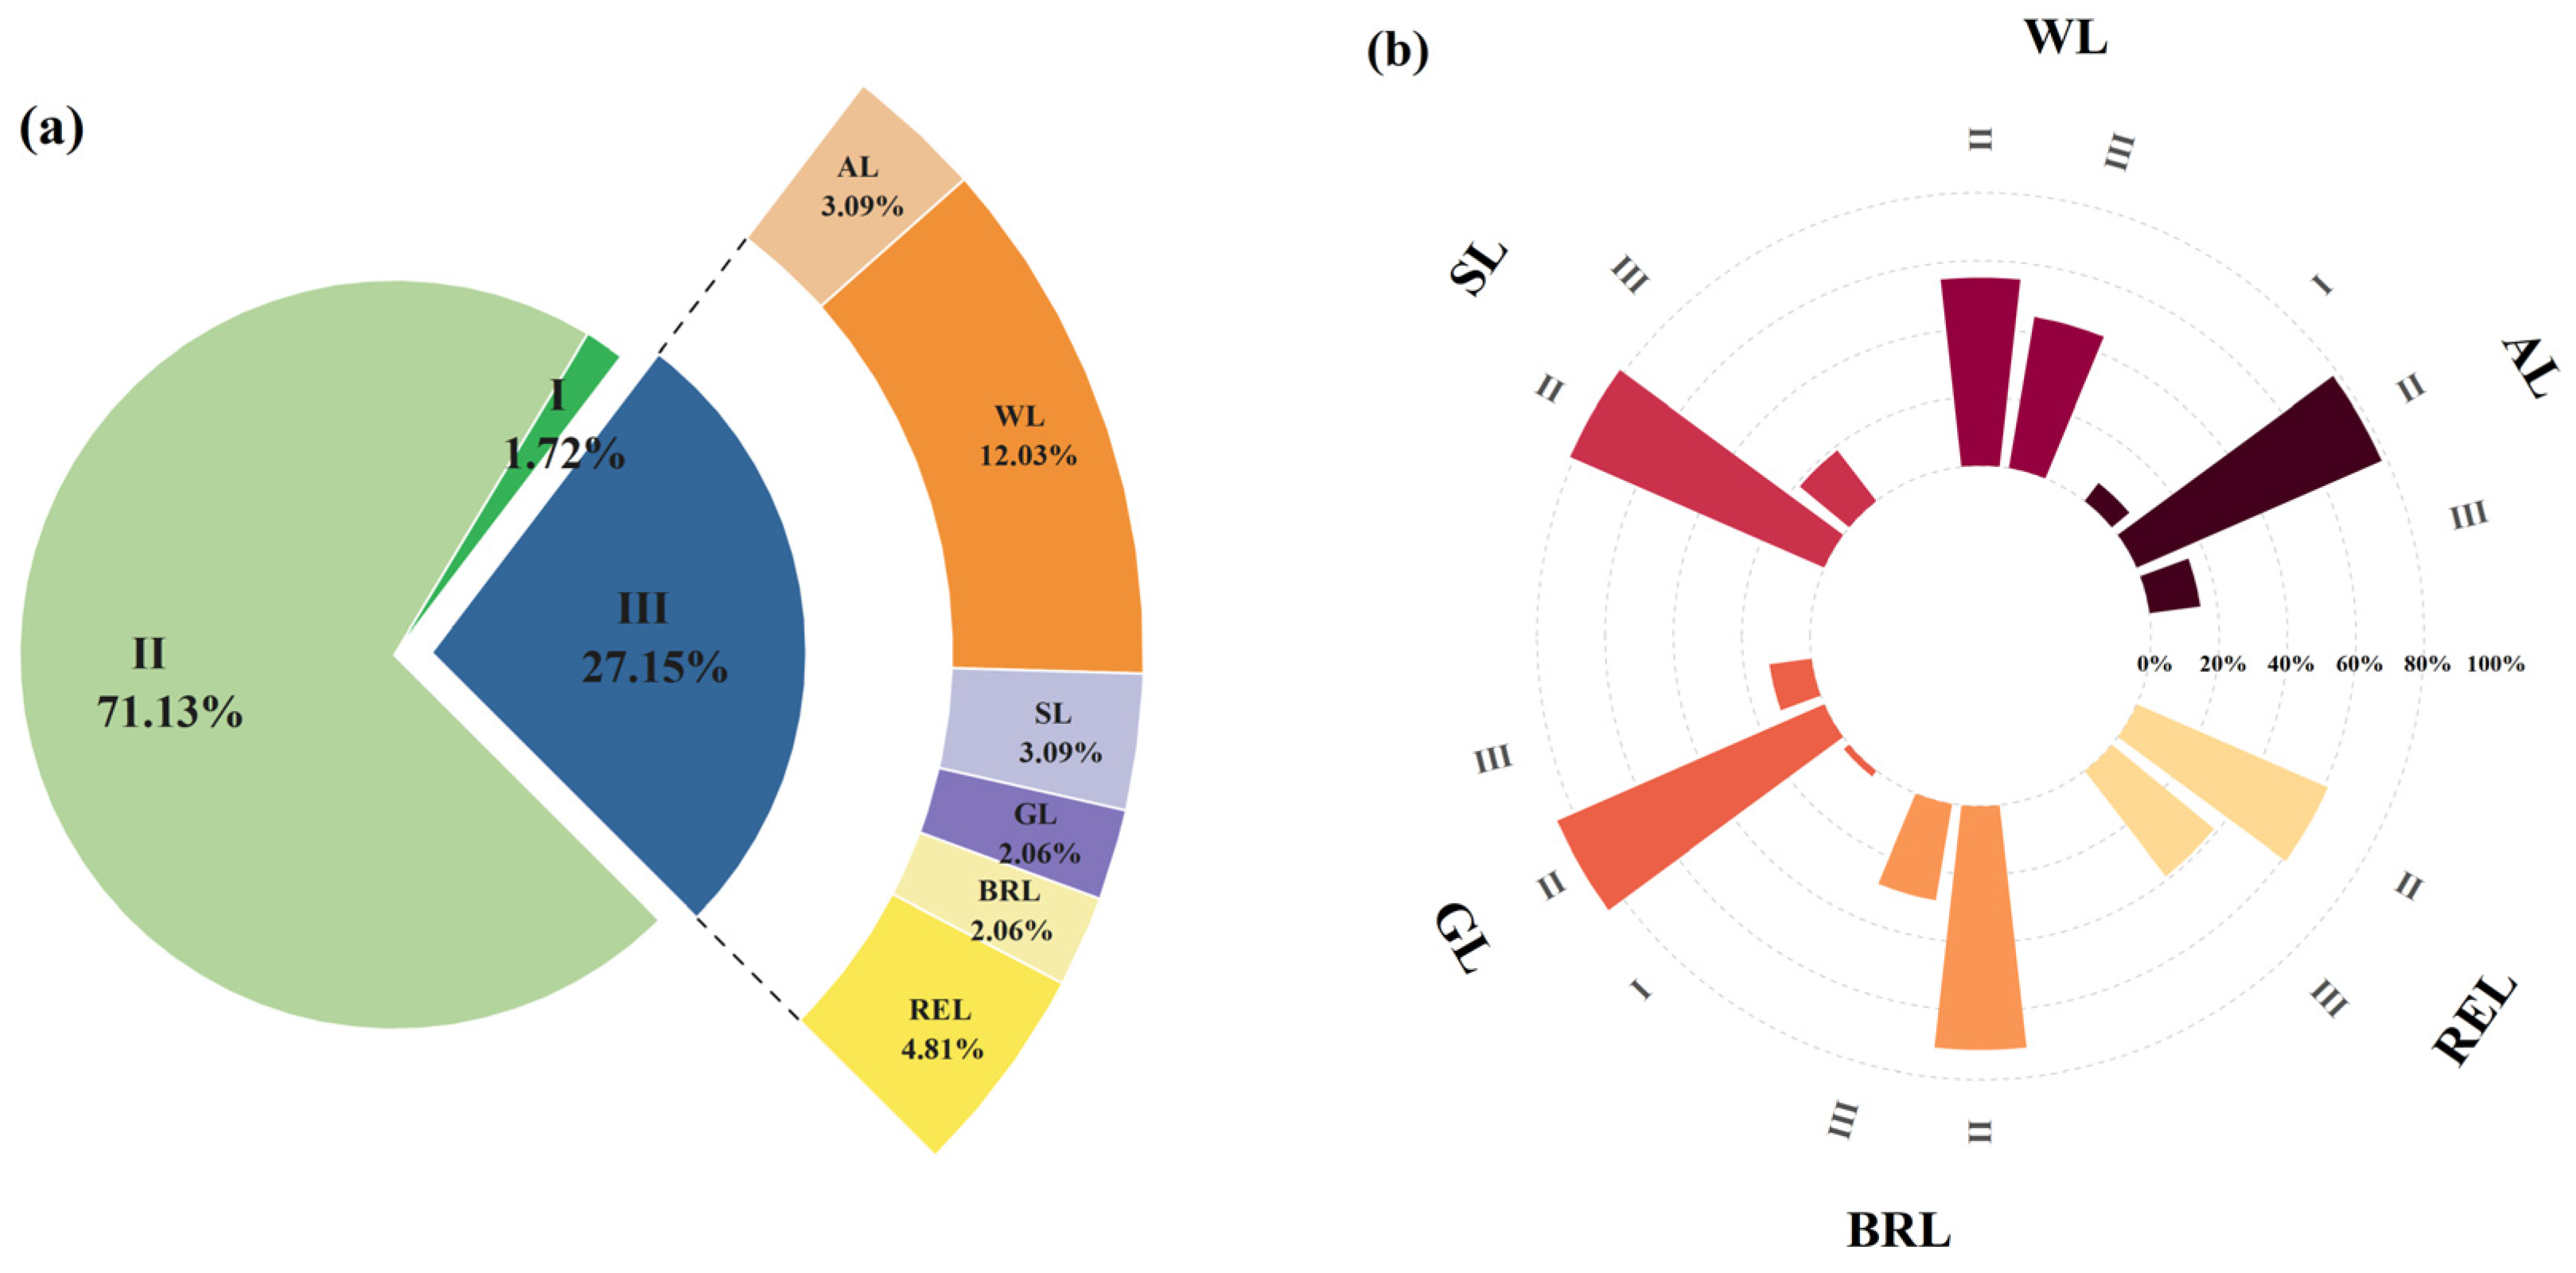
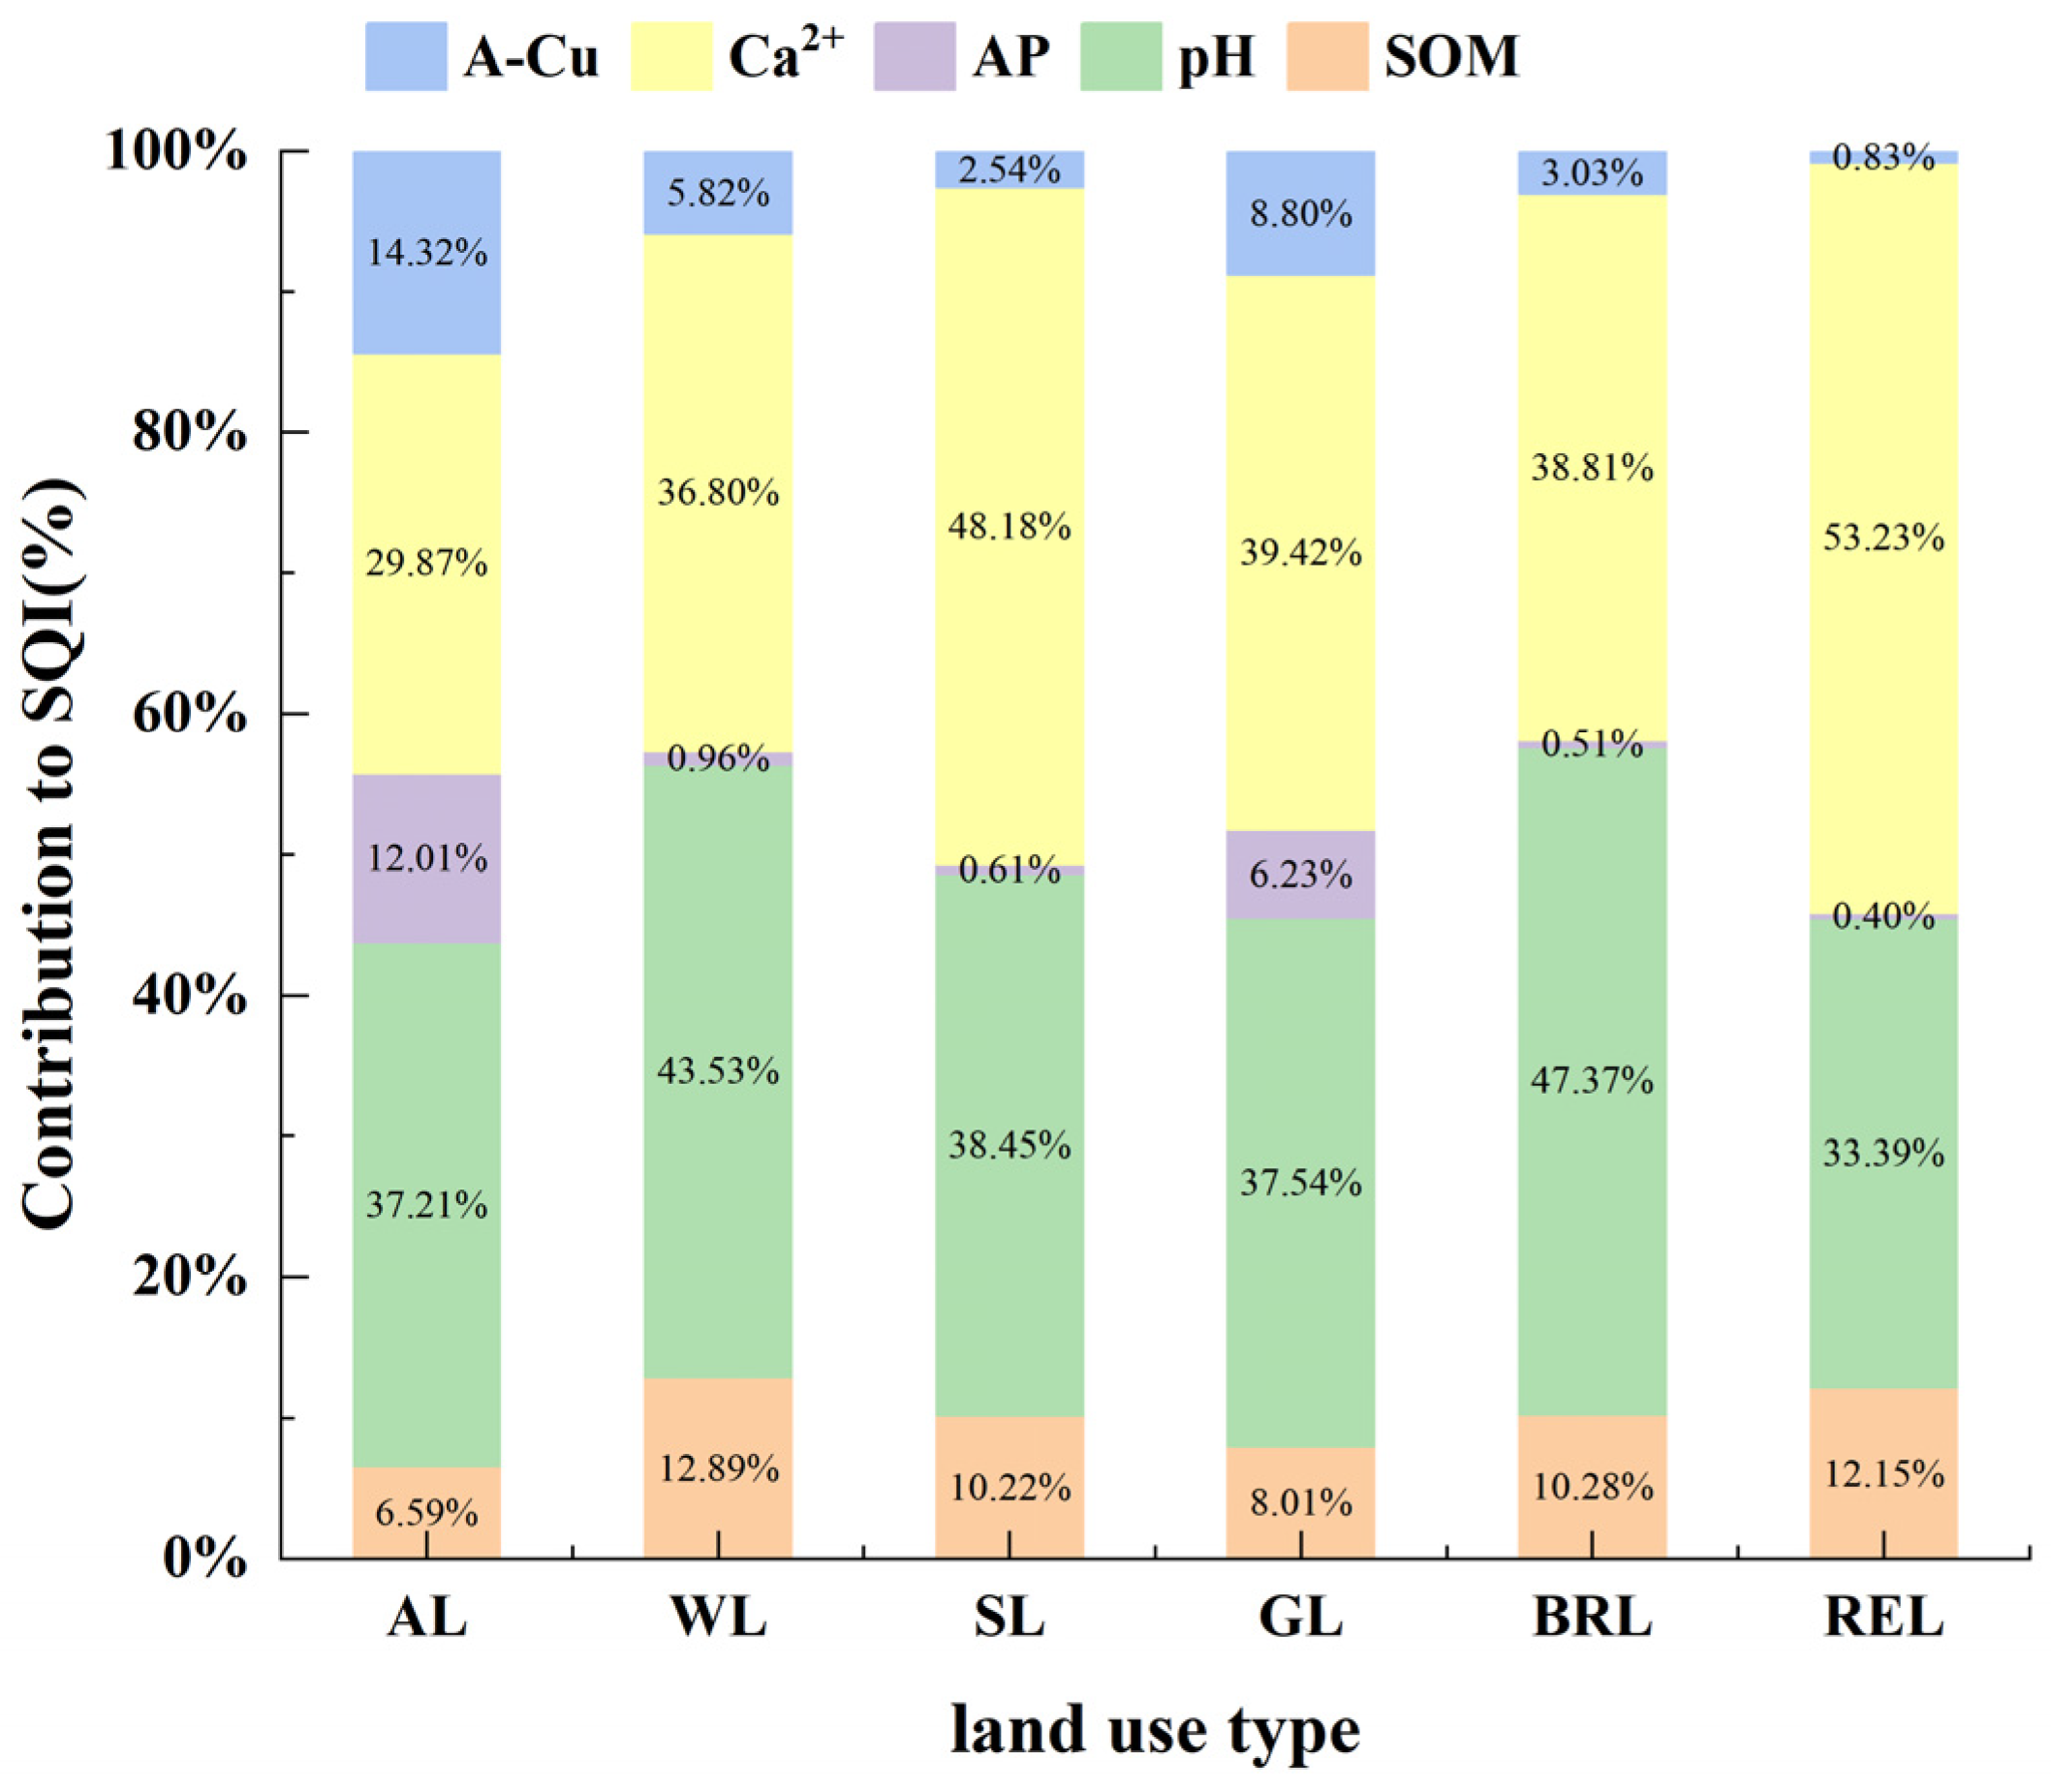
3.4. Soil Quality Index Based on TDS and MDS

The soil quality index (SQI) was computed using the affiliation function in Table 1 based on the total data set (TDS) and the minimum data set (MDS), by the relationship between soil characteristics and soil functions (Figure 3). The results show that soil quality varies significantly under different land use patterns. Additionally, the trends of soil quality changes in TDS-SQI and MDS-SQI across different land use patterns are consistent. The TDS-SQI ranged from 0.1057 to 0.6322, with a mean value of 0.3083 ± 0.0903 and a coefficient of variation of 29.3%, indicating a moderate variation. Meanwhile, the MDS-SQI, based on the minimum data set, varied from 0.0253 to 0.6998, with a mean value of 0.3696 ± 0.1349 and a coefficient of variation of 36.49%, also indicating a moderate variation. Under different land use modes, the mean values of SQI were as follows: agricultural land (0.380) > grassland (0.342) > shrubland (0.310) > woodland (0.274) > bare rock land (0.263) > red bed erosion land (0.242).
In the study area, 1.72%, 71.13%, and 27.15% of the sampling sites were classified into soil quality index Classes I, II, and III, respectively (Figure 4). Among the soils classified as Class III with severe limitations on vegetation growth, forest soils accounted for the highest percentage, followed by red bed erosion land. Concerning different land use types, 15%, 18.75%, and 12.5% of the sampling sites in agricultural, shrub, and grassland plots, respectively, exhibited Class III soil quality. Meanwhile, 28.75% and 38.95% of the sampling sites in bare rock land and red bed erosion land were classified as Class III, and 44.87% of the sampling sites in woodland had low-quality soil. These findings suggest that most soil quality in the study area is moderate, with soil quality being deficient in red bed erosion land, bare rock land, and woodland, often hindering vegetation growth. Agricultural soil quality is relatively higher in comparison.
Figure 5 shows the proportionate contributions of each indicator to the various land use types of soil. The total contribution of pH and Ca2+ to soil quality under different land use patterns was the highest, 39.58% and 41.05%, respectively. In addition, the total contribution of SOM was 10.02%, which fluctuated above and below 10% in different land use types. The percentage contribution of A-Cu under different land use patterns was agricultural land (14.32%) > grassland (8.80%) > woodland (5.82%) > bare rock land (3.03%) > shrubland (2.54%) > red bed erosion land (0.83%). There were significant differences in the contribution of AP under different land use patterns, with 12.01% and 6.23% in agricultural land and grassland, respectively, and less than 1% in the rest of the land use patterns, which were, in descending order, woodland (0.96%) > shrubland (0.61%) > bare rock land (0.51%) > red bed erosion land (0.40%).

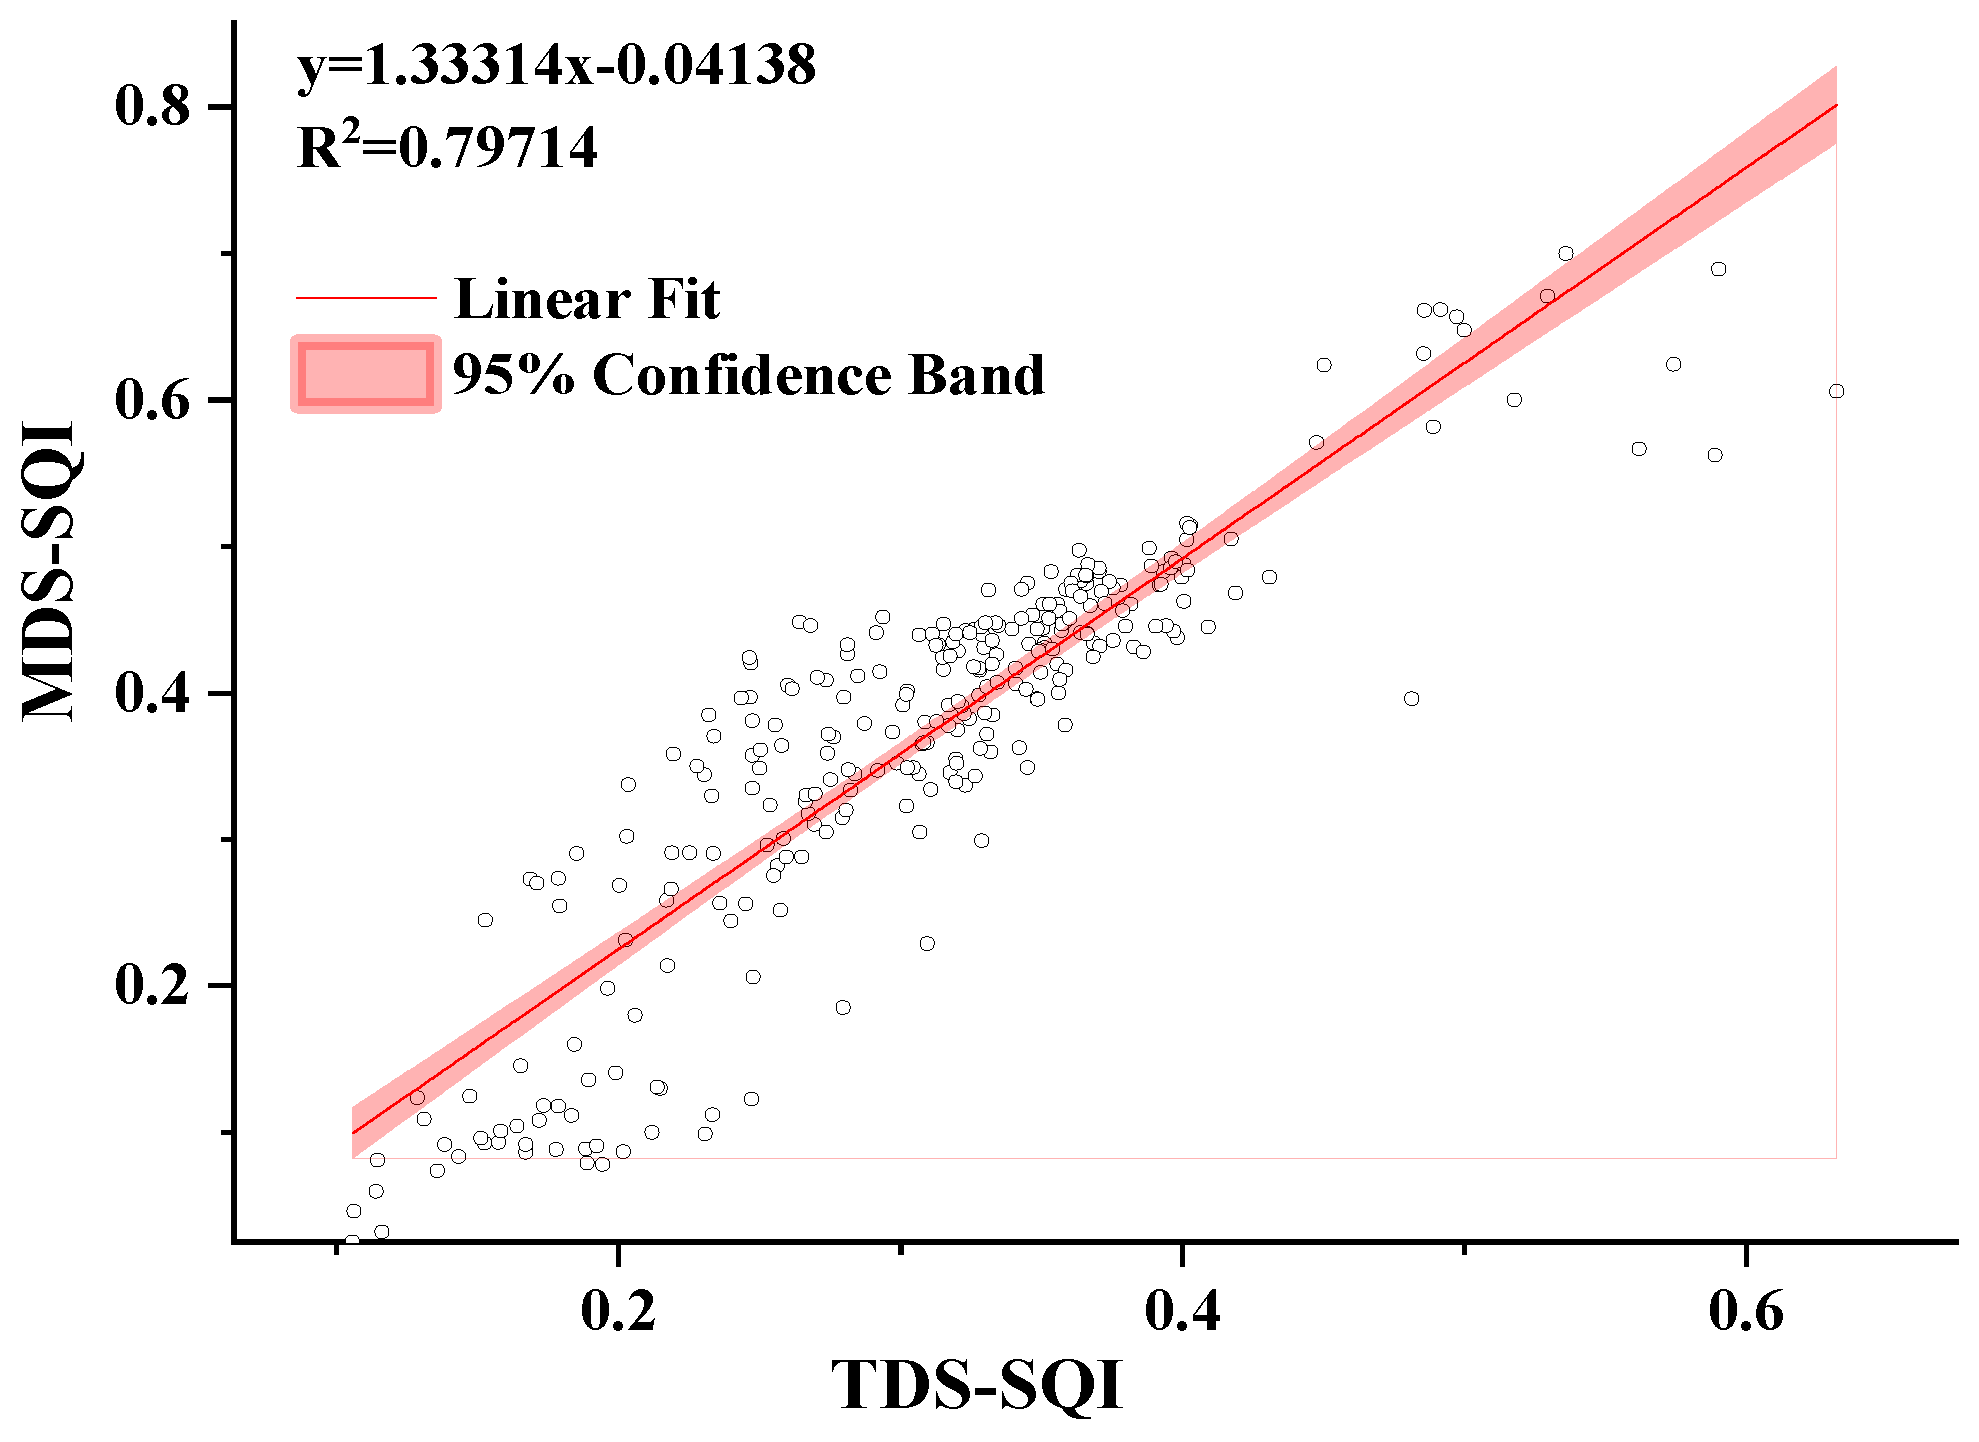
3.5. Validate the Applicability of MDS

The computed total data set soil quality index (TDS-SQI) and minimal data set soil quality index (MDS-SQI) were examined using linear regression and a scatter plot in order to verify the applicability of MDS. As depicted in the fitting effect (Figure 6), a significant positive correlation was observed between the TDS-SQI and the MDS-SQI, with an R2 of 0.797, indicating a relatively strong fitting effect. These results indicate that MDS can effectively replace TDS in calculating the soil quality index to assess the soil quality in the study area.

4. Discussion

4.1. The MDS for Soil Quality Assessment in Humid Red Bed Basins

Numerous researchers have examined the effects of indicators including bulk density, soil structure, percentages of clay and sand, and conductivity on soil quality in order to evaluate the effects of soil physical and chemical features on nutrient cycling and uptake. However, only a few of these indicators are usually chosen for the minimal data set (MDS) for soil quality evaluation because of the relationships between these parameters [46,47]. In this study, the soil quality of different land use types in the red bed desertification area of the humid region was assessed using PCA and MDS methods. The results showed that a minimum data set consisting of SOM, pH, AP, Ca2+, and A-Cu was the most suitable for evaluating soil quality in the region. SOM, pH, and AP were highly consistent with the MDS identified in many other soil quality assessment studies [48,49].
Soil pH is one of the most important factors in determining the quality of soil since it directly affects the chemical reactions and nutrient availability of the soil [50]. Huang et al. (2010) [11] concluded that pH is highly sensitive to land use changes, and it has been widely used as an essential indicator for assessing soil quality, particularly in forest ecosystems [48,51]. From the specific contribution of pH to the SQI of different land types in the study area (Figure 5), it was observed that the contribution of pH varied significantly in different land use types of soils, with the highest contribution of 43.53% in arborvitae woodlands. pH is one of the important indicators in the minimal data set created based on principal component analysis.
Moharana et al. (2019) [52] considered Ca2+ and Mg2+ as the main cations present in semi-arid soils. Pessoa et al. (2022)’s [53] study concluded that soil exchangeable and soluble ions were at low levels in native vegetation areas, while they were high in cultivated areas and areas of desertification. This suggests that anthropogenic factors may be the main influence on land salinity degradation. The conclusions of this paper are in agreement with these findings. From the characteristics of different land use types, the red bed erosion land with the most severe desertification has very low soil water content, but the highest exchangeable calcium and magnesium contents among all land use types. The exchangeable salty ion content in agricultural land that has been artificially fertilized is the second highest, while the exchangeable salty ion content of arboreal forest land soil, which is less affected by anthropogenic influences, is relatively the lowest.
In addition, the contents of Ca, Mg, Na, and K reflect the dissolution of easily weathered primary minerals [54]. The weak weathering resistance and strong erosion by flowing water of the red bed soft rock in the study area may be the reason for the higher content of exchangeable salty ions in the red bed eroded land compared to other land types. This indicates the significant role of mineral composition in regional soil fertility and productivity [55,56]. Therefore, it is essential to consider relevant indicators such as cation exchange capacity and exchangeable salinity ions when establishing a minimum data set for soil quality assessment in areas of desertification.
Available trace elements present in soil can be absorbed and utilized by plants, playing an irreplaceable role similar to macronutrients in plant growth and development [57]. However, many previous studies on soil quality have not considered the impact of these available micronutrients [58,59]. Liu et al. (1982) [60] emphasized that micronutrient content is crucial in soil quality assessment, especially when deficiencies limit crop growth. Tian et al. (2020) [61] also highlighted this point in their research. Therefore, in this study, available micronutrients were included in the soil quality assessment. Available copper, in particular, was incorporated into the minimum data set as a representative of these micronutrients, addressing the gap left by previous soil quality assessment studies.
Soil organic matter (SOM) and available phosphorus (AP) have been the most frequently included indicators in the minimum data set (MDS) for assessing soil quality in numerous prior studies. SOM is a primary source of plant mineral nutrients and influences the functional activity of soil biota by affecting the rate of soil nutrient cycling. Available phosphorus (AP) is the best indicator of phosphorus availability in soils and is frequently used in soil diagnosis and fertility assessment. The contribution of AP to the soil quality index (SQI) of soils under different land use types varies widely. As previously mentioned, it is relatively higher in land classes with higher SQI, such as cropland and grassland, and contributes less than 1% to other land classes. This variation may further indicate that anthropogenic factors, such as fertilizer application, significantly influence soil quality.
Overall, Ca2+ had the greatest contribution to the SQI (41.05%), followed by pH (39.58%), SOM (10.02%), A-Cu (5.89%), and AP (3.45%). Our results confirm previous studies indicating that the MDS for the scientific assessment of soil quality should include indicators that (i) characterize nutrient retention (organic matter, exchangeable calcium); (ii) characterize available nutrients (available phosphorus, available copper); and (iii) correlate with alkali saturation (pH) [62].

4.2. Soil Quality Characteristics and Influencing Factors of Different Land Use Types in the Red Bed Region

Soil water vapor movement and physicochemical qualities, including pH and soil nutrients, are greatly impacted by varying land use patterns. These factors ultimately determine the quality of the soil [63,64]. These effects can be attributed to a variety of factors, including vegetation type, vegetation cover, and human activities [65]. Both the total data set (TDS) and the minimum data set (MDS) for the soil quality index (SQI) of the various land use types in this study showed the same trend, suggesting that MDS can effectively replace TDS for evaluating soil quality under various land use practices in typical red bed desertification areas.
The soil of the red bed erosion area is weakly alkaline, with the lowest average values of W%, AN, AP, A-Cu, A-Zn, and A-Fe among all land types. This aligns with its characteristics of extreme water shortage, low soil nutrient content, and severe desertification [66,67]. However, its SOM is unexpectedly high, likely due to government-led ecological restoration efforts such as regular irrigation and the application of organic fertilizers. Despite the increase in SOM, the red bed soil remains arid, and the levels of other nutrients have not significantly increased. This suggests that while human activities have improved some soil properties, it is challenging to achieve qualitative changes in a short period [68]. The poor water retention capacity of the red bed soil makes it difficult to quickly improve soil quality. The overall quality of the soil is influenced by the synergistic effects of its physical, chemical, and biological properties. Therefore, preventing and controlling desertification in the red beds is a long-term process that requires consideration from multiple perspectives.
The soil properties of the bare rock land are comparable to, albeit slightly better than, those of the red bed erosion land. This is attributed to the presence of a shallow, thin soil layer on the surface of the bare rock land, along with sporadic vegetation growth, which exerts a modest soil-fixing influence. However, if desertification persists unchecked, the gradual decline in vegetation cover may lead the bare rock land to degrade into red bed erosion land within a few years, resulting in further soil quality deterioration.
In contrast to the red bed erosion land, agricultural soils exhibit the highest levels of water content, alkaline dissolved nitrogen, available phosphorus, quick-acting potassium, exchangeable magnesium, available copper, available zinc, and available iron among the six land types. To ensure optimal crop yields, agricultural land soils undergo regular irrigation and application of fertilizers conducive to crop growth, underscoring the significant impact of anthropogenic land management practices on agricultural land quality. However, the average organic matter content of agricultural land was slightly lower compared to other sampling sites. This discrepancy can be attributed to the crop planting and growth processes, which promote the decomposition, transformation, leaching, and migration of organic matter, leading to its loss from the topsoil layer [69]. Additionally, frequent plowing processes may lead to the degradation of the soil structure, exacerbate the depletion of nutrients, and reduce the quality of the agricultural soil, which in turn affects crop yields.
In addition to agricultural soils, the soil quality of grassland and shrubland is better than that of other land use types. This is because some of the grasslands we sampled were formed from the abandonment of agricultural land for many years and retain rich nutrient elements even though they have not been artificially fertilized or irrigated. Additionally, compared to other land use types, the vegetation growing in grassland and shrubland usually has high adaptability and a fast growth rate. As a result, the soil in these areas tends to have a well-developed root system and a thicker layer of apoptotic material. This leads to a higher biomass input of organic matter, making the soil less susceptible to rapid erosion in a short period of time, thus preventing the formation of red bed deserts [70,71].
In addition, an interesting phenomenon observed in this study is that, contrary to many previous studies where forest land typically exhibits superior soil quality compared to other land use types due to factors such as less anthropogenic disturbance and abundant apomictic material, the soil quality of forest land in this study was among the lowest, only better than that of bare rock land and red bed erosion land. The percentage of soils with an SQI of III was also the highest for arboreal woodland. This could be attributed to the fact that arboreal woodlands in the region are predominantly planted with horsetail pine and artificial vegetation such as Taiwan acacia and new silver acacia, which are generally characterized by drought and barrenness tolerance. Augusto et al. (2002) [72] demonstrated that the decomposition of pine apomictic material produces high concentrations of Al3+ and H+ in the soil solution, which not only lowers the soil pH but also inhibits the uptake of Ca2+ and Mg2+ [73], reduces root growth, alters photosynthetic activity, and leads to nutrient imbalances in woodland species [51,74]. Additionally, the well-developed local agriculture and significant anthropogenic disturbances, such as fuel wood collection and turpentine extraction, contribute to the poor soil quality in forested areas of the region [27].
Regarding the contribution of indicators to soil quality within the minimum data set (Figure 5), Ca2+ and pH jointly accounted for 80.63% of soil quality, highlighting the pivotal role of parent rock mineral composition in determining soil quality within the red bed desertification area. Additionally, pH exerts further control over soil quality by influencing soil chemical reactions and nutrient effectiveness. Furthermore, anthropogenic land management and utilization practices, exemplified by fertilizer application patterns and vegetation types represented by AP, A-Cu, and SOM, also significantly impact soil quality.
As illustrated in Figure 6, apart from grassland, there is a consistent decrease in soil water content across each land category, namely agricultural land, woodland, shrubland, bare rock land, and red bed erosion land. This decline corresponds to a gradual decrease in soil fertility and a subsequent decline in the soil quality index, suggesting a progressive reversal of vegetation succession within the red bed desertification area under study. Consequently, if timely preventive and control measures are not taken, soil erosion and land desertification in the area may be further aggravated.

4.3. Soil Quality Improvement Recommendations for Red Bed Desertification Areas

China has made remarkable efforts and achieved considerable success in combating desertification in arid regions [75]. However, the mechanisms and distribution patterns of desertification in arid areas differ from those in the hot and humid southern red bed areas [1]. Therefore, in the future, local red bed desertification control should focus on improving the soil quality of forested land in the basin. Simultaneously, regulating the soil quality of arable land through rational farming practices and appropriate fertilizer application is essential to prevent the degradation process, which could lead to a decline or even loss of arable land productivity due to over-construction and excessive management aimed at increasing crop yields [76]. For bare rock and red bed eroded land with a high degree of desertification, efforts should be made to increase vegetation cover. This should be done in conjunction with national policies on land transformation and utilization to prevent the further aggravation of red bed desertification, which in turn affects the security of the regional ecological environment.
Although this study has made some progress in assessing soil quality in red bed desertification areas, there are still some limitations. For example, in the analysis process, we primarily focus on chemical indicators and neglect important physical and biological indicators, which limits a comprehensive understanding of the multidimensional characteristics of soil quality in red bed desertification areas. Therefore, future research should consider a wider range of ecosystem indicators in the red bed region, including soil physical indicators (such as porosity and particle distribution), biological indicators (such as soil microbial diversity and activity), climate, topographic factors, and anthropogenic influences. By integrating these diverse indicators, we can conduct a more comprehensive soil quality analysis and deeply explore the dynamic mechanisms of the ecosystem in the red bed desertification area. Ultimately, we hope that through our current and future work, more scholars will focus on the ecological and environmental issues in the red bed desertification area, promoting the development of a more scientific and reliable soil quality assessment system. This, in turn, will provide strong support for soil management and land use decision-making in the red bed desertification area.

5. Conclusions

To evaluate the comprehensive quality of soils under six land use modes in the humid red bed desertification region of South China, this study selected 11 soil physicochemical indicators, verified the correlation between these indicators, and established the minimum data set (MDS) to calculate the soil quality index (SQI). The results showed that most of the soils in the study area were of medium quality. The soil quality of red bed erosion land and bare rock land, which had a high degree of desertification, was generally low, followed by arboreal forest land, while the quality of agricultural soil was relatively the highest. The significant difference in the contribution of the indicators in the MDS to soil quality indicates that the mineral composition of the host rock is the most important factor affecting soil quality in the red bed desertification area. Additionally, fertilizer application patterns, vegetation types, and other anthropogenic land management practices are also important factors affecting soil quality. The characteristics of the soil quality and the factors that influence various land use patterns in the humid red bed desertification region are revealed in this study, which is very important for the scientific assessment, application, and enhancement of soil quality in desertification regions.

Author Contributions

F.S.: fieldwork, sampling, indoor test analysis, data processing, and paper drafting. B.C.: project implementation, paper conception and revision, fieldwork, sampling. B.W.: field research and sampling, indoor test analysis, data processing, and paper conception. W.L.: field research and sampling, indoor test analysis, and data processing. C.Z.: field research, sampling, indoor testing, and analysis. J.F.: project implementation and fieldwork. B.Y.: project implementation, field research arrangement. G.X.: field sampling, in-door sample testing, and analysis. All authors have read and agreed to the published version of the manuscript.

Funding

This research was funded by National Key R&D Program of China: Theory and Method of Big Data and Knowledge Fusion of Cross-scale Multi-source Heterogeneous Geological Resources (2022YFF0800101) and Local Government Commissioned Project: Monitoring Analysis and Evaluation Project of Comprehensive Remediation for Nanxiong red beds Desertification (Phase II) (ZPSG2020ZB010).

Data Availability Statement

The data that have been used are confidential.

Conflicts of Interest

The authors declare no conflicts of interest.

References

  1. Yan, L.-B.; Kasanin-Grubin, M. Land degradation and management of red beds in China: Two case studies. J. Mt. Sci. 2019, 16, 2591–2604. [Google Scholar] [CrossRef]
  2. Guo, Y.; Xie, Q.; Wen, J. Red beds distribution and engineering geological problem in China. Hydrogeol. Eng. Geol. 2007, 6, 67–71. [Google Scholar] [CrossRef]
  3. Zhao, J.; He, X.; Shao, T. Material composition and microstructure of purple soil and purple mudstone in Chongqing area. Acta Pedol. Sin. 2012, 49, 212–219. [Google Scholar]
  4. Jin, Y.; Peng, H.; Yan, L.; Xiang, Y.; Wang, X. Discussion on desertification of humid region in southern China. Prog. Geogr. 2015, 34, 772–780. [Google Scholar] [CrossRef]
  5. Peng, H. Perspectives on the red beds landforms in humid area of southern China and some related problems. Geogr. Res. 2011, 30, 1739–1752. [Google Scholar] [CrossRef]
  6. Doran, J.W.; Parkin, T.B. Defining and assessing soil quality. Defin. Soil Qual. A Sustain. Environ. 1994, 35, 1–21. [Google Scholar]
  7. Ditzler, C.A.; Tugel, A.J. Soil quality field tools: Experiences of USDA-NRCS soil quality institute. Agron. J. 2002, 94, 33–38. [Google Scholar] [CrossRef]
  8. Karlen, D.L.; Ditzler, C.A.; Andrews, S.S. Soil quality: Why and how? Geoderma 2003, 114, 145–156. [Google Scholar] [CrossRef]
  9. Pierce, F.; Larson, W.; Dowdy, R.; Graham, W. Productivity of soils: Assessing long-term changes due to erosion. J. Soil Water Conserv. 1983, 38, 39–44. [Google Scholar]
  10. Bünemann, E.K.; Bongiorno, G.; Bai, Z.; Creamer, R.E.; De Deyn, G.; De Goede, R.; Fleskens, L.; Geissen, V.; Kuyper, T.W.; Mäder, P. Soil quality—A critical review. Soil Biol. Biochem. 2018, 120, 105–125. [Google Scholar] [CrossRef]
  11. Huang, T.; Yue, X.; Ge, X.; Wang, X. Evaluation of soil quality on gully region of loess plateau based on principal component analysis. Agric. Res. Arid. Areas 2010, 28, 141–147. [Google Scholar]
  12. Shao, G.; Ai, J.; Sun, Q.; Hou, L.; Dong, Y. Soil quality assessment under different forest types in the Mount Tai, central Eastern China. Ecol. Indic. 2020, 115, 106439. [Google Scholar] [CrossRef]
  13. Yu, P.; Han, D.; Liu, S.; Wen, X.; Huang, Y.; Jia, H. Soil quality assessment under different land uses in an alpine grassland. Catena 2018, 171, 280–287. [Google Scholar] [CrossRef]
  14. Zhang, X.; Kong, F.; Jiang, Z. Construction and empirical analysis of a comprehensive evaluation method of coastal wetland soil quality based on ecological functions. Environ. Sci. 2022, 43, 2709–2718. [Google Scholar] [CrossRef]
  15. Maurya, S.; Abraham, J.S.; Somasundaram, S.; Toteja, R.; Gupta, R.; Makhija, S. Indicators for assessment of soil quality: A mini-review. Environ. Monit. Assess. 2020, 192, 604. [Google Scholar] [CrossRef] [PubMed]
  16. Abraham, J.S.; Sripoorna, S.; Dagar, J.; Jangra, S.; Kumar, A.; Yadav, K.; Singh, S.; Goyal, A.; Maurya, S.; Gambhir, G. Soil ciliates of the Indian Delhi Region: Their community characteristics with emphasis on their ecological implications as sensitive bio-indicators for soil quality. Saudi J. Biol. Sci. 2019, 26, 1305–1313. [Google Scholar] [CrossRef] [PubMed]
  17. Moral, F.J.; Rebollo, F.J. Characterization of soil fertility using the Rasch model. J. Soil Sci. Plant Nutr. 2017, 17, 486–498. [Google Scholar] [CrossRef]
  18. Liu, Z.-P.; Shao, M.-A.; Wang, Y.-Q. Spatial patterns of soil total nitrogen and soil total phosphorus across the entire Loess Plateau region of China. Geoderma 2013, 197, 67–78. [Google Scholar] [CrossRef]
  19. Das, P.P.; Singh, K.R.; Nagpure, G.; Mansoori, A.; Singh, R.P.; Ghazi, I.A.; Kumar, A.; Singh, J. Plant-soil-microbes: A tripartite interaction for nutrient acquisition and better plant growth for sustainable agricultural practices. Environ. Res. 2022, 214, 113821. [Google Scholar] [CrossRef]
  20. Luo, X.; Zhang, L.; Lin, Y.; Wen, D.; Hou, E. Nitrogen availability mediates soil organic carbon cycling in response to phosphorus supply: A global meta-analysis. Soil Biol. Biochem. 2023, 185, 109158. [Google Scholar] [CrossRef]
  21. Soumare, A.; Djibril, S.; Diédhiou, A.G. Potassium sources, microorganisms and plant nutrition: Challenges and future research directions. Pedosphere 2023, 33, 105–115. [Google Scholar] [CrossRef]
  22. Ciais, P.; Gervois, S.; Vuichard, N.; Piao, S.; Viovy, N. Effects of land use change and management on the European cropland carbon balance. Glob. Chang. Biol. 2011, 17, 320–338. [Google Scholar] [CrossRef]
  23. Cotrufo, M.F.; Lavallee, J.M. Soil organic matter formation, persistence, and functioning: A synthesis of current understanding to inform its conservation and regeneration. Adv. Agron. 2022, 172, 1–66. [Google Scholar]
  24. O’Sullivan, L.; Bampa, F.; Knights, K.; Creamer, R. Soil protection for a sustainable future: Options for a soil monitoring network for Ireland. Soil Use Manag. 2017, 33, 346–363. [Google Scholar] [CrossRef]
  25. Bertini, S.C.B.; Azevedo, L.C.B.; de Carvalho Mendes, I.; Cardoso, E.J.B.N. Hierarchical partitioning for selection of microbial and chemical indicators of soil quality. Pedobiologia 2014, 57, 293–301. [Google Scholar] [CrossRef]
  26. Jin, H.; Shi, D.; Chen, Z.; Liu, Y.; Lou, Y.; Yang, X. Evaluation indicators of cultivated layer soil quality for red soil slope farmland based on cluster and PCA analysis. Trans. Chin. Soc. Agric. Eng. 2018, 34, 155–164. [Google Scholar] [CrossRef]
  27. Chen, J.; Fu, J.; Xu, G.; Yu, B.; Lai, X.; Hu, S.; Zhang, K.; Liu, J. Soil Quality Characteristics and Influencing Factors of Different Land Use in the Red Bed Landform Region of South China: Taking Nanxiong Basin as An Example. Ecol. Environ. 2022, 31, 918. [Google Scholar] [CrossRef]
  28. Yan, P.; Lin, K.; Wang, Y.; Tu, X.; Bai, C.; Yan, L. Assessment of influencing factors on the spatial variability of SOM in the red beds of the Nanxiong basin of China, using GIS and geo-statistical methods. ISPRS Int. J. Geo-Inf. 2021, 10, 366. [Google Scholar] [CrossRef]
  29. Yan, P.; Lin, K.; Wang, Y.; Zheng, Y.; Gao, X.; Tu, X.; Bai, C. Spatial interpolation of red bed soil moisture in Nanxiong basin, South China. J. Contam. Hydrol. 2021, 242, 103860. [Google Scholar] [CrossRef]
  30. Wu, Z.; Peng, H. A study on the formation and development rules of the red beds in Guangdong Province. Trop. Geogr. 2006, 26, 207. [Google Scholar]
  31. Shen, W.-S.; Cao, X.-Z.; Shen, F.-Y. Classification and grading of land degradation in China. J. Ecol. Rural. Environ. 2006, 22, 88–93. [Google Scholar]
  32. Lu, R. Soil Agrochemical Analytical Methods; Chinese Agriculture and Technology Press Publisher: Beijing, China, 1999. [Google Scholar]
  33. Walkley, A.; Black, I.A. An examination of the Degtjareff method for determining soil organic matter, and a proposed modification of the chromic acid titration method. Soil Sci. 1934, 37, 29–38. [Google Scholar] [CrossRef]
  34. Anderson, J.M.; Ingram, J.S. Tropical soil biology and fertility: A handbook of methods. Soil Sci. 1994, 157, 265. [Google Scholar] [CrossRef]
  35. Schmugge, T.; Jackson, T.; McKim, H. Survey of methods for soil moisture determination. Water Resour. Res. 1980, 16, 961–979. [Google Scholar] [CrossRef]
  36. Bray, R.H.; Kurtz, L.T. Determination of total, organic, and available forms of phosphorus in soils. Soil Sci. 1945, 59, 39–46. [Google Scholar] [CrossRef]
  37. Schollenberger, C.; Simon, R. Determination of exchange capacity and exchangeable bases in soil—Ammonium acetate method. Soil Sci. 1945, 59, 13–24. [Google Scholar] [CrossRef]
  38. Norvell, W.; Lindsay, W. Reactions of DTPA chelates of iron, zinc, copper, and manganese with soils. Soil Sci. Soc. Am. J. 1972, 36, 778–783. [Google Scholar] [CrossRef]
  39. Rinot, O.; Levy, G.J.; Steinberger, Y.; Svoray, T.; Eshel, G. Soil health assessment: A critical review of current methodologies and a proposed new approach. Sci. Total Environ. 2019, 648, 1484–1491. [Google Scholar] [CrossRef] [PubMed]
  40. Wu, C.; Liu, G.; Huang, C.; Liu, Q. Soil quality assessment in Yellow River Delta: Establishing a minimum data set and fuzzy logic model. Geoderma 2019, 334, 82–89. [Google Scholar] [CrossRef]
  41. Zhang, F.; Gao, Z.; Ma, Q.; Song, Z.; Li, G.; Li, X.; Su, Y. Construction of minimum data set for soil quality assessment in the Dunhuang Oasis. Chin. J. Soil Sci. 2017, 48, 1047–1054. [Google Scholar]
  42. Jin, H.; Zhong, Y.; Shi, D.; Li, J.; Lou, Y.; Li, Y.; Li, J. Quantifying the impact of tillage measures on the cultivated-layer soil quality in the red soil hilly region: Establishing the thresholds of the minimum data set. Ecol. Indic. 2021, 130, 108013. [Google Scholar] [CrossRef]
  43. Chen, Y.; Wang, H.; Zhou, J.-M.; Xing, L.; Zhu, B.; Zhao, Y.; Chen, X. Minimum data set for assessing soil quality in farmland of northeast China. Pedosphere 2013, 23, 564–576. [Google Scholar] [CrossRef]
  44. Computer Network Information Center, C.A.o.S. ASTER GDEM 30M Resolution Digital Elevation Data. Available online: https://www.gscloud.cn/sources/index?pid=1&rootid=1 (accessed on 15 June 2024).
  45. Ministry of Natural Resources of the People’s Republic of China. China Standard Map (Revision No. GS (2024) 0650). Available online: https://cloudcenter.tianditu.gov.cn/administrativeDivision (accessed on 15 June 2024).
  46. Yu, P.; Liu, S.; Zhang, L.; Li, Q.; Zhou, D. Selecting the minimum data set and quantitative soil quality indexing of alkaline soils under different land uses in northeastern China. Sci. Total Environ. 2018, 616, 564–571. [Google Scholar] [CrossRef] [PubMed]
  47. Zhu, Z.; Chen, J.; Hu, H.; Zhou, M.; Zhu, Y.; Wu, C.; Zhu, L.; Jiang, X.; Wang, J. Soil quality evaluation of different land use modes in small watersheds in the hilly region of southern Jiangsu. Ecol. Indic. 2024, 160, 111895. [Google Scholar] [CrossRef]
  48. Cheng, J.; Ding, C.; Li, X.; Zhang, T.; Wang, X. Soil quality evaluation for navel orange production systems in central subtropical China. Soil Tillage Res. 2016, 155, 225–232. [Google Scholar] [CrossRef]
  49. Salazar, M.P.; Lozano, L.A.; Villarreal, R.; Irizar, A.B.; Barraco, M.; Polich, N.G.; Soracco, C.G. Capacity and Intensity Indicators to evaluate the effect of different crop sequences and cover crops on soil physical quality of two different textured soils from Pampas Region. Soil Tillage Res. 2022, 217, 105268. [Google Scholar] [CrossRef]
  50. Schoenholtz, S.H.; Van Miegroet, H.; Burger, J. A review of chemical and physical properties as indicators of forest soil quality: Challenges and opportunities. For. Ecol. Manag. 2000, 138, 335–356. [Google Scholar] [CrossRef]
  51. Bautista-Cruz, A.; Del Castillo, R.F.; Etchevers-Barra, J.D.; del Carmen Gutiérrez-Castorena, M.; Baez, A. Selection and interpretation of soil quality indicators for forest recovery after clearing of a tropical montane cloud forest in Mexico. For. Ecol. Manag. 2012, 277, 74–80. [Google Scholar] [CrossRef]
  52. Moharana, P.; Singh, R.; Singh, S.; Tailor, B.; Jena, R.; Meena, M. Development of secondary salinity and salt migration in the irrigated landscape of hot arid India. Environ. Earth Sci. 2019, 78, 454. [Google Scholar] [CrossRef]
  53. Pessoa, L.G.; Freire, M.B.d.S.; Green, C.H.; Miranda, M.F.; de A Filho, J.C.; Pessoa, W.R. Assessment of soil salinity status under different land-use conditions in the semiarid region of Northeastern Brazil. Ecol. Indic. 2022, 141, 109139. [Google Scholar] [CrossRef]
  54. Dos Santos, J.C.B.; Le Pera, E.; de Souza Junior, V.S.; Corrêa, M.M.; de Azevedo, A.C. Gneiss saprolite weathering and soil genesis along an east-west regolith sequence (NE Brazil). Catena 2017, 150, 279–290. [Google Scholar] [CrossRef]
  55. Câmara, E.R.G.; dos Santos, J.C.B.; de Araújo Filho, J.C.; Schulze, S.M.B.B.; Corrêa, M.M.; Ferreira, T.O.; de Sousa, J.E.S.; de Souza Júnior, V.S. Parent rock–pedogenesis relationship: How the weathering of metamorphic rocks influences the genesis of Planosols and Luvisols under a semiarid climate in NE Brazil. Geoderma 2021, 385, 114878. [Google Scholar] [CrossRef]
  56. Oliveira Filho, J.d.S.; Barrozo, M.V.d.S.; Bastos, F.d.H.; Pereira, M.G. Effects of climate and land-use on physicochemical properties of gneiss-derived soils in tropical drylands: Evidence from northeastern Brazil. Geoderma Reg. 2023, 33, e00639. [Google Scholar] [CrossRef]
  57. Dong, G.; Zhang, A.; Luo, G.; Xu, W.; Dai, L. Study on contents of available trace elements in oasis soil of Sangong river watershed. Soils 2009, 41, 726–732. [Google Scholar]
  58. Ge, Y.; Murray, P.; Hendershot, W. Trace metal speciation and bioavailability in urban soils. Environ. Pollut. 2000, 107, 137–144. [Google Scholar] [CrossRef]
  59. Thornton, I. Geochemistry and the mineral nutrition of agricultural livestock and wildlife. Appl. Geochem. 2002, 17, 1017–1028. [Google Scholar] [CrossRef]
  60. Liu, Z.; Zhu, F.Q.; Tang, L.; Xu, J.; Yen, C. Geographical distribution of trace element-deficient soils in China. Acta Pedol. Sin. 1982, 19, 209–223. [Google Scholar]
  61. Tian, K.; Zhang, B.; Zhang, H.; Huang, B.; Darilek, J.L.; Zhao, Y.; Yang, J. Evaluation of soil quality in major grain-producing region of the North China Plain: Integrating minimum data set and established critical limits. Ecol. Indic. 2020, 117, 106613. [Google Scholar] [CrossRef]
  62. Macedo, R.S.; Lima, R.P.; de Almeida Alves Carneiro, K.; Moro, L.; Refati, D.C.; Campos, M.C.C.; Beirigo, R.M.; da Cruz, G.K.G.; de Sousa, A.A.P.; de Brito Neto, J.F. Assessment of Soil Quality of Smallholder Agroecosystems in the Semiarid Region of Northeastern Brazil. Land 2024, 13, 304. [Google Scholar] [CrossRef]
  63. Cotrufo, M.F.; Haddix, M.L.; Kroeger, M.E.; Stewart, C.E. The role of plant input physical-chemical properties, and microbial and soil chemical diversity on the formation of particulate and mineral-associated organic matter. Soil Biol. Biochem. 2022, 168, 108648. [Google Scholar] [CrossRef]
  64. Xiao, K.; Li, D.; Wen, L.; Yang, L.; Luo, P.; Chen, H.; Wang, K. Dynamics of soil nitrogen availability during post-agricultural succession in a karst region, southwest China. Geoderma 2018, 314, 184–189. [Google Scholar] [CrossRef]
  65. Wang, X.; Liu, Z.; Xiong, K.; He, Q.; Li, Y.; Li, K. Characteristics and controlling factors of soil dissolved organic matter in the rainy season after vegetation restoration in a karst drainage area, South China. Catena 2022, 217, 106483. [Google Scholar] [CrossRef]
  66. Huang, S.; Peng, X.; Huang, Q.; Zhang, W. Soil aggregation and organic carbon fractions affected by long-term fertilization in a red soil of subtropical China. Geoderma 2010, 154, 364–369. [Google Scholar] [CrossRef]
  67. Zhang, H.; Wang, B.; Xu, M.; Fan, T. Crop yield and soil responses to long-term fertilization on a red soil in southern China. Pedosphere 2009, 19, 199–207. [Google Scholar] [CrossRef]
  68. Li, X.; Wang, D.; Ren, Y.; Wang, Z.; Zhou, Y. Soil quality assessment of croplands in the black soil zone of Jilin Province, China: Establishing a minimum data set model. Ecol. Indic. 2019, 107, 105251. [Google Scholar] [CrossRef]
  69. Jin, H.; Shi, D.; Lou, Y.B.; Zhang, J.; Ye, Q.; Jiang, N. Evaluation of the quality of cultivated-layer soil based on different degrees of erosion in sloping farmland with purple soil in China. Catena 2021, 198, 105048. [Google Scholar] [CrossRef]
  70. Gan, F.; Shi, H.; Yan, Y.; Pu, J.; Dai, Q.; Gou, J.; Fan, Y. Soil quality assessment of karst trough valley under different bedrock strata dip and land-use types, based on a minimum data set. Catena 2024, 241, 108048. [Google Scholar] [CrossRef]
  71. Huang, W.; Zong, M.; Fan, Z.; Feng, Y.; Li, S.; Duan, C.; Li, H. Determining the impacts of deforestation and corn cultivation on soil quality in tropical acidic red soils using a soil quality index. Ecol. Indic. 2021, 125, 107580. [Google Scholar] [CrossRef]
  72. Augusto, L.; Ranger, J.; Binkley, D.; Rothe, A. Impact of several common tree species of European temperate forests on soil fertility. Ann. For. Sci. 2002, 59, 233–253. [Google Scholar] [CrossRef]
  73. De Wit, H.A.; Eldhuset, T.D.; Mulder, J. Dissolved Al reduces Mg uptake in Norway spruce forest: Results from a long-term field manipulation experiment in Norway. For. Ecol. Manag. 2010, 259, 2072–2082. [Google Scholar] [CrossRef]
  74. Wright, R.; Baligar, V.; Ahlrichs, J. The influence of extractable and soil solution aluminum on root growth of wheat seedlings. Soil Sci. 1989, 148, 293–302. [Google Scholar] [CrossRef]
  75. Miao, L.; Moore, J.C.; Zeng, F.; Lei, J.; Ding, J.; He, B.; Cui, X. Footprint of research in desertification management in China. Land Degrad. Dev. 2015, 26, 450–457. [Google Scholar] [CrossRef]
  76. Sui, H.; Song, G.; Liu, W.; Zhang, Y.; Su, R.; Wang, Q.; Ren, G.; Mi, Y. Spatiotemporal variation of cultivated land ecosystem stability in typical regions of Lower Liaohe Plain China based on stress-buffer-response. Sci. Total Environ. 2023, 858, 160213. [Google Scholar] [CrossRef] [PubMed]
Figure 1. Distribution of the study area and sampling sites.
Land 13 01265 g001
Figure 2. Pearson correlation coefficient matrix of indicators for soil quality evaluation in red bed soil.
Land 13 01265 g002
Figure 3. SQI of different land use types in red bed areas based on TDS and MDS (the whiskers at both ends represent the maximum and minimum values of a set of data, the solid dot in the middle of the line segment represents the average, and the upper and lower boundaries of the box represent the upper and lower quartiles of a set of data, respectively).
Land 13 01265 g003
Figure 4. Soil quality status of different land use types in red bed areas based on MDS ((a) represents the proportion of all sample sites in grade I, II, and III soil quality; (b) represents the proportion of grade I, II, and III soil quality in each of the six different land use types).
Land 13 01265 g004
Figure 5. Percentage of the contribution of MDS index to soil SQI of different land use types.
Land 13 01265 g005
Figure 6. Relationship between MDS-SQI and TDS-SQI in the red bed desertification region.
Land 13 01265 g006
Table 1. Field photographs and characteristics of the six land use types.
Land Use TypeField PhotographsCharacteristics
Agricultural land
(AL)
Land 13 01265 i001
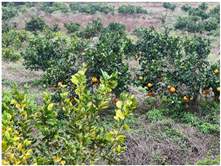
Plots where Citrus sinensis, Nicotiana tabacum, and Chinese medicinal herbs are cultivated after manual fertilization and irrigation.
Woodland (WL)Land 13 01265 i002
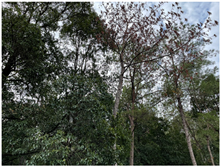
Primarily includes Pinus massoniana, Acacia confusa, and Leucaena leucocephala.
Shrubland
(SL)
Land 13 01265 i003
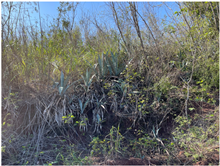
Plots with low shrubs such as Vitex negundo, Maclura cochinchinensis, and Melia azedarach.
Grassland
(GL)
Land 13 01265 i004The vegetation is diverse, with some areas being abandoned agricultural land where grasses such as Agave sisalana, Setaria viridis, and Caryopteris incana naturally grow.
Bare rock land (BRL)Land 13 01265 i005This area is in the initial stage of natural succession, with only small patches of vegetation cover, predominantly consisting of xerophytic shrubs and grasses.
Red bed erosion land (REL)Land 13 01265 i006
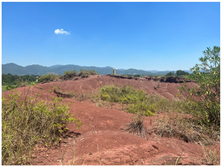
It is an area of severe red bed desertification, characterized by extensive bare ground, sparse vegetation, and, in extreme desertification zones, no plant growth at all. To carry out ecological restoration and prevent soil erosion in the red bed desertification area, experimental soil improvement has been conducted in some red bed erosion areas with extensive bare ground. The primary measure implemented has been the application of organic fertilizer.
Table 2. Regional classification of red bed desertification in the study area.
Evaluate Factors
Vegetation CoverageThe Exposed Area Occupies the Total AreaComprehensive Performance Characteristics
Light desertification50%~70%≤10%Erosion gullies are either developed or absent, with the topsoil layer missing. The vegetation is limited, consisting mostly of drought-tolerant shrubs and trees.
Moderate desertification30%~50%10%~25%Erosion gullies are well developed, but the slopes are generally gentle, with only a small number of shrubs and grasses growing.
Severe desertification10%~30%25%~50%Erosion gullies are widely distributed, and surface vegetation is scarce, consisting mainly of xerophytic shrubs and grasses.
Extreme desertification≤10%≥50%The area is characterized by dense erosion gullies, extensive bare land surfaces, sparse vegetation mainly consisting of xerophytes, and an absence of grass in the most extreme areas.
Table 3. Evaluation indicator type and membership function.
Function TypeMembership FunctionEvaluation IndexMembership Function Parameter
amnb
Type of parabolic
linear
u χ = 1 , m x n x a m a , a < x < m x n b n , b > x > n 0 , x a ; x b pH4.52789.36
W%08.5%15.5%55.74%
Type of S U x = 1 , χ b x a b a , a < x < b 0 , χ a SOM5.99 38.50
AN10.08 346.08
AP0.03 129.54
AK24.04 735.51
Ca2+50.52 8051.00
Mg2+8.12 274.50
A-Cu0.02 3.94
A-Zn0.05 4.78
A-Fe0.37 389.39
Type of reverse S u x = 1 , x a x b a b , a < x < b 0 , x b /
Note: The membership function is denoted by u x , where x represents the actual value of the indicators; the lower and upper bounds of the indicators’ critical values, respectively, are represented by a and b, which stand for the minimum and maximum values measured in the field; the optimal value for the indicator is represented by n, and its lower bound by m [42].
Table 4. Descriptive statistics of soil characteristics of different land use types in the study area.
Land Use TypeSOM
(g/kg)
pHW
(%)
AN
(mg/kg)
AP
(mg/kg)
AK
(mg/kg)
Ca2+ (mg/kg)Mg2 (mg/kg)A-Cu
(mg/kg)
A-Zn
(mg/kg)
A-Fe
(mg/kg)
AL13.58 ± 6.207.57 ± 1.0317.26 ± 11.2590.92 ± 66.1931.14 ± 27.32196.58 ± 138.664760.17 ± 2064.3493.53 ± 48.311.13± 0.881.22 ± 0.9441.47 ± 71.63
WL15.68 ± 6.236.86 ± 1.499.53 ± 4.1365.53 ± 25.471.66 ± 1.48100.14 ± 50.953838.73 ± 3169.0566.51 ± 38.690.31 ± 0.210.82 ± 0.3618.07 ± 32.40
SL16.40 ± 3.728.31 ± 0.478.49 ± 3.2233.28 ± 12.701.42 ± 0.80105.28 ± 38.576774.34 ± 496.0276.64 ± 33.150.19 ± 0.090.45 ± 0.251.88 ± 1.16
GL14.82 ± 4.188.17 ± 0.548.59 ± 3.9751.35 ± 11.4515.50 ± 20.18147.21 ± 76.216002.18 ± 1490.3378.05 ± 31.130.67 ± 0.371.03 ± 0.337.38 ± 7.24
BRL15.08 ± 7.687.37 ± 1.107.44 ± 3.1642.05 ± 16.291.04 ± 0.3558.33 ± 16.224750.24 ± 2525.7440.38 ± 13.770.20 ± 0.130.43 ± 0.225.20 ± 4.78
REL16.90 ± 2.648.60 ± 0.462.71 ± 1.9516.86 ± 11.720.84 ± 0.51104.48 ± 28.066589.87 ± 382.3191.79 ± 61.730.07 ± 0.040.11 ± 0.060.79 ± 0.25
Note: Mean ± SD; AL: agricultural land, WL: woodland, SL: shrubland, GL: grassland, BRL: bare rock land, REL: red bed erosion land.
Table 5. Load matrix and Norm value of each indicator for soils in red bed desertification area.
Evaluation IndexGroupingPCA (Principal Component)
PC1PC2PC3Norm
W (%)10.660−0.0730.4241.417
AN (mg/kg)10.598−0.1190.3461.280
AP (mg/kg)10.8540.194−0.2061.763
AK (mg/kg)10.5720.496−0.4381.480
A-Cu (mg/kg)10.8970.0720.1561.819
A-Zn (mg/kg)10.7690.032−0.3101.589
A-Fe (mg/kg)10.691−0.2510.3931.514
pH2−0.2570.8350.1241.430
Ca2+ (mg/kg)2−0.3140.8550.2081.515
Mg2+ (mg/kg)20.4110.602−0.3071.311
SOM (g/kg)3−0.0170.5970.5531.134
Eigenvalue4.0582.5191.269/
Percentage of explained variance/%36.88722.89611.532/
Cumulative explanation percentage/%36.88759.78371.315/
Table 6. Load matrix and Norm value of each indicator for soils in red bed desertification area.
IndicatorsTDSMDS
CommunalityWeightCommunalityWeight
SOM (g/kg)0.6620.0840.4930.125
pH0.7790.0990.8190.207
W (%)0.6210.079
AN (mg/kg)0.4910.063
AP (mg/kg)0.8090.1030.8730.221
AK (mg/kg)0.7650.098
Ca2+ (mg/kg)0.8730.1110.8860.224
Mg2+ (mg/kg)0.6260.080
A-Cu (mg/kg)0.8330.1060.8830.223
A-Zn (mg/kg)0.6890.0880.4930.125
A-Fe (mg/kg)0.6950.089
Disclaimer/Publisher’s Note: The statements, opinions and data contained in all publications are solely those of the individual author(s) and contributor(s) and not of MDPI and/or the editor(s). MDPI and/or the editor(s) disclaim responsibility for any injury to people or property resulting from any ideas, methods, instructions or products referred to in the content.

