Article

Ecological Security Pattern Construction and Multi-Scenario Risk Early Warning (2020–2035) in the Guangdong–Hong Kong–Macao Greater Bay Area, China

School of Geography, South China Normal University, Guangzhou 510631, China
*
Author to whom correspondence should be addressed.
Land 2024, 13(8), 1267; https://doi.org/10.3390/land13081267
Submission received: 12 July 2024 / Revised: 4 August 2024 / Accepted: 9 August 2024 / Published: 12 August 2024

Abstract

:
The effectiveness of ecological security patterns (ESPs) in maintaining regional ecological stability and promoting sustainable development is widely recognized. However, limited research has focused on the early warning of risks inherent in ESPs. In this study, the Guangdong–Hong Kong–Macao Greater Bay Area (GHKMGBA) is taken as the study area, and ecological security risk zones are delineated by combining the landscape ecological risk index and habitat quality, and a multi-level ESP is constructed based on the circuit theory. The PLUS model was employed to simulate future built-up land expansion under different scenarios, which were then extracted and overlaid with the multi-level ESP to enable the multi-scenario early warning of ESP risks. The results showed the following: The ESP in the central plains and coastal areas of the GHKMGBA exhibits a high level of ecological security risk, whereas the peripheral forested areas face less threat, which is crucial for regional ecological stability. The ESP, comprising ecological sources, corridors, and pinch points, is crucial for maintaining regional ecological flow stability, with tertiary corridors under significant stress and risk in all scenarios, requiring focused restoration and enhancement efforts. There are significant differences in risk early warning severity within the ESP across various development scenarios. Under the ecological protection scenario, the ESP will have the best early warning situation, effectively protecting ecological land and reducing ecological damage, providing a valuable reference for regional development policies. However, it must not overlook economic development and still needs to further seek a balance between economic growth and ecological protection.

1. Introduction

With the rapid development of the economy and urbanization, built-up land has continuously expanded at the expense of occupying a large amount of ecological land, thus causing many eco-environmental problems and threatening ecological security [1,2]. Ecological security patterns (ESPs) are mainly composed of landscape elements in different spatial locations [3] and are an effective way to ensure the integrity of ecosystem structures and processes, maintain ecological security, and support sustainable development [4,5]. At present, the ESP has been listed among China’s three main strategic patterns of protection and development of China’s territorial space and has become a long-term strategy for coordinating the economic growth and ecological protection of China.
Currently, the basic paradigm of “ecological source identification–resistance surface construction–corridor and pinch point extraction” is established in ESP construction. Ecological sources are patches with high ecosystem service value, stable ecological functions, and continuity [6,7], and their identification methods include direct selection, morphological spatial pattern analysis (MSPA), and comprehensive index evaluation [8,9,10]. Among them, the direct selection method is more subjective, while the MSPA method improves identification by emphasizing landscape connectivity between patches, but it relies solely on land use data and overlooks the spatial heterogeneity and functional attributes of ecological land [7]. The comprehensive index evaluation method, however, excels in ecological source identification by assessing multiple functional indicators like soil conservation, carbon fixation, and ecological sensitivity, while also considering landscape connectivity to select ecological sources more scientifically and objectively [11,12]. Resistance surface construction is the key preliminary work to extract ecological corridors and pinch points, and there are two main ideas: (1) take the reciprocal of habitat quality as the resistance value to construct the resistance surface [7]; (2) construct the resistance surface based on the land use type, and combine with the natural environment, social, and economic data for correction [13,14]. However, the first approach overlooks non-habitat factors like topography and human activity, leading to resistance surfaces that may not accurately reflect ecological flow diffusion. In contrast, the second approach provides a more comprehensive and scientific assessment by incorporating land use, natural environment, and socioeconomic data. Ecological corridors and pinch points are typically extracted using the MCR model, gravity model, or circuit theory model [15,16,17]. Among them, the circuit theory model quantifies the importance of ecological corridors and nodes using species’ random walk characteristics, setting thresholds and key nodes to define ecological protection areas. This approach effectively evaluates ecological connectivity, accurately estimates corridor widths, and identifies node locations [18,19].
Generally, scholars often use the landscape connectivity analysis method or gravity model to measure the intensity of interaction between ecological sources to divide ESP levels [20,21]. However, such methods simplify the relationship between ecological sources into a linear or simple nonlinear mode, and fail to fully consider the influence of complex and changeable environmental factors in the real ecosystem. In recent years, the habitat quality model and landscape ecological risk model have become hot tools for ecological security research [22]. Habitat quality, a key indicator of ecosystem health and sustainability, reveals ecosystem security by measuring habitat response to environmental threats and their interaction distances [23]. Landscape ecological risk refers to the possibility of disturbance in each part of the landscape and is used to measure the state and degree of regional ecological security [24]. Previous studies have demonstrated that combining the habitat quality model with the landscape ecological risk model and considering the impact of land environment factors on ecology can ensure a more comprehensive risk assessment of regional ecological security [22]. Therefore, the present paper combines the two methods to divide the ecological security risk zones, and overlays them with the constructed ESP, thus generating a multi-level ESP.
ESP construction has yielded fruitful results, but risk early warning and effective protection based on ESPs remain critical challenges for promoting regional sustainable development. Based on the constructed ESP, some scholars demarcate core protected areas or set up ecological barriers to reduce the destruction of human activities [25,26,27], or they identify key ecological restoration areas and early warning points by simulating the land use changes to determine the urgency of ESP protection, and thus divide the spatial partition zones of ecological protection and restoration [28,29,30]. Although the protection, restoration, and early warning points of ESPs have been analyzed in these studies, there is still a lack of discussion on the construction of different levels of ESP buffers and the identification of early warning level [31]. With the further development of the economy and urbanization, built-up land expansion is inevitable, and its interference with ecosystems will continue [32]. Simulating future land use changes and their ecological threats can help decision-makers identify and prevent future risks in advance [33]. The common land use change simulation models are cellular automata (CA), multi-agent systems, CLUE-S, FLUS, PLUS, etc. [34,35,36]. Among them, the PLUS model integrates Land Expansion Analysis Strategy (LEAS) and CA based on Multiple Random Seeds (CARS), which can effectively explore the driving factors of land expansion and simulate land use changes [37]. Moreover, the PLUS model is easy to operate and has high simulation accuracy, making it suitable for land use change simulation at various scales [38,39]. Therefore, this paper uses the PLUS model to simulate future land use patterns under multiple scenarios, identify built-up land expansion, and overlay them with current multi-level ESPs for multi-scenario risk warnings.
In recent decades, China’s massive urbanization has led to numerous ecological issues, including declining habitat quality, fragmentation of ecological networks, and extensive damage to ecological lands [40,41]. The GHKMGBA, as the most vibrant urban conglomerate, faces severe ecological issues due to rapid urbanization, including loss of ecological land and disruption of ecological networks [42,43,44]. With the implementation of the Guangdong–Hong Kong–Macao Greater Bay Area Development Outline, the economy and urbanization in the region will further develop, more land development activities are expected to occur, and the threat of anti-ecological behavior will continue or even increase. Therefore, this paper takes the GHKMGBA as the study area to maintain regional ecological stability by constructing a regional ESP, identifying the ecological threats brought about by the future expansion of built-up land, and predicting and guarding against the future risks of the regional ESP. The objectives of this study are to (1) identify ecological sources through an integrated “ecosystem service importance–ecological sensitivity–landscape connectivity” assessment methodology; (2) extract ecological corridors and pinch points based on circuit theory, combined with ecological security risk zones delineated by landscape ecological risk index and habitat quality, to construct a regional multi-level ESP; and (3) simulate the multi-scenario land use patterns in 2035 using the PLUS model, and extract future built-up land expansion areas and overlay them with the current multi-level ESP to identify the risk warning level of the regional ESP.

2. Materials and Methods
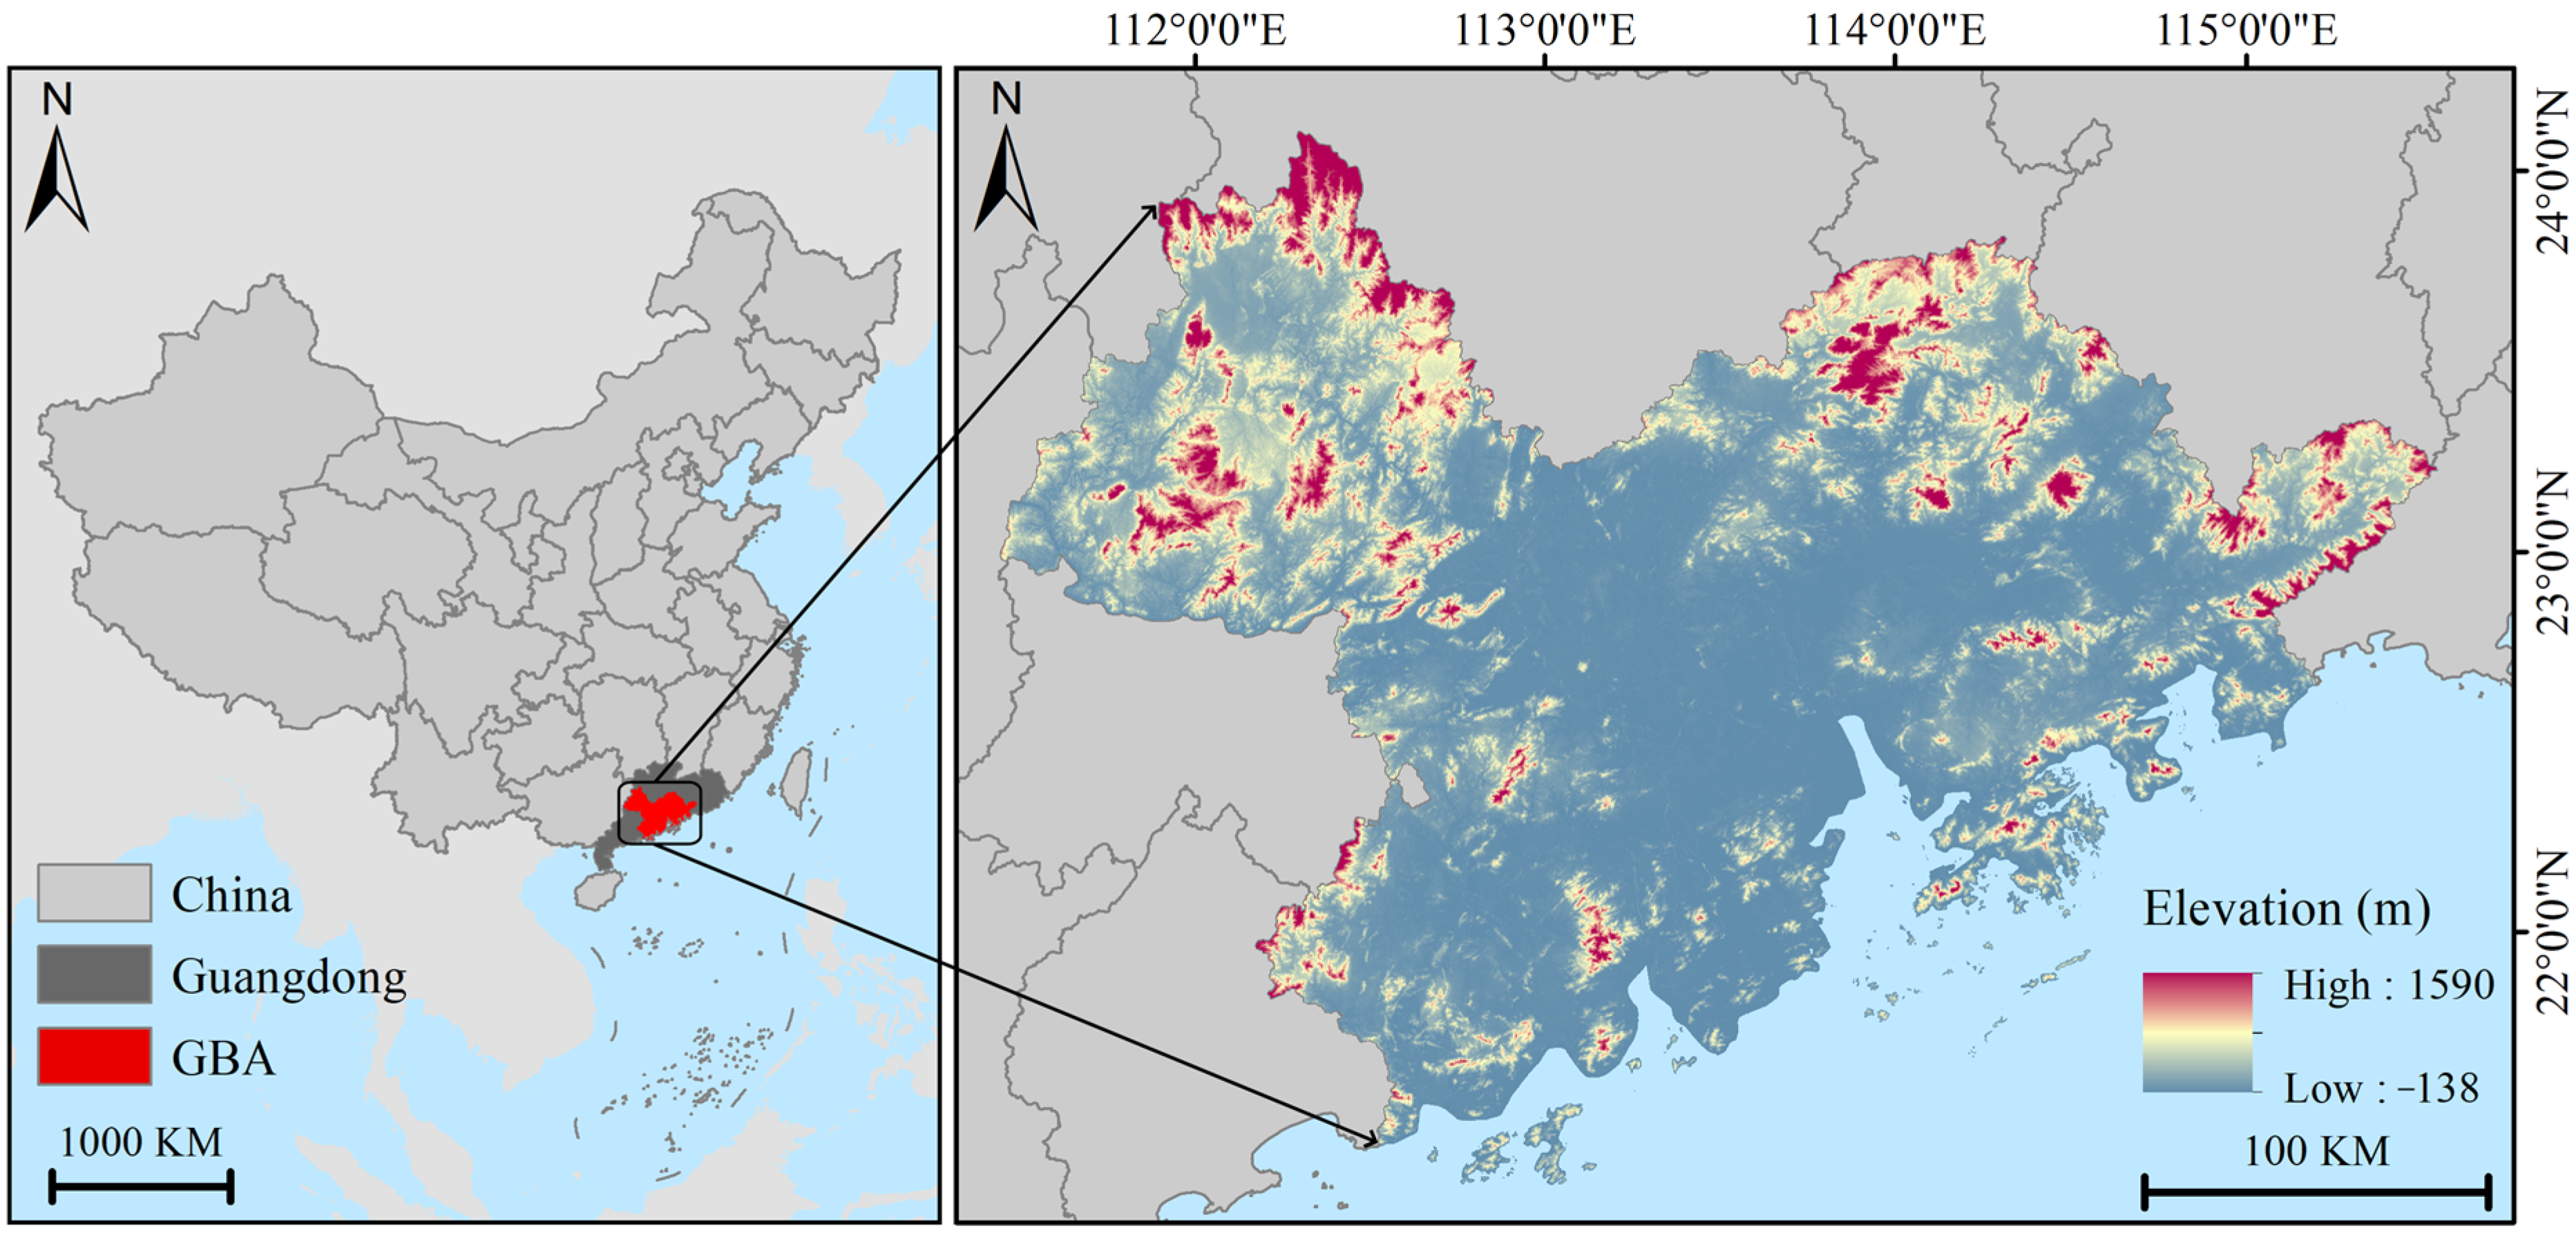
2.1. Study Area

The GHKMGBA (21°57′ N–24°39′ N, 111°36′ E–115°42′ E) is located near the mouth of the Pearl River, bordering the South China Sea, with a total area of 56,000 km2 (Figure 1). The region has a subtropical monsoon climate with mild weather year-round, averaging 21 to 23 °C annually. The region experiences abundant precipitation, mainly concentrated in the summer, with yearly rainfall exceeding 1500 mm. Its zonal vegetation consists of evergreen leafy monsoon rainforests typical of the southern subtropics. The soils of the district are dominated by the red soil type due to a combination of monsoon climatic and biological factors. The topography features higher elevations in the northeast and northwest, with lower altitudes in the southeast and central areas. Mountains are primarily located in the north, while the central part and coastal belt consist mainly of plains. In 2020, the resident population of the region reached 86.14 million people. With a gross domestic product (GDP) of CNY 11.5 trillion, it accounts for about 12% of China’s GDP despite having only 6% of China’s population and 0.58% of its land area. This makes the region one of the most economically vibrant in China. However, the region’s rapid economic and urbanization development has been accompanied by a sharp expansion of built-up land, a decrease in ecological land, and degraded connectivity of ecological corridors [42]. Under the dual pressure from land development and ecological protection, it has become an urgent task to give early warning of the risk that the ESP may be compromised by the potential expansion of built-up land in the region.

2.2. Data Sources and Processing

This study uses 2020 as the base year because it aligns with the planning nodes of major policies like the 14th Five-Year Plan and the Guangdong–Hong Kong–Macao Greater Bay Area Development Plan. Additionally, 2020 data are complete and well organized, facilitating in-depth study and ensuring the research’s relevance and timeliness. The data used in this paper are shown in Table 1. The land use data of GHKMGBA for 2000, 2010, and 2020 used in this study were obtained from the National Ecological Science Data Center. The original land use data were reclassified into six types: arable land, forestland, grassland, built-up land, water area, and unused land, which were mainly used for the construction of ESP and land use simulation. In the construction of ecological security risk zones, land use data were employed for habitat quality assessment and the calculation of the landscape ecological risk index. Additionally, the aforementioned land use data were used in the process of constructing ESP. The Digital Elevation Model (DEM), potential evapotranspiration, vegetation coverage, annual average precipitation, annual average temperature, slope, and soil data were obtained from the corresponding websites listed in Table 1 and were used for the evaluation of ecosystem service value and ecological sensitivity during the selection process of ecological sources. Nighttime light, road, and relief degree of land surface were taken as crucial factors in the construction of the resistance surface. The Patch-based Land Use Simulation (PLUS) model primarily requires land use data and driving factor data. The land use data utilized in the PLUS model are identical to those employed in the aforementioned processes. Concerning the data on driving factors, the majority of these are analogous to the meteorological data, socioeconomic data, and natural environment data that were employed in the construction of the ESP. In addition, river, GDP, and population density data are also included.
To ensure the consistent spatial resolution of the raster data, we resampled all the above raster data to 30 m × 30 m.

2.3. Delineation of Ecological Security Risk Zones

Habitat quality models and landscape ecological risk models can delineate regional ecological security risk zones [22], providing a basis for generating a multi-level ESP.

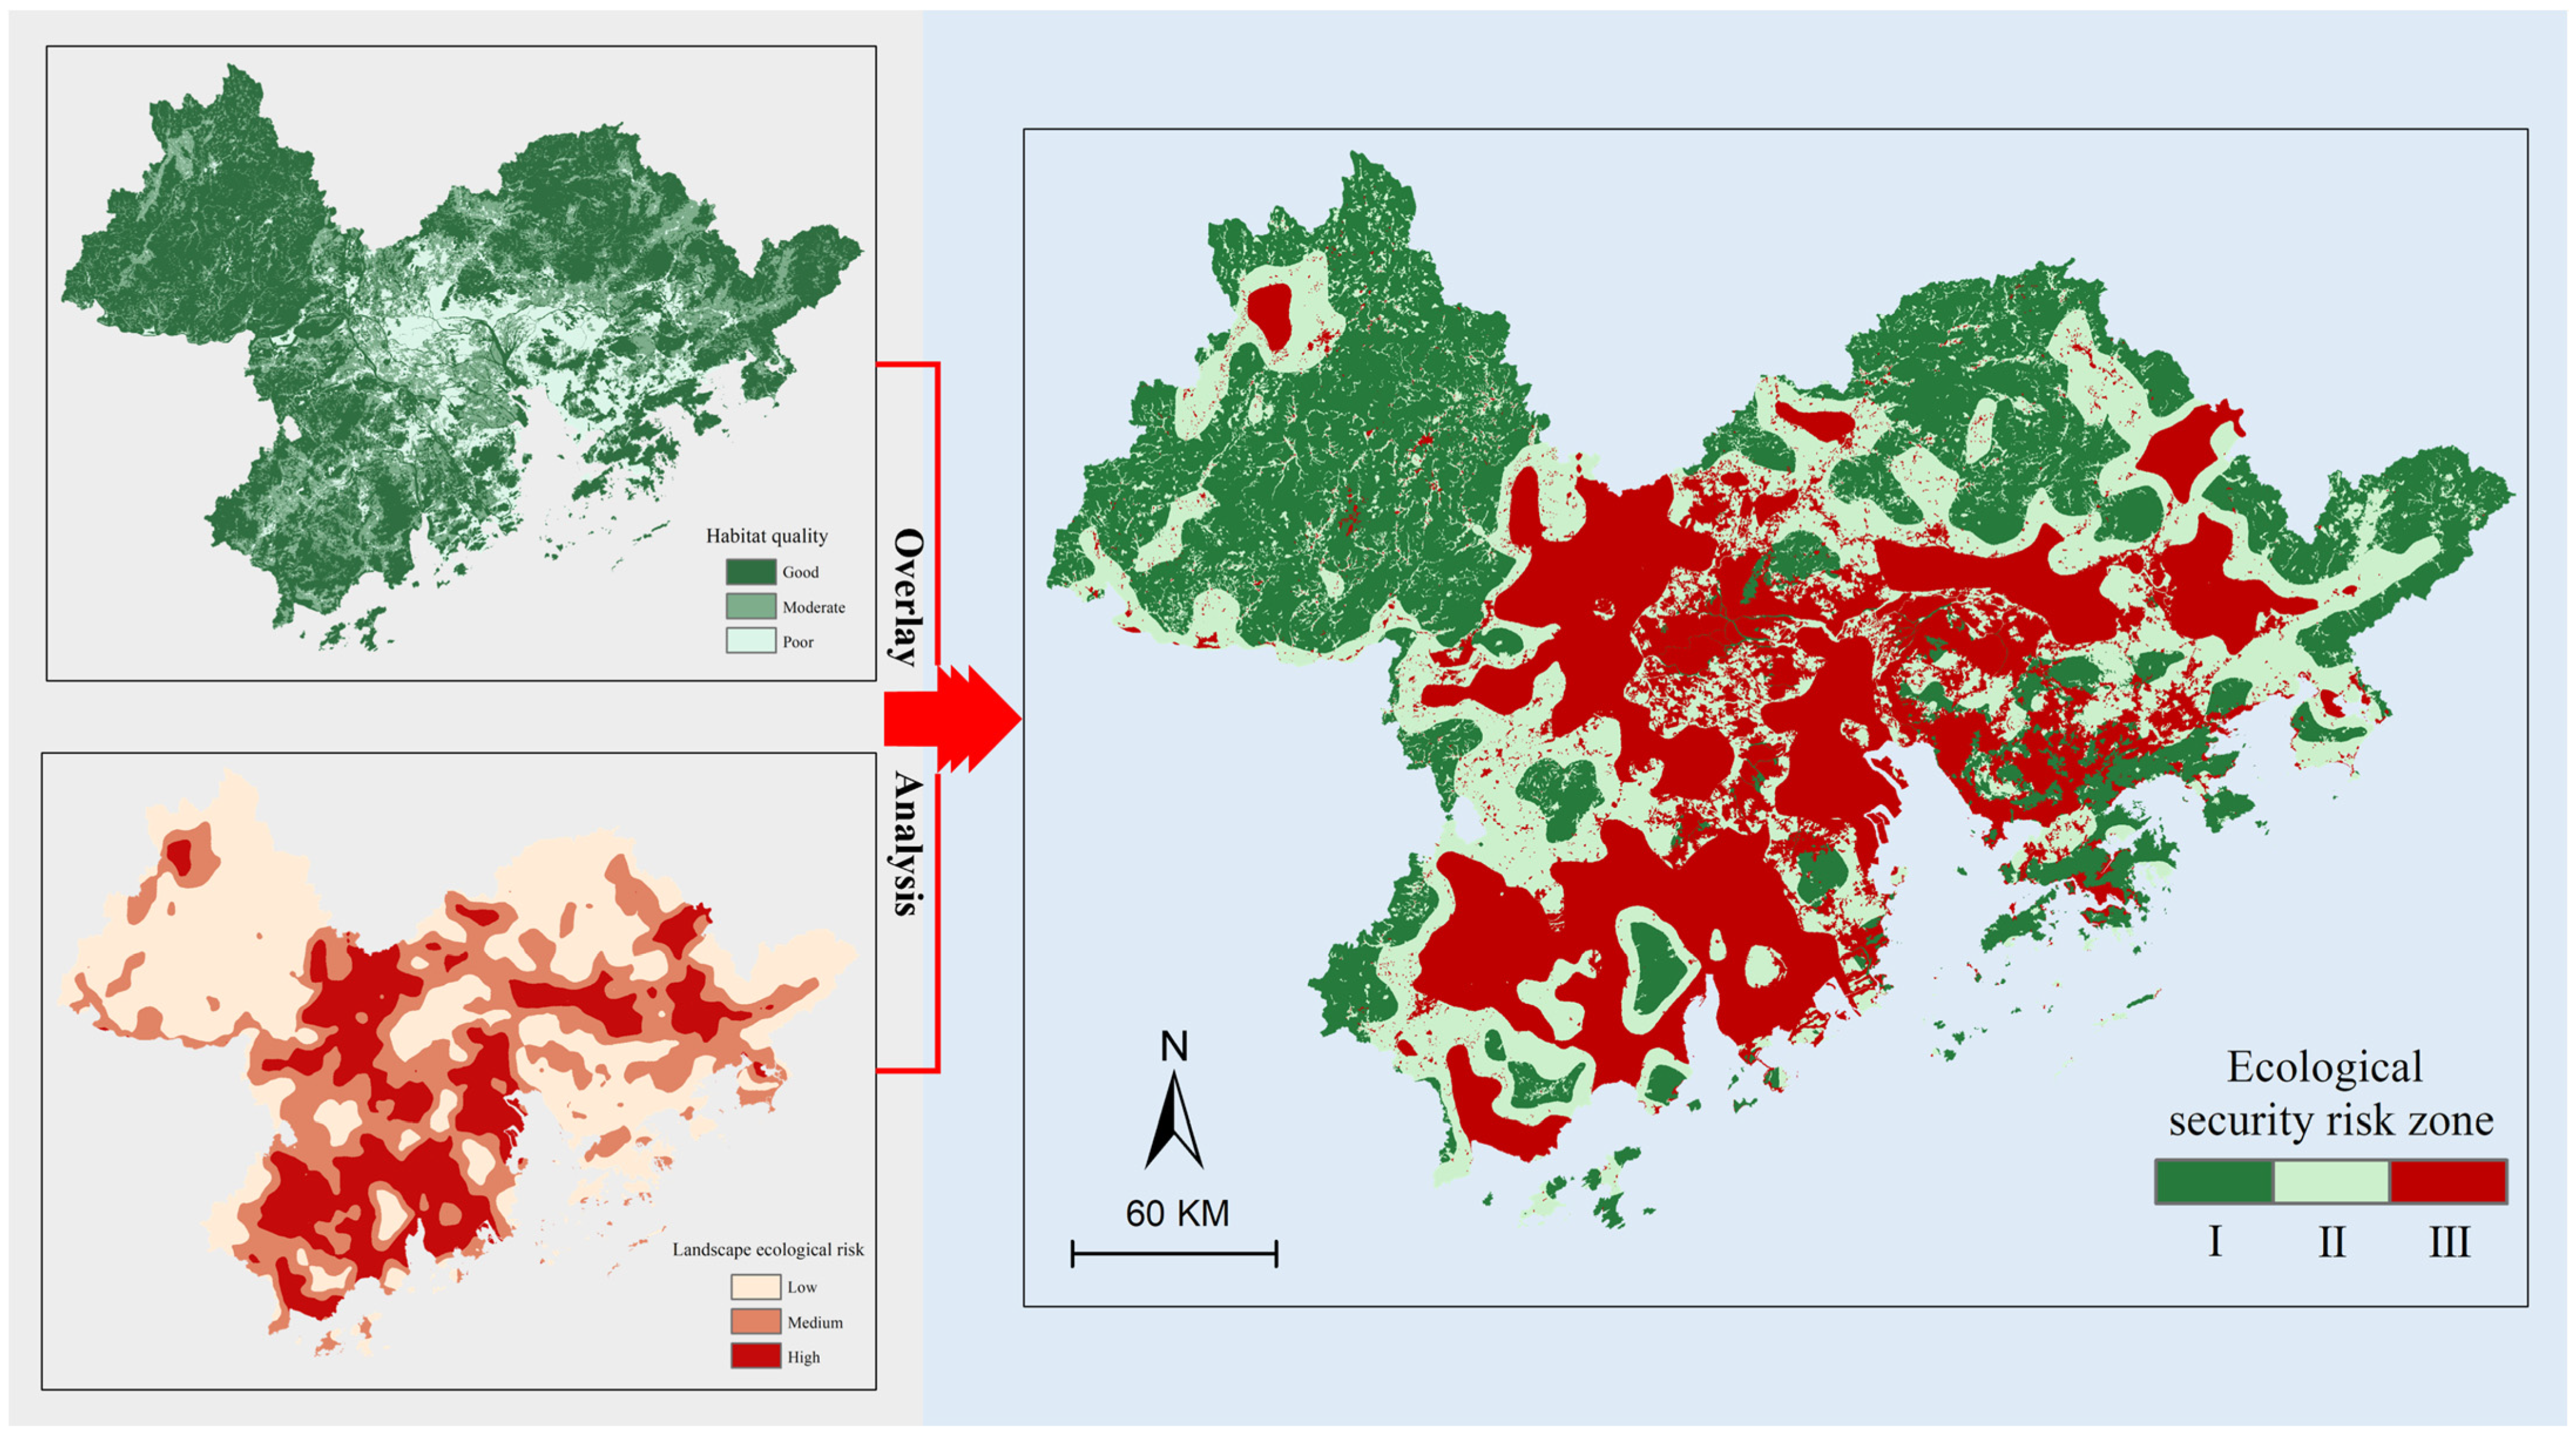
2.3.1. Habitat Quality Assessment

Habitat quality is one of the crucial indicators of ecological value, and its improvement is conducive to the protection of biodiversity and the realization of better ecosystem services [45,46]. This study employs the habitat quality module from InVEST to assess habitat quality, with values ranging from 0 to 1. Typically, higher values indicate enhanced biodiversity and diminished human interference. Its calculation formula is as follows:
Q x j = H j 1 D x j z D x j z + K z
where Qxj is habitat quality of unit x in landscape type j, Hj refers to the habitat suitability of landscape type j, and z and k are the scale constant and the semi-saturation constant, respectively. Dxj is the habitat degradation degree of unit x in landscape type j, and the formula is as follows:
D x j = r = 1 R y = 1 Y r w r r = 1 R w r r y i r x y β x S j r
where R means the number of threat factors, Yr is the total number of units with threat factors, wr is the weight value of the threat factors, ry is the number of threat factors on the grid unit, irxy is the threat distance between the grid unit x and the threat source grid y, and βx is the accessibility level of threat factor of unit x, which is influenced by legal policies, physical protection, and other factors. Sjr is the sensitivity of landscape j to threat factor r. The parameters and weights of habitat threat sources were determined through multiple iterations of experimentation, benchmarking against relevant research findings, and review of the InVEST model manual and related literature [7,47,48], ensuring that the parameters accurately reflect the region’s true habitat conditions.

2.3.2. Landscape Ecological Risk Model

To comprehensively express the potential harmfulness of different landscape types under the influence of the outside world, the present paper selects the area ratio of land use types, landscape disturbance index, and landscape vulnerability index to construct the land use ecological risk index regarding the related research [22,49], and the calculation formula is as follows:
E R I k = i = 1 n A k i A k × E i × F i
where ERIk is the ecological risk index of land use in unit k, Ak and Aki are the area of unit k and the area of land type i in unit k, and Ei and Fi are the landscape disturbance index and landscape vulnerability index of land type i, respectively.
(1) Ei indicates the degree to which landscape elements are disturbed by external environment [50], and it can be expressed as follows:
E i = a C i + b S i + c U i
where a, b, and c are the weights of the index, a + b + c = 1, and values of 0.5, 0.3, and 0.2 were assigned according to the literature [24,51], respectively. The Ci, Si, and Ui expressions are as follows:
S i = D i P i
D i = 1 2 n i A
U i = 1 + n i n + P i 3
where Si means the landscape separation degree of land type i, Di is the distance index of land type i, Ui is the landscape dominance of i land type, n is the total number of patches in the unit, Pi is the area ratio of land type i, A is the unit area, and ni has the same meaning as above.
(2) Fi represents the vulnerability of landscape elements to external disturbances, determined by assigning values to different land types, normalizing them through expert consultation, and adjusting based on real-world conditions. According to research [52] and expert opinions, the normalized vulnerability indexes for six land types are as follows: arable land 0.190, forestland 0.095, grassland 0.143, water area 0.238, built-up land 0.048, and unused land 0.286.
The natural break point method is used to classify the calculated habitat quality of each grid unit in the study area in 2020 into three grades: poor (0–0.30), moderate (0.31–0.60), and good (0.61–1). The landscape ecological risk value of each grid unit is divided into low (0.16–0.29), medium (0.30–0.38), and high (0.39–0.56). After that, the study area is divided into three ecological security risk zones, Grade I, Grade II, and Grade III, according to the rules in Table 2.

2.4. Identifying Ecological Security Patterns

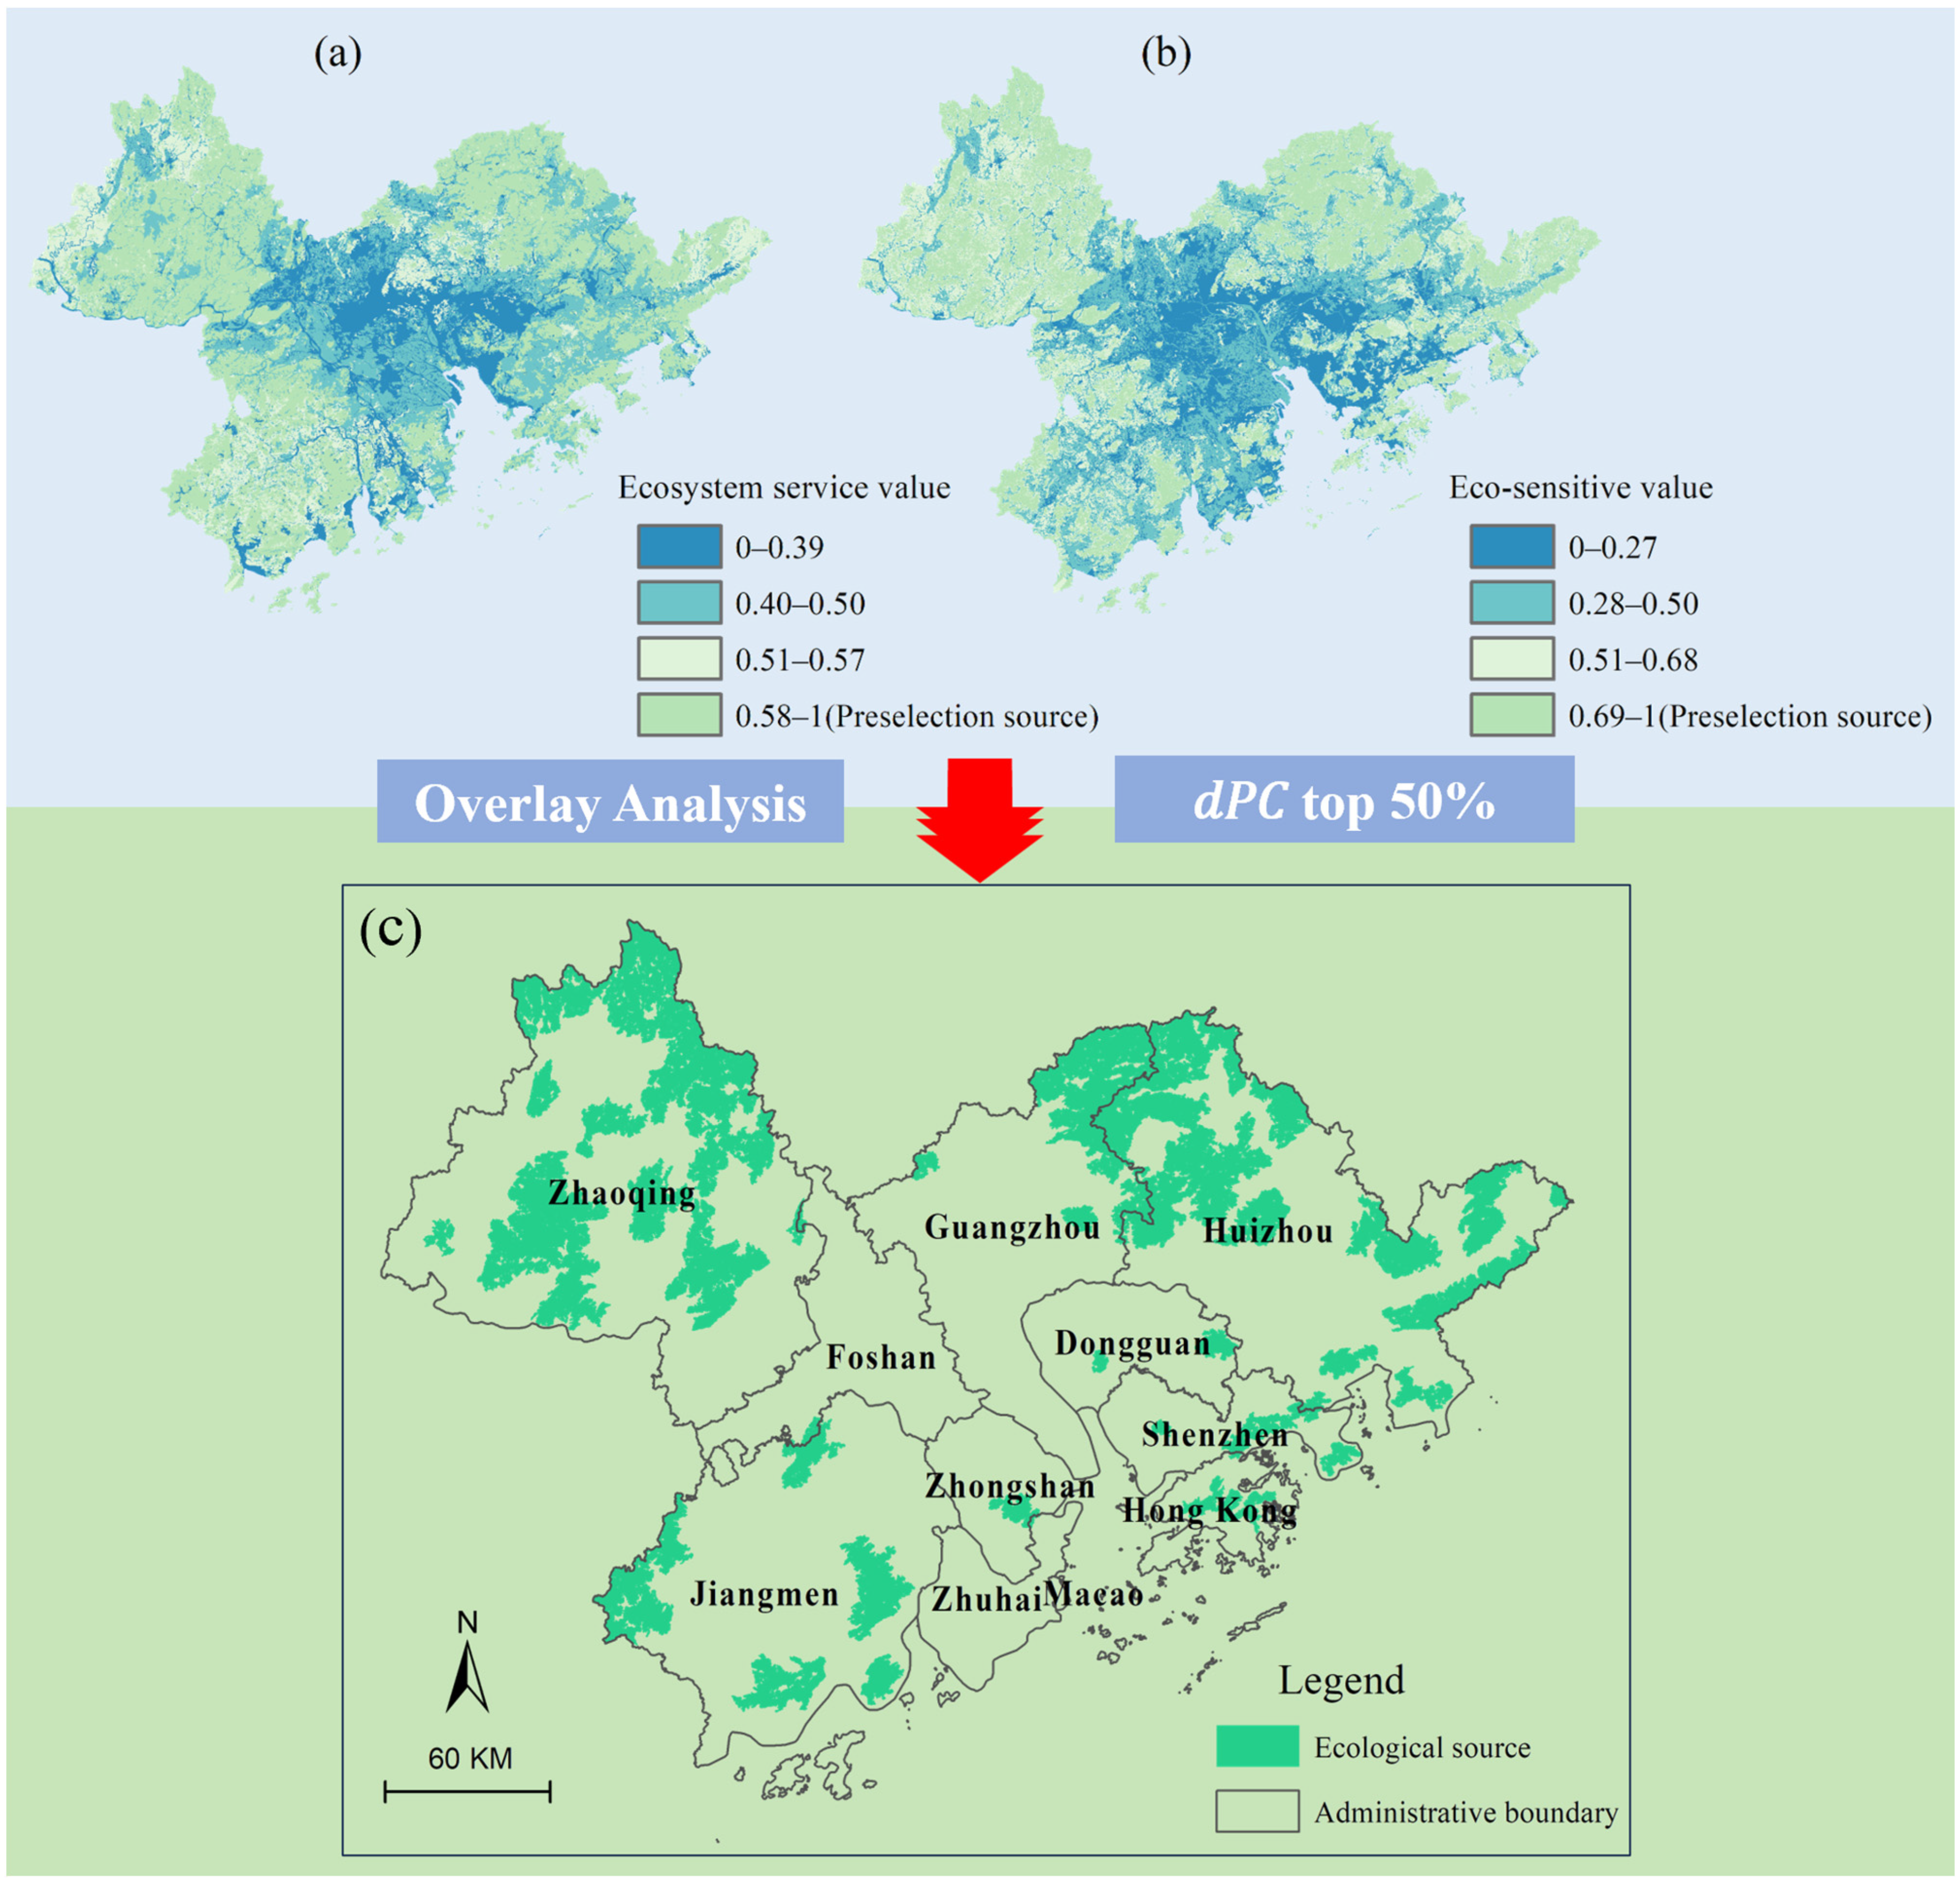
2.4.1. Identify Ecological Sources

Ecological sources are patches with high ecosystem service value and ecological sensitivity and good connectivity, which are essential for regional ecological security [12,53]. Therefore, this paper adopts the comprehensive evaluation method of “ecosystem service importance–ecological sensitivity–landscape connectivity” to identify ecological sources.
(1)
Ecosystem service value assessment
Ecosystem services offer various benefits essential for human well-being and ecosystem health, becoming crucial indicators for assessing ecological conditions [54,55]. Soil conservation is critical for measuring ecosystem services because it is about the risk of regional soil and water conservation [56]. With large-scale lakes and dense river networks, water conservation is another key ecosystem service. Carbon storage capacity, a critical indicator for climate change mitigation, underscores the importance of carbon sequestration in ecosystem services. With a comprehensive consideration of the relevant research [54,55], the demand for ecosystem services, and data availability, three ecological services of soil conservation, water conservation, and carbon sequestration were selected and calculated with the help of the InVEST model. These services were quantitatively assessed through normalization and superposition analysis, with the specific evaluation method detailed in Table 3 [56,57,58,59].
(2)
Ecosystem sensitivity assessment
The purpose of ecosystem sensitivity assessment is to quantify the response degree of ecosystem to external interference, and the index system is usually constructed by an analytic hierarchy process or entropy weight method [54,60]. In this paper, seven factors, including elevation, slope, annual average temperature, annual average precipitation, soil erosion, vegetation coverage, and land use type, are selected to evaluate ecosystem sensitivity by the analytic hierarchy process.
(3)
Landscape connectivity evaluation
PC is an important indicator to measure the landscape pattern and function, and its value can measure the importance of each patch to landscape connectivity [5]. The formula is as follows:
P C = i = 1 n j = 1 n A i A j p i j * A L 2
where n represents the number of patches in the landscape, Ai and Aj represent the areas of patches i and j, respectively, AL is the total area of the study area, and p i j * is the probability of direct diffusion of ecological flow between patches i and j. The value of PC varies from 0 to 1.
The change in landscape connectivity of the whole study area after a patch is removed (recorded as dPC) can be used to analyze the importance of each patch to the connectivity of the whole study area, and the calculation formula is as follows:
d P C = P C P C r e m o v e P C × 100 %
where PCremove is the possible connectivity index of the landscape composed of the remaining patches after removing a single patch. The higher the dPC value of a patch, the more important it is to the landscape connectivity of the whole study area.
According to the related literature [11,12], the actual situation of the study area, and the repeated experiments, the area with an ecosystem service value greater than 0.58 and an ecological sensitivity value greater than 0.69 was selected as the pre-selected S, and then the larger patches with an area greater than 20 km2 were selected as the alternative S. Then, the dPC values of each alternative ecological source were calculated by Conefor2.6 software. Finally, according to the order of dPC values and the actual situation of the study area, the top 50% of patches were selected as the final ecological sources.

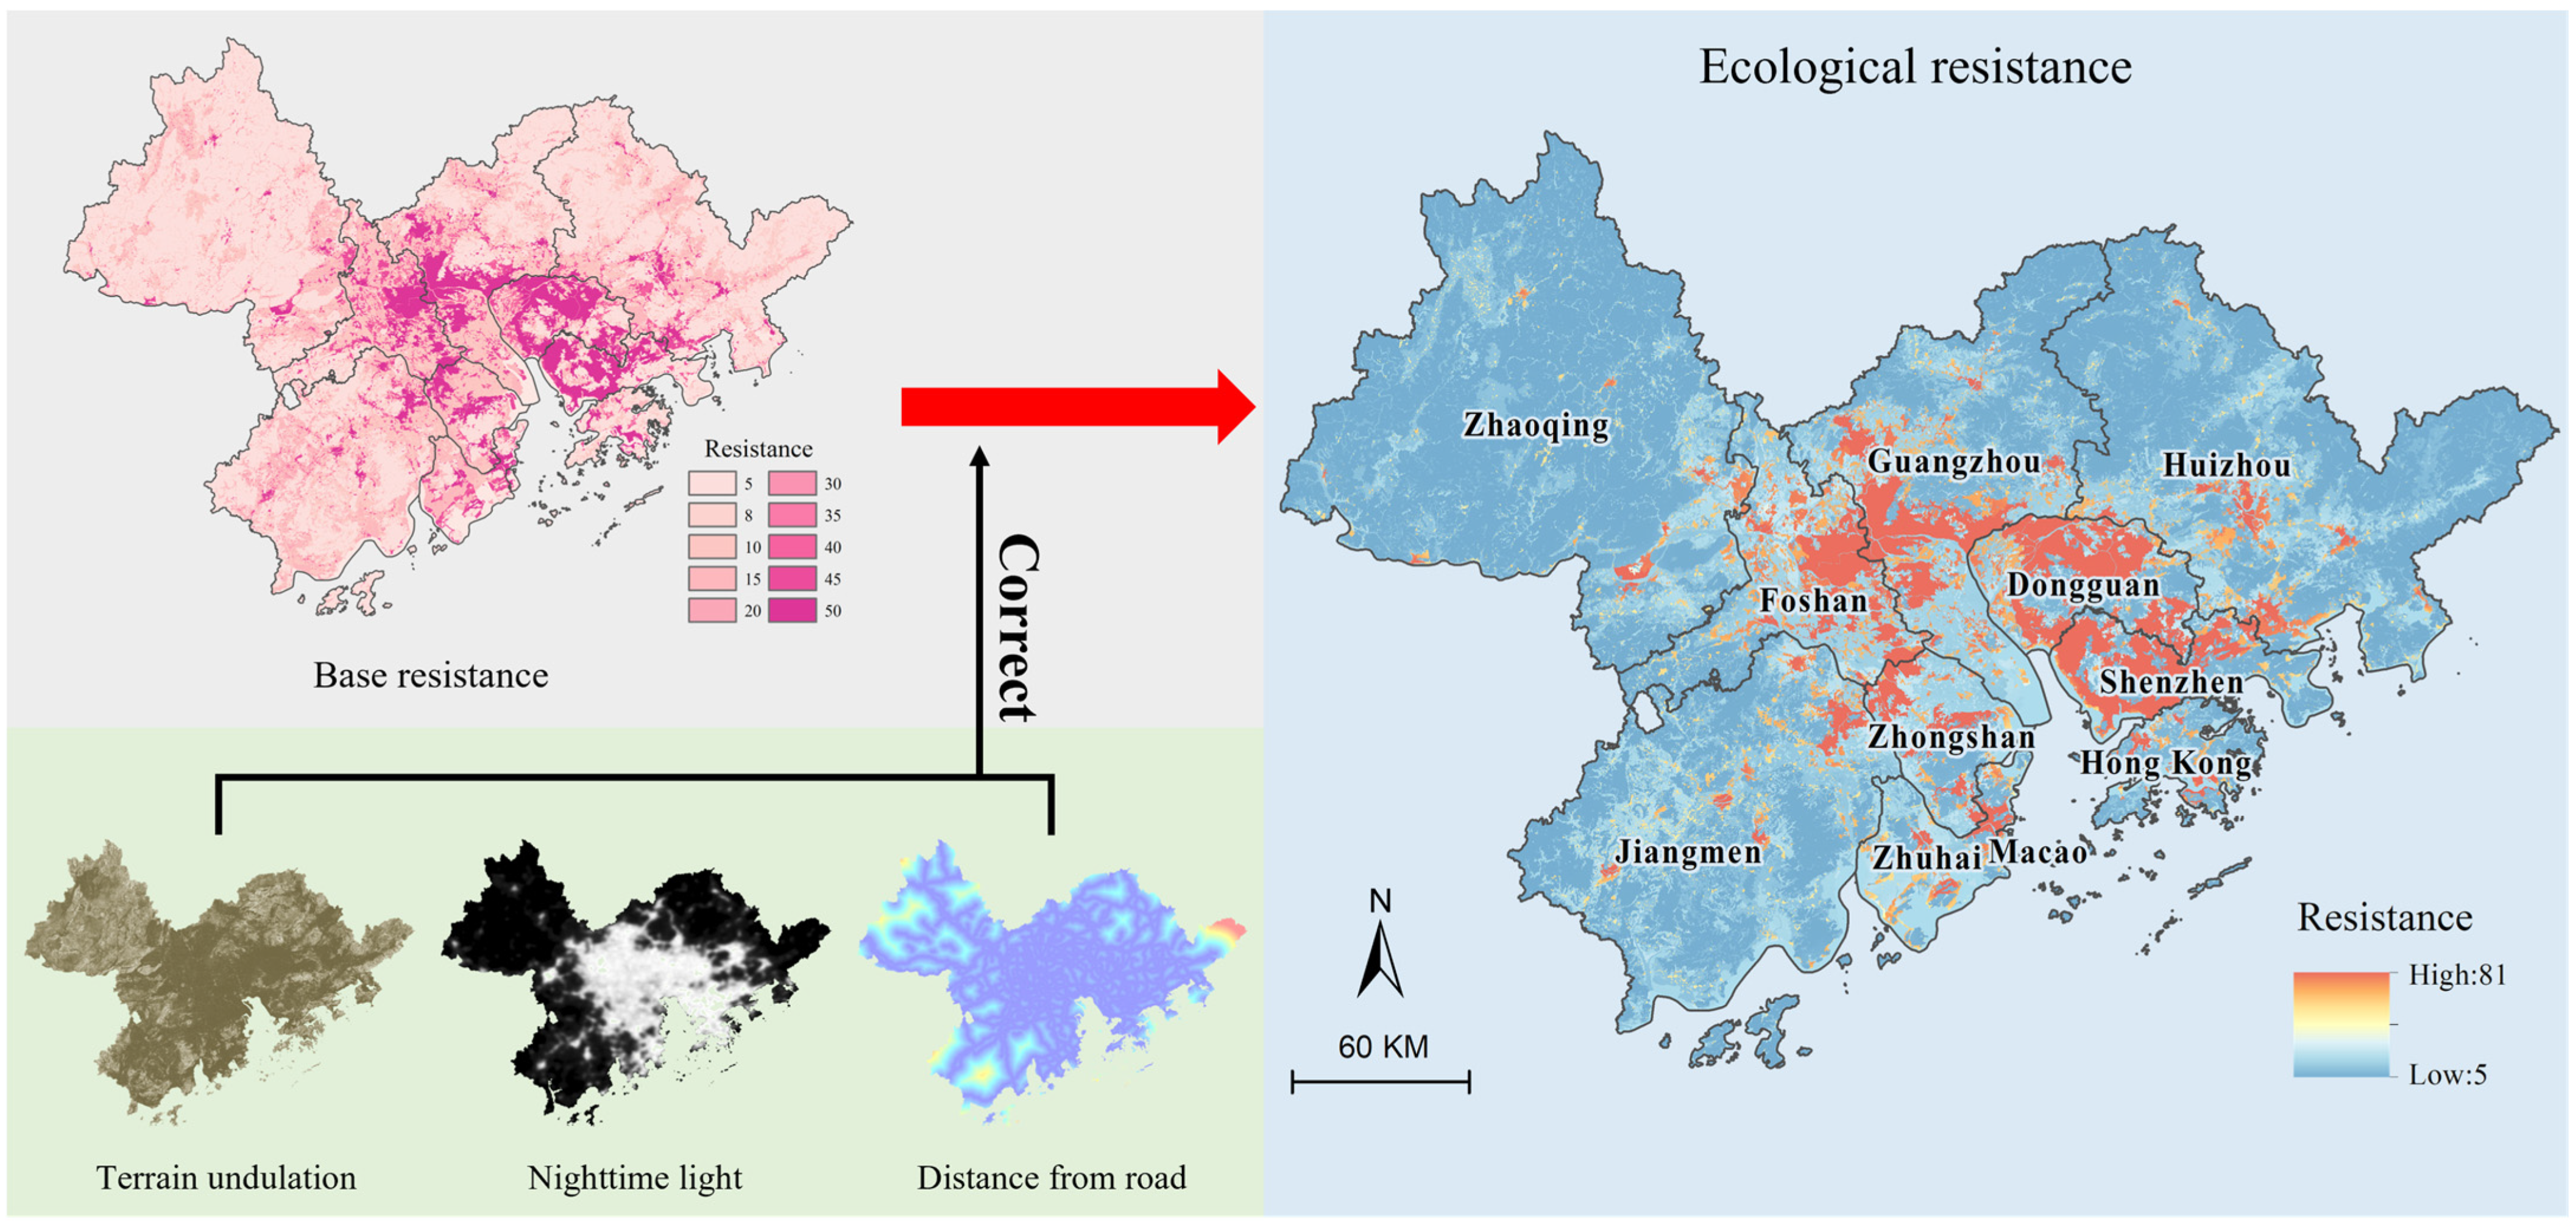
2.4.2. Resistance Surface Construction

Ecological resistance refers to the intensity of obstruction when the ecological flow migrates between different landscape units, reflecting the interference of external conditions on ecological flow [4,61]. Based on the relevant research [5] and the regional characteristics, this paper first gives the initial resistance value on the foundation of the land use situation (Table 4), and then corrects it by Equation (10) with 3 factors of night light intensity, terrain undulation, and distance from the road to obtain the comprehensive resistance value of each unit, thus constructing the resistance surface.
R s i = N L i + R o a d i + R e l i e f i × R i
where Rsi is the comprehensive resistance value of unit i, NLi is the night light intensity of unit i, Roadi is the distance from unit i to the nearest road, and Reliefi is the topographic relief of unit i. Ri is the initial resistance value of unit i.

2.4.3. Corridors and Pinch Points Extraction

The circuit theory model [62,63] is used to identify ecological corridors and pinch points. The model was taken by McRae (2006), who integrated physical circuit theory into landscape ecology. It regarded a species or gene as an electron in the circuit and the landscape surface as a resistive surface and revealed the diffusion and migration path of species on the landscape surface through current simulation [64]. As a low-resistance area, ecological corridors are essential for maintaining ecological processes and enhancing landscape connectivity [7]. The area with high current density in the process of current diffusion is defined as pinch points, which play a vital role in the process of ecological flow diffusion.
Through the Linkage Mapper toolbox, the cumulative resistance value of electron motion is calculated according to the effective distance between ecological sources, and the low-resistance region is identified as ecological corridors. Then, the current density is analyzed by the Pinchpoint Mapper tool in the Linkage Mapper toolbox. According to the natural breaking point method, the current density is divided into five grades, and the area with the largest grade current density is selected as pinch points. After many verifications, it is finally determined that the weighted distance of corridor costs is set at 5 km to ensure the accuracy of the simulation results.

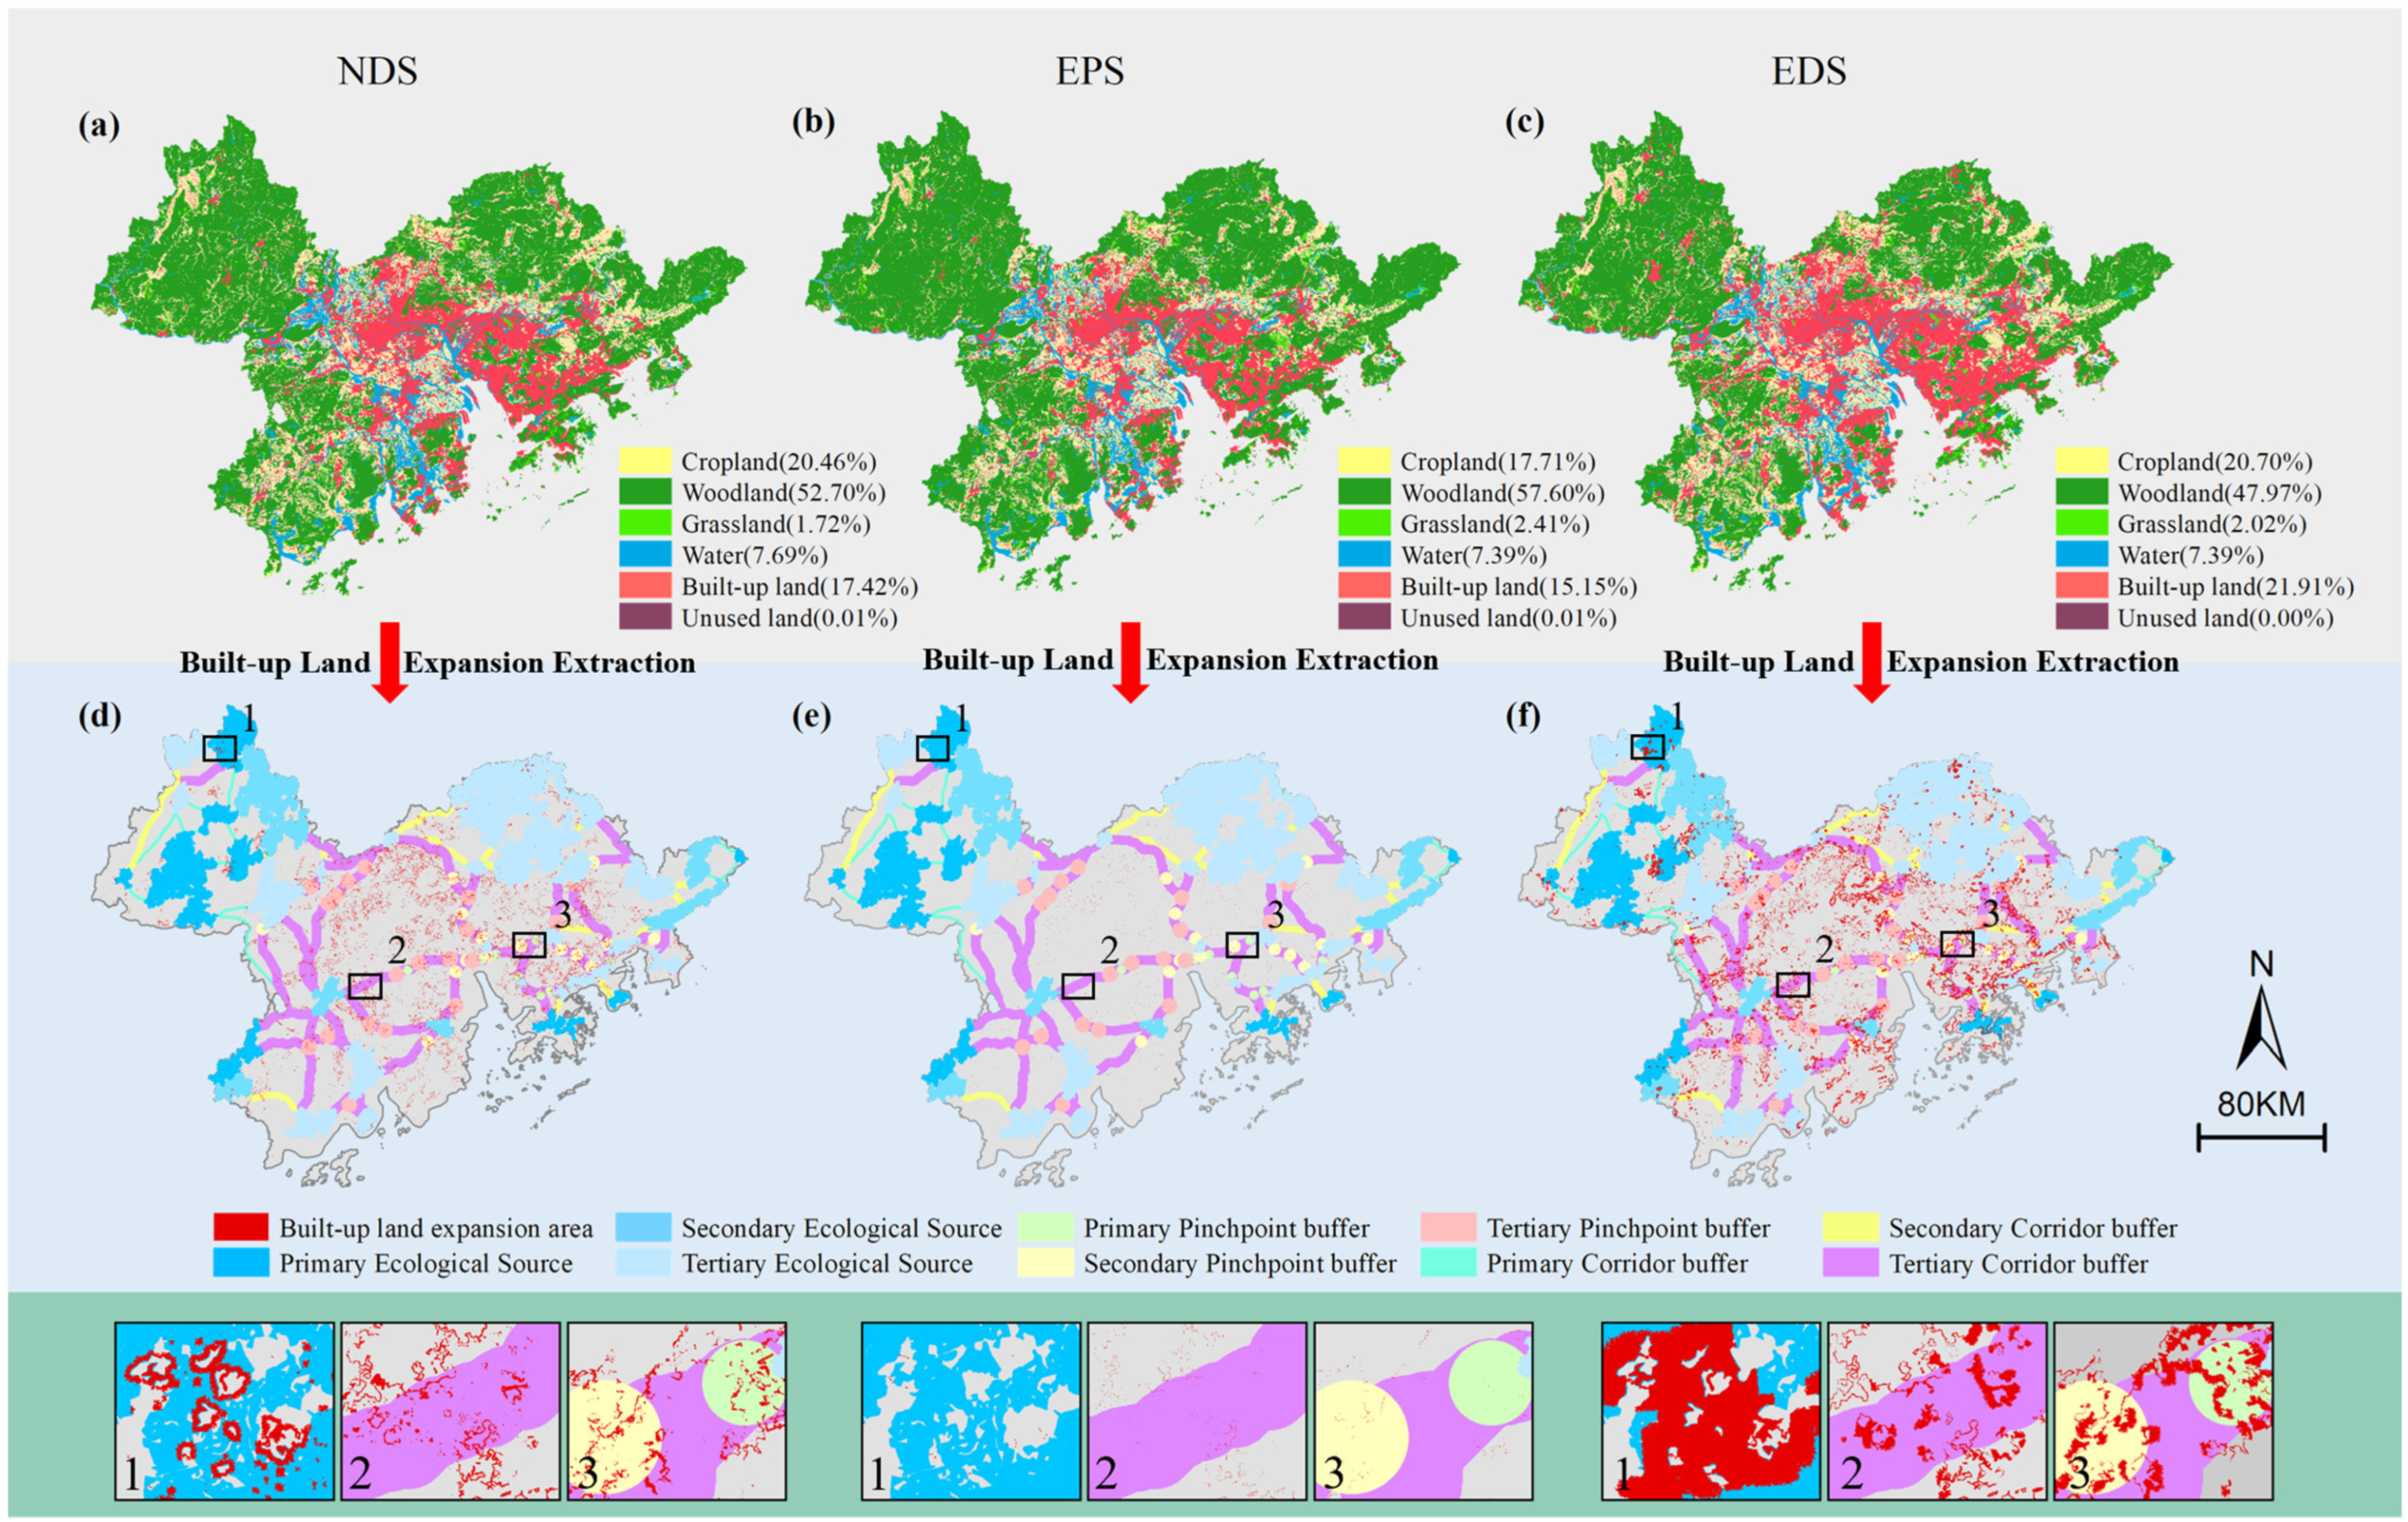
2.5. Multi-Scenario Risk Early Warning of Ecological Security Patterns

We utilized the approach of “simulating future land use patterns, extracting future built-up expansion areas, overlaying them with the multi-level ESP, and identifying the warning level of regional ESP risks” for ESP risk early warning. In this paper, the patch-generating land use simulation (PLUS) model is applied, comprising two key modules: Land Expansion Analysis Strategy (LEAS) and CA based on Multiple Random Seeds (CARS) [65]. LEAS uses the random forest algorithm to assess driving factors and determine development probabilities for each land use type. CARS integrates “top-down” land use demand with “bottom-up” simulation, using multi-type random seeds for land use competition and adjusting current land use to meet macro demands. Details of the PLUS model are provided by Liang et al. (2021).
Drawing on the Guangdong–Hong Kong–Macao Greater Bay Area Development Outline and relevant research [22], this study establishes three scenarios for simulating land use in the study area in 2035: the natural development scenario (NDS), the ecological protection scenario (EPS), and the economic development scenario (EDS). The configuration of each scenario is outlined as follows:
(1)
The NDS analyzes the land use change trend in the study area from 2000 to 2020 using the Markov model, without considering various macro-policy regulation requirements, to predict the future demand for each land type.
(2)
The EPS considers the environmental carrying capacity and ensures ecological benefits, building on the natural development scenario. Specific settings: grassland and forestland to built-up land is reduced by 30%, arable land and waters to built-up land by 20%, and built-up land to forestland is increased by 10%.
(3)
The EDS prioritizes economic benefits, aiming to boost economic output and urbanization rates, based on the natural development scenario. Specific settings: arable land, forestland, and grassland to built-up land increase by 20%, while built-up land to non-arable landscape types decreases by 30%.
Based on the 2035 land use pattern of the study area under simulated multi-scenarios, the expansion parts of built-up land in 2020–2035 under different scenarios are extracted and superimposed with the constructed multi-level ESP, and then classified according to the area occupied by the expansion of built-up land by various elements (ecological sources, ecological corridors, pinch points) in the ESP to identify the risk warning level of the regional ESP, thus realizing the multi-scenario risk early warning of the regional ESP.

3. Results

3.1. Results of Ecological Security Risk Zones Division

Through the method described in Section 3.1, the ecological security risk zones of the study area in 2020 are obtained. Figure 2 shows that the risk levels of ecological security in the study area are mainly concentrated in two levels, low risk level and high risk level, and the proportion of medium-risk areas is relatively small. Additionally, the risk distribution of regional ecological security shows significant regional differences, and it shows the trend of “high risk in the central part and low risk in the east and west” on the whole. The main reason may be that the central plains and some coastal areas have become areas of higher ecological security risk due to their flat topography, high level of human activity, high degree of land fragmentation, and low habitat quality. Conversely, at the edge of the study area, large expanses of forest maintain many ecological security risk units at a low risk level due to their high habitat quality and landscape integrity. This plays a crucial role in maintaining the overall stability of ecological security risks in the study area.

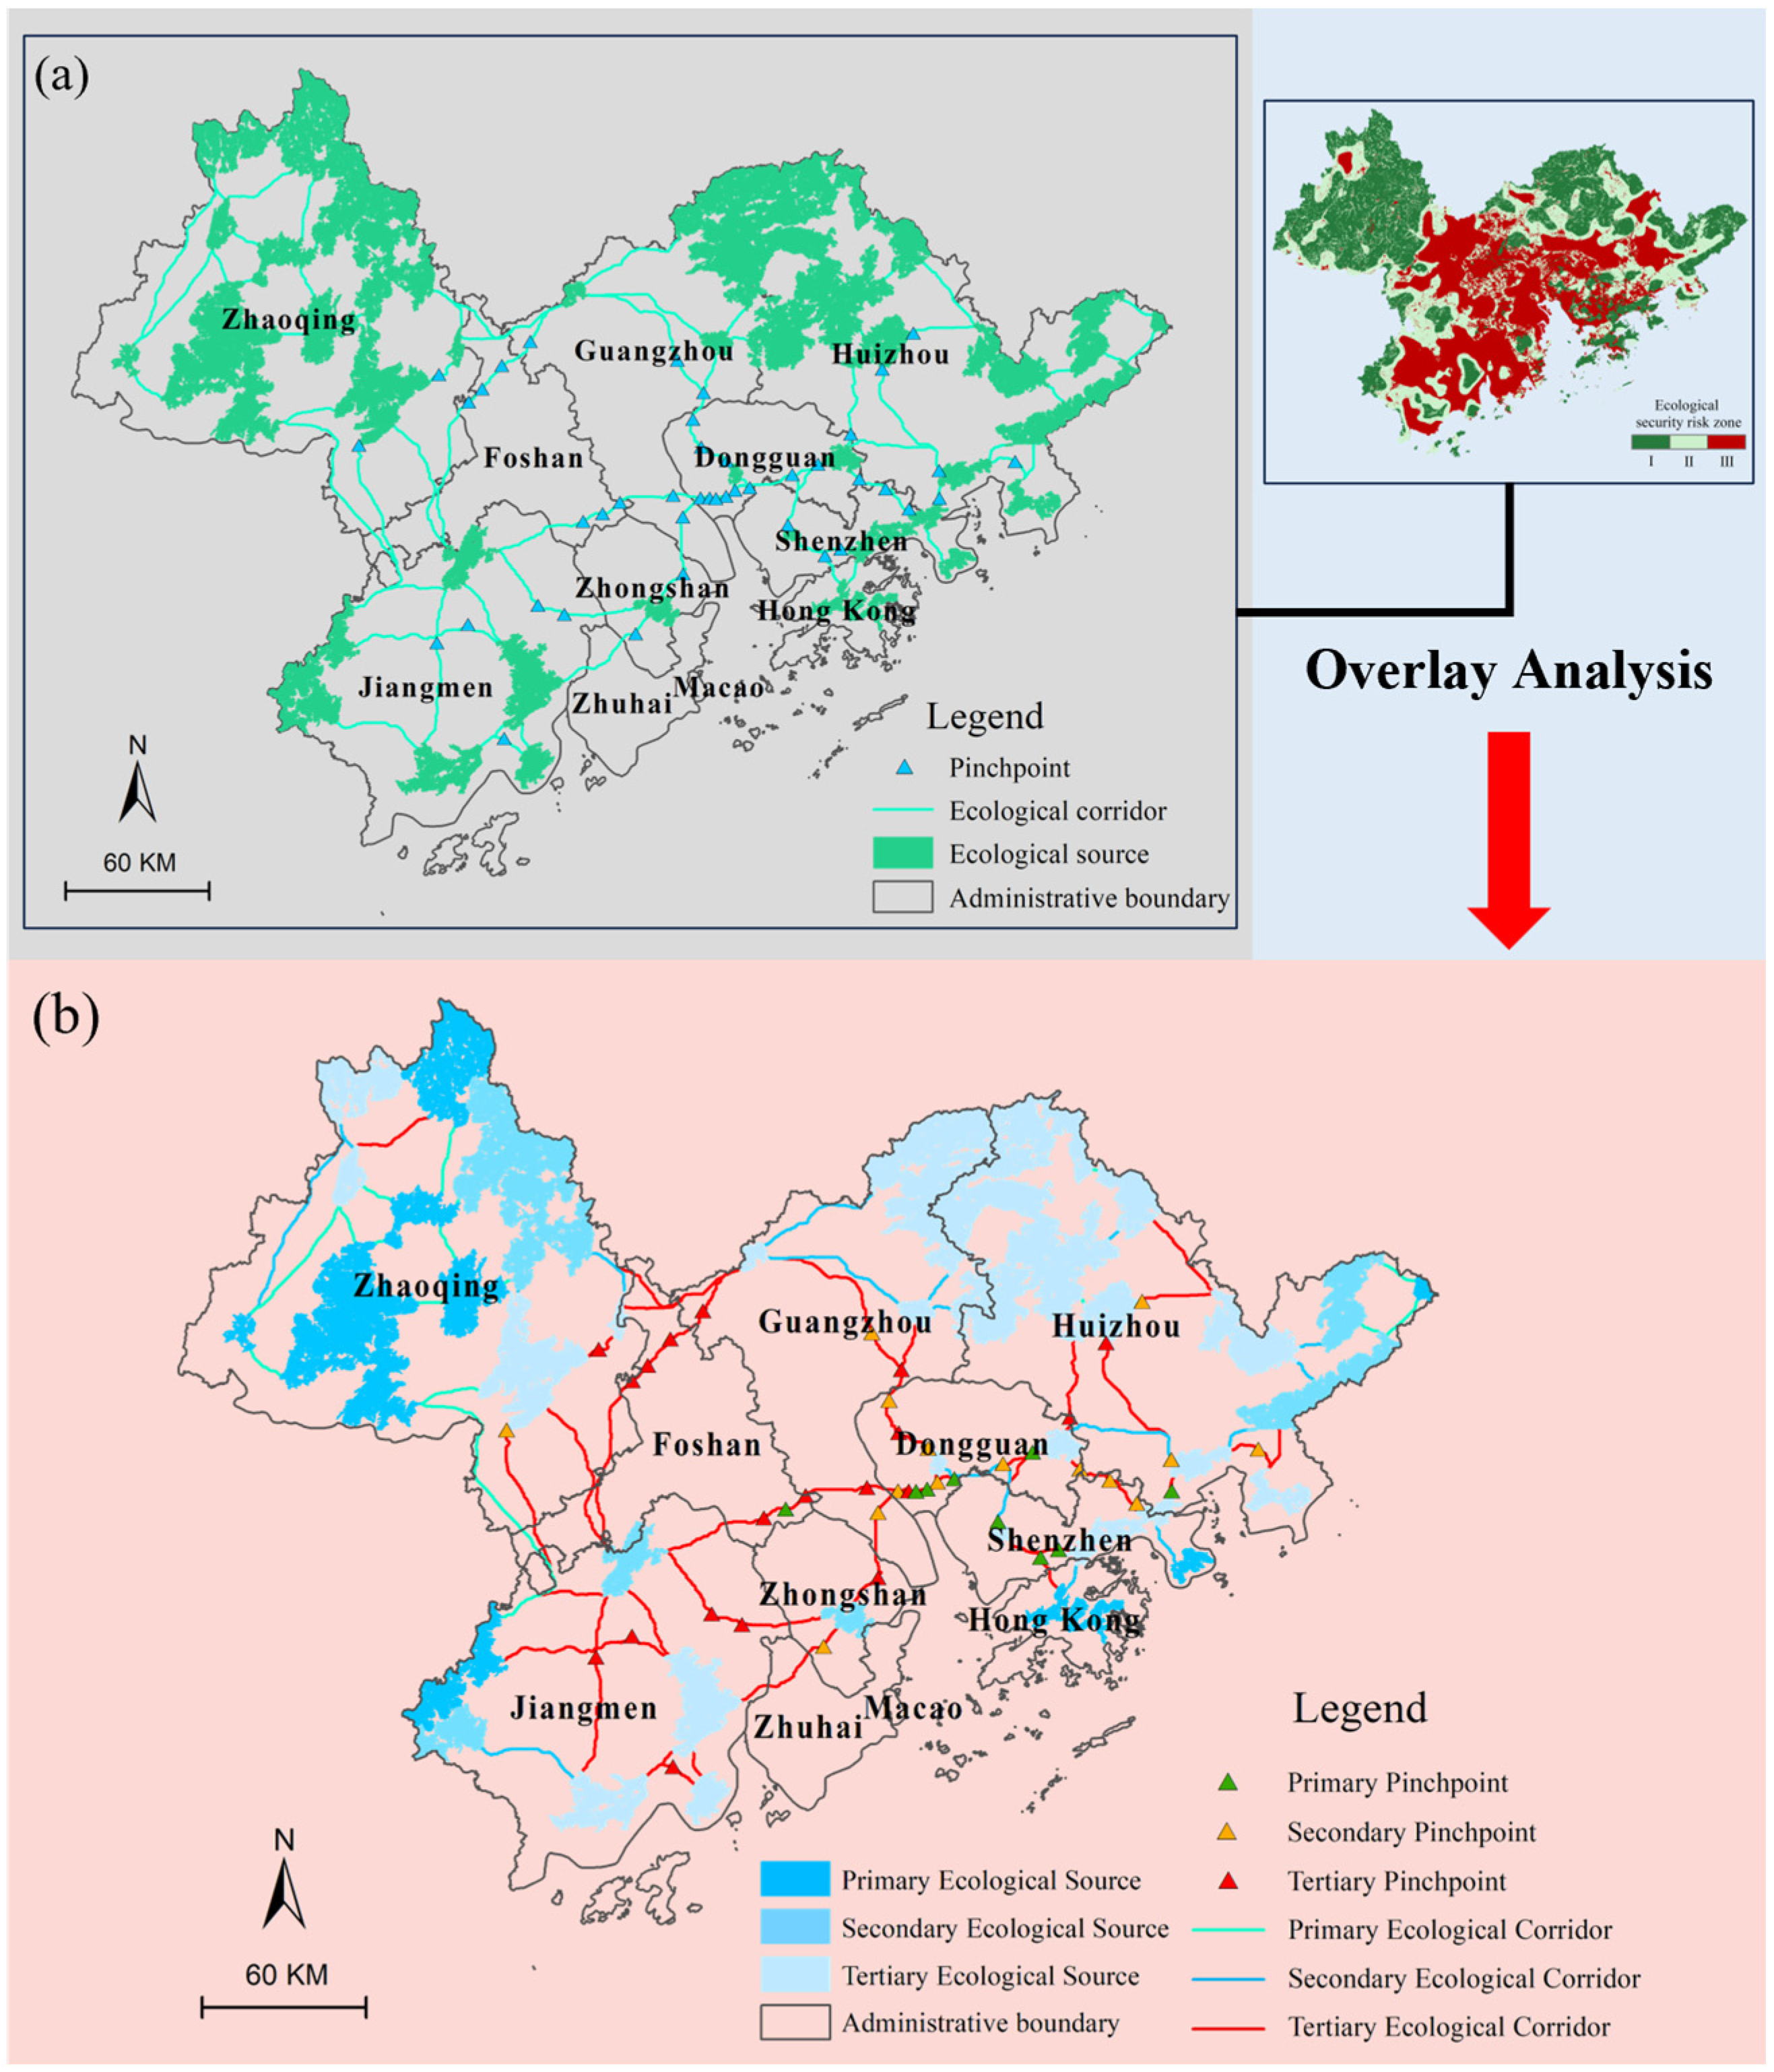
3.2. Ecological Security Patterns

3.2.1. Ecological Source and Resistance Surface

According to the method described in Section 3.2.1, the ecosystem service values and ecological sensitivity values of each unit in the study area in 2020 are obtained (Figure 3), and the grids with ecosystem service values greater than 0.58 and ecological sensitivity values greater than 0.69 were superimposed and screened for area (>20 km2) as the alternative ecological sources. Then, the dPC values of the abovementioned alternative ecological sources are obtained by the landscape connectivity calculation method in 3.2.1, and sorted in descending order. After comprehensive consideration of regional factors, the top 50% of patches are selected as the final ecological sources, and finally 35 ecological sources are obtained, covering about 25% of the total study area (Figure 3c).
Ecosystem service values decrease from outside to inside. The high-value areas are mainly distributed in Jiangmen, Huizhou, Zhaoqing, and the northeast of Guangzhou, while the low-value areas are concentrated in the central plain. The spatial distribution of ecological sensitivity is similar to that of ecosystem service values (Figure 3a). The high-ecological-sensitivity area is mainly distributed in surrounding forests and some waters, the middle-sensitivity area is mainly located in towns and farmland areas, and the low-sensitivity area is concentrated in the core developed cities in the study area (Figure 3b).
As can be seen from Figure 3c, there are significant differences in the distribution of ecological sources in the region: Zhaoqing and Huizhou account for 70.61% of ecological sources, bearing great ecological pressure. Jiangmen, Guangzhou, and Shenzhen account for 23.66%. The other six cities account for only 5.73% of the total, of which Macao has no ecological resources. This reflects that most of the plain areas in the study area have been developed, and the ecological security is under great pressure. Especially in the cities on both sides of the Pearl River Estuary with high economic and urbanization levels, the ecological land is highly fragmented, and it is difficult to form a large area of contiguous ecological sources. Large-scale ecological sources with an area of over 200 km2 in the study area are concentrated in Shimen National Forest Park, Nankun Mountain, Luofu Mountain, Xiangtou Mountain in the northwest of Huizhou, Lianhua Mountain in the east of Huizhou, Gudou Mountain and Tianlu Mountain in Jiangmen, and Luoke Mountain and Dinghu Mountain in Zhaoqing. These findings demonstrate the great challenge of the balance between ecological protection and economic development in the process of urbanization and indicate the importance of ecosystem protection in highly urbanized areas. And areas where large ecological sources areas exist play a key role in maintaining regional ecological balance and biodiversity.
The regional resistance surface obtained based on the method in Section 3.2.2 is shown in Figure 4, and the ecological resistance value in the study area ranges from 5 to 81, with an average resistance value of 17.30. According to the natural break point method, the resistance value is divided into three grades: low, medium, and high. The high-grade areas (with a resistance value greater than 50) are mainly distributed in urban areas where human construction activities are concentrated, such as Guangzhou, Foshan, Dongguan, Shenzhen, Hong Kong, and Macao. Middle-grade areas are scattered on the edge of the study area. Low-grade areas (with a resistance value less than 15) show a trend of outward diffusion centered on ecological land. High-resistance areas have dense construction and intense human activity, disrupting natural habitats. Low-resistance areas have minimal human interference, promoting ecological connectivity. This highlights the need for sustainable urban planning and ecological protection.

3.2.2. Ecological Security Patterns

According to the method described in Section 3.2.3, 72 ecological corridors and 43 pinch points were identified (Figure 5a). The total length of the ecological corridors is 2254.9 km, mainly scattered around the central area of the study area in the form of circular fishing nets. Most ecological corridors are in the border areas of Zhaoqing, Jiangmen, Huizhou, and some cities, all of which are mountainous and hilly areas with good vegetation coverage. In the development and construction of the Greater Bay Area, we should avoid ecological sources and ecological corridors, make use of restrictive policies and other means for critical protection, and give full play to the diffusion and connectivity of ecological sources and ecological corridors to ecological elements such as water resources, energy, and grain. At the same time, we should strengthen the construction of green infrastructure such as forestland and grassland, improve the continuity of ecosystem services, and ensure ESP. Pinch points are mainly distributed in the plain areas on both sides of the Pearl River Estuary, especially in the border areas of Guangzhou, Shenzhen, Foshan, and Dongguan. The reason is that the possibility of ecological flow passing through the abovementioned areas is high, and they are surrounded by landscapes with huge hindrance impacts, which leads to the easy fracture of these areas, so these areas need to be protected. This distribution pattern well avoids the built-up land with strong human activities such as cities and towns, and provides a transmission channel for biological migration and ecological element flow between ecological sources.

3.2.3. Multi-Level Ecological Security Patterns

The multi-level ESP facilitates more accurate ecological risk assessments through enhanced risk stratification, thereby improving the precision of interventions. Moreover, the ability to tailor protection measures to specific conditions allows for more targeted responses to varying levels of environmental stress. After superimposing Figure 2 and Figure 5a, we analyzed the position of each element in the constructed ESP within the ecological security risk zones, classifying the risk levels of ecological sources, ecological corridors, and pinch points. By conducting a spatial overlay analysis, elements located in higher-risk ecological security zones were assigned higher risk levels. This approach allowed us to reconstruct a multi-level ESP that accurately reflected the varying degrees of ecological risk across the study area. According to the risk stress, the factors in ESP are classified, and a total of 9 first-class ecological sources, 6 second-class ecological sources, 20 third-class ecological sources, 21 first-class ecological corridors, 18 second-class ecological corridors, 33 third-class ecological corridors, 9 first-class pinch points, 15 second-class pinch points, and 19 third-class pinch points are obtained (Figure 5b). According to the results, the buffer zones are set for ecological corridors and pinch points according to the rules in Table 5, and different degrees of protection are implemented.

3.3. Early Warning of Ecological Security Pattern Risk

The 2035 land use pattern (Figure 6a–c) under the NDS, EPS, and EDS in the study area was simulated by the PLUS model. The expansion degree of built-up land in 2020–2035 is significantly different under different scenarios, and the built-up land area will increase by 15.91%, 0.79%, and 45.79% under the NDS, EPS, and EDS, respectively. Obviously, the built-up land under the EPS increases slightly and mainly expands around the existing built-up land, which can effectively control the scale and speed of construction occupation of arable land and ecological land.
Since the built-up land is the main threat to regional ecological security, the expansion pattern of built-up land in each scenario is superimposed with the buffer zones of various elements in the multi-level ESP to determine the ESP risk early warning zone (Figure 6d–f). According to the area occupied by the expansion of built-up land itself (or construction buffer zones), ecological sources, ecological corridors, and pinch points are given corresponding warnings (Table 6). Level I corresponds to extreme warning, Level II corresponds to severe warning, Level III corresponds to moderate warning, Level IV corresponds to mild warning, and Level V corresponds to no warning.
There are obvious spatial differences in regional risk early warning under three scenarios (Figure 7):
(1)
Under the NDS, the warning level is between the EPS and EDS. The ecological source warning level is relatively good, and the number of severe and extreme warnings is at a low level. The number of severe and extreme warnings in ecological corridors is relatively large, mainly distributed in the center of the study area, connecting all parts of the area. The situation of ecological sources is slightly serious and needs to be addressed. In pinch points, there are many severe warnings, mainly in ecological corridors on both sides of the Pearl River Estuary.
(2)
Under the EPS, the regional ecological security situation is obviously optimized. All ecological sources are in a state of no warning, which is conducive to ensuring regional ecological security. Most ecological corridors are kept in a state of no warning or mild warning to ensure the connectivity of regional landscape. There is no moderate warning alarm or above for pinch points, which can ensure the stability of key nodes. It shows that under the policy guidance of ecological priority, ESP is well maintained, and biodiversity and ecosystem service functions are maintained at a healthy level.
(3)
Under the EDS, the ecological pressure faced by the study area suddenly increases, and the total area of regional early warning is as high as 358.17 km2. The total number of severe and extreme warnings in ecological sources, corridors, and pinch points is as high as 101, seven times that of NDS. Among them, pinch points are in an all-round alert state, and the migration and diffusion of ecological flow will be hindered. This indicates that under the influence of rapid economic growth, if appropriate ecological protection measures are not taken, the integrity of regional ecological sources and ecological networks will be seriously threatened.
Under different development scenarios, the risk alert levels of ecological security patterns differ notably. The EDS leads to severe alerts, stressing the need for ecological protection. The EPS lowers risks more effectively, while the NDS offers intermediate alerts, balancing economic and ecological priorities.

4. Discussion

4.1. Feasibility Analysis of Risk Early Warning Methods for Ecological Security Patterns

To address the ecological challenges posed by the unchecked expansion of construction land and ensure regional ecological security, this study introduces an innovative risk warning method for ESP based on land use data and validates its effectiveness. Effective ecological risk assessment is increasingly critical due to growing environmental challenges. The models for landscape ecological risk and habitat quality are primarily based on objective land use data, minimizing uncertainties and inaccuracies from subjective and socioeconomic statistical information [22]. The results of the ecological security risk zone delineation align closely with those of [22], establishing a solid foundation for the fine-grained hierarchical delineation of the ESP and ensuring the accuracy of the assessment results. Ecological sources were identified using a comprehensive index evaluation method (ecosystem service importance–ecological sensitivity–landscape connectivity). These sources were overlaid with national and provincial nature reserves and several large parks in the GHKMGBA region (Figure 8). Approximately 70% of the nature reserves and parks were found to fall within the identified sources, effectively validating our method’s feasibility. Based on circuit theory, high-resistance areas were effectively avoided, and a total of 72 ecological corridors and 43 ecological nodes were scientifically extracted, ensuring practicality. To verify the PLUS model’s validity, the 2020 land use pattern was simulated based on 2000 and 2010 land use data and compared to the actual 2020 data. The results showed an overall accuracy of 90%, with FOM at 0.29 and Kappa at 0.85. These metrics exceed simulation requirements, indicating the PLUS model’s suitability for simulating future land use patterns in the study area, providing a foundation for ESP risk early warning. In summary, the feasibility of the method has been partially validated, demonstrating a significant level of effectiveness. The application of this method, particularly through the PLUS model and the construction of ecological security patterns, primarily relies on objective land use data and ecological indicators. By minimizing the uncertainties and inaccuracies often associated with subjective and socioeconomic data, this methodology proves to be both adaptable and effective. Consequently, it shows promise for application in regions with diverse ecological and urban characteristics, promoting sustainable development and environmental protection across various contexts.

4.2. Implications of Ecological Security Pattern Risk Assessment and Multi-Scenario Risk Early Warning

Incorporating ESP into urban planning is crucial for regional ecological sustainability [3]. Conducting risk assessments and early warning provides valuable insights into the ecological risks posed by urban expansion, emphasizing the necessity of strategic interventions.
The study results indicate that the central cities on both sides of the Pearl River Estuary face high ecological security risks, mainly due to policy-driven urban construction land expansion. Up to 70% of the high-risk early warning areas under the scenarios are from secondary and tertiary ecological sources, ecological corridors, and pinch points. These risk levels vary with different development scenarios. In the EDS, the early warning level is extremely high, highlighting the need for greater ecological protection while pursuing economic development. The EPS significantly reduces future early warning risk, effectively easing ecological pressure and ensuring regional ecological security. The early warning risk of the NDS is between the other two, providing a balanced option for regional development but still requiring a balance between economic development and ecological protection.
To mitigate these risks and ensure biodiversity conservation, the main strategies include protecting existing natural ecosystems and restoring degraded ecosystems. Rational planning of new construction land is crucial to reducing ecological risks. Although the growth of construction land is inevitable in urbanization, scientific planning can effectively reduce the negative impact on the ecosystem. For example, in neighboring cities of the GHKMGBA like Zhaoqing and Huizhou, there are many low-risk ecological safety elements, forming important ecological barriers in the region. Although these areas currently face fewer ecological challenges, careful planning is needed in future development to avoid undue occupation of ecological space. Maintaining the integrity and function of these ecological barriers is vital for the ecological security of the entire Greater Bay Area.

4.3. Limitations and Future Research Prospects

Despite the merits of this study, some limitations are observed and need to be addressed in future research. First, we focus exclusively on the potential threats to ESP posed by the expansion of built-up land, and issue risk early warning accordingly. Although disorderly built-up land expansion is the primary threat to ESP, some other factors that may also affect ESP, such as climate change, natural disasters, and environmental pollution, are not considered due to their difficulty in quantification and availability. For future research, more potential factors could be explored. Second, some parameter settings in the construction of the ecological safety pattern need further refinement, such as the minimum area threshold of the source area, the corridor resistance extraction threshold, and the pinch point extraction threshold. Additionally, this study did not fully consider specific species’ needs when determining the ecological corridor width, leading to limitations in the corridor width and landscape connectivity distance thresholds. Future research should aim to (1) establish ecological security patterns at different scales for various restoration purposes to accurately identify areas requiring protection and restoration; (2) focus on constructing buffer zone systems within the ESP that accommodate the habitat needs and dispersal characteristics of each species, ensuring effective protection and support for diverse ecological groups. Third, the relatively low resolution of partly original data may introduce deviation between our analysis results and actual situations. Therefore, future efforts should prioritize the use of high-resolution spatial data to ensure more realistic conclusions.

5. Conclusions

The construction of an ESP and the development of risk early warning for it can proactively identify and mitigate potential regional ecological threats, thereby protecting ecological security and ensuring sustainable development. This study explores the ecological security risk zones of the GHKMGBA by integrating landscape ecological risk and habitat quality models. A multi-level ESP was constructed using circuit theory and these risk zones, and a 2035 ESP risk early warning was developed by overlaying future built-up land with the multi-level ESP. Based on this framework, the research findings indicate that the ESP along both sides of the Pearl River coast and in some coastal urban areas face high ecological security risks due to frequent human activities. These regions contain numerous secondary and tertiary high-risk ecological sources, corridors, and pinch points, serving as “connectors” of regional ecological flows. Given their consistently high warning levels across various development scenarios, these areas should be prioritized for ecological protection. In contrast, the region’s peripheral areas with high forest coverage and high habitat quality face fewer threats and serve as important ecological barriers for the region. These areas require careful planning in future development to avoid excessive occupation of ecological spaces, thereby maintaining the integrity and functionality of these ecological barriers, which is crucial for the overall ecological security of the GHKMGBA. Furthermore, the EPS shows a more optimistic early warning level, effectively mitigating risks and ensuring regional ecological security. This provides a reference for regional development but requires a delicate balance between economic and environmental priorities. These findings suggest that a comprehensive framework based on “simulating future land use patterns, extracting future built-up expansion areas, overlaying them with the multi-level ESP, and identifying the warning level of regional ESP risks” is instrumental in identifying ESP risks within the region for early warning, detecting high-risk areas, and guiding targeted protection efforts and strategic urban planning. This approach offers significant practical implications for decision-makers and urban planners in the GHKMGBA. By highlighting critical ecological security risk zones and providing a forward-looking risk early warning of ESP, it enables policy-makers to prioritize conservation efforts in vulnerable coastal and urban areas while also safeguarding the integrity of ecologically rich peripheral regions.

Author Contributions

Conceptualization, Z.M.; data curation, J.M. and X.W.; formal analysis, J.M. and X.W.; funding acquisition, Z.M.; methodology, J.M. and S.L.; resources, J.M.; supervision, Z.M.; visualization, J.M. and J.L.; writing—original draft, J.M.; writing—review and editing, Z.M. All authors have read and agreed to the published version of the manuscript.

Funding

This research was funded by the Humanities and Social Sciences Research Planning Foundation of the Ministry of Education of China (Grant No. 23YJAZH101).

Data Availability Statement

Data are contained within the article.

Conflicts of Interest

The authors declare no conflicts of interest.

References

  1. Lu, X.; Shi, Z.; Li, J.; Dong, J.; Song, M.; Hou, J. Research on the Impact of Factor Flow on Urban Land Use Efficiency from the Perspective of Urbanization. Land 2022, 11, 389. [Google Scholar] [CrossRef]
  2. Yang, L.; Li, Y.; Jia, L.; Ji, Y.; Hu, G. Ecological Risk Assessment and Ecological Security Pattern Optimization in the Middle Reaches of the Yellow River Based on ERI+MCR Model. J. Geogr. Sci. 2023, 33, 823–844. [Google Scholar] [CrossRef]
  3. Jia, Q.; Jiao, L.; Lian, X.; Wang, W. Linking Supply-Demand Balance of Ecosystem Services to Identify Ecological Security Patterns in Urban Agglomerations. Sustain. Cities Soc. 2023, 92, 104497. [Google Scholar] [CrossRef]
  4. Jiao, Z.; Wu, Z.; Wei, B.; Luo, Y.; Lin, Y.; Xue, Y.; Li, S.; Gao, F. Introducing Big Data to Measure the Spatial Heterogeneity of Human Activities for Optimizing the Ecological Security Pattern: A Case Study from Guangzhou City, China. Ecol. Indic. 2023, 150, 110203. [Google Scholar] [CrossRef]
  5. Wu, W.; Zhao, S.; Guo, J.; Ou, M.; Ding, G. Construction and Optimization of Ecological Security Pattern Based on the Circuit Theory: A Case Study of Hohhot City. Environ. Sci. Pollut. Res. 2023, 30, 89597–89615. [Google Scholar] [CrossRef] [PubMed]
  6. Yang, Q.; He, C.; Xu, Y.; Ye, Y.; Guo, H.; Zhang, S.; Li, F.; Liu, K. Coastal Wetlands Play an Important Role in the Ecological Security Pattern of the Coastal Zone. Land 2022, 11, 2317. [Google Scholar] [CrossRef]
  7. Chen, J.; Mei, Z.; Wang, B.; Wei, J. Construction of Ecological Security Patterns Based on Circuit Theory under the Resistance Distance Principle. Int. J. Environ. Res. Public Health 2022, 19, 6298. [Google Scholar] [CrossRef] [PubMed]
  8. Hui, L.; Na, Y.; Wen, Y.; Si, W.; Zhi, L.; Shu, Y. Shangri-La county ecological land use planning based on landscape security pattern. Acta Ecol. Sin. 2011, 31, 5928–5936. (In Chinese) [Google Scholar]
  9. Zhang, L.; Peng, J.; Liu, Y.; Wu, J. Coupling Ecosystem Services Supply and Human Ecological Demand to Identify Landscape Ecological Security Pattern: A Case Study in Beijing–Tianjin–Hebei Region, China. Urban Ecosyst. 2017, 20, 701–714. [Google Scholar] [CrossRef]
  10. Hu, C.; Wang, Z.; Huang, G.; Ding, Y. Construction, Evaluation, and Optimization of a Regional Ecological Security Pattern Based on MSPA–Circuit Theory Approach. Int. J. Environ. Res. Public Health 2022, 19, 16184. [Google Scholar] [CrossRef]
  11. Chen, J.; Wang, S.; Zou, Y. Construction of an Ecological Security Pattern Based on Ecosystem Sensitivity and the Importance of Ecological Services: A Case Study of the Guanzhong Plain Urban Agglomeration, China. Ecol. Indic. 2022, 136, 108688. [Google Scholar] [CrossRef]
  12. Zhang, Y.; Zhao, Z.; Fu, B.; Ma, R.; Yang, Y.; Lü, Y.; Wu, X. Identifying Ecological Security Patterns Based on the Supply, Demand and Sensitivity of Ecosystem Service: A Case Study in the Yellow River Basin, China. J. Environ. Manag. 2022, 315, 115158. [Google Scholar] [CrossRef]
  13. Gao, Y.; Ma, L.; Liu, J.; Zhuang, Z.; Huang, Q.; Li, M. Constructing Ecological Networks Based on Habitat Quality Assessment: A Case Study of Changzhou, China. Sci. Rep. 2017, 7, 46073. [Google Scholar] [CrossRef]
  14. Ding, M.; Liu, W.; Xiao, L.; Zhong, F.; Lu, N.; Zhang, J.; Zhang, Z.; Xu, X.; Wang, K. Construction and Optimization Strategy of Ecological Security Pattern in a Rapidly Urbanizing Region: A Case Study in Central-South China. Ecol. Indic. 2022, 136, 108604. [Google Scholar] [CrossRef]
  15. Huang, L.; He, C.; Wang, B. Study on the Spatial Changes Concerning Ecosystem Services Value in Lhasa River Basin, China. Environ. Sci. Pollut. Res. 2022, 29, 7827–7843. [Google Scholar] [CrossRef] [PubMed]
  16. Luo, M.; Jia, X.; Zhao, Y.; Wang, H.; Chen, C.; Li, D.; Yang, S.; Li, J. The Temporal and Spatial Characteristics of Ecological Security Pattern in the Loess Plateau, China. Land 2024, 13, 570. [Google Scholar] [CrossRef]
  17. Huang, M.; Gong, D.; Zhang, L.; Lin, H.; Chen, Y.; Zhu, D.; Xiao, C.; Altan, O. Spatiotemporal Dynamics and Forecasting of Ecological Security Pattern under the Consideration of Protecting Habitat: A Case Study of the Poyang Lake Ecoregion. Int. J. Digit. Earth 2024, 17, 2376277. [Google Scholar] [CrossRef]
  18. Dickson, B.G.; Albano, C.M.; Anantharaman, R.; Beier, P.; Fargione, J.; Graves, T.A.; Gray, M.E.; Hall, K.R.; Lawler, J.J.; Leonard, P.B.; et al. Circuit-theory Applications to Connectivity Science and Conservation. Conserv. Biol. 2019, 33, 239–249. [Google Scholar] [CrossRef]
  19. Wu, Y.; Han, Z.; Meng, J.; Zhu, L. Circuit Theory-Based Ecological Security Pattern Could Promote Ecological Protection in the Heihe River Basin of China. Environ. Sci. Pollut. Res. 2022, 30, 27340–27356. [Google Scholar] [CrossRef]
  20. Huang, X.; Wang, H.; Shan, L.; Xiao, F. Constructing and Optimizing Urban Ecological Network in the Context of Rapid Urbanization for Improving Landscape Connectivity. Ecol. Indic. 2021, 132, 108319. [Google Scholar] [CrossRef]
  21. Li, Q.; Zhou, Y.; Yi, S. An Integrated Approach to Constructing Ecological Security Patterns and Identifying Ecological Restoration and Protection Areas: A Case Study of Jingmen, China. Ecol. Indic. 2022, 137, 108723. [Google Scholar] [CrossRef]
  22. Jiao, M.; Wang, Y.; Hu, M.; Xia, B. Spatial Deconstruction and Differentiation Analysis of Early Warning for Ecological Security in the Pearl River Delta, China. Sustain. Cities Soc. 2021, 64, 102557. [Google Scholar] [CrossRef]
  23. Xiao, P.; Zhou, Y.; Li, M.; Xu, J. Spatiotemporal Patterns of Habitat Quality and Its Topographic Gradient Effects of Hubei Province Based on the InVEST Model. Environ. Dev. Sustain. 2023, 25, 6419–6448. [Google Scholar] [CrossRef]
  24. Ai, J.; Yu, K.; Zeng, Z.; Yang, L.; Liu, Y.; Liu, J. Assessing the Dynamic Landscape Ecological Risk and Its Driving Forces in an Island City Based on Optimal Spatial Scales: Haitan Island, China. Ecol. Indic. 2022, 137, 108771. [Google Scholar] [CrossRef]
  25. Wu, L.; Fan, F. Assessment of Ecosystem Services in New Perspective: A Comprehensive Ecosystem Service Index (CESI) as a Proxy to Integrate Multiple Ecosystem Services. Ecol. Indic. 2022, 138, 108800. [Google Scholar] [CrossRef]
  26. Tang, H.; Peng, J.; Jiang, H.; Lin, Y.; Dong, J.; Liu, M.; Meersmans, J. Spatial Analysis Enables Priority Selection in Conservation Practices for Landscapes That Need Ecological Security. J. Environ. Manag. 2023, 345, 118888. [Google Scholar] [CrossRef] [PubMed]
  27. Zeng, W.; Tang, H.; Liang, X.; Hu, Z.; Yang, Z.; Guan, Q. Using Ecological Security Pattern to Identify Priority Protected Areas: A Case Study in the Wuhan Metropolitan Area, China. Ecol. Indic. 2023, 148, 110121. [Google Scholar] [CrossRef]
  28. Yang, L.; Jin, L.; Xiang, S. An early warning method on ecological risk and its application to improve landscape ecological security pattern regulation. Geogr. Res. 2017, 36, 485–494. (In Chinese) [Google Scholar]
  29. Chao, Y.; Chen, W.; Zhe, F.; Ke, W.; Hua, Z. Urgency Classification of Beijing Ecological Security Pattern Protection. Beijing Da Xue Xue Bao 2020, 56, 1047–1055. (In Chinese) [Google Scholar]
  30. Wang, S.; Song, Q.; Zhao, J.; Lu, Z.; Zhang, H. Identification of Key Areas and Early-Warning Points for Ecological Protection and Restoration in the Yellow River Source Area Based on Ecological Security Pattern. Land 2023, 12, 1643. [Google Scholar] [CrossRef]
  31. Jian, L.; Shen, L.; Shen, F.; Yong, H. Identification of territorial ecological protection and restoration areas and early warning places based on ecological security pattern: A case study in Xiamen-Zhangzhou-Quanzhou Region. Acta Ecol. Sin. 2021, 41, 8124–8134. (In Chinese) [Google Scholar]
  32. Guo, H.; Cai, Y.; Li, B.; Tang, Y.; Qi, Z.; Huang, Y.; Yang, Z. An Integrated Modeling Approach for Ecological Risks Assessment under Multiple Scenarios in Guangzhou, China. Ecol. Indic. 2022, 142, 109270. [Google Scholar] [CrossRef]
  33. Ji, X.; Wu, D.; Yan, Y.; Guo, W.; Li, K. Interpreting Regional Ecological Security from Perspective of Ecological Networks: A Case Study in Ningxia Hui Autonomous Region, China. Environ. Sci. Pollut. Res. 2023, 30, 65412–65426. [Google Scholar] [CrossRef] [PubMed]
  34. Liu, X.; Liang, X.; Li, X.; Xu, X.; Ou, J.; Chen, Y.; Li, S.; Wang, S.; Pei, F. A Future Land Use Simulation Model (FLUS) for Simulating Multiple Land Use Scenarios by Coupling Human and Natural Effects. Landsc. Urban Plan. 2017, 168, 94–116. [Google Scholar] [CrossRef]
  35. Zheng, F.; Hu, Y. Assessing Temporal-Spatial Land Use Simulation Effects with CLUE-S and Markov-CA Models in Beijing. Environ. Sci. Pollut. Res. 2018, 25, 32231–32245. [Google Scholar] [CrossRef] [PubMed]
  36. Fu, F.; Deng, S.; Wu, D.; Liu, W.; Bai, Z. Research on the Spatiotemporal Evolution of Land Use Landscape Pattern in a County Area Based on CA-Markov Model. Sustain. Cities Soc. 2022, 80, 103760. [Google Scholar] [CrossRef]
  37. Li, X.; Liu, Z.; Li, S.; Li, Y. Multi-Scenario Simulation Analysis of Land Use Impacts on Habitat Quality in Tianjin Based on the PLUS Model Coupled with the InVEST Model. Sustainability 2022, 14, 6923. [Google Scholar] [CrossRef]
  38. Duan, X.; Chen, Y.; Wang, L.; Zheng, G.; Liang, T. The Impact of Land Use and Land Cover Changes on the Landscape Pattern and Ecosystem Service Value in Sanjiangyuan Region of the Qinghai-Tibet Plateau. J. Environ. Manag. 2023, 325, 116539. [Google Scholar] [CrossRef] [PubMed]
  39. Wang, Q.; Guan, Q.; Sun, Y.; Du, Q.; Xiao, X.; Luo, H.; Zhang, J.; Mi, J. Simulation of Future Land Use/Cover Change (LUCC) in Typical Watersheds of Arid Regions under Multiple Scenarios. J. Environ. Manag. 2023, 335, 117543. [Google Scholar] [CrossRef]
  40. Peng, J.; Pan, Y.; Liu, Y.; Zhao, H.; Wang, Y. Linking Ecological Degradation Risk to Identify Ecological Security Patterns in a Rapidly Urbanizing Landscape. Habitat Int. 2018, 71, 110–124. [Google Scholar] [CrossRef]
  41. Sun, H.; Liu, C.; Wei, J. Identifying Key Sites of Green Infrastructure to Support Ecological Restoration in the Urban Agglomeration. Land 2021, 10, 1196. [Google Scholar] [CrossRef]
  42. Jiang, H.; Peng, J.; Dong, J.; Zhang, Z.; Xu, Z.; Meersmans, J. Linking Ecological Background and Demand to Identify Ecological Security Patterns across the Guangdong-Hong Kong-Macao Greater Bay Area in China. Landsc. Ecol. 2021, 36, 2135–2150. [Google Scholar] [CrossRef]
  43. Zhou, Y.; Zheng, Z.; Wu, Z.; Guo, C.; Chen, Y. Construction and Evaluation of Ecological Networks in Highly Urbanised Regions: A Case Study of the Guangdong-Hong Kong-Macao Greater Bay Area, China. Ecol. Indic. 2023, 152, 110336. [Google Scholar] [CrossRef]
  44. Wang, X.; Wen, Y.; Liu, X.; Wen, D.; Long, Y.; Zhao, P.; Liu, P.; Zhong, J. Protection Effect and Vacancy of the Ecological Protection Redline: A Case Study in Guangdong–Hong Kong–Macao Greater Bay Area, China. Remote Sens. 2021, 13, 5171. [Google Scholar] [CrossRef]
  45. Tang, F.; Wang, L.; Guo, Y.; Fu, M.; Huang, N.; Duan, W.; Luo, M.; Zhang, J.; Li, W.; Song, W. Spatio-Temporal Variation and Coupling Coordination Relationship between Urbanisation and Habitat Quality in the Grand Canal, China. Land Use Policy 2022, 117, 106119. [Google Scholar] [CrossRef]
  46. Ouyang, X.; Tang, L.; Wei, X.; Li, Y. Spatial Interaction between Urbanization and Ecosystem Services in Chinese Urban Agglomerations. Land Use Policy 2021, 109, 105587. [Google Scholar] [CrossRef]
  47. Sharp, R.; Chaplin-Krame, R.; Wood, S.; Guerry, A.; Tallis, H.; Ricketts, T. InVEST 3.2.0 User’s Guide; NatCap: Stanford, CA, USA, 2015. [Google Scholar]
  48. Li, M.; Zhou, Y.; Xiao, P.; Tian, Y.; Huang, H.; Xiao, L. Evolution of Habitat Quality and Its Topographic Gradient Effect in Northwest Hubei Province from 2000 to 2020 Based on the InVEST Model. Land 2021, 10, 857. [Google Scholar] [CrossRef]
  49. Wang, H.; Liu, X.; Zhao, C.; Chang, Y.; Liu, Y.; Zang, F. Spatial-Temporal Pattern Analysis of Landscape Ecological Risk Assessment Based on Land Use/Land Cover Change in Baishuijiang National Nature Reserve in Gansu Province, China. Ecol. Indic. 2021, 124, 107454. [Google Scholar] [CrossRef]
  50. Xu, W.; Wang, J.; Zhang, M.; Li, S. Construction of Landscape Ecological Network Based on Landscape Ecological Risk Assessment in a Large-Scale Opencast Coal Mine Area. J. Clean. Prod. 2021, 286, 125523. [Google Scholar] [CrossRef]
  51. Li, C.; Zhang, J.; Philbin, S.P.; Yang, X.; Dong, Z.; Hong, J.; Ballesteros-Pérez, P. Evaluating the Impact of Highway Construction Projects on Landscape Ecological Risks in High Altitude Plateaus. Sci. Rep. 2022, 12, 5170. [Google Scholar] [CrossRef]
  52. Zeng, C.; He, J.; He, Q.; Mao, Y.; Yu, B. Assessment of Land Use Pattern and Landscape Ecological Risk in the Chengdu-Chongqing Economic Circle, Southwestern China. Land 2022, 11, 659. [Google Scholar] [CrossRef]
  53. Cai, G.; Xiong, J.; Wen, L.; Weng, A.; Lin, Y.; Li, B. Predicting the Ecosystem Service Values and Constructing Ecological Security Patterns in Future Changing Land Use Patterns. Ecol. Indic. 2023, 154, 110787. [Google Scholar] [CrossRef]
  54. Wen, M.; Zhang, T.; Li, L.; Chen, L.; Hu, S.; Wang, J.; Liu, W.; Zhang, Y.; Yuan, L. Assessment of Land Ecological Security and Analysis of Influencing Factors in Chaohu Lake Basin, China from 1998–2018. Sustainability 2021, 13, 358. [Google Scholar] [CrossRef]
  55. Wang, X.; Wu, J.; Liu, Y.; Hai, X.; Shanguan, Z.; Deng, L. Driving Factors of Ecosystem Services and Their Spatiotemporal Change Assessment Based on Land Use Types in the Loess Plateau. J. Environ. Manag. 2022, 311, 114835. [Google Scholar] [CrossRef] [PubMed]
  56. Wang, F.; Yu, Q.; Qiu, S.; Xu, C.; Ma, J.; Liu, H. Study on the Relationship between Topological Characteristics of Ecological Spatial Network and Soil Conservation Function in Southeastern Tibet, China. Ecol. Indic. 2023, 146, 109791. [Google Scholar] [CrossRef]
  57. Bi, Y.; Zheng, L.; Wang, Y.; Li, J.; Yang, H.; Zhang, B. Coupling Relationship between Urbanization and Water-Related Ecosystem Services in China’s Yangtze River Economic Belt and Its Socio-Ecological Driving Forces: A County-Level Perspective. Ecol. Indic. 2023, 146, 109871. [Google Scholar] [CrossRef]
  58. Chen, Z.; Lin, J.; Huang, J. Linking Ecosystem Service Flow to Water-Related Ecological Security Pattern: A Methodological Approach Applied to a Coastal Province of China. J. Environ. Manag. 2023, 345, 118725. [Google Scholar] [CrossRef] [PubMed]
  59. Wang, Z.; Li, X.; Mao, Y.; Li, L.; Wang, X.; Lin, Q. Dynamic Simulation of Land Use Change and Assessment of Carbon Storage Based on Climate Change Scenarios at the City Level: A Case Study of Bortala, China. Ecol. Indic. 2022, 134, 108499. [Google Scholar] [CrossRef]
  60. Tsou, J.; Gao, Y.; Zhang, Y.; Genyun, S.; Ren, J.; Li, Y. Evaluating Urban Land Carrying Capacity Based on the Ecological Sensitivity Analysis: A Case Study in Hangzhou, China. Remote Sens. 2017, 9, 529. [Google Scholar] [CrossRef]
  61. Huang, J.; Hu, Y.; Zheng, F. Research on Recognition and Protection of Ecological Security Patterns Based on Circuit Theory: A Case Study of Jinan City. Environ. Sci. Pollut. Res. 2020, 27, 12414–12427. [Google Scholar] [CrossRef]
  62. Mcrae, B.H. Isolation by resistance. Evolution 2006, 60, 1551–1561. [Google Scholar] [PubMed]
  63. Mcrae, B.H.; Beier, P. Circuit theory predicts gene flow in plant and animal populations. Proc. Natl. Acad. Sci. USA 2007, 104, 19885–19890. [Google Scholar] [CrossRef] [PubMed]
  64. McRae, B.H.; Dickson, B.G.; Keitt, T.H.; Shah, V.B. Using circuit theory to model connectivity in ecology, evolution, and conservation. Ecology 2008, 89, 2712–2724. [Google Scholar] [CrossRef] [PubMed]
  65. Liang, X.; Guan, Q.; Clarke, K.C.; Liu, S.; Wang, B.; Yao, Y. Understanding the Drivers of Sustainable Land Expansion Using a Patch-Generating Land Use Simulation (PLUS) Model: A Case Study in Wuhan, China. Comput. Environ. Urban Syst. 2021, 85, 101569. [Google Scholar] [CrossRef]
Figure 1. Location of the study area.
Land 13 01267 g001
Figure 2. Spatial distribution of ecological security risk zones in the study area in 2020.
Land 13 01267 g002
Figure 3. (ac) Spatial distribution of ecological sources (Note: (a) Ecosystem services (b) Ecological sensitivity (c) Ecological sources).
Land 13 01267 g003
Figure 4. Resistance surface.
Land 13 01267 g004
Figure 5. (a,b) Multi-level ecological security patterns in the study area in 2020 (Note: (a) Ecological security patterns (b) Multi-level ecological security patterns).
Land 13 01267 g005
Figure 6. (af) Early warning identification of risks to ecological security patterns in 2035 under different scenarios (Note: (ac) Multi-scenario land use simulation (df) Ecological security pattern multi-scenario risk early warning).
Land 13 01267 g006
Figure 7. Spatial and quantitative distribution of vigilance of ecological security patterns in 2035 under different scenarios.
Land 13 01267 g007
Figure 8. Validation of ecological source.
Land 13 01267 g008
Table 1. Information of basic data.
Data CategoryData NameTimeResolutionData Source
Land useLand use data of GHKMGBA2000, 2010, 202030 mNational Ecological Science Data Center
https://www.resdc.cn
(accessed on 3 May 2023)
Meteorological dataAnnual average temperature20201 km
Annual average precipitation20201 km
Socioeconomic dataPopulation density20191 km
GDP20201 km
Nighttime light20201 km
Road2020-OpenStreetMap
https://www.openstreetmap.org
(accessed on 3 May 2023)
Natural environment dataRiver2020-
Potential evapotranspiration20201 kmNational Tibetan Plateau
https://data.tpdc.ac.cn
(accessed on 3 May 2023)
Vegetation cover2020250 m
Soil data20131 kmHarmonized World Soil Database from FAO
(https://www.fao.org/)
(accessed on 23 May 2024)
DEM202030 mGeospatial Data Cloud
(www.gscloud.cn)
(accessed on 3 May 2023)
Slope/relief degree of land surface data202030 mBased on DEM calculation
Table 2. Criteria for categorizing ecological security zones.
Habitat Quality LevelLandscape Ecological Risk Level
LowMediumHigh
PoorIIIIIIIII
ModerateIIIIIII
GoodIIIIII
Table 3. Methods and calculation processes for ecosystem service evaluation.
Ecosytem Service IndexCalculation FormulaExplanationReference
Soil conservation S C = R i × K i × L S i 1 C P SC represents the soil conservation capacity of unit i, R is the rainfall erosivity factor, K is the soil erodibility factor, LS is the topographic factor, C is the vegetation coverage factor, and P is the factor of soil and water conservation measures. Among them, the K factor is calculated based on the world soil database, R is calculated based on the annual rainfall data, LS is calculated based on DEM, and C and P are set according to the existing related research.[7,56,57]
Water yield W Y x = 1 A E T x P R E x × P R E x
A E T x P R E x = 1 + P E T x P R E x 1 + P E T x P R E x w 1 w
WY(x) represents the annual water supply of unit x, AET(x) is the annual actual evapotranspiration of unit x, PET(x) is the annual potential evapotranspiration of unit x, and PRE(x) is the annual precipitation of unit x.[58]
Carbon sequestration C i = C i a b o v e + C i b e l o w + C i d e a d + C i s o i l
C t o t a l = i = 1 n C i × S i
Ci is the total carbon storage of type i, Ci-above and Ci-below are the aboveground and underground carbon densities of type i, Ci-soil is the soil organic carbon density of type i, Ci-dead is the dead organic carbon density of type i, Ctotal is the regional total carbon storage, and Si is the area of type i. Concerning A dataset of carbon density in Chinese terrestrial ecosystems (2010s) and related research is used. [25,59]
Table 4. Setting of resistance values for land use types.
Land Use Class ILand Use Class IIResistance Value
Arable landpaddy field10
Dryland15
ForestlandShrubland 10
Forestland5
Other forestland8
GrasslandHigh-cover grassland10
Medium-cover grassland8
Low-cover grassland5
Water areaCanals10
Rivers20
Reservoirs15
Mudflats20
Built-up landUrban built-up land50
Rural built-up land40
Other built-up land45
Unused landsandy land30
marshland35
bare ground20
Other unused land15
Table 5. Ecological security pattern buffer zone setting.
Buffer Zone Level
Buffer TypeIIIIII
Ecological corridor buffer zone1 km2 km3 km
Pinch point buffer zone3 km4 km5 km
Table 6. Early warning level and ecological security pattern encroachment area.
Area of Encroachment on Ecological Sources (km2)Area of Encroachment on Ecological Corridor Buffer Zones (km2)Area of Encroachment on the Buffer Zone of Pinch Points (km2)Warning LevelWarning Situation
0 ≤ area < 0.210 ≤ area < 0.090 ≤ area < 0.05VNo warning
0.21 ≤ area < 0.660.09 ≤ area < 0.780.05 ≤ area < 1.15IVLight warning
0.66 ≤ area < 1.710.78 ≤ area < 4.271.15 ≤ area < 3.51IIIMedium warning
1.71 ≤ area < 5.764.27 ≤ area < 14.813.51 ≤ area < 5.6IISevere warning
5.76 ≤ area < 61.7314.81 ≤ area < 110.615.6 ≤ area < 17.36IExtreme Warning
Disclaimer/Publisher’s Note: The statements, opinions and data contained in all publications are solely those of the individual author(s) and contributor(s) and not of MDPI and/or the editor(s). MDPI and/or the editor(s) disclaim responsibility for any injury to people or property resulting from any ideas, methods, instructions or products referred to in the content.

