Article

Spatiotemporal Evolution of Urban Land Green Utilization Efficiency and Driving Factors: An Empirical Study Based on Spatial Econometrics

1
School of Economics and Management, Jiangsu University of Science and Technology, Zhenjiang 212100, China
2
Business School, Nanjing Xiaozhuang University, Nanjing 211171, China
*
Author to whom correspondence should be addressed.
Land 2024, 13(8), 1272; https://doi.org/10.3390/land13081272
Submission received: 15 July 2024 / Revised: 8 August 2024 / Accepted: 11 August 2024 / Published: 12 August 2024
(This article belongs to the Special Issue Land Resource Use Efficiency and Sustainable Land Use)

Abstract

:
Green development is an inevitable choice for sustainable development under the constraints of environmental resources. This paper attempts to explore the connotation of urban land green utilization efficiency (LGUE) and reveal its spatial differentiation characteristics. This study adopts the super-SBM model to measure LGUE from 2009 to 2022 and analyzes the spatiotemporal variation rules. Then, the study reveals the spatial influencing factors of LGUE, drawing the following conclusions: (1) the average efficiency value of LGUE at the national level is still at a low level, but it is on an upward trend. There are significant differences in LGUE among the eastern, central, and western regions, with the highest LGUE in the eastern region and the lowest in the western region. (2) The spatial distribution of LGUE in various cities across the country is not entirely random but shows significant spatial autocorrelation characteristics. The improvement in LGUE in a region can improve the surrounding region’s LGUE. (3) Economic development level promotes the improvement of local city LGUE, but its impact on LGUE of surrounding neighboring cities is not significant; local city industrial structure upgrading can improve LGUE in both local and neighboring cities; foreign investment in local cities can promote LGUE in both local and neighboring cities; the increase in population density will hinder LGUE in local cities but improve surrounding cities LGUE. The intervention degree of local city government will suppress the improvement of LGUE in both local and neighboring cities.

1. Introduction

With the continuous deepening of urbanization, traditional enclosure-style expansion has gradually decreased its impact and contribution to economic growth. People have begun to focus on land intensive use and LGUE improvement. However, the land use mode that only focuses on economic benefits while ignoring environmental carrying capacity has led to “urban diseases” such as environmental pollution, resource waste, and ecological deterioration, which seriously hinder urbanization [1]. Therefore, green development is important for achieving sustainable development under resource and environmental constraints [2]. The green use of urban land is an important practice in the concept that green development is an inevitable requirement for building an ecological civilization [3]. The status of LGUE is crucial to properly solving various structural contradictions in production, implementing carbon peak goals, and carbon neutrality prospects. The LGUE comprehensively realizes coordinated development and meets the needs of people’s lives in terms of environmental and quality of life aspects.
At present, the LGUE in China is relatively low, and most cities are at medium and low levels, with a large space for optimization and improvement [4]. Comprehensively improving the LGUE is a major practical problem that needs to be solved today. Urban agglomerations, as key areas and priority development areas of national urban construction, have become important spatial carriers in the new stage of economic development. Strengthening cooperation and interaction between cities within urban agglomerations, forming cooperative linkage mechanisms between cities [5], and integrating the “green” and “joint” development concepts into the systematic decision-making of urban land use are powerful means to break through the improvement of LGUE in the region. In today’s context, where economic development contacts between cities are increasingly close, taking urban agglomerations as the starting point and leading cities as the guide, and fully considering the comparative advantages of each city, points out the direction for forming a high-quality development pattern of territorial space. Urban land green utilization is both the process of land use and the goal of land use. Reasonably measuring LGUE is important for sustainability.
Based on the above analysis, this paper measures the land green utilization efficiency of 30 regions in China using the super-efficient SBM model, compares the land green utilization efficiency of different regions from the horizontal and vertical perspectives, and then examines the factors affecting the land green utilization efficiency using the spatial econometric model and analyzes the spatial effects of their influencing factors, which on the one hand, provides theoretical references to the government’s policymaking, and on the other hand, provides guidance and reference for improving China’s regional land green utilization efficiency. To provide guidance and reference for improving regional land green utilization efficiency in China.

2. Literature Review

2.1. Connotation and Measurement of LGUE

In the evaluation of LGUE, the traditional method adopts a single-index method to measure, such as Han and Lai [6], using the non-agricultural GDP per unit of urban construction area to represent the value of LGUE. However, the measurement of a single index often only reflects economic benefits and less social benefits [7]. Based on the shortcomings of single-index measurements, scholars have constructed a comprehensive evaluation method to measure [8]. The comprehensive evaluation method is represented by the “social + economic + ecological” model [9]. Wang and Pang [10] measured LGUE and considered environmental pollution and energy consumption in an evaluation system. Xie et al. [11] selected a sequence generalized directional distance function to measure the dynamic changes in industrial land use efficiency. With the deepening of research, data envelopment analysis (DEA) has been widely applied. For example, Cao et al. [12] used the super-SBM model to measure LGUE.

2.2. Research on Spatiotemporal Evolution of LGUE

Urban land green utilization efficiency is a spatiotemporal dynamic evolution process due to the geospatial location of the city, the endowment of land resources, and different stages of socioeconomic development, resulting in the green utilization efficiency of land resources in different cities and at different stages of development with the existence of objective spatiotemporal heterogeneity. Some scholars have carried out rich research in this field, such as Liu et al. [13], who showed that during the thirty years, the efficiency of urban construction land use in China showed a significant increasing trend, and the growth rate in the central region was the highest. Li [14] found that LGUE in Guizhou Province showed a trend of first decreasing and then increasing from 2005 to 2020, but the overall trend is positive and shows a “high in the center and low around” evolution characteristic. Ding et al. [15] found that the overall trend of LGUE of resource-based cities in the Yellow River Basin was not significant from 2009 to 2018, the overall spatial correlation is not strong, the agglomeration trend is not significant, and a “small agglomeration and large dispersion” spatial distribution characteristic is locally shown. Zhang et al. [16] found significant regional differences, with an overall two-stage fluctuating upward pattern; Zhang et al. [17] concluded that the LGUE in the Central Plains urban agglomeration is not high overall, showed a trend of first decrease and then increase; Lu et al. [18] showed that China as a whole showed a fluctuating upward trend, with regional differences presenting a pattern of the west > east > central.

2.3. Research on Influencing Factors of LGUE

Research on the factors influencing the efficiency of green land use has focused on government intervention, social environment, and industrial structure. For example, Halleux et al. [19] explored the influencing factors of LGUE in Europe based on empirical studies; Vergurg et al. [20] studied the changes in LGUE from ecological and social environments,; and Zitti et al. [21] found that disposable income per capita has a positive effect on LGU, but ignored the impact of the ecological environment on its efficiency. Domestic scholars such as Xu [22] believe that administrative intervention has a significant impact on LGUE. Hu et al. [23] found that LGUE shows a certain degree of “spatial club” convergence phenomenon. Song et al. [24] explored the spatiotemporal evolution characteristics of industrial structure upgrading and land use efficiency, and found that industrial structure upgrading has not yet formed a universal driving effect on LGUE. Ji and Zhang [25] believe that government policy inclination and special subsidies will have a crowding-out effect on project R&D investment, which is not conducive to the improvement of urban LGUE. Wang et al. [26] believe that corporate rent-seeking behavior will also distort the allocation of urban land green utilization resources, making it difficult for administrative intervention to improve urban LGUE.
Through the combing of literature, the research on urban LGUE is relatively scarce and still in the exploratory stage, with unclear directional conclusions. There are two main shortcomings in the current research: First, not much attention has been paid to LGUE. Urban land provides not only economic output but also, more importantly, social and ecological service products. It is necessary to measure the comprehensive efficiency value when considering environmental constraints. Second, as a type of resource, land is also subject to resource and environmental constraints in its utilization process and needs to achieve green production. Therefore, it should include energy and environmental in the land input-output system when considering the economic value generated by land use, and to construct a LGUE evaluation model, making land use efficiency evaluation more accurate and closer to actual needs. In view of this, this study first uses the super-SBM model to measure LGUE of urban land from 2009 to 2022, analyzes its spatiotemporal variation rules, and then reveals the spatial influencing factors of LGUE. This research not only helps to deeply understand the driving mechanism of LGUE but also provides a scientific basis for urban sustainable development.

3. Methods

3.1. Measurement Method of LGUE

Among the commonly used methods for evaluating land use efficiency, the DEA model is widely applied [27,28]. DEA can handle the full factor efficiency analysis of multiple inputs and outputs at the same time, does not require pre-setting of function or parameter weights, avoids subjectivity and information compression defects, and is widely used. The essence of DEA is to determine whether the decision unit is on the production frontier and whether the decision unit is DEA efficient. The traditional radial DEA model adjusts the input indicators to shrink synchronously or expands the output indicators to enlarge synchronously for inefficient adjustments but cannot effectively adjust the specific indicators, causing inefficiency, which may lead to biased results. In 2001, Tone proposed the SBM model [29], which considers the shortage of expected output or redundancy of undesirable output. It is superior to other models in addressing the shortcomings of traditional DEA models and in reflecting the essence of efficiency evaluation. This model allows inputs and outputs to be adjusted at different ratios and can measure efficiency through the improvement of the average ratios. It can accurately reflect the degree of land use in resource conservation, pollution reduction, and economic growth, which is in line with green land production.
SBM model measures the efficiency of a DMU (x0, y0, z0) with m inputs, n1 expected outputs, and n2 undesirable outputs, based on the following basic form:
ρ = min 1 1 m k = 1 m s k x k 0 1 + 1 n 1 + n 2 r = 1 n 1 s r + y r 0 + v = 1 n 2 s v z v 0
s . t .   x 0 = X λ + s
y 0 = y λ s +
z 0 = z λ + s
λ 0 ,   s 0 ,   s + 0
Among them, ρ represents the efficiency value, λ is the adjustment matrix, X λ represents the input on the frontier, y λ represents the expected output on the frontier, z λ represents the unexpected output on the frontier. s k is K-th input, s r + is the r-th expected output, s v represents the redundancy of the V-th unexpected output, that is, the relaxation of input indicators, expected output indicators, and unexpected output indicators on the production front. In the objective function, 1 m k = 1 m s k x k 0 is the proportion of redundancy in m inputs to their actual inputs, i.e., the average non-efficiency level of m inputs, so, 1 1 m k = 1 m s k x k 0 represents the average efficiency level of m inputs; For the same reason, 1 + 1 n 1 + n 2 r = 1 n 1 s r + y r 0 + v = 1 n 2 s v z v 0 . Indicates the output efficiency level that includes n1 expected outputs and n2 unexpected outputs.
Input redundancy ratio refers to the ratio of input factors that can be reduced:
X = 1 m k = 1 m s k / x k
Expected output shortfall ratio, i.e., output expansion ratio:
Y = 1 n 1 r = 1 n 1 s r + / y r  
Unexpected output redundancy ratio, also known as the ratio of non-expected output that can be reduced:
Z = 1 n 2 v = 1 n 2 s v + z v
However, in the measurement results, it is often the case that multiple DMUs have a value of 1, making it difficult to distinguish the differences between effective DMUs. To avoid the problem of multiple decision units having an efficiency value of 1 during the analysis, which is not conducive to comparative analysis, this study selects the super-SBM model, which extends the SBM model by considering the changing production technology of each year during the research period and estimates efficiency in a non-ray manner. The super-SBM model has the following advantages: overcoming the problem of traditional DEA models based on radial and angular, not considering slack variables leading to biased efficiency values; the calculation result range is not limited to (0, 1], solving the problem of multiple efficiency frontiers that cannot be sorted; and it can introduce undesirable outputs to accurately measure efficiency values [30].

3.2. Selection of Input and Output Variables

Input indicators. This study includes land, capital, and labor inputs in the indicator system. The urban construction land area is used to represent land input, and the total urban employment and private and individual business employees are used to represent labor input. Referring to Zhang Jun et al. [31], for the calculation of capital stock, the fixed asset investment amount is used as the basis, and the perpetual inventory method is adopted. The fixed asset investment amount in 2009 is taken as the initial capital stock, and the fixed asset investment amount in each year during the research period is adjusted and reduced according to the corresponding fixed asset investment price index based on 2009.
Expected output. The expected output is represented by the added value of the secondary and tertiary industries, the average wage of employed staff, and the per capita green space area.
Undesirable output. The undesirable output is the “three wastes” of industry, namely, the volume of industrial wastewater discharge, the emission volume of industrial SO2, and the emission volume of industrial dust, the indicator system as Table 1.

3.3. Spatial Autocorrelation Analysis

The spatial correlation degree of LGUE is measured using Moran’s I to calculate the spatial association and its temporal evolution trend. In Formula (9), n represents the number of cities, x i and x j represents the efficiency values, x represents the mean of land utilization efficiency for each city, S2 represents the mean square deviation of LGUE for each city, and w i j represents the spatial weight matrix. The value of Moran’s I range from [−1, 1]. When Moran’s I > 0, there is a positive spatial correlation in the LGUE of city clusters; when Moran’s I < 0, there is a negative spatial correlation; and when Moran’s I approaches 0, there is no spatial association.
Moran s   I = i = 1 n j n w i j x i x ¯ x j x ¯ S 2 i = 1 n j n w i j
The setting of the spatial weight matrix comprehensively considers geographical accessibility and economic asymmetry. First, based on the negative exponential distance principle and using the inter-city accessible road traffic distance as the basis, an accessible geographical distance spatial weight matrix Wd is constructed. The matrix element in the i-th row and j-th column is w i j = exp(−cdij), where dij is the shortest traffic accessible distance between city i and city j, and the parameter c is the inverse of the minimum non-zero inter-city distance; then, a composite weight matrix is constructed by compounding the inter-city economic relative strength, W 1 = W d d i a g Y 1 ¯ Y ¯ , Y 2 ¯ Y ¯ , , Y n ¯ Y ¯ , where the diagonal matrix element for the city i is the average annual gross domestic product per capita of the city during the observation period, and Y is the annual average gross domestic product of the city cluster.

3.4. Spatial Econometric Analysis Method

When there is spatial dependence between variables, traditional model estimation methods cannot effectively overcome the problems caused by spatial dependence [32], and spatial econometric models must be considered to avoid biases in empirical results [33,34]. The study aims to find the “local-neighbor” effect of LGUE, and the spatial dependence between variables is a key factor to consider in the analysis process. Therefore, this section will attempt to construct the corresponding spatial econometric model. The current common spatial econometric models mainly include three types: the Spatial Lag Model (SLM), Spatial Error Model (SEM), and Spatial Durbin Model (SDM). When the dependent variable is spatially correlated, the Spatial Lag Model (SLM) is generally required.
The form of the Spatial Lag Model is
ln L G U E i t = ρ j = 1 N w i j l n L G U E i t + β i l n X i t + γ i + μ t + ε i t
In the model, ρ is the spatial lag coefficient; N is the number of spatial units; Xit denotes the vector composed of explanatory variables, β i are the estimated parameters of the explanatory variables, γ i and μ t respectively represent the spatial fixed effect and temporal fixed effect.
When the model considers the spatial dependence of the residual, the Spatial Error (SEM) model should be used. The form of the model is as follows:
ln L G U E i t = τ j = 1 N w i j φ i j + β i l n X i t + γ i + μ t + ε i t
In the context of the spatial econometric model, φ i j represents the spatially autocorrelated error term, and τ denotes the spatial autocorrelation coefficient of the error term. All other variables have the same meanings as in Equation (10).
When both the dependent and independent variables have spatial dependence, the Spatial Durbin Model (SDM) should be selected. The SDM model is:
ln L G U E i t = ρ j = 1 N w i j l n L G U E i t + j = 1 N w i j l n x j t + β i l n X i t + γ i + μ t + ε i t
In the model, the specific choice of spatial econometric model to be used in this paper will be determined through empirical testing to select the most appropriate spatial econometric model.

3.5. Variable Selection and Model Construction

3.5.1. Dependent Variable

Land Green Utilization Efficiency (LGUE): The results of LGUE are measured by the super-SBM model.

3.5.2. Explanatory Variables

Economic development level (GDP). The basic development of a city mainly depends on the economy, and its economic level has a decisive effect on the way land is used, therefore, the regional economic level affects LGUE. First, economic development in different regions varies, and there are significant differences in industrial production structure conditions, industrial factor input capabilities, and capital investment, which makes the land input and use configuration show significant differences, that is to say, due to the limited area and fixed spatial location, there is a significant difference in factor allocation between land and other social production factors such as labor, capital, and technology. Second, the degree of economic development directly affects the production activities of enterprises, which is directly related to the use of technology by enterprises, the scale and mode of land use, investment in environmental protection funds, and attention to green development. At the same time, it also helps enterprises to establish the concept of environmental protection and promotes the development of energy-saving and environmental protection industry technology, which can promote the green development of industrial technology. The city’s average GDP is selected as an indicator to measure the level of economic development.
Industrial Structure (IS). The industrial structure can reflect the overall planning direction of a city, which will provide a reference for the division and utilization of urban land and then reasonably control the intensity and mode of land development. Against the background that “green” has become the mainstream direction of social development, urban land use modes should accelerate unified and coordinated development. In general, the land use mode of tertiary industry is precise and clear, and the resource consumption and pollutant emissions of tertiary industry are lower than those of traditional industries. This study selects the proportion of the added value of tertiary industry to GDP to represent.
Population Density (POP). The Chinese economy has the nature of “demographic dividend”. The population size of different cities determines the degree of land demand, which affects the aggregation phenomenon of capital and industry. The LGUE of cities will be affected by production factors aggregation. When urban population density rises to a certain level, it can promote the economic scale and demand of cities, thereby expanding the range of resource aggregation, realizing industrial aggregation, and bringing agglomeration effects, which bring economies of scale to urban development. However, when urban population density increases, it will cause problems such as population congestion and a decline in quality of life, which will affect the economic development of cities and cause a decline in LGUE.
Government Intervention Degree (GOV). The government is the administrative subject of urban management, and it has large decision-making power in urban planning, industrial development, land resource development, and utilization and configuration. Since the market allocation mechanism for land resources is not yet mature enough, excessive government intervention, motivated by local governments’ pursuit of maximizing regional economic aggregates, is more likely to lead to an excessive supply of land resources and excessively low prices, giving rise to excessive demand for and inefficient use of land. Government monopolization of land supply and excessive intervention in the land market are major causes of distortion in the allocation of land resources. Such intervention not only inhibits the optimal allocation of land but may also lead to inefficient land use. The government’s direct or indirect intervention also opens the door to polluting industries, and land development and utilization activities that sacrifice the ecological environment frequently occur. Following the research of Wang et al. [35], the per capita government fiscal expenditure is used to represent the degree of government intervention in society and the economy, and its impact on urban LGUE is examined.
Openness to the Outside World (FDI): The improvement of openness to the outside world may be accompanied by technology transfer and industrial upgrading, which is conducive to improving LGUE; however, it may also cause problems such as excessive land development and intensified pollution due to the pursuit of short-term economic benefits, which have a negative impact on LGUE. This study selects the proportion of FDI to GDP as an indicator. Descriptive statistics for each variable are shown in Table 2.

4. Results

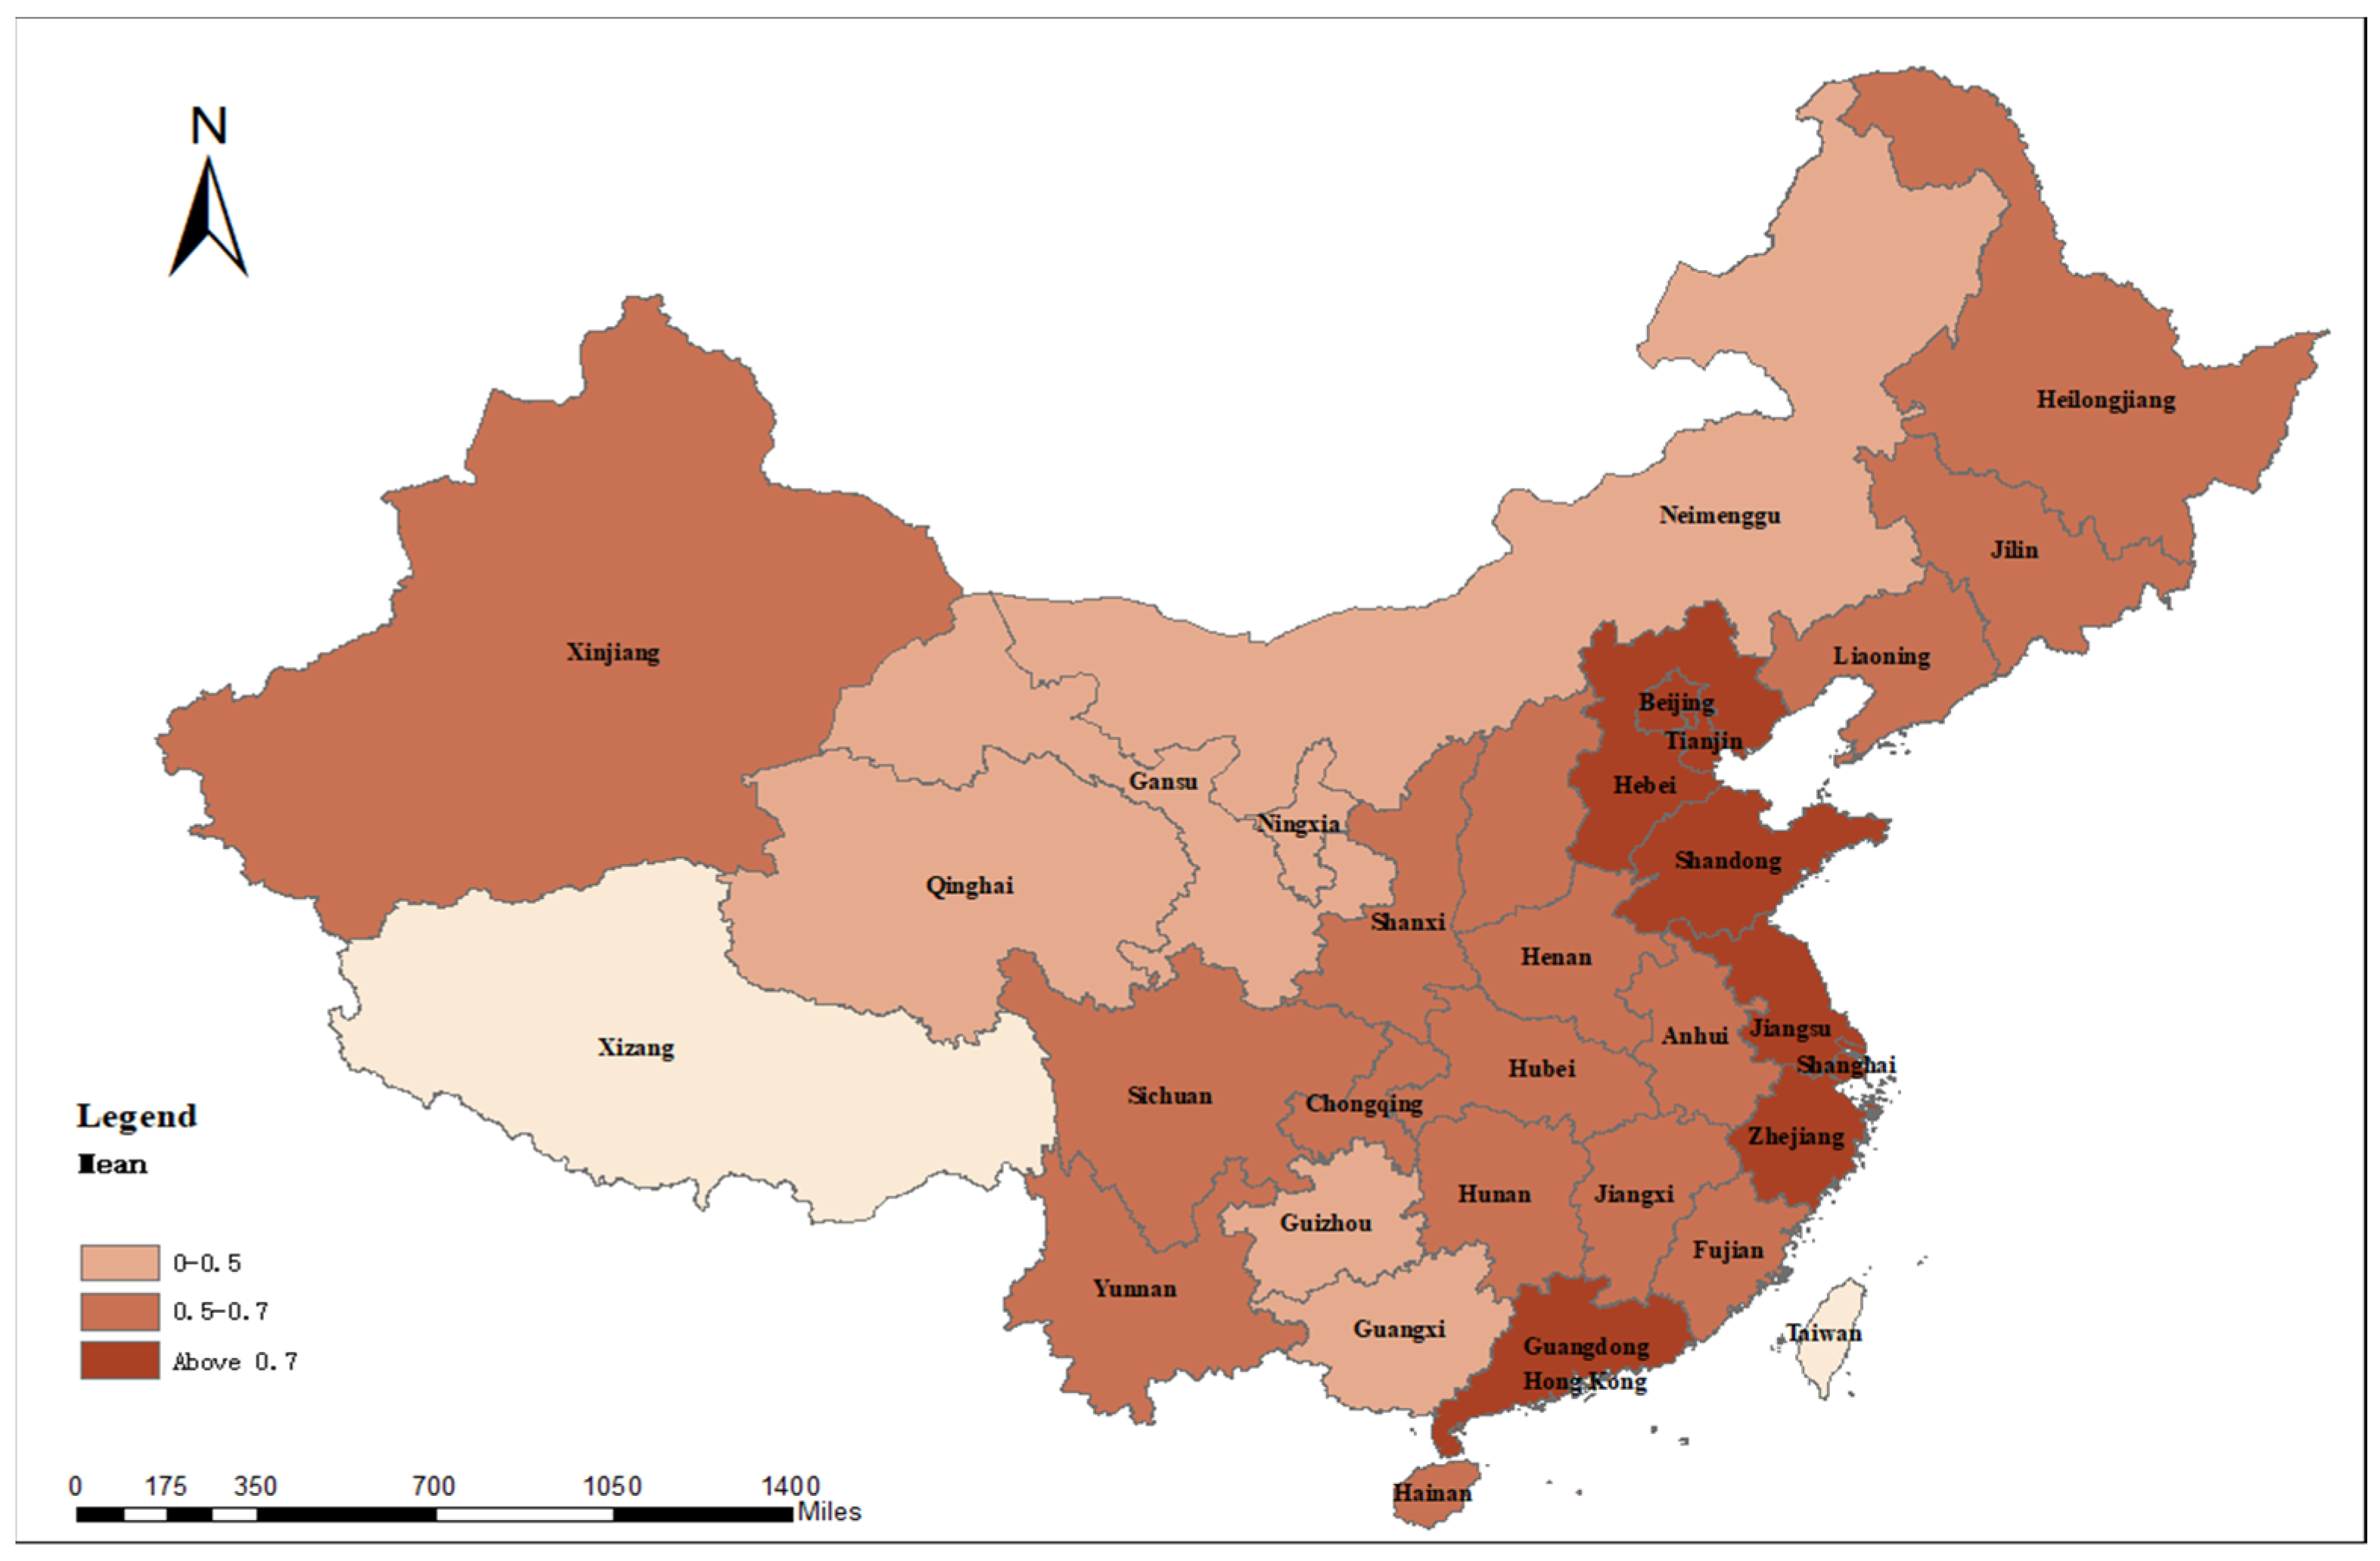
4.1. Measurement Results of LGUE

The study adopts the super-SBM model to calculate the LGUE of 30 regions from 2009 to 2022, and the results are shown in Table 3.
From the overall trend of the national LGUE over time, the average efficiency in the country increased from 0.470 in 2009 to 0.656 in 2022, indicating that the value is gradually increasing during the research period. From different large regions (eastern, central, and western), there are significant differences in LGUE between regions. The average value of the eastern region is 0.887, the central region is 0.635, and the western region is 0.447. Combined with the spatial distribution of efficiency values at the city, provincial, and municipal levels, the spatial differentiation characteristics of urban LGUE can be summarized as gradually decreasing from the eastern coast to the northwest inland area (Figure 1). The main reason is that the eastern is economically developed, and cities have an absolute advantage in “hardware” construction and “software” construction [36,37], which can attract more investment and further promote faster urban development; the city’s industrial structure and layout are more rational, and the agglomeration effect is more obvious, which can greatly reduce costs and save space; meanwhile, the “pollution reduction effect” of industrial structure optimization and technological progress begins to emerge [38,39]. All of these aspects are conducive to improving LGUE. In contrast, the economic development in the central and western regions is relatively slow, the regional environment and investment environment are obviously not as advantageous as in the eastern region, urban infrastructure is insufficient, technological progress levels are relatively low, and the industrial structure is not rational, which is insufficient to generate agglomeration effects to reduce costs. This is also not conducive to reducing pollution emissions per unit of output, ultimately leading to low urban LGUE.

4.2. Spatial Autocorrelation Test

The Moran’s I is calculated using MATLAB for LGUE from 2009 to 2022 are all significantly positive, indicating that the spatial distribution of LGUE across all cities in the country is not entirely random but shows significant spatial autocorrelation characteristics (see Table 4).

4.3. Spatial Econometric Regression

4.3.1. Spatial Model Selection

Before conducting the empirical analysis of the factors influencing LGUE, this paper successively performed LM, Wald, LR, and Hausman tests to preliminarily determine the specific form of the model to be used. The results in Table 5 indicate that the LM statistic passes the significance test, demonstrating that the model exhibits spatial autocorrelation characteristics in the residuals. Consequently, this paper further selects the model through Wald and LR tests. The results show that both the Wald and LR statistics for the Spatial Lag Model and the spatial error model reject the null hypothesis, meaning that the Spatial Durbin Model (SDM) regression results are more appropriate for this study, and the SDM used cannot be directly simplified to a Spatial Lag Model or a spatial error model. Additionally, the Hausman test also rejects the assumption of the random effects model. Therefore, the study ultimately chooses the SDM with time and space fixed effects to explore the spatial spillover effects.

4.3.2. Spatial Econometric Model Estimation

Multicollinearity Test

Before performing the regression, it is necessary to check for serious multicollinearity between different explanatory variables. Multicollinearity refers to the high or precise correlation between the explanatory variables in a linear regression model that prevents the model from estimating accurately or estimating incorrectly. To rule out this error, this paper uses the variance inflation factor, VIF, to measure the multicollinearity of each variable. The larger the variance inflation factor (VIF), the higher the probability of covariance between the explanatory variables. Generally speaking, if the VIF is greater than 5, the model may have serious multicollinearity problems and is not suitable for the next regression analysis. Table 6 shows the results of the multicollinearity test of the regression model in this paper. It can be seen that, among all the explanatory variables, the maximum value of VIF is 3.33, which is less than the critical value of 5. This indicates that the regression equation constructed in this paper does not have serious multicollinearity problems and the regression results are acceptable.

Results of Spatial Econometric Model Estimation

According to the estimation results of the SDM shown in Table 7, it can be observed that the model fit is greater than 0.8, indicating a high level of explanatory power. The spatial regression coefficient is 0.0632. This suggests a significant positive spatial spillover effect on LGUE. An improvement in the LGUE of a local city can have a positive impact on the LGUE of surrounding neighboring cities, thereby driving an increase in the LGUE of these neighboring cities. Additionally, the model results show that all coefficients passed the significance test. This means that relevant driving factors can influence the LGUE of other regions in space. This further illustrates that failing to consider spatial effects may lead to biased empirical conclusions.

4.3.3. Analysis of the Spatial Effects Decomposition of LGUE Driving Factors

Considering that a change in the independent variable of a region not only affects the dependent variable in that region but may also impact the dependent variables in other regions, LeSage and Pace [40] define the former as the direct effect and the latter as the indirect effect. They argue that the indirect effect reflects the spatial spillover effect and provide methods for measuring the direct and indirect effects, as well as the total effect, using averages. Elhorst and Fréret (2009) [41] further offer corresponding statistical test quantities. It is evident that a more appropriate approach is to analyze the impact of various variables on ecological efficiency by observing direct and indirect effects. Therefore, the following text mainly observes the impact of various types of variables on ecological efficiency through direct and indirect effects. To further explore the spatial spillover effects of the regression coefficients for LGUE in the model, Table 8 presents the decomposition of the direct and indirect effects for each variable using the partial derivative matrix.
Economic growth can improve LGUE, which is confirmed by statistical analysis. Specifically, economic growth has a significant positive direct impact on local LGUE, with a coefficient of 0.1349. However, its indirect impact, with a coefficient of −0.0982, is not statistically significant. This result is the same as that of Zhu et al. [42], who also pointed out that economic growth can promote local LGUE. However, the impact of this growth on LGUE in neighboring cities is not significant. This may be because cities with a solid economic foundation can increase investment in environmental governance and energy-saving. With the increase in residents’ income, their demand for a high-quality living environment also grows, which further promotes green consumption and low-carbon development in cities, thereby improving LGUE. However, high-economic-level cities may affect neighboring cities in two opposite ways: on the one hand, they may promote economic development in neighboring cities through the trickle-down effect and industrial connections, and on the other hand, they may transfer pollution-intensive industries to neighboring cities during industrial transformation, which may inhibit the LGUE of these cities.
The optimization and upgrading of the industrial structure can also improve the LGUE of both local and neighboring cities. The direct effect coefficient is 0.0804, and the indirect effect coefficient is 0.0626. This indicates that upgrading the industrial structure not only helps improve the LGUE of local cities but also promotes the development of neighboring cities through positive spillover effects. A higher tertiary industry proportion is a sign of an advanced industrial structure, which not only reflects the overall strength of the city but also attracts more high-quality investment projects. In addition, in urban development, a higher service industry proportion is associated with lower land pollution levels. This optimization of the industrial structure can control urban over-expansion and reduce the environmental pollution caused by traditional industrial activities, thereby effectively reducing the burden of urban growth on the ecological environment. This transformation improves the environmental protection of the LGUE. Moreover, the transformation of cities to a higher-end industrial structure not only promotes LGUE but also has a positive impact on the LGUE of neighboring cities through demonstration effects, industrial linkages, and positive externalities, thus promoting the harmonious development of population, resources, and environment within the region.
The direct effect coefficient of foreign investment is 0.1534, and the indirect effect coefficient is 0.0314. This indicates that local foreign investment has a promoting effect on local city LGUE. Comprehensively expanding openness and improving the level of interconnection with major ports along the “Belt and Road” initiative can configure various types of element resources on a larger scale. At the current stage, the positive impact of introducing foreign capital, such as capital factors and technology spillover effects, is greater than the negative impact of pollution transfer, and it is important to focus on introducing foreign investment in advanced production and green and clean technologies to improve urban LGUE. Foreign investment can also improve the LGUE of neighboring cities. The main reason is that foreign direct investment brings capital and technology spillover effects, which can promote neighboring areas of the LGUE.
The increase in population density inhibits the LGUE of local city land but has a positive correlation with that of neighboring cities. This indicates that population density hinders the green use of land in cities. A higher population density increases the demand for residential land for living, thereby reducing the demand for industrial land with higher economic efficiency. It also causes congestion effects, and increases regional pollutants and carbon dioxide emissions, thereby constraining the improvement of urban LGUE. At the same time, the surge in demand for social infrastructure due to high population density leads to excessive environmental undesirable outputs, which can not improve LGUE. The strong population aggregation capacity and high urbanization level of local cities can meet more residents’ needs, which to some extent alleviates the population pressure in neighboring cities and has a promoting effect on their LGUE.
The direct effect coefficient of government intervention is −0.1624, and the indirect effect coefficient is −0.0675, all of which passed the significance test. This indicates that the improvement in LGUE is affected and suppressed by the degree of government intervention in local cities. This is consistent with the research conclusions of Tu et al. [43], Zhou et al. [44], Wen et al. [45], and Zhang and Wu [46]. That is, government intervention inhibits LGUE and suppresses LGUE in neighboring cities through negative spillover effects. The government is responsible for promoting regional economic growth and intervenes in regional socioeconomic development through fiscal expenditure. Excessive intervention is not conducive to the role of market entities, leading to the irrational allocation of various factors, thereby inhibiting the improvement of urban LGUE. It is necessary to adhere to market entities and government guidance. The government should increase support for infrastructure construction, strengthen investment in technology elements, human resources, and environmental governance, and promote the improvement of urban LGUE. The measures and strategies adopted by local city governments for land development and use, urban infrastructure investment, and industrial structure optimization will be transmitted to neighboring cities.

5. Conclusions and Suggestions

5.1. Conclusions

This study uses the super-SBM model to measure the LGUE of urban land from 2009 to 2022 and analyzes its spatiotemporal variation rules to reveal the spatial influencing factors of LGUE, drawing the following conclusions:
From the overall national trend over time, the average efficiency value of urban LGUE during the research period remains at a low level but is on an upward trend. Significant differences exist in LGUE among the eastern, central, and western regions, with the eastern region having the highest average value and the western region the lowest.
The spatial distribution of LGUE across all cities in the country is not entirely random but exhibits significant spatial autocorrelation characteristics. A significant positive spatial spillover effect exists in urban LGUE, where improvements in one city can positively influence the efficiency of neighboring cities.
Economic growth has a positive direct impact on enhancing LGUE in local cities, although its impact on surrounding cities is not statistically significant. This may be because economically strong cities can invest more in production factors, providing financial support for environmental protection and energy-saving and emission-reduction measures. Meanwhile, the optimization of the local city’s industrial structure not only promotes the growth of LGUE locally, but also has a positive externality effect that encourages progress in neighboring cities. Additionally, foreign investment has a positive direct impact on the LGUE of local cities, and this influence is also statistically significant in neighboring cities. In terms of population factors, an increase in population density hinders the green use of land in local cities but helps to alleviate population pressure in neighboring cities, thus positively affecting their green land utilization efficiency. Government intervention in local cities may restrict LGUE and negatively affect the LGUE of neighboring cities through negative externalities, mainly because excessive government intervention may limit the green transformation of land use efficiency.

5.2. Suggestions

Emphasize the technological embedding and environmental empowerment effects of the digital economy on urban land use. First, the government should actively adapt to and lead a new round of digital technology innovation, deeply embedding it in urban land use activities to improve the efficiency of urban land use and environmental governance. Second, the government should adapt to the development environment of digitalization, create a digital platform for green land use governance in cities, and enhance the dynamic response of urban land green use to internal and external environmental changes.
Local governments should innovate land management methods to enhance the efficiency of green land utilization. First, local governments should unite regional innovation resources, increase financial investment in scientific and technological innovation and platform construction, support clean technology innovation through taxation, subsidies, and other means, and improve regional independent innovation capacity. Secondly, it is necessary to pay attention to the important role of enterprises as the main force in technological innovation, strengthen the cooperation between government and enterprises, introduce new technologies, improve the efficiency of resource allocation and technology utilization, and then promote the improvement of regional urban land green utilization efficiency. Finally, through the strict implementation of arable land protection policies, the transfer of land use rights should be standardized, the focus should be on the operation of rough and less efficient land, large-scale operations should be carried out, the modernization of agriculture should be promoted, and efficient ecological agriculture should be developed. For example, by concentrating roughly operated and less efficient land in the hands of farmers and carrying out large-scale operations to promote agricultural modernization and develop efficient ecological agriculture, the efficiency of land-scale operations can be improved. Improve the efficiency of large-scale land management.
The adjustment of industrial structure is crucial for improving LGUE, which can not only promote rapid urban economic development but also reduce the negative impact on resources and the environment. It can also provide a reference for the scientific planning of urban land. First, the industrial structure is suggested to shift toward industries with low energy consumption, less environmental pollution, and high economic benefits, alleviating environmental pollution caused by economic development while promoting rapid social and economic development; second, through green industrial transformation, eliminate backward production capacity, foster emerging industries, and establish a comprehensive emission-reduction mechanism for each link of the industry. Utilize the spatial reconstruction effect of the industry to promote the development of urban land use toward greening, low-carbon, and high efficiency.
Vigorously advocate for green land use, appropriately develop the tourism industry, and increase publicity efforts to instill the concept of combining land use with green development in people’s minds. Integrate the green concept into all industries, strictly control the bottom line of the land-population environment, and appropriately increase the development of the tourism industry in various cities in Guangxi to reduce industrial pollution. Consider environmental factors more in economic output, allowing economic growth and environmental friendliness to proceed simultaneously. Leverage local geographical features to vigorously develop the tourism industry and appropriately reduce the proportion of the secondary industry.
The government should protect and support urban land facing ecological and environmental risks. It should play a guiding role in land use and industrial layout, create a good institutional environment, strengthen market supervision, maintain healthy land market competition, and reduce negative externalities, such as random pollution discharge. The government should also strengthen the management of land that has been allocated, strictly control inefficient land use, achieve sustainable urban land use; and local governments should formulate scientific and reasonable environmental standards for industry entry, strengthen environmental regulation, and play a comprehensive role in front-end control and end-of-pipe treatment to improve the ecological governance capacity of cities in the Northeast region.
For cities lagging in efficiency, the approach should be to “strictly control increments, revitalize existing resources, and improve quality” to enhance the LGUE of urban land. With the continuous improvement in urbanization levels, the expansion of urban land scale has not been accompanied by an increase in LGUE, indicating that such cities should moderately control the scale of construction land, replace increments with potential, optimize the internal structure of cities, promote industrial structure upgrades, and drive intensive and green land use to improve land use efficiency.
Strengthen the attraction, exchange, and radiation effects of central cities on surrounding cities, break down barriers to cooperation, and jointly improve the overall LGUE of urban agglomerations. As the “leader” of urban agglomeration development, central cities should effectively leverage their attractiveness for scientific and technological innovation and high-level talents from a technology innovation agglomeration economy, take the lead in implementing sustainable development measures such as green buildings and low-carbon transportation, and move toward a higher level of LGUE. Further, utilize the exchange and radiation power of central cities on surrounding cities, play a leading and exemplary role, and build characteristic industrial chains in urban agglomerations. With central cities as the lead, cities should strengthen policy communication to form an integrated land use development mechanism, plan rationally for different cities, determine the reasonable layout of functional areas such as green spaces, ecological protection areas, and industrial land, and achieve organic integration and coordinated development of cities within urban agglomerations, breaking down barriers to cooperation.

5.3. Shortcomings and Prospects of the Research in This Paper

Transportation infrastructure is widely recognized as a key factor influencing both desirable and undesirable outputs in urbanized areas. For example, subways bring significant economic and air quality benefits to Chinese cities [47], which are correlated with the output indicators. However, this paper has limitations in data collection, with missing data for some years as well as insufficiently updated data for 2022, and thus did not consider this influential factor, which is a factor that this paper needs to focus on in future research.
Three undesirable outputs were considered in this study. However, in the context of global decarbonization, CO2 emissions as undesirable outputs could be a potential limitation of the methodology, especially considering that urbanization-induced land use and land cover changes are one of the main causes of CO2 emissions and climate change [48,49], and that this paper considered the undesirable outputs mainly on the basis of whether or not they pollute the environment, and did not take into account the impacts of CO2 on the climate. This important factor may have been overlooked; therefore, further research will be carried out in future studies by considering non-desired outputs, including CO2, in the hope of drawing more valuable conclusions.

Author Contributions

Methodology, J.T.; software, X.S.; validation, X.S.; formal analysis, J.T.; investigation, X.S.; resources, X.S.; data curation, R.W.; writing—original draft preparation, J.T.; writing—review and editing, R.W.; project administration, X.S.; funding acquisition, R.W. All authors have read and agreed to the published version of the manuscript.

Funding

This research received no external funding.

Data Availability Statement

The data used to support the findings of this study are available from the corresponding author upon request.

Conflicts of Interest

The authors declare no conflicts of interest.

References

  1. Ma, Y.; Zheng, M.; Xu, F.; Qian, Y.; Liu, M.; Zheng, X.; Liu, J. Modeling and exploring the coordination relationship between green infrastructure and land use eco-efficiency: An urban agglomeration perspective. Environ. Sci. Pollut. Res. 2023, 30, 92537–92554. [Google Scholar] [CrossRef] [PubMed]
  2. Tsai, S.B.; Liu, W.; Yuan, Y. Guest editorial: New challenges and opportunities for green industry development. Int. J. Syst. Cybern. 2023, 52, 493–494. [Google Scholar] [CrossRef]
  3. Bille, R.A.; Jensen, K.E.; Buitenwerf, R. Global patterns in urban green space are strongly linked to human development and population density. Urban For. Urban Green. 2023, 86, 127980. [Google Scholar] [CrossRef]
  4. Zhang, R.; Wen, L.J.; Wang, N.; Mou, S. Impact of scientific and technological innovation on green use efficiency of urban land: A case study of 48 districts and counties in the Wuhan Metropolitan Area. Resour. Sci. 2023, 45, 264–280. [Google Scholar] [CrossRef]
  5. Bosma, C.; Hein, L. The climate and land use change nexus: Implications for designing adaptation and conservation investment strategies in Sub-Saharan Africa. Sustain. Dev. 2023, 31, 3811–3830. [Google Scholar] [CrossRef]
  6. Han, F.; Lai, M.Y. Market Proximity, Technology Spillover, and Urban Land Use Efficiency. World Econ. 2016, 39, 123–151. [Google Scholar]
  7. Li, Y.L.; Shu, B.R.; Wu, Q. Urban Land Use Efficiency in China: Spatiotemporal Characteristics, Regional Disparities, and Influencing Factors. Econ. Geogr. 2014, 34, 133–139. [Google Scholar]
  8. Liu, Y.; Fan, P.; Yue, W.; Song, Y. Impacts of Land Finance on Urban Sprawl in China: The Case of Chongqing. Land Use Policy 2018, 72, 420–432. [Google Scholar] [CrossRef]
  9. Tong, X.N.; Yang, G.Q.; Li, M.Y. Comprehensive Evaluation Index System and Method for Urban Land Use Benefits—A Case Study of Wuhan City. J. Huazhong Agric. Univ. (Soc. Sci. Ed.) 2006, 4, 53–57. [Google Scholar]
  10. Wang, D.Q.; Pang, X.Q. Study on the Green Land Use Efficiency of the Jing-Jin-Ji Urban Agglomeration. China Popul. Resour. Environ. 2019, 29, 68–76. [Google Scholar]
  11. Xie, H.L.; Chen, Q.R.; Wang, W.; He, Y.F. Analyzing the green efficiency of arable land use in China. Technol. Forecast. Soc. Chang. 2018, 133, 15–28. [Google Scholar] [CrossRef]
  12. Cao, X.; Liu, Y.; Li, T.; Liao, W. Analysis of Spatial Pattern Evolution and Influencing Factors of Regional Land Use Efficiency in China Based on ESDA-GWR. Sci. Rep. 2019, 9, 520. [Google Scholar] [CrossRef] [PubMed]
  13. Tan, S.; Hu, B.; Kuang, B.; Zhou, M. Regional differences and dynamic evolution of urban land green use efficiency within the Yangtze River Delta, China. Land Use Policy 2021, 106, 105449. [Google Scholar] [CrossRef]
  14. Li, Z.Y. Spatiotemporal Evolution and Influencing Factors of Urban Land Green Utilization Efficiency under the Dual-Carbon Goals: A Case Study of Guizhou Province. Mod. Hortic. 2023, 46, 153–155. [Google Scholar]
  15. Ding, Y.; Guo, Q.X.; Qin, M.X. Spatiotemporal Evolution and Influencing Factors of Green Land Use Efficiency in Resource-Based Cities in the Yellow River Basin. J. Agric. Eng. 2021, 37, 10. [Google Scholar]
  16. Zhang, Y.H.; Chen, J.L.; Gao, J.L.; Jiang, W.Y. Impact Mechanism of Urban Land Use Efficiency from the Perspective of Economic Transition: A Study of the Yangtze River Delta. J. Nat. Resour. 2019, 34, 1157–1170. [Google Scholar] [CrossRef]
  17. Zhang, S.J.; Liu, X.Y.; Du, S.Y. Study on the Spatiotemporal Differences and Influencing Factors of Urban Land Use Efficiency in the Central Plains Urban Agglomeration. Resour. Environ. Yangtze River Basin 2021, 30, 2417–2429. [Google Scholar]
  18. Lu, X.H.; Li, J.; Liu, C.; Kuang, B.; Cai, D.W.; Hou, J. Driving Factors and Spatial Differentiation of Urban Land Green Utilization Efficiency in China. Geogr. Sci. 2022, 42, 611–621. [Google Scholar]
  19. Halleux, J.M.; Marcinczak, S.; Krabben, E.V.D. The adaptive efficiency of land use planning measured by the control of urban sprawl. The cases of the Netherlands, Belgium and Poland. Land Use Policy 2012, 29, 887–898. [Google Scholar] [CrossRef]
  20. Verburg, P.H.; Berkel, D.B.V.; Doorn, A.M.V.; van Eupen, M.; van den Heiligenberg, H.A. Trajectories of land use change in Europe: A model—Base exploration of coral futures. Landsc. Ecol. 2010, 25, 217–232. [Google Scholar] [CrossRef]
  21. Masini, E.; Tomao, A.; Barbati, A.; Corona, P.; Serra, P.; Salvati, L. Urban Growth, Land-use Efficiency and Local Socioeconomic Context: A Comparative Analysis of 417 Metropolitan Regions in Europe. Environ. Manag. 2019, 63, 322–337. [Google Scholar] [CrossRef] [PubMed]
  22. Xu, Z.X.; Xu, W.W.; Liu, C.J. The Impact of Environmental Regulation on Land Green Utilization Efficiency. Chin. Land Sci. 2021, 8, 87–95. [Google Scholar]
  23. Hu, B.X.; Li, J.; Kuang, B. Evolution Characteristics and Influencing Factors of Urban Land Use Efficiency Differences under the Concept of Green Development. Econ. Geogr. 2018, 38, 183–189. [Google Scholar]
  24. Song, Y.; He, C.F.; Yueng, G.; Xu, Y. The Impact of Industrial Structure Upgrading in Resource-Based Cities in China on Land Use Efficiency. Geogr. Res. 2023, 42, 86–105. [Google Scholar]
  25. Ji, Z.H.; Zhang, P. Spatial Differences and Driving Mechanisms of Urban Land Use Efficiency in China under Environmental Constraints—A Study of 285 Prefecture-Level and Above Cities. Chin. Land Sci. 2020, 8, 72–79. [Google Scholar]
  26. Wang, P.; Chen, Y.; He, Y.J. Theoretical Analysis and Identification of Key Issues in the Regulation of Regional Green Space Use. Ecol. Econ. 2019, 9, 177–181+221. [Google Scholar]
  27. Charnes, A.; Cooper, W.W.; Li, S. Using DEA to Evaluate Relative Efficiencies in the Economic Performance of Chinese Cities. Socio-Econ. Plan. Sci. 1989, 23, 325–344. [Google Scholar] [CrossRef]
  28. Ahn, T.; Charnes, A.; Cooper, W.W. Using Data Envelopment Analysis to Measure the Efficiency of Not-for-Profit Organizations: A Critical Evaluation-Comment. Manag. Decis. Econ. 2010, 9, 251–253. [Google Scholar] [CrossRef]
  29. Tone, K. A slacks based-measure of efficiency in data development analysis. Eur. J. Oper. Res. 2001, 130, 498–509. [Google Scholar] [CrossRef]
  30. Meng, M.; Qu, D. Understanding the green energy efficiencies of provinces in China: A Super-SBM and GML analysis. Energy 2022, 239, 121912. [Google Scholar] [CrossRef]
  31. Zhang, J.; Wu, G.Y.; Zhang, J.P. Estimation of Interprovincial Physical Capital Stock in China: 1952–2000. Econ. Res. 2004, 10, 35–44. [Google Scholar]
  32. Huang, C.F. Spatial Measurement and Evaluation of Land Traffic Accessibility Based on GIS. J. Chongqing Jiaotong Univ. (Soc. Sci. Ed.) 2022, 22, 23–28. [Google Scholar]
  33. Li, X.X.; Zhao, L.; Liu, Y.X.; Jiang, Z.; Cai, L. Eco-efficiency Measurement and Spatiotemporal Characteristics Analysis at the County Scale in Shandong Province. World Reg. Stud. 2022, 31, 120–129. [Google Scholar]
  34. Yang, J.; Wang, Y.X.; Zhou, L.Y. Study on the Impact of Urban Land Use on Subway Passenger Flow Based on Spatial Econometric Model. Railw. Transp. Econ. 2023, 45, 81–88. [Google Scholar]
  35. Wang, L.J.; Li, H.; Shi, C. The Efficiency of Urban Land Use in China and Its Spillover Effects and Influencing Factors. Acta Geogr. Sin. 2015, 70, 1788–1799. [Google Scholar]
  36. Hu, G.Z. Research on the Connectivity of Software Infrastructure under the “Belt and Road” Initiative—Taking the China-Indochina Peninsula Economic Corridor as an Example. Chin. Circ. Econ. 2018, 32, 102–109. [Google Scholar]
  37. Guo, X.M.; Huang, S. Efficiency of Institutional Environment and Infrastructure Connectivity in ASEAN Countries under the Construction of the “Land-Sea New Corridor”—Based on the Super Efficiency Window DEA and Spatial Panel Model. Chin. Circ. Econ. 2020, 34, 74–85. [Google Scholar]
  38. Gai, X.M.; Li, A. Study on the Spatial Effects of Factor Technical Efficiency and Industrial Structure Optimization—From the Perspective of Technological Progress Bias. Financ. Econ. Rev. 2021, 1, 3–13. [Google Scholar]
  39. Zhao, Y.A.; Li, J.M.; Lu, J. The Impact of Human Capital Accumulation in the Yangtze River Economic Belt on Environmental Pollution—Based on the Moderating Effect of Technological Innovation. Sci. Technol. Manag. Res. 2023, 43, 85–95. [Google Scholar]
  40. Pace, R.K.; Lesage, J.P. Omitted Variable Biases of OLS and Spatial Lag Models. Adv. Spat. Sci. 2010, 1, 17–28. [Google Scholar]
  41. Elhorst, J.P.; Freret, S. Evidence of political yardstick competition in France usinga two-regime spatial Durbin model with fixed effects. J. Reg. Sci. 2009, 49, 931–951. [Google Scholar] [CrossRef]
  42. Zhu, X.; Zhang, P.; Wei, Y.; Li, Y.; Zhao, H. Measuring the efficiency and driving factors of urban land use based on the DEA method and the PLS-SEM model-A case study of 35 large and medium-sizedcities in China. Sustain. Cities Soc. 2019, 50, 101646. [Google Scholar] [CrossRef]
  43. Tu, F.; Yu, X.; Ruan, J. Industrial land use efficiency under government intervention: Evidence from Hangzhou, China. Habitat Int. 2014, 43, 1–10. [Google Scholar] [CrossRef]
  44. Zhou, Y.; Tan, G.R. Analysis of the Impact of Local Government Competition on Urban Land Use Efficiency. Reg. Res. Dev. 2017, 36, 118–122. [Google Scholar]
  45. Wen, G.Z.; Chai, Y. Land Use Efficiency in Government-Led Urbanization—Empirical Results from China. Acad. Mon. 2015, 47, 11–23. [Google Scholar]
  46. Zhang, X.; Wu, X.W. Study on Regional Differences in Urban Construction Land Use Efficiency in China. J. Jinan Univ. (Soc. Sci. Ed.) 2016, 38, 67–76. [Google Scholar]
  47. Yang, L.; Chau, K.W.; Szeto, W.Y.; Cui, X.; Wang, X. Accessibility to transit, by transit, and property prices: Spatially varying relationships. Transp. Res. Part D Transp. Environ. 2020, 85, 102387. [Google Scholar] [CrossRef]
  48. Ou, Y.; Bao, Z.; Ng, S.T.; Song, W.; Chen, K. Land-use carbon emissions and built environment characteristics: A city-level quantitative analysis in emerging economies. Land Use Policy 2024, 137, 107019. [Google Scholar] [CrossRef]
  49. Gong, P.; Liu, H.; Zhang, M.; Li, C.; Wang, J.; Huang, H.; Clinton, N.; Ji, L.; Li, W.; Bai, Y.; et al. Stable classification with limited sample: Transferring a 30-m resolution sample set collected in 2015 to mapping 10-m resolution global land cover in 2017. Sci. Bull. 2019, 64, 370–373. [Google Scholar] [CrossRef]
Figure 1. Region LGUE distribution.
Land 13 01272 g001
Table 1. Input and Output Indicator System.
Indicator TypeIndicator NameIndicator Composition
Input IndicatorsLand ResourcesUrban Construction Land Area
CapitalFixed Asset Investment Amount
LaborUrban Employment Personnel
Energy InputScale above Industrial Enterprise Energy Consumption
Expected Output IndicatorsEconomic OutputSecondary and Tertiary Industry Added Value
Social OutputAverage Wage of On-post Employees
Ecological OutputPer Capita Green Space Area
Undesirable OutputPollutant EmissionIndustrial Wastewater Discharge Volume
Industrial SO2 Emission Volume
Industrial Dust Emission Volume
Data sources: Gross product and urban fixed asset investment from “China Regional Economic Statistical Yearbook”, the employees come from “China Urban Statistical Yearbook”, urban built-up area from “China Urban Construction Statistical Yearbook”, wastewater, waste gas, and solid waste discharge volume and treatment unit price from “China Environmental Statistical Yearbook”, and the research period is selected from 2009 to 2022. Energy data source “China Energy Statistical Yearbook”. The gross domestic product and fixed asset investment are adjusted to the 2009 price base, resulting in comparable panel data over time.
Table 2. Descriptive statistics results.
VariableMeanStandard DeviationMinimumMaximum
LGUE0.6560.4450.2221.553
Ln GDP9.90874.24551.992619.0091
Ln IS0.23400.33180.01230.4532
Ln POP0.34090.33290.04550.6521
Ln GOV0.07120.06570.00160.1987
Ln FDI0.09030.07760.01130.2109
Table 3. Land use efficiency measurement results.
Region20092010201120122013201420152016201720182019202020212022Mean
EasternBeijing0.835 0.837 0.912 0.924 0.955 1.013 1.032 1.058 1.066 1.127 1.278 1.352 1.431 1.553 1.098
Tianjin0.667 0.668 0.695 0.751 0.753 0.855 0.887 0.932 0.979 1.013 1.036 1.128 1.148 1.175 0.906
Hebei0.536 0.539 0.542 0.622 0.659 0.696 0.711 0.744 0.757 0.784 0.795 0.818 0.827 0.988 0.716
Liaoning0.527 0.538 0.543 0.613 0.629 0.655 0.722 0.725 0.731 0.748 0.769 0.772 0.877 0.885 0.695
Shanghai0.819 0.884 0.936 0.947 0.965 1.043 1.066 1.094 1.123 1.126 1.237 1.248 1.257 1.289 1.074
Jiangsu0.869 0.878 0.926 1.033 1.045 1.057 1.076 1.109 1.123 1.129 1.176 1.208 1.216 1.242 1.078
Zhejiang0.898 0.925 0.936 0.995 1.029 1.033 1.076 1.118 1.121 1.132 1.135 1.173 1.201 1.216 1.071
Fujian0.562 0.567 0.542 0.579 0.605 0.611 0.662 0.681 0.789 0.761 0.785 0.811 0.857 0.883 0.693
Shandong0.561 0.566 0.582 0.597 0.673 0.679 0.742 0.785 0.853 0.887 0.972 1.014 1.079 1.131 0.794
Guangdong0.829 0.834 0.872 0.938 0.955 1.022 1.076 1.111 1.129 1.132 1.146 1.172 1.181 1.218 1.044
Hainan0.428 0.469 0.487 0.528 0.537 0.576 0.588 0.616 0.623 0.636 0.651 0.668 0.732 0.745 0.592
Eastern mean0.685 0.700 0.725 0.775 0.800 0.840 0.876 0.907 0.936 0.952 0.998 1.033 1.073 1.120 0.887
CentralShanxi0.447 0.445 0.525 0.567 0.593 0.619 0.641 0.627 0.663 0.723 0.759 0.765 0.772 0.876 0.644
Jilin0.443 0.471 0.498 0.553 0.598 0.643 0.638 0.626 0.656 0.747 0.791 0.842 0.853 0.891 0.661
Heilongjiang0.447 0.485 0.515 0.537 0.562 0.578 0.563 0.571 0.673 0.722 0.744 0.751 0.818 0.832 0.628
Anhui0.461 0.516 0.522 0.557 0.623 0.631 0.622 0.615 0.643 0.737 0.842 0.814 0.919 0.941 0.675
Jiangxi0.432 0.438 0.473 0.493 0.529 0.523 0.518 0.533 0.571 0.628 0.709 0.722 0.871 0.792 0.588
Henan0.427 0.434 0.445 0.467 0.512 0.545 0.537 0.537 0.566 0.634 0.689 0.726 0.791 0.805 0.580
Hubei0.428 0.475 0.538 0.542 0.579 0.585 0.544 0.562 0.691 0.716 0.747 0.775 0.805 0.816 0.629
Hunan0.422 0.432 0.542 0.679 0.685 0.644 0.612 0.681 0.712 0.743 0.764 0.815 0.838 0.844 0.672
Central mean0.438 0.462 0.507 0.549 0.585 0.596 0.584 0.594 0.647 0.706 0.756 0.776 0.833 0.850 0.635
WesternNeimenggu0.237 0.249 0.219 0.257 0.324 0.337 0.322 0.453 0.459 0.465 0.471 0.542 0.579 0.698 0.401
Guangxi0.334 0.345 0.395 0.397 0.443 0.451 0.411 0.426 0.433 0.506 0.558 0.662 0.698 0.726 0.485
Chongqing0.339 0.341 0.321 0.353 0.428 0.455 0.475 0.526 0.576 0.623 0.636 0.672 0.702 0.732 0.513
Sichuan0.377 0.385 0.315 0.397 0.422 0.438 0.463 0.471 0.573 0.632 0.664 0.731 0.808 0.908 0.542
Guizhou0.221 0.229 0.234 0.255 0.317 0.322 0.346 0.352 0.364 0.411 0.438 0.445 0.565 0.582 0.363
Yunnan0.331 0.338 0.377 0.381 0.431 0.423 0.528 0.567 0.619 0.624 0.641 0.678 0.702 0.729 0.526
Shanxi0.342 0.343 0.353 0.362 0.468 0.463 0.534 0.541 0.548 0.632 0.657 0.616 0.732 0.759 0.525
Gansu0.233 0.246 0.276 0.283 0.297 0.318 0.341 0.357 0.375 0.412 0.434 0.453 0.574 0.595 0.371
Qinghai0.222 0.229 0.231 0.238 0.251 0.264 0.313 0.328 0.337 0.359 0.384 0.416 0.543 0.572 0.335
Ningxia0.223 0.252 0.263 0.266 0.272 0.278 0.312 0.324 0.341 0.348 0.362 0.412 0.538 0.569 0.340
Xinjiang0.307 0.315 0.325 0.367 0.343 0.451 0.471 0.486 0.533 0.546 0.678 0.762 0.798 0.861 0.517
Western mean0.288 0.297 0.301 0.323 0.363 0.382 0.411 0.439 0.469 0.505 0.538 0.581 0.658 0.703 0.447
National mean0.470 0.487 0.511 0.549 0.583 0.606 0.624 0.647 0.684 0.721 0.764 0.797 0.855 0.891 0.656
Table 4. Spatial Autocorrelation Test Results for LGUE.
YearLnLGUEYearLnLGUE
Moranp-ValueMoranp-Value
20090.14270.000420160.26720.0001
20100.16280.000320170.27340.0004
20110.20040.000220180.28430.0002
20120.21470.000020190.29680.0001
20130.22340.000020200.31340.0000
20140.23680.000420210.32690.0000
20150.26110.000120220.34720.0001
Table 5. Results of Model Selection Tests.
Testing MethodStatisticTesting MethodStatistic
LM (lag) test12.342 ***Wald_spatial_lag13.932 ***
Robust LM (lag) test5.822 ***LR_spatial_lag22.384 ***
LM (error) test33.021 ***Wald_spatial_error17.293 ***
Robust LM (error) test19.832 ***LR_spatial_error19.220 ***
Hausman test41.222 ***
Note: *** indicate p < 0.01.
Table 6. Multicollinearity test results.
lnGDPLn ISLn POPLn GOVLn FDI
VIF3.332.571.563.251.98
1/VIF0.30030.38910.64100.30770.5051
Table 7. Results of Spatial Econometric Model Estimation.
VariableTwo-Way Fixed Effects
Ln GDP0.1564 *** (3.655)
Ln IS0.2729 *** (3.567)
Ln POP0.1314 *** (4.569)
Ln GOV0.1498 *** (4.980)
Ln FDI0.2366 *** (6.231)
W    Ln GDP0.2249 *** (3.672)
W    Ln IS0.2537 *** (4.233)
W    Ln POP0.2671 * (1.845)
W    Ln GOV0.1997 *** (2.905)
W    Ln FDI0.2134 ** (1.997)
R20.9905
ρ 0.0632
Log-likelihood177.548
Hansman test0.0000 *** (4.679)
Note: ***, **, * indicate p < 0.01, p < 0.05, p < 0.1 respectively.
Table 8. Decomposition Results of the Spatial Effects of Urban LGUE Driving Factors.
VariableDirect EffectIndirect EffectTotal Effect
Ln GDP0.1349 ***−0.09820.0367 ***
Ln IS0.0804 ***0.0626 ***0.1430 ***
Ln POP−0.1123 ***0.1543 ***0.0420 ***
Ln GOV−0.1624 **−0.0675 **−0.2299 **
Ln FDI0.1534 ***0.0314 **0.1848 ***
Note: ***, ** indicate p < 0.01, p < 0.05 respectively.
Disclaimer/Publisher’s Note: The statements, opinions and data contained in all publications are solely those of the individual author(s) and contributor(s) and not of MDPI and/or the editor(s). MDPI and/or the editor(s) disclaim responsibility for any injury to people or property resulting from any ideas, methods, instructions or products referred to in the content.

