Abstract
The establishment of the ecological protection redline (EPR) in China plays a crucial role in safeguarding key ecological functional areas and sustaining biodiversity. Besides their significance, the impact of these redlines on regional carbon sequestration remains unclear due to current inconsistencies in their implementation and adjustment. This paper conducts a thorough analysis of the evolution of two EPR versions on Hainan Island and employs the InVEST model to assess the effects of two EPR areas on regional carbon storage between 2000 and 2020. Additionally, a spatial autoregressive model is integrated to explore the socioeconomic and environmental driving mechanisms behind changes in regional carbon storage, thereby revealing complex interactions between ecological protection policy adjustments and ecosystem services of carbon storage. Key findings include: (1) The 2022 EPR area has improved the management of ecological protection boundaries, permanent cultivated land, and urban development boundaries, outperforming the 2016 version, particularly in control of construction land and water resource management. (2) The EPR2022 exhibits higher carbon storage per area, indicating a more effective zoning system. The increase in carbon storage is primarily observed in transitions from cultivated land to forest, grassland to forest, and water bodies to grassland. (3) Elevation exhibits a relatively strong positive correlation with carbon storage within the EPRs, with high-altitude areas typically encompassing the core zones of tropical rainforest national parks that possess diverse vegetation and stable ecosystems, conducive to maintaining or increasing carbon storage. Evaluating the efficacy of the EPR in enhancing regional carbon storage is critical for refining management strategies and achieving carbon neutrality goals. Future strategies should incorporate a comprehensive analysis of ecosystem services of carbon storage into the EPR framework to enhance multiple ecosystem functions, thereby establishing a resilient and functionally stable ecological landscape. This research introduces an insightful estimation method crucial for developing more effective ecological protection policies and provides valuable insights for managing ecological protection areas globally.
1. Introduction
Climate change and biodiversity loss represent two of the most pressing challenges to contemporary ecological environments [1], with these challenges being exacerbated by increasing anthropogenic activities that degrade ecosystem health and biodiversity [2]. In response, governments and the global scientific community are dedicated to protecting critical ecological regions and enhancing ecosystem services [3,4,5]. Numerous countries have established protected areas (PAs) in accordance with standards prescribed by the International Union for Conservation of Nature (IUCN) [6,7,8]. These efforts are integral to mitigating environmental threats and promoting sustainable ecological management. Accordingly, Hainan established several nature reserves to provide protection; however, these reserves remained somewhat fragmented and lacked a comprehensive protective effect [9]. In 2011, China initiated the concept of the ecological protection redline (EPR) [10], which defines the spatial extents necessary for ecological protection and establishes baselines for ecological safety [11]. This policy is designed to protect areas that are critical for ecological functions and particularly sensitive to anthropogenetic activities, thereby playing a pivotal role in upholding ecological security [12,13]. Since 2014, China has implemented a comprehensive series of policies and technical guidelines to establish the EPRs both in terrestrial and marine zones [14,15]. Hainan Province, recognized for its significant biodiversity and ecological importance, has frequently served as a pilot region for new environmental initiatives [16,17,18]. This strategic choice underscores the province’s role in national efforts to enhance ecological preservation. In September 2016, the People’s Government of Hainan Province issued its foundational EPR plan, specifically designed to align with the province’s unique ecological characteristics and environmental protection requirements [19]. By April 2018, in conjunction with the development of the Hainan Free Trade Port, Hainan was strategically designated as one of the four pillars of the National Ecological Civilization Pilot Zone [19,20,21]. This designation necessitated rigorous management of the ecosystem and prompted the establishment of comprehensive land management mechanisms and conservation systems. The EPR then underwent subsequent revisions and optimizations to effectively regularize economic development with ecological conservation, culminating in the revision of a second refined version of EPR in 2022 [22].
In assessing terrestrial carbon sequestration, carbon storage is a critical metric used to evaluate the sequestration capabilities of ecosystems [23,24]. Previous research has employed these measurements to analyze regional ecosystem services in conjunction with land use and land cover (LULC) changes, thereby providing a comprehensive view of how land management practices impact carbon dynamics [25,26]. Research on EPR within Chinese academia, particularly focusing on Hainan Island, has primarily centered on management strategies and ecosystem health assessments. Studies have often emphasized the valuation of ecosystem services [27]. For example, Guo et al. [28] utilized a multicriteria framework that incorporated land use and future climate predictions along with scenario analysis to assess the impacts of EPR on Guizhou’s ecological zones. This research demonstrated the effectiveness of EPR in ecological protection, which also exhibited spillover benefits to adjacent non-EPR areas. In another study, Liu et al. [29] evaluated the ecosystem services on Hainan Island in relation to Ecological Security Patterns (ESP), discovering a strong correlation between ESP, vegetation coverage, and habitat quality. This indicates enhanced ecological protection in undisturbed areas. Conversely, recent research by Zhang et al. [30] noted that while EPR implementation on Hainan Island has reduced the movement of habitat risk centers, overall habitat risk levels continue to rise. Despite these findings, the impact of EPR policies on ecosystem health, particularly concerning carbon storage potential, has been unexplored on Hainan Island. In alignment with China’s ambition for carbon neutrality by 2060, numerous ecological restoration projects aimed at boosting the carbon storage potential of natural ecosystems have been initiated within EPR boundaries [31,32]. However, the dynamics of regional carbon storage and its influencing factors remain inadequately addressed in existing studies concerning Hainan Island [33,34].
This study therefore adopts a comprehensive methodology that integrates land use, socioeconomic, and ecological dimensions to systematically investigate the evolution of EPR boundaries on Hainan Island and their effects on land use patterns and carbon storage potential. Employing the InVEST model, this research assesses the impacts of EPR delineations from 2000 to 2020 on regional carbon storage and compares these effects with broader carbon storage trends across the island, enabling dynamic monitoring of ecological services within the EPR. Additionally, a spatial autoregression model is utilized to explore the drivers behind the spatiotemporal evolution of carbon storage within the EPR areas. The findings from this study contribute new scientific insights and methodological frameworks for regional ecological management and policymaking. They could potentially provide empirical evidence supporting the ongoing verification and refinement of EPR delineations, ensuring their scientific accuracy, relevance, and authority in ecological conservation on Hainan Island.
2. Materials and Methods
2.1. Study Area
Hainan Island, situated in the northwestern South China Sea, spans a geographic area between 18°10′ to 20°10′ north latitude and 108°37′ to 111°03′ east longitude (Figure 1). The island covers a land area of approximately 33,856.29 square kilometers, while its adjacent nearshore maritime region extends over 23,675.71 square kilometers [35]. The climatic pattern on Hainan is a tropical monsoon type, characterized by favorable photothermal conditions that promote a rich natural resource base and a substantial ecological footprint. The island’s landscape is dominantly a central montane environment with peripheral low terrains, structured around a dome-shaped mountainous core featuring prominent elevations such as Wuzhi Mountain and Yinggeling. This topographical structure descends outward in a sequence of mountains, hills, plateaus, and plains, creating a concentric, layered geomorphology with a clear terraced structure [36]. Hainan hosts a significant number of protected areas, totaling 49, which includes 10 at the national level and 22 at the provincial level. These reserves encompass an area of 27,023 square kilometers including the marine protected zone, thereby contributing to the island’s high proportion of conserved ecological space.
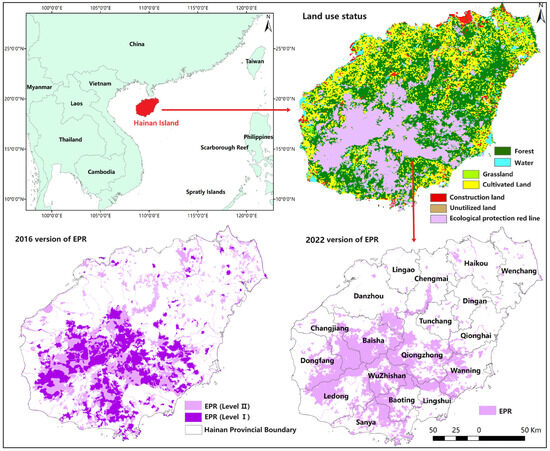
Figure 1.
Study area of Hainan Island with two EPR version boundaries.
The EPR delineated in Hainan Province includes both the terrestrial and marine zones of Hainan Island and its adjacent nearshore areas. This study specifically addresses the evolution of carbon storage within the terrestrial EPR. The initial designation of the terrestrial EPR, as per the 2016 “Regulations for the Management of Ecological Protection Red Lines in Hainan Province”, covered 11,535 square kilometers, constituting 33.5% of the island’s total land area [37]. In 2017, the Chinese government released “Certain Opinions on Designation and Strictly Adhering to the Ecological Conservation Redline”, which initiated a series of regulatory updates [38]. These guidelines elaborated on the ecological protection redline’s definition, scope, and regulatory frameworks, facilitating more structured environmental governance. Following these national directives, Hainan Province updated its original regulations. The updated EPR framework discards the previous classification system, which differentiated zones into level I and level II based on the severity and vulnerability of biodiversity values and ecosystem services [37]. Instead, it adopts a unified strategy termed “one line”, which applies differentiated management controls across various regions, focusing particularly on core conservation areas [38]. This approach aims to balance ecological protection with sustainable land use, reflecting an integrated strategy for environmental and resource management. The 2022 edition of the “Regulations” specifies that the terrestrial EPR in Hainan Province now encompasses 9256.84 square kilometers, representing 27.3% of the island’s total land area [22]. The scheme outlines a structured spatial distribution pattern categorized as “one core, one belt, one circle, and multiple corridors”. The “one core” pertains to the central mountainous region, identified as the ecological core of the island, which is pivotal for biodiversity conservation, water resource conservation, and soil erosion control. This core area includes significant ecological zones such as Limu Mountain, Wuzhi Mountain, Bawangling, Yinggeling, Diaoluoshan, and Jianfengling. The “one belt” refers to the coastal protection belt, designed primarily to enhance coastal ecological stability and serve as a barrier against wind-driven sand displacement. Meanwhile, the “one circle” designates the encompassing island plateau and plains, which are critical for soil conservation and water resource management. This comprehensive spatial framework is detailed in Figure 1, which illustrates the specific locations of these EPR designations across Hainan Island, thereby providing a visual representation of the island’s strategic ecological zoning. For the purposes of this study, the EPR area delineated by the 2016 policy is designated as EPR2016, and the area defined by the revised 2022 policy is referred to as EPR2022. These research areas will be further compared and analyzed.
2.2. Data
This study is based on land use data from Hainan Island covering the period from 2000 to 2020 [35]. To meet the needs of the research, the data was reclassified into seven land categories: cultivated land, forest land, grassland, water bodies, construction land, and unutilized land. Detailed descriptions and the sources of data are presented in Table 1.

Table 1.
Data sources.
2.3. Data Preparation
To ensure consistency in data analysis, ArcGIS (version 10.8) was employed to standardize all datasets to the World Geodetic System 1984 (WGS 84) coordinate system and resample spatial resolutions to 100 m × 100 m. Critical variables including LULC, slope, the digital elevation model (DEM), the normalized difference vegetation index (NDVI), annual average temperature, annual average precipitation, population density, and gross domestic product (GDP) were cropped to the study area. A detailed workflow and research framework are depicted below in Figure 2.
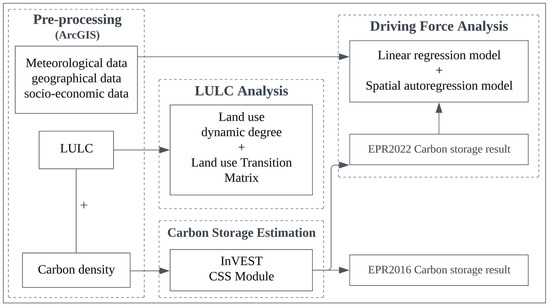
Figure 2.
Research framework and workflow.
2.4. Land Use Dynamic Degrees and Transition Matrices
2.4.1. Land Use Dynamic Degrees
The dynamic degree of land use, , quantifies temporal changes in a specific land use category within a defined region, reflecting the rate of land use change over a specified time interval [39]. In this study, the dynamic degrees are estimated based on three sets of changes: 2000 to 2010, 2010 to 2015, and 2015 to 2020. The equation used to calculate the dynamic degree of land use within Hainan Island’s EPR is defined as follows:
Here, and represent the areas of a particular land use/cover type at the start and end of the study period, respectively, while is the duration of time.
2.4.2. LULC Transition Matrix
The LULC transition matrix is a mathematical method derived from the quantitative description of system states and state transitions in systems analysis. It not only reflects the static land type structure during a specific period but also captures the characteristics of mutual conversions among various LULC types and the dynamic transfer volumes between different land types within the study area. In this study, the spatial analyst tool in ArcGIS was used to process LULC data from 2000 to 2020 within the Hainan EPR to derive a land use transition matrix. The matrix is represented by the following equation:
where p is the land area, n represents the number of different land use types, i indicates the land use type at the start of the study period, and indicates the land use type at the end of the study period.
2.5. Calculation of Carbon Storage Using InVEST Model
In this study, the InVEST model’s carbon storage and sequestration (CSS) module (version 3.12.1) was used to estimate the total carbon storage on Hainan Island, utilizing LULC raster data and data on carbon pools. The module ideally calculates the present carbon levels in a landscape and assesses the value of carbon sequestration over time [40]. The CSS module categorizes carbon storage into four main pools: aboveground biomass carbon (Cabove), which includes all living plant material above the soil; belowground biomass carbon (Cbelow), which encompasses carbon in the living root systems of plants; soil carbon (Csoil), representing organic carbon within the soil; and dead organic matter carbon (CV), which comprises carbon in plant litter, and both fallen and standing deadwood [23]. The methodology for calculating total regional carbon storage is shown as Equation (3), while Equation (2) details the calculation for carbon storage by individual land classes, integrating parameters such as the area of each land class Ai and the respective carbon pools (Cabove, Cbelow, Csoil, Cdead), leading to the aggregate carbon storage across all land classes (Ctotal).
This study derived a carbon density table for Hainan Island by integrating parameters from research at latitudes similar to that of Hainan with data from the National Ecological Science Data Center’s terrestrial ecosystem carbon density dataset (http://www.cnern.rg.cn, accessed on 13 May 2024), see Table 2. This method ensures the carbon density coefficients are accurately adjusted to reflect the specific ecological conditions of Hainan Island.
Table 2.
Carbon densities of various parts of different land use types (t/hm2).
2.6. Spatial Autoregression Model
Previous statistical methods, such as classical linear regression, often rely on assumptions of uniform data distribution and independence, which may lead to incompleteness when assessing geospatial data with spatial dependencies [41]. Geographical data typically display spatial autocorrelation, where observations in proximate areas are correlated due to spatial interactions like diffusion and migration. To address these complexities, spatial autoregression models incorporate a spatial weights matrix into the regression framework, allowing for the capture of spatial effects between adjacent regions. For this study, six independent variables are considered: natural factors including annual mean temperature, precipitation, and elevation, along with socioeconomic factors of GDP, urbanization rate, and population density. The result of the carbon storage estimate from EPR2022 serves as the dependent variable. Further, linear regression and spatial autoregression models are constructed based on queen continuity within the GeoDa (version 1.22) and ArcGIS environments [42].
3. Results
3.1. Spatial Changes of EPR Land Use of Hainan Island
Overall, the land use within Hainan Island’s EPR across both versions is dominated by forests, followed by grasslands and aquatic environments (Figure 3). Forest areas are concentrated in the central mountain region, encompassing the entire Hainan Tropical Rainforest National Park (HTRNP). Grasslands are peripherally situated around these forests, while major water bodies, Songtao Reservoir, are localized in the Baisha region, the eastern section of the Changhua River, and minor stretches along the Wanquan River in the Qionghai region. Cultivated lands are interspersed within these areas, appearing sparsely in the central region but more extensively near coastal cities like Sanya, Haikou, Wenchang, and Qionghai. The distribution of construction areas closely aligns with cultivated lands, predominantly near coastal zones. Comparatively, cultivated land within EPR2016 was located in the eastern and central regions, with a significant decline observed in EPR2022, especially in the central area. In contrast, changes in the forest area of EPR2016 and EPR2022 were minimal, with enhanced protection efforts in the central and northern boundaries evident in EPR2022. Moreover, grassland areas showed significant recovery in 2020 under EPR2022, indicating effective ecological conservation outcomes compared to EPR2016.
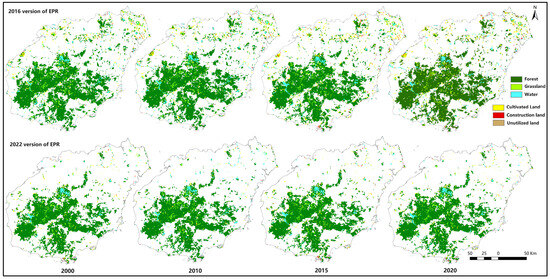
Figure 3.
Spatial distribution of land use of Hainan Island from 2000 to 2020.
The temporal analysis of land use changes, as delineated in the EPR of 2016 and 2022, reveals significant fluctuations across various land types over two decades. Cultivated land exhibited substantial fluctuation in both EPR versions, with an initial decrease followed by substantial expansion and subsequent decline, highlighting dynamic agricultural practices possibly influenced by policy shifts or market demands. Forest land maintained relative stability, suggesting effective conservation measures or inherent ecosystem resilience. Grassland showed minor fluctuations with a trend towards recovery, indicating adaptive land management. Water bodies experienced notable variability with periods of increase and decrease. Construction land and unutilized land both demonstrated significant shifts, particularly in the 2015–2020 period, where construction land surged, suggesting increased urbanization expansion, followed by notable retraction, possibly indicating land management progress. Figure 4 offers a detailed visualization of the transitions among six land use types as observed in the EPRs from 2000 to 2020.
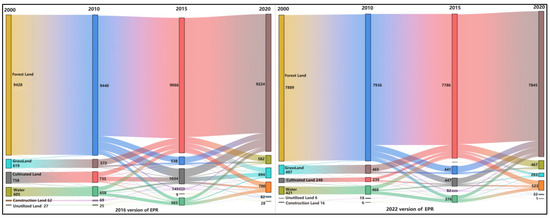
Figure 4.
Land use conversion within EPR2016 and EPR2022 boundaries from 2000 to 2020 (km2).
To more effectively illustrate the outcomes, Figure 5 displays distinct land use dynamics from 2000 to 2020 within the boundaries analyzed in the EPRs. In the EPR2016, cultivated land, forest land, and grassland decreased by 14 km² (−0.18%), 84 km² (−0.09%), and 31 km² (−0.25%), respectively, while water bodies and construction land increased by 123 km² (1.01%) and 26 km² (2.10%). Unutilized land also saw a modest increase of 1 km² (0.19%). Conversely, the 2022 EPR version showed no change in cultivated land (0.00%), smaller reductions in forest and grassland areas of 32 km² (−0.04%) and 31 km² (−0.16%), respectively, a notable increase in water bodies by 100 km² (1.15%), and a slight increase in construction land by 16 km² (2.35%). Unutilized land decreased by 2 km² (−1.11%). The EPR2016 and EPR2022 analyses reveal differential land use changes, with the former showing reductions in natural land types and increases in anthropogenic areas, whereas the latter demonstrated stability in cultivated land, slight reductions in natural areas, and modest expansions in water bodies and construction land.
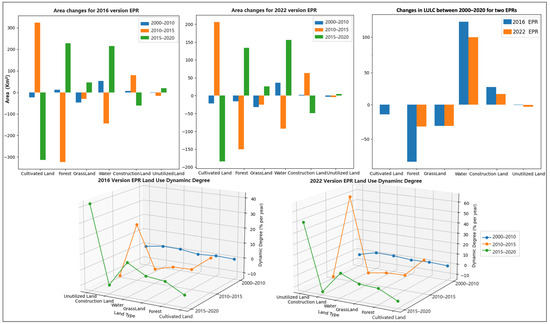
Figure 5.
Comparison of land use changes and dynamic degrees of two EPR versions of Hainan Island from 2000 to 2020.
Combined with the result from Figure 4, cultivated land primarily transitioned to forests and water bodies in EPR2016, while forests remained largely stable with minor conversions to water bodies and cultivated land. Grasslands were notably dynamic, with 44.43% transitioning to forests. Water bodies also shifted significantly post-2010, primarily converting to forests, grasslands, and cultivated lands. Construction land was mainly stable with slight increases, and a small fraction of unutilized land transformed into cultivated land. Conversely, EPR2022 demonstrates more stability in cultivated land with no changes (0%), compared to an overall decrease of 1.08% in EPR2016 (Figure 5). Grasslands and water bodies showed little change, except for minor conversions of water bodies to cultivated land, and a reduction in construction land. Comparison highlights that from 2010 to 2015, transitions between cultivated and forest lands were particularly pronounced within EPR2016, indicating notable activity in land use changes involving cultivated land, forest land, and grassland. Overall, EPR2022 showed enhanced stability in land class structure, reduced inter-class conversions, and notable efforts in controlling urban expansion and enhancing water body areas.
3.2. Comparison of the Spatiotemporal Trends of Carbon Storage inside and outside the EPR
Figure 6 reveals that areas within EPR2016 with higher carbon storage are predominantly located in the central and southwestern mountain regions, such as Wuzhi Mountain, Jianfengling, and Bawangling, characterized by extensive forest coverage and correspondingly high carbon storage. In contrast, areas with lower carbon storage are typically found in coastal cities and development zones like Haikou and Sanya, as well as in the frequently altered land use regions of cultivated and grassland areas in the eastern and northern parts of EPR2016, affecting the stability of carbon storage. Conversely, EPR2022 exhibits a more concentrated carbon storage distribution with fewer low storage areas, as illustrated in the figure. High carbon storage persists in the central and western forests, with increases in the EPR-designated areas of eastern and northern Hainan, including Haikou, Wenchang, Lingshui, and Ledong, demonstrating a noticeable impact of delineation result.
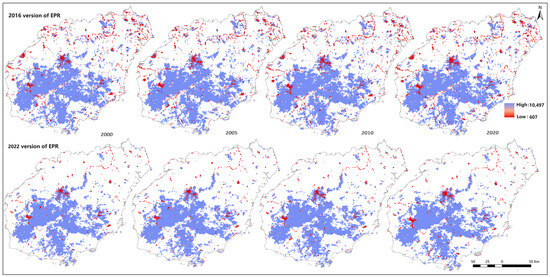
Figure 6.
Spatial distribution of carbon storage within EPR2016 and EPR2022 boundaries from 2000 to 2020.
Table 3 shows the detailed carbon storage of two EPRs over the past two decades. From 2000 to 2020, Hainan Island’s overall carbon storage exhibited a declining trend, with recorded levels decreasing from 1.660 × 10¹⁰ t in 2000 to 1.641 × 10¹⁰ t in 2020. This decrease was mirrored within both the EPR2016 and EPR2022 boundaries. For EPR2016, carbon storage decreased from 61,763,178 t in 2000 to 60,525,588 t in 2020, with gradual reductions of 577,812 t from 2000 to 2010, 447,460 t from 2010 to 2015, and 212,318 t from 2015 to 2020, indicating a slowing rate of decline over the years. Comparatively, EPR2022 showed a decrease from 50,560,219 t in 2000 to 49,533,251 t in 2020, with reductions of 511,317 t from 2000 to 2010, 323,847 t from 2010 to 2015, and 191,804 t from 2015 to 2020, reflecting an even slower rate of decline. This data suggests more effective carbon management within the EPR2022 boundaries over time.
Table 3.
Carbon storage change within EPRs from 2000 to 2020 (t).
Due to the decreased coverage from EPR2016 to EPR2022, directly comparing total carbon storage values may yield less reliable results. Consequently, this study further analyzed the carbon storage per unit area within each version to evaluate the trends. In EPR2016, carbon storage per square kilometer consistently declined from 5352.75 t/km² in 2000 to 5246.38 t/km² by 2020. In comparison, EPR2022 also experienced a decrease in carbon storage per square kilometer, from 5461.70 t/km² in 2000 to 5351.60 t/km² in 2020 but maintained a higher rate per unit area than EPR2016, indicating a relatively better carbon storage performance over the period.
Figure 7 depicts the temporal dynamics of carbon stock on Hainan Island from 2000 to 2020, highlighting both carbon storage per unit area within EPR2016 and EPR2022, and the total storage changes across the island. Both graphs demonstrate a steady decline in carbon storage, with a slightly sharper decrease observed from 2010 to 2020 in EPR2016. The right graph indicates a steady reduction in total carbon storage on the island, from nearly 1.66 × 10¹⁰ tons in 2000 to approximately 1.642 × 10¹⁰ tons in 2020, pointing to a persistent decline in the overall carbon storage potential over the two decades. Collectively, these trends reveal significant challenges in maintaining or enhancing carbon storage, both within designated ecological protection areas and island-wide, underscoring the impacts of environmental or anthropogenic changes.
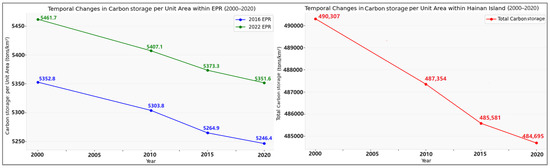
Figure 7.
Changes in carbon storage per unit area within the two versions of Hainan Island’s EPR from 2000 to 2020 (left) and changes in the total carbon storage across the entire island (right).
3.3. Comparison of the Spatiotemporal Trends of Carbon Storage inside the EPR
In Hainan Island’s EPR, carbon storage ranks from the highest to the lowest as follows: forest land, grassland, cultivated land, water bodies, construction land, and unutilized land. According to Figure 8, the most notable increases in carbon storage occurred during transitions from cultivated to forest land, grassland to forest land, and water bodies to grassland. Specifically, in EPR2016, transitioning from cultivated land to forest land resulted in an increase of 545,650 tons of carbon storage, while EPR2022 saw an increase of 242,606 tons for the same transition. Grassland to forest land transitions added 1,711,395 tons in EPR2016 and 2,679,600 tons in EPR2022. Conversely, the largest reductions in carbon storage were observed during transitions from forest to grassland, forest to cultivated land, and cultivated land to construction land. For instance, forest-to-grassland transitions resulted in a decrease of 986,700 tons in EPR2016 and 1,968,168 tons in EPR2022, indicating a more extensive conversion within the EPR2022 boundary. The transition from cultivated land to construction land reduced carbon storage by 139,244 tons in EPR2016 and 79,142 tons in EPR2022. Additionally, the transition from forest to cultivated land decreased carbon storage by 571,848 tons in EPR2016 and 228,618 tons in EPR2022.
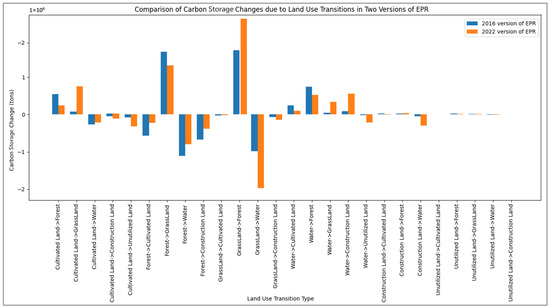
Figure 8.
Effects of land use conversions on carbon storage changes EPR2016 and EPR2022 boundaries from 2000 to 2020.
3.4. Driving Forces Analysis of Carbon Storage Evolution in Hainan Island’s EPR
To analyze the drivers influencing carbon storage within EPR2022 and their impact levels, this study utilized both classical linear regression and spatial autoregression models. Six variables were selected as independent factors: annual mean temperature, precipitation, elevation, and vegetation coverage representing natural factors, alongside GDP and population density as socioeconomic factors. The latest carbon storage data from EPR2022 served as the dependent variable.
Table 4 provides a comprehensive analysis of spatial correlation in the residuals of a regression model, revealing significant spatial autocorrelation. The Moran’s I statistic of 0.5486 with a p-value close to zero confirms strong positive spatial autocorrelation, indicating non-random similarity among neighboring observations. The Lagrange multiplier tests, particularly the spatial error tests with values of 147.2546 and 147.4847 and p-values of zero, strongly suggest the necessity of integrating a spatial error term. These results, corroborated by the robust forms of the tests, emphasize that spatial dependencies in the data are primarily due to error rather than lagged spatial influence, validating the selection of a spatial error model for further analysis. The results from subsequent calculations using the model are presented in Table 5, validating the model’s appropriateness in addressing spatial dependencies in the data.
Table 4.
Spatial correlation analysis.
Table 5.
Results from the spatial error model calculation.
Regression analysis from Table 5 reveals significant relationships between regional carbon storage and several environmental and socioeconomic factors. Elevation presents a relatively notable positive correlation with a high coefficient value, where each percentage point increase boosts carbon storage by 118.97 percentage points. Similarly, precipitation and vegetation cover positively impact carbon storage, enhancing it by 2.6074 and 1.8646 percentage points per percentage point increase, respectively. These findings highlight the critical influences of both natural environmental conditions and human activities on carbon storage, emphasizing the role of ecological protection and environmental management in sustaining carbon equilibrium.
4. Discussion
4.1. EPRs’ Impact on Land Use Conversion
This study presents a comparative analysis of land use dynamics, carbon storage evolution, and driving mechanisms within two versions of the EPR on Hainan Island, spanning from 2000 to 2020. It assesses the influence of differing EPR policies on regional carbon storage and explores the underlying drivers of these changes. The analysis identifies significant variations in the implementation and effectiveness of the 2016 and 2022 EPR versions. The 2016 EPR emphasized the protection of cultivated land and grasslands, with an observed increase in cultivated land area until 2015, followed by a notable decline while grassland areas consistently decreased. Conversely, the 2022 EPR maintained a smaller yet stable area of cultivated land throughout the two decades and demonstrated superior performance in controlling construction land expansion and enhancing hydrological resource management. This observation was evident as the area designated for construction initially expanded but subsequently experienced a significant reduction. This trend suggests an effective resolution of spatial conflicts within the EPR areas, particularly between permanent basic farmland and general cultivated land. This improvement is likely due to a refined EPR delineation scheme in which unstable land patches—such as permanent basic farmland, artificial forests, and economic plantations present in EPR2016—have been excluded from EPR2022. This update has incorporated more restored mangrove forests and other riparian vegetation with high ecological value [22]. The implementation of more robust measures to restrict urban expansion and enhance the protection of natural resources underscores the improved efficacy of spatial planning and resource management strategies in these regions.
4.2. EPRs’ Impact on Carbon Storage and Driving Factors
Spatial-temporal analysis of these changes underlines the profound impact of EPR policies on ecosystem carbon storage, demonstrating how strategic land management can enhance carbon storage. This observation is consistent with findings from prior research, such as the study by Li, Huang, and Yang [36], which found that natural landscapes with significant ecological value tend to have higher carbon storage potential. Conversely, the expansion of artificial forests has been shown to adversely affect carbon storage [43]. Additionally, we noted spatial variations in carbon storage across different municipal regions. In Haikou, there was an increase in carbon storage within the EPR2022 boundaries, largely attributed to enhancements in coastal protective forests and urban greening initiatives [44,45]. Conversely, carbon storage remained relatively stable with a slight decline in Sanya [46], with nearby areas like Lingshui and Ledong experiencing increases likely linked to local ecological restoration and conservation measures [47]. Eastern cities such as Wenchang and Qionghai also exhibited rising trends in carbon storage, reflecting strengthened ecological protection efforts. These observations highlight the effectiveness of targeted environmental policies in improving carbon storage and ecological integrity across varied landscapes.
The analysis of factors driving the evolution of carbon storage reveals that elevation and GDP are comparatively significant correlates of regional carbon storage. Specifically, on Hainan Island, carbon storage demonstrated a relatively strong correlation with elevation. This correlation is explained by the inclusion of the entire HTRNP within the EPR, where the core tropical rainforest area hosts diverse vegetation and stable ecosystems conducive to higher carbon storage potential [48,49]. Higher elevations within the EPR are associated with increased vegetation cover and biodiversity value, potentially supporting regional carbon storage [50]. This characteristic is also proposed in recent research indicating that Hainan’s higher elevated areas promote more robust forest growth and concentration, hence suggesting enhanced carbon storage capabilities [51]. On the other hand, GDP and population density could also be negatively correlated with carbon storage, signifying that human activities and economic development drive frequent land conversions, which diminish the region’s carbon storage potential [48].
4.3. Future Research
There are several opportunities for future enhancements in this research methodology. The current method estimates carbon storage based on land use categories, which could be expanded to more robustly incorporate the dynamics of carbon fluxes. The InVEST model, utilized in this study, presupposes linear changes in carbon storage over specified periods, which may not adequately reflect the potentially non-linear nature of carbon sequestration effects [40]. Therefore, storage analyses should consider a range of scenarios to enable more accurate and predictive estimations. Moreover, this study does not account for the variability in carbon density, a critical factor that should be integrated into future research to better understand the influence of natural ecosystem variables and anthropogenic factors on carbon dynamics. Meanwhile, comparing the impact of carbon storage between natural forests and restoring artificial forests in EPR should be researched as well. Future research should also employ data from dynamic carbon density monitoring to more accurately depict changes in carbon storage. Such data would improve the accuracy of carbon storage assessment and enhance the understanding of the mechanisms underlying carbon storage associated with various land use transitions, particularly in the context of climate change. This would involve examining how different ecosystem types both contribute to and are affected by carbon storage dynamics. Enhancing the long-term monitoring and assessment of the effectiveness of EPR policy implementation is crucial. Doing so will improve the scientific validity and efficacy of ecological protection measures, ensuring that they are both adaptive and responsive to evolving environmental conditions.
5. Conclusions
This study employs a comprehensive approach, integrating land use, socioeconomic factors, and natural ecological relationships, to systematically analyze changes in land use and the evolution of carbon storage within two delineations of EPR on Hainan Island, utilizing spatial autoregression models. Key findings highlight several insights.
- (1)
- The 2022 EPR facilitated more accurate ecological protection and better performance in managing the relationships between ecological protection zones, permanent basic farmland, and urban development boundaries. In geographical terms, the 2016 EPR’s cultivated land was predominantly located in the eastern and central regions. The 2022 version showed a substantial reduction in cultivated land especially in the central areas, though it maintained overall stability from 2000 to 2020. Both versions exhibited similar trends in forest land changes, with the 2022 EPR enhancing forest conservation efforts, particularly in the central and northern peripheral zones. While the 2016 EPR focused on conserving cultivated land and grasslands, the 2022 EPR excelled in construction land control and water resource management, indicating a strategic shift towards integrated ecological and resource protection.
- (2)
- The 2022 version of the EPR has also significantly enhanced the connectivity and integrity of key ecological habitats within its designated boundaries. Although overall carbon storage within the EPR exhibited a declining trend due to the decreased coverage, the carbon storage per unit area in the 2022 version was relatively higher, indicative of a more cohesive, structurally sound, and functionally comprehensive zoning management. Furthermore, carbon storage distribution within the 2022 EPR became more concentrated, particularly with restoration observed in the agricultural and forested areas within the eastern and northern coastal cities of Hainan Island. The increase in carbon storage was primarily driven by land use transitions, notably the conversion of cultivated land to forest land, grassland to forest land, and water bodies to grassland. Additionally, there were notable decreases in carbon storage across Hainan Island, more pronounced within the boundaries of the EPR2016.
- (3)
- Elevation displayed a relatively positive correlation with carbon storage of both versions’ EPR, primarily due to the ecological characteristics of high-altitude regions of the central mountainous area where HTRNP is located with robust natural forests. These areas feature richer vegetation and more stable natural ecosystems, significantly contributing to enhanced carbon storage.
These findings highlight the effects of ecological protection strategies under different EPR delineations on regional carbon storage, offering a robust foundation for future research and improvements in terrestrial land management practices. Additionally, they furnish new insights and frameworks for ecological management and policymaking on Hainan Island, potentially enhancing the verification and refinement of EPR delineations to ensure their scientific accuracy and relevance in conservation efforts.
Author Contributions
Conceptualization, P.J. and Y.Z.; methodology, Y.Z.; data curation, P.J. and Y.Z.; validation, Z.Z.; formal analysis, Y.Z. and Z.Z.; resources, P.J.; writing-original draft preparation, Z.Z. and Y.Z.; writing—review and editing, P.J. and Z.Z.; funding acquisition, P.J. All authors have read and agreed to the published version of the manuscript.
Funding
This research was funded by the National Natural Science Foundation of China (NSFC), grant number No. 42371272.
Data Availability Statement
The original contributions presented in the study are included in the article, further inquiries can be directed to the corresponding author.
Conflicts of Interest
The authors declare that there is no conflict of interest regarding the publication of this article.
References
- Friedlingstein, P.; Jones, M.W.; O’Sullivan, M.; Andrew, R.M.; Bakker, D.C.; Hauck, J.; Le Quéré, C.; Peters, G.P.; Peters, W.; Pongratz, J. Global carbon budget 2021. Earth Syst. Sci. Data 2022, 14, 1917–2005. [Google Scholar] [CrossRef]
- Friedlingstein, P.; O’sullivan, M.; Jones, M.W.; Andrew, R.M.; Gregor, L.; Hauck, J.; Le Quéré, C.; Luijkx, I.T.; Olsen, A.; Peters, G.P. Global carbon budget 2022. Earth Syst. Sci. Data 2022, 14, 4811–4900. [Google Scholar] [CrossRef]
- Yu, C.; Zhang, Z.; Jeppesen, E.; Gao, Y.; Liu, Y.; Liu, Y.; Lu, Q.; Wang, C.; Sun, X. Assessment of the effectiveness of China’s protected areas in enhancing ecosystem services. Ecosyst. Serv. 2024, 65, 101588. [Google Scholar] [CrossRef]
- Black, B.; Anthony, B.P. Counterfactual assessment of protected area avoided deforestation in Cambodia: Trends in effectiveness, spillover effects and the influence of establishment date. Glob. Ecol. Conserv. 2022, 38, e02228. [Google Scholar] [CrossRef]
- Bai, Y.; Wong, C.P.; Jiang, B.; Hughes, A.C.; Wang, M.; Wang, Q. Developing China’s Ecological Redline Policy using ecosystem services assessments for land use planning. Nat. Commun. 2018, 9, 3034. [Google Scholar] [CrossRef] [PubMed]
- Li, S.; Liu, Y.; Yang, H.; Yu, X.; Zhang, Y.; Wang, C. Integrating ecosystem services modeling into effectiveness assessment of national protected areas in a typical arid region in China. J. Environ. Manag. 2021, 297, 113408. [Google Scholar] [CrossRef]
- Chen, H.; Zhang, T.; Costanza, R.; Kubiszewski, I. Review of the approaches for assessing protected areas’ effectiveness. Environ. Impact Assess. Rev. 2023, 98, 106929. [Google Scholar] [CrossRef]
- IUCN. Effective Protected Areas. Available online: https://www.iucn.org/our-work/topic/effective-protected-areas (accessed on 3 October 2023).
- Wu, R.; Ma, G.; Long, Y.; Yu, J.; Li, S.; Jiang, H. The performance of nature reserves in capturing the biological diversity on Hainan Island, China. Environ. Sci. Pollut. Res. 2011, 18, 800–810. [Google Scholar] [CrossRef]
- Zou, C.; XU MJ, L. Analysis on the connotation of ecological protection redline and suggestions on ecological protection redline drawing. Environ. Prot. 2015, 43, 54–57. [Google Scholar]
- Liang, X.; Jin, X.; Zhu, F.; He, J.; Zhang, X.; Zhang, M.; Fan, Y.; Hu, J.; Zhou, Y. Reflection on delimiting ecological protection red line (EPRL) in Middle-Lower Yangtze Plain: A case study of Jiangsu province. Acta Ecol. Sin. 2020, 40, 5968–5979. [Google Scholar]
- Xu, D.-L.; Zou, C.-X.; Lin, N.-F.; Wang, Y.; Xu, M.-J.; Wu, D.; Cao, B.-S. Building an Evaluation Indicator System for Assessing the Protection Effectiveness of Ecological Conservation Redline. J. Ecol. Rural Environ. 2020, 36, 1562–1568. [Google Scholar]
- Chen, H. The ecosystem service value of maintaining and expanding terrestrial protected areas in China. Sci. Total Environ. 2021, 781, 146768. [Google Scholar] [CrossRef] [PubMed]
- Zou, C.; Wang, L.; Liu, J. Classification and management of ecological protection redlines in China. Biodivers. Sci. 2015, 23, 716. [Google Scholar] [CrossRef]
- Kong, L.; Wang, Y.; Zheng, H.; Xiao, Y.; Xu, W.; Zhang, L.; Xiao, Y.; Ouyang, Z. A method for evaluating ecological space and ecological conservation redlines in river basins: A case of the Yangtze River Basin. Acta Ecol. Sin. 2019, 39, 835–843. [Google Scholar]
- Liu, J.; Ma, S.; Gao, J.; Zou, C.; Wang, J.; Liu, Z.; Wang, L. Delimiting the ecological conservation redline at regional scale: A case study of Beijing-Tianjin-Hebei region. China Environ. Sci. 2018, 38, 652–2657. [Google Scholar]
- He, H.; Wen, J.; Zhang, J.; Zeng, X.; Li, F. Ecological functions assessment of mangrove wetland in Hainan Province. Ecol. Econo. 2015, 31, 145–149. [Google Scholar]
- Ding, D.; Li, M.; Liao, B.; Dan, X. Evaluation of economic value of coastal natural wetland ecosystem services of Hainan province. Ecol. Environ. Sci. 2015, 24, 1472–1477. [Google Scholar]
- Li, T.; Hong, X.; Liu, S.; Wu, X.; Fu, S.; Liang, Y.; Li, J.; Li, R.; Zhang, C.; Song, X. Cropland degradation and nutrient overload on Hainan Island: A review and synthesis. Environ. Pollut. 2022, 313, 120100. [Google Scholar] [CrossRef]
- Wang, H.; Zeng, Y. Policy Optimization for Hainan Tropical Rainforest National Park Based on Quantitative Comparison of Regional Policies of Free Trade Port Areas. Front. Environ. Sci. 2022, 10, 891432. [Google Scholar] [CrossRef]
- Liu, Z.; Li, H.; Wu, F.; Wang, H.; Chen, H.; Zhu, Q.; Yang, G.; Liu, W.; Chen, D.; Li, Y.; et al. Quantification of Ecosystem-Scale Methane Sinks Observed in a Tropical Rainforest in Hainan, China. Land 2022, 11, 154. [Google Scholar] [CrossRef]
- Department of Natural Resources and Planning of Hainan Province. Regulations for the Management of Ecological Protection Red Lines in Hainan Province (2022 Amendment). Available online: https://lr.hainan.gov.cn/xxgk_317/0200/0202/202403/t20240313_3617540.html (accessed on 14 June 2024).
- Zhao, M.; He, Z.; Du, J.; Chen, L.; Lin, P.; Fang, S. Assessing the effects of ecological engineering on carbon storage by linking the CA-Markov and InVEST models. Ecol. Indic. 2019, 98, 29–38. [Google Scholar] [CrossRef]
- Houghton, R.A. Revised estimates of the annual net flux of carbon to the atmosphere from changes in land use and land management 1850–2000. Tellus. Ser. B Chem. Phys. Meteorol. 2003, 55, 378–390. [Google Scholar] [CrossRef]
- Zhou, J.; Zhao, Y.; Huang, P.; Zhao, X.; Feng, W.; Li, Q.; Xue, D.; Dou, J.; Shi, W.; Wei, W.; et al. Impacts of ecological restoration projects on the ecosystem carbon storage of inland river basin in arid area, China. Ecol. Indic. 2020, 118, 106803. [Google Scholar] [CrossRef]
- Yang, Y.; Li, H.; Qian, C. Analysis of the implementation effects of ecological restoration projects based on carbon storage and eco-environmental quality: A case study of the Yellow River Delta, China. J. Environ. Manag. 2023, 340, 117929. [Google Scholar] [CrossRef] [PubMed]
- Yang, M.; Xie, Y. Spatial pattern change and ecosystem service value dynamics of ecological and non-ecological redline areas in Nanjing, China. Int. J. Environ. Res. Public Health 2021, 18, 4224. [Google Scholar] [CrossRef]
- Guo, X.; Zhang, Y.; Guo, D.; Lu, W.; Xu, H. How does ecological protection redline policy affect regional land use and ecosystem services? Environ. Impact Assess. Rev. 2023, 100, 107062. [Google Scholar] [CrossRef]
- Liu, H.; Zhang, G.; Li, T.; Ren, S.; Chen, B.; Feng, K.; Li, W.; Zhao, X.; Qin, P.; Zhao, J. Importance of ecosystem services and ecological security patterns on Hainan Island, China. Front. Environ. Sci. 2024, 12, 1323673. [Google Scholar] [CrossRef]
- Zhang, X.; Jin, X.; Liang, X.; Shi, X.; Sun, R.; Zhu, W.; Lin, J.; Han, B.; Zhou, Y. Assessment and management for future habitat risks under the implementation of China’s territorial spatial planning: A case study from Hainan Island. Environ. Impact Assess. Rev. 2024, 106, 107474. [Google Scholar] [CrossRef]
- Yuan, L.; Geng, M.; Li, F.; Xie, Y.; Tian, T.; Chen, Q. Spatiotemporal characteristics and drivers of ecosystem service interactions in the Dongting Lake Basin. Sci. Total Environ. 2024, 926, 172012. [Google Scholar] [CrossRef]
- Jiang, B.; Wang, X.; Yang, M.; Cai, J. Application of ecosystem services research on a protection effectiveness evaluation of the ecological redline policy. Acta Ecol. Sin 2019, 39, 3365–3371. [Google Scholar]
- Feng, C.; Cao, M.; Wang, W.; Wang, H.; Liu, F.; Zhang, L.; Du, J.; Zhou, Y.; Huang, W.; Li, J. Which management measures lead to better performance of China’s protected areas in reducing forest loss? Sci. Total Environ. 2021, 764, 142895. [Google Scholar] [CrossRef] [PubMed]
- Anthony, B.P.; Shestackova, E. Do global indicators of protected area management effectiveness make sense? A case study from Siberia. Environ. Manag. 2015, 56, 176–192. [Google Scholar] [CrossRef] [PubMed]
- Resource Environment Data Center of the Chinese Academy of Sciences. Globeland30. Available online: https://www.resdc.cn/ (accessed on 3 May 2023).
- Li, L.; Huang, X.; Yang, H. Optimizing land use patterns to improve the contribution of land use planning to carbon neutrality target. Land Use Policy 2023, 135, 106959. [Google Scholar] [CrossRef]
- Department of Ecology and Environment of Hainan Province. Regulations for the Management of Ecological Protection Red Lines in Hainan Province. Available online: https://hnsthb.hainan.gov.cn/xxgk/0200/0202/hjywgl/stbh/201901/t20190106_2126022.html (accessed on 14 June 2024).
- Gao, J.; Zou, C.; Zhang, K.; Xu, M.; Wang, Y. The establishment of Chinese ecological conservation redline and insights into improving international protected areas. J. Environ. Manag. 2020, 264, 110505. [Google Scholar] [CrossRef] [PubMed]
- Guo, P.; Zhang, F.; Wang, H. The response of ecosystem service value to land use change in the middle and lower Yellow River: A case study of the Henan section. Ecol. Indic. 2022, 140, 109019. [Google Scholar] [CrossRef]
- The Natural Capital Project. Carbon Storage and Sequestration. Available online: http://releases.naturalcapitalproject.org/invest-userguide/latest/en/carbonstorage.html (accessed on 29 July 2024).
- Wang, H.; Zhu, Y.; Huang, W.; Yin, J.; Niu, J. Spatio-temporal evolution and driving mechanisms of rural residentials from the perspective of the human-land relationship: A case study from luoyang, China. Land 2022, 11, 1216. [Google Scholar] [CrossRef]
- Anselin, L.; Rey, S.J. Modern Spatial Econometrics in Practice, a Guide to Geoda, Geodaspace and Pysal; GeoDa Press: Chicago, IL, USA, 2014; Volume 29. [Google Scholar]
- Li, Y.; Yao, S.; Jiang, H.; Wang, H.; Ran, Q.; Gao, X.; Ding, X.; Ge, D. Spatial-temporal evolution and prediction of carbon storage: An integrated framework based on the MOP–PLUS–InVEST model and an applied case study in Hangzhou, East China. Land 2022, 11, 2213. [Google Scholar] [CrossRef]
- Meng, Y.; Gou, R.; Bai, J.; Moreno-Mateos, D.; Davis, C.C.; Wan, L.; Song, S.; Zhang, H.; Zhu, X.; Lin, G. Spatial patterns and driving factors of carbon stocks in mangrove forests on Hainan Island, China. Glob. Ecol. Biogeogr. 2022, 31, 1692–1706. [Google Scholar] [CrossRef]
- Lei, J.; Wu, T.; Chen, X.; Chen, Y.; Li, Y.; Chen, Z. Landscape Pattern Changes and Driving Factors Analysis of Wetland in Hainan Island during 1990-2018. Ecol. Environ. 2020, 29, 59–70. [Google Scholar]
- Wang, P.; Wang, J.; Zhang, J.; Ma, X.; Zhou, L.; Sun, Y. Spatial-temporal changes in ecosystem services and social-ecological drivers in a typical coastal tourism city: A case study of Sanya, China. Ecol. Indic. 2022, 145, 109607. [Google Scholar] [CrossRef]
- Li, R.; Zheng, H.; Polasky, S.; Hawthorne, P.L.; O’Connor, P.; Wang, L.; Li, R.; Xiao, Y.; Wu, T.; Ouyang, Z. Ecosystem restoration on Hainan Island: Can we optimize for enhancing regulating services and poverty alleviation? Environ. Res. Lett. 2020, 15, 084039. [Google Scholar] [CrossRef]
- Wu, W.; Huang, Z.; Sun, Z.; Zhang, J.; Wang, S.; Fang, M.; Yang, H.; Lu, H.; Guo, G.; Liu, W. Simulation and attribution analysis of terrestrial ecosystem carbon storage of Hainan Island from 2015 to 2050. Sci. Total Environ. 2024, 917, 170348. [Google Scholar] [CrossRef] [PubMed]
- Liu, Q.; Yang, D.; Cao, L.; Anderson, B. Assessment and prediction of carbon storage based on land use/land cover dynamics in the tropics: A case study of hainan island, China. Land 2022, 11, 244. [Google Scholar] [CrossRef]
- Zhang, Y.; Han, N.; Hu, K.; Yu, M.; Li, X. The impact of land-use changes on the spatio-temporal variation of carbon storage in the central mountainous area of Hainan Island. J. Nanjing For. Univ. 2023, 47, 115. [Google Scholar]
- Lin, M.; Song, Y.; Lu, D.; Qiu, Z. Geospatial environmental influence on forest carbon sequestration potential of Tropical forest growth in Hainan Island, China. Front. Environ. Sci. 2022, 10, 807105. [Google Scholar] [CrossRef]


Disclaimer/Publisher’s Note: The statements, opinions and data contained in all publications are solely those of the individual author(s) and contributor(s) and not of MDPI and/or the editor(s). MDPI and/or the editor(s) disclaim responsibility for any injury to people or property resulting from any ideas, methods, instructions or products referred to in the content. |
© 2024 by the authors. Licensee MDPI, Basel, Switzerland. This article is an open access article distributed under the terms and conditions of the Creative Commons Attribution (CC BY) license (https://creativecommons.org/licenses/by/4.0/).