Article

Dynamic Analysis of Urban Land Use Efficiency in the Western Taiwan Strait Economic Zone

1
Miami College, Henan University, Kaifeng 475004, China
2
Key Laboratory of Remote Sensing of Gansu Province, Heihe Remote Sensing Experimental Research Station, Northwest Institute of Eco-Environment and Resources, Chinese Academy of Sciences, Lanzhou 730000, China
*
Author to whom correspondence should be addressed.
Land 2024, 13(8), 1298; https://doi.org/10.3390/land13081298
Submission received: 31 July 2024 / Revised: 13 August 2024 / Accepted: 14 August 2024 / Published: 16 August 2024

Abstract

:
The Western Taiwan Strait (WTS) Economic Zone connects the Yangtze River Delta and the Pearl River Delta, playing a significant role in China’s coastal economy and forming part of the East Asian economic structure. This study used panel data from 20 cities in the WTS Economic Zone, spanning 2011 to 2020, to investigate urban land use efficiency and its dynamic evolution characteristics. The study used a super-efficiency EBM model, which accounts for undesirable outputs, combined with kernel density estimation and Malmquist–Luenberger (ML) index analysis, to thoroughly examine the changes in total factor productivity (TFP) of urban land use and the factors driving these changes within the WTS Economic Zone. The findings are as follows: (1) From 2011 to 2020, the overall trend of urban land use efficiency in the WTS Economic Zone was upward, with coastal areas generally exhibiting higher urban land use efficiency compared to inland areas. (2) The urban land use efficiency of cities in the WTS Economic Zone displayed four types of changes: rising, stable, “U”-shaped, and inverted “U”-shaped. (3) The TEP index of the WTS Economic Zone exhibited a right-leaning “M” trend. Technological change was the primary driver of enhanced urban land use efficiency, although there is still room for improvement in technical efficiency. Based on these findings, this study proposes policy insights to foster high-quality development of urban land use efficiency in the WTS Economic Zone.

1. Introduction

China, as a leading example among developing countries, has rapidly accelerated its urbanization process. Urban construction land, acting as a crucial spatial carrier for economic development, has significantly boosted socio-economic growth, including an increase in the labor force [1]. However, excessive land expansion can lead to various social and environmental issues, such as longer commutes and pollution, thus diminishing the overall quality of urban development [2]. Consequently, assessing urban land use efficiency and promoting sustainable urban development have become critical areas of interest for many scholars [3,4]. Urban land use efficiency involves optimizing urban space to maximize economic output, social welfare, and environmental sustainability while minimizing waste and adverse effects. Increasing attention is being paid to ensuring that urban land use is both rational and efficient, particularly in balancing ecological and economic considerations [5].
Enhancing urban land use efficiency fundamentally depends on adopting effective evaluation methods [6]. Currently, urban land use efficiency evaluation research has evolved from static measures to dynamic measures that account for temporal variations and external factors. Initially, urban land use efficiency focused on economic output, represented by the economic added value per unit of construction land [7]. During this period, land development aimed to maximize economic benefits. As environmental concerns have gained prominence, research on urban land use efficiency has gradually shifted from purely economic outputs to also considering negative outputs like wastewater, exhaust gas, and smoke. Urban land use efficiency is now measured considering the constraints imposed by undesirable outputs [5,8]. This shift in focus has provided a more complex understanding of the relationships between land use, economic development, and the environment. Over time, integrating space and time has continued to expand the domain further. For instance, He et al. [9] highlighted the importance of urban form, regional heterogeneity, and spatial effects in the urban land use efficiency process. This spatial viewpoint has led to specific approaches for increasing urban land use efficiency in different urban settings. However, overall research balancing socio-economic benefits and environmental impacts in urban land use efficiency evaluations remains limited.
In terms of methodological development, there has been a shift from parametric to non-parametric approaches. Parametric methods, such as the evaluation indicator system, involve developing a comprehensive set of metrics to assess different aspects of urban land use efficiency, thus providing a structured evaluation framework. Liu, Li and Yang [8] created an evaluation indicator system that encompasses economic, social, and environmental dimensions of land use. In contrast, non-parametric methods, such as Data Envelopment Analysis (DEA), provide flexibility and precision in measuring efficiency, accommodating the complexities of urban land use. The original DEA technique, advanced by Charnes, Cooper, and Rhodes, is a non-parametric method for measuring the efficiency of DMUs using several inputs and outputs [10,11]. This method has been used in all sectors because of its flexibility and capacity to calculate production efficiency without a specific production function in advance [12,13]. In subsequent years, various other DEA models have been formulated to make the assessments more accurate, such as the super efficiency slacks-based measure model [14,15], super-efficiency DEA [16], and epsilon-based measure (EBM) model with undesirable outputs [17]. For example, Zhou et al. [18] used the super-efficiency SBM to measure the efficiency of urban land use in the Yangtze River Delta, including environmental factors for better analysis. Li, Zhao, Chang, Yu, Song and Zhang [17] used the super-efficiency EBM model to analyze the eco-efficiency of cultivated land use around Beijing–Tianjin and demonstrated that this model is sensitive to spatial-temporal changes. However, many current studies rely on static models to assess urban land use efficiency, with limited consideration of dynamic and temporal variations in land use patterns.
Effective and sustainable utilization of urban land is integral to economic development, ecological conservation, and urban planning. However, regional heterogeneity presents significant challenges in evaluating urban land use efficiency. For instance, as China’s urbanization progresses rapidly, notable regional disparities in urbanization rates have emerged. Specifically, urbanization rates are highest in the eastern and coastal regions, while the central and western regions have comparatively lower rates. He, Yu, Li and Zhang [9] examined how urban form affects urban land use efficiency in 336 Chinese cities. Their study highlighted the significance of spatial effects and regional heterogeneity, suggesting that urban planning should consider cities’ spatial characteristics to enhance urban land use efficiency. Nevertheless, existing studies often neglect how regional economic integration influences urban land use efficiency [19], and rarely address the spatial spillover effects in metropolitan areas [20]. Additionally, land disparities and allocative efficiency in coastal regions are under-researched [5]. Unlike inland cities, coastal regions’ ecological implications of infrastructural development underscore the need for balanced economic and ecological policies [21]. Few studies have focused on examining urban land use efficiency in depth in coastal urban agglomerations and have primarily emphasized provincial and municipal levels. Chen et al. [22] explored the economic efficiency of urban construction land in the Yangtze River Delta, one of China’s most economically dynamic coastal regions. Their results showed that the Yangtze River Delta exhibited a clear spatial variability pattern of “South High, North Low”. Studies have also shown significant disparities in urban land use efficiency between coastal and inland areas. Coastal regions often exhibit higher urban land use efficiency due to better access to markets, advanced infrastructure, and greater economic activity [23]. In contrast, inland regions may face difficulties in logistics and exploiting regional endowments, resulting in lower efficiency scores [24].
Situated at the crossroads between the Yangtze River Delta and the Pearl River Delta, the Western Taiwan Strait Economic Zone (WTS) illustrates China’s urbanization, industrialization, and sustainable land use experiments [14]. Economically, this zone is pivotal due to its contribution to the national GDP, attraction of foreign investments, and position in international trade networks. Simultaneously, the WTS Economic Zone faces challenges such as small urban scales, the need for improved urbanization levels, low quality of urban development, and deteriorating environmental quality. These issues significantly hinder the sustainable development of the WTS Economic Zone. However, there is currently a lack of comprehensive research accurately measuring and evaluating the land use efficiency of cities within the WTS Economic Zone. Additionally, there is a significant gap in studies examining the dynamic evolution of urban land use efficiency over multiple years and the key driving factors behind these changes. Understanding the historical development and trends in urban land use efficiency within the WTS Economic Zone and analyzing the potential impact of key drivers and policies is crucial for promoting sustainable urban development. To address this gap, this study aimed to assess the current state of urban land use efficiency in the WTS Economic Zone and explore dynamic evolution trends and key driving factors from 2011 to 2020. The findings from this research are expected to provide valuable insights into how cities within the WTS Economic Zone can optimize land use practices to ensure long-term sustainability and resilience.
Past research on urban land efficiency has largely relied on cross-sectional data from single years, lacking dynamic monitoring of efficiency across different periods. Most studies have focused on provincial and municipal levels, with limited research on urban land use efficiency in coastal urban agglomerations. Research on coastal urban agglomerations in China predominantly focused on the Yangtze River Delta, with fewer studies addressing smaller coastal agglomerations like the WTS. In response, using panel data from 20 cities in the WTS Economic Zone from 2011 to 2020, this study evaluated urban land use efficiency across various historical stages. Methodologically, existing research primarily used the DEA method, employing static input–output models to study urban land use efficiency, often overlooking dynamic and temporal changes in land use patterns. Furthermore, current research seldom accounted for the impact of undesirable outputs on the urban land use process, often resulting in an overestimation of actual urban land use efficiency. There is also a scarcity of in-depth analyses on changes in urban land use efficiency. To address the gaps in previous research, this study used panel data from 20 cities within the WTS Economic Zone, spanning 2011 to 2020, to conduct a dynamic evaluation and monitoring of urban land use efficiency over the decade. The model incorporated fund, labor, and land as input indices, alongside expected output indices (economic, social, and environmental) and undesired output indices (three types of industrial waste). Meanwhile, kernel density estimation was also applied to analyze the dynamic evolution characteristics of urban land use efficiency in this region. Finally, the ML index analysis decomposition method was used to explore changes in Total Factor Productivity (TFP) of urban land use in this region and its driving factors. The results of this study can provide valuable insights for the formulation of urban land use policies, offering guidance for the high-quality urban development of the WTS Economic Zone.

2. Data and Methodology

2.1. Study Area

The WTS Economic Zone is located on the west coast of the Taiwan Strait, between longitudes 117°31′ and 120°45′ E and latitudes 23°30′ and 25°50′ N, adjacent to the East China Sea and the South China Sea (see Figure 1).
This region features varied terrain, including plains, hills, and mountains, and has a subtropical monsoon climate with distinct seasons and moderate temperatures, which is favorable for extensive agricultural activities and economic growth. Due to its strategic location and rich natural resources, the WTS Economic Zone has become a significant economic hub in southeastern China. This study focuses on the WTS Economic Zone, including various prefecture-level and higher cities across the provinces of Fujian, Jiangxi, Guangdong, and Zhejiang. Due to the lack of comprehensive data on the Pingtan Comprehensive Experimental Zone, this study limits its scope to the remaining 20 cities in the economic zone, as shown in Table 1. Recently, the WTS Economic Zone has experienced rapid economic growth fueled by strong industrial development, booming trade, and a dynamic service sector. However, rapid economic expansion has posed significant challenges to environmental protection and sustainable development. The release of industrial pollutants and rapid urbanization have caused environmental degradation, placing heavy stress on local ecosystems. Moreover, rapid urbanization has encroached on agricultural land and ecological spaces, and inefficient land use has intensified conflicts between urban development and ecological conservation. Therefore, investigating the urban land use efficiency of cities within the WTS Economic Zone is crucial for fostering sustainable urban development in the region.

2.2. Indicator Selection and Data Source

The optimal goal of urban land use is to maximize desired the socio-economic outputs and minimize the undesired environmental and ecological effects [25]. Scientifically selecting input–output indicators is essential for measuring urban land use efficiency. Thanassoulis [12] noted that the number of DMUs should be at least twice the number of evaluation indicators. Given that this study includes 20 cities (20 DMUs) in the WTS Economic Zone, the number of indicators should not exceed 10 to ensure reliable evaluation results. Considering the actual needs of China’s urbanization, this study refers to the existing literature [26,27,28,29,30] and follows the principles of systematicity, conciseness, representativeness, comparability, and operability to establish the input–output indicator system for evaluating urban land use efficiency in the WTS Economic Zone, focusing on “inputs”, “desired outputs”, and “undesired outputs” as shown in Table 2. Past research generally considers land use efficiency as a complex system involving social, economic, and natural development [5,31]. Liu, Zhang and Zhou [5] in their study on the efficiency of land allocation in China found that capital, labor, and land investments jointly contributed to the growth of non-agricultural GDP, indicating that improving land use efficiency requires the effective allocation of multiple resources. Considering data availability, we used the total fixed assets investment (representing fund), the number of employees in the secondary and tertiary industries (representing labor), and the construction area (representing ground) as the three inputs. We considered the output value of the secondary and tertiary industries (representing the economic benefit), the average salary of the urban employees (representing the social benefit), and the area of the park green spaces (representing the environmental benefit) as the three expected output indices. Additionally, we used industrial wastewater discharged, industrial waste gas (SO2) emissions, and industrial smoke (powder) dust production as three undesirable outputs. This study collected the input–output indicators and values required for evaluating the urban land use efficiency of 20 cities in the WTS Economic Zone from 2011 to 2020.
The main data sources included the “China Urban Statistical Yearbook (2011–2020)”, “China Environmental Statistical Yearbook”, “China Urban Construction Statistical Yearbook”, “China Energy Statistical Yearbook”, relevant provincial and city statistical yearbooks, and the national economic and social development bulletins of the cities. Missing data were supplemented using ARIMA, which is a robust statistical method used for time series forecasting and imputing missing values. It uses past values in the series (autoregression) and past forecast errors (moving average) to make predictions. The integration part of ARIMA was used to make the time series stationary, which is essential for accurate modeling. This period includes China’s rapid economic development phase and the implementation of several significant policies. For instance, the “National Land Use Master Plan (2006–2020)” had a crucial impact on enhancing urban land use efficiency during this time. Additionally, this period saw substantial economic and environmental changes, with many cities beginning to consider adverse outputs, such as carbon emissions, in their land use planning. Analyzing data from this period can provide better insights into the effects of these changes on urban land use efficiency.

2.2.1. Input Index

Input factors in the classic production function typically include land, labor, and capital [32]. These components are critical in understanding the dynamics of economic productivity and efficiency. Specifically, urban land resources serve as a pivotal base for both construction and developmental endeavors. Consequently, the extent of developed land, often quantified through the built-up area, is employed as a metric for land input, highlighting its significance in urban economic frameworks. The production efficiency of labor and capital affects a country or region’s economic efficiency and competitiveness [29]. In the context of China, the economic landscape is predominantly shaped by the activities within the secondary and tertiary sectors. These sectors’ vitality underscores the importance of labor input, which is quantified by the employment figures within these industries. Capital input, another cornerstone of the production function, is gauged through the aggregate fixed asset investment by the broader society. This measure reflects the intensity and scale of capital deployment in fostering economic activities and supporting infrastructural and developmental projects. The interplay between labor and capital inputs, against the backdrop of urban land utilization, offers a comprehensive lens through which the intricacies of economic efficiency and competitiveness can be examined, particularly within the urbanized settings of China.

2.2.2. Output Index

Urban desired outputs usually cover economic, social, and ecological aspects [30], and these outputs are pivotal in assessing the holistic performance and sustainability of urban development. The economic dimension is measured by the output value of the secondary and tertiary industries. This indicator represents a city’s economic vitality, reflecting the efficiency of resource allocation and utilization. In terms of social benefits, the focus shifts toward the enhancement of residents’ quality of life, an aspect that is intricately linked to the socio-economic fabric of urban environments. The average salary of urban employees is selected as a representative metric, offering insights into the socio-economic ramifications of urban development on the populace. Ecologically, the focus shifts toward the development and preservation of the urban ecological environment. The area of park green areas within urban landscapes is utilized as a key indicator in this regard. This metric not only embodies the ecological benefits emanating from urban planning and development but also underscores the importance of green infrastructure in enhancing urban livability and environmental quality. Conversely, undesired outputs manifest as detrimental environmental impacts stemming from urban land utilization processes. These are typically represented by the emission of pollutants, including industrial wastewater discharged, industrial waste gas (SO2) emissions, and industrial smoke (powder) dust production. These indicators serve as critical markers for assessing the environmental cost of urbanization, highlighting the imperative for sustainable urban planning and development strategies that mitigate the adverse ecological impacts associated with urban expansion and industrialization.

2.3. Methodology

2.3.1. Super-Efficiency EBM Model

Data Envelopment Analysis (DEA) is a widely used method for evaluating efficiency that can handle multiple inputs and outputs simultaneously. Unlike stochastic frontier analysis, DEA does not impose specific functional form constraints, making it a powerful tool for efficiency analysis. Traditional DEA models are typically divided into two categories: radial models, such as the CCR model [10] and BCC model [33], and non-radial models, like the SBM model [34]. However, these traditional models have limitations. For instance, they do not fully account for slack in inputs and outputs, which can lead to biased efficiency measurements [35]. To overcome these limitations, Tone et al. [36] proposed a hybrid model known as the EBM model, which combines radial and non-radial measures. The EBM model offers a more accurate assessment of the efficiency of decision-making units (DMUs) by evaluating the improvement ratio between actual and target values and identifying gaps in inputs and outputs. The formula for the model is as follows:
m i n θ ε x 1 i = 1 m w i i = 1 m w i s i x i φ + ε y 1 r = 1 s w r + r = 1 s w r + s r + y r + ε b 1 q = 1 p w q + q = 1 p w q s q b q
s . t .   X λ + s i = θ x i
Y λ s r + = φ y r
b λ + s q = φ b q , λ 0 ,   s i ,   s r + ,   s q 0 ,   θ 1 ,   φ 1
The model has m + 1 parameters: ε and w i ( i   = 1,2, …, m ). w i indicates the relative importance of each input index. Different from the general mixed-distance model, the parameter selection of the EBM model is based on the data characteristics. ε denotes the specific gravity of the non-radial part of the model and takes a value of [0,1]; when it is 0, this model is equivalent to the radial model. When ε = 1, the non-radial model is the SBM model.
The EBM model can be applied in three forms: input-oriented, output-oriented, and non-oriented. In this study, a non-oriented EBM model is used, considering undesirable outputs to evaluate urban land use efficiency in the WTS Economic Zone. In practice, DEA models often find many DMUs to be efficient, especially when there are numerous input and output indicators. This can make it difficult to differentiate between DMUs with similar efficiency scores. To address this, Andersen et al. developed the “super-efficiency” model [37], which excludes the DMU under evaluation from the reference set. This approach allows for efficiency scores greater than 1, providing a clearer distinction among efficient DMUs. Some studies showed that the efficiency coefficient needs to be at or above 1 to be considered a relatively efficient land use. Especially in cities that strike a balance between economic development and environmental protection, a high efficiency score (for example, 1.2 or higher) usually indicates that the city not only makes full use of land resources, but also effectively reduces unnecessary environmental burdens [18]. In addition, Liu, Xiao, Li, Ye and Song [24] showed that the land use efficiency of different regions in China varies significantly. The average efficiency values in the eastern, central and western regions are 0.733, 0.535 and 0.507, respectively. This suggests that in some regions, efficiency values below 0.6 may be common, while efficiencies above 0.8 may be seen as relatively high utilization efficiencies. Given these advantages, this study employed the super-efficiency EBM model. However, because this model used cross-sectional data, it only measured efficiency at specific time points, making it challenging to compare efficiency across different periods. To overcome this limitation, this study integrated the super-efficiency EBM model with the Malmquist–Luenberger (ML) index for dynamic analysis.

2.3.2. Malmquist–Luenberger Index

Total Factor Productivity (TFP) is an important indicator for assessing economic growth rates. It represents the efficiency of production activities over a specified period and measures total output per unit of total input. The Malmquist–Luenberger (ML) index is well-supported in academic literature for measuring and decomposing TFP into components such as efficiency change and technical change. The ML index serves as a pivotal metric, offering insights into the TFP shifts over time. It is instrumental in decomposing the TFP into two distinct but interrelated elements: efficiency change (EC) and technological change (TC). EC pertains to the improvement or decline in the utilization of input resources to achieve optimal output levels, essentially reflecting the ability of a unit to maximize its output given a set of inputs. On the other hand, TC captures the evolution or innovation in the production processes, signifying shifts in the frontier of production possibilities. Chung, et al. [38] applied the traditional DEA method and directional distance function to the Malmquist index model, introducing the Malmquist–Luenberger (ML) index that incorporates undesired outputs, also known as the ML productivity index. As the production process is a long-term continuous change and technology is constantly advancing, this method can evaluate dynamic panel data over multiple continuous time points, analyzing the trend of technological efficiency growth. Subsequently, Du et al. [39] modified the Malmquist–Luenberger index to address the infeasibility problem and applied it to assess environmental productivity performance in China, highlighting the role of technical change as a major driver of productivity growth.
The model formula is as follows:
M I T E P t + 1 t = E t x t + 1 , y t + 1 , b t + 1 ; g E t x t , y t , b t ; g E t + 1 x t + 1 , y t + 1 , b t + 1 ; g E t + 1 x t , y t , b t ; g = E C × T C = E t + 1 ( x t + 1 , y t + 1 , b t + 1 ; g ) E t x t , y t , b t ; g × E t x t , y t , b t ; g E t + 1 x t , y t , b t ; g E t x t + 1 , y t + 1 , b t + 1 ; g E t + 1 x t + 1 , y t + 1 , b t + 1 ; g
where M I T E P t + 1 t is the TFP Index for period t + 1, and E t x t , y t , b t ; g and E t + 1 x t , y t , b t ; g are the efficiencies for periods t and t + 1, respectively; x represents the input factors, y represents the output factors, b represents the environmental variables, and g represents the technology parameters. The formula decomposes into the product of efficiency change ( E C ) and technical change ( T C ), where E C represents the relative efficiency change at different time points under the same technology and T C represents the impact of technological progress on productivity. If E C > 1, the technical efficiency of DMU is close to the production frontier, and if T C > 1, then the entire social technology frontier shifted to a higher level of development. By calculating each part of the formula, the TFP can be obtained.
In addition, according to Zofio’s [40] productivity decomposition method, E C is further decomposed into pure efficiency change ( P E C ) and scale efficiency change ( S E C ), and T C is decomposed into pure technology change ( P T C ) and technology scale change ( S T C ). The following formula shows these adjustments:
M L t t + 1 = P E C t t + 1 · S E C t t + 1 · P T C t t + 1 · S T C t t + 1
To further analyze the situation, Färe et al. [41] proposed decomposing T C into three parts: output-biased technological change ( O B T C ), input-biased technological change ( I B T C ), and magnitude of technological change ( M A T C ):
T C = O B T C I B T C M A T C
O B T C t t + 1 = E t x t + 1 , y t + 1 , b t + 1 ; g E t x t , y t , b t ; g E t x t + 1 , y t , b t ; g E t + 1 x t + 1 , y t , b t ; g
I B T C t t + 1 = E t x t + 1 , y t , b t ; g E t + 1 x t + 1 , y t , b t ; g E t x t , y t , b t ; g E t + 1 x t , y t , b t ; g
M A T C t t + 1 = E t x t , y t , b t ; g E t + 1 x t , y t , b t ; g
Through these formulas, the impact of technological progress and technological efficiency on the TFP index can be analyzed, and the influence of factor-biased technological changes on technological progress can be examined from both input and output perspectives.

2.3.3. Kernel Density Estimation

Kernel Density Estimation (KDE) is a flexible, non-parametric statistical technique that estimates the probability density function of a random variable. This approach is particularly valuable for examining the evolution of urban land use efficiency over time, as it enables visualization of data distribution patterns without assuming any specific distribution. KDE works by placing a smooth curve, called a kernel function, over each data point. These curves are summed to produce an overall density curve. The height of the curve at any point reflects the probability density, offering insights into the concentration and distribution of the data. This method allows for the detection of trends, changes, and patterns in the data, making it a powerful tool for understanding temporal shifts in urban land use efficiency. The kernel density function is expressed as follows:
f n x = 1 n h i 1 n K x i x h
where n is the number of samples, h is the bandwidth of the kernel density estimate, K   ( u ) is the kernel function, x i is the sample data and x is the independent variable. The kernel functions in common use include the uniform kernel function, Epanechnikov kernel function and Gaussian kernel function. The Gaussian kernel function formula used in this study is as follows:
K u = 1 2 π e x p 1 2 u 2
where the u in the formula is x i x h . The bandwidth controls the smoothness of the density curve; smaller values lead to a more detailed but potentially noisier curve, while larger values result in a smoother curve. Common kernel functions include the uniform, Epanechnikov, and Gaussian kernels, with the Gaussian kernel being the most widely used due to its smooth, bell-shaped curve that balances the influence of nearby data points.
This study employed the Gaussian kernel function to assess the dynamic evolution of urban land use efficiency in the WTS Economic Zone. By examining changes in the position, shape, and peak of the KDE curve over time, we gained insights into how urban land use efficiency has shifted, whether it has become more or less evenly distributed, and if certain areas have diverged from the norm. This analysis provides a comprehensive view of how efficiency has developed over time, helping to identify trends and areas that may require further attention or intervention.

3. Results

3.1. Results of Urban Land Use Efficiency

This study utilized MaxDEA Model to compute the urban land use efficiency of 20 cities in the WTS Economic Zone over the period from 2011 to 2020. Looking at the above average urban land use efficiency value, it reveals that with slight increases and decreases, overall, most cities have exhibited an upward trend in urban land use efficiency over the decade. The average urban land use efficiency of the WTS Economic Zone increased from 0.934 in 2011 to 1.011 in 2020, with a peak of 1.015 in 2018. In 2011, there were 13 cities with urban land use efficiency greater than 1, which increased to 17 by 2020, indicating an increased focus on urban land use in the region.

3.1.1. Results of Kernel Density Estimation

Using kernel density estimation (KDE), the urban land use efficiency values of the WTS Economic Zone were analyzed for 2011, 2014, 2017, and 2020. This analysis aimed to further characterize the temporal dynamic evolution of urban land use efficiency in the region, as illustrated in Figure 2. (1) Examining the centroid positions of the kernel density curves for each year, it is observed that the centroid positions have shifted to the right over the four years. This rightward shift suggests that, on average, cities in this region have become more efficient in their use of land, and the value range has narrowed from 2011 to 2020. The narrowing of the value range further implies that this improvement is becoming more uniform across the region, with fewer outliers or extreme inefficiencies. This could be a result of regional policies or economic strategies that have successfully raised the baseline level of efficiency and reduced disparities between different cities. (2) The relatively smooth curves observed for 2011 and 2014 suggest a period of relative stability in urban land use efficiency, where most cities had similar efficiency levels. However, the fluctuations in the 2017 curve highlight a period of diversity and volatility in land use efficiency. This could indicate that while some cities were improving, others were experiencing challenges, possibly due to economic shifts, policy changes, or external factors affecting certain areas differently. (3) The sharp peak in the 2020 curve is particularly noteworthy as it reflects a high concentration of urban land use efficiency. This peak suggests that by 2020, a significant number of cities within the WTS Economic Zone had achieved high levels of efficiency, indicating a convergence toward optimal land use practices. This could be attributed to the cumulative effect of sustained development efforts, improved infrastructure, better governance, and perhaps increased awareness of the need for sustainable land use.
This study’s findings have significant implications for land policy and urban planning in the WTS Economic Zone. This research indicates that while implementing a unified land use policy, the government should consider the needs of less developed cities to further enhance the region’s overall efficiency. The high concentration of urban land use efficiency observed in 2020 suggests that the region is relatively mature and can maintain and enhance its efficiency advantage through advanced land use strategies. The KDE results demonstrate the dynamic evolution of urban land use efficiency in the WTS Economic Zone and provide valuable insights into the effectiveness of past policies and the direction of future strategies.

3.1.2. Results of the City-Level Analysis of Urban Land Use Efficiency

Overall, urban land use efficiency in the WTS Economic Zone has generally improved, possibly due to better planning, technological advancements, and increased awareness of sustainable practices. However, the rate of improvement is not uniform across all cities. For instance, Xiamen and Chaozhou have shown significant growth in urban land use efficiency, while cities like Ganzhou and Fuzhou (Jiangxi) have exhibited more fluctuating patterns. This highlights substantial heterogeneity in urban land use efficiency across the cities in the WTS Economic Zone. As shown in Figure 3, the coastal cities of Xiamen, Ningde, Shantou, Chaozhou, and Putian have consistently ranked in the top five for urban land use efficiency in the region.
Figure 4 present the average urban land use efficiency of various cities in the WTS Economic Zone over a decade. Figure 5 presents the trends in land use efficiency from 2011 to 2020 for four representative cities, illustrating the different patterns of efficiency development over time. As shown in Figure 6, this analysis segregated these cities into four distinct typologies based on the observed trends in urban land use efficiency. The “ascending” trend suggests that the city’s land use efficiency is improving, likely due to effective policies or measures that promote continuous enhancement. For stable trends, a high efficiency level may indicate that the city has reached an optimal level of land use, while a low level could reflect an insufficient focus on land development. In cities with a “U” shaped trend, the initial decline followed by an increase suggests that issues were identified and addressed in time to restore efficiency. Conversely, the inverted “U” shaped trend indicates initial growth, but later decline may result from excessive resource depletion or ineffective policy implementation. These four trends are elucidated as follows:
The first one is called “ascending”, and cities such as Chaozhou, Xiamen Ganzhou and Shangrao belong to this category. These are the cities that were observed to have a progressive enhancement of their overall land utilization throughout the followed period. In the case of Xiamen, the efficiency index rose from 1.120 in 2011 to 1.206 in 2020, exhibiting a general upward trend despite a slight decline in the final two years. This trend implies that there is an advancement in demand, utilization and maybe efficient use of land resources as decreed by increased urbanization, infrastructure development and favorable economic policies. Policies for this type of city should promote industrial cooperation and technological innovation, continuously advance green urban planning and sustainable practices, and drive the development of the surrounding cities.
The second category, termed “stable”, includes a broader set of cities: encompassed under this are cities including Fuzhou (Fujian), Lishui, Ningde, Putian, Quanzhou, Sanming, Yingtian, Zhangzhou, Shantou, and Wenzhou. It is important to note that the efficiency of land use differs slightly in these locations, but its variability over time is insignificant. For example, Fuzhou (Fujian) maintained an average efficiency index of 1.039 over the decade, with yearly data showing minor fluctuations around this mean, indicating a generally stable trend. This steadiness may be an indication of mature urban systems, where available land use has leveled out, effectively absorbing the pressures of development while at the same time heeding sustainable use. This type of city should maintain stable and consistent land use policies, encourage the diversification of economic activities, and support emerging industries such as information technology, services, and tourism.
The third pattern can be described as the ‘U-type’ pattern where division cities like Fuzhou of Jiangxi, Jieyang and Meizhou are typified. Such a pattern can be explained by assuming that there exists a suboptimal phase where the efficiency of land utilization declines gradually and then there is a recovery phase, where the efficiency begins to increase again, or land is utilized more efficiently. In the case of Jieyang, the efficiency index approached 1.1 at the beginning and 1.2 at the end of the period, but in the middle years, the index hovered around 1.0, with a notable drop to 0.619 in 2017, displaying a distinct “U”-shaped trend. These changes might be evident during days of transformation or restructuring of the mentioned urban centers, whereby factors that encourage growth such as initial sprawl or changes in economic systems result in inefficiencies, which are later rectified by other improvements or techniques. Policies for this type of city should implement targeted revitalization plans to overcome the initial efficiency decline, such as improving urban management, upgrading infrastructure, and attracting investment. They should support enterprises in transitioning from traditional industries to more sustainable and innovative industries.
The fourth type of trend is the “inverted U-shaped” trend, and this refers to regions of Longyan, Quzhou and Nanping where there was an exciting improvement in the LUE initially, but later they showed a more apparent decline in the subsequent years. As for Longyan, the efficiency index was recorded at 0.698 in 2011 and 0.821 in 2019, with most years within this period exceeding these values, and certain years even surpassing 1. Although the index in 2020 was relatively high, the overall trend formed an inverted “U” shape. This trend could imply that improvements in productivity from land development and urbanization activities, which were initially accelerated, attain some level of saturation or suffer from negative externalities as well as unadaptable practices, thereby leading to a negative sloping part of the curve. Policies for this type of city should avoid over-exploitation of land and resources, implement land use policies that balance development and conservation, and encourage the adoption of advanced technologies to maintain and improve productivity.
This classification method provides a valuable perspective on the potential divergent evolutionary trajectories of modern cities within the WTS Economic Zone regarding land use intensity. The findings are consistent with previous studies, such as Chen et al. [42] who found that customized policies considering local social, economic, and environmental factors can significantly enhance urban land use efficiency and support rural revitalization in China. Similarly, He, et al. [43] found that impacts on regional ecological efficiency vary at the provincial level, underscoring the importance of considering local conditions when implementing ecological efficiency improvements. Regional differences necessitate tailored policy approaches. This study showed that differentiated urban development strategies and policies are essential to address the development patterns and characteristics of land use in different cities, ensuring sustainable urban development.

3.1.3. Results of the Violin Map

To further analyze and compare the urban land use efficiency of central cities in the WTS Economic Zone, a violin plot was drawn for the urban land use efficiency from 2011 to 2020, as shown in Figure 7. The violin plot, which combines a box plot and a density plot, visually displays the distribution density and statistical characteristics of the data. In the figure, the black dots represent the median efficiency, which can be used to compare the average urban land use efficiency of each city. The width of the violin indicates the probability density of urban land use efficiency at different values. As shown in Figure 7, cities such as Fuzhou (Jiangxi), Ganzhou, Longyan, and Nanping have longer central lines in their plots, indicating greater variance and instability in urban land use efficiency values from 2011 to 2020. In contrast, cities like Chaozhou, Fuzhou (Fujian), Jieyang, Lishui, Ningde, Putian, Quanzhou, Sanming, Shantou, Wenzhou, Yingtan, and Zhangzhou show less variation in efficiency values over the ten years. Additionally, most cities with relatively stable urban land use efficiency are coastal cities, while the unstable ones are located inland.

3.2. Results of Total Factor Productivity Change

3.2.1. TFP Growth and Regional Differences

Using the Malmquist–Luenberger (ML) index analysis method and accounting for undesirable outputs, this study quantitatively analyzed changes in urban land use TFP for 20 cities in the WTS Economic Zone from 2011 to 2020. The analysis of the TFP and its constituent components within the WTS Economic Zone spanned over the decade from 2011 to 2020, as delineated in Figure 8. The TFP index, a pivotal indicator of aggregate productivity performance, exhibited an average annual growth rate of 1.059 throughout this period. This growth trajectory is characterized by a distinctive pattern, described as a right-skewed “M” shape, which encapsulates phases of stability, followed by successive cycles of growth and decline. Such a pattern underscores the fluctuating nature of productivity growth within the zone, reflecting periods of economic vigor interspersed with intervals of contraction. Delving deeper into the decomposition of the TFP index, the analysis reveals the distinct contributions of efficiency change (EC) and technological change (TC) to the overall productivity growth. The annual average growth rate of EC, standing at 1.025, alongside that of TC recorded at 1.047, collectively underpin the positive trajectory of the TFP index. This dual contribution signifies that the advancements in both operational efficiency and technological capabilities have been instrumental in driving the productivity enhancements observed within the economic zone. However, a critical examination of the EC values, which fall below the unity threshold, raises pertinent concerns regarding the optimization of resource allocation and operational practices. The sub-optimal EC values suggest that despite the overall positive growth trend, there exists a potential bottleneck in achieving maximal production efficiency. Such a scenario underscores the imperative need for strategic interventions aimed at bolstering the efficiency component of productivity. Addressing this aspect is crucial for sustaining and augmenting the development trajectory of the WTS Economic Zone, ensuring that the foundations of productivity growth are robust and conducive to long-term economic prosperity.
In addition, an in-depth examination of the decomposition factors contributing to technological progress reveals a noteworthy trend across most cities analyzed. The data indicates a predominance of input-biased technological changes (IBTC) over output-biased technological changes (OBTC). This distinction suggests that modifications and improvements in the technology related to input factors have a more pronounced impact than those associated with output factors, thereby positioning changes in input efficiency as a crucial catalyst for the overall enhancement of the TFP index. Input-biased technological changes (IBTC) refer to advancements or shifts in technology that primarily augment the efficiency or effectiveness of input utilization, without necessarily increasing the quantity of inputs. This can include innovations that reduce the number of resources required for production, enhance the quality of inputs, or improve the overall process efficiency, thereby leading to a more productive use of inputs. Conversely, output-biased technological changes (OBTC) involve innovations that directly increase the output level, independent of changes in input use, which could result from improvements in product design, quality, or production scalability. The predominance of IBTC over OBTC in most cities underscores the pivotal role that improvements in input efficiency play in driving the growth of the TFP index.
As shown in Figure 9, all 20 cities had an annual average TFP growth greater than 1, indicating positive growth in productivity indices for all cities; in terms of individual components, all cities had a TC greater than 1, also indicating positive growth. This phenomenon underscores the pivotal role of technological advancements as the primary catalyst propelling the TFP ascendancy within these urban entities. However, the analysis reveals a nuanced divergence in the efficiency change (EC) metric, wherein four cities, namely Fuzhou (Fujian), Ningde, Putian, and Zhangzhou, encountered a regressive trend in EC, marking a departure from the otherwise universal growth narrative. This regression in efficiency change delineates a critical constraint, potentially impeding the full realization of the benefits derived from technological progress within these locales. This dichotomy between the universal technological progress and the localized efficiency setbacks offers a compelling lens through which to evaluate the multifaceted nature of productivity growth.
In examining the multifaceted development trajectory of urban centers, an analysis of TFP growth rates offers insightful perspectives on the interplay between economic advancement and ecological sustainability. From the perspective of comprehensive development ranking of cities, the top five cities shown in Figure 9 with the fastest TFP growth were Longyan, Fuzhou (Jiangxi), Shangrao, Quanzhou, and Ganzhou, which are not key economic cities in the WTS Economic Zone, indicating that rapidly developing cities do not necessarily achieve a win–win between ecological environmental protection and economic development. However, this phenomenon also underscores a critical discourse concerning the balance between economic expansion and environmental stewardship. The fact that these rapidly ascending cities are not among the preeminent economic hubs suggests a nuanced dynamic wherein swift economic growth does not invariably translate to a harmonious integration of ecological and economic objectives. Despite the adoption of sustainability concepts, many plans lack a holistic approach, failing to adequately integrate equitable economic development and environmental justice with environmental sustainability goals [44]. Conversely, the analysis also highlights a cohort of cities, specifically Meizhou, Fuzhou (Fujian), Ningde, Chaozhou, and Shantou, characterized by relatively sluggish TFP growth rates. The underlying factors contributing to this subdued growth trajectory may include, but are not limited to, suboptimal technical efficiency, a lag in the adoption of advanced technological solutions, inefficient utilization of land and resources, and inadequate environmental governance mechanisms. This indicates potential areas of concern that may warrant targeted interventions to catalyze development.

3.2.2. ML Exponential Decomposition

The decomposition of the ML index was used to explore the driving factors behind changes in total factor productivity of urban land use. Based on Zofio’s productivity decomposition method [40], the ML index was broken down into Pure Efficiency Change (PEC), Scale Efficiency Change (SEC), Pure Technological Change (PTC), and Technological Scale Change (STC). The calculation results are shown in Figure 9, Figure 10 and Figure 11. Figure 10 presents the geometric mean of the ML index for land use in cities of the WTS Economic Zone from 2012 to 2020. The ML index of land use in this region exhibited an “M”-shaped trend during this period, indicating significant fluctuations in the TFP. Although the ML index values exceeded 1 in certain years, suggesting an increase in the TFP, the overall trend was unstable. From 2012 to 2015, the ML index was relatively stable, with an average slightly above 1, indicating that the TFP remained largely unchanged during this period. In 2016, the ML index reached its peak, approaching 1.15, indicating a significant improvement in the TFP. The index declined in 2017 but rebounded in 2018, and then decreased again to around 1 in 2019–2020. The notable rise in the ML index in certain years may have been driven by factors such as technological advancements, policy directions, changes in the economic environment, and adjustments in industrial structure. However, these factors did not fundamentally promote a sustained increase in the TFP.
By analyzing Figure 11 and Figure 12, it is evident that all four indicators show significant fluctuations. However, upon closer examination, it is found that the PTC values are generally greater than 1, and most exceed the PEC. This indicates that from 2012 to 2020, fluctuations in the land use ML index of the WTS Economic Zone were mainly influenced by the PTC. For instance, the peak in 2016 was due to a sudden increase in the PTC, highlighting that technological progress is the primary driver for improving urban land use efficiency. Nevertheless, the overall level of the PTC remains unstable, with an average of only 1.044. Therefore, it is crucial to further enhance technological innovation and guide the transformation and upgrading of mid- to low-end industries to promote urban technological advancement in the future.
The SEC and the STC reflect the interaction between scale economies and the interplay between economic scale and technological progress. Generally, both coefficients fluctuate around their means with similar magnitudes, almost symmetrically, demonstrating strong interaction and dependency. Between 2017 and 2018, the SEC and STC experienced a significant “increase” and “decrease”, respectively, before returning to their respective average levels. This trend was closely linked to the positive transformation of urban land use methods and the accelerated industrial restructuring in the WTS Economic Zone in 2018. However, this asymmetric change significantly impacted the ML index in 2020, suggesting that while rapid economic scale growth spurred economic development, the lag in technological progress potentially constrained long-term efficiency improvements. Technological innovation enables the integration of emerging technological elements into traditional industries, gradually fostering the growth of emerging industries. This process facilitates the optimal allocation of urban land use, thereby creating favorable conditions for the development of economies of scale. Starting in 2019, both the SEC and STC gradually returned to near their mean values, and their fluctuation trends began to align. This indicates that after a period of asymmetric fluctuations, the balance between scale economies and technological progress was restored, and their interaction stabilized.

4. Discussion and Conclusions

Utilizing the EBM super-efficiency model, kernel density estimation, and ML index analysis method, and accounting for undesirable outputs, this paper examined the urban land use efficiency and its dynamic evolution characteristics of 20 cities in the WTS Economic Zone from 2011 to 2020. Additionally, it analyzed the changes in total factor productivity of urban land use and its driving factors in the WTS Economic Zone. The main conclusions of the study are as follows:
(1)
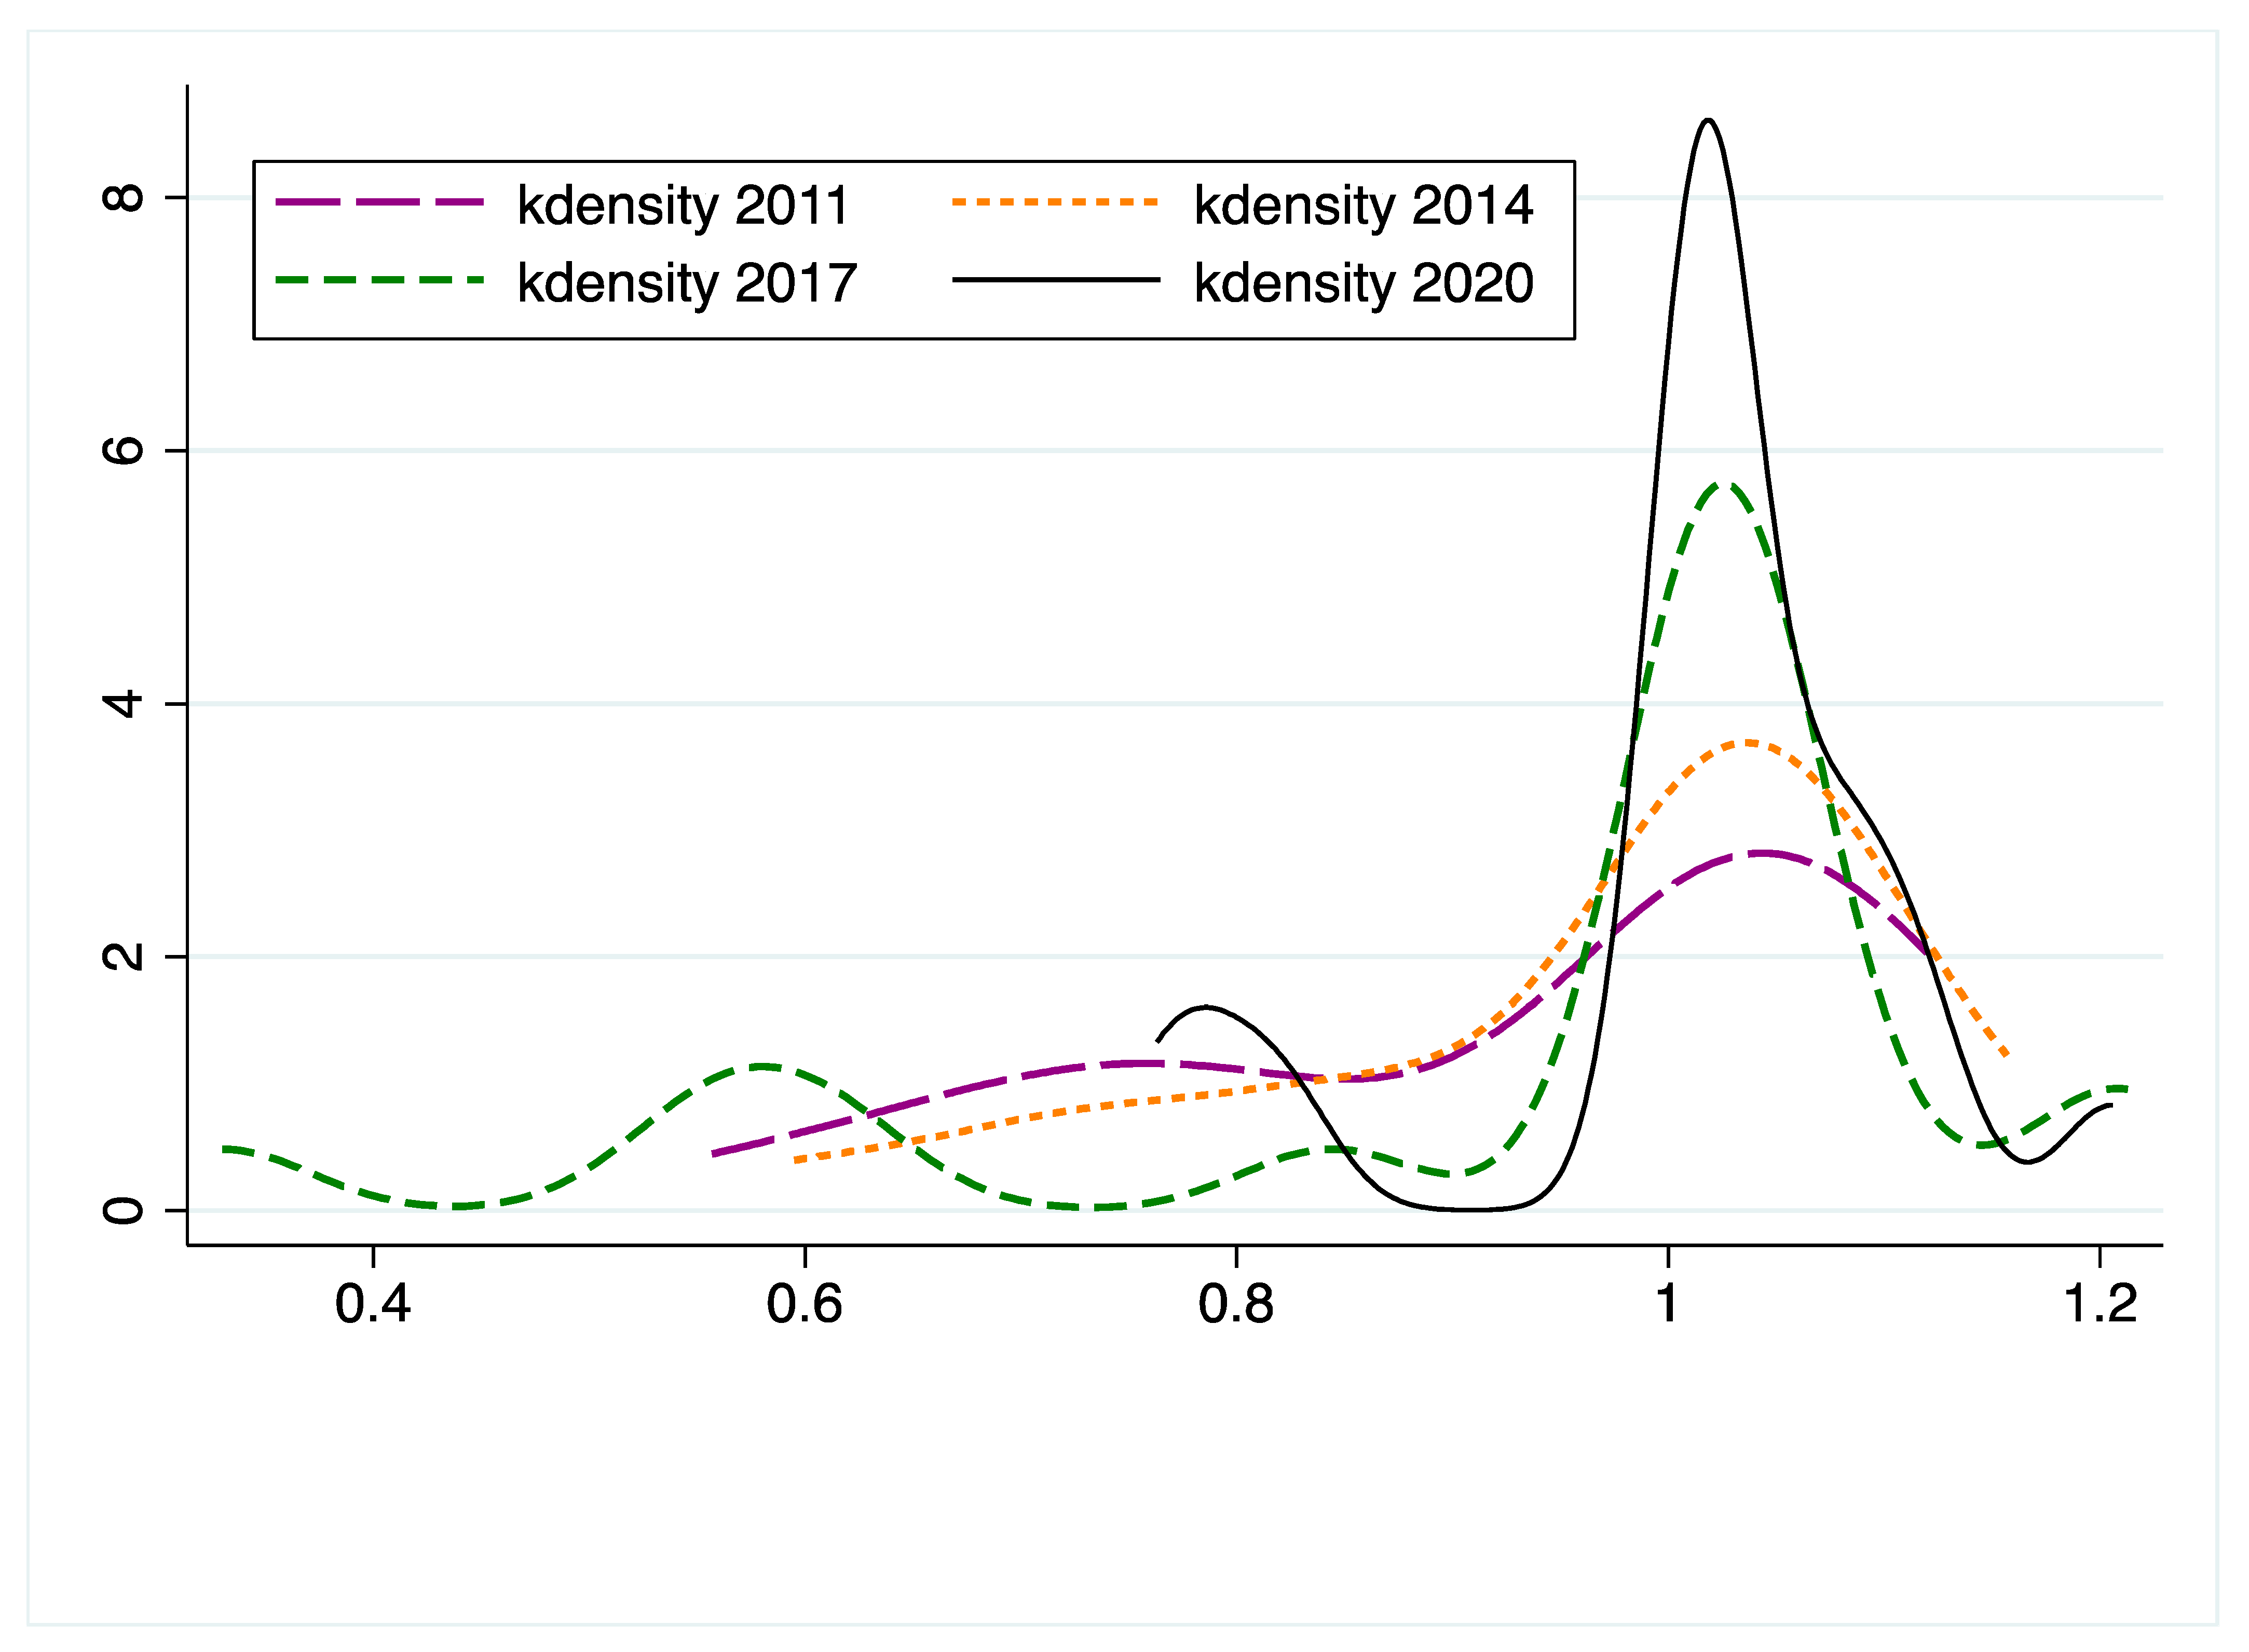
From 2011 to 2020, the urban land use efficiency values of 20 cities in the WTS Economic Zone showed slight fluctuations, but the overall trend for most cities was upward. The results of the dynamic evolution of urban land use efficiency in this region, calculated using the kernel density estimation method, indicate that urban land use efficiency in the WTS Economic Zone improved significantly after a period of stability. Notably, in 2020, the concentration of urban land use efficiency increased significantly, reflecting substantial development optimization in that year. This study contributes to the existing literature by providing empirical evidence of the dynamic evolution of urban land use efficiency in the Western Taiwan Strait Economic Zone, addressing the previous gap in the detailed temporal analysis of urban land use efficiency trends in the region. These findings suggest that further research is needed to explore the specific factors driving these changes, fostering a deeper understanding of the mechanisms underlying the optimization of urban land use in this rapidly developing economic zone.
(2)
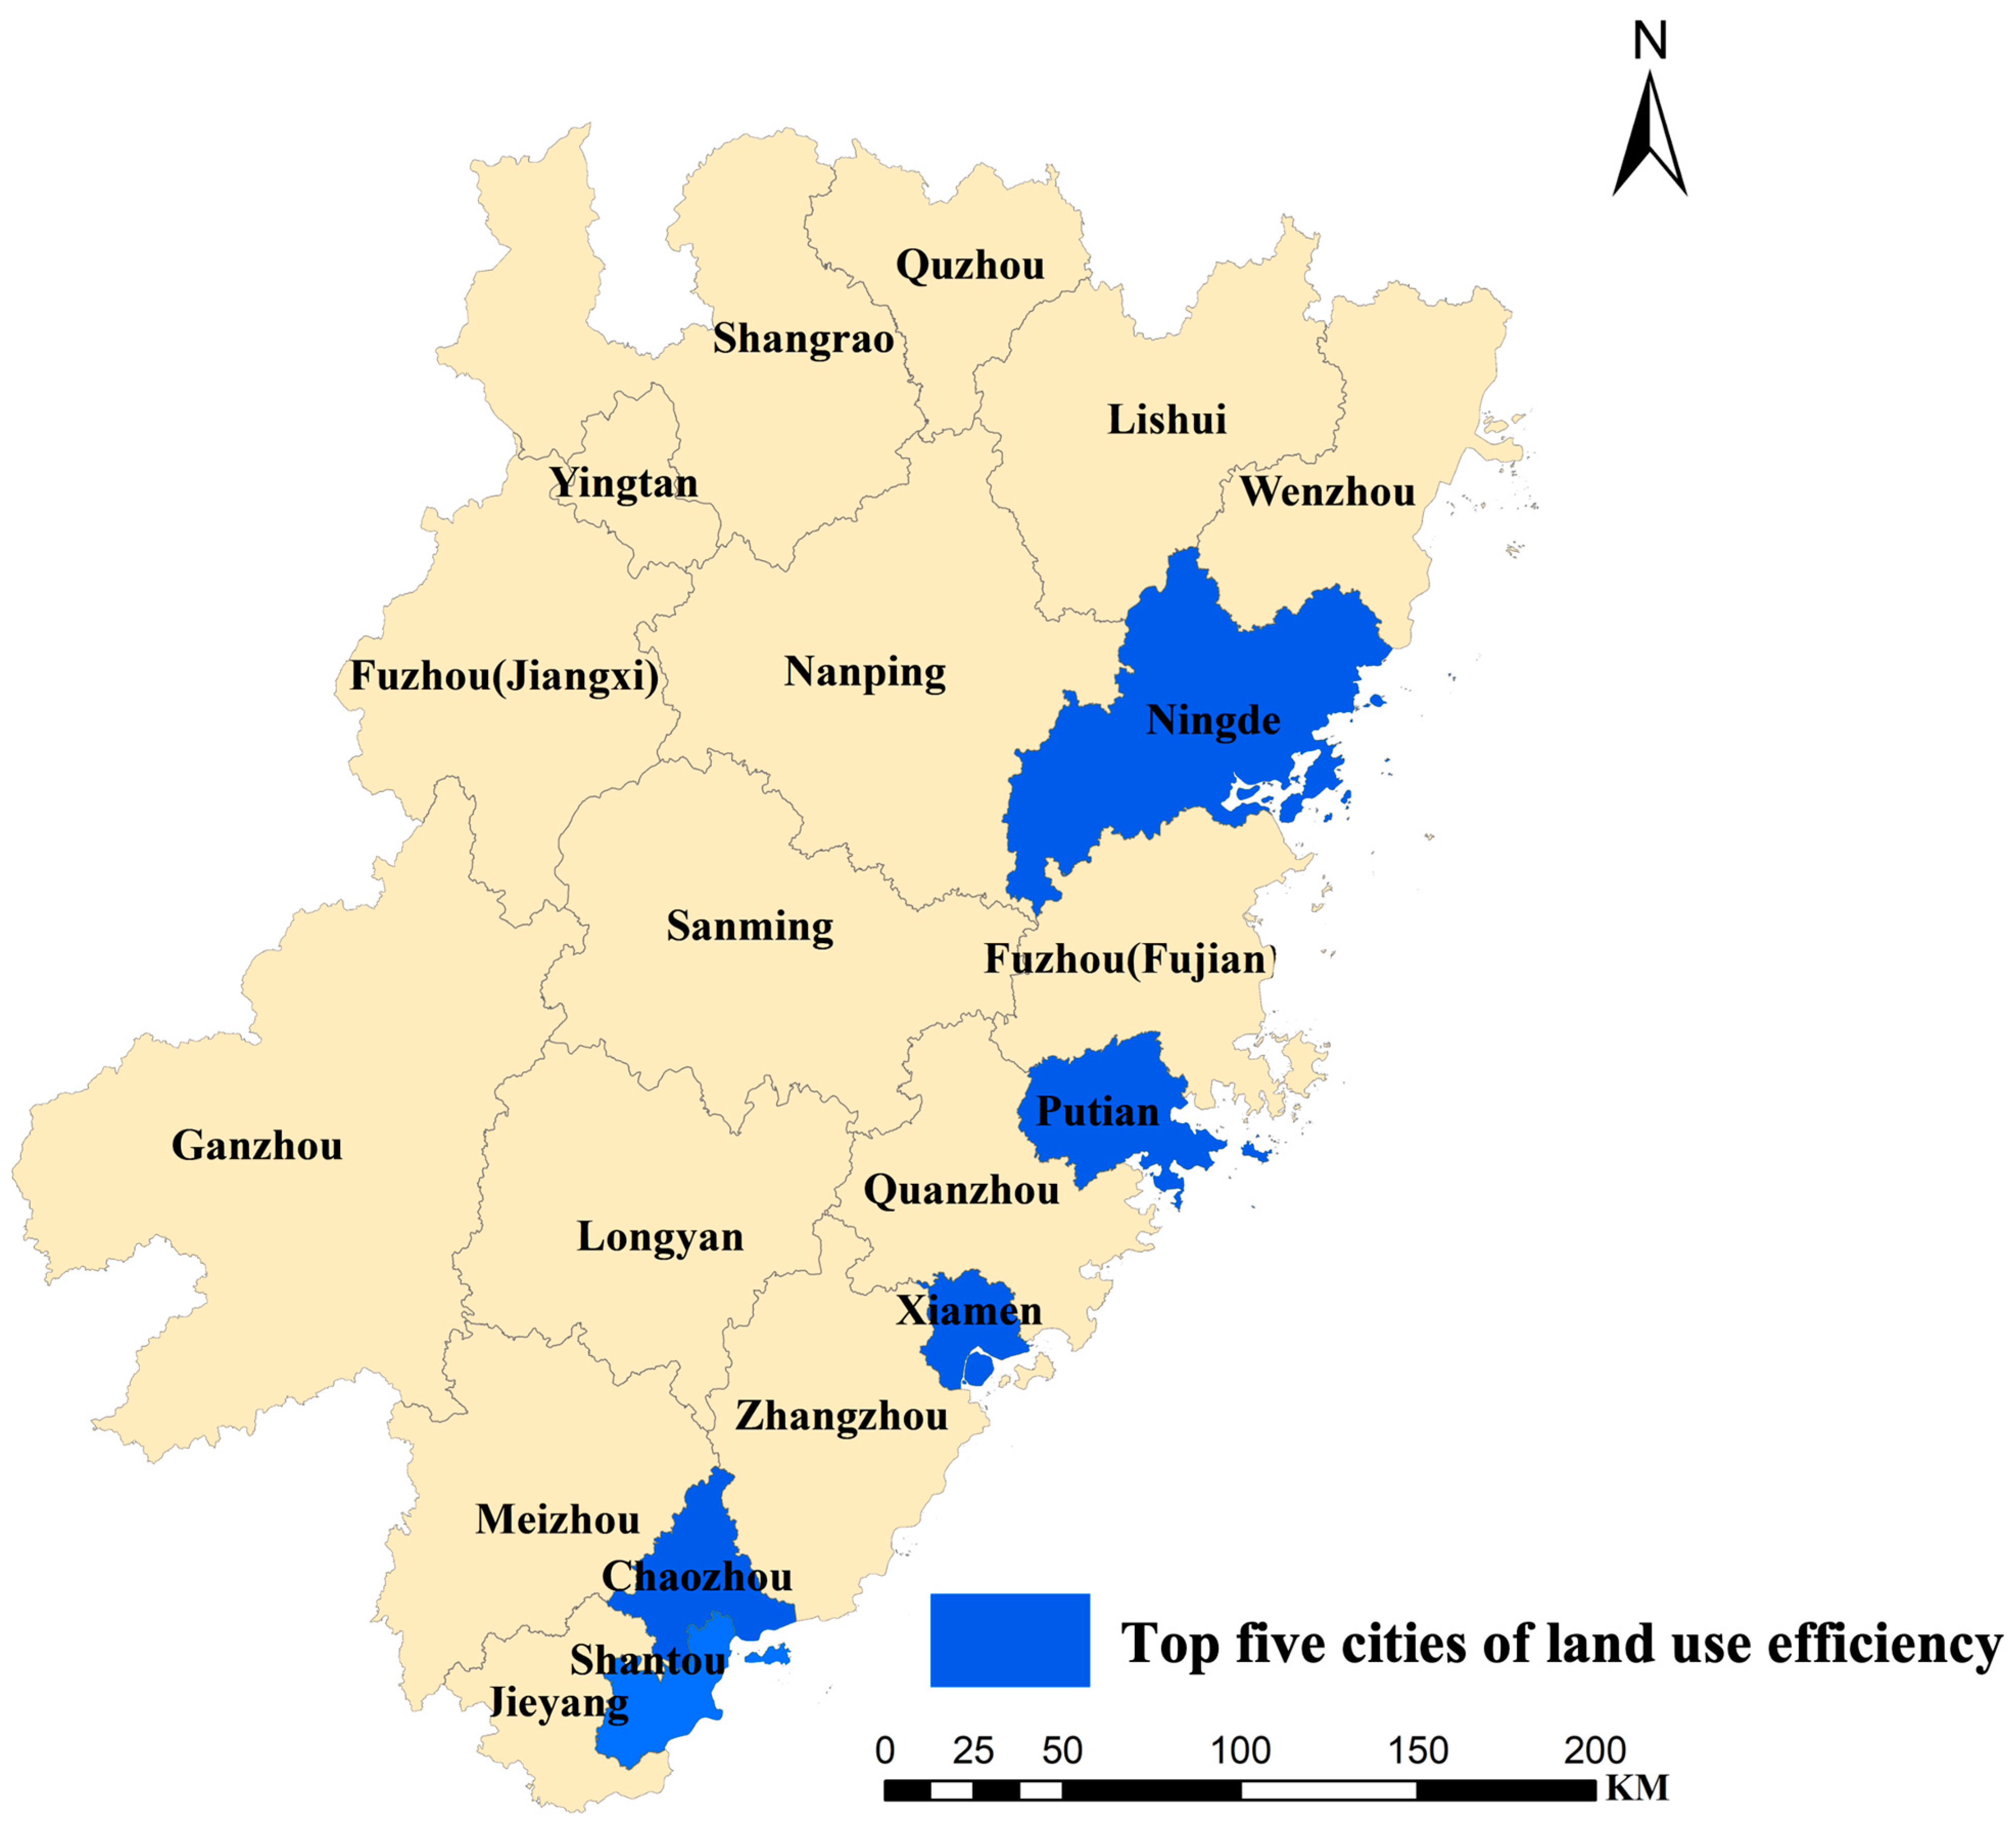
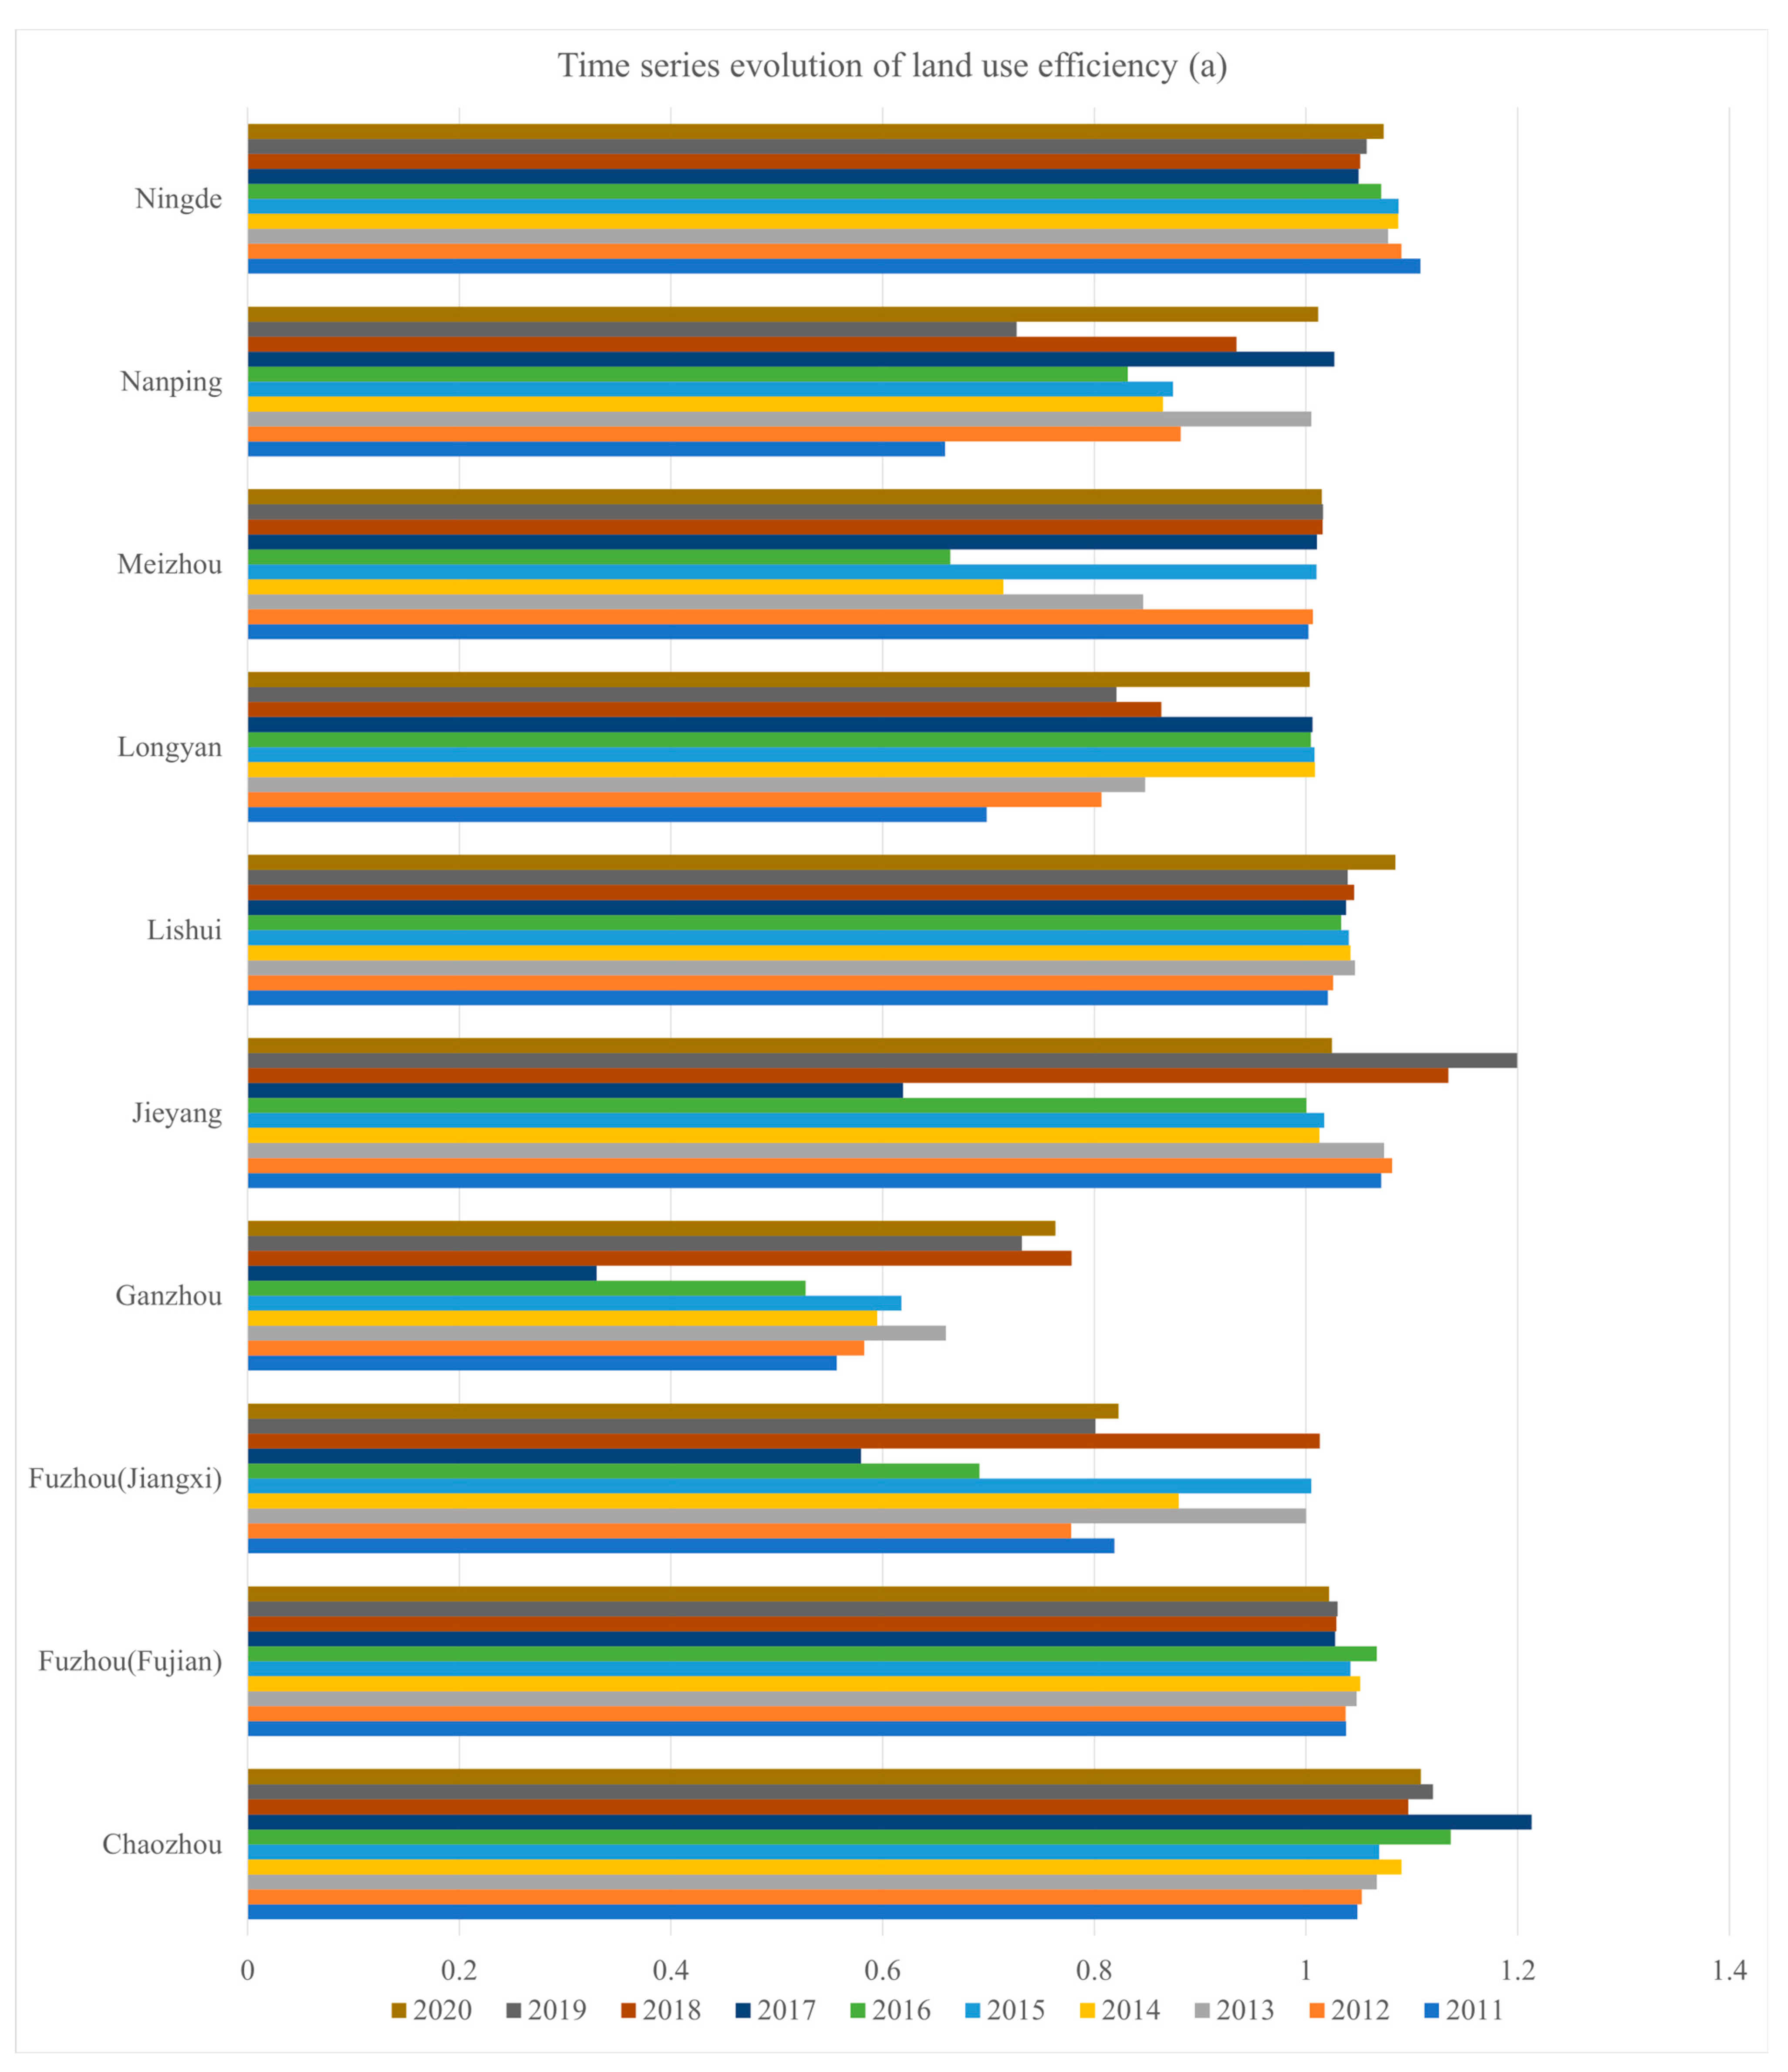
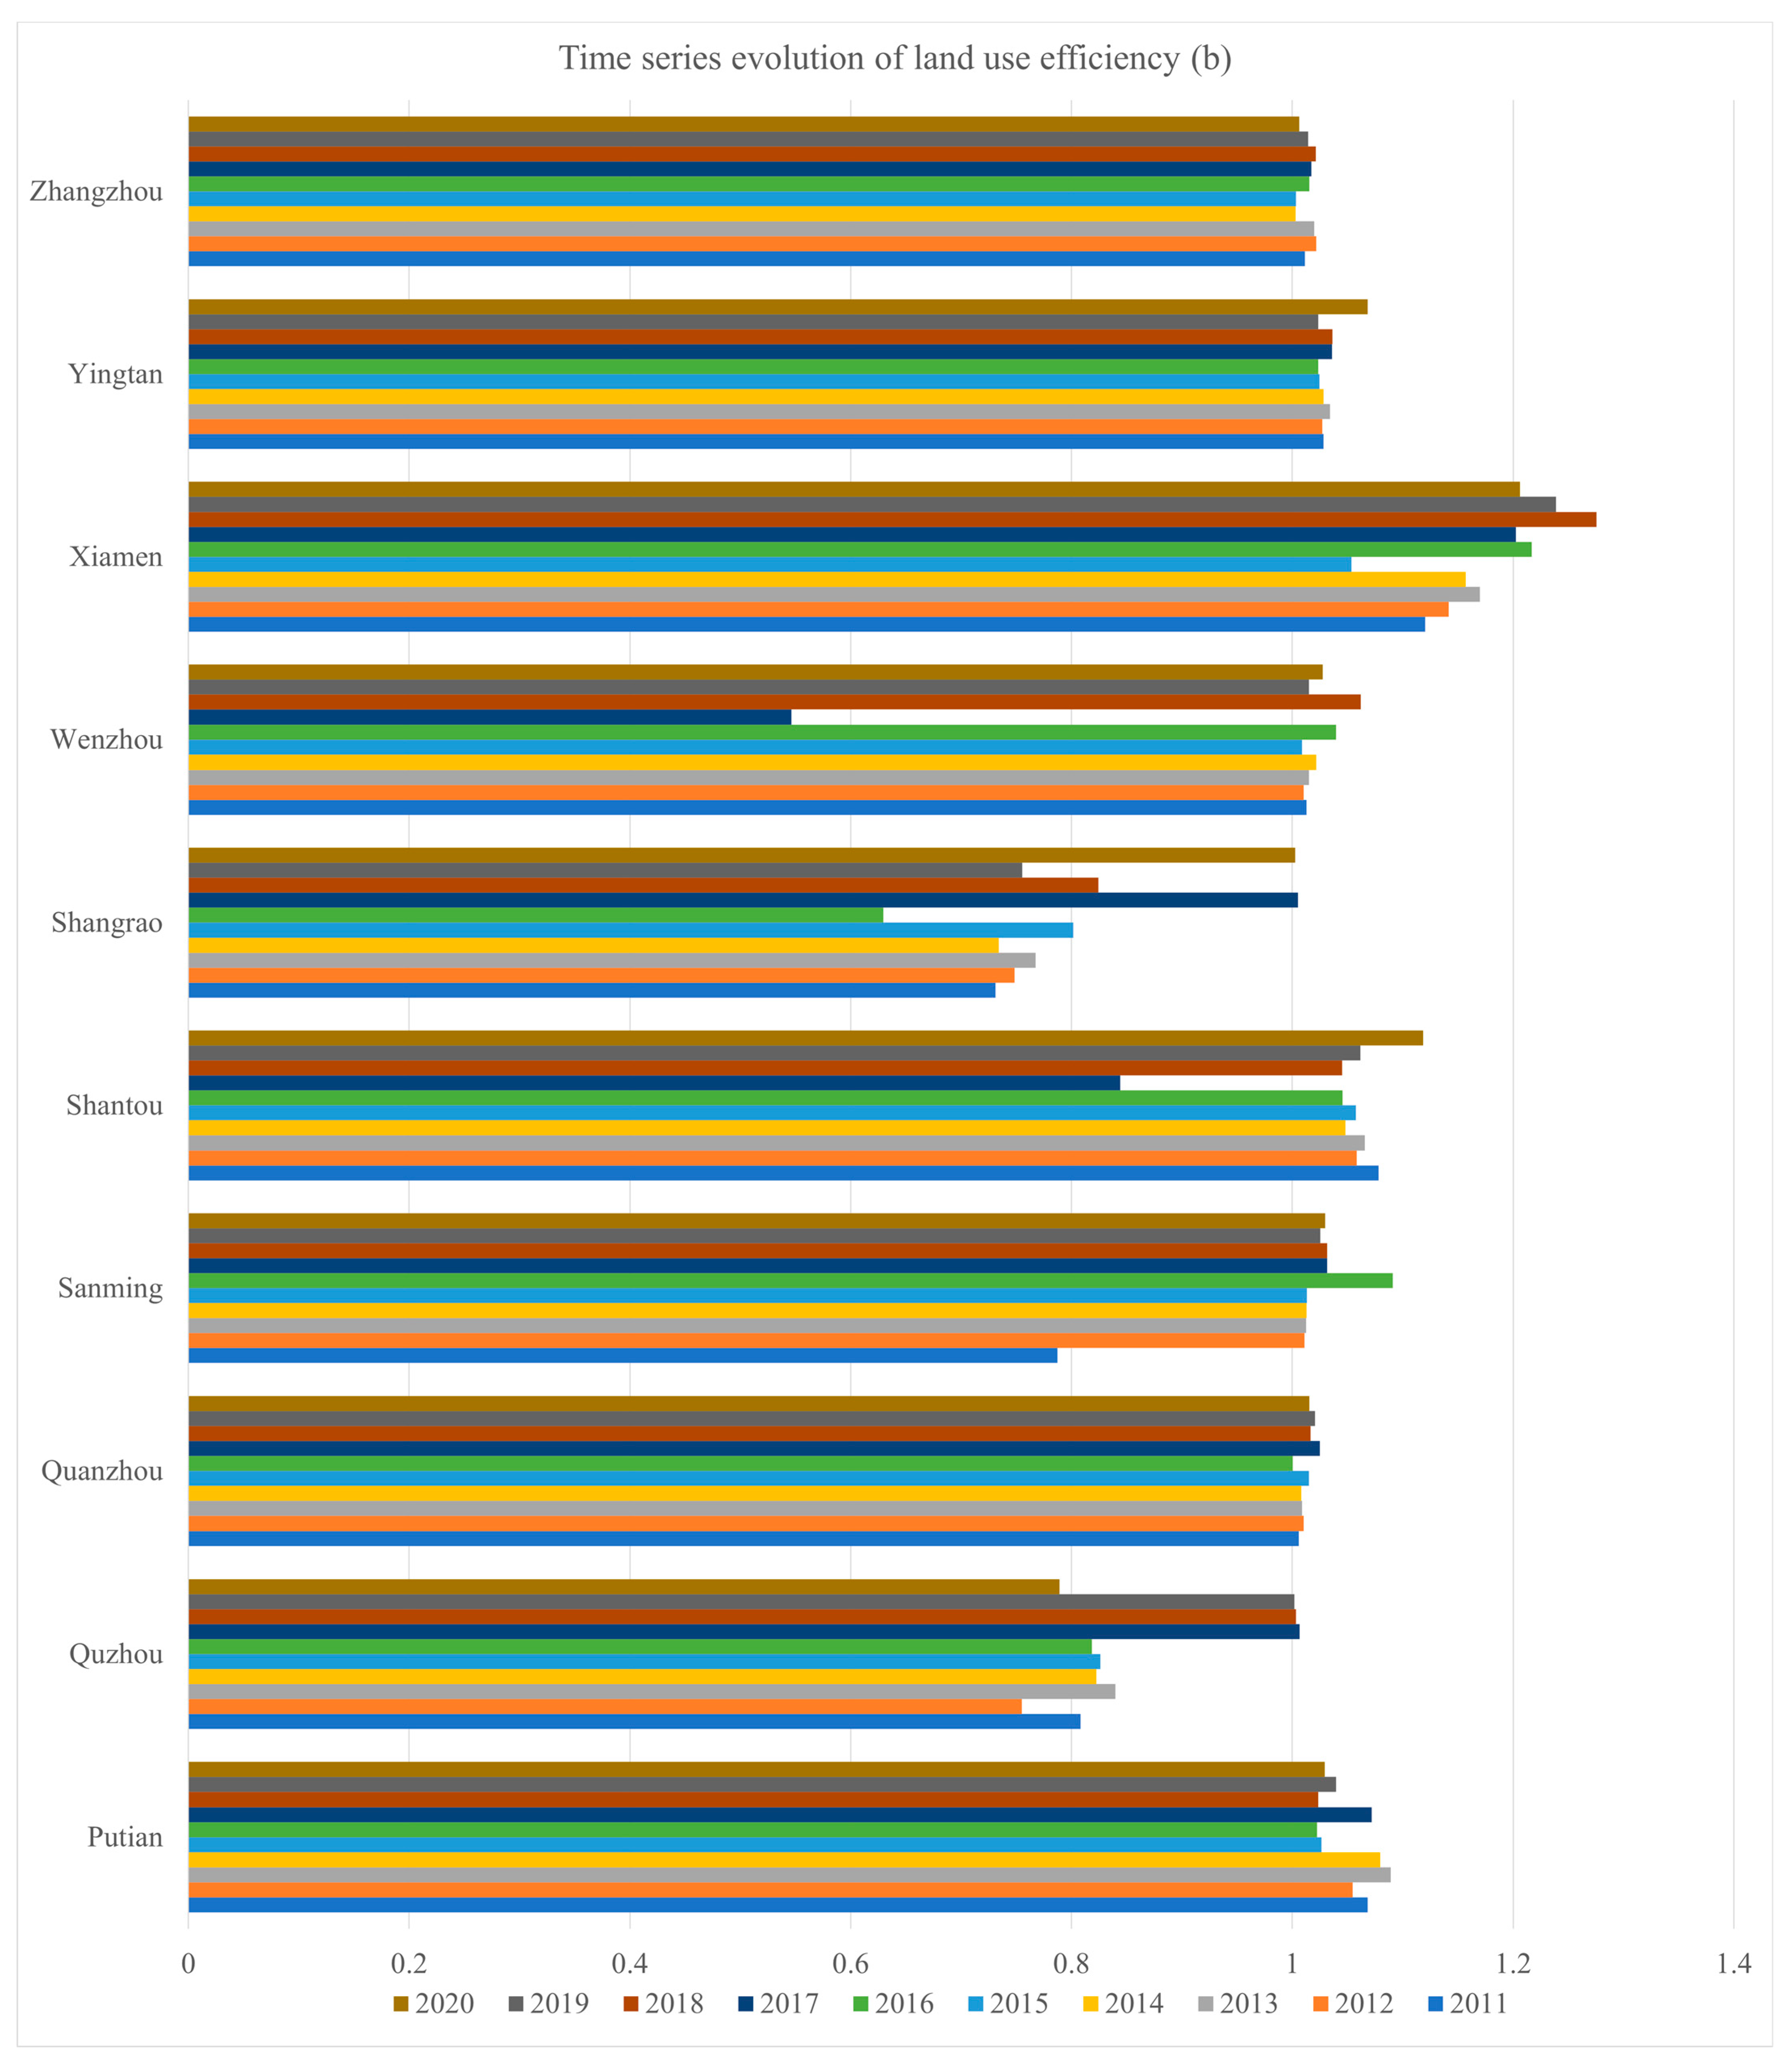
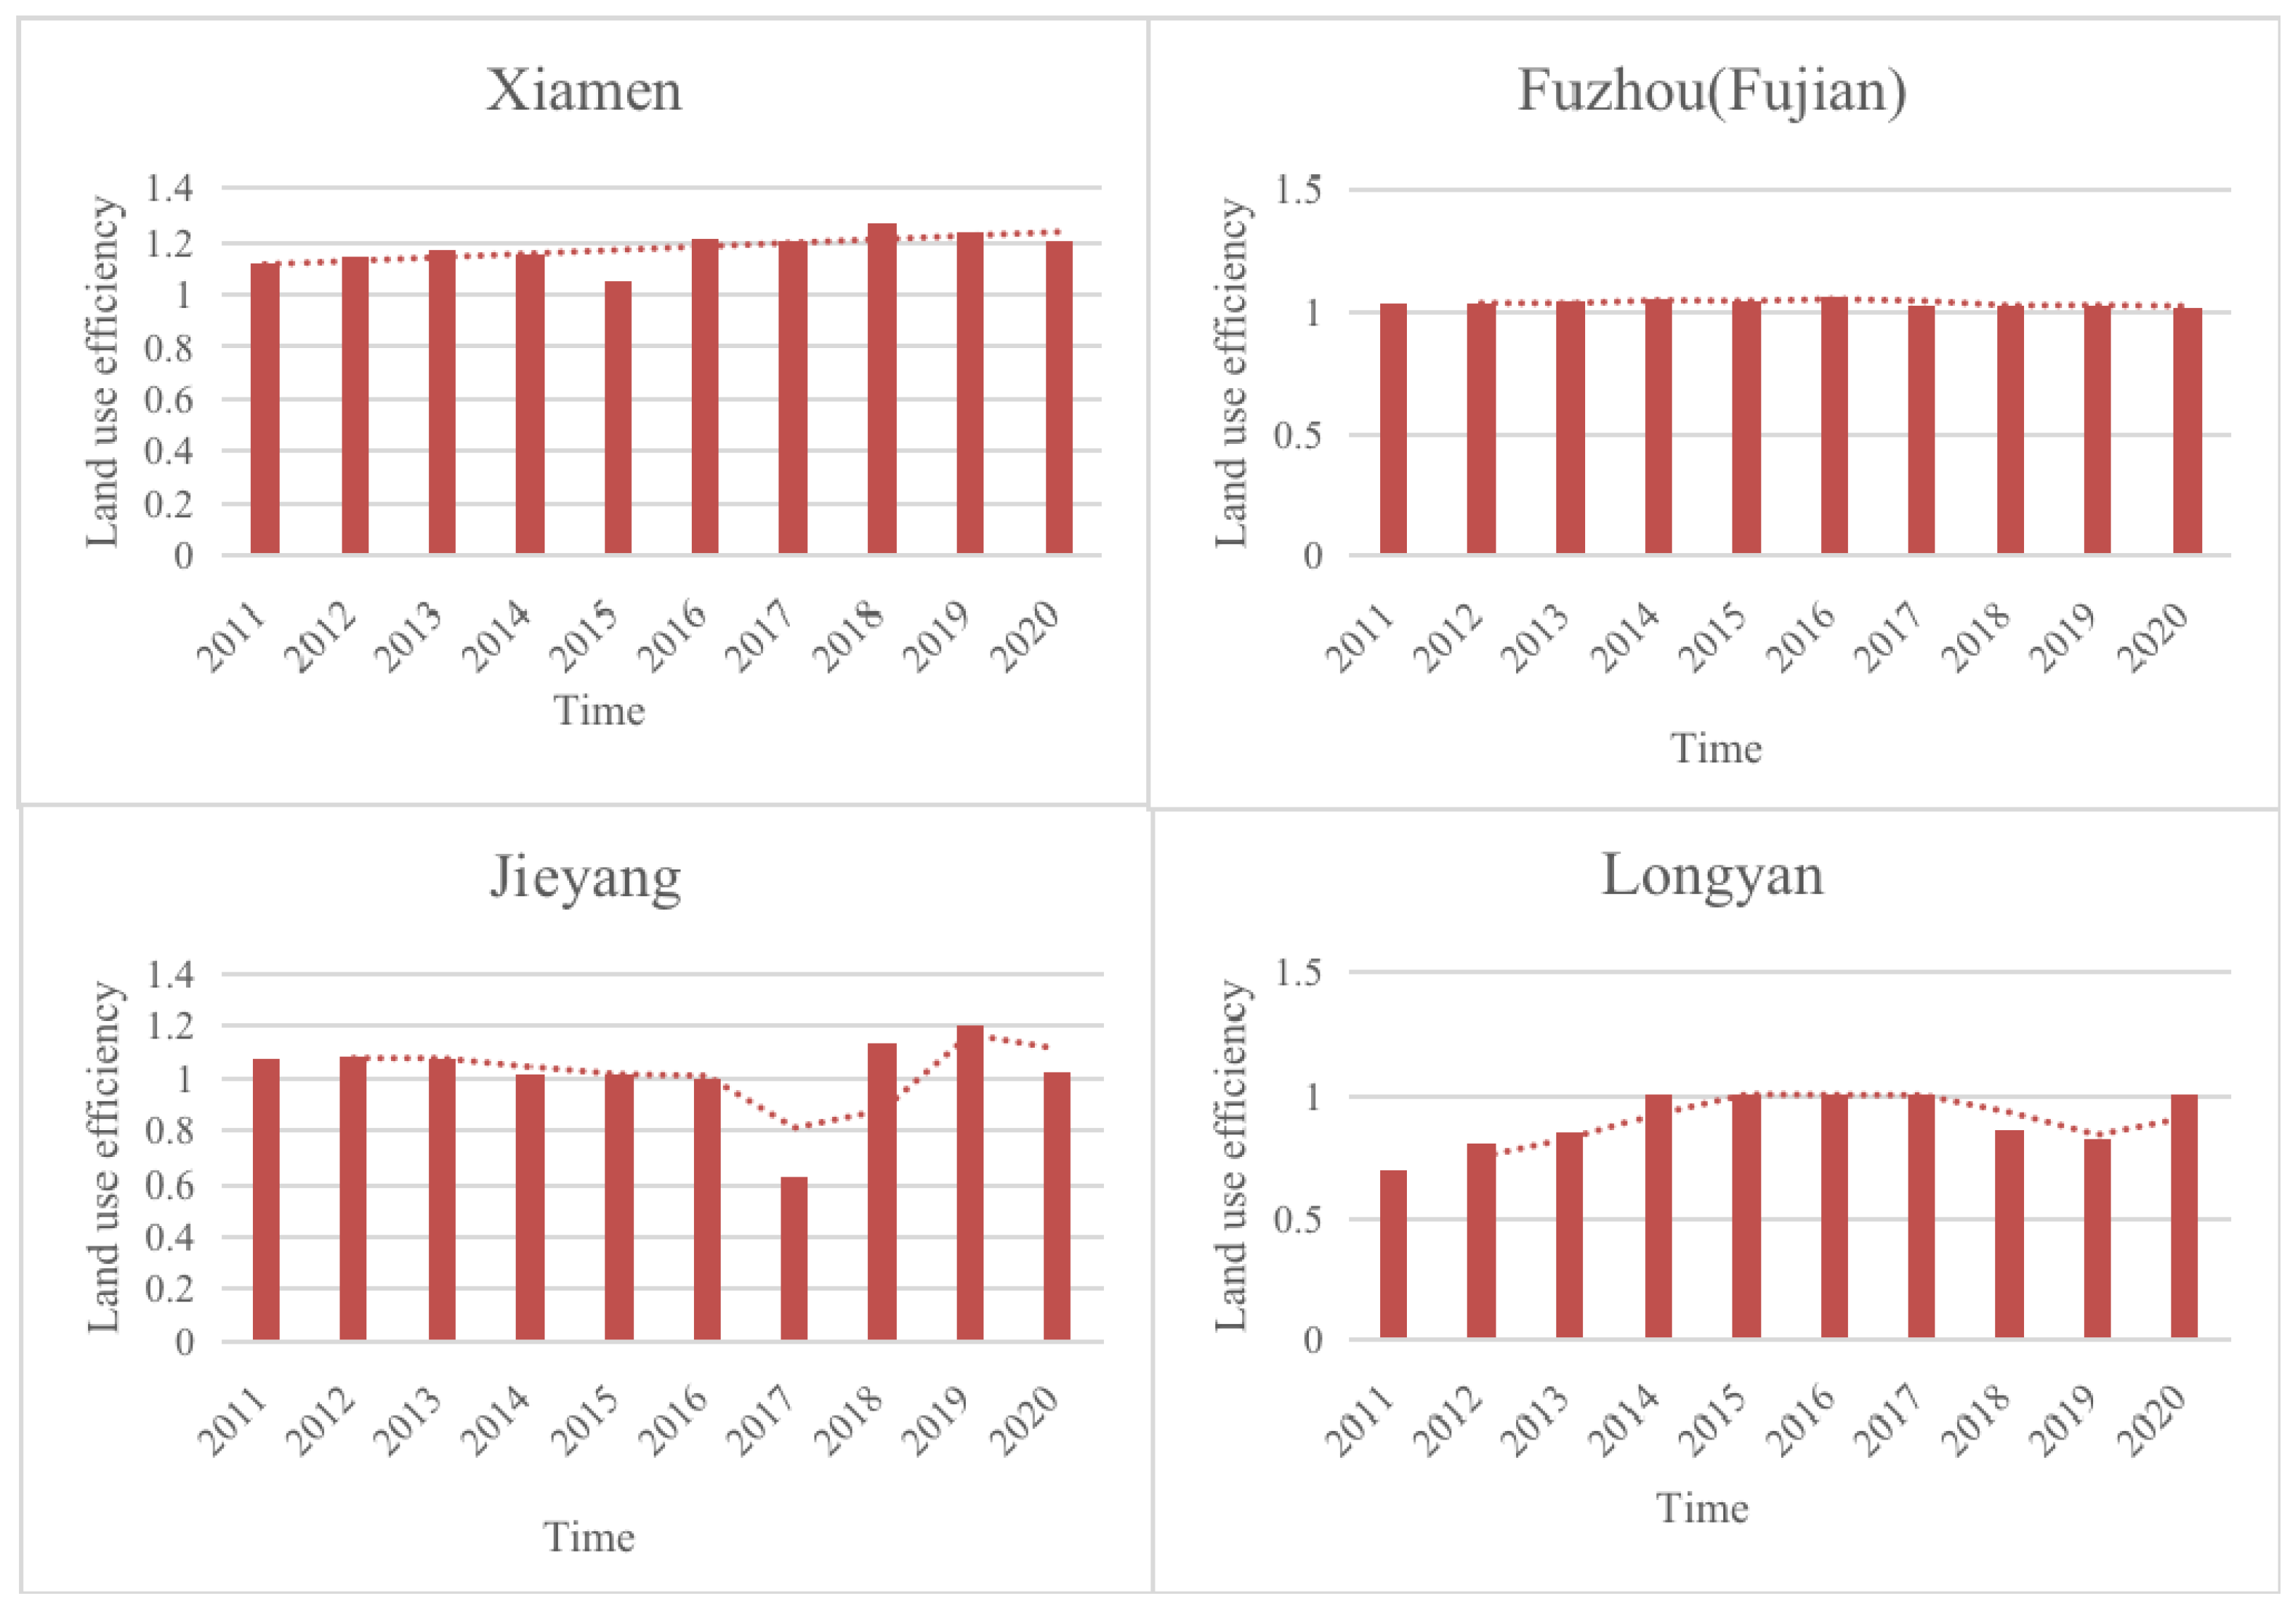
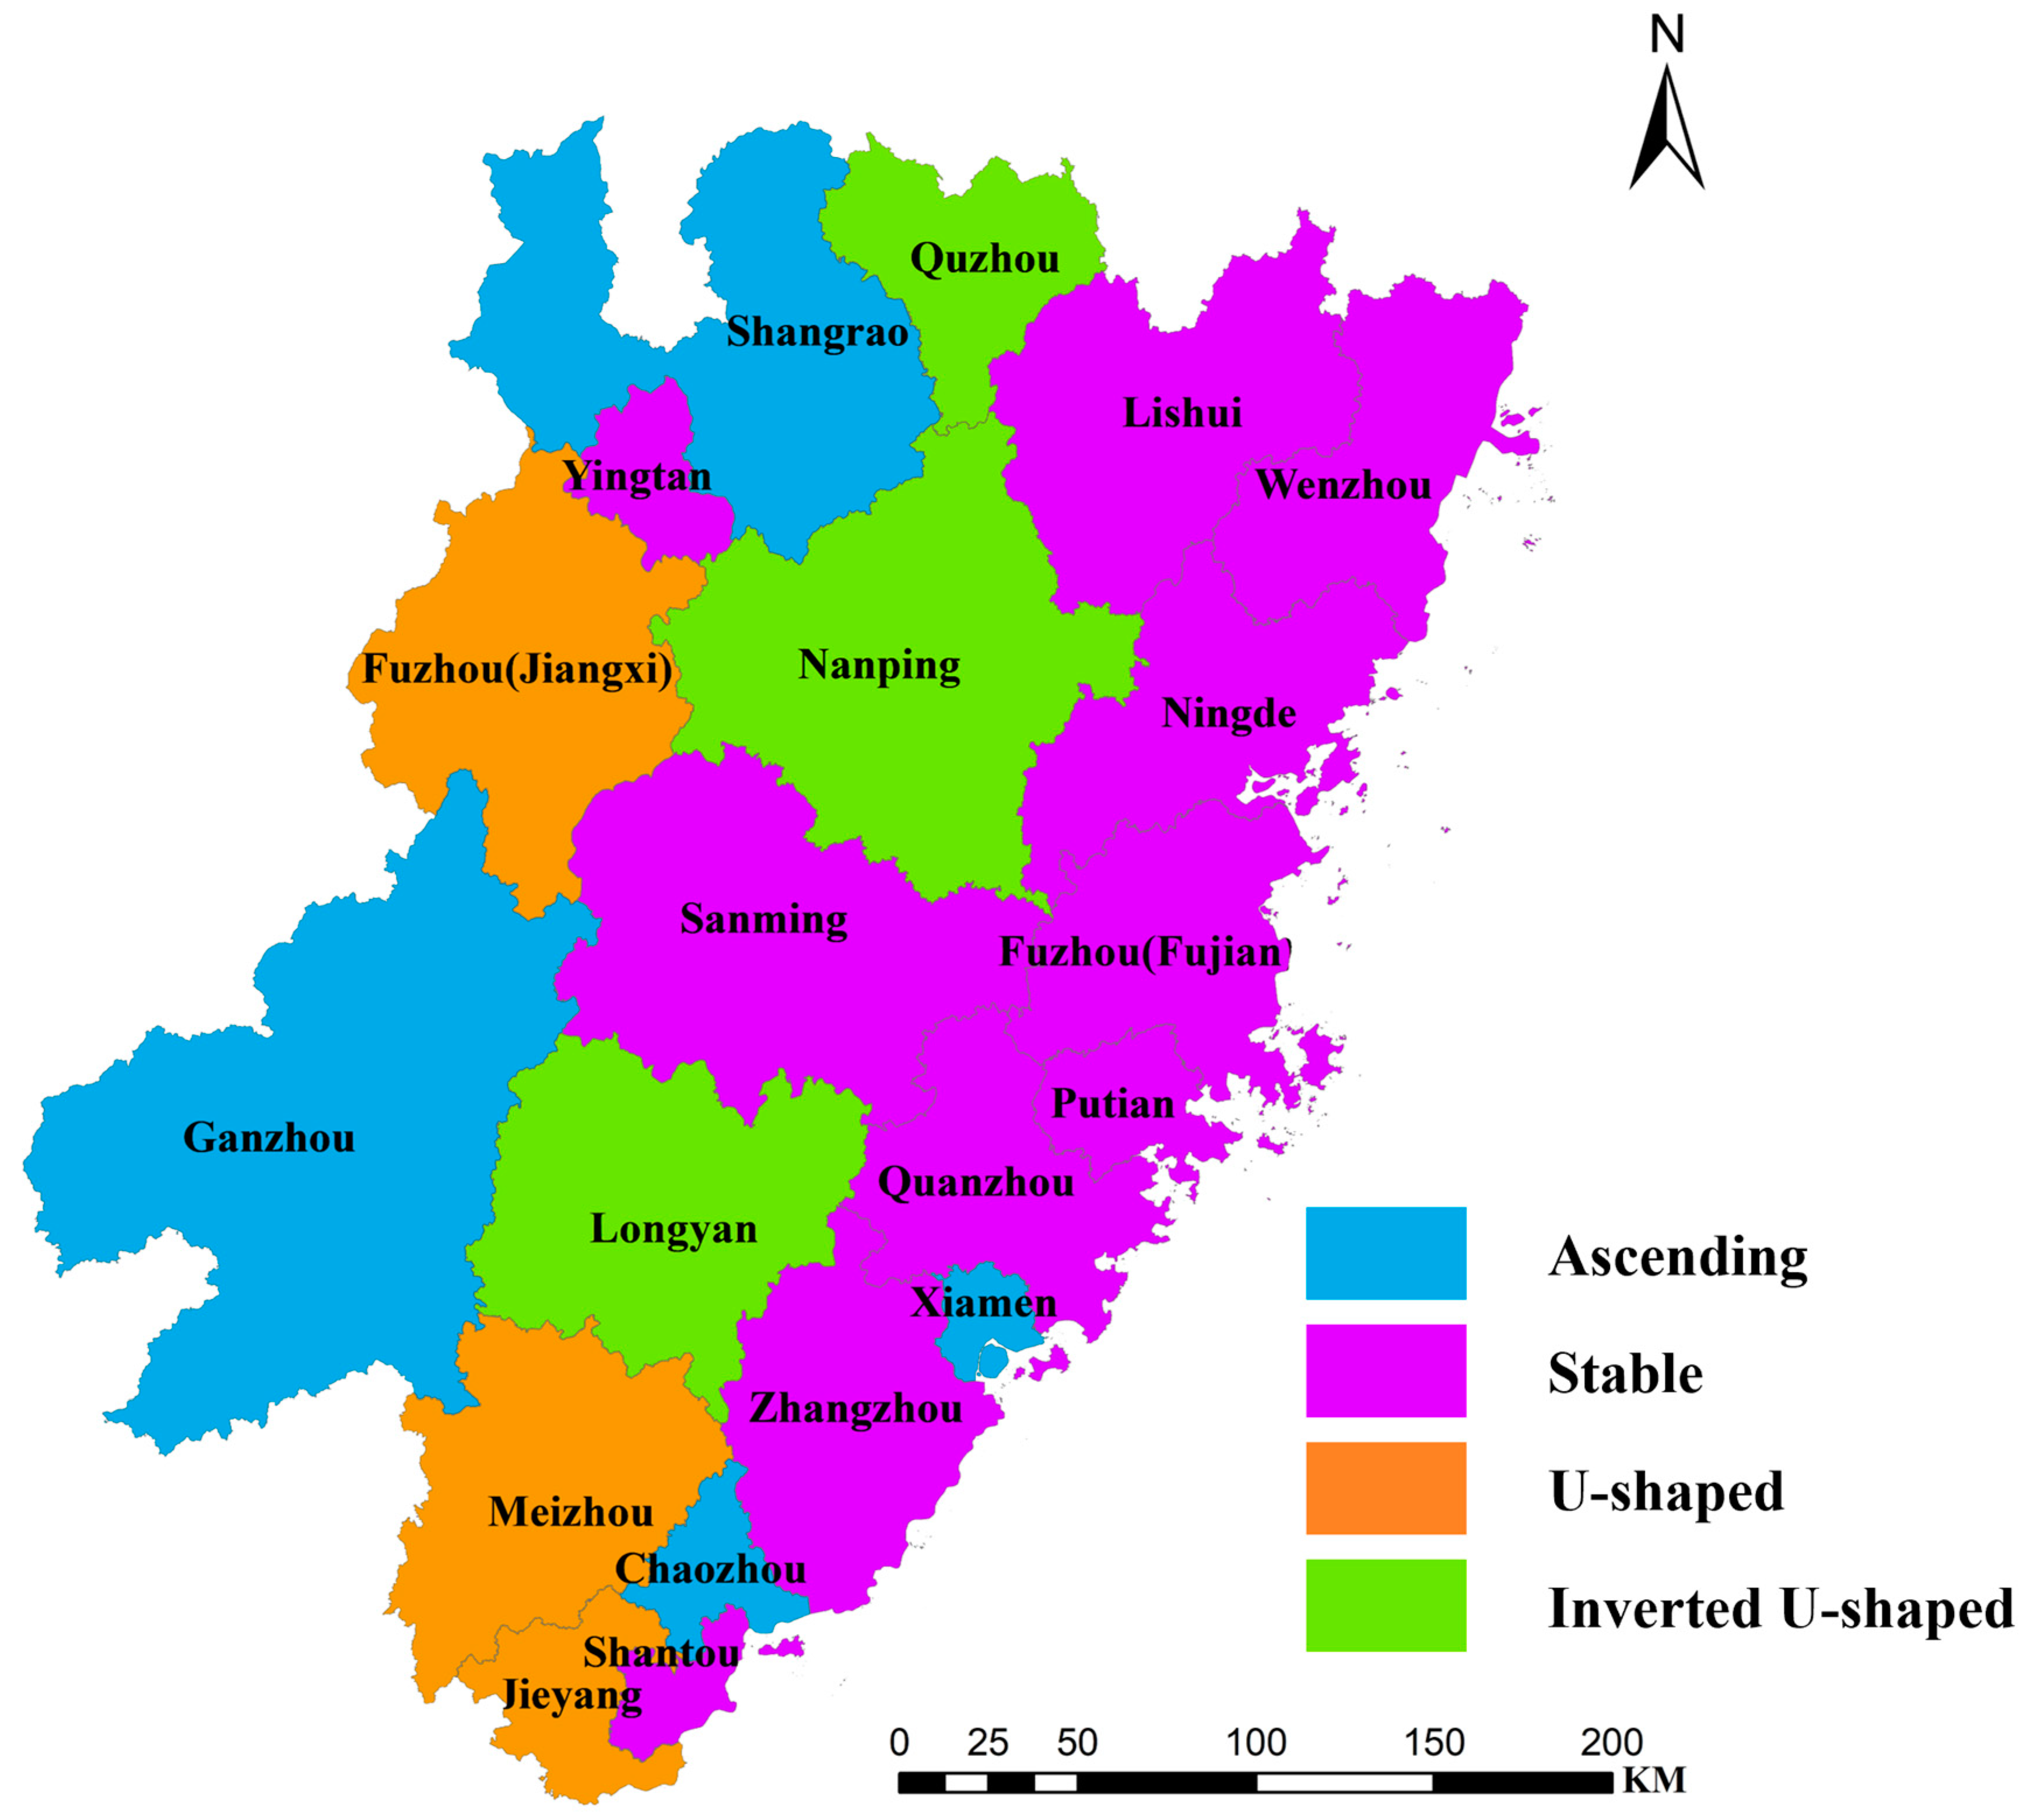
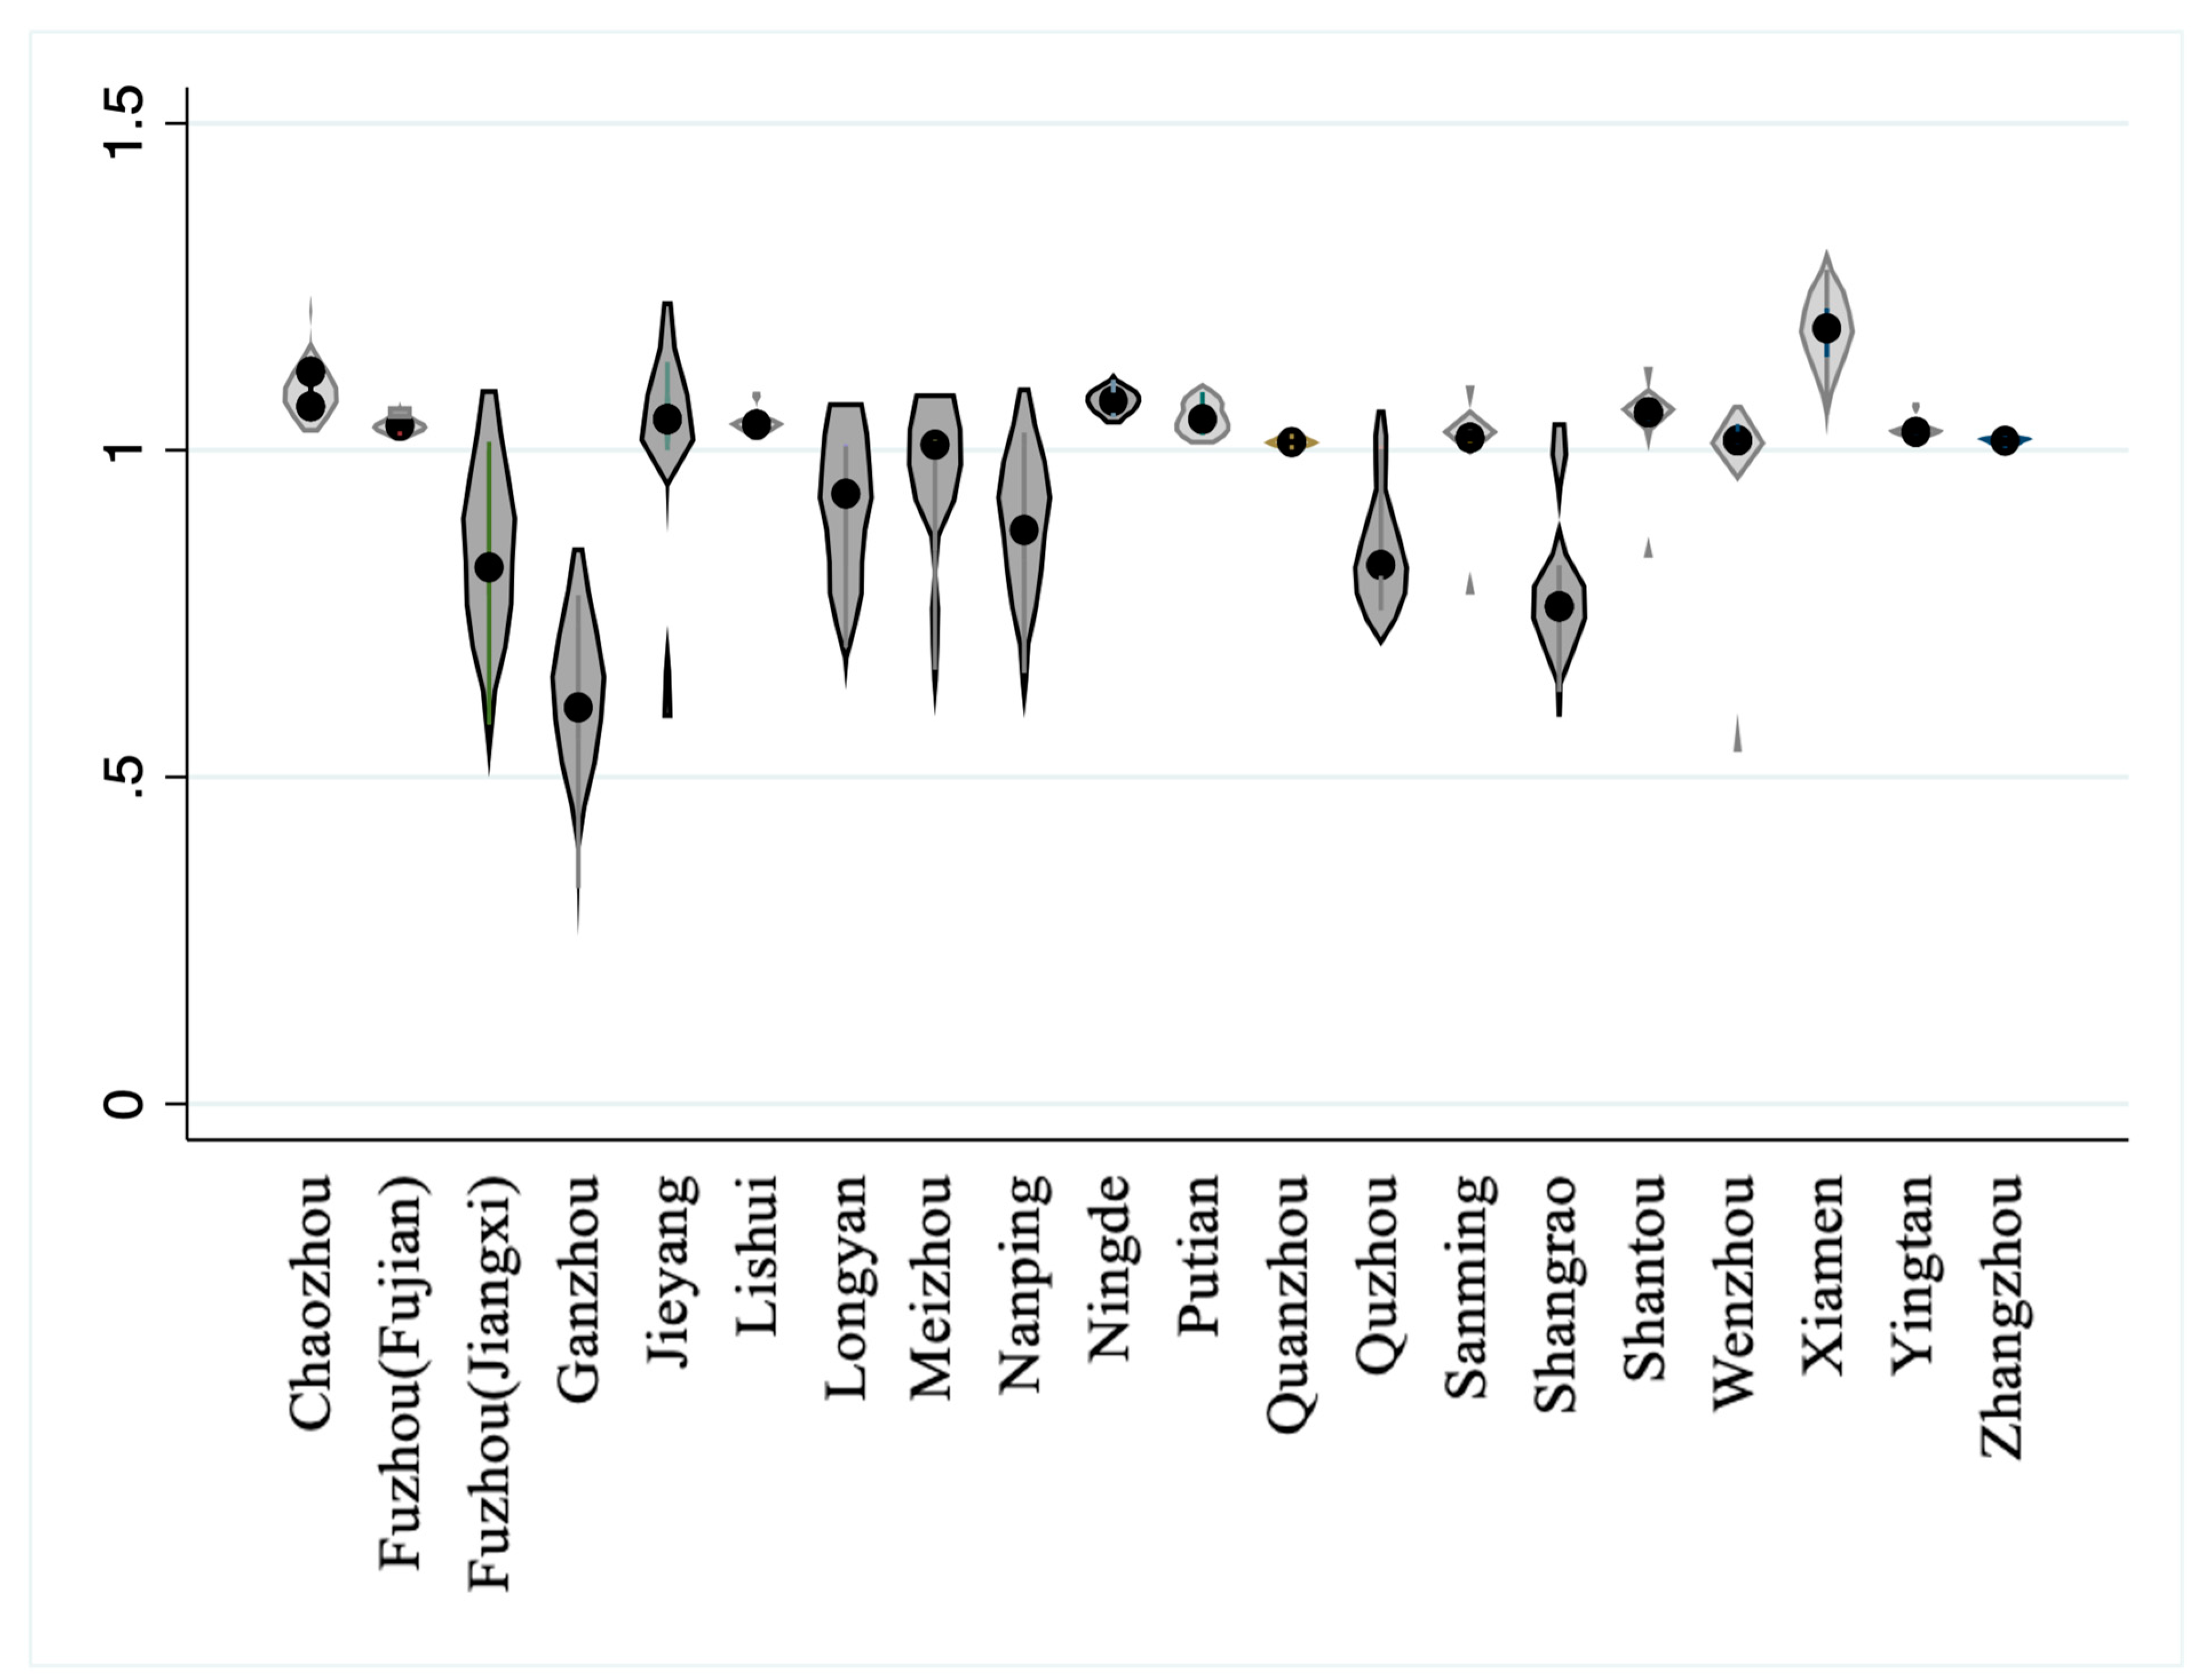
This study found that coastal cities in the WTS Economic Zone generally have higher and more stable urban land use efficiency compared to inland cities. Xiamen, Ningde, Shantou, Chaozhou, and Putian consistently ranked among the top five in urban land use efficiency within the region. Coastal cities may have a greater capacity to leverage trade routes, infrastructure, and investment opportunities, thereby enhancing their urban land use efficiency. This finding is consistent with prior research by Ma and Shi [45], who also noted that urban land use efficiency in coastal regions is superior to that of inland areas. Governments will need to implement differentiated policy approaches to address the distinct challenges and advantages faced by coastal and inland cities. Furthermore, the identification of four distinct patterns in the evolution of urban land use efficiency within the WTS Economic Zone between 2011 and 2020—increasing, stable, “U”-shaped, and inverted “U”-shaped—offers new insights into how different cities respond to various land development pressures and policies. The improvement or stability observed in most cities suggests an overall trend of betterment or maintenance in land use practices. The significant fluctuations seen in some cities, as indicated by the “U”-shaped and inverted “U”-shaped patterns, underscore their vulnerability to economic, social, or environmental shocks. These findings fill a gap in current research by providing detailed temporal and spatial analyses of urban land use efficiency trends in the WTS Economic Zone. This study sets the stage for further exploration of the factors driving these varied patterns and the long-term sustainability of urban land use practices in the region.
(3)
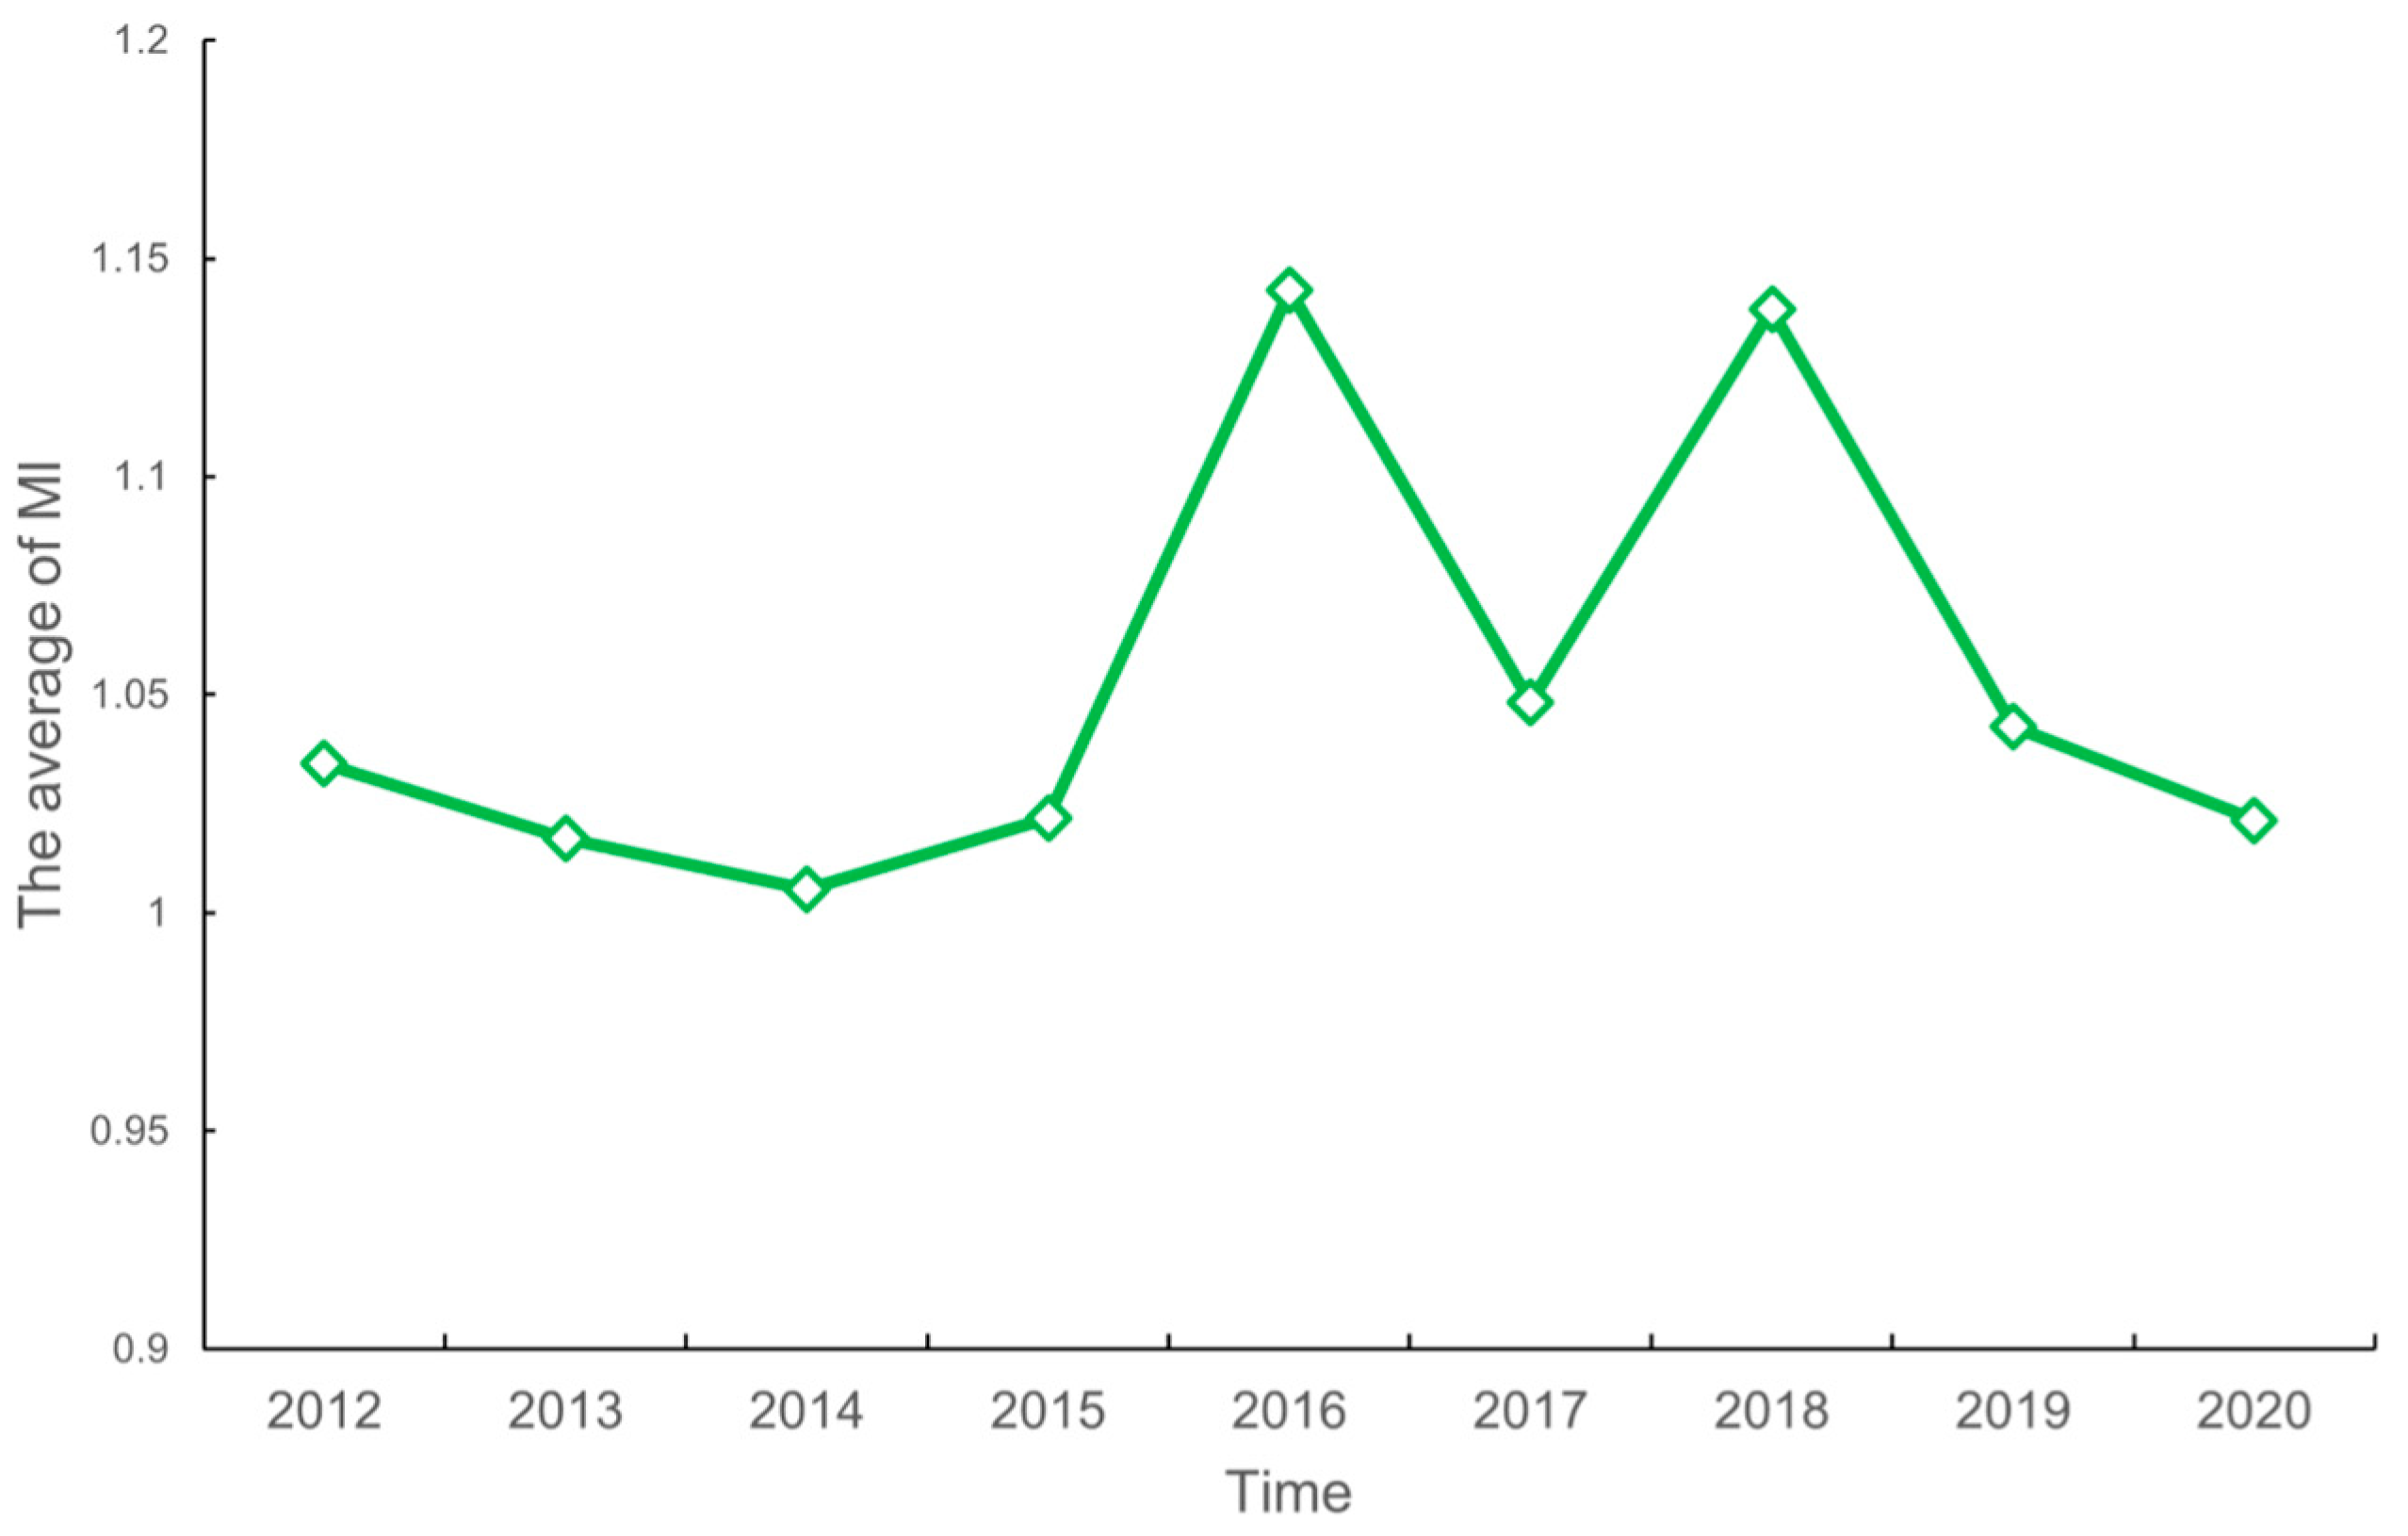
The observed right “M”-shaped trend in the TFP index from 2011 to 2020 within the WTS Economic Zone reveals inherent volatility in productivity growth across the region. This pattern, characterized by alternating periods of stability, growth, and decline, underscores the cyclical nature of economic development, where phases of expansion are followed by contractions. These fluctuations can be attributed to factors including economic policies, external market conditions, and internal shifts in industrial or technological capabilities. In addition, technological change being identified as the primary driver of TFP growth in urban land use highlights the critical role of innovation in enhancing productivity. These findings align with Zhu et al. [46], affirming that technological progress significantly enhances urban land use efficiency. Moreover, input-biased technological change (IBTC) proved more advantageous than output-biased technological change (OBTC). This suggests that the most effective approach to enhancing productivity in the region should focus on increasing the efficiency of inputs like labor, capital, and materials, rather than simply boosting output quantity or quality. This insight is vital for policymakers and urban planners aiming to foster economic growth and productivity, highlighting the importance of promoting an environment supportive of input-oriented technological innovations.
(4)
This study revealed that all 20 cities experienced positive growth in their TFP index and TC, underscoring the success of technological innovation as a key driver of productivity in the region. However, there are slight variations in EC, with cities such as Fuzhou (Fujian), Ningde, Putian, and Zhangzhou experiencing declines. This indicates that relying solely on technological progress is insufficient to ensure sustained productivity growth. These findings contribute to the broader discourse on productivity dynamics by highlighting that technological innovation alone cannot guarantee continuous growth. This study emphasizes the importance of optimizing resource allocation and refining operational processes to supplement technological advancements. This combined approach ensures that cities can fully capitalize on technological progress to achieve productivity improvements. While previous research has predominantly focused on technological change, it has often overlooked the operational factors that facilitate or hinder its effective implementation. Future studies should investigate the causes behind the decline in EC in these cities and develop strategies to mitigate these issues.
(5)
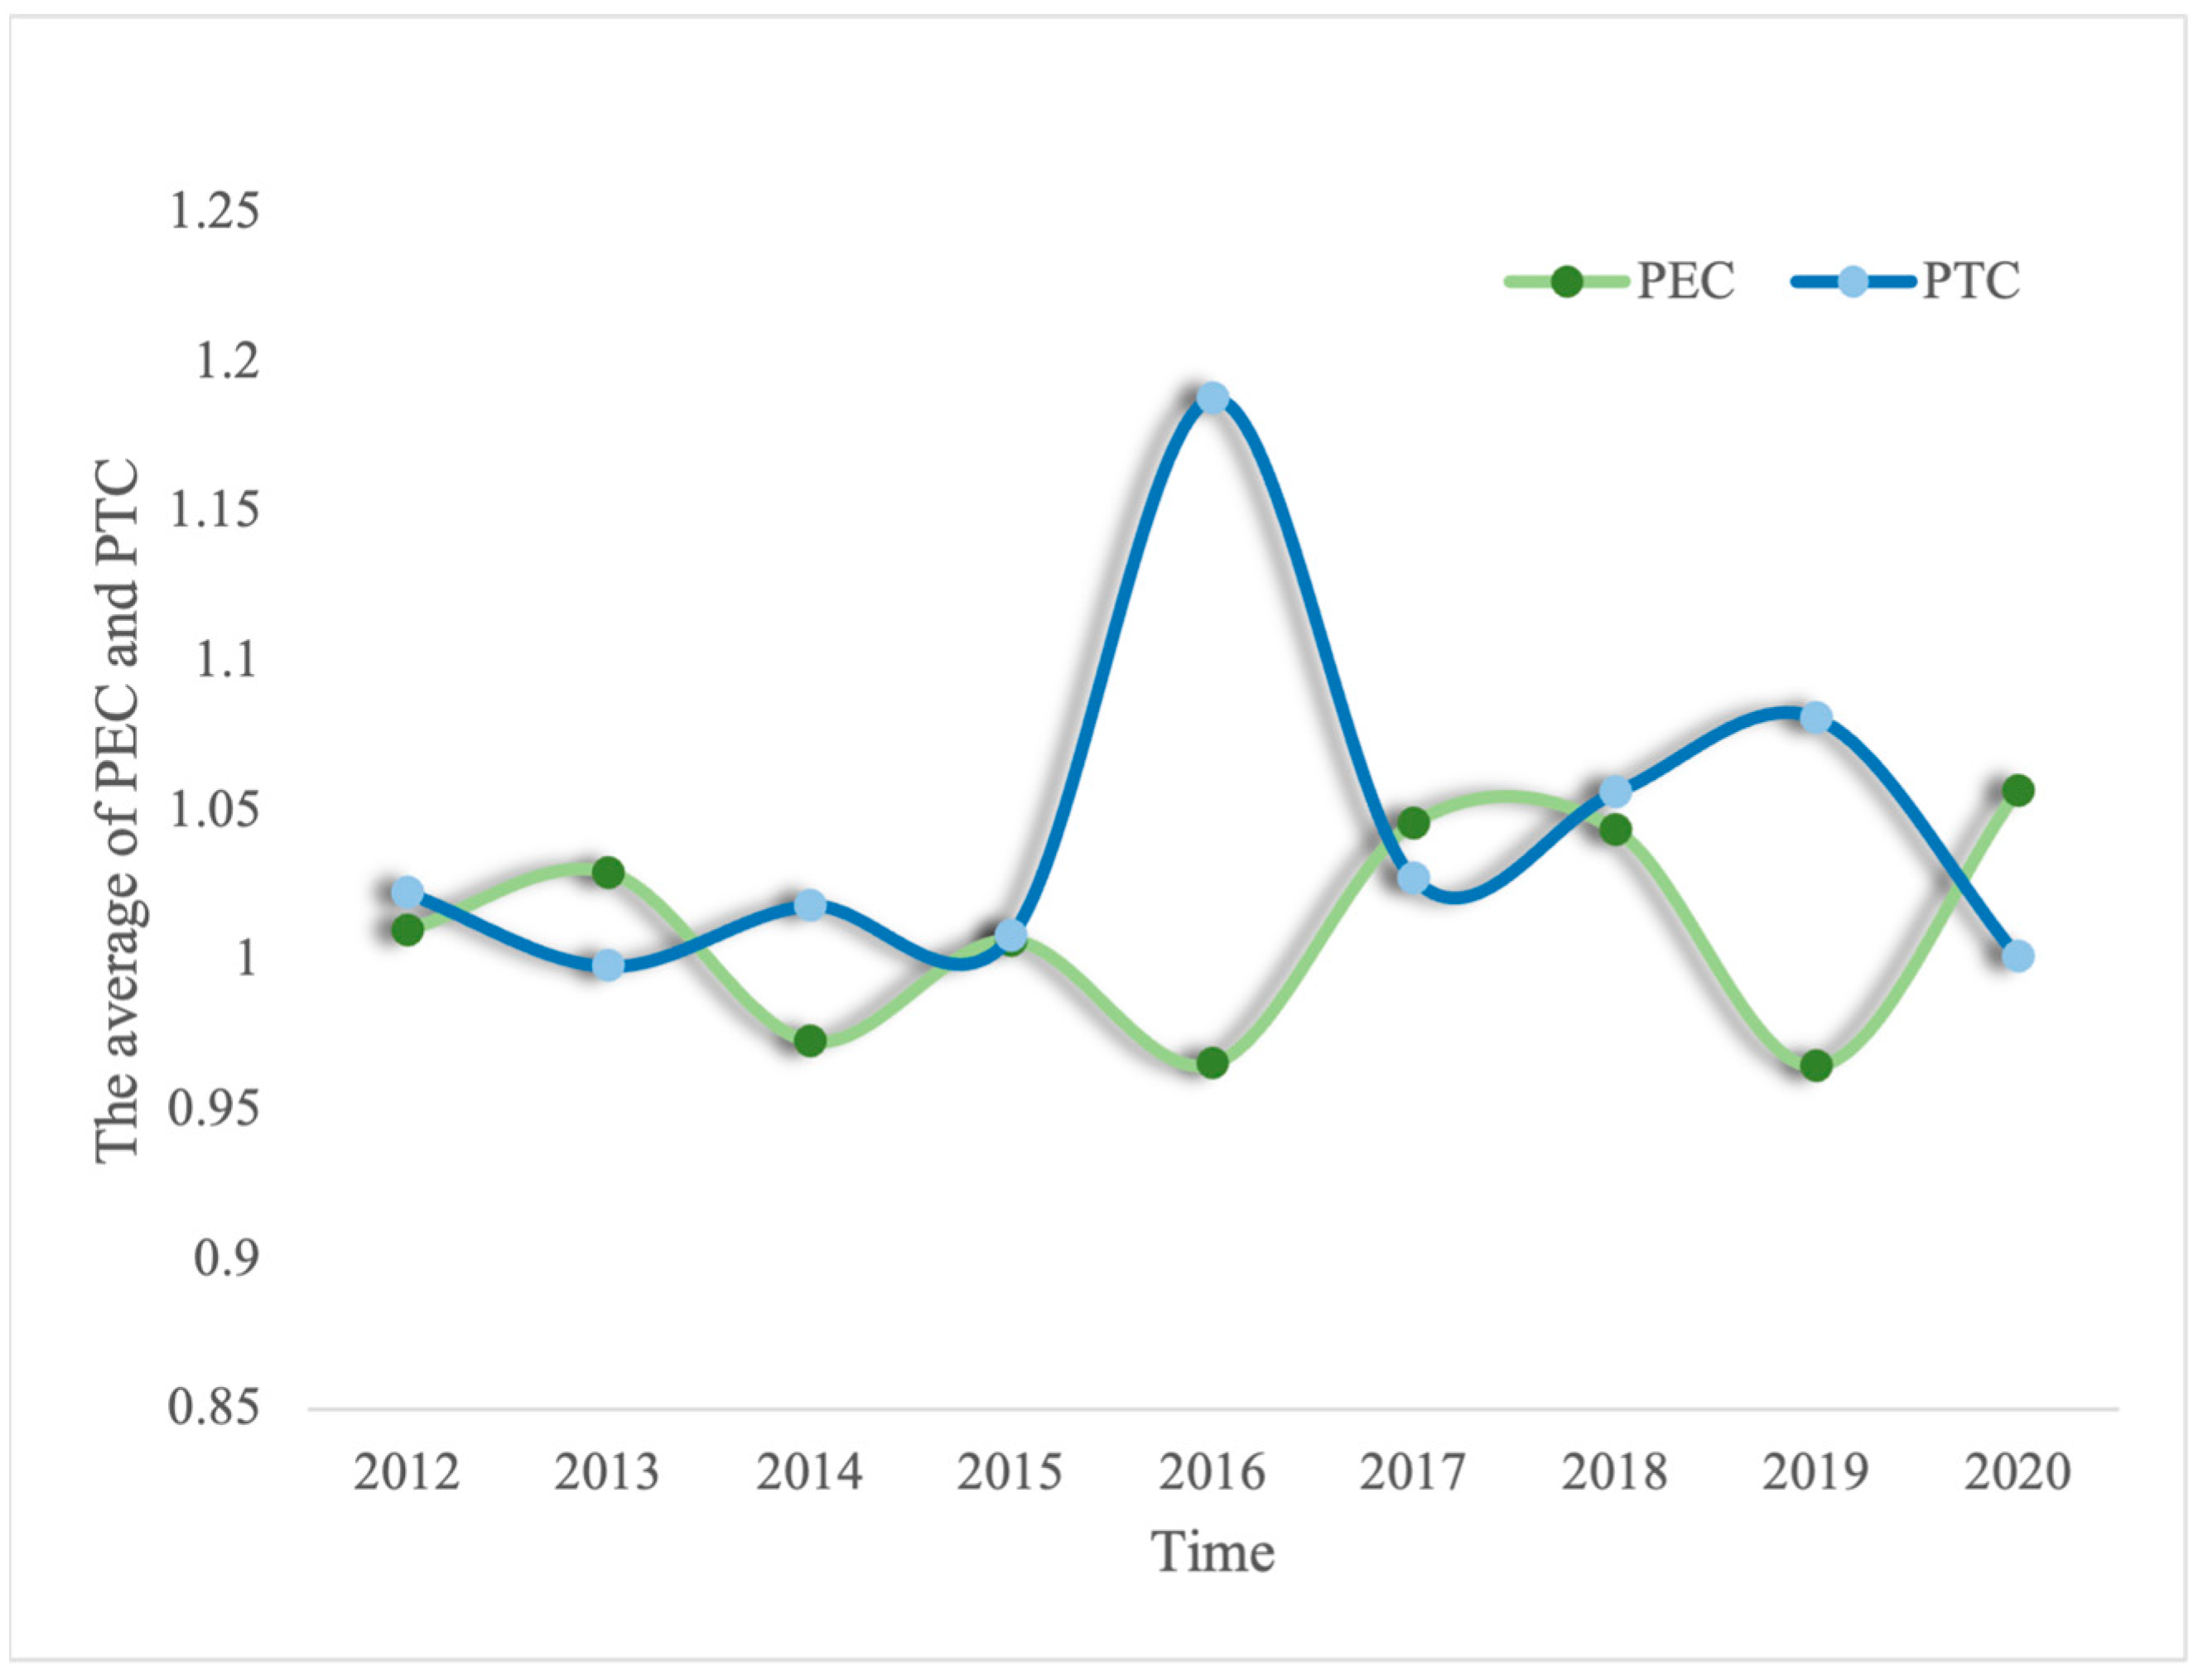
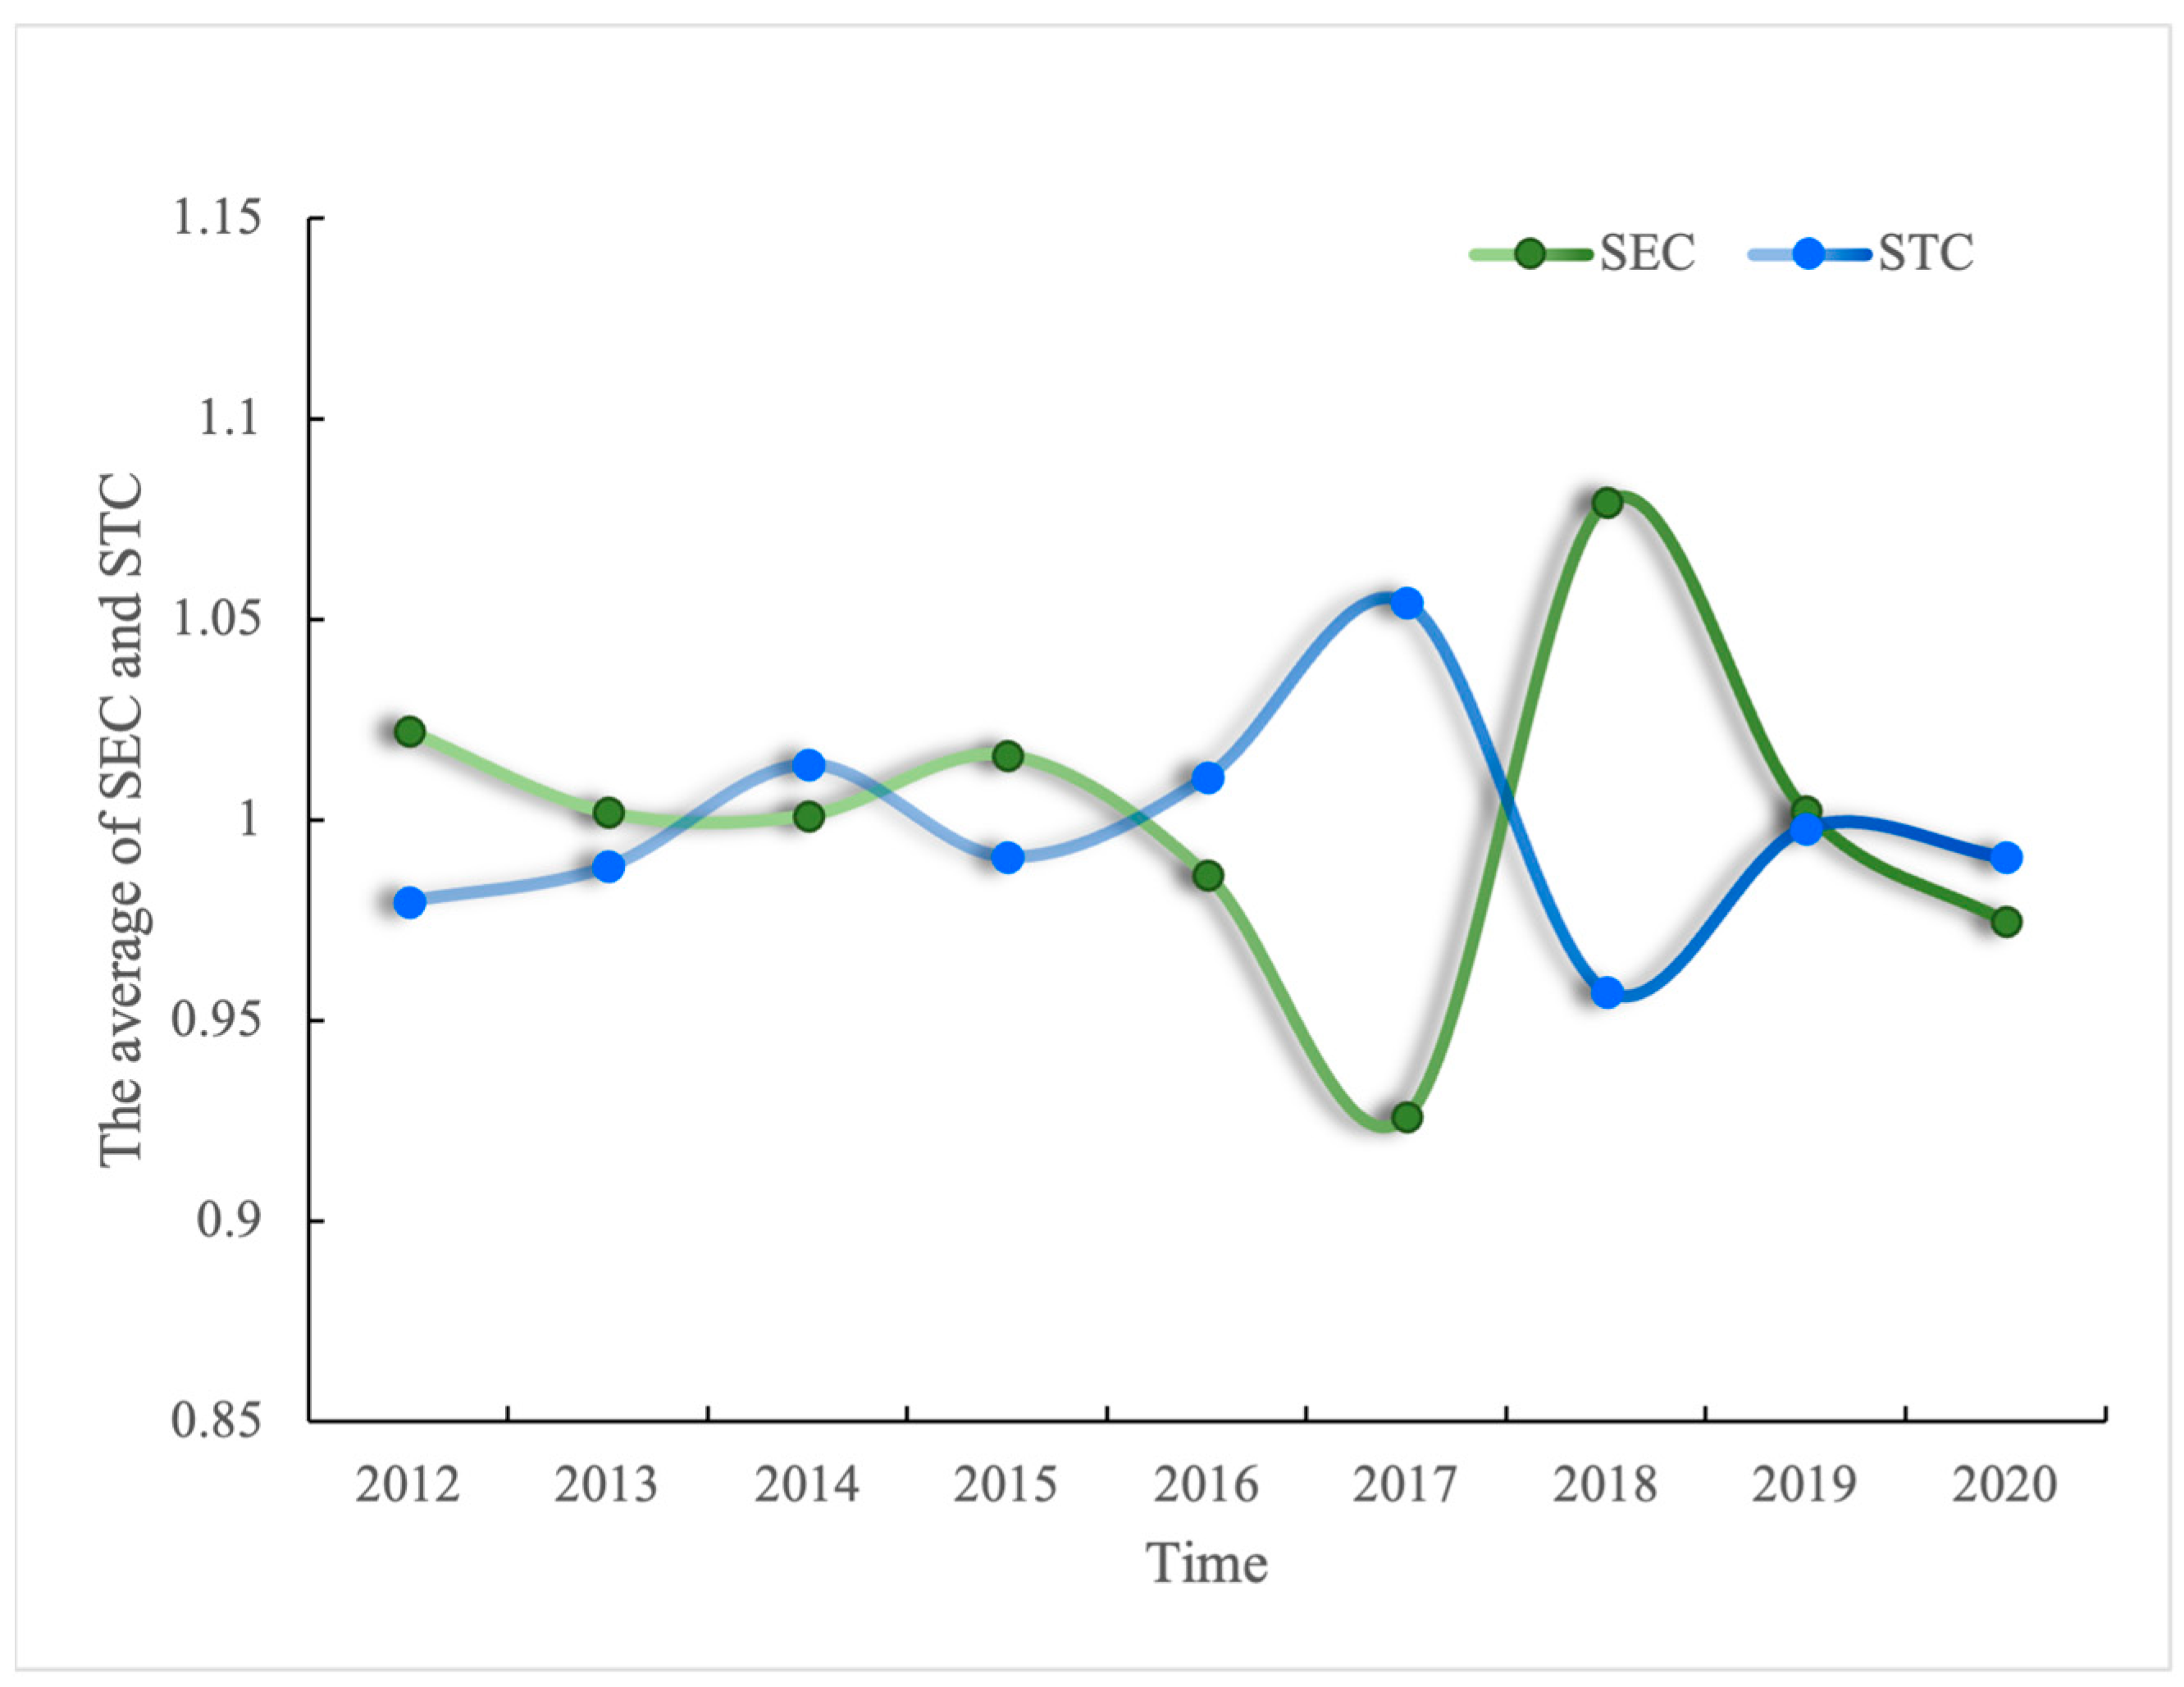
For the four ML index decompositions, only the PTC showed a significant upward trend, indicating that the “fluctuating rise” in the ML index of urban land use in the WTS Economic Zone from 2009 to 2017 was mainly due to improvements in the PTC. This observation underscores the vital role of technological progress in improving urban land use efficiency, highlighting the effectiveness of the drivers behind technological advancements during the studied period. However, the average fluctuation values of the Scale Efficiency Change (SEC) and Scale Technological Change (STC), around 1, suggest that the interaction between economic scale and technological progress is limited. This is a significant finding, as it contributes to the broader discourse on the relationship between economic growth and technological innovation. It indicates that, despite technological advancements, the economic scale has not sufficiently complemented these improvements to maximize urban land use efficiency. The weak interaction between these factors suggests that current strategies might not fully harness the potential of technological progress. Future research should explore how cities can better align their economic scale with technological innovation to achieve more sustainable and efficient land use practices.

5. Policy Implications

Based on the research conclusions, this paper provides the following policy recommendations: First, improve land policies according to the development characteristics of the four types of urban land use efficiency: rising, stable, “U”-shaped, and inverted “U”-shaped, tailored to local conditions. Consider the differences in land resource endowments, industrial structure characteristics, and economic development stages of each city, using key cities to drive the development of surrounding areas. Secondly, promote an integrated regional development strategy that enhances cooperation among cities within the WTS Economic Zone. Establish regional planning bodies to coordinate infrastructure projects, environmental conservation efforts, and economic policies. Promote the coordinated development of industries in the WTS Economic Zone, foster advanced industries based on existing industrial bases and resources, eliminate outdated production capacities, and establish a new pattern of sustainable development. Coordinate regional transportation systems, infrastructure, and industrial planning; enhance the supervision and management of resources; and optimize the input structure to improve urban land use efficiency.
Then, given the significant impact of undesirable outputs on urban land use efficiency, a green development orientation should be maintained. Emphasize balancing the input–output efficiency of natural resource systems, avoid blindly exploiting land for wealth, and steer industries toward low-carbon, environmentally friendly, and high-quality development. Strengthen the supervision of emission reduction policies and introduce competition mechanisms to gradually eliminate high energy-consuming, high-pollution, and high-emission enterprises, thereby mitigating the constraint of environmental factors like waste emissions on the high-quality development of urban land use efficiency. Finally, based on the four decomposition indicators of the ML index, understand the intrinsic driving factors for the growth of urban land use total factor productivity. Strengthen collaborative innovation in science and technology and talent development among cities to drive overall regional technological progress. Use technological advancements to support the transformation and upgrading of regional industrial structures, shift away from “environmentally unfriendly” production methods, and improve waste emission management. Coordinate the interaction between the economic scale of urban land use and technological progress according to the economic and industrial technological levels of each city in the WTS Economic Zone, reasonably control the economic scale, and fully leverage the scale economy effects of urban land use development.
Future research can further explore the spatiotemporal dynamics of urban land use efficiency across different urban and rural backgrounds within the region, including how spatial heterogeneity and temporal variations impact urban land use efficiency. Investigating the long-term effects of technological advancements on urban land use efficiency is another promising area, focusing on specific technologies such as smart city initiatives and green technologies and how they influence land use patterns and efficiency. Analyzing the effectiveness of existing land use policies and their impact on urban development and ecological sustainability also represents a novel direction. This might involve case studies of cities that have successfully implemented innovative land use policies. Comparative studies between the WTS Economic Zone and other economic zones in China or internationally can provide valuable insights into best practices and areas for improvement.

Author Contributions

H.X. contributed to the current research ideas and performed the statistical analysis; H.X. and R.Z. wrote the first draft; H.X. and R.Z. contributed to improving the manuscript. All of the authors contributed to the article and approved the submitted version. All authors have read and agreed to the published version of the manuscript.

Funding

This research received no external funding.

Data Availability Statement

Data are available only on request due to privacy and ethical restrictions. The data presented in this study are available on request from the corresponding author.

Conflicts of Interest

The authors declare no conflicts of interest.

References

  1. Huang, M.-Y.; Yue, W.-Z.; He, X. Decoupling relationship between urban expansion and economic growth and its spatial heterogeneity in the Yangtze Economic Belt. J. Nat. Resour. 2018, 33, 219–232. [Google Scholar] [CrossRef]
  2. Shaker, R.R.; Altman, Y.; Deng, C.; Vaz, E.; Forsythe, K.W. Investigating urban heat island through spatial analysis of New York City streetscapes. J. Clean. Prod. 2019, 233, 972–992. [Google Scholar] [CrossRef]
  3. Martinho, V.J.P.D. Efficiency, total factor productivity and returns to scale in a sustainable perspective: An analysis in the European Union at farm and regional level. Land Use Policy 2017, 68, 232–245. [Google Scholar] [CrossRef]
  4. Xie, H.; Chen, Q.; Lu, F.; Wu, Q.; Wang, W. Spatial-temporal disparities, saving potential and influential factors of industrial land use efficiency: A case study in urban agglomeration in the middle reaches of the Yangtze River. Land Use Policy 2018, 75, 518–529. [Google Scholar] [CrossRef]
  5. Liu, Y.; Zhang, Z.; Zhou, Y. Efficiency of construction land allocation in China: An econometric analysis of panel data. Land Use Policy 2018, 74, 261–272. [Google Scholar] [CrossRef]
  6. Chen, Y.; Chen, Z.; Xu, G.; Tian, Z. Built-up land efficiency in urban China: Insights from the general land use plan (2006–2020). Habitat Int. 2016, 51, 31–38. [Google Scholar] [CrossRef]
  7. Wu, C.; Wei, Y.D.; Huang, X.; Chen, B. Economic transition, spatial development and urban land use efficiency in the Yangtze River Delta, China. Habitat Int. 2017, 63, 67–78. [Google Scholar] [CrossRef]
  8. Liu, Y.; Li, J.; Yang, Y. Strategic adjustment of land use policy under the economic transformation. Land Use Policy 2018, 74, 5–14. [Google Scholar] [CrossRef]
  9. He, S.; Yu, S.; Li, G.; Zhang, J. Exploring the influence of urban form on land-use efficiency from a spatiotemporal heterogeneity perspective: Evidence from 336 Chinese cities. Land Use Policy 2020, 95, 104576. [Google Scholar] [CrossRef]
  10. Charnes, A.; Cooper, W.W.; Rhodes, E. Measuring the efficiency of decision making units. Eur. J. Oper. Res. 1978, 2, 429–444. [Google Scholar] [CrossRef]
  11. Cooper, W.W.; Seiford, L.M.; Tone, K. Data Envelopment Analysis: A comprehensive Text with Models, Applications, References and DEA-Solver Software; Springer Science & Business Media: Berlin/Heidelberg, Germany, 2007. [Google Scholar]
  12. Thanassoulis, E. Introduction to the Theory and Application of Data Envelopment Analysis: A Foundation Text with Integrated Software; Kluwer Academic Publishers: Dordrecht, The Netherlands, 2004. [Google Scholar]
  13. Emrouznejad, E.; Amin, G.R. DEA models for handling fractional/incomplete observations: A survey and a new robust model. Math. Comput. Model. 2010, 52, 1169–1177. [Google Scholar] [CrossRef]
  14. Zhu, W.; Xu, L.; Tang, L.; Xiang, X. Eco-efficiency of the Western Taiwan Straits Economic Zone: An evaluation based on a novel eco-efficiency model and empirical analysis of influencing factors. J. Clean. Prod. 2019, 234, 638–652. [Google Scholar] [CrossRef]
  15. Ge, X.J.; Liu, X. Urban Land Use Efficiency under Resource-Based Economic Transformation—A Case Study of Shanxi Province. Land 2021, 10, 850. [Google Scholar] [CrossRef]
  16. Qiu, Y.; Sheng, J.; He, X. An analysis on urban land use efficiency based on super-efficiency DEA. J. Phys. Conf. Ser. 2021, 1873, 012051. [Google Scholar] [CrossRef]
  17. Li, X.; Zhao, L.; Chang, X.; Yu, J.; Song, X.; Zhang, L. Spatial and temporal evolution of the eco-efficiency of cultivated land use in the region around Beijing–Tianjin based on the Super-EBM model. Front. Ecol. Evol. 2023, 11, 1297570. [Google Scholar] [CrossRef]
  18. Zhou, Y.; Chen, Y.; Hu, Y. Assessing Efficiency of Urban Land Utilisation under Environmental Constraints in Yangtze River Delta, China. Int. J. Env. Res. Public Health 2021, 18, 12634. [Google Scholar] [CrossRef] [PubMed]
  19. Zhao, J.; Zhu, D.; Cheng, J.; Jiang, X.; Lun, F.; Zhang, Q. Does regional economic integration promote urban land use efficiency? Evidence from the Yangtze River Delta, China. Habitat Int. 2021, 116, 102404. [Google Scholar] [CrossRef]
  20. Gao, X.; Zhang, A.; Sun, Z. How regional economic integration influence on urban land use efficiency? A case study of Wuhan metropolitan area, China. Land Use Policy 2020, 90, 104329. [Google Scholar] [CrossRef]
  21. Shen, J.; Zhang, Y.; Chen, X.; Li, M.-C. Ecological protection on the West Coast of Taiwan Strait under economic zone construction: A case study of land use in Yueqing. Open Geosci. 2023, 15, 20220530. [Google Scholar] [CrossRef]
  22. Chen, W.; Shen, Y.; Wang, Y.; Wu, Q. The effect of industrial relocation on industrial land use efficiency in China: A spatial econometrics approach. J. Clean. Prod. 2018, 205, 525–535. [Google Scholar] [CrossRef]
  23. Xia, K.; Guo, J.-K.; Han, Z.-L.; Dong, M.-R.; Xu, Y. Analysis of the scientific and technological innovation efficiency and regional differences of the land–sea coordination in China’s coastal areas. Ocean. Coast. Manag. 2019, 172, 157–165. [Google Scholar] [CrossRef]
  24. Liu, S.; Xiao, W.; Li, L.; Ye, Y.; Song, X. Urban land use efficiency and improvement potential in China: A stochastic frontier analysis. Land Use Policy 2020, 99, 105046. [Google Scholar] [CrossRef]
  25. Li, X.; Hao, J.; Cai, Y.; Sun, Y. Impact of Urbanization and Industrial Collaborative Agglomeration on Land Use Efficiency of Resource-Based Cities in the Yellow River Basin, China. Beijing Da Xue Xue Bao 2023, 59, 681–694. [Google Scholar] [CrossRef]
  26. Li, H.; Qu, J.; Wang, D.; Meng, P.; Lu, C.; Zeng, J. Spatial-temporal integrated measurement of the efficiency of urban land use in Yellow River Basin. Sustainability 2021, 13, 8902. [Google Scholar] [CrossRef]
  27. Zhu, X.; Zhang, P.; Wei, Y.; Li, Y.; Zhao, H. Measuring the efficiency and driving factors of urban land use based on the DEA method and the PLS-SEM model—A case study of 35 large and medium-sized cities in China. Sustain. Cities Soc. 2019, 50, 101646. [Google Scholar] [CrossRef]
  28. Tang, Y.; Wang, K.; Ji, X.; Xu, H.; Xiao, Y. Assessment and spatial-temporal evolution analysis of urban land use efficiency under green development orientation: Case of the Yangtze River Delta urban agglomerations. Land 2021, 10, 715. [Google Scholar] [CrossRef]
  29. Porter, M.E. Competitive Advantage of Nations: Creating and Sustaining Superior Performance; Simon and Schuster: New York, NY, USA, 2011. [Google Scholar]
  30. Zhang, W.; Zou, J.; Wu, Q. A Literature Study of Urban Land Use Efficiency. Resour. Environ. Yangtze Basin 2019, 28, 2030–2039. [Google Scholar]
  31. Yang, Y.; Liu, Y.; Li, Y.; Li, J. Measure of urban-rural transformation in Beijing-Tianjin-Hebei region in the new millennium: Population-land-industry perspective. Land Use Policy 2018, 79, 595–608. [Google Scholar] [CrossRef]
  32. Liu, S.; Ye, Y.; Xiao, W. Spatial-Temporal Differentiation of Urban Land-Use Efficiency in China Based on Stochastic Frontier Analysis. China Land Sci. 2020, 34, 61–69. [Google Scholar]
  33. Banker, R.D.; Charnes, A.; Cooper, W.W. Some models for estimating technical and scale inefficiencies in data envelopment analysis. Manag. Sci. 1984, 30, 1078–1092. [Google Scholar] [CrossRef]
  34. Tone, K. A slacks-based measure of efficiency in data envelopment analysis. Eur. J. Oper. Res. 2001, 130, 498–509. [Google Scholar] [CrossRef]
  35. Zhang, N.; Kim, J.-D. Measuring sustainability by energy efficiency analysis for Korean power companies: A sequential slacks-based efficiency measure. Sustainability 2014, 6, 1414–1426. [Google Scholar] [CrossRef]
  36. Tone, K.; Tsutsui, M. An epsilon-based measure of efficiency in DEA–a third pole of technical efficiency. Eur. J. Oper. Res. 2010, 207, 1554–1563. [Google Scholar] [CrossRef]
  37. Andersen, P.; Petersen, N.C. A procedure for ranking efficient units in data envelopment analysis. Manag. Sci. 1993, 39, 1261–1264. [Google Scholar] [CrossRef]
  38. Chung, Y.H.; Färe, R.; Grosskopf, S. Productivity and undesirable outputs: A directional distance function approach. J. Environ. Manag. 1997, 51, 229–240. [Google Scholar] [CrossRef]
  39. Du, J.; Duan, Y.; Xu, J. The infeasible problem of Malmquist–Luenberger index and its application on China’s environmental total factor productivity. Ann. Oper. Res. 2019, 278, 235–253. [Google Scholar] [CrossRef]
  40. Zofio, J.L. Malmquist productivity index decompositions: A unifying framework. Appl. Econ. 2007, 39, 2371–2387. [Google Scholar] [CrossRef]
  41. Färe, R.; Grifell-Tatjé, E.; Grosskopf, S.; Knox Lovell, C. Biased technical change and the Malmquist productivity index. Scand. J. Econ. 1997, 99, 119–127. [Google Scholar] [CrossRef]
  42. Chen, H.; Su, K.; Peng, L.; Bi, G.; Zhou, L.; Yang, Q. Mixed land use levels in rural settlements and their influencing factors: A case study of Pingba Village in Chongqing, China. Int. J. Environ. Res. Public Health 2022, 19, 5845. [Google Scholar] [CrossRef]
  43. He, G.; Ma, Z.; Wang, X.; Xiao, Z.; Dong, J. Does the improvement of regional eco-efficiency improve the residents’ health conditions: Empirical analysis from China’s provincial data. Ecol. Indic. 2021, 124, 107387. [Google Scholar] [CrossRef]
  44. Finn, D.; McCormick, L. Urban climate change plans: How holistic? Local Environ. 2011, 16, 397–416. [Google Scholar] [CrossRef]
  45. Ma, H.; Shi, L. Assessment of eco-environmental quality of Western Taiwan Straits Economic Zone. Env. Monit Assess 2016, 188, 311. [Google Scholar] [CrossRef] [PubMed]
  46. Ren, Y.; Fang, C.; Li, G. Spatiotemporal characteristics and influential factors of eco-efficiency in Chinese prefecture-level cities: A spatial panel econometric analysis. J. Clean. Prod. 2020, 260, 120787. [Google Scholar] [CrossRef]
Figure 1. Research Area.
Land 13 01298 g001
Figure 2. Kernel density distribution of urban land use efficiency in WTS economic zones in 2011, 2014, 2017 and 2020. Notes: the horizontal axis represents the value range of urban land use efficiency; the vertical axis represents the probability density of data occurrence within the range.
Land 13 01298 g002
Figure 3. The top five cities in terms of urban land use efficiency.
Land 13 01298 g003
Figure 4. Time series evolution of urban land use efficiency ((a) The land use efficiency of Chaozhou, Fuzhou (Fujian), Fuzhou (Jiangxi), Ganzhou, Jieyang, Lishui, Longyan, Meizhou, Nanping, Ningde. (b) The land use efficiency of Putian, Quzhou, Quanzhou, Sanming, Shantou, Shangrao, Wenzhou, Xiamen, Yingtan, Zhangzhou).
Land 13 01298 g004aLand 13 01298 g004b
Figure 5. Trends in Urban Land Use Efficiency Across Four Representative Cities (2011–2020).
Land 13 01298 g005
Figure 6. Four distinct typologies based on observed trends in urban land use efficiency.
Land 13 01298 g006
Figure 7. Violin map of urban land use efficiency of each city in the WTS Economic Zone. Notes: the black dots represent the median efficiency; the width of the violin indicates the probability density of urban land use efficiency at different values.
Land 13 01298 g007
Figure 8. Annual change rate of TFP and decomposition items in the WTS Economic Zone from 2011 to 2020.
Land 13 01298 g008
Figure 9. Annual change rate of TFP and decomposition items in each city from 2011 to 2020.
Land 13 01298 g009
Figure 10. Change of ML index of Urban Land Use in the WTS Economic Zone from 2012 to 2020.
Land 13 01298 g010
Figure 11. Change of PEC and PTC indices of Urban Land Use in the WTS Economic Zone from 2012 to 2020.
Land 13 01298 g011
Figure 12. Change of SEC and STC indices of Urban Land Use in the WTS Economic Zone from 2012 to 2020.
Land 13 01298 g012
Table 1. Cities of research area.
Serial NumberRegionProvince
1ChaozhouGuangdong
2Fuzhou (Fujian)Fujian
3Fuzhou (Jiangxi)Jiangxi
4GanzhouJiangxi
5JieyangGuangdong
6LishuiZhejiang
7LongyanFujian
8MeizhouGuangdong
9NanpingFujian
10NingdeFujian
11PutianFujian
12QuzhouZhejiang
13QuanzhouFujian
14SanmingFujian
15ShantouGuangdong
16ShangraoJiangxi
17WenzhouZhejiang
18XiamenFujian
19YingtanJiangxi
20ZhangzhouFujian
Table 2. Indicator system.
Criterion LevelElement LevelIndex LevelUnit
Input indexFundTotal fixed assets investment100 million yuan
LaborNumber of employees in the secondary and tertiary industriesPeople
GroundConstruction areaSquare kilometer (sq.km.)
Expected output indexEconomic benefitOutput value of the secondary and tertiary industries100 million yuan
Social benefitThe average salary of urban employeesYuan
Environment benefitArea of park green areasHectare
Undesired output indexNegative impact on the environment (three industrial wastes)Industrial wastewater discharged10,000 tons (10,000 t)
Industrial waste gas (SO2) emissionsTon (t)
Industrial smoke (powder) dust productionTon (t)
Disclaimer/Publisher’s Note: The statements, opinions and data contained in all publications are solely those of the individual author(s) and contributor(s) and not of MDPI and/or the editor(s). MDPI and/or the editor(s) disclaim responsibility for any injury to people or property resulting from any ideas, methods, instructions or products referred to in the content.

