Article

Progress in Remote Sensing and GIS-Based FDI Research Based on Quantitative and Qualitative Analysis

School of Geography and Planning, Sun Yat-Sen University, Guangzhou 510275, China
Land 2024, 13(8), 1313; https://doi.org/10.3390/land13081313
Submission received: 28 May 2024 / Revised: 10 August 2024 / Accepted: 15 August 2024 / Published: 19 August 2024
(This article belongs to the Special Issue Recent Progress in RS&GIS-Based Urban Planning)

Abstract

:
Foreign direct investment (FDI) by transnational companies (TNCs) is the primary indicator of urban globalization. The initial publication on the topic of remote sensing and geographic information system-based urban globalization research was published in 1981. However, the number of publications on this topic remains relatively limited. Despite some advances in the field in recent decades, there is currently no comprehensive review of related research, and it is not clear how the different perspectives and views have been developed. Furthermore, previous literature reviews on the utilization of remote sensing and GIS technology in urban development have predominantly employed quantitative methodologies, which has resulted in a paucity of qualitative analysis. In order to address these shortcomings, this paper employs a mixed-methods approach, integrating quantitative and qualitative analyses. This entails the utilization of a combination of the scientometric method and a qualitative literature review method. The findings are as follows: (1) The number of publications is still relatively limited, and research in this area is still in its infancy. (2) Some of the articles are evidently interdisciplinary in nature. (3) Progress has been made in terms of geographic visualization of FDI, macro-environmental research at different scales, global value chains, the micro-geography of TNCs, and globalization of the geo-information industry. (4) The spatial and temporal development pattern, location, and accessibility of FDI have constituted a significant area of research interest in the past. Similarly, the relationships between FDI and regional development, urban growth, land use, and environmental change have emerged as prominent research directions. China’s Belt and Road Initiative is an emerging popular topic. (5) In recent years, there has been a notable increase in the number of papers employing multi-source data and multi-method approaches. (6) The extent of research collaborations between countries is relatively limited, with the majority of such collaborations occurring within the past five years. Finally, based on these research findings, this paper suggests future research directions.

1. Introduction

The impact of globalization on urban and economic development is becoming increasingly pronounced. A substantial body of research has been conducted on the impact of globalization on cities, with particular focus on the concepts of the global city, the world city, and global city–region studies [1,2,3]. Foreign direct investment (FDI) from transnational corporations (TNCs) represents the most significant manifestation of urban globalization [4,5]. It is therefore evident that FDI and TNCs represent important research topics in the context of contemporary globalization. In this paper, foreign direct investment refers to cross-border investment from a company in its home country to another country [4,5]. This encompasses two distinct connotations: a company in its home country purchases a controlling interest in another company in the host country, or establishes a subsidiary or branch in the host country. FDI represents the most significant manifestation of urban globalization. Urban globalization is mainly driven by FDI and TNCs. Since the 21st century, scholars have engaged in a thorough examination of the process by which TNCs reshape the global production landscape and their locally generated interactions from a relational perspective [5,6]. The process of globalization, as evidenced by FDI and TNCs, has significantly altered the use and development of urban land.
Since the inaugural launch of a land remote sensing satellite in the early 1970s, the wider global diffusion of remote sensing expertise and the increasing global transparency of remote sensing knowledge have led to exponential growth in the application of satellite imagery data in scientific institutions, government agencies, non-governmental organizations (NGOs), private companies, and public sectors [7]. Remote sensing has witnessed a remarkable pace of technological advancement, accompanied by a notable trend of multinational collaboration in satellite launch. According to the satellite database of the Union of Concerned Scientists (UCS)1, there were 7560 satellites in orbit as of 1 May 2023. The main purposes of satellite launches are communication, Earth observation, and technology development, accounting for 73.07%, 16.65%, and 4.95% of all launches, respectively. Other purposes include navigation/global positioning, space science, technology demonstration, Earth science, surveillance, space observation, meteorological, Earth/space observation, mission extension technology, educational aims, and platform and satellite positioning. Regarding the country of the operator or owner, 75 countries and regions in the world have their own satellites. It is noteworthy that the earliest involvement of a TNC in a satellite launch was in 1992 for the purpose of conducting space science research. As of 1 May 2023, 105 satellites have been launched with multinational cooperation, representing 1.39% of the total. The global reach of satellite information technologies acts as a primary catalyst for facilitating the flow of data and information across national boundaries [7].
As previously stated in the paper “Remote Sensing in Development”, published in Nature in 1981, remote sensing is a valuable resource in itself [8]. This powerful resource, which can be utilized as a new source of analytical data and a new medium for multinational organizations and academic researchers to access satellite imagery, has the potential to draw more attention to international issues [7]. In scientific research, remote sensing technology is employed in numerous disciplines, including geography, ecology, environmental science, and others. In other words, globalization has contributed to the advancement and improvement of remote sensing technology, which in turn has further contributed to globalization. Remote sensing technology and geographic information systems (GIS) have been widely applied as analytical tools for the investigation of urban globalization, particularly in the context of spatial analysis and map visualization. Nevertheless, research on the impact of remote sensing technology and GIS on urban globalization, particularly with regard to FDI and TNCs, is still in its early stages. Only a limited number of publications have addressed this topic, and no review paper has yet been published.
A literature review is a fundamental research method employed to identify pertinent topics or issues for investigation [9,10]. It serves as the foundation for academic research activities, providing a basis for new research that is anchored in existing knowledge and linked to previous findings [10]. This method entails the identification and retrieval of pertinent literature, the analysis of these sources, and the synthesis of the information in order to develop new insights into the topic [9]. The rationale behind the choice of a literature review should be clearly articulated by the author. This could be achieved by discussing the importance of the topic under investigation, explaining the context that necessitates further exploration, detailing the author’s interest in a specific phenomenon, highlighting emerging trends and shifts in the field, or showcasing recent research developments across various fields [9]. Moreover, a lack of recent literature reviews on a dynamic topic can justify the need for a review [11]. The combination of findings and perspectives from a number of empirical studies makes the literature review a powerful and increasingly relevant research method [9].
In this study, first of all, FDI represents the most significant manifestation of urban globalization. The latter is an important topic that has attracted the attention of a large number of scholars. Geography is one of the main disciplines in studies with a particular focus on FDI and TNCs. Secondly, the geo-information industry has undergone a high degree of internationalization, with the emergence of multinational corporations with significant global impact, such as Maxar Technologies, Airbus Defence and Space, and others. Thirdly, approximately five decades after the launch of the first land remote sensing satellite, satellite information technology has emerged as a significant catalyst for transnational information flow and transnational scientific cooperation. This is evidenced by the global dissemination of GIS technology and the increased transparency of satellite remote sensing data. In light of these developments, some progress has been made in the studies on remote sensing technology and GIS in relation to FDI and TNCs. This scientific field has received attention from scholars, yet no comprehensive review of related research has yet been undertaken. The disparate perspectives and views that have been developed remain unclear. A comprehensive and rigorous literature review forms the foundation and inspiration for substantial and impactful research, aiming to expand knowledge on the topic beyond what is presented in the original literature [11,12,13]. Hence, the objective of this paper is to provide a comprehensive overview of the research on the application of remote sensing and GIS to FDI.
The most challenging aspect of conducting literature reviews is not merely searching for and summarizing past research; it involves developing theoretical directions for future studies [12]. Previous literature reviews on the application of remote sensing and GIS technologies in urban development have been predominantly quantitative, often employing scientometric analytic software. This is exemplified by reviews of GIS-based urban modeling, as evidenced by the work of Sui (1998) [14]. However, these reviews frequently fail to acknowledge the contributions of studies based on qualitative methods. The overreliance on quantitative data and apparent technical sophistication can mislead researchers into assuming that they possess a comprehensive understanding of a subject, while overlooking the fact that not all aspects of a phenomenon can be quantified [15]. For many years, traditional qualitative methods have been extensively used in social science to synthesize the literature [10,13,15]. The continued relevance of qualitative analysis techniques for literature reviews is justified by their continued utility in identifying existing patterns and gaps in research [15]. Narrative literature reviews do not rely on quantitative data to support statistical analysis; instead, they creatively synthesize research findings to focus on core issues rather than merely reporting previous findings [15]. The use of multiple approaches can facilitate a more comprehensive understanding.
In light of the aforementioned considerations, this paper presents a review that employs a combination of quantitative and qualitative analysis, representing a novel review approach to the subject matter. The method combines the scientometric approach with the traditional literature research method to conduct a systematic review of previous literature. Furthermore, this paper represents the inaugural review of research on the application of remote sensing and GIS to FDI. The objective of this study is twofold: firstly, to provide a comprehensive analysis of existing research trends and, secondly, to suggest potential avenues for future research.
The remainder of this paper is organized as follows. Section 2 outlines the research methods and literature sources employed in this study, as well as the data screening and processing procedures. Section 3 demonstrates the subject categories, subject evolution process, and publication trends. Section 4 presents a systematic review of the literature, employing both quantitative and qualitative analysis. Section 5 comprises the conclusions and suggests directions for future research.

2. Research Methods and Data

2.1. Research Methods

This paper presents a review of previous studies, combining quantitative and qualitative analysis. The bibliometric method is primarily employed as a quantitative analysis tool, with the objective of elucidating scientific knowledge. The utilization of the scientometric analytical software CiteSpace2 enables the exploration of specialty dynamics through the mapping of scientific knowledge within a given field over a specified temporal period. This is achieved through the identification of the nature of research frontiers, the detection of emerging trends and transient patterns in scientific literature, and the visualization of these trends and patterns [16,17]. Table 1 delineates the steps involved in the quantitative analysis conducted with the CiteSpace software (Version 6.3.1).
Qualitative analysis techniques, as methods for a literature review, are employed primarily in sociological research to synthesize and analyze relevant literature [10,13]. A literature review is a qualitative methodology for conducting research, which involves the systematic analysis, description, and critique of relevant research findings from books, journal articles, dissertations, and other related sources, so as to link research to the existing knowledge and establish the building block of academic research activities, thereby laying the foundation for further academic knowledge development [10,18]. A literature review facilitates the identification of research areas across multiple disciplines and integrates research findings to develop new or more comprehensive understanding of a topic [9,10]. It is a crucial aspect of developing theoretical and conceptual frameworks. The qualitative analysis of the literature in this study is comprised of five distinct steps:
(1)
The collection of publications according to specific topics;
(2)
The selection of relevant journal articles and dissertations;
(3)
The documentation of these materials in a coherent structure;
(4)
The study and analysis of these materials;
(5)
The summary of the findings.

2.2. Data Sources and Screening

In order to enhance the representativeness and accessibility of the data, the data for the quantitative analysis were obtained via the Web of Science (WOS) literature search website. The WOS Core Collection database was the primary focus, with data extracted for the period concluding in 2023. The data were then excluded based on the following criteria: The search statement employed for the literature search was as follows: TS = foreign direct investment (TS = topic search), TS = “transnational company”, TS = “multinational investment”, TS = multinational company and TS = GIS, or TS = remote sensing. Secondly, in order to refine the search results, the WOS categories were filtered to include only journal articles. Furthermore, only articles written in English were included in the analysis.
The initial search yielded a total of 53 publications. Upon examination of the titles and abstracts of the papers, it was discovered that the term “GIS” was associated with five terms that were irrelevant to the topic of this research: management information systems (GIS), geographical indications (GIs), green innovations (GIs), greenfield investments (GIs), and green investment scheme (GIS). The initial corpus of papers was then subjected to a manual review, with those deemed to have limited relevance to the topic of this study being excluded. The screening process was further refined to yield 35 papers published between 2003 and 2023, which were used as the basis for the quantitative analysis of this study.
The qualitative analysis of literature allows for a more comprehensive examination than is possible with quantitative analysis, due to the manual reading process, which is not constrained by software limitations. In addition to the 35 papers based on quantitative analysis, a search was conducted on Google Scholar and the Chinese journal search platform CKNI to expand the range of literature sources. The articles retrieved encompass a diverse range of publications, including journal articles, dissertations, and conference papers. The search methodology employed for the search was as follows: the research topic was identified as the search term, and the search was conducted manually, followed by an extended reading of the retrieved papers. This yielded a total of 103 papers as the source of literature for the qualitative analysis.

2.3. Data Processing

The data obtained from the quantitative analysis of literature encompass a range of information, including the paper title, author, journal source, publication time, keywords, abstract, cited references, and other full WOS records. In order to conduct a systematic review of the literature, this paper initially applied CiteSpace’s data processing utilities to the WOS record with the objective of removing duplicates. No instances of repetition were identified. The objective of scientific mapping using CiteSpace is to facilitate the exploration of the science knowledge domain, scientific evolution, research frontiers, and author collaboration [17]. Subsequently, visual analytic techniques of CiteSpace were employed for the visualization of co-word analysis, citation analysis, co-citation analysis, and author collaboration network analysis [17]. Finally, the time-slicing technique was employed to model the time series network of the aforementioned analyses, thereby indicating the research trends of relevant scientific knowledge. In general, the quantitative research method is used to synthesize and analyze the subject categories, intellectual structure, popular research topics, current status, and scientific research network among countries and institutes of the relevant literature.

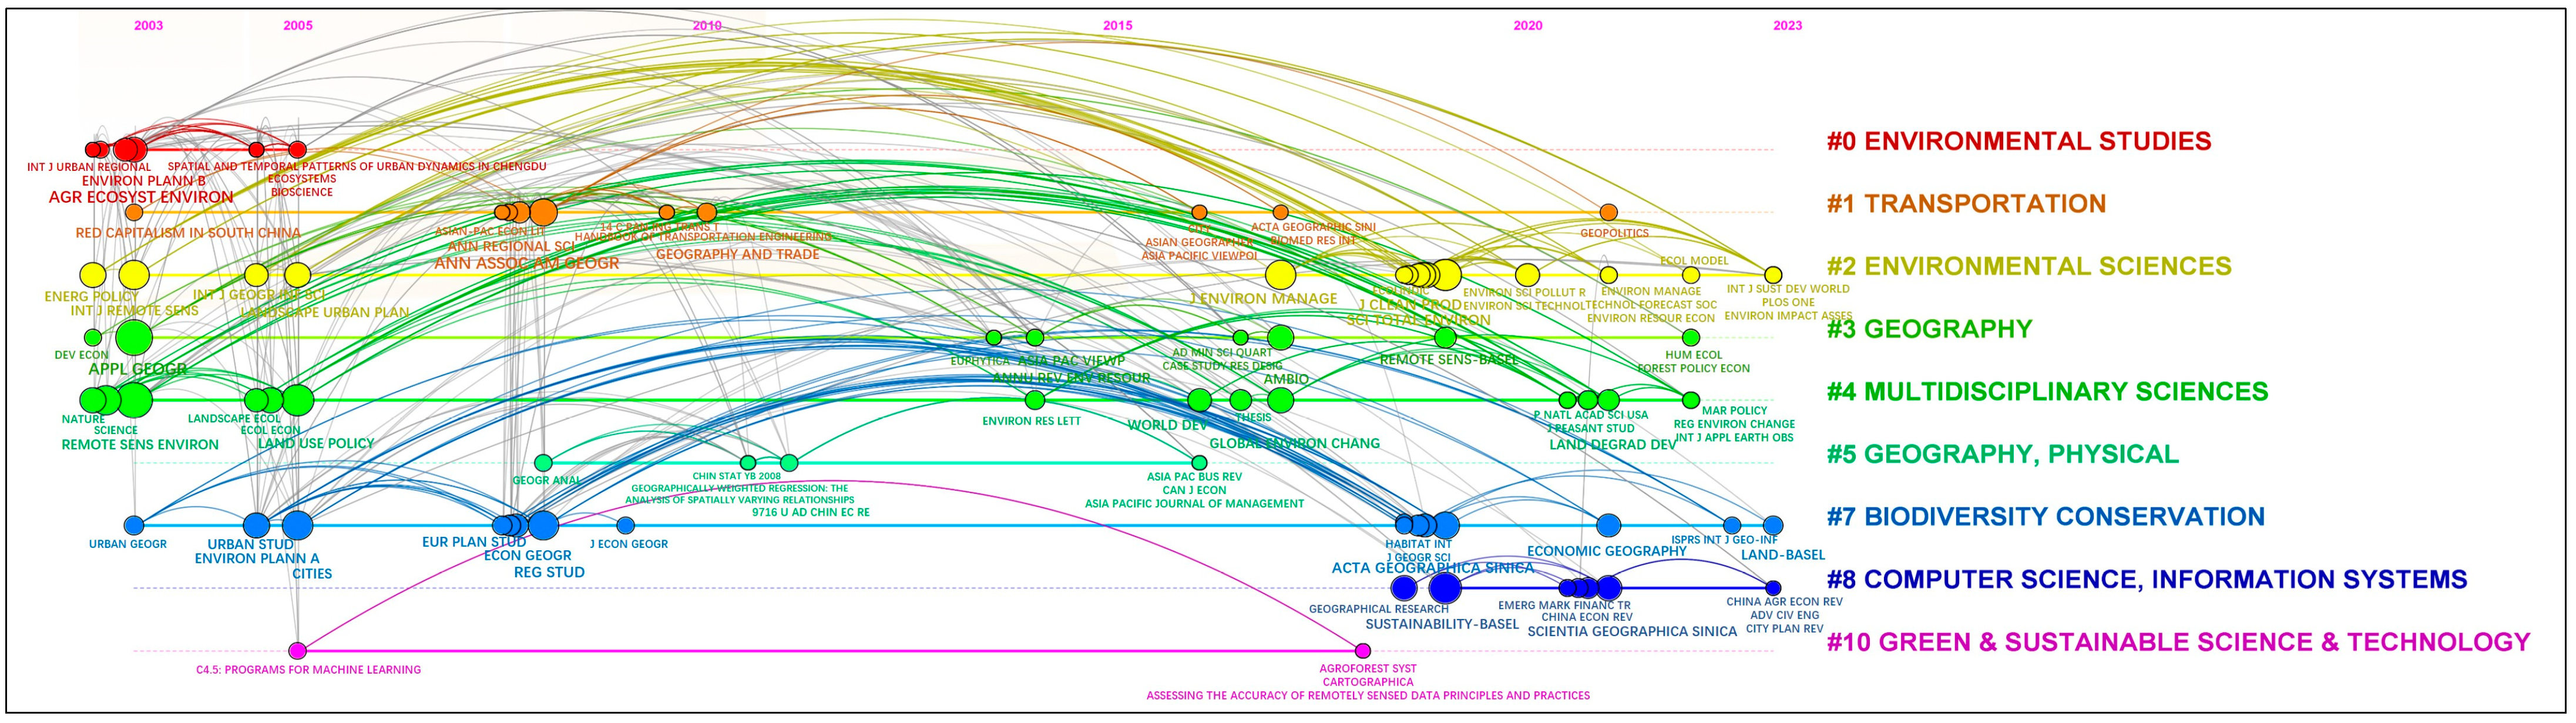
3. Subject Categories and Publication Trends

3.1. Subject Evolution

The major clusters were highlighted to facilitate an examination of the disciplinary composition of the subject areas and source journals (see Figure 1). The publications were primarily concentrated in the fields of environmental studies, transportation, environmental sciences geography, physical geography, biodiversity conservation, computer science and information systems, and green and sustainable science and technology. The relative importance of nodes was elucidated in terms of citation-based metrics, such as citation counts. The articles were published mainly in the following journals: Sustainability, Journal of Cleaner Production, Land, Applied Geography, Environment and Planning B-Planning & Design, Journal of Environmental Management, Journal of Geographical Sciences, and Remote Sensing. It is noteworthy that the interdisciplinary clustering result for multidisciplinary sciences indicates that a number of the articles are clearly interdisciplinary in nature. Firstly, the research directions were interdisciplinary, with notable examples including the integration of industrial and economic research with urbanization and urban land research. Secondly, the research contents were interdisciplinary, encompassing a diverse range of topics, including global supply chains, land use change, and environmental development. Thirdly, the research methodologies were interdisciplinary, encompassing the comprehensive application of remote sensing and GIS methodologies, as well as social science methodologies.

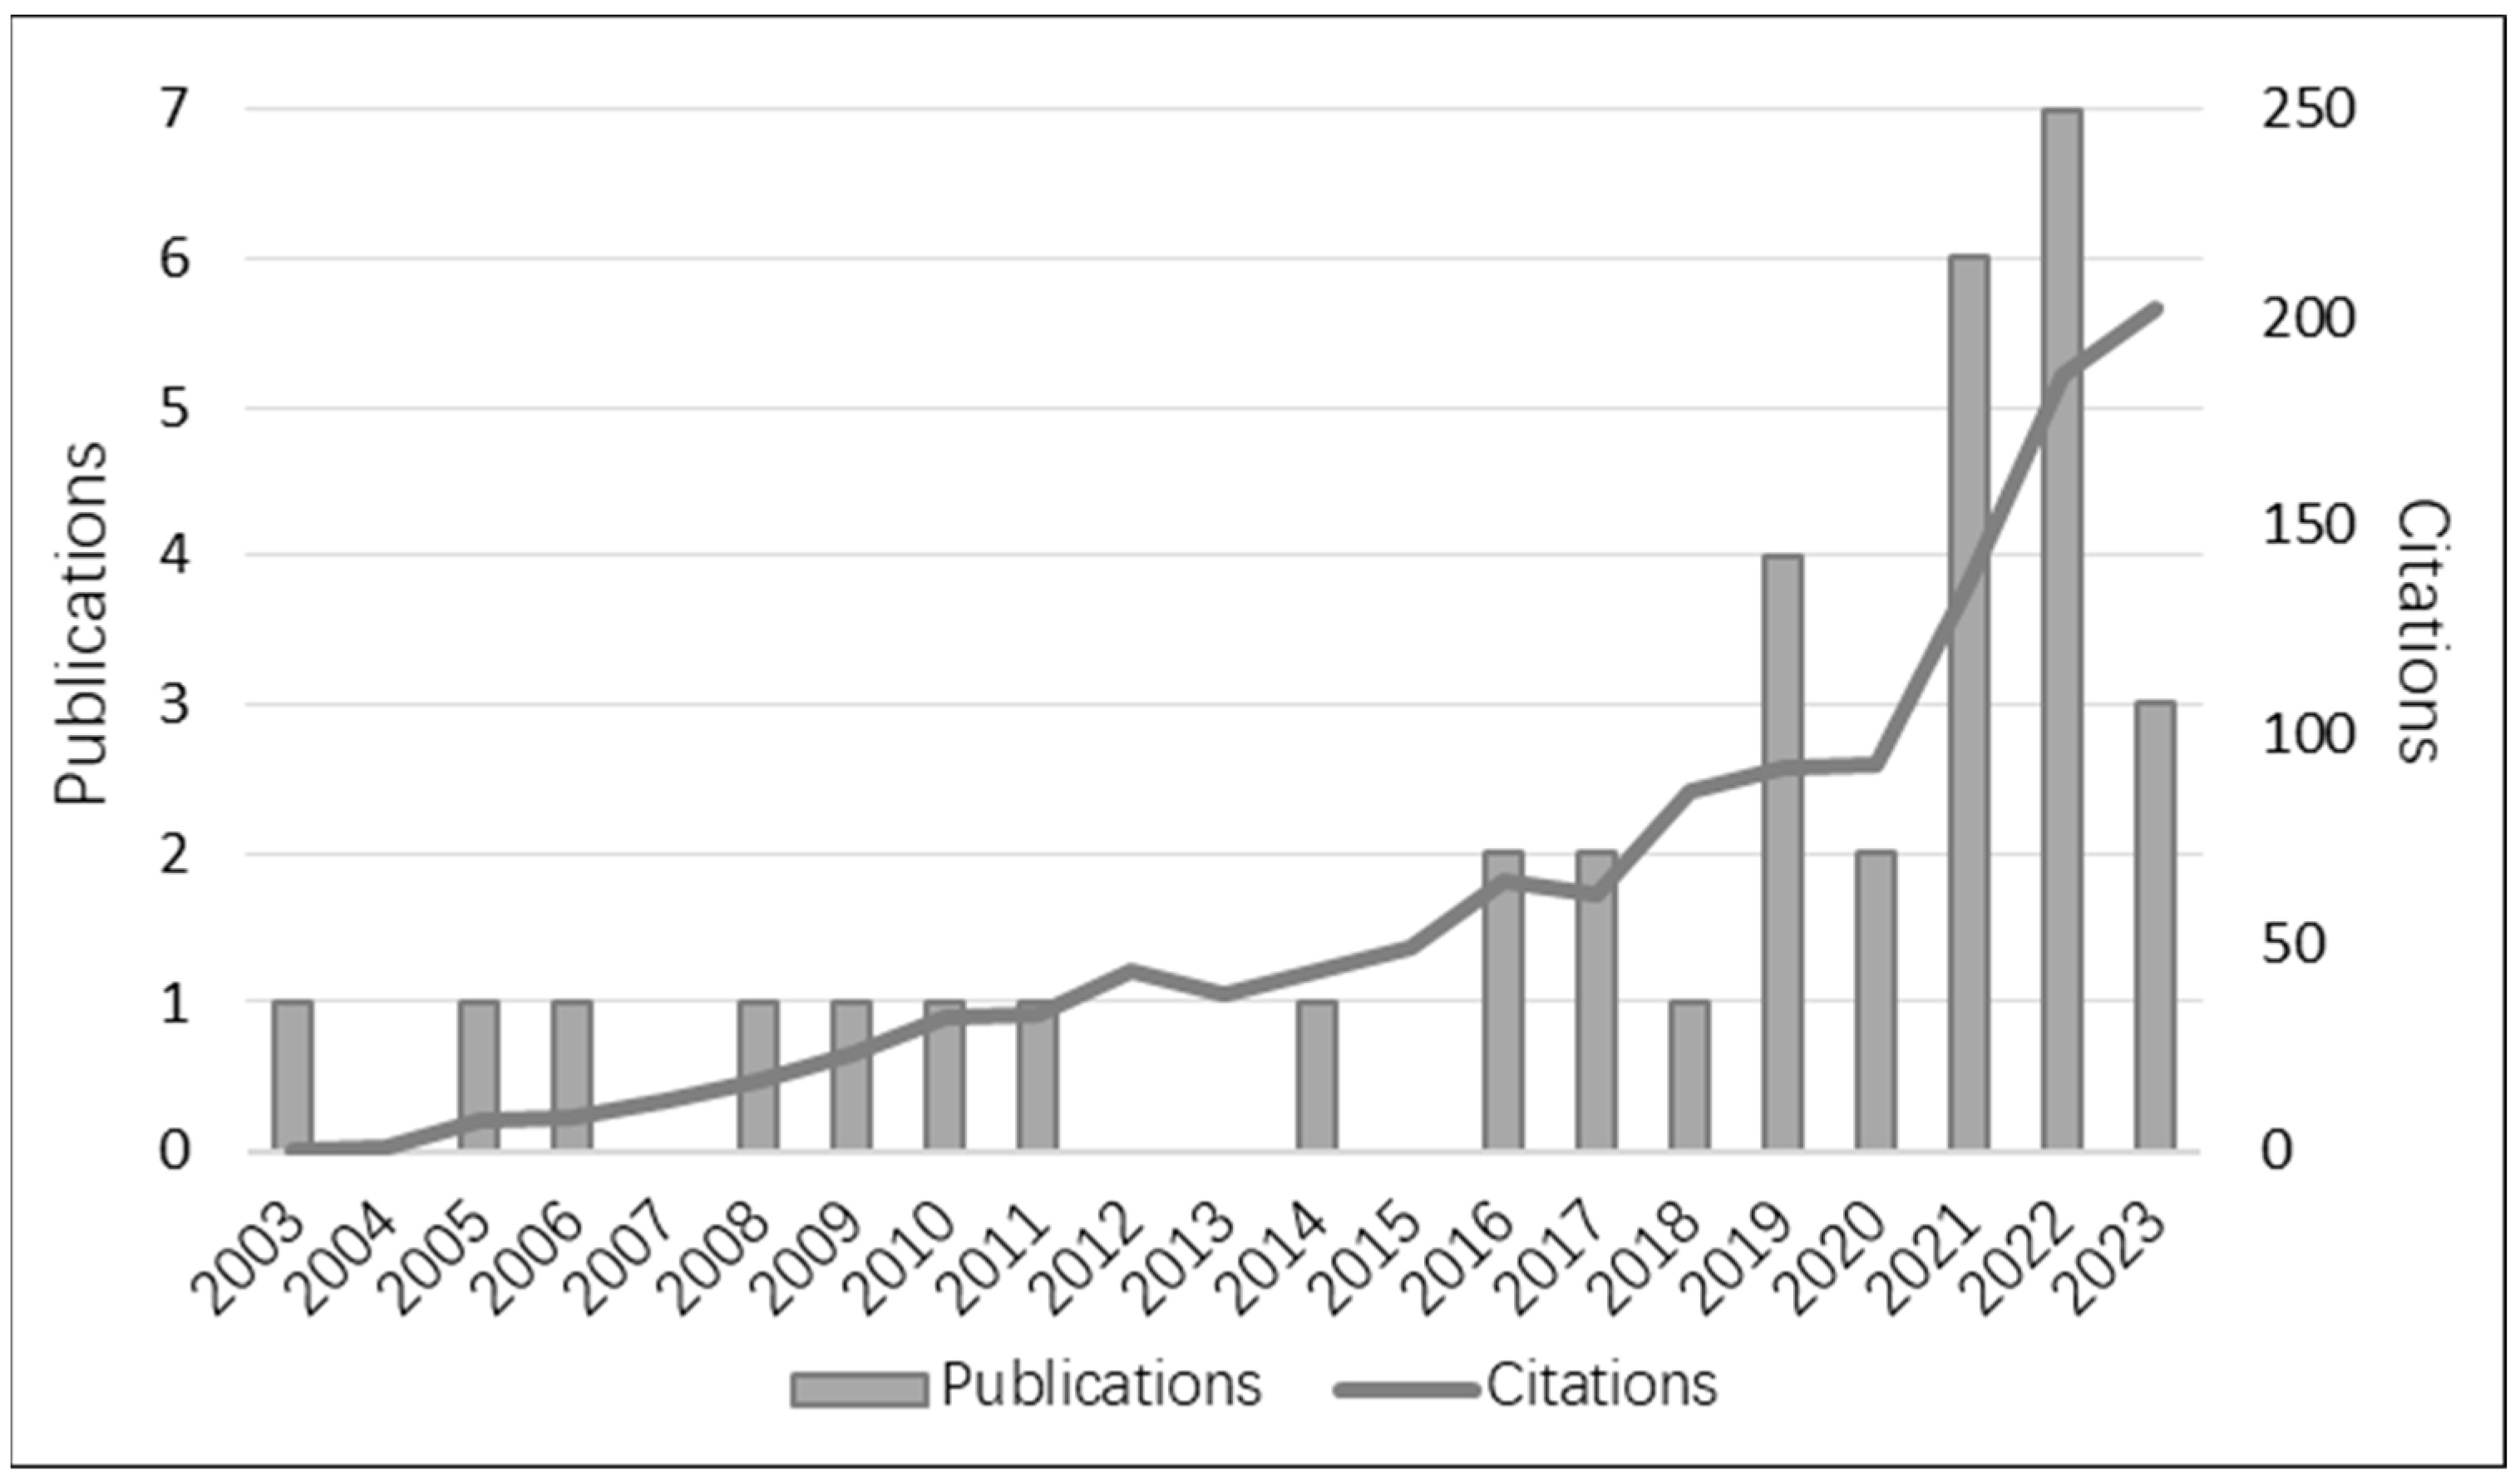
3.2. Trends in the Number and Cited Times of Published Papers

Figure 2 displays the number of base publications and citation footprints in this scientific literature. The number of publications can be divided into three distinct phases of development. In the initial phase, spanning from 2003 to 2015, the research field attracted only limited attention from scholars, with the number of publications per year remaining relatively low. On average, no more than one paper was published per year, representing 22.86% of the total. This period is characterized as the initial introduction of remote sensing and GIS technology to the related research fields, such as the application of geographical information systems to TNCs [19,20].
It is only since 2016 that this field has attracted greater attention from scholars. From 2016 to 2018, as the second phase, the number of publications increased gradually, accounting for 14.28% of the total. This period is characterized by an expansion of the research scope, which considers the role of remote sensing and GIS in understanding the impact of globalization on urban expansion and spatial distribution, as well as industrial agglomeration and effects [21,22].
Since 2019, the number of publications has accounted for 62.86% of the total, indicating a period of rapid development. The research conducted during this phase is more expansive in scope, encompassing studies at various levels of analysis, including global, national, regional, and city scales. The topics under discussion encompass a range of themes, including the internationalization of companies, urban globalization, global urban agglomeration, global city–regions, global supply chain, transnational land acquisition, and transnational scientific and technological cooperation. Although some progress has been made and this field of study has attracted greater attention from scholars, it remains relatively small in terms of the number of publications and the lack of comprehensive research.
The number of citations of publications serves to illustrate the significance and the extent of the articles’ influence. The total number of citations of publications was 1231 from the year 2003 to 2023, with an average of 61.55 citations per year. There was a gradual increase in citations spanning from 2004 to 2012. The time period from 2012 to 2017 was marked by a fluctuating pattern, with a slight decline in citations of publications followed by a gradual recovery. From 2018 to 2020, there was a reversal from the previous decline. After 2020, there was an acceleration in the number of times articles were cited. The article that was cited most frequently was published in 2003, with a total of 336 citations. The second most cited article was published in 2010, with a total of 121 citations. The third most frequently cited article was published in 2017 and was cited a total of 111 times.

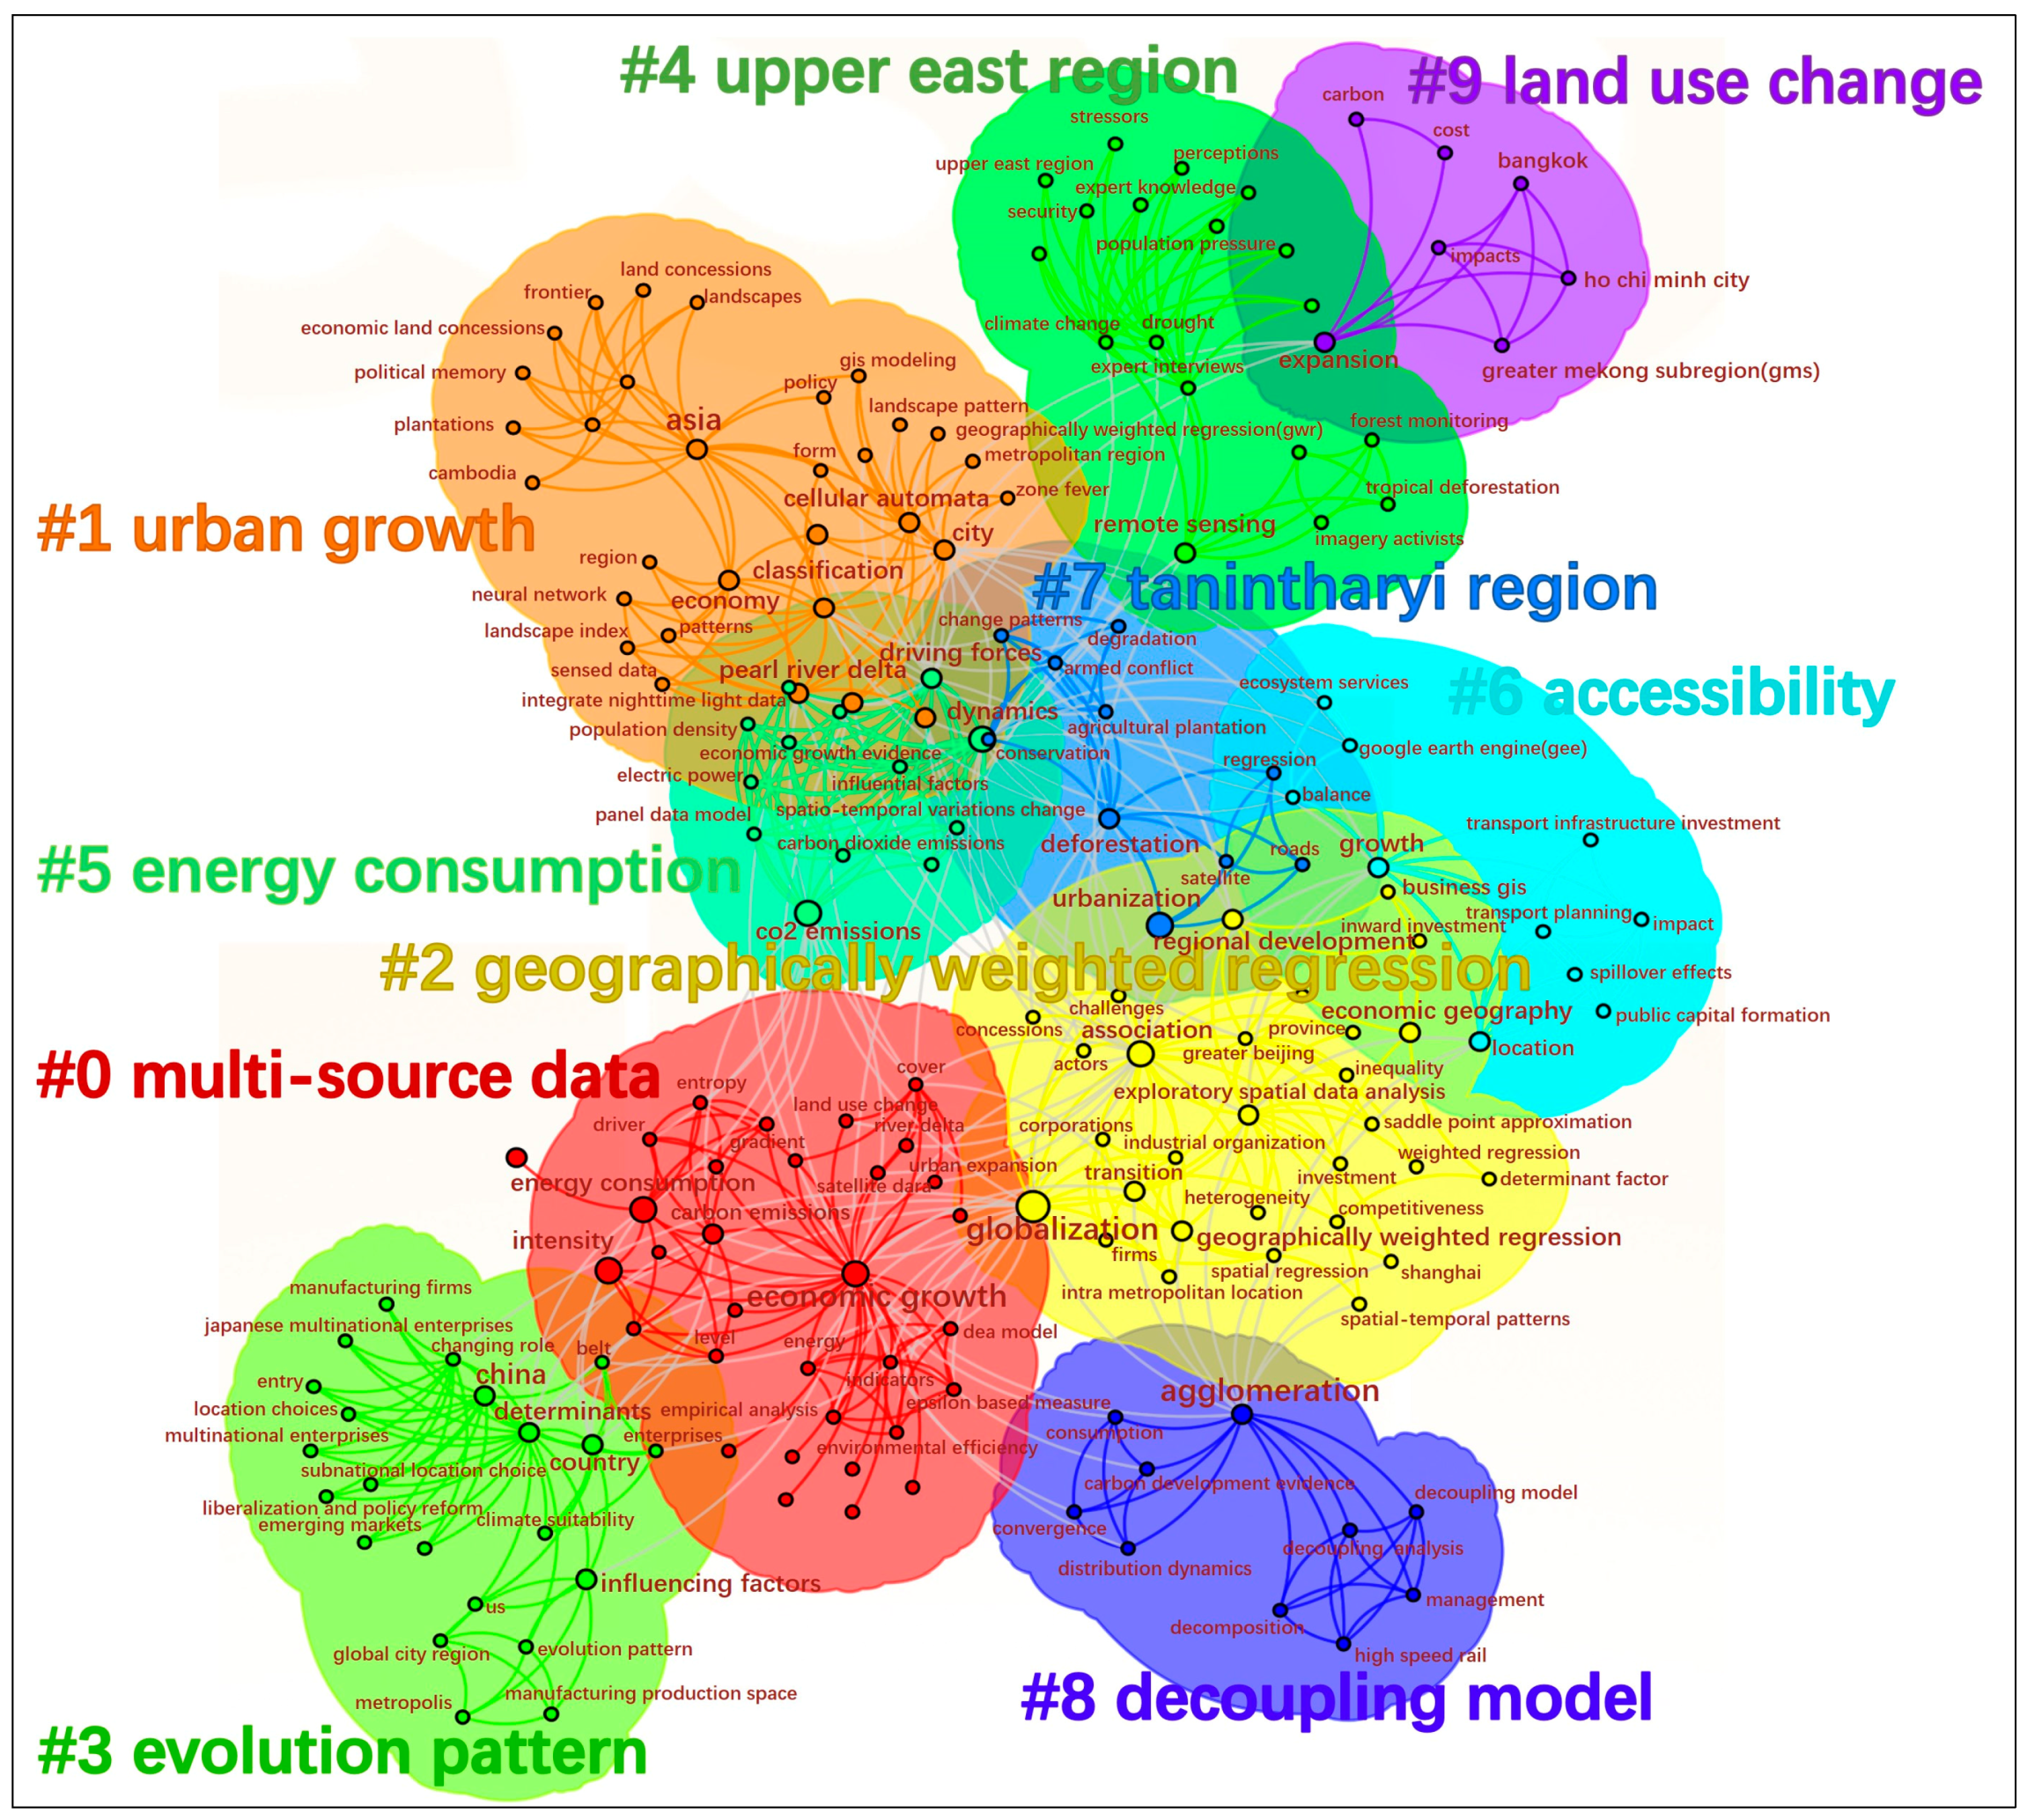
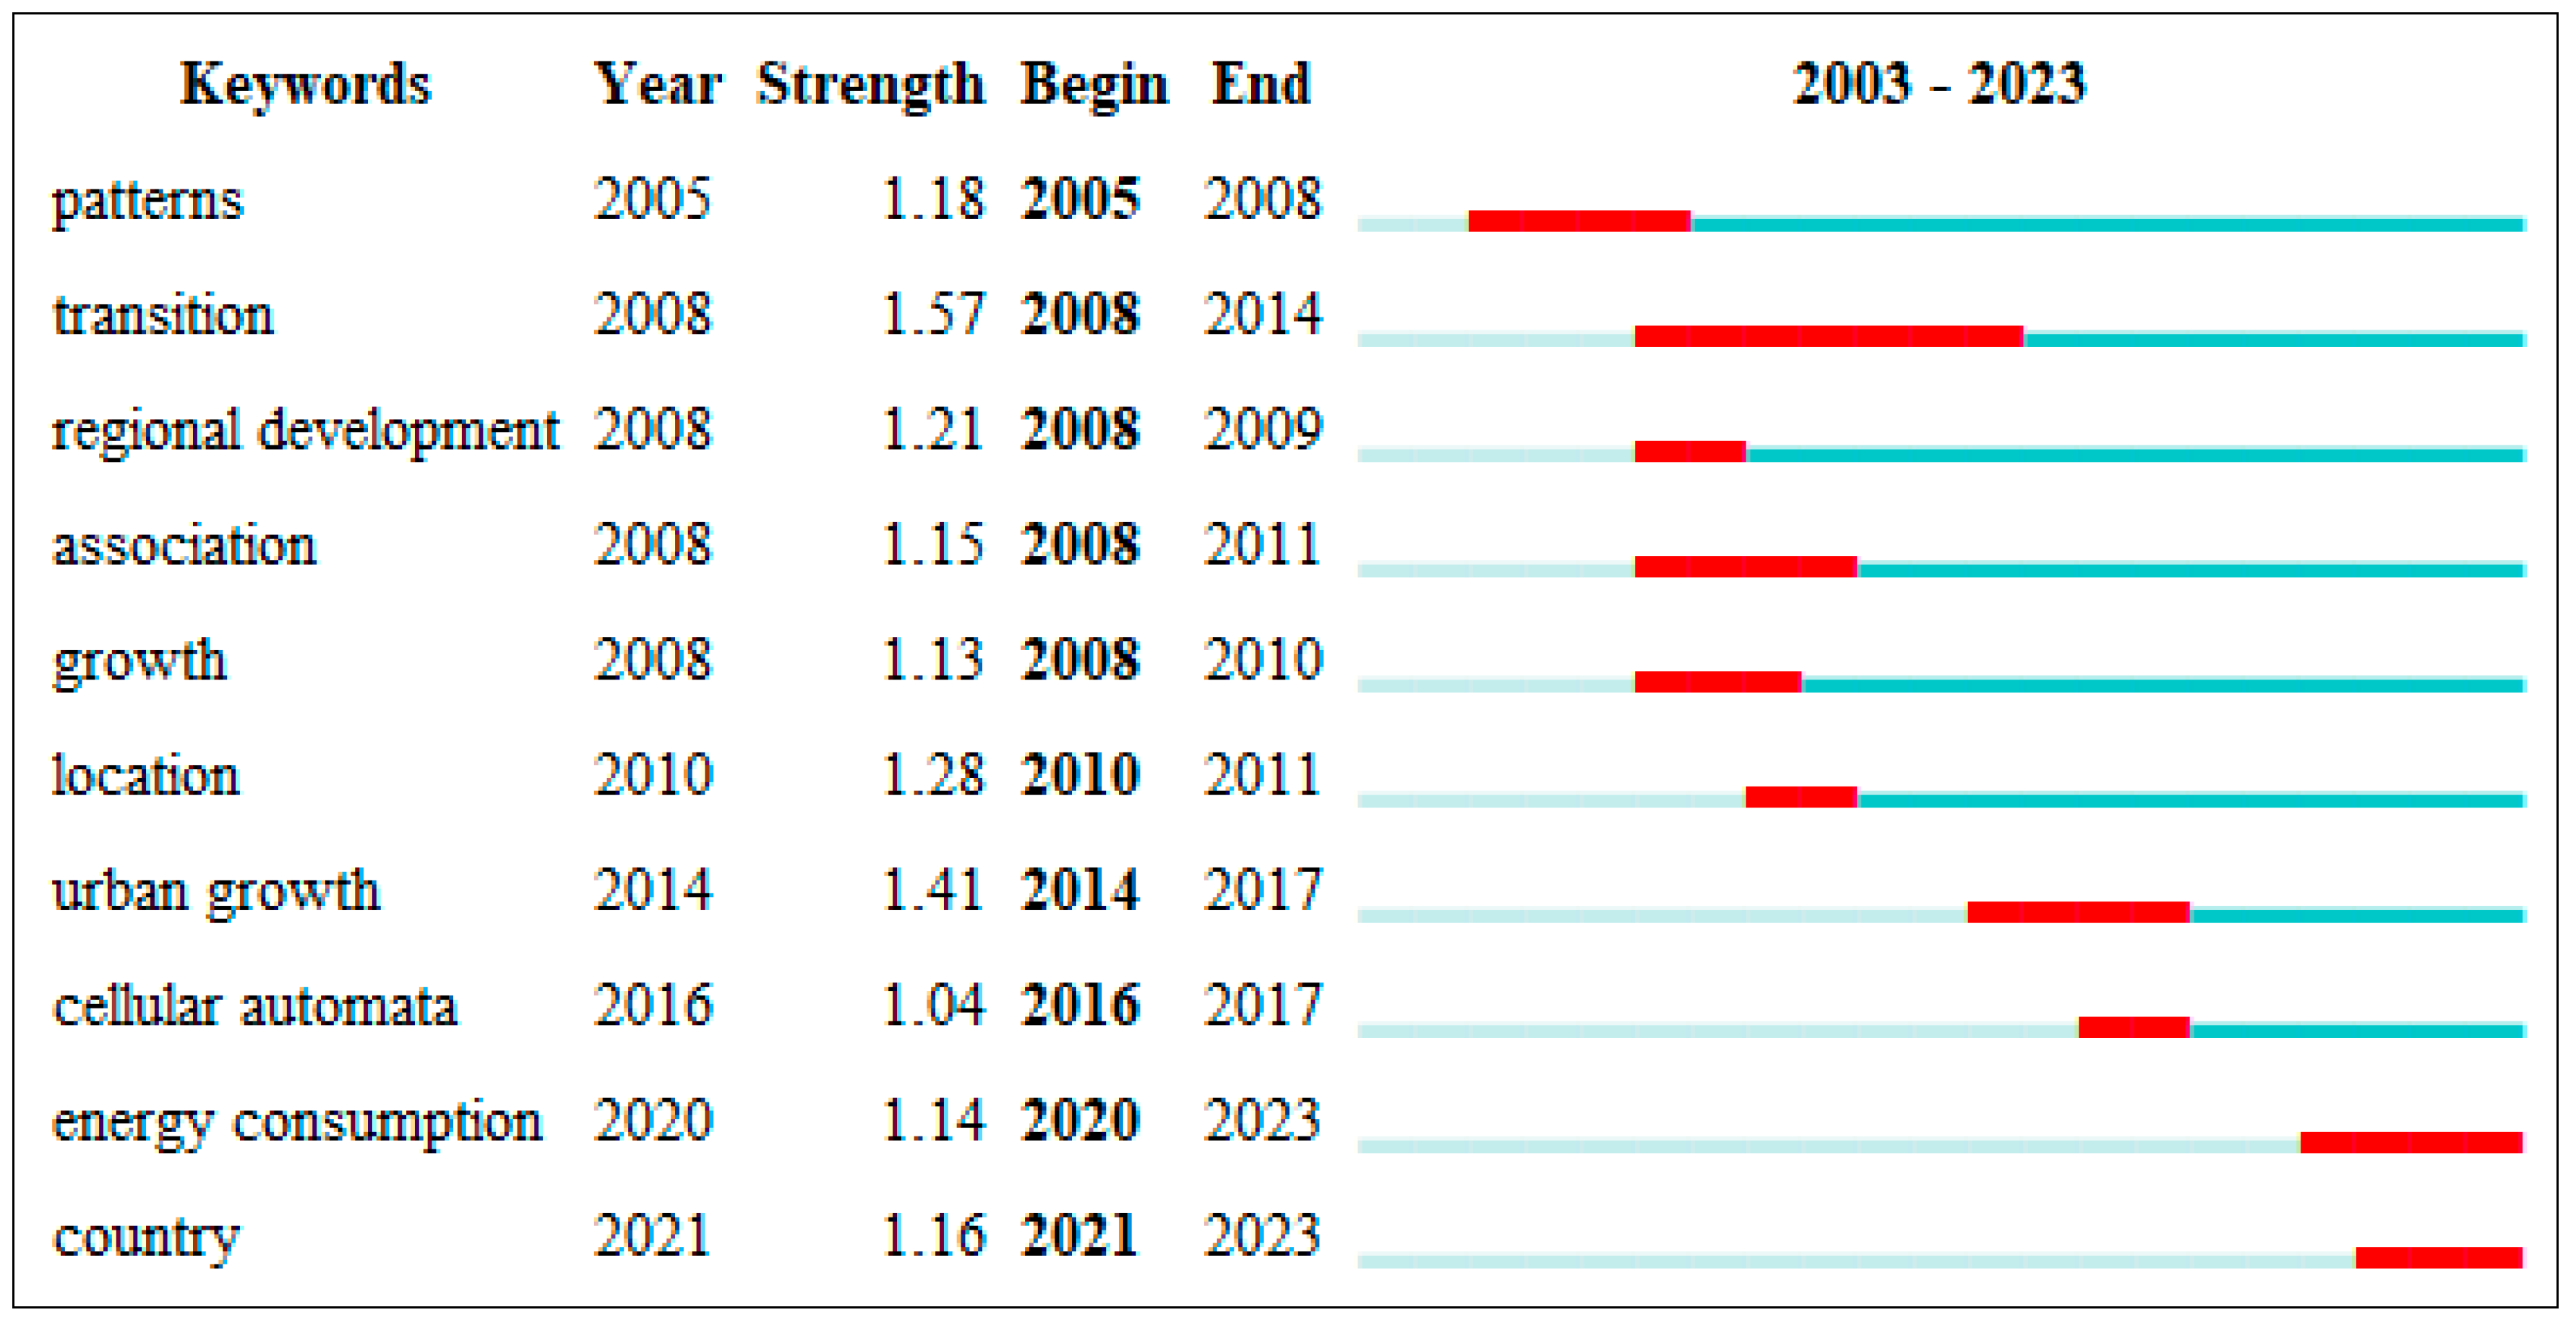
4. The Intellectual Structure

4.1. Quantitative Analysis

Chen (2006) [16] proposed a comprehensive representation of the dynamics of a specialty through the use of heterogeneous networks of terms and articles. Furthermore, the informative cluster labels indicate the research front terms [16]. Consequently, the quantitative analysis in this paper employs CiteSpace’s function of co-occurring analysis, co-citation cluster networks, and citation bursts.
First of all, the co-occurrence of terms indicates research front terms, and is defined as the occurrence of two or more keywords in multiple manuscripts within a statistical time period, in order to reveal the more frequently appearing keywords in the research field, as well as the correlation between these high-frequency keywords [17,23]. By analyzing the co-occurrence of keywords, popular research topics can be identified. The size of the node is indicative of the occurrence frequency of the keyword, which also indicates the extent of academic attention this keyword has received. In addition to the most frequently occurring keyword, “FDI”, other high-frequency keywords include “country”, “deforestation”, “economy”, “expansion”, “growth”, “influencing factors”, “land use change”, “regional development”, “transition”, and “urban growth”.
Subsequently, the popular research topics are identified through the use of a co-citation cluster. The keyword co-citation cluster network is presented in Figure 3 in the form of a landscape view. Each cluster comprises a group of words that are closely related to one another, thereby illustrating the degree of relationship between these words and the subject matter they form. Figure 3 lists the nine major co-citation clusters identified by CiteSpace, namely: 0# multi-source data, 1# urban growth, 2# geographically weighted regression, 3# evolution pattern, 4# upper east region, 5# energy consumption, 6# accessibility, 7# Tanintharyi, 8# decoupling mode, and 9# land use change. The smaller the number, the more keyword members are included in the cluster, which is more representative than a cluster with a larger number [24].
The clusters 0# multi-source data, 2# geographically weighted regression, and 8# decoupling model are closely related to the data sources and methodologies employed. The clusters 1# urban growth, 5# energy consumption, and 9# land use change comprise studies that engage in the impact of FDI on urban development, urban spatial expansion, and the environment. Cluster 3#, which concerns the evolution pattern of FDI, and cluster 6#, which is related to the studies of spatial pattern and accessibility of FDI, include research on spatiotemporal evolution, accessibility indicators, and network routines.
In traditional co-citation analysis, the focus is on homogeneous networks of co-cited papers. However, newly published articles are often underrepresented due to the fact that they may not have accumulated sufficient citations [16]. Burst-detection algorithms in CiteSpace are capable of identifying surging topical terms and detecting emerging trends and abrupt changes [16,17]. Figure 4 depicts the 10 keywords with the strongest citation bursts, with red lines representing time durations in which the size of bursts changed significantly, that is, sudden, rapid increases in citation counts. Blue denotes citation durations. The time intervals can be classified into four distinct stages. Previous studies by scholars in the initial stage concentrated on the keyword “patterns”. The second stage is concerned with “transition”, “regional development”, “association”, “growth”, and “location”. The third stage is distinguished by the emergence of urban growth and cellular automata. The fourth stage encompasses citation bursts of the keywords “country” and “energy consumption”. This is closely related to notable global concerns about energy consumption, the further deepening or disintegration of globalization, and China’s Belt and Road Initiative.
The top 15 references with the strongest citation bursts are illustrated in Figure 5. Prior to 2005, two papers stand out as being particularly noteworthy. The first one was published in 2002, pertained to the swift economic growth of China’s Pearl River Delta during the late 1970s and early 1980s. Seto et al. (2000) [25] noted that the factors contributing to such rapid development were governmental directives that led to extensive land conversion. The second one was the inaugural study that utilized high-resolution satellite imagery to quantify the discrepancy between agricultural land sensing images and official statistics in China [26]. From 2015 to 2017, the strongest citation burst was due to a book by Dicken in 2015. From 2018 to 2020, two studies emphasized the potential of night-time light data: one study used night-time light images to model a country’s population density, while the other used night-time light signals to study the spatiotemporal characteristics of urbanization dynamics in a cross-border region [27,28]. The strongest citation bursts starting from 2018 were, on the one hand, concerning studies on Chinese outward FDI activities responding to China’s Belt and Road Initiative and investment risks in these destination countries receiving high levels of citations [29,30,31,32,33,34,35]; on the other hand, the social and environmental resources that are influenced by transnational investments were also of concern to scholars [36,37].
It is possible to ascertain the major countries and research institutions that have had a significant impact on the study field, as well as the cooperative relationships among them, by examining the network of cooperation between those nations and institutions [23]. As illustrated in Figure 6, China and the United States were the most prominent countries in the network. Although China has a larger node than the United States, the United States has a longer history and an earlier start to international cooperation. China has exhibited a more pronounced increase in its level of international cooperation over the past five years. The remaining countries have demonstrated a comparatively limited degree of cross-border cooperation, with each accounting for less than 10% of the total. In general, the extent of research cooperation between countries is relatively limited.
Figure 7 illustrates the institutional cooperation networks. The connecting line between the nodes represents the cooperative relationship between the institutions. The greater the width of the connecting line, the stronger the strength of cooperation. The colors of the nodes in the form of a chronology indicate the times of publications, while the color of the connecting line represents the time of the first collaboration. It is evident that the majority of collaborations occurred within the past five years.

4.2. Qualitative Analysis

Torraco (2016) [11] highlighted that while the entire literature is reviewed, only selected pieces are thoroughly discussed, and these selected pieces may be representative, controversial, central, or pivotal. The literature can be examined qualitatively in different ways. One approach is to read each piece in its entirety, or to focus on specific elements, such as methods and findings, in order to summarize, analyze, evaluate, and synthesize the documents [9,11,13]. In this paper, the method of theme analysis is applied in accordance with the suggestion set forth by Onwuegbuzie et al. (2012) [13]. Theme analysis entails identifying themes to explore relationships among domains. Each theme, extracted from the theme analysis, serves as the basis for a section, with its label acting as the designation for each subsection. The qualitative analysis section of this paper is structured into six themes, each comprising one subsection.
The initial subsection introduces the GIS-based studies of FDI at various macro scales, including at the national, regional, and urban levels. As a research and planning tool, GIS has been employed by environmental scientists, planners, and resource managers in macro-environmental studies [19]. To illustrate, the role of FDI and other related human activities played in the ecological environment, particularly land use, is a case in point. The second subsection addresses how remote sensing and GIS have been employed in business-related applications, including the mapping of industrial supply chains and the optimization of product delivery. The utilization of remote sensing technology by scholars encompasses the investigation of a range of sectors, including agriculture, mining, manufacturing, and services. These studies pertain to the domains of agricultural management, mineral resources, and the spatial patterns of production. The third subsection presents an analysis of literature related to global value chains, with two case studies of the application of remote sensing technology in the rubber value chain. The fourth subsection illustrates the application of remote sensing and GIS technologies in micro-geography, with a particular emphasis on the spatial distribution, site selection, and organizational strategies of TNCs. This subsection examines the relationship between the organizational structure of TNCs and the spatial environment. The application of remote sensing and GIS technologies has proved instrumental in the decision-making processes of entrepreneurs. The theme of the fifth subsection addresses the commercialization and internationalization of the geo-information industry. This industry is highly globalized and plays an important role in national defense and transnational scientific collaboration. Finally, the last subsection examines how scholars are developing a more comprehensive understanding of FDI by integrating remote sensing data with a range of other data sources and methods.

4.2.1. Macro-Environmental Research at National, Regional, and City Scales

Satellite imagery activists are rapidly emerging as a critical source of understanding for a wide range of human challenges, human–environment interactions, humanitarian relief efforts, and catastrophic events due to the rapid advances in remote sensing and GIS technology [7,39].
Firstly, the impact of FDI on the macro-environment is to be examined. Scholars have mainly utilized satellite remote sensing data, which have a large spatial coverage and a longer temporal period. Tong et al. (2021) [40] discussed the transition effects of FDI on the ecological environment and found that the influence of FDI may exhibit two contradictory effects: at the stage of a lower economic level, the effect of FDI on the ecological environment was negative, namely, the pollution haven effect; when the economic level exceeded a certain threshold, FDI began to exhibit the positive pollution halo effect. Wei et al. (2023) [41] demonstrated that FDI on carbon emissions can be utilized to respond to global climate change and achieve carbon emission reduction. Their findings suggest that FDI has a considerable positive impact on carbon emissions, which can be attributed to scale effects, technology spillovers, and industrial specialization, thus supporting the “pollution haven hypothesis”. However, it is essential to acknowledge that this positive effect will gradually diminish over time. The study by Zou et al. (2019) [42] revealed that a higher degree of openness and FDI can widen the regional gap in energy efficiency within a region. In addition, government departments and non-governmental environmental organizations employ satellite remote sensing to detect environmental developments, with the objective of monitoring global ecological trends and the impact of human activities on the surrounding ecosystems [7]. Examples of data that can be collected include monitoring global forest growth and forest degradation trends, as well as the ecological damage caused by fires on surrounding ecosystems.
Secondly, remote sensing satellites offer a significant advantage, as they provide repeated and consistent observations over a large geographic area, thereby revealing explicit patterns of land cover and land use [43]. Studies on the role of FDI in national, regional, and urban land use and evolution have started from the classification of land use types and the revelation of urban functions by using single remote sensing data in the early days, to gradually integrating and applying multivariate data in the last decade [44]. Remote sensing imagery technology has proven to be a valuable tool for identifying urban functional zones and spatial patterns of land use, thereby supporting urban system management and urban planning [45,46]. The utilization of GIS and spatial data analysis offers a unique opportunity to delve deeply into the intricate spatial nuances of regional development, as highlighted by Yu and Wei (2008) [47]. Cao et al. (2019) [48] observed spatiotemporal patterns of urban land use change in the cities of the transnational region based on land use maps from Landsat satellite products, so as to deal with the attitudes of government policy towards FDI urban land use change.
Thirdly, the urban functional area serves as a fundamental unit of analysis within the context of urban geography. In order to identify the spatial structure and functional features of an urban functional area, relevant studies employ remote sensing data. The utilization of high-spatial-resolution optical images, such as street view imagery, enables researchers to capture the physical characteristics of a city [45,49,50]. Moreover, as important signals of human activities, the high-spatial-resolution night-time light images offer valuable insights into the understanding of urban landscapes [50].

4.2.2. Global Industrial Development and Layout

Scholars employ remote sensing technology to investigate the global configuration and information management system of industries such as agriculture, mining, manufacturing, and services. A multitude of applications of remote sensing can be found in the studies of the primary industry, including agricultural security, agricultural management informationization, agricultural layout, and remote control management. In the early stages of research, the potential applications of remote sensing in agriculture were explored, including the use of crop statistics, soil mapping, and land use potential mapping [8]. Since the early 2000s, foreign investors have been acquiring large tracts of land around the world [51]. Müller et al. (2021) [51] used a multi-method approach, integrating agricultural data, remote sensing data, household survey data, and geo-referenced information on land deals to examine the impact of transnational investment on local food security in terms of food production and access. The findings of their studies suggest a paradoxical effect: while land deals narrow the global yield gap by increasing crop yields, they also threaten local food security by diverting key dietary nutrients to export markets.
Most studies in remote sensing combined with geophysical measurements have focused on the relationship between FDI in developed countries and the abundant resources of less developed countries. For instance, some TNCs from developed countries possess advanced satellite processing technology, and employ Landsat data and geophysical measurements to identify and analyze the surface features of mineral resources [8]. These large TNCs then use this information to discover mineral resources such as oil in other countries, but the negotiations between these TNCs and mineral-rich Third World countries have historically been challenging [8].
The production, sales, and distribution of the manufacturing industry exhibit unique characteristics of a spatial pattern. Remote sensing and GIS approaches offer significant potential for analyzing a range of topics, such as global raw material sourcing, site selection of production space, route optimization for freight transport, and location choice for product distribution [19,39]. By integrating point-of-interest (POI) data of manufacturing enterprises with high-resolution remote sensing imagery at different scales—whole region level, city level, and county level—scholars have achieved higher precision and continuity in the manufacturing production space [39,52]. They analyzed the space of physical entities of the manufacturing production space in China’s global city–region and concluded that the evolutionary characteristics of China’s manufacturing production space are distinct from those in the West [39,52].
In their study on the application of remote sensing technology in the service industry, Zhang et al. (2023) [53] analyzed the matching relationship between urban service industry land expansion and economic growth in China, by the means of GIS cluster analysis and spatial autocorrelation analysis to examine the phenomenon from the perspectives of the service industry, urban economy, and government revenue.

4.2.3. Research on Global Value Chains

The application of remote sensing technologies in global value chains is exemplified by the global rubber supply chain. Against the backdrop of increasing global demand for natural rubber, scholars have employed satellite remote sensing to identify and map the expansion of large-scale rubber plantations in southern Laos [22]. This has led to the discovery of the large-scale development and expansion of rubber plantations in Laos. Subsequently, an interdisciplinary sociological approach was adopted, linking the political economy of development, collaborative research with civil society groups, rubber ecology, and remote sensing methods and data [22]. Remote sensing has been used to track the supply chains of natural rubber from Sri Lanka to the United States, and the analysis reveals that rubber traders and multinational tire manufacturers are significant actors that impede the tracing of rubber back to the plantations [54]. Additionally, the North American Free Trade Agreement Association has employed GIS to model the movement of trade across North America [19].

4.2.4. Micro-Information Geography of TNCs

Remote sensing and GIS technologies have the ability to visualize map-based presentations and cope with spatial analysis functions, and GIS also has the ability to integrate with other systems while maintaining data integrity. This ability has led to their study and application in the area of TNCs’ spatial distribution, site selection, and business strategy [19,20,55,56]. Entrepreneurs are more adept at making business decisions that improve efficiency, quality, and productivity, and at identifying potential markets faster than their counterparts by exploiting the spatial overlap between different demographic groups [19]. Furthermore, Berntsson-Svensson et al. (2009) [19] showed how the geographically dispersed components of the organization work together to achieve practical business objectives. Another study was conducted from a global–local interaction perspective to identify spatial evolution of transnational technology transfer over the past 15 years [57].

4.2.5. Internationalization and Commercialization of Geo-Information Industry

In recent years, the geo-information industry has experienced rapid growth and become a new focus of international competition. This has attracted the attention of countries and large TNCs, which are now engaged in the competitive process [58,59]. The geo-information industry is distinguished by a high degree of internationalization and globalization. The geo-information industry is a comprehensive sector that encompasses all activities related to the production, development, and provision of geospatial information resources through the use of space information technology [58]. The geo-information industry plays a pivotal role in national defense, global technology commercialization, and transnational scientific research and cooperation. For example, Auque (2000) [60] observed that the European space industry has undergone significant changes, including a shift in growth patterns, the introduction of new commercial services, a focus on customer satisfaction, and restructuring. These changes can be attributed to several factors, including the evolution of the market for space applications, the actions of the industry itself, and the industry’s response to the consolidation of its US competitors.
In addition to the intensifying rivalry between regional geo-information industries, the emergence of numerous actors and global value chains has prompted agencies to prioritize enhancing global competitiveness [59]. This is accompanied by the increasing commercialization of the industry, with the involvement of multiple actors. Commercial companies are entering the commercial space sector and becoming involved in outer space activities, which is disrupting the market structure that has been dominated by government investments as the commercial space industry has matured [61]. The involvement of multiple stakeholders in a satellite federation necessitates the establishment of trust between them, given that the federation is owned and operated by multiple parties [62]. It is beyond dispute that public space agencies play a pivotal role [59].
Baker and Williamson (2006) [7] proposed that the public’s access to civil and commercial satellite imagery data has expanded significantly, and that non-traditional imagery activist users have made notable progress in utilizing satellite imagery to advance their public policy agendas. They provided an illustrative example of the use of satellite imagery as a novel source of analytical data and a medium to draw greater government and public attention to international issues. The global activist NGO WRI’s Global Forest Watch has utilized satellite imagery and geospatial technologies to draw international public attention to deforestation problems by establishing an international network that connects local forest organizations interested in monitoring global deforestation; meanwhile, it has conducted assessments of deforestation trends in several countries in collaboration with governments and wood products companies [7]. Issues pertaining to the utilization of remote sensing in the Third World encompass the capacity of developing countries to assimilate advanced technology, the autonomy in accessing resource information, and the competing foreign policy interests of the industrialized world in the global search for raw materials [8].
The commercialization of the geo-information industry may also give rise to international legal and international liability issues. The dual goal of promoting more inclusive and challenge-driven growth can aid in clarifying, constructing, and managing publicly funded global space infrastructures in ways that foster innovative collaborations with private companies, with the aim of advancing new technologies and services to assist businesses in remaining competitive in global value chains [59]. Export controls play a significant role in impeding the spread of commercial satellite technology within the global economy [63].
As an emerging technology, geospatial technology is closely connected to the Industrial Revolution 4.0, which is driven by the worldwide trend of interconnecting and interlinking of industries, making international scientific and technological collaboration more necessary [59,64]. In order to promote technological collaboration, regional training centers in Upper Volta, Kenya, and Thailand are being funded by developing countries, as well as the United Nations, the United States, France, and Canada [8]. The use of satellite imagery by developing countries has raised concerns among Third World nations regarding existing and proposed changes in Earth observation activities by industrialized countries. These concerns and issues frequently arise in United Nations forums and in bilateral foreign assistance projects [8].

4.2.6. Multiple Data and Interdisciplinary Approaches

The utilization of remote sensing data or socioeconomic statistics—including government-sourced data and company information—is inevitably constrained by their inherent limitations. On the one hand, the limitations of remote sensing in identifying socioeconomic characteristics make it difficult to discern the nuanced types of livelihood challenges, as well as its inability to identify indirect anthropogenic drivers [22,65,66]. On the other hand, the quality of records and data collected from companies and surveys is frequently inconsistent, difficult to access, lacking spatial information on location, and variable from year to year [22].
The application of multiple data sources and methods can help to overcome the inherent limitations of each approach. In recent studies, scholars have employed a range of research methods, integrated various data sources, and utilized a mixed-method approach that combines qualitative and quantitative data analyses from the natural and social sciences [19,65,66,67]. Remote sensing data are extracted information, and repetitive and spatially explicit data, in several spectral regions and with temporal frequencies [22]. Qualitative research endeavors to investigate and comprehend the context in which social and cultural phenomena manifest [19]. Social science methods offer valuable insights into social issues, economic factors, and qualitative aspects that cannot be captured through remotely sensed images, while interviews, questionnaires, field surveys, and on-site evaluations are irreplaceable in gaining a comprehensive understanding [22,43,65].

5. Discussions and Conclusions

Remote sensing technology has become a focus of international competition, with countries and large TNCs engaged in a global race to gain an advantage. The geo-information industry is distinguished by a considerable degree of internationalization. There has also been a gradual increase in the number of studies using remote sensing technology and GIS to analyze FDI. Despite the growing diversity of research on the integration of remote sensing technology in FDI, this field of study has yet to garner significant attention from scholars. The number of publications in this area is relatively limited, and research in this field is still in its infancy. The principal subjects of publications include environmental sciences, geography, biodiversity conservation, computer science, and information systems.
From the perspective of quantitative analysis, there has been a notable increase in the number of papers that adopt multiple data sources and mixed analytical methods in recent years. FDI’s impacts on regional development, urban growth, land use change, and environmental change have emerged as particularly popular research directions. The spatiotemporal evolution pattern, location, and accessibility of FDI are topics that have attracted considerable interest, and China’s Belt and Road Initiative is an emerging topic of research. In terms of research collaboration between countries, China and the United States were the most prominent countries in the network. The United States has engaged in collaborative research with other countries for a longer period of time than China. China has witnessed a notable surge in collaborative endeavors with other countries over the past five years, with the number of such collaborations surpassing those of the United States. In conclusion, the level of international collaboration remains relatively limited and is still in its infancy. Institutional cooperation networks are distinguished by a high degree of fragmentation.
In terms of qualitative analysis, previous studies have primarily focused on six themes, as follows: (1) visualization, which enables the intuitive detection of the Earth’s surface on a global scale; (2) the macroscopic perspective, which facilitates the analysis of cities, regions (urban agglomerations), and countries, as well as cross-scale analysis among cities, regions, and countries; (3) the analysis of global industrial development and the global value chain of commodities; (4) the analysis of the global distribution of FDI and TNCs from the perspective of micro-information geography; (5) the internationalization and commercialization of the geo-information industry, the exploitation and utilization of relevant technology by TNCs, and the facilitation of transnational scientific and technological cooperation; and (6) the integration of remote sensing and GIS data and approaches with other data and methods to facilitate and contribute to interdisciplinary research. Overall, the evolution of GIS technology has been profound, progressing from its origins in traditional mapping to its current status as a tool for exploring the Earth’s surface. In the contemporary era, GIS technology has reached a point where individual users can access real-time global spatial data, enabling them to address geo-relational problems in a timely and effective manner.
The application of remote sensing and GIS technology as analytical tools for exploring the Earth’s surface and for managing spatial information systems in the context of globalization, in conjunction with the advancement of data mining techniques, has become increasingly prevalent [19]. Naqvi and Naqvi (2021) [64] highlighted the significance of GIS and its evolution from conventional mapping to the current state of sophisticated real-time geospatial data analytics. GIS allows users to obtain answers to questions regarding geographic relationships because it is a system that can model the spatial relationships between various geographical features and provide spatial analysis tools to manipulate the underlying geographic data [19]. Geography, through the use of GIS, is elevating science and society in ways that are final, lasting, and enduring [64].
A review of the recent literature on a topic allows for the evaluation of forthcoming developments in the field and the identification of factors influencing its future trajectory [12]. Although the use of remote sensing and GIS tools to analyze the urban globalization characterized by FDI and TNCs is becoming increasingly prevalent, the previous studies have not yet become a major area of research. Building upon the intellectual structure of the preceding studies, particularly with regard to their critique of recent literature, this paper puts forth the following questions and suggestions for future research.
First, further analysis is required to examine the long-term relationship between FDI and the ecological environment at various levels, including the global, national, subnational, regional, and local levels. This will provide scientific evidence to support global sustainable development. The impact of FDI and TNCs on the local ecological environment can be studied through the use of real-time remote sensing monitoring tools. It would be beneficial to investigate the potential for enhancing the environmental regulation of FDI and TNCs in cities. Second, it is recommended that scholars utilize GIS technology to analyze, predict, and simulate future cross-border investment activities with the objective of optimizing the global industrial layout. Third, future studies could prove beneficial in exploring the role of TNCs and international NGOs in tracking and detecting global environmental governance through satellite imagery, so as to provide policy guidance on global issues. It is crucial to consider the potential challenges associated with the internationalization of remote sensing technology. Such considerations include the potential for transnational political risks and transnational legal issues to emerge. Fourth, an analysis of the global industrial chain of the remote sensing industry could be conducted in order to ascertain its embeddedness in urban space and its comprehensive impact on local development, including economic, social, cultural, and political aspects. Fifth, from a micro perspective, the impact of transnational investment in the remote sensing industry on urban and global governance could be understood in terms of the global organizing function and bargaining power of TNCs. This analysis should examine how these TNCs interact with multiple actors, such as governments and the public, and the ways in which they might more effectively discharge their social responsibilities. Sixth, the phenomenon of global urbanization encompasses a multitude of non-quantitative factors pertaining to urban challenges, including cultural conflicts, social responsibility, political risks, and environmental governance regulations. It is also necessary to consider how these non-quantitative factors can be better integrated with the quantifiable indicators of remote sensing technology. This can be achieved by adopting an interdisciplinary approach to the study of FDI.
Finally, this paper puts forth the proposition that quantitative analysis is insufficient for encompassing the entirety of a research field, whereas qualitative analysis is more suitable for reviews in fields with a lengthy historical development but a relatively limited total number of publications. In order to conduct a comprehensive review, it is essential to integrate quantitative analysis with qualitative methods. One such method is the mixed application of scientometric methods with qualitative literature reviews. In future research, scholars may wish to consider utilizing international cases and data to conduct transnational research, with the aim of enhancing cooperation and knowledge exchange among scholars and academic institutes from different countries.
Some limitations of this paper should be noted. This study is limited to literature published in English and Chinese; consequently, relevant studies in other languages have not been included. Owners of a large number of satellites, such as European Union countries and Japan, may conduct research in their native languages. Furthermore, qualitative reviews are inherently subjective. As Rozas and Klein (2010) [15] note, qualitative assessments are not always exhaustive and may lack precision. In addition to academic papers, documents used as sources for review may include, but are not limited to, websites, videos, interview transcripts, company reports, and government documents [13]. This literature review did not encompass all sources of reviews and further work is required in the future to provide a comprehensive reflection of the entire field of study.

Funding

This research was funded by the National Natural Science Foundation of China (grant number 42101197).

Data Availability Statement

The original contributions presented in the study are included in the article; further inquiries can be directed to the corresponding author.

Acknowledgments

I would like to express my sincerest gratitude to the reviewers and editor for their invaluable comments that instrumental in enhancing the final version of this paper.

Conflicts of Interest

The author declares no conflicts of interest.

Notes

1
The website of UCS is https://www.ucsusa.org/resources/satellite-database (accessed on 13 July 2024). One date of launch is missing from the data set, but this has a minimal impact on the overall trend.
2
The CiteSpace software (Version 6.3.1 at https://sourceforge.net/projects/citespace/files/, accessed on 13 July 2024) is selected as the primary quantitative analysis tool in this paper.

References

  1. Friedmann, J. The world city hypothesis. Dev. Chang. 1986, 17, 69–83. [Google Scholar] [CrossRef]
  2. Sassen, S. The Global City: New York, London, Tokyo; Princeton University Press: Princeton, NJ, USA, 2001. [Google Scholar]
  3. Scott, A.J. Global City-Regions: Trends, Theory, Policy; Oxford University Press: Oxford, UK, 2001. [Google Scholar]
  4. Gregory, D.; Johnston, R.; Pratt, G.; Watts, M.; Whatmore, S. The Dictionary of Human Geography; Wiley-Blackwell: New York, NY, USA, 2009; pp. 395–396, 771–772. [Google Scholar]
  5. Dicken, P. Global Shift: Mapping the Changing Contours of the World Economy, 7th ed.; Guilford Press: New York, NY, USA, 2015. [Google Scholar]
  6. Coe, N.M.; Hess, M.; Yeung, H.W.; Dicken, P.; Henderson, J. ‘Globalizing’regional development: A global production networks perspective. Trans. Inst. Br. Geogr. 2004, 29, 468–484. [Google Scholar] [CrossRef]
  7. Baker, J.C.; Williamson, R.A. Satellite imagery activism: Sharpening the focus on tropical deforestation. Singap. J. Trop. Geogr. 2006, 27, 4–14. [Google Scholar] [CrossRef]
  8. Charles, K.P.; Adolfo, C. Mascarenhas. Remote sensing in development. Science 1981, 214, 139–145. [Google Scholar]
  9. Torraco, R.J. Writing integrative literature reviews: Guidelines and examples. Hum. Resour. Dev. Rev. 2005, 4, 356–367. [Google Scholar] [CrossRef]
  10. Snyder, H. Literature review as a research methodology: An overview and guidelines. J. Bus. Res. 2019, 104, 333–339. [Google Scholar] [CrossRef]
  11. Torraco, R.J. Writing integrative literature reviews: Using the past and present to explore the future. Hum. Resour. Dev. Rev. 2016, 15, 404–428. [Google Scholar] [CrossRef]
  12. Watson, R.T.; Webster, J. Analysing the past to prepare for the future: Writing a literature review a roadmap for release 2.0. J. Decis. Syst. 2020, 29, 129–147. [Google Scholar] [CrossRef]
  13. Onwuegbuzie, A.J.; Leech, N.L.; Collins, K.M.T. Qualitative analysis techniques for the review of the literature. Qual. Rep. 2012, 17, 1–28. [Google Scholar] [CrossRef]
  14. Su, D.Z. GIS-based urban modelling: Practices, problems, and prospects. Int. J. Geogr. Inf. Sci. 1998, 12, 651–671. [Google Scholar] [CrossRef]
  15. Rozas, L.W.; Klein, W.C. The Value and Purpose of the Traditional Qualitative Literature Review. J. Evid.-Based Soc. Work. 2010, 7, 387–399. [Google Scholar] [CrossRef]
  16. Chen, C. CiteSpace II: Detecting and visualizing emerging trends and transient patterns in scientific literature. J. Am. Soc. Inf. Sci. Technol. 2006, 57, 359–377. [Google Scholar] [CrossRef]
  17. Chen, C. Science map: A systematic review of the literature. J. Data Inf. Sci. 2017, 2, 1–40. [Google Scholar]
  18. Davis, J.; Mengersen, K.; Bennett, S.; Mazerolle, L. Viewing systematic reviews and meta-analysis in social research through different lenses. SpringerPlus 2014, 3, 1–9. [Google Scholar] [CrossRef] [PubMed]
  19. Svensson, R.B.; Haggar, G.J.A.; Aurum, A.; Hooper, V.J. The application of geographical information systems to multinational finance corporations. Int. J. Bus. Syst. Res. 2009, 3, 437–455. [Google Scholar] [CrossRef]
  20. Weber, P.; Chapman, D. Investing in geography: A GIS to support inward investment. Comput. Environ. Urban Syst. 2009, 33, 1–14. [Google Scholar] [CrossRef]
  21. Horn, S.A.; Cross, A.R. Japanese production networks in India: Spatial distribution, agglomeration and industry effects. Asia Pac. Bus. Rev. 2016, 22, 612–640. [Google Scholar] [CrossRef]
  22. Özdoğan, M.; Baird, I.G.; Dwyer, M.B. The role of remote sensing for understanding large-scale rubber concession expansion in Southern Laos. Land 2018, 7, 55. [Google Scholar] [CrossRef]
  23. Wang, X.; Zhang, Y.; Zhang, J.; Fu, C.; Zhang, X. Progress in urban metabolism research and hotspot analysis based on CiteSpace analysis. J. Clean. Prod. 2021, 281, 125224. [Google Scholar] [CrossRef]
  24. Chen, C.; Hu, Z.; Liu, S.; Tseng, H. Emerging trends in regenerative medicine: A scientometric analysis in CiteSpace. Expert Opin. Biol. Ther. 2012, 12, 593–608. [Google Scholar] [CrossRef]
  25. Seto, K.C.; Kaufmann, R.K.; Woodcock, C.E. Landsat reveals China’s farmland reserves, but they’re vanishing fast. Nature 2000, 406, 121. [Google Scholar] [CrossRef] [PubMed]
  26. Seto, K.C.; Woodcock, C.E.; Song, C.; Huang, X.; Lu, J.; Kaufmann, R.K. Monitoring land-use change in the Pearl River Delta using Landsat TM. Int. J. Remote Sens. 2002, 23, 1985–2004. [Google Scholar] [CrossRef]
  27. Tan, M.; Li, X.; Li, S.; Xin, L.; Wang, X.; Li, Q.; Li, W.; Li, Y.; Xiang, W. Modeling population density based on nighttime light images and land use data in China. Appl. Geogr. 2018, 90, 239–247. [Google Scholar] [CrossRef]
  28. Zhao, M.; Cheng, W.; Zhou, C.; Li, M.; Huang, K.; Wang, N. Assessing spatiotemporal characteristics of urbanization dynamics in Southeast Asia using time series of DMSP/OLS nighttime light data. Remote Sens. 2018, 10, 47. [Google Scholar] [CrossRef]
  29. Liu, H.Y.; Tang, Y.K.; Chen, X.L.; Poznanska, J. The determinants of Chinese outward FDI in countries along “One Belt One Road”. Emerg. Mark. Financ. Trade 2017, 53, 1374–1387. [Google Scholar] [CrossRef]
  30. Du, J.; Zhang, Y. Does one belt one road initiative promote Chinese overseas direct investment? China Econ. Rev. 2018, 47, 189–205. [Google Scholar] [CrossRef]
  31. Duan, F.; Ji, Q.; Liu, B.Y.; Fan, Y. Energy investment risk assessment for nations along China’s Belt & Road Initiative. J. Clean. Prod. 2018, 170, 535–547. [Google Scholar]
  32. Huang, Y. Environmental risks and opportunities for countries along the Belt and Road: Location choice of China’s investment. J. Clean. Prod. 2019, 211, 14–26. [Google Scholar] [CrossRef]
  33. Yuan, J.; Li, X.; Xu, C.; Zhao, C.; Liu, Y. Investment risk assessment of coal-fired power plants in countries along the Belt and Road initiative based on ANP-Entropy-TODIM method. Energy 2019, 176, 623–640. [Google Scholar] [CrossRef]
  34. Hussain, J.; Zhou, K.; Guo, S.; Khan, A. Investment risk and natural resource potential in “Belt & Road Initiative” countries: A multi-criteria decision-making approach. Sci. Total Environ. 2020, 723, 137981. [Google Scholar] [PubMed]
  35. Hashemizadeh, A.; Ju, Y.; Bamakan, S.M.H.; Le, H.P. Renewable energy investment risk assessment in belt and road initiative countries under uncertainty conditions. Energy 2021, 214, 118923. [Google Scholar] [CrossRef]
  36. Dell’angelo, J.; D’odorico, P.; Rulli, M.C.; Marchand, P. The tragedy of the grabbed commons: Coercion and dispossession in the global land rush. World Dev. 2017, 92, 1–12. [Google Scholar] [CrossRef]
  37. D’Odorico, P.; Rulli, M.C.; Dell’Angelo, J.; Davis, K.F. New frontiers of land and water commodification: Socio-environmental controversies of large-scale land acquisitions. Land Degrad. Dev. 2017, 28, 2234–2244. [Google Scholar] [CrossRef]
  38. Davis, K.F.; Koo, H.I.; Dell’Angelo, J.; D’Odorico, P.; Estes, L.; Kehoe, L.J.; Kharratzadeh, M.; Kuemmerle, T.; Machava, D.; Pais, A.d.J.R.; et al. Tropical forest loss enhanced by large-scale land acquisitions. Nat. Geosci. 2020, 13, 482–488. [Google Scholar] [CrossRef]
  39. Liu, B.; Xue, D.; Zheng, S. Evolution and Influencing Factors of Manufacturing Production Space in the Pearl River Delta—Based on the Perspective of Global City-Region. Land 2023, 12, 419. [Google Scholar] [CrossRef]
  40. Tong, Y.; Zhou, H.; Jiang, L. Exploring the transition effects of foreign direct investment on the eco-efficiency of Chinese cities: Based on multi-source data and panel smooth transition regression models. Ecol. Indic. 2021, 121, 107073. [Google Scholar] [CrossRef]
  41. Wei, G.; Bi, M.; Liu, X.; Zhang, Z.; He, B.J. Investigating the impact of multi-dimensional urbanization and FDI on carbon emissions in the belt and road initiative region: Direct and spillover effects. J. Clean. Prod. 2023, 384, 135608. [Google Scholar] [CrossRef]
  42. Zou, Y.; Lu, Y.; Cheng, Y. The impact of polycentric development on regional gap of energy efficiency: A Chinese provincial perspective. J. Clean. Prod. 2019, 224, 838–851. [Google Scholar] [CrossRef]
  43. Schneider, A.; Seto, K.C.; Webster, D.R. Urban growth in Chengdu, Western China: Application of remote sensing to assess planning and policy outcomes. Environ. Plan. B Plan. Des. 2005, 32, 323–345. [Google Scholar] [CrossRef]
  44. Su, Y.; Lu, C.; Su, Y.; Wang, Z.; Huang, Y.; Yang, N. Spatio-temporal evolution of urban expansion based on a novel adjusted index and GEE: A case study of central plains urban agglomeration, China. Chin. Geogr. Sci. 2023, 33, 736–750. [Google Scholar] [CrossRef]
  45. Cao, R.; Zhu, J.; Tu, W.; Li, Q.; Cao, J.; Liu, B.; Zhang, Q.; Qiu, G. Integrating aerial and street view images for urban land use classification. Remote Sens. 2018, 10, 1553. [Google Scholar] [CrossRef]
  46. Tu, W.; Hu, Z.; Li, L.; Cao, J.; Jiang, J.; Li, Q.; Li, Q. Portraying urban functional zones by coupling remote sensing imagery and human sensing data. Remote Sens. 2018, 10, 141. [Google Scholar] [CrossRef]
  47. Yu, D.; Wei, Y.D. Spatial data analysis of regional development in Greater Beijing, China, in a GIS environment. Pap. Reg. Sci. 2008, 87, 97–119. [Google Scholar] [CrossRef]
  48. Cao, H.; Liu, J.; Chen, J.; Gao, J.; Wang, G.; Zhang, W. Spatiotemporal patterns of urban land use change in typical cities in the Greater Mekong Subregion (GMS). Remote Sens. 2019, 11, 801. [Google Scholar] [CrossRef]
  49. Krylov, V.A.; Kenny, E.; Dahyot, R. Automatic discovery and geotagging of objects from street view imagery. Remote Sens. 2018, 10, 661. [Google Scholar] [CrossRef]
  50. Huang, X.; Yang, J.; Li, J.; Wen, D. Urban functional zone mapping by integrating high spatial resolution nighttime light and daytime multi-view imagery. ISPRS J. Photogramm. Remote Sens. 2021, 175, 403–415. [Google Scholar] [CrossRef]
  51. Müller, M.F.; Penny, G.; Niles, M.T.; Ricciardi, V.; Chiarelli, D.D.; Davis, K.F.; Dell’angelo, J.; D’odorico, P.; Rosa, L.; Rulli, M.C.; et al. Impact of transnational land acquisitions on local food security and dietary diversity. Proc. Natl. Acad. Sci. USA 2021, 118, e2020535118. [Google Scholar] [CrossRef]
  52. Liu, B.; Xue, D.; Tan, Y. Deciphering the manufacturing production space in global city-regions of developing countries—A case of Pearl River Delta, China. Sustainability 2019, 11, 6850. [Google Scholar] [CrossRef]
  53. Zhang, P.; Yang, X.; Chen, H.; Zhao, S. Matching relationship between urban service industry land expansion and economy growth in China. Land 2023, 12, 1139. [Google Scholar] [CrossRef]
  54. Cho, K.; Goldstein, B.; Gounaridis, D.; Newell, J.P. Hidden risks of deforestation in global supply chains: A study of natural rubber flows from Sri Lanka to the United States. J. Clean. Prod. 2022, 349, 131275. [Google Scholar] [CrossRef]
  55. Shi, F.; Xu, H.; Hsu, W.L.; Lee, Y.C.; Zhu, J. Spatial pattern and influencing factors of outward foreign direct investment enterprises in the Yangtze River Economic Belt of China. Information 2021, 12, 381. [Google Scholar] [CrossRef]
  56. Yin, Y.; Liu, Y. Investment suitability assessment based on B&R symbiotic system theory: Location choice of China’s OFDI. Systems 2022, 10, 195. [Google Scholar] [CrossRef]
  57. Liu, C.; Yan, S. Transnational technology transfer network in China: Spatial dynamics and its determinants. J. Geogr. Sci. 2022, 32, 2383–2414. [Google Scholar] [CrossRef]
  58. Xu, Y.; Zuo, X.L. Technology roadmapping of geo-spatial information and application services industry in China. Forum Sci. Technol. China 2016, 4, 30–36. [Google Scholar]
  59. Robinson, D.K.R.; Mazzucato, M. The evolution of mission-oriented policies: Exploring changing market creating policies in the US and European space sector. Res. Policy 2019, 48, 936–948. [Google Scholar] [CrossRef]
  60. Auque, F. The space industry in the context of the European aeronautics and defence sector. Air Space Eur. 2000, 2, 22–25. [Google Scholar] [CrossRef]
  61. George, K.W. The economic impacts of the commercial space industry. Space Policy 2019, 47, 181–186. [Google Scholar] [CrossRef]
  62. von Maurich, O.; Golkar, A. Data authentication, integrity and confidentiality mechanisms for federated satellite systems. Acta Astronaut. 2018, 149, 61–76. [Google Scholar] [CrossRef]
  63. Zelnio, R.J. Whose jurisdiction over the US commercial satellite industry? Factors affecting international security and competition. Space Policy 2007, 23, 221–233. [Google Scholar] [CrossRef]
  64. Naqvi, S.A.A.; Naqvi, R.Z. Geographical information systems (GIS) in industry 4.0: Revolution for sustainable development. In Handbook of Smart Materials, Technologies, and Devices: Applications of Industry 4.0; Springer International Publishing: Cham, Switzerland, 2021; pp. 1–27. [Google Scholar]
  65. Kleemann, J.; Baysal, G.; Bulley, H.N.N.; Fürst, C. Assessing driving forces of land use and land cover change by a mixed-method approach in north-eastern Ghana, West Africa. J. Environ. Manag. 2017, 196, 411–442. [Google Scholar] [CrossRef]
  66. Chen, W.; Huang, H.; Dong, J.; Zhang, Y.; Tian, Y.; Yang, Z. Social functional mapping of urban green space using remote sensing and social sensing data. ISPRS J. Photogramm. Remote Sens. 2018, 146, 436–452. [Google Scholar] [CrossRef]
  67. Seto, K.C.; Kaufmann, R.K. Modeling the drivers of urban land use change in the Pearl River Delta, China: Integrating remote sensing with socioeconomic data. Land Econ. 2003, 79, 106–121. [Google Scholar] [CrossRef]
Figure 1. The clusters and evolution of subjects. Source: Mapping scientometric analytic software CiteSpace.
Land 13 01313 g001
Figure 2. Annual distribution of publications and citation footprint. Source: Data from WOS platform.
Land 13 01313 g002
Figure 3. The landscape view of the keyword co-citation cluster network. Source: Mapping scientometric analytic software CiteSpace. Note: Modularity Q = 0.7031, clustering structure is significant; Weighted mean silhouette S = 0.8696, clustering result is convincing.
Land 13 01313 g003
Figure 4. Top 10 keywords with strongest citation bursts. Source: Mapping scientometric analytic software CiteSpace. Note: The red color in the image indicates a significant citation burst.
Land 13 01313 g004
Figure 5. Top 15 references with the strongest citation bursts [5,25,26,27,28,29,30,31,32,33,34,35,36,37,38]. Source: Mapping scientometric analytic software CiteSpace. Note: The red color in the image indicates a significant citation burst.
Land 13 01313 g005
Figure 6. Map of the cooperation networks among countries and regions. Source: mapping scientometric analytic software CiteSpace.
Land 13 01313 g006
Figure 7. Map of the cooperation networks among institutions. Source: mapping scientometric analytic software CiteSpace.
Land 13 01313 g007
Table 1. The procedure steps of quantitative analysis by CiteSpace.
StepDescriptionDetails
1Topic identificationIdentify a knowledge domain using the broadest possible terms
2Data collectionCollect data of commonly used sources of scientific literature
3Terms extractExtract research front terms
4Time slicingBuild time series models over time
5Outcome layoutAnalyze domains and generate visualizations
Source: summary from [16,17].
Disclaimer/Publisher’s Note: The statements, opinions and data contained in all publications are solely those of the individual author(s) and contributor(s) and not of MDPI and/or the editor(s). MDPI and/or the editor(s) disclaim responsibility for any injury to people or property resulting from any ideas, methods, instructions or products referred to in the content.

