Article

Spatial–Temporal Changes and Driving Factor Analysis of Net Ecosystem Productivity in Heilongjiang Province from 2010 to 2020

1
School of Public Administration and Law, Northeast Agricultural University, Harbin 150030, China
2
Xinjiang Water Conservancy and Hydropower Survey Design Institute Co., Ltd., Urumqi 830000, China
3
Security Management Department, Inner Mongolia University for Nationalities, Tongliao 028000, China
*
Author to whom correspondence should be addressed.
Land 2024, 13(8), 1316; https://doi.org/10.3390/land13081316
Submission received: 25 June 2024 / Revised: 13 August 2024 / Accepted: 14 August 2024 / Published: 20 August 2024

Abstract

:
Net ecosystem productivity (NEP) is an important indicator for the quantitative evaluation of carbon sources/sinks in terrestrial ecosystems. An improved CASA model and soil respiration model, combined with MODIS and meteorological data, are utilized to estimate vegetation NEP from 2010 to 2020. A Theil–Sen trend analysis, a Mann–Kendall test, the Hurst index, and geographical detector methods were employed to analyze the spatiotemporal variations in NEP in Heilongjiang Province and its driving factors. The results show the following: (1) The overall NEP in Heilongjiang Province exhibited a fluctuating upward trend from 2010 to 2020, with a growth rate of 4.74 g C·m−2·yr−1, and an average annual NEP of 404 g C·m−2·yr−1. Spatially, NEP exhibits a distribution pattern of “low from east to west to high from north to south in the central region”, with 99.27% of the area being a carbon sink. (2) Significant regional differences were observed in the spatial trend of NEP changes, with 78.39% of regions showing increasing trends and 17.53% showing decreasing trends. Future NEP changes are expected to continue, with regions showing a persistent increase (58.44%), potential decrease (19.95%), potential increase (5.65%), and persistent decrease (11.88%). (3) The geographical detector results indicate that altitude is the dominant factor affecting NEP, followed by slope, temperature, population density, etc. The interaction-detector results show that the interaction between each factor shows an increasing trend, and the interaction between any two factors is higher than that of a single factor. The research results can provide scientific references for reducing emissions, increasing sinks, and protecting ecosystems in Heilongjiang Province.

1. Introduction

Since the Industrial Revolution, human activities such as the burning of fossil fuels and deforestation [1] have increased the concentration of carbon dioxide in the atmosphere by approximately 50% compared with pre-industrial levels [2]. The continuous rise in carbon dioxide concentration has altered global carbon-cycle patterns [3], exacerbating climate warming [4], which, in turn, has triggered a series of climate and environmental issues. These include droughts and floods, tropical storms, sea-level rise, and changes in precipitation patterns, severely restricting the coordinated and sustainable development of society, the economy, and ecology. In their October 2018 report, the United Nations Intergovernmental Panel on Climate Change (IPCC) pointed out that to achieve the goal of limiting global temperature rise to within 1.5 degrees Celsius, global carbon emissions need to be halved by 2030 and to reach net zero by the middle of the current century [5]. As a major carbon emitter, China has committed to peaking carbon emissions by 2030 and achieving carbon neutrality by 2060. Net ecosystem productivity (NEP) is the net carbon exchange between terrestrial ecosystems and the atmosphere, serving as a critical indicator for quantitatively assessing terrestrial ecosystem carbon sources and sinks [6]. Therefore, accurately understanding the spatiotemporal variations in NEP and revealing its driving mechanisms are of great significance for maintaining global carbon balance, mitigating climate change, and achieving carbon neutrality targets.
In recent years, research on the carbon cycle of terrestrial ecosystems has become a focal point in the fields of regional sustainable development and climate change [4]. Scholars, both domestic and international, have utilized methods and technologies such as field measurements [7], atmospheric remote-sensing inversions [8], and model simulations [9] to scientifically analyze and explore the carbon budget [10], carbon source/sink properties [11], and climate responses [12] of major carbon pools in different regions (e.g., Europe [13], China [14], provinces [15], and river basins [16]), including forests [17], grasslands [18], and farmlands [19]. Additionally, the spatiotemporal evolution and quantitative attribution of driving forces in the carbon cycle of terrestrial ecosystems are current research hotspots in this field. Existing studies have used methods such as linear regression [20], correlation analysis [10], geographic detectors [21], and random forests [22], combined with climate-change data, to analyze the spatiotemporal variations and driving factors of carbon sources/sinks in vegetation ecosystems across different regions [10]. Research has shown that the spatiotemporal variations in vegetation NEP and its driving factors exhibit significant spatial heterogeneity and that there are notable differences in the response and sensitivity of different vegetation types to climate change [23]. Overall, existing research has mostly focused on single vegetation types or specific regions, lacking a comprehensive assessment of carbon cycling in complex ecosystems [24]. In addition, research has mostly focused on the impact of climate factors (such as temperature and precipitation) on NEP, while ignoring the complexity of human factors and the interaction of multiple factors [22]. Therefore, exploring more comprehensive and systematic research methods to reveal the underlying mechanisms of NEP changes has become a key issue that urgently needs to be addressed in the current carbon-cycle research.
Heilongjiang Province, with its vast territory, rich natural resources, and diverse topography and climate types, is a crucial part of the “Northeast Forest Belt” in China’s “Two Screens and Three Belts” ecological security strategy. It is also an important area for ensuring national ecological security and promoting high-quality development in Northeast China [25]. Therefore, conducting a quantitative assessment of the carbon-sequestration capacity of vegetation in Heilongjiang Province and studying the spatiotemporal pattern changes and influencing factors hold significant scientific value for rationally regulating the carbon cycle of vegetation ecosystems and implementing ecological protection projects [20]. Currently, preliminary studies have been conducted on the net primary productivity of vegetation in Heilongjiang Province [26], changes in vegetation cover [25], and spatiotemporal dynamic patterns of carbon sources and sinks in the three northeastern provinces [11]. However, there is still a lack of in-depth research on the spatiotemporal distribution characteristics and driving mechanisms of vegetation NEP in Heilongjiang Province. In view of this, based on multi-source data such as MODIS, meteorology, topography, and socio-economic factors, this article uses an improved CASA model and soil respiration model to estimate the vegetation NEP in Heilongjiang Province from 2010 to 2020 and deeply analyzes its spatiotemporal variation characteristics and driving factors. The aim is to provide scientific basis for ecosystem carbon management in Heilongjiang Province and even larger areas and to provide decision-making references for formulating effective emission reduction and sink-enhancement strategies and ecological protection measures, thereby helping to achieve China’s and even the world’s carbon-neutrality goals.

2. Materials and Methods

2.1. Study Area

Heilongjiang Province (121°11′–135°05′ E, 43°26′–53°33′ N) is located in Northeastern China, covering a total area of 473,000 square kilometers. It governs 12 prefecture-level cities, including Harbin and Daqing, as well as the Daxing’anling region (Figure 1). The terrain is high in the northwest, north, and southeast and low in the northeast and southwest [27], with mountains, plains, and terraces making up 58%, 28%, and 14% of the total area, respectively. The province experiences a cold temperate and temperate continental monsoon climate, spanning humid, semi-humid, and semi-arid zones from east to west. The annual average temperature ranges from −4 °C to 5 °C, with average annual precipitation between 400 and 650 mm [28]. The province boasts diverse vegetation types, including shrubs, larch, mixed coniferous and broad-leaved forests, and meadows. These abundant natural resources enable Heilongjiang Province to play a significant role in the global–regional carbon cycle [29].

2.2. Data Source and Pretreatment

This study involves data on remote-sensing imagery, land cover, meteorology, topography, and socio-economics. The remote-sensing data were sourced from NASA’s website (https://ladsweb.modaps.eosdis.nasa.gov/, accessed on 15 July 2024) and included EOS/MODIS products from 2010 to 2020. These products include the MOD13A1 dataset (NDVI, Normalized Difference Vegetation Index; spatial resolution of 500 m and temporal resolution of 16 days), the MOD16A2 dataset (Net Evapotranspiration, spatial resolution of 500 m, and temporal resolution of 8 days), and the MOD17A3H v006 dataset (NPP, spatial resolution of 500 m, temporal resolution of 1 year). MRT (MODIS Reprojection Tool) software and ArcGIS 10.8 software were used to perform preprocessing such as mosaicking, format conversion, reprojection, and filtering to remove outliers on MOD13A1 and MOD16A2 images; and Maximum Value Composition (MVC) was used to generate monthly data. The land-cover data were sourced from the 2015 NASA’s MODIS product MCD12Q1 dataset, with a spatial resolution of 500 m. Preprocessing of these images included mosaicking, reprojection, and format conversion. The land cover was classified into 15 categories based on the International Geosphere–Biosphere Programme (IGBP) classification rules. For the purpose of analyzing NEP trends across different vegetation types, these categories were further consolidated into six types: forests, grasslands, built-up lands, croplands, wetlands, and water bodies.
The meteorological data were sourced from the ECMWF ERA5 reanalysis dataset, specifically the ERA5-Land monthly averaged data from 2010 to 2020 (ERA5-Land monthly averaged data from 1950 to present). The average temperature at 2 m, surface downward solar radiation, and total precipitation were selected to represent the monthly average temperature, monthly total radiation, and monthly total precipitation, respectively.
The topographic data were sourced from the European Space Agency’s Copernicus PANDA website (https://panda.copernicus.eu/panda, accessed on 12 July 2024), providing global DEM data with a resolution of 30 m. The slope data were calculated based on the DEM data.
The socio-economic data were sourced from the Resource and Environment Science and Data Registration and Publication System, providing the 1 km resolution gridded datasets of China’s population distribution and Gross Domestic Product (GDP) distribution [30].
All data were uniformly projected to the WGS 1984/UTM Zone 51N coordinate system, and the spatial resolution was resampled to 500 m to facilitate subsequent data processing and analysis.

2.3. Research Methods

2.3.1. NEP Estimation Model

Net ecosystem productivity (NEP) was initially proposed by Woodwell [31] as a crucial indicator for measuring the carbon source/sink of regional vegetation. It is typically represented by the difference between net primary productivity (NPP) and soil heterotrophic respiration (Rh) [32]. The formula is as follows:
NEP = NPP − Rh
In the formula, NEP is the net ecosystem productivity of vegetation, NPP is the net primary productivity of vegetation, and Rh is the heterotrophic respiration rate of soil, all in units of g C·m−2. Net primary productivity (NPP) refers to the remaining material energy obtained by green plants per unit area and unit time, excluding autotrophic respiration consumption [33]. The CASA model (Carnegie–Ames–Stanford Approach) is a model used to estimate net primary productivity (NPP) of vegetation. This model multiplies the photosynthetically active radiation absorbed by vegetation with the utilization rate of light energy by vegetation during photosynthesis to obtain an estimate of the net primary productivity of vegetation. The CASA model uses remote-sensing data and meteorological data as the basic data sources, utilizing remote-sensing and geographic information-system technology, while considering the impact of driving factors such as land-use type, surface vegetation, solar radiation, temperature, and hydrology. Using the CASA model based on light energy-utilization efficiency to simulate and estimate the monthly NPP of Heilongjiang Province from 2010 to 2020, the annual NPP is obtained by accumulating each month. The calculation method of the model is described in References [34,35,36]. The soil heterotrophic respiration rate was estimated using the relationship model established by Pei Zhiyong et al., and the specific calculation can be found in Reference [37]. When NEP > 0, it indicates that the ecosystem is a carbon sink, while when NEP < 0, it indicates that the ecosystem is a carbon source.

2.3.2. Sen + Mann–Kendall Trend Analysis

The Sen slope estimator is a non-parametric statistical method used to estimate the slope of the data trend. This method is robust against noise, shows good stability, and is insensitive to errors, so it is used to explore the trend of NEP changes in Heilongjiang Province. The specific calculation can be found in Reference [38].
Mann–Kendall is a non-parametric statistical test method used to determine trends in time-series data. Its advantages include not assuming normality of the data and being robust against outliers, thus accurately revealing trends in the overall time series. The calculation method is described in Reference [39]. In the bilateral trend test, according to the normal distribution table, if the standard value, Z, is greater than 0, the sequence shows an upward trend; if it is less than 0, the sequence shows a downward trend. When the absolute value of Z is greater than or equal to 1.65, 1.96, and 2.58, it indicates that the results have passed the significance tests with confidence levels of 90%, 95%, and 99%.

2.3.3. Hurst Index

The Hurst exponent based on the R/S method quantitatively describes the persistence of time-series data. The specific calculation can be found in Reference [40]. The Hurst exponent ranges between 0 and 1, with 0.5 as a midpoint. Different characteristics of the time series are exhibited across this range. When 0 < H < 0.5, future changes tend to be opposite to past trends; the closer H is to 0, the stronger the anti-persistence. When H = 0.5, the time series is random. When 0.5 < H < 1, future changes tend to continue past trends; the closer H is to 1, the stronger the persistence.

2.3.4. Geographic Detector

Geographic detector refers to a set of statistical methods [41] used to detect spatial heterogeneity and to reveal its driving mechanisms. This paper utilizes factor detectors and interaction detectors within the model to analyze the driving factors influencing NEP (net ecosystem productivity) in Heilongjiang Province, investigating the primary driving factors and their interactions.
Based on previous research findings and considering regional conditions and data availability, meteorological factors (radiation X1, precipitation X2, temperature X3, and evapotranspiration X6), topographic factors (altitude X4 and slope X5), and socio-economic factors (GDP X7 and population density X8) were selected for geographic detector analysis. A 5 km × 5 km grid was created using ArcGIS 10.2, with 10,575 sampling points selected. Additionally, considering that geographic detectors require categorical data as inputs, optimal spatial data discretization of continuous variables was conducted using the “GD” package in R Studio 4.3.0 software.

3. Results

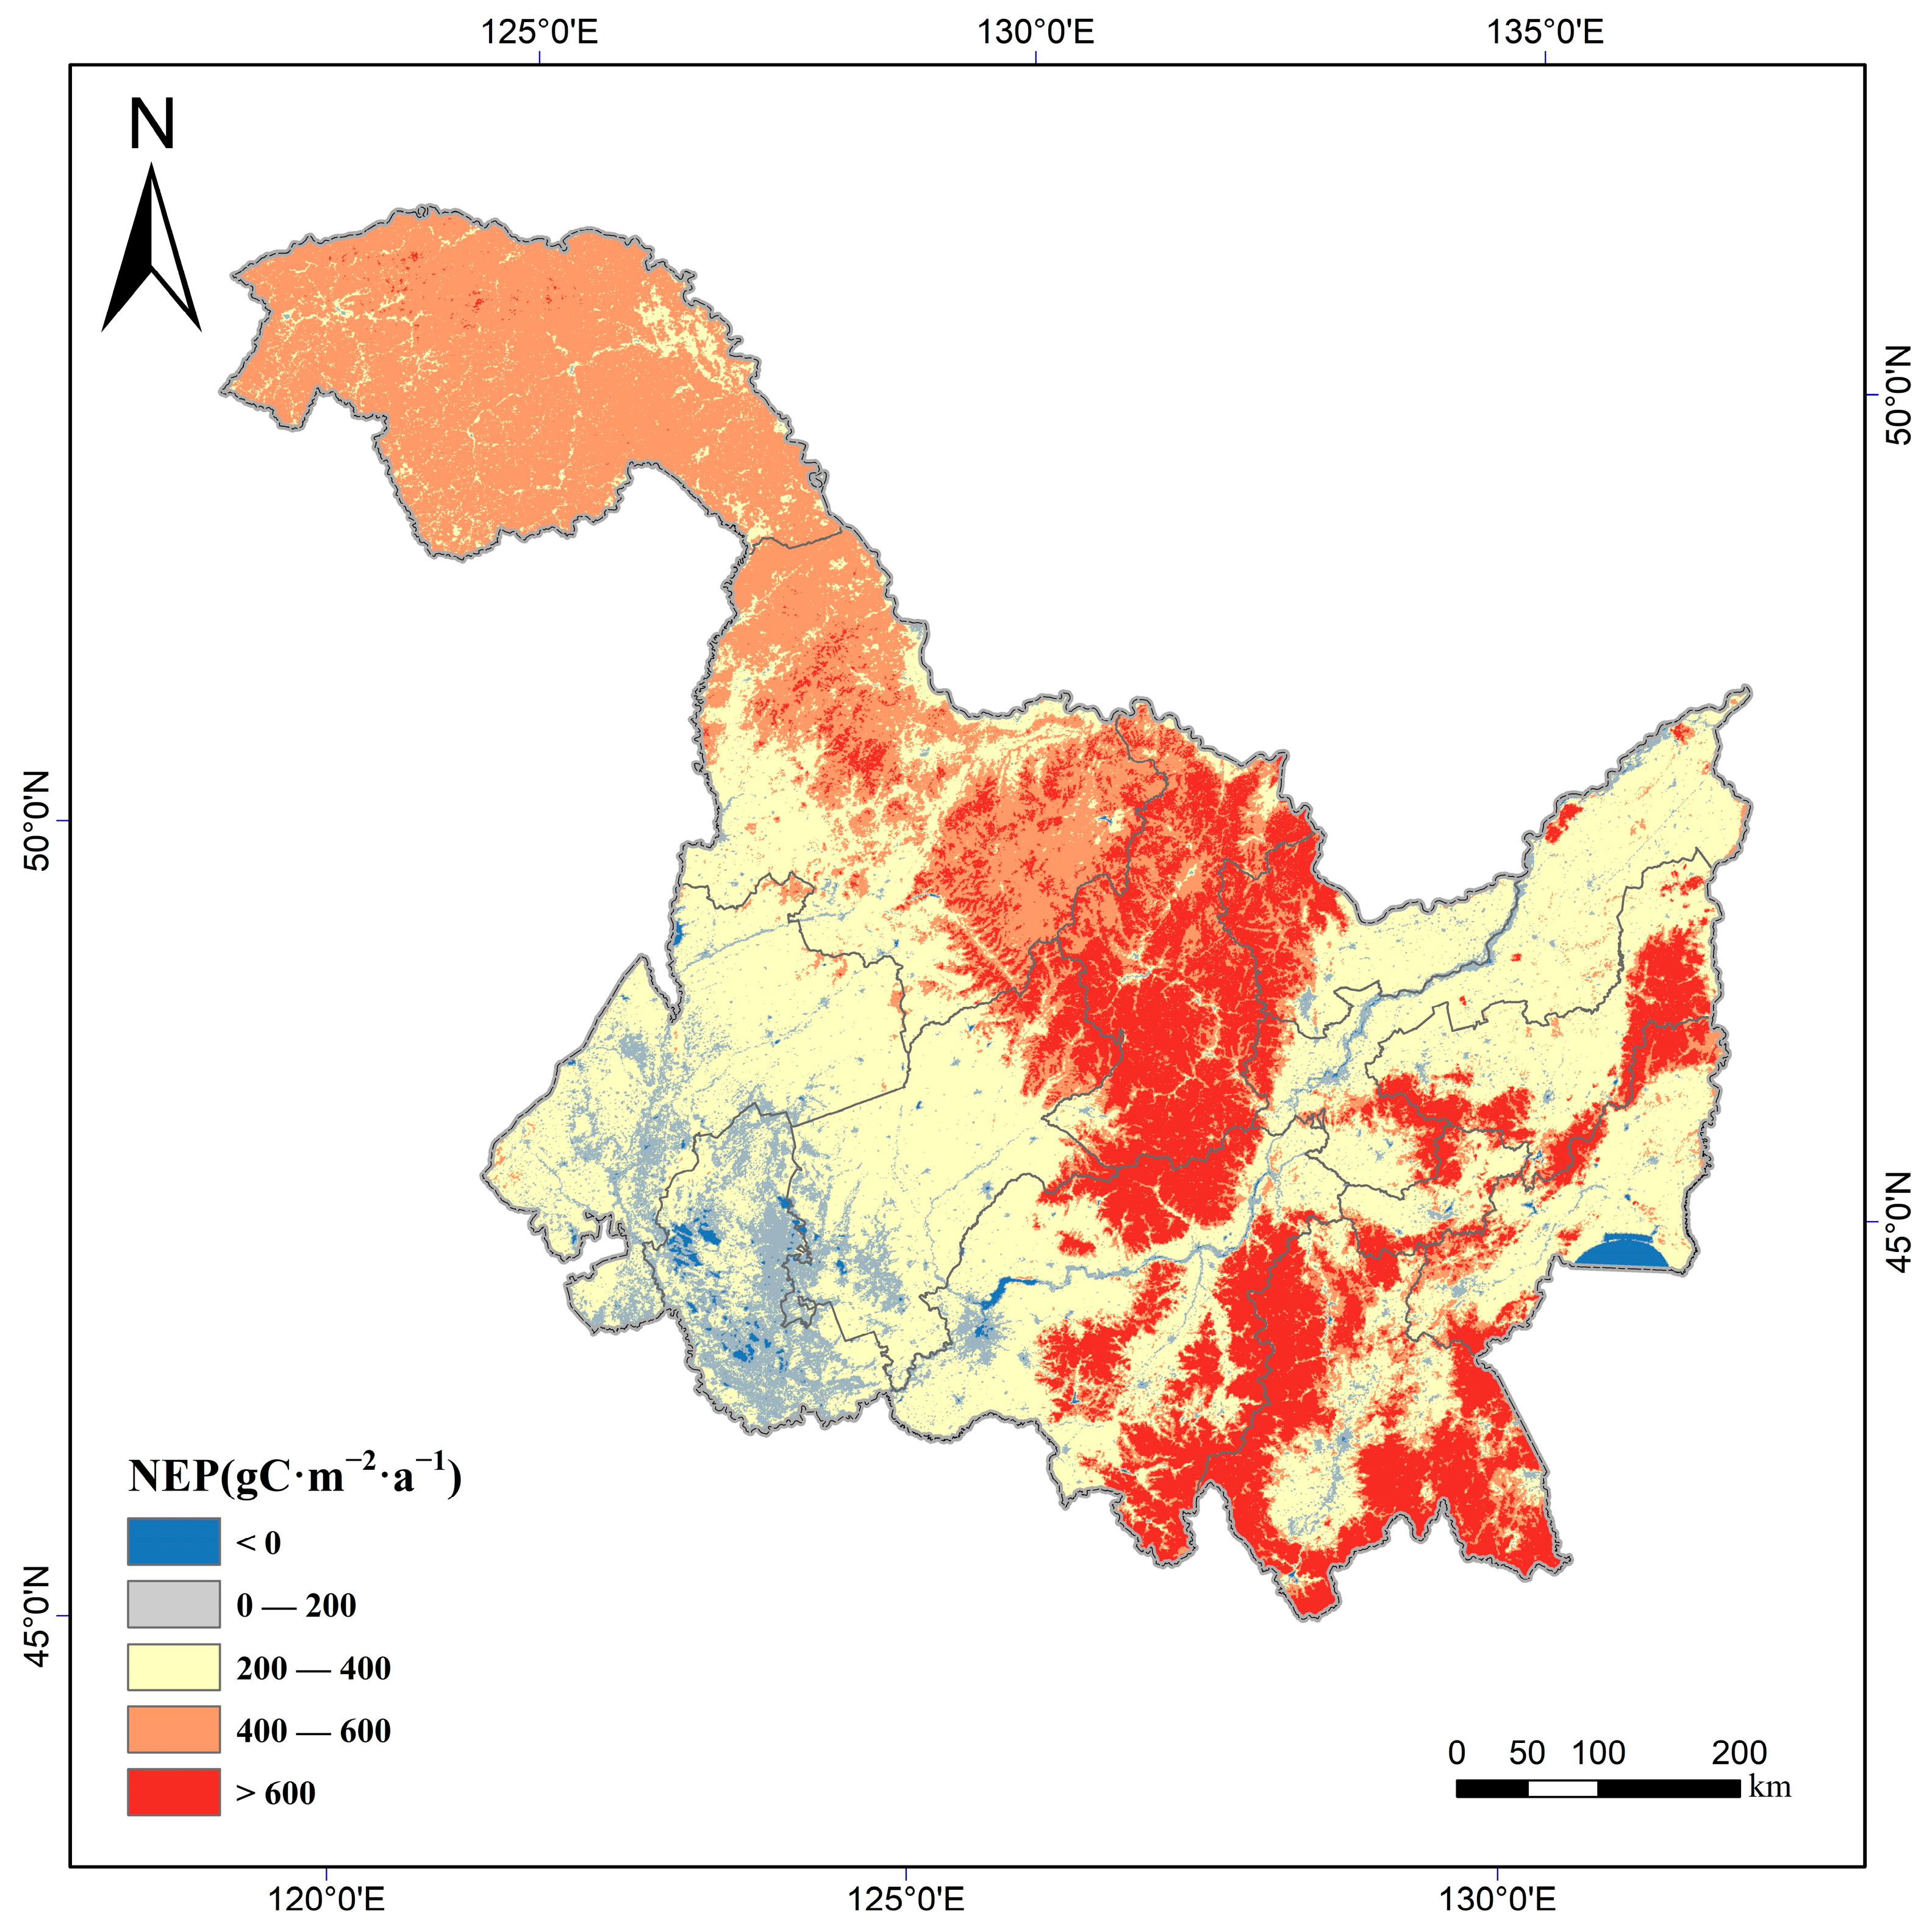
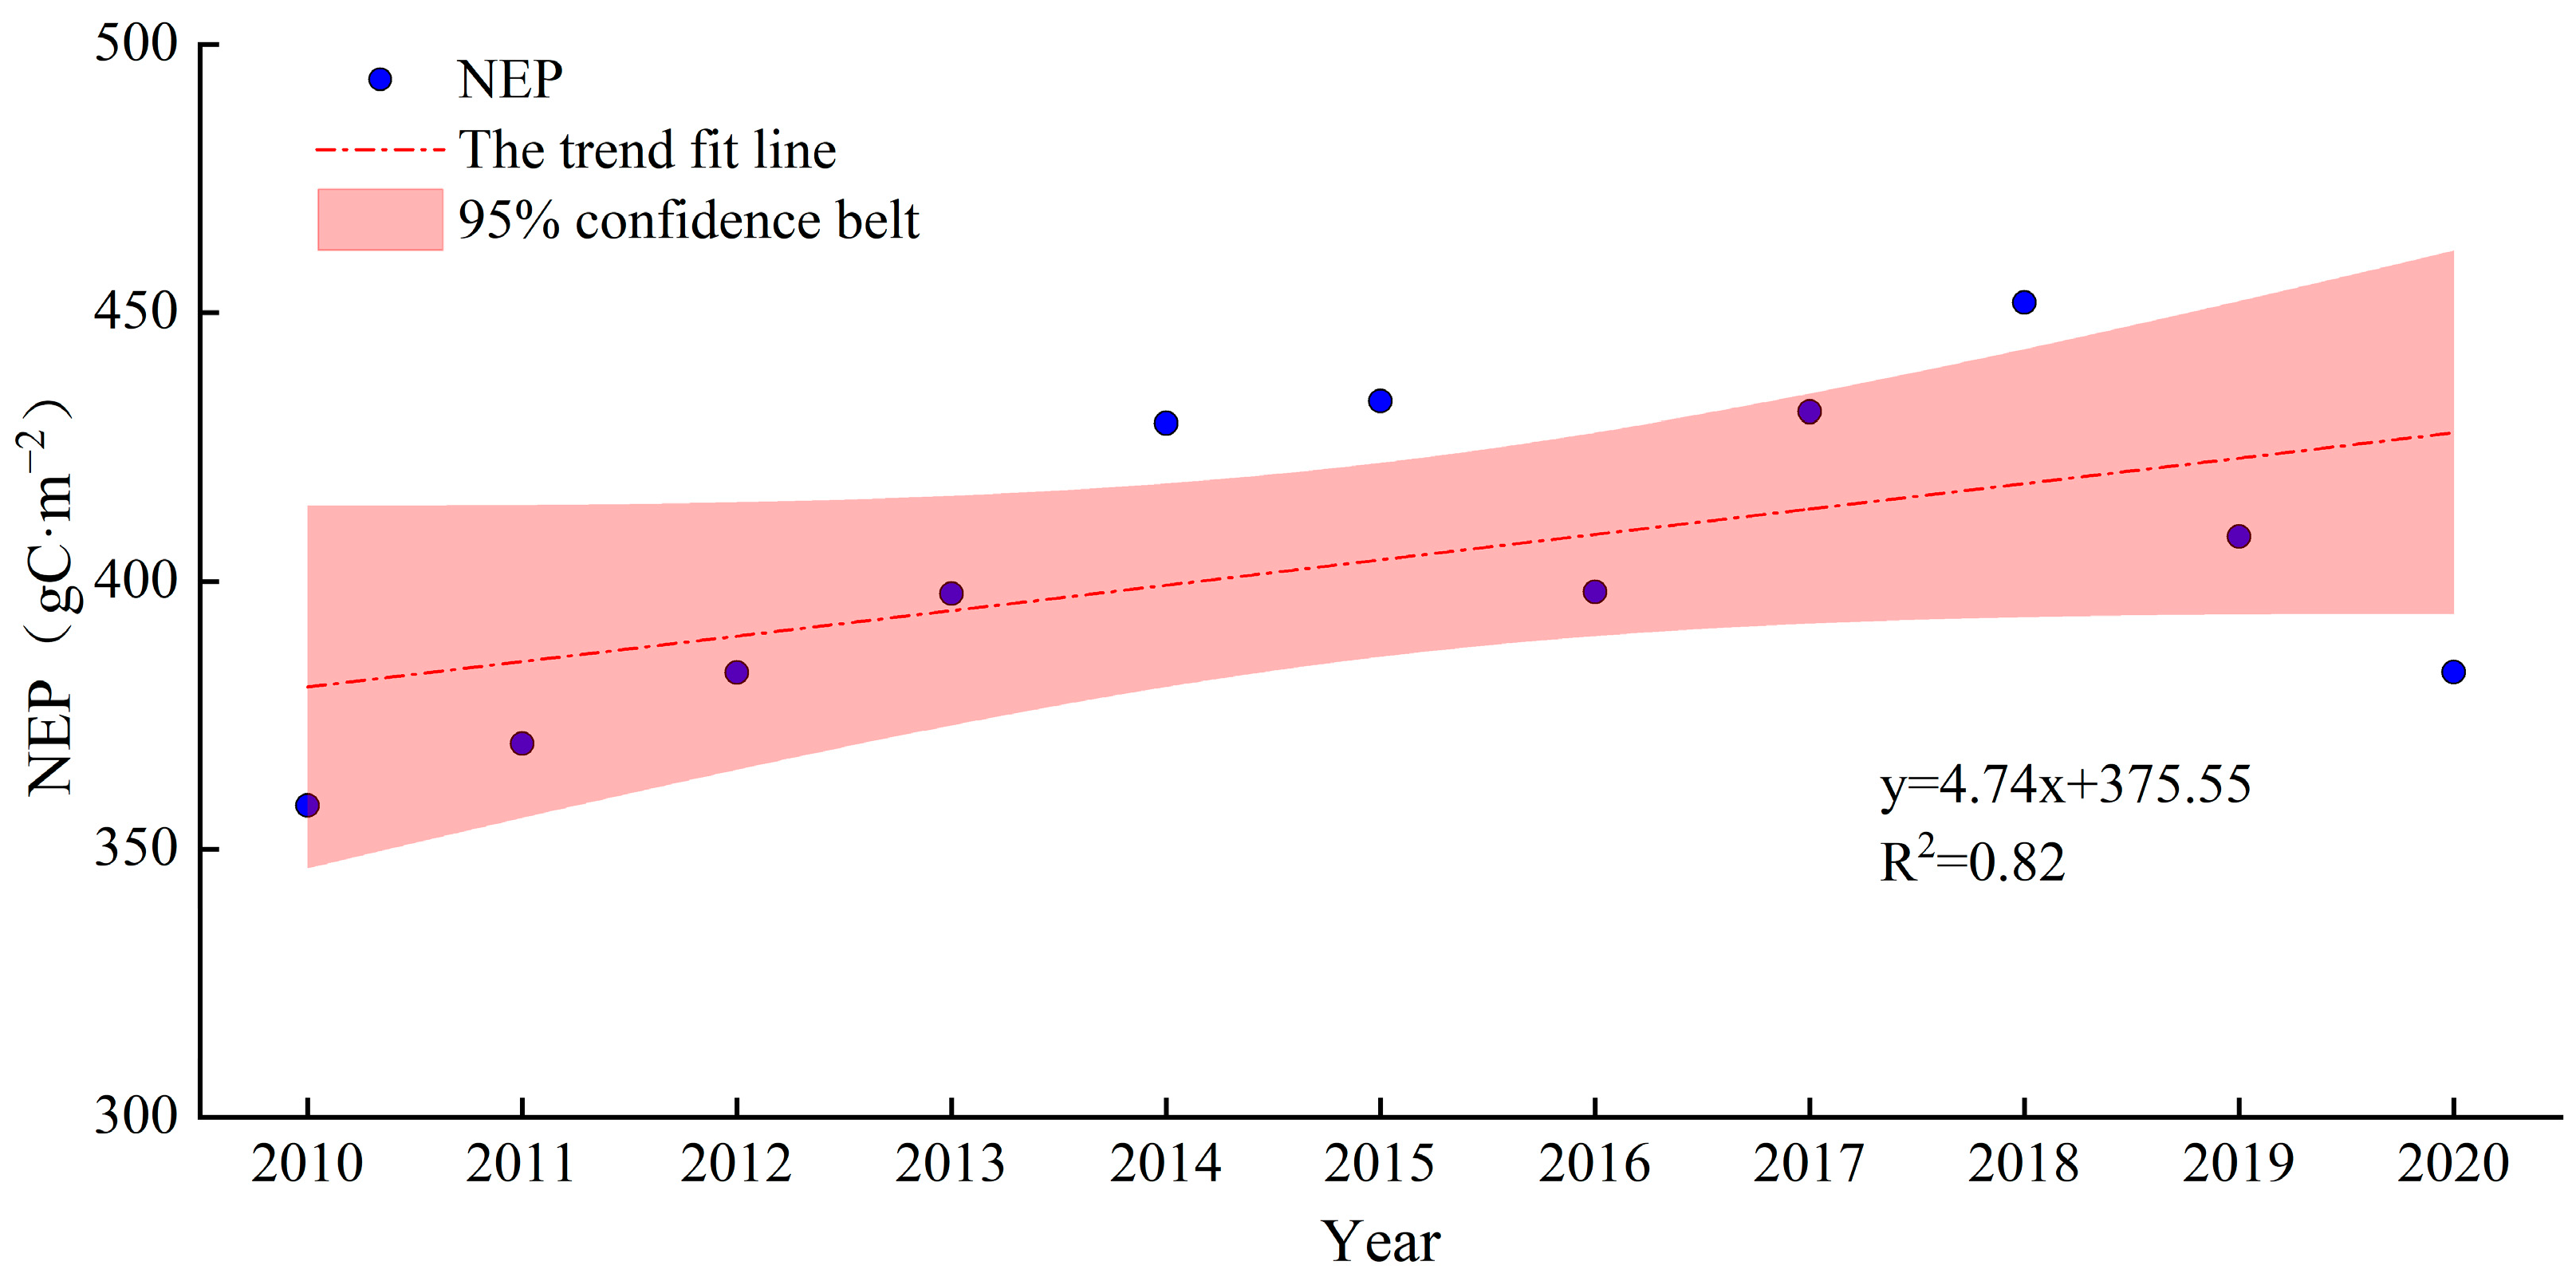
3.1. Spatiotemporal Distribution Characteristics of NEP

From 2010 to 2020, the NEP in Heilongjiang Province exhibited pronounced spatial differentiation, showing an overall distribution pattern of low in the east and west and high in the central and northern regions (Figure 2). Areas of carbon sink (NEP > 0) made up approximately 452,700 km2, accounting for about 99.27% of the total area. Regions with NEP average values ranging from 200 to 400 g C·m−2·a−1 constituted the largest proportion, approximately 43.70% of the total area, mainly concentrated in the plains of Qiqihar and Suihua in Western Heilongjiang Province and in Jiamusi and Jixi in the east. These regions have sufficient precipitation and suitable temperatures conducive to vegetation growth and are predominantly covered by farmlands and grasslands. High-value areas with NEP average values exceeding 600 g C·m−2·a−1 were mainly distributed in the southeastern mountainous regions of Heilongjiang Province, including Mudanjiang and Shuangyashan, and in the central part of the Lesser Khingan Mountains in Yichun. These areas have relatively high altitudes and favorable water–thermal conditions [42], with forests as the dominant vegetation cover, resulting in higher cumulative NEP averages. The carbon source areas (NEP < 0) covered approximately 3300 km2, about 0.73% of the total area, with an annual average carbon emission of 1.10 t C·a−1. These areas are primarily found in Daqing, Xingkai Lake in Songhua River, and Jixi, characterized by low vegetation cover, predominantly consisting of wetlands and water bodies. In terms of temporal changes (Figure 3), the overall NEP trend in Heilongjiang Province showed fluctuating increases during the study period, with a growth rate of 4.74 g C·m−2·a−1. However, significant declines were observed in 2016 and 2019, possibly due to severe extreme weather events such as droughts, strong winds, hailstorms, and blizzards in those years. Over the 11-year period, the average NEP value was 404 g C·m−2·a−1, with an annual average carbon sequestration of approximately 736.93 t C·a−1. The lowest NEP average value was recorded in 2010, at 358.17 g C·m−2·a−1, while the highest was in 2018, at 451.83 g C·m−2·a−1.
In Heilongjiang Province, there are notable differences in NEP among different vegetation types. Looking at interannual variations (Figure 4), the average NEP values of various vegetation types generally follow a pattern of increase–decrease–increase–decrease over the years. Grasslands exhibit significant fluctuation between years, while forests, croplands, and wetlands show relatively minor fluctuations, suggesting significant changes in grassland extent over the past decade, either increasing or decreasing. Considering the average and total NEP values of various vegetation types over the years (Figure 5), the average NEP for forest ecosystems over 11 years was 559.51 g C·m−2·a−1, totaling 5662.21 t C. Grassland ecosystems averaged 223.82 g C·m−2·a−1, totaling 243.79 t C. Cropland ecosystems averaged 255.53 g C·m−2·a−1, totaling 2146.72 t C. Wetland ecosystems averaged 207.03 g C·m−2·a−1, totaling 17.34 t C. The frequency distributions of NEP for these four vegetation types show that forests have the widest distribution, with most NEP frequencies falling within the range of 450–750 g C·m−2·a−1. Grassland NEP ranges between −100 and 500 g C·m−2·a−1. Cropland NEP is more concentrated, primarily falling within the range of 200–300 g C·m−2·a−1. Wetlands, with the smallest area, are primarily distributed within a range from −100 to 400 g C·m−2·a−1, with less pronounced peaks. Overall, carbon cycling in Heilongjiang Province is dominated by carbon-sink processes. Forests exhibit the highest carbon-sink capacity and total carbon sequestration, followed by croplands, grasslands, and wetlands. Forests and croplands act as carbon sinks, while a small portion of grasslands and wetlands function as carbon sources, showing negative NEP values.

3.2. Spatial Characteristics of NEP Changes

Based on the spatial variation trends and significance test results of NEP in Heilongjiang Province from 2010 to 2020 (Figure S1), it is evident that there is significant spatial heterogeneity in the interannual NEP trends. At the pixel scale, the change rates exhibit a decreasing trend from southeast to northwest. The Sen trend values range from −65.02 to 89.59 g C·m−2·a−1, with an average increase rate of 5.91 g C·m−2·a−1. Areas showing an increasing NEP trend account for 78.39% of the total area, with 28.66% of the regions exhibiting a significant increase in NEP and 6.55% showing an extremely significant increase, mainly distributed in Mudanjiang City, the Songhua River Basin, and the eastern part of the Greater Khingan Mountains. Regions with a decreasing NEP trend cover 17.53% of the total area, scattered in Heihe City, Suihua City, and the western part of the Greater Khingan Mountains. Areas where NEP shows no significant change comprise approximately 4.08% of the area, primarily distributed in wetlands and aquatic areas.

3.3. Future Trends of NEP

The Hurst index in Heilongjiang Province ranges from 0.08 to 1.00, with an average of 0.57 (Figure S1). Areas where the Hurst index exceeds 0.5 account for 73.52% of the total area, indicating a persistent trend in vegetation NEP changes, suggesting that future NEP trends in most regions will remain consistent with the past. Specifically, areas showing strong persistence (H > 0.75) cover 7.08% of the total area, primarily located in the western part of Qiqihar City, Daqing City, Jiamusi City, and the eastern part of the Greater Khingan Mountains. Regions where the Hurst index is less than 0.5 cover 26.48% of the total area, scattered across central and southern Heilongjiang Province, and the northern part of the Greater Khingan Mountains. These areas are projected to exhibit trends opposite to those observed in the past.
To further clarify the future trends of NEP in Heilongjiang Province, the Hurst index is overlaid with NEP trends (Figure S2). According to Table 1, the future persistent increase in NEP area in Heilongjiang Province is predominantly located in the southern mountainous areas, Western Songnen Plain, Sanjiang Plain, and Eastern Daxing’anling region, accounting for approximately 58.44% of the total area. The areas with potential decrease cover about 19.95% of the total area, primarily found in the eastern part of Yichun City, Southern Mudanjiang, Jixi City, and the Northern Daxing’anling region. Regions showing no trend in change represent only 4.09% of the area, mainly located in wetlands and water bodies. Areas potentially increasing and persistently decreasing are less distributed, accounting for 5.65% and 11.88%, respectively, scattered in sporadic locations in Hegang City, Suihua City, and Northwestern Daxing’anling. In summary, the future changes in vegetation NEP in Heilongjiang Province show a stable and positive development trend, with most regions showing an increasing carbon-sequestration capacity.

3.4. Analysis of Driving Factors of NEP

3.4.1. Dominant Factor Detection

The results of the single-factor detection (Figure 6) indicate that, in 2010, radiation was the dominant factor affecting the spatial variation in NEP, with an explanatory power of 0.402. In 2015 and 2020, altitude had the highest explanatory power, reaching 0.298 and 0.256, respectively. Throughout the study period, except for a slight increase in the explanatory power of precipitation, the explanatory power of the other factors gradually declined. Particularly, the explanatory power of radiation decreased from 0.402 in 2010 to 0.191 in 2020, showing the most noticeable fluctuation in its impact on NEP. Evapotranspiration consistently had an explanatory power below 10%, exerting a weak influence on the spatial variation in NEP. Additionally, in terms of the multi-year mean explanatory power of each factor, altitude (0.299) > slope (0.272) > temperature (0.268) > population density (0.256) > radiation (0.253) > GDP (0.200) > precipitation (0.170) > evapotranspiration (0.049), indicating that altitude is the primary driving force behind the spatial variation in NEP.

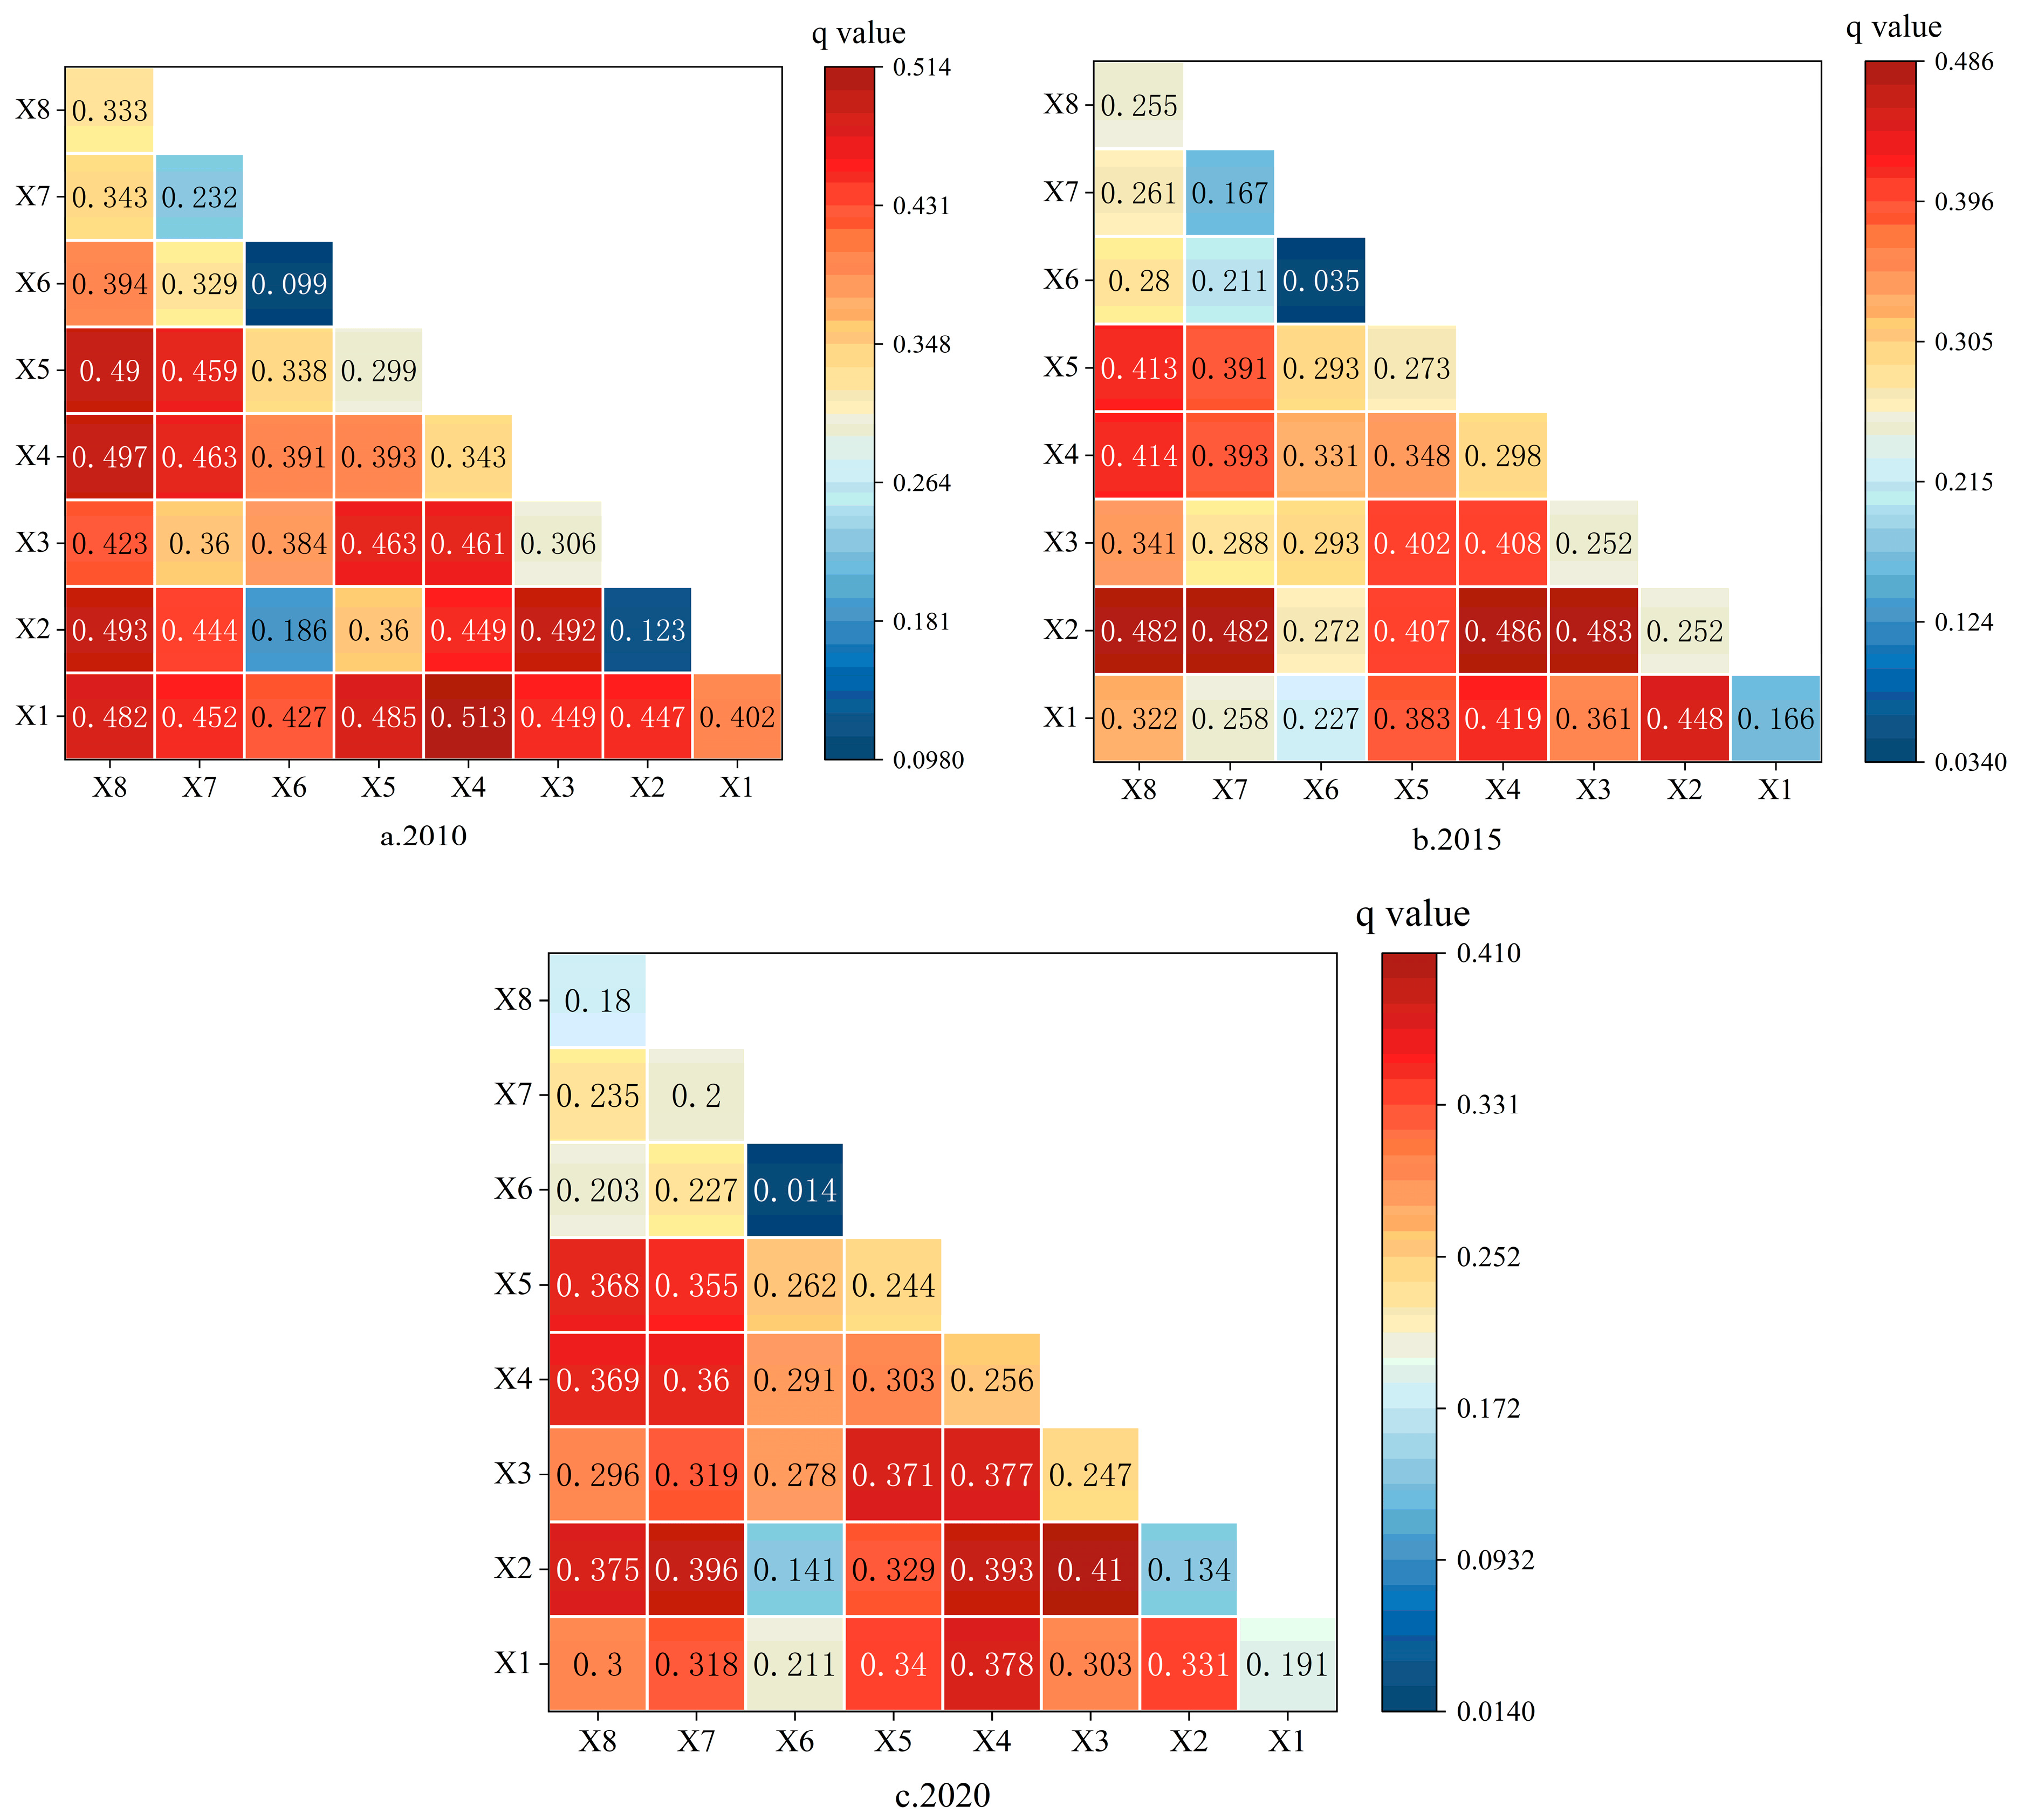
3.4.2. Factor Interaction Detection

The interaction results (Figure 7) indicate that the effects of interactions between pairs of factors are significantly higher than single-factor effects. Interactions between different factors show enhancements and nonlinear increases, indicating that the spatial variation in NEP in Heilongjiang Province is influenced by the synergistic effects of multiple factors. When arranging the interaction effects of representative years, it can be observed that, in 2010 and 2015, the interaction between altitude and radiation, as well as precipitation, had the highest explanatory powers, reaching 0.513 and 0.486, respectively. In 2020, precipitation and temperature had the highest explanatory power after interaction, reaching 0.410. These results further confirm the dominant role of altitude in the spatial variation in NEP in Heilongjiang Province. They also highlight that factors with weaker individual effects significantly increase their impact on NEP when interacting with other factors.

3.5. Analysis of NEP Driving Factors

Currently, the accuracy of estimation methods is mainly validated based on comparisons with the measured data, remote sensing-data products, and results from other models [43,44]. This study covers a large area; thus, obtaining the measured NPP data at the same scale is challenging. Therefore, we used comparisons with other remote sensing-data products and model estimation results to validate the NPP and Rh parameters, thereby assessing the reliability and scientific validity of the NEP estimates.
In this study, the improved CASA model estimation results were compared with the MOD17A3HGF NPP product dataset (Figure 8). The results show that the correlation coefficient between the estimated NPP values and the MOD17A3HGF NPP product values is 0.82 (R2 = 0.67), which is statistically significant. Additionally, the annual average NPP value for Heilongjiang Province estimated in this study is 511.83 g C·m−2·a−1. This result is similar in range to the calculations obtained using the TEC model by Cheng Chunxiang et al. [26], and the spatial patterns are essentially consistent. Therefore, it indicates that the results estimated using the improved CASA model in this study are highly reliable.
The comparison between the estimation results of soil heterotrophic respiration in this study and other research results is shown in Table 2. The Rh estimation values in this study are basically consistent with those obtained by Chen Di [45], Wang Fei et al. [46], and Zhou Shuhan et al. [47] using Pei Yongzhi’s formula to estimate soil heterotrophic respiration in Gannan Prefecture, the Yellow River Basin, and the three northeastern provinces. Among them, Zhou Shuhan found, in the study of carbon sources and sinks in the three northeastern provinces, that the monthly average Rh value in Heilongjiang Province for many years is about 14.67 g C·m−2·monthly−1, which is similar to the estimation results in this study. However, the Rh estimation value in this article is significantly lower than the estimation results of the Hexi Corridor using the Bond_Lamberty and Raich formulas by Fan Yeping [48], which may be due to differences in data-processing methods and soil characteristics. Overall, the use of Pei Yongzhi’s formula to estimate soil heterotrophic respiration in Heilongjiang Province is reliable.

4. Discussion

4.1. Spatiotemporal Variation in NEP

Net ecosystem productivity (NEP) is a crucial variable representing carbon source/sink status in terrestrial ecosystems. The spatiotemporal distribution patterns of NEP can reflect the carbon sequestration status and potential of regional vegetation ecosystems to some extent. From 2010 to 2020, the NEP in Heilongjiang Province exhibited an overall upward trend, which is consistent with previous research results [48]. This increase is likely related to the implementation of reforestation and ecological restoration projects in the region. Between 2010 and 2020, the total area of ecological restoration in Heilongjiang Province was 15,840.0 km2, accounting for 37.2% of the total land area, with afforestation areas reaching 11,697.1 km2 [26]. Xie et al. [49] indicated that reforestation programs such as the Conversion of Cropland to Forest Program (CCFP) and carbon capture, utilization, and storage (CCUS) are two decisive approaches for achieving carbon sequestration. These techniques should be systematically applied to achieve China’s 2060 carbon neutrality goal. Spatially, regions with increasing NEP trends account for 78.39% of the study area. Notably, areas with significant increases are mainly distributed in the southeastern mountainous regions, the Songhua River Basin, and the eastern part of the Greater Khingan Mountains. The southeastern mountainous regions of Heilongjiang Province have higher elevations and ample heat and moisture; are predominantly forested; and experience minimal human intervention, resulting in significant carbon-sequestration capabilities. The Songhua River Basin, including Daqing, Harbin, Hegang, and Jiamusi, is a crucial agricultural area in Heilongjiang Province. These regions have flat terrain and favorable hydrothermal conditions and are primarily covered by farmlands and grasslands. Cheng Chunxiang et al. found that, over the past 20 years, the annual NPP of Heilongjiang’s farmland systems increased rapidly, demonstrating a strong vegetation carbon-sequestration capacity [26]. Additionally, recent conservation and restoration projects for mountains, rivers, forests, farmlands, lakes, grasslands, and deserts have greatly improved the vegetation and regional ecological environment. The eastern part of the Greater Khingan Mountains has extensive forest cover, high vegetation coverage, relatively stable annual precipitation and temperature, low soil respiration carbon consumption, and increasing annual vegetation carbon-sequestration capacity.
In the future, the spatial distribution of NEP in Heilongjiang Province will present a new pattern, with most regions showing a continuous increase in NEP. This positive trend can be attributed to the implementation of national policies and related environmental protection projects, which have continuously improved regional ecological conditions and enhanced resilience to risks. Additionally, climate change trends, which have moved toward warmer and wetter conditions [26], have significantly improved hydrothermal conditions, providing favorable climatic conditions for vegetation growth. Regions with potential decreases in NEP in the future account for about 20%, mainly distributed in the eastern part of Yichun, Southern Mudanjiang, Jixi, and Northern Greater Khingan Mountains. Although a series of ecological management measures have improved the ecological environment in these areas in recent years, structural, root, and trend pressures have not been fundamentally alleviated and ecological environmental protection remains a long-term challenge [50].

4.2. NEP Driving Factors

The spatial variation in vegetation NEP in Heilongjiang Province is influenced by topographical, climatic, and socio-economic factors. Overall, natural factors have a greater impact on vegetation NEP than socio-economic factors. Elevation is the dominant factor affecting the spatial variation in NEP in Heilongjiang Province. It interacts with other environmental factors to produce a more significant impact on NEP. This is mainly because the regional elevation differences not only affect local microclimate variations and soil fertility but also influence the vertical distribution of vegetation types and the intensity of human activities to a certain extent [51]. Climatic factors primarily affect the carbon sequestration capacity of vegetation by regulating metabolic processes such as photosynthesis, respiration, and transpiration. During the study period, except for an increase in the explanatory power of precipitation, the influence of radiation, temperature, and evapotranspiration on NEP all showed varying degrees of decline. This indicates that the growth of vegetation in Heilongjiang Province is becoming increasingly dependent on water availability. The interaction-detection results of precipitation with other factors also support this conclusion. In addition to the influence of topographical and climatic conditions, socio-economic factors significantly affect the spatial pattern of NEP. On one hand, measures such as reforestation and ecological protection and restoration enhance the carbon sequestration potential of vegetation. On the other hand, activities such as urbanization and excessive resource exploitation increase carbon emissions. Therefore, future ecological planning should consider the characteristics of different influencing factors and adopt diversified and differentiated regulatory strategies.

4.3. Limitations and Future Work

Currently, studies of net ecosystem productivity (NEP) mainly rely on ground observations, remote-sensing data, and model simulations. However, these data sources have some issues regarding accuracy and completeness. For instance, the distribution of ground observation sites in Heilongjiang Province is uneven, and ground observation data are relatively scarce, making it difficult to comprehensively reflect the carbon-cycle status of an entire terrestrial ecosystem. Remote sensing-data quality varies due to factors such as weather and cloud cover. This makes it difficult to combine two types of data for research. Model simulations are influenced by parameter settings and model structures, which may result in biases in the simulation results. Additionally, human activities have profoundly impacted the carbon cycle of terrestrial ecosystems. However, current research faces challenges in quantifying the effects of human factors (such as land-use changes and agricultural activities) on the carbon cycle. This limits our in-depth understanding of the role of human activities in the carbon cycle. In the future, we need to improve observation technologies, optimize remote sensing data-processing methods, and refine model simulations to enhance the accuracy and completeness of the data. Furthermore, by collecting and analyzing relevant data, we can establish quantitative models to assess the contributions and impacts of human activities on the carbon cycle. This will help us better understand the role of human activities in the carbon cycle and provide a scientific basis for formulating environmental policies.
This study conducted an in-depth analysis of the spatiotemporal-variation characteristics and driving factors of NEP in Heilongjiang Province and drew a series of important conclusions. These conclusions not only deepen our understanding of regional carbon cycling processes but also provide strong support for achieving carbon neutrality goals and promoting ecological civilization construction. However, we should also recognize the limitations of current research in data acquisition and processing, as well as the complexity of the impact of human activities on the carbon cycle. Future research should strive to improve the accuracy and completeness of data, while strengthening interdisciplinary cooperation to explore the laws and mechanisms of regional carbon cycling in a more comprehensive and in-depth manner.

5. Conclusions

This study takes Heilongjiang Province as an example and systematically analyzes the spatiotemporal variation characteristics and driving factors of vegetation net ecosystem productivity (NEP) in Heilongjiang Province from 2010 to 2020 by combining an improved CASA model and soil respiration model, as well as MODIS and meteorological data. The main conclusions are as follows:
(1)
Research shows that the overall NEP in Heilongjiang Province showed a fluctuating upward trend from 2010 to 2020, mainly attributed to the implementation of the Grain for Green and Ecological Restoration Project, as well as the warming and humidification trend of the regional climate. This discovery not only validates the effectiveness of ecological restoration measures in enhancing regional carbon sequestration functions but also provides empirical support for achieving carbon-neutrality goals.
(2)
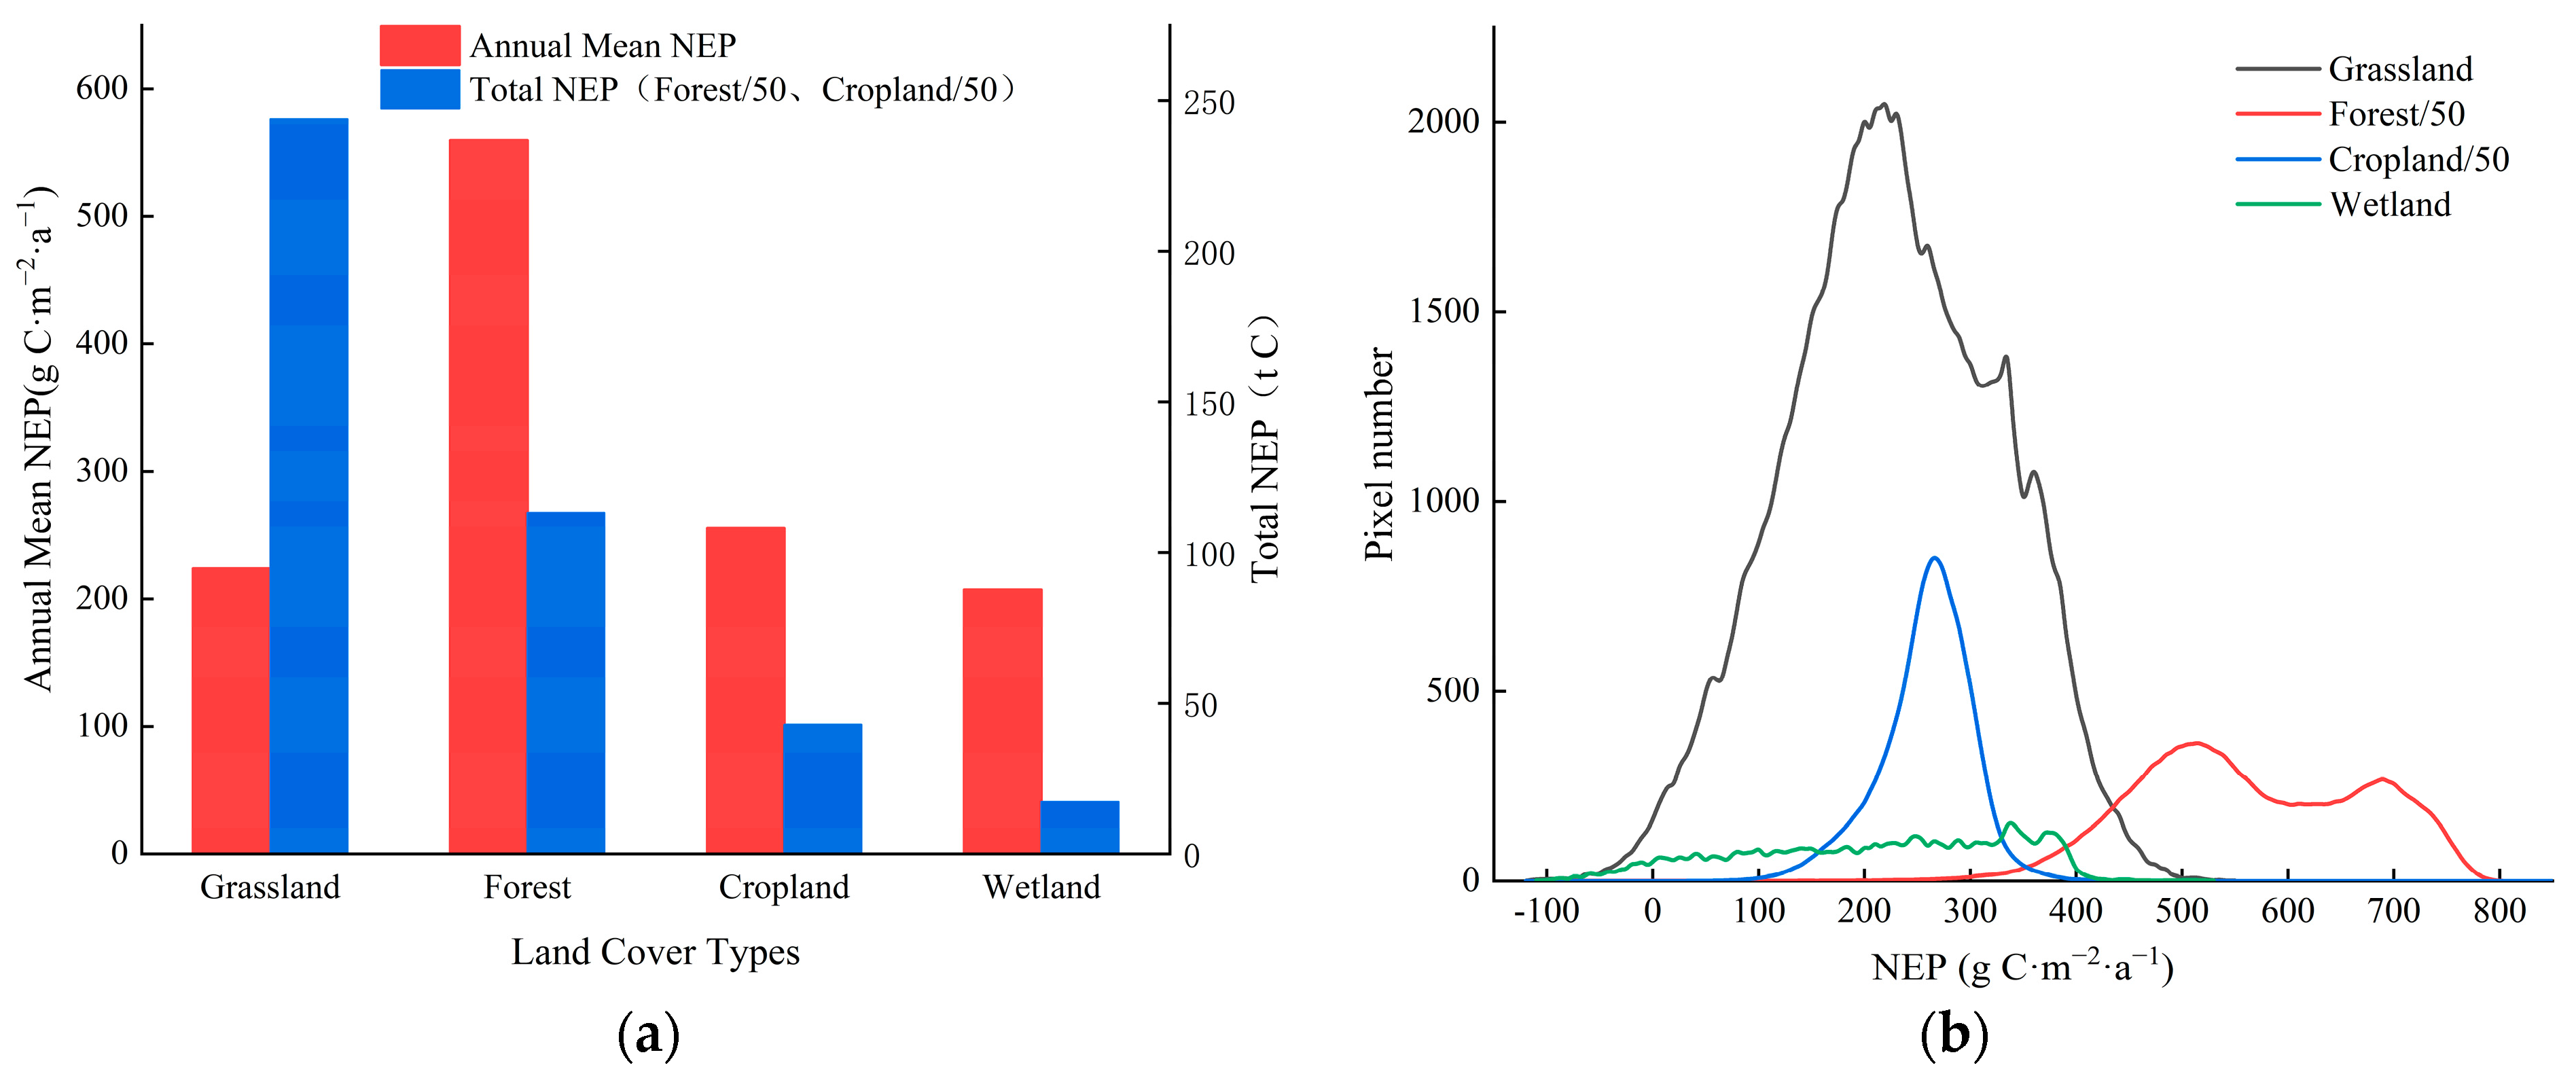
There are significant differences in the contribution of different vegetation types to carbon sinks, with forests and farmland being the main carbon-sink areas, while some grasslands and wetlands serve as carbon sources. This discovery emphasizes the important role of forests and farmland in regional carbon cycling, especially in terms of agricultural carbon-sink potential and carbon-sequestration methods, providing important references for future policy formulation.
(3)
The study revealed significant regional differences in the spatial variation in NEP in Heilongjiang Province, with most regions (78.39%) showing an increasing trend, while a few regions (17.53%) showed a decreasing trend. In addition, predictions of future NEP changes indicate that most regions will continue to increase, but there are still some regions facing potential risks of reduction. This requires us to fully consider regional differences and adopt differentiated management measures when formulating ecological protection and restoration strategies.
(4)
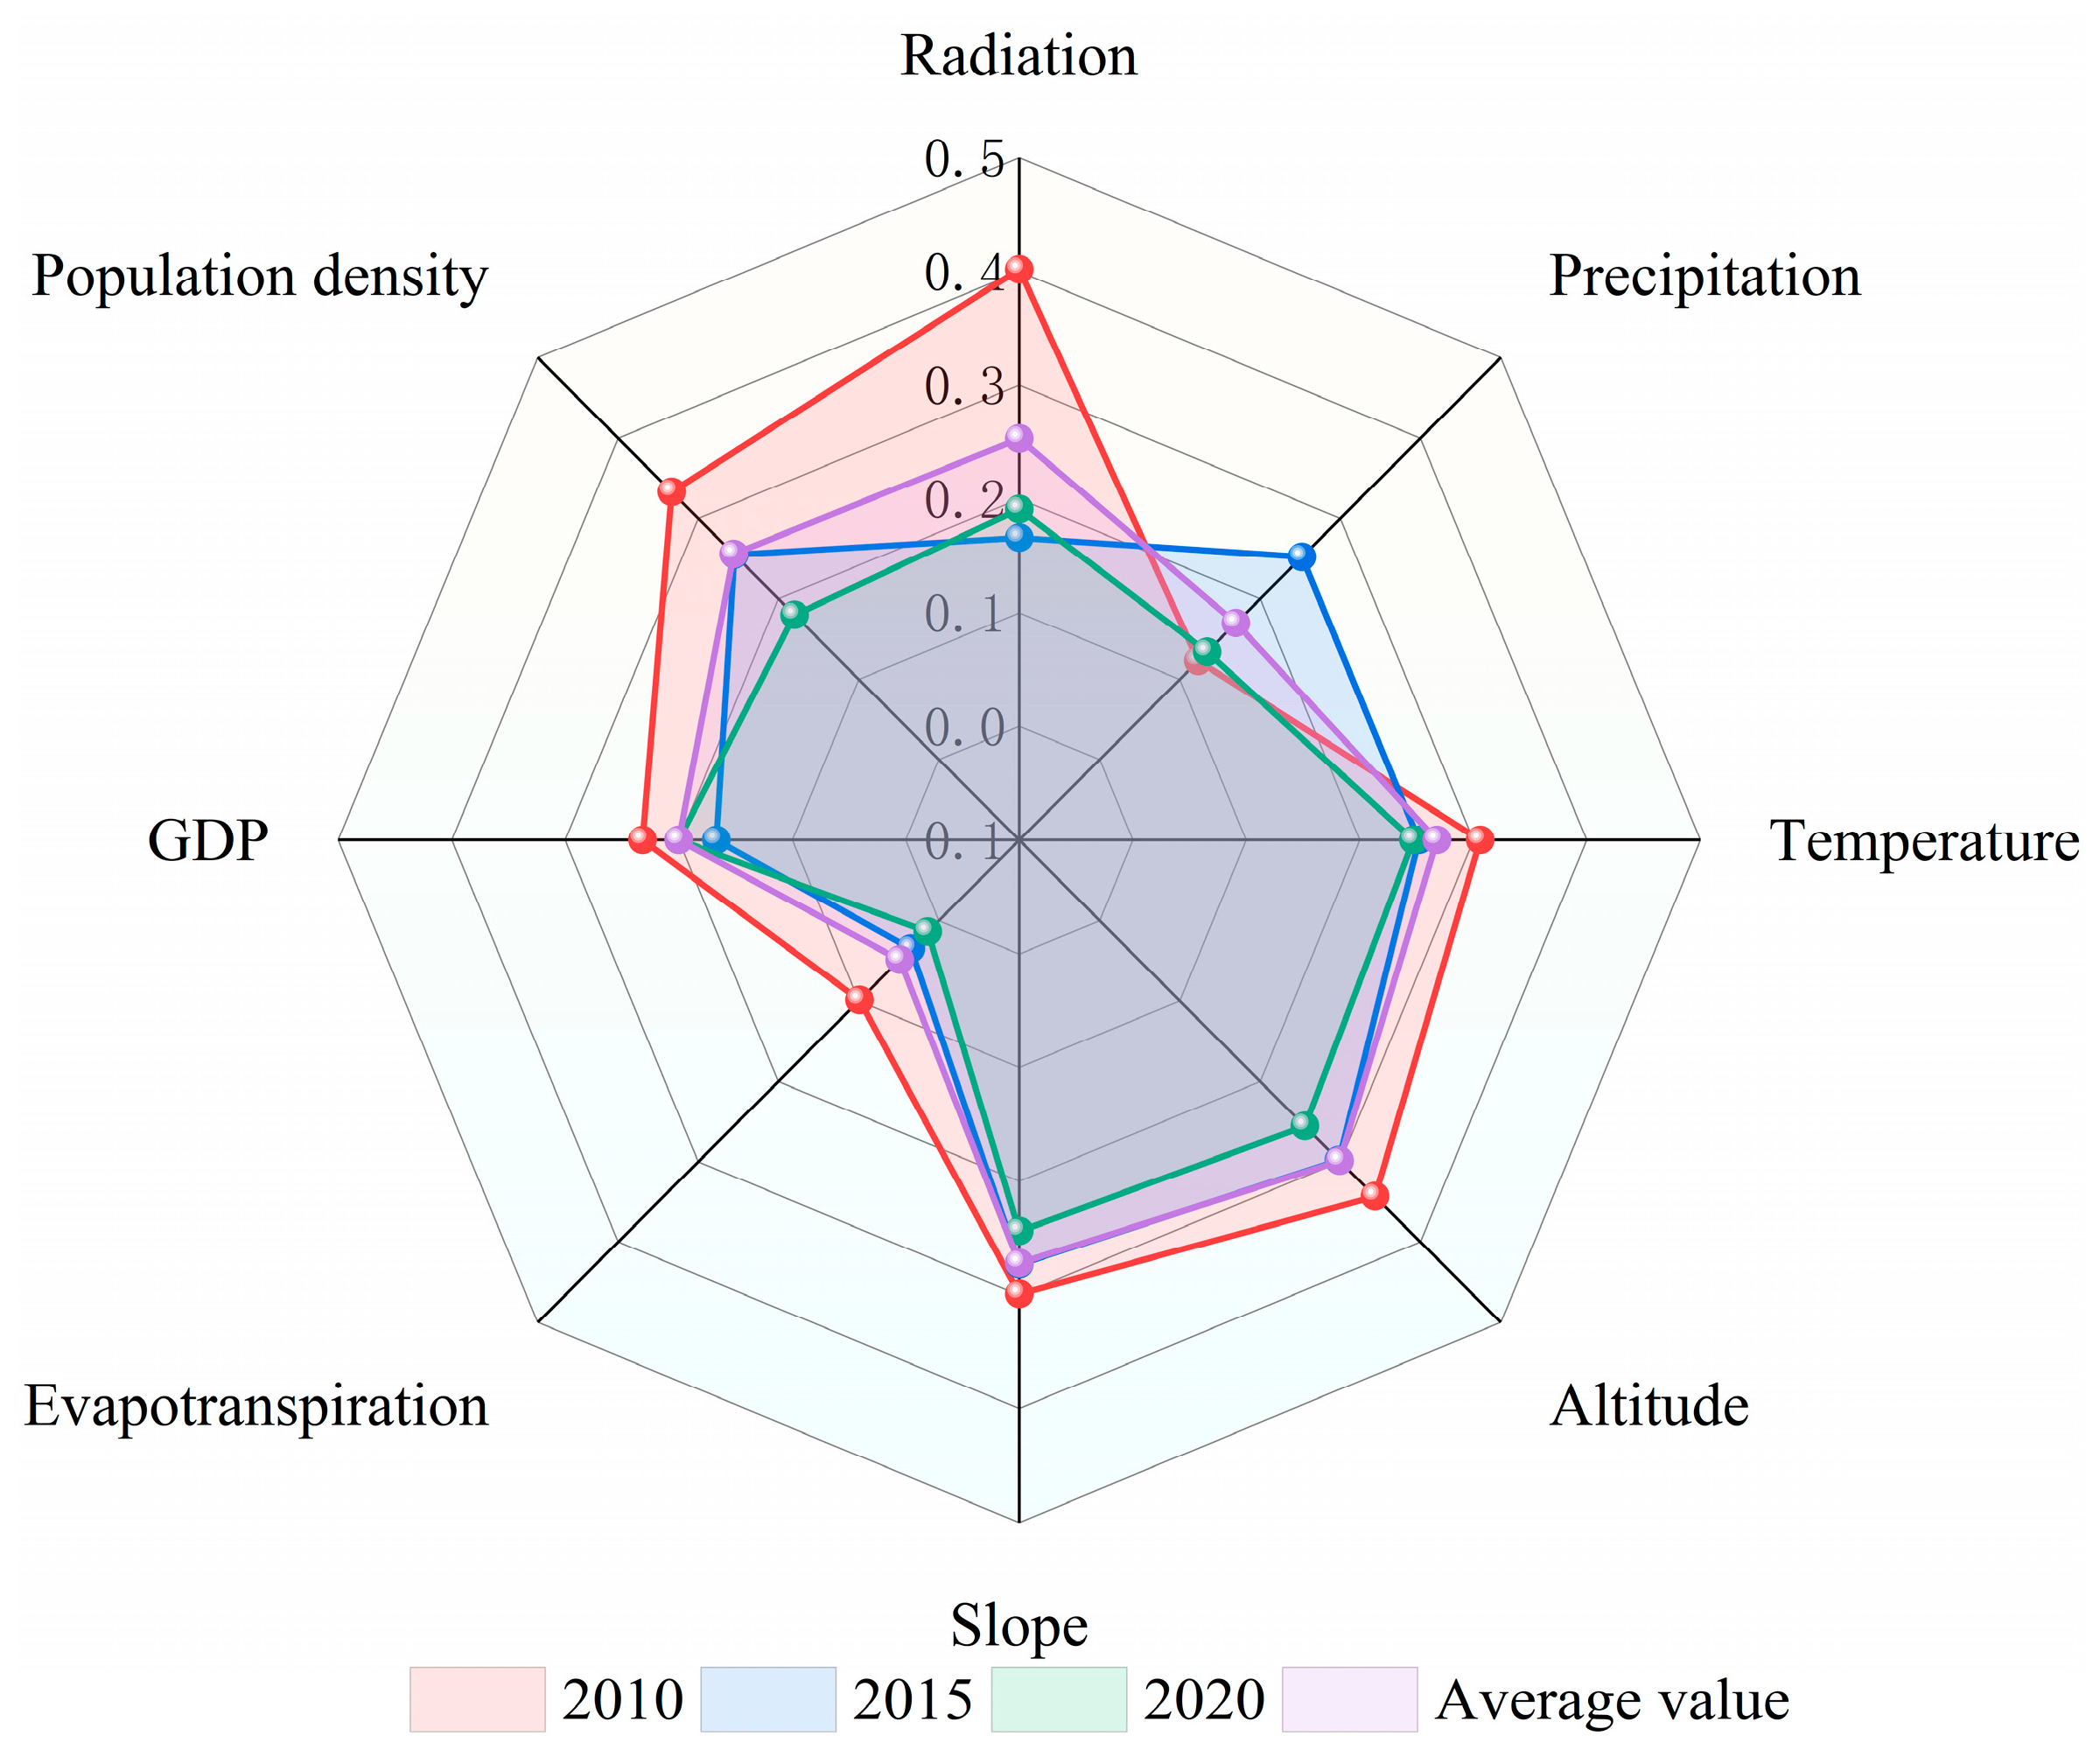
Through a geographic-detector analysis, this study found that terrain, climate, and socio-economic factors all have an impact on the spatial differentiation of NEP in Heilongjiang Province, but the influence of natural factors (especially altitude) is more significant. This discovery reveals the complex mechanisms behind NEP changes and provides a new perspective for us to gain a deeper understanding of regional carbon-cycling processes.
In summary, this study not only deepens the understanding of the carbon-cycle mechanism in the ecosystem of Heilongjiang Province but also provides important references for the formulation of regional carbon reduction and ecological restoration policies. Future research should further refine the impact mechanism of human activities on carbon cycling, as well as explore more effective ecological-protection and -restoration measures.

Supplementary Materials

The following supporting information can be downloaded at: https://www.mdpi.com/article/10.3390/land13081316/s1, Figure S1: Trend and significance test of NEP: (a) Theil–Sen trend chart of NEP; (b) Theil–Sen trend results from the MK test; Figure S2: NEP Hurst index and persistence characteristics distribution. (a) Calculation results of the Hurst index of NEP. (b) Future Trends of NEP Changes.

Author Contributions

Conceptualization, H.Z. and Z.H.; methodology, H.Z.; validation, H.Z., Z.H., L.Z., R.C. and W.W.; formal analysis, W.W.; resources, H.Z. and Z.H.; data curation, Z.H.; writing—original draft preparation, Z.H.; writing—review and editing, H.Z. and Z.H.; visualization, L.Z. and W.W.; supervision, H.Z.; project administration, H.Z.; funding acquisition, H.Z. All authors have read and agreed to the published version of the manuscript.

Funding

This research was funded by the Strategic Priority Research Program of the Chinese Academy of Sciences, grant number XDA28130402; and the Postdoctoral funded project in Heilongjiang Province, grant number LBH-Z12032.

Data Availability Statement

The original contributions presented in the study are included in the article, further inquiries can be directed to the corresponding authors.

Acknowledgments

We express our gratitude to the professionals at Northeast Agricultural University who encouraged us to make this project a success.

Conflicts of Interest

Author Zhenghong He was employed by the company Xinjiang Water Conservancy and Hydropower Survey Design Institute Co., Ltd. The remaining authors declare that the research was conducted in the absence of any commercial or financial relationships that could be construed as a potential conflict of interest.

References

  1. Zhang, M.; Huang, X.J.; Chuai, X.; Xie, X.; Zhu, Z.; Wang, Y. Spatial Distribution and Changing Trends of Net Ecosystem Productivity in China. Geogr. Geo-Inf. Sci. 2020, 36, 69–74. [Google Scholar] [CrossRef]
  2. Friedlingstein, P.; Jones, M.W.; O’Sullivan, M.; Andrew, R.M.; Hauck, J.; Olsen, A.; Peters, G.P.; Peters, W.; Pongratz, J.; Sitch, S.; et al. Global carbon budget 2021. Earth Syst. Sci. Data 2022, 14, 1917–2005. [Google Scholar] [CrossRef]
  3. Piao, S.L.; Yue, C.; Ding, J.; Guo, J. Perspectives on the role of terrestrial ecosystems in the ‘carbon neutrality’ strategy. Sci. China Earth Sci. 2022, 52, 1419–1426. [Google Scholar] [CrossRef]
  4. Higgins, P.A.T.; Harte, J. Cardon cycle uncertainty increases climate change risks and mitigation challenges. J. Clim. 2012, 25, 7660–7668. [Google Scholar] [CrossRef]
  5. Intergovernmental Panel on Climate Change (IPCC). Special Report on Global Warming of 1.5 °C; Cambridge University Press: Cambridge, UK, 2018. [Google Scholar] [CrossRef]
  6. Erb, K.H.; Kastner, T.; Plutzar, C.; Bais, A.L.S.; Carvalhais, N.; Fetzel, T.; Gingrich, S.; Haberl, H.; Lauk, C.; Niedertscheider, M.; et al. Unexpectedly large impact of forest management and grazing on global vegetation biomass. J. Nat. 2018, 553, 73–76. [Google Scholar] [CrossRef] [PubMed]
  7. Wang, X.K.; Feng, Z.W.; Ouyang, Z.Y. Vegetation carbon storage and density of forest ecosystems in China. Chin. J. Appl. Ecol. 2001, 12, 13–16. [Google Scholar] [CrossRef]
  8. Misal, H.; Hoare, V.H.C.; Miles, V. Responding to the climate crisis: Taking action on the IPCC 6th Assessment Report. Weather 2022, 77, 149–150. [Google Scholar] [CrossRef]
  9. Friedlingstein, P.; O’Sullivan, M.; Jones, M.W.; Andrew, R.M.; Hauck, J.; Olsen, A.; Peters, G.P.; Peters, W.; Pongratz, J.; Sitch, S.; et al. Global carbon budget 2020. Earth Syst. Sci. Data 2020, 12, 3269–3340. [Google Scholar] [CrossRef]
  10. Li, Z.H.; Shan, N.; Wang, Q.; Li, W.; Wang, Z.; Bao, S.; Dou, H.; Ao, W.; Pang, B.; Dou, H. Estimation of Vegetation Carbon Source/Sink and Analysis of Its Influencing Factors in Hulun Lake Basin from 2013 to 2020. Ecol. Rural. Environ. 2022, 38, 1437–1446. [Google Scholar] [CrossRef]
  11. Zhang, L.; Wang, J.; Shi, R.H. Temporal-spatial variations of carbon sink/source in Northeast China from 2000 to 2010. J. East China Norm. Univ. 2015, 2015, 164–173. [Google Scholar] [CrossRef]
  12. Dai, E.F.; Huang, Y.; Zhuo, W. Spatial-temporal features of carbon source-sink and its relationship with climate factors in InnerMongolia grassland ecosystem. Acta Geogr. Sin. 2016, 71, 21–34. [Google Scholar] [CrossRef]
  13. Qiu, S.; Liang, L.; Wang, Q.; Geng, D.; Wu, J.; Wang, S.; Chen, B. Estimation of European Terrestrial Ecosystem NEP Based on an Improved CASA Model. IEEE J. Sel. Top. Appl. Earth Obs. Remote Sens. 2023, 16, 1244–1255. [Google Scholar] [CrossRef]
  14. Zhao, N.; Zhou, L.; Zhuang, J.; Wang, Y.L.; Zhou, W.; Chen, J.J.; Song, J.; Ding, J.X.; Chi, Y.G. Integration analysis of the carbon sources and sinks in terrestrial ecosystems, China. Acta Ecol. Sinica. 2021, 41, 7648–7658. [Google Scholar] [CrossRef]
  15. Ye, X.J.; Wang, Y.H.; Pan, H.Z.; Bai, Y.; Dong, D.; Yao, H. Spatial-temporal variation and driving factors of vegetation net ecosystem productivity in Qinghai Province. Arid. Zone Res. 2022, 39, 1673–1683. [Google Scholar] [CrossRef]
  16. Cao, Y.; Sun, Y.L.; Jiang, Y.Q.; Wan, J. Analysis on temporal-spatial variations and driving factors of net ecosystem productivity in the Yellow River Basin. Ecol. Environ. Sci. 2022, 31, 2101–2110. [Google Scholar] [CrossRef]
  17. Weng, S.H.; Zhang, Y.Q.; Jiang, D.X.; Pan, W.H.; Li, L.C.; Zhang, F.M. Spatio-temporal changes and attribution analysis of net ecosystem productivity in forest ecosystem in Fujian province. Ecol. Environ. Sci. 2023, 32, 845–856. [Google Scholar] [CrossRef]
  18. Ren, X.L.; He, H.L.; Zhang, L.; Ge, R.; Feng, A.; Yu, G.; Zhang, L. Net ecosystem production of alpine grasslands in the Three-River Headwaters Region during 2001–2010. Res. Environ. Sci. 2017, 30, 51–58. [Google Scholar] [CrossRef]
  19. Sun, X.X.; Zhang, H.B.; Yu, Y.P. Spatial and tremporal dynamics in carbon source/sink and equity of the farmland ecosystem in Jiangsu Coastal Area, China. Chin. J. Agric. Resour. Reg. Plan. 2021, 42, 56–64. [Google Scholar]
  20. Liu, F.; Zeng, Y.N. Analysis of the spatio-temporal variation of vegetation carbon source/sink in Qinghai Plateau from 2000—2015. Acta Ecol. Sin. 2021, 41, 5792–5803. [Google Scholar] [CrossRef]
  21. Wu, D.Q.; Hou, W.; Sang, H.Y.; Zhai, L.; Guo, J. Analysis of spatio-temporal variation of vegetation carbon sources/sinks in Tibet and its impact factors. Sci. Surv. Mapp. 2022, 47, 105–113. [Google Scholar] [CrossRef]
  22. Hou, Y.; Chu, Y.; Yang, Q.L.; Zheng, F.; Zhang, S.X.; Huangpu, X.D. Multi-dimensional detection of spatiotemporal variations and driving factors in vegetation carbon sink capacity in Ningxia, China. Chin. J. Ecol. 2023, 42, 1–11. Available online: https://kns.cnki.net/kcms2/detail/21.1148.Q.20230707.0922.006.html (accessed on 2 November 2023).
  23. Mu, S.J.; Li, J.L.; Zhou, W.; Yang, H.F.; Zhang, C.B.; Ju, W.M. Spatial-temporal distribution of net primary productivity and its relationship with climate factors in Inner Mongolia from 2001 to 2010. Acta Ecol. Sin. 2013, 33, 3752–3764. [Google Scholar] [CrossRef]
  24. Pan, J.H.; Wen, Y. Estimation and spatial-temporal characteristics of carbon sink in the arid region of northwest China. Acta Ecol. Sin. 2015, 35, 7718–7728. [Google Scholar] [CrossRef]
  25. Shi, S.; Li, W.; Lin, X.P. patiotemporal Variations of Vegetation NDVl and Influencing Factors in Heilongjiang Province. Res. Soil Water Conserv. 2023, 30, 294–305. [Google Scholar] [CrossRef]
  26. Cheng, C.X.; Yu, M.; Mao, Z.J. Spatial-Temporal Evolution and Patterns of Abrupt Changs of NPP in Heilongjiang Province in the Process of Ecological Protection and Restoration in China. Sci. Silvae Sin. 2022, 58, 23–31. [Google Scholar]
  27. Jiao, Y.; Hu, H.Q. Carbon storage and its dynamics of forest vegetations in Heilongjiang Province. J. Appl. Ecol. 2005, 16, 2248–2252. [Google Scholar] [CrossRef]
  28. Kang, H.X.; Na, X.D.; Zang, S.Y. Distribution characteristic of time and space of vegetation atmospheric regulating service in Heilongjiang province. Sci. Surv. Mapp. 2017, 42, 60–64. [Google Scholar] [CrossRef]
  29. Cheng, C.X. Spatial-Temporal Changes and Driving Forces of Terrestrial Vegetation NPP in Heilongjiang Province from 2000 to 2020. Ph.D. Thesis, Northeast Forestry University, Harbin, China, 2023. [Google Scholar]
  30. Xu, X.L. China GDP Spatial Distribution Kilometer Grid Dataset. Resource and Environmental Science Data Registration and Publishing System. 2017. Available online: https://www.resdc.cn/DOI/doi.aspx?DOIid=33 (accessed on 15 January 2024).
  31. Woodwell, G.M.; Whittaker, R.H.; Reiners, W.A.; Likens, G.E.; Delwiche, C.C.; Botkin, D.B. The biota and the world carbon budget. Science 1978, 199, 141–146. [Google Scholar] [CrossRef]
  32. Fang, J.Y.; Ke, J.H.; Tang, Z.Y.; Anping, C.E. Implications and estimations of four terrestrial productivity parameters. Chin. J. Plant Ecol. 2001, 25, 414–419. [Google Scholar]
  33. Sun, C.J.; Qiao, P.; Wang, J.R.; Wang, H.Y.; Sun, J.L. Spatio-temporal variation characteristics of net primary productivity in Lvliang contiguous poverty areas since 2000. Acta Ecol. Sin. 2022, 42, 277–286. [Google Scholar] [CrossRef]
  34. Zhu, W.Q.; Pan, Y.Z.; Zhang, J.S. Estimation of net primary productivity of Chinese terrestrial vegetation based on remote sensing. Chin. J. Plant Ecol. 2007, 31, 413–424. [Google Scholar] [CrossRef]
  35. Zhu, W.Q.; Chen, Y.H.; Pan, Y.Z.; Li, J. Estimation of light light utilization efficiency of vegetation in China based on GIS and RS. Geomat. Inf. Sci. Wuhan Univ. 2004, 29, 694–698. [Google Scholar] [CrossRef]
  36. Zhu, W.Q.; Pan, Y.Z.; He, H.; Yu, D.; Hu, B. Simulation of maximum light utilization efficiency of typical vegetation in China. Chin. Sci. Bull. 2006, 51, 700–706. [Google Scholar] [CrossRef]
  37. Pei, Z.Y.; Zhou, C.P.; Ouyang, H.; Yang, W.B. A carbon budget of alpine steppe area in the Tibetan Plateau. Geogr. Res. 2010, 29, 102–110. [Google Scholar] [CrossRef]
  38. Qian, F.Y.; Lan, A.J.; Fan, Z.M.; Wang, R.; Tao, Q.; Zhou, Y.C.; Xu, J.S. Spatiotemporal Variation Characteristics and Influencing Factors of NPP in Guizhou Province from 2000 to 2020. Res. Soil Water Conserv. 2023, 30, 408–416+426. [Google Scholar] [CrossRef]
  39. Xie, H.; Tong, X.J.; Li, J.; Liu, P.R.; Yu, F.Y. Changes of NDVI and EVI and their responses to climatic variables in the Yellow River Basin during the growing season of 2000–2018. Acta Ecol. Sin. 2022, 42, 4536–4549. [Google Scholar] [CrossRef]
  40. Wen, X.J.; Liu, Y.X.; Yang, X.J. A resilience-based analysis on the spatial heterogeneity of vegetation restoration and its affecting factors in the construction of eco-cities: A case study of Shangluo, Shaanxi. Acta Ecol. Sin. 2015, 35, 4377–4389. [Google Scholar] [CrossRef]
  41. Wang, J.F.; Xu, C.D. Geodetector: Principle and prospective. Acta Geogr. Sin. 2017, 72, 116–134. [Google Scholar] [CrossRef]
  42. Liu, F.; Zeng, Y.N. Spatial-temporal change in vegetation Net Primary Productivity and its response to climate and human activities in Qinghai Plateau in the past 16 years. Acta Ecol. Sin. 2019, 39, 1528–1540. [Google Scholar] [CrossRef]
  43. Liu, C.Y. The temporal-Spatial Changes and Dynamic Mechanism of Carbon Source/Sink of Provincial Ecosystem—A Case of Gansu Province. Ph.D. Thesis, Lanzhou University, Lanzhou, China, 2016. [Google Scholar] [CrossRef]
  44. Hashimoto, S.; Carvalhais, N.; Ito, A.; Migliavacca, M.; Nishina, K.; Reichstein, M. Global spatiotemporal distribution of soil respiration modeled using a global database. Biogeosciences 2015, 12, 4121–4132. [Google Scholar] [CrossRef]
  45. Chen, D. Study on Terrestrial Ecosystem NEP in Gannan Based on Romte Sense Technology. Ph.D. Thesis, Lanzhou University, Lanzhou, China, 2016. [Google Scholar] [CrossRef]
  46. Wang, F.; Cao, Y.Q.; Zhou, S.H.; Fan, S.B.; Jiang, X.M. Estimation of vegetation carbon sink in the Yellow River Basin ecological function area andanalysis of its main meteorological elements. Acta Ecol. Sin. 2023, 43, 2501–2514. [Google Scholar] [CrossRef]
  47. Zhou, S.H. Spatio-Temporal Distribution of Carbon Source/Sink and Carbon Deficitprediction in Northeast China. Ph.D. Thesis, Liaoning Normal University, Dalian, China, 2023. [Google Scholar]
  48. Fan, Y.P. Spatio-Temporal Variation of Carbon Source/Sink of Vegetation and Its Response to Climate Change in the Hexi Corridor. Ph.D. Thesis, Northwest Normal University, Lanzhou, China, 2019. [Google Scholar]
  49. Xie, Y.C.; Hou, Z.M.; Liu, H.J.; Cao, C.; Qi, J. The sustainability assessment of CO2 capture, utilization and storage (CCUS) and the conversion of cropland to forestland program (CCFP) in the Water–Energy–Food (WEF) framework towards Chinas carbon neutrality by 2060. Environ. Earth Sci. 2021, 80, 468. [Google Scholar] [CrossRef]
  50. Wang, G.P.; Ma, J. Connotation, Characteristics, and Values: A Three Dimensional Interpretation of Xi Jinping’s Ecological Civilization Thought. J. Jiangxi Univ. Sci. Technol. 2021, 42, 7–13. [Google Scholar] [CrossRef]
  51. Xu, Y.; Huang, W.T.; Zheng, Z.W.; Dai, Q.Y.; Li, X.Y. Detecting Influencing Factor of Vegetation NPP in Southwest China Based on Spatial Scale Effect. Environ. Sci. 2023, 44, 900–911. [Google Scholar] [CrossRef]
Figure 1. Location and elevation schematic of the study area and land-cover types.
Land 13 01316 g001
Figure 2. Spatial distribution of average NEP values in Heilongjiang Province from 2010 to 2020.
Land 13 01316 g002
Figure 3. Interannual variation in NEP in Heilongjiang Province from 2010 to 2020.
Land 13 01316 g003
Figure 4. Interannual variation in NEP for different vegetation types in 2010–2020.
Land 13 01316 g004
Figure 5. Mean and total annual NEP values for different vegetation types and their frequency distribution: (a) mean and total annual NEP values for different vegetation types; and (b) frequency distribution of different vegetation types.
Land 13 01316 g005
Figure 6. Distribution of q-values for detected factors.
Land 13 01316 g006
Figure 7. Factor interaction detection: (a) interaction results for 2010, (b) interaction results for 2015, and (c) interaction results for 2020.
Land 13 01316 g007
Figure 8. Comparison of NPP estimates with MODIS NPP values (The blue square and red line represent the scatter points and fitted lines of the CASA model estimation results and MOD17A3HGF NPP, respectively).
Land 13 01316 g008
Table 1. Future NEP trends in Heilongjiang Province.
NEP Trend Hurst ValueTypeArea/(1 × 104 km2)Percent/%
Sen > 0H > 0.5Persistent increase26.6558.44
H < 0.5Potential decrease9.1019.95
Sen = 0H > 0.5No changing trend1.864.09
Sen < 0H < 0.5Potential increase2.575.65
H > 0.5Persistent decrease5.4211.88
Table 2. Validation of Rh estimates.
RegionDurationAverage Monthly Rh/(g C·m−2·month−1)
Gannan Prefecture [45]2005–20141.72–14.61
Yellow River Basin [46]2000–20203.44–30.89
Hexi Corridor [47]2001–201630.15–82.99
Three Northeast Provinces [48]2000–20204.35–35.23
This study2010–20205.82–11.18
Disclaimer/Publisher’s Note: The statements, opinions and data contained in all publications are solely those of the individual author(s) and contributor(s) and not of MDPI and/or the editor(s). MDPI and/or the editor(s) disclaim responsibility for any injury to people or property resulting from any ideas, methods, instructions or products referred to in the content.

