Article

Improving Urban Ecological Welfare Performance: An ST-LMDI Approach to the Yangtze River Economic Belt

by
Jie Yang
1,2 and
Zhigang Li
2,3,*
1
Department of Economics, The Engineering & Technical College of Chengdu University of Technology, Leshan 614000, China
2
College of Management Science, Chengdu University of Technology, Chengdu 610059, China
3
Research Center for Protection Policy of Key Ecological Functional Areas in the Upper Reaches of the Yangtze River, Chengdu 610059, China
*
Author to whom correspondence should be addressed.
Land 2024, 13(8), 1318; https://doi.org/10.3390/land13081318
Submission received: 13 July 2024 / Revised: 13 August 2024 / Accepted: 18 August 2024 / Published: 20 August 2024
(This article belongs to the Special Issue Urban Ecosystem Services: 5th Edition)

Abstract

:
Enhancing urban ecological welfare performance is essential for achieving sustainable urban development and fostering a comprehensive regional green transformation. This study develops a quantitative assessment framework for urban ecological welfare performance, grounded in both the welfare of urban residents and their consumption of ecological resources. Employing the spatio-temporal Logarithmic Mean Divisia Index model to dissect the ecological welfare performance across 108 key prefecture-level cities within China’s Yangtze River Economic Belt, considering both temporal and spatial dimensions, the analysis reveals a “W”-shaped trajectory in the ecological welfare performance from 2006 to 2022, characterized by pronounced spatial disparities. Particularly in the downstream coastal regions and notably the Yangtze River Delta, advantages in social and economic structures, along with public fiscal outlays, contribute to a superior ecological welfare performance, exhibiting a notable spatial spillover effect. The study introduces six key factors—social benefit, economic benefit, population dispersion, population density in urban areas, urbanization scale, and ecological sustainability—to examine their influence on ecological welfare performance, uncovering substantial differences in the outcomes of temporal and spatial decomposition. Temporal decomposition indicates that economic benefit and urbanization scale are the primary drivers enhancing ecological welfare performance, whereas population dispersion is identified as the primary inhibitor. Spatial decomposition reveals that the determinants of above-average urban ecological welfare vary regionally and undergo dynamic shifts over time. Overall, a holistic understanding of the interplay among economic growth, ecological preservation, and the enhancement of residents’ welfare can inform the development and execution of tailored policies by local governments.

1. Introduction

In the context of the rapid development of urbanization in China, the improvement of ecological welfare performance (EWP) in the Yangtze River Economic Belt (YREB), as an important economic growth region, has become the key to achieve sustainable development [1]. The acceleration of urbanization in the YREB has led to excessive consumption of ecological resources and aggravation of environmental problems [2], which not only threatens the regional ecological balance, but also restricts high-quality economic development [3,4]. Therefore, in-depth discussion on the improvement strategy of urban EWP in the YREB is of great significance for promoting regional coordinated development, ensuring ecological security, and realizing comprehensive regional green transformation. Existing studies have discussed EWP from many angles [5]. However, there are relatively few empirical studies on this specific area of the YREB. Especially in the methodology, how to comprehensively consider the complex relationship between regional economic development, ecological environmental protection, and social welfare improvement is still an urgent problem to be solved. The development strategy of the YREB proposed by the Chinese government emphasizes the principle of ecological priority and green development, which provides the policy background and research necessity for this study [6]. The purpose of this study is to empirically analyze the influencing factors of urban EWP in the YREB through the spatio-temporal Logarithmic Mean Divisia Index model (ST-LMDI), and explore effective improvement strategies. The ST-LMDI model, as a powerful tool [7], can decompose the EWP from the two dimensions of time and space. This study will make adaptive improvements to this model to better adapt to the regional characteristics of the YREB, and analyze it in combination with the latest social and economic data. This study first introduces the research background and significance, and then reviews related literature to identify research gaps. Then, the research methods, data sources, and analysis framework are expounded. Finally, according to the results of the empirical study, the paper puts forward some suggestions to improve the performance of urban ecological welfare in the YREB. This study is expected to provide a theoretical basis and practical guidance for the improvement of EWP in the YREB and other regions of the country, and provide a decision-making reference for policy makers in the construction of ecological civilization.

2. Literature Review

2.1. Measurement Research on EWP

EWP is the level of social welfare that can be transformed by unit ecological resource consumption, which is an effective tool to coordinate economic development, social welfare, and resources and environment [3,4]. With the proposed concept of sustainable development, EWP has been gradually applied to sustainable development research [5,7]. The concept of sustainable development originates from ecology and emphasizes the integration and dynamic balance between multiple factors, including economics, sociology, and environmental science, to ensure the maximum of overall welfare within and between generations. Therefore, the maintenance of sustainable development requires, first and foremost, ensuring that the resources, environment, and ecological elements can effectively meet the current and future needs of mankind, that is, improving the quality of human life without exceeding the carrying capacity of the ecosystem [6]. The concept of EWP is similar to that of ecological efficiency, but it is superior to ecological efficiency in measuring the ability of sustainable development, because it also considers the transformation of ecological consumption into multi-dimensional comprehensive welfare such as education, medical and health care, social equity, and ecological environment, which belongs to the category of strong sustainability [8,9], and can more truly reflect the level of people’s welfare.
At present, the measurement of EWP mainly adopts the index system construction, data envelopment analysis, and the ratio of welfare level to ecological footprint (EF). However, the multi-dimensional evaluation method of EWP centering on resource consumption, ecological environment, and welfare level, or the ultra-efficient Slacks-Based Measure (SBM) method, with ecological consumption as an input variable and pollution and economic growth as output variables [10,11], cannot guarantee the comprehensiveness and objectivity of the evaluation of social and economic welfare level. The human development index (HDI) is usually used to refer to the welfare of residents in the studies that use the ratio of welfare level to EF to measure EWP [12]. Among them, EF is the biologically productive land area occupied in the process of social and economic development that can continuously provide natural resources and waste consumption, which can more accurately measure the level of consumption of nature [13]. While the HDI objectively assesses people’s combined ability to achieve health, education, and a quality standard of living, it is a dimensionless indicator that ranges from 0 to 1. Therefore, using the ratio of HDI to EF to calculate EWP, it is necessary to standardize EF first and evaluate EWP through relative numerical value.

2.2. Research Methods of Influencing Factors of EWP

EWP is a multi-dimensional concept, which involves the coordinated development of environment, economy, and society. In terms of driving factors of EWP, most studies only describe the temporal and spatial characteristics and differentiation pattern of EWP [14]. Only a few studies have been carried out on influencing factors and spatial convergence. For instance, empirical research employing spatial econometric models has uncovered a nonlinear relationship between EWP and the level of income inequality among residents [15]. This finding highlights the complex dynamics at play within the ecological welfare framework. Moreover, studies have indicated that EWP at both the provincial and urban scales in China exhibits spatial convergence, influenced by a multitude of factors. Key determinants include the level of urbanization and the degree of economic development [16,17]. These factors contribute to the heterogeneity observed across different regions, suggesting that a one-size-fits-all approach to enhancing EWP may not be effective. The Logarithmic Mean Divisia Index (LMDI) model is mainly used to decompose the influencing factors of carbon emission [18]. Although this model was used to analyze the influencing factors of EWP in various provinces and cities in China [19], the spatial heterogeneity and time lag effect of each factor on EWP were not fully considered. In view of this, this study tries to expand in the following two aspects: (1) using the HDI to represent the level of urban social welfare, which is conducive to the per capita ecological footprint to represent the level of urban ecological resource consumption; (2) introducing the ST-LMDI model, which is an advanced decomposition technology that can reveal the relative contribution of different factors to the change in EWP [20]. The ST- LMDI model is characterized by its multi-dimensional analysis ability, which can simultaneously consider time changes and spatial differences, providing a more comprehensive perspective for research [21]. In addition, the decomposition approach of the model allows researchers to quantify the contribution of individual components to overall change, thereby identifying key influencing factors. Through this approach, this study is expected to fill in the gaps of existing research and provide a scientific basis for continuous improvement of EWP. We hope to provide more accurate decision support for policy makers and provide new research perspectives for the academic community, so as to promote the optimization and improvement of EWP.

2.3. Research Gaps

While a wealth of research has enhanced our comprehension of EWP, several research gaps remain that warrant further investigation. This study endeavors to address these gaps. Primarily, the current literature predominantly describes the spatiotemporal patterns of EWP, yet it offers limited insight into the underlying drivers and the intricacies of their interplay. Although the impact of urbanization and economic development on EWP has been examined, the spatial convergence and temporal lags of these factors have not been thoroughly elucidated, particularly in the context of pronounced regional disparities. Secondly, there is a dearth of sophisticated methodologies in existing research to disentangle the various factors contributing to shifts in EWP. Despite the application of tools like the LMDI model in select domains, the integration of spatial and temporal dynamics within the study of EWP remains nascent. This represents a significant gap, as such models are pivotal for deepening our understanding of the determinants underpinning EWP and for informing targeted policy initiatives. Lastly, the literature has not comprehensively explored the influence of critical factors such as the level of social development, economic status, population distribution, population density, urbanization scale, and ecological sustainability on the advancement of EWP. These elements are potentially pivotal for fostering sustainable development, and the current discourse on their interrelation with EWP is insufficient.
This study is designed to scientifically assess urban ecological welfare performance by thoroughly examining the spatio-temporal dynamics of these driving factors and employing the ST-LMDI model to delve into their influence on EWP. The goal is to bridge the aforementioned research gaps.

3. Materials and Methods

3.1. Study Area and Data Source
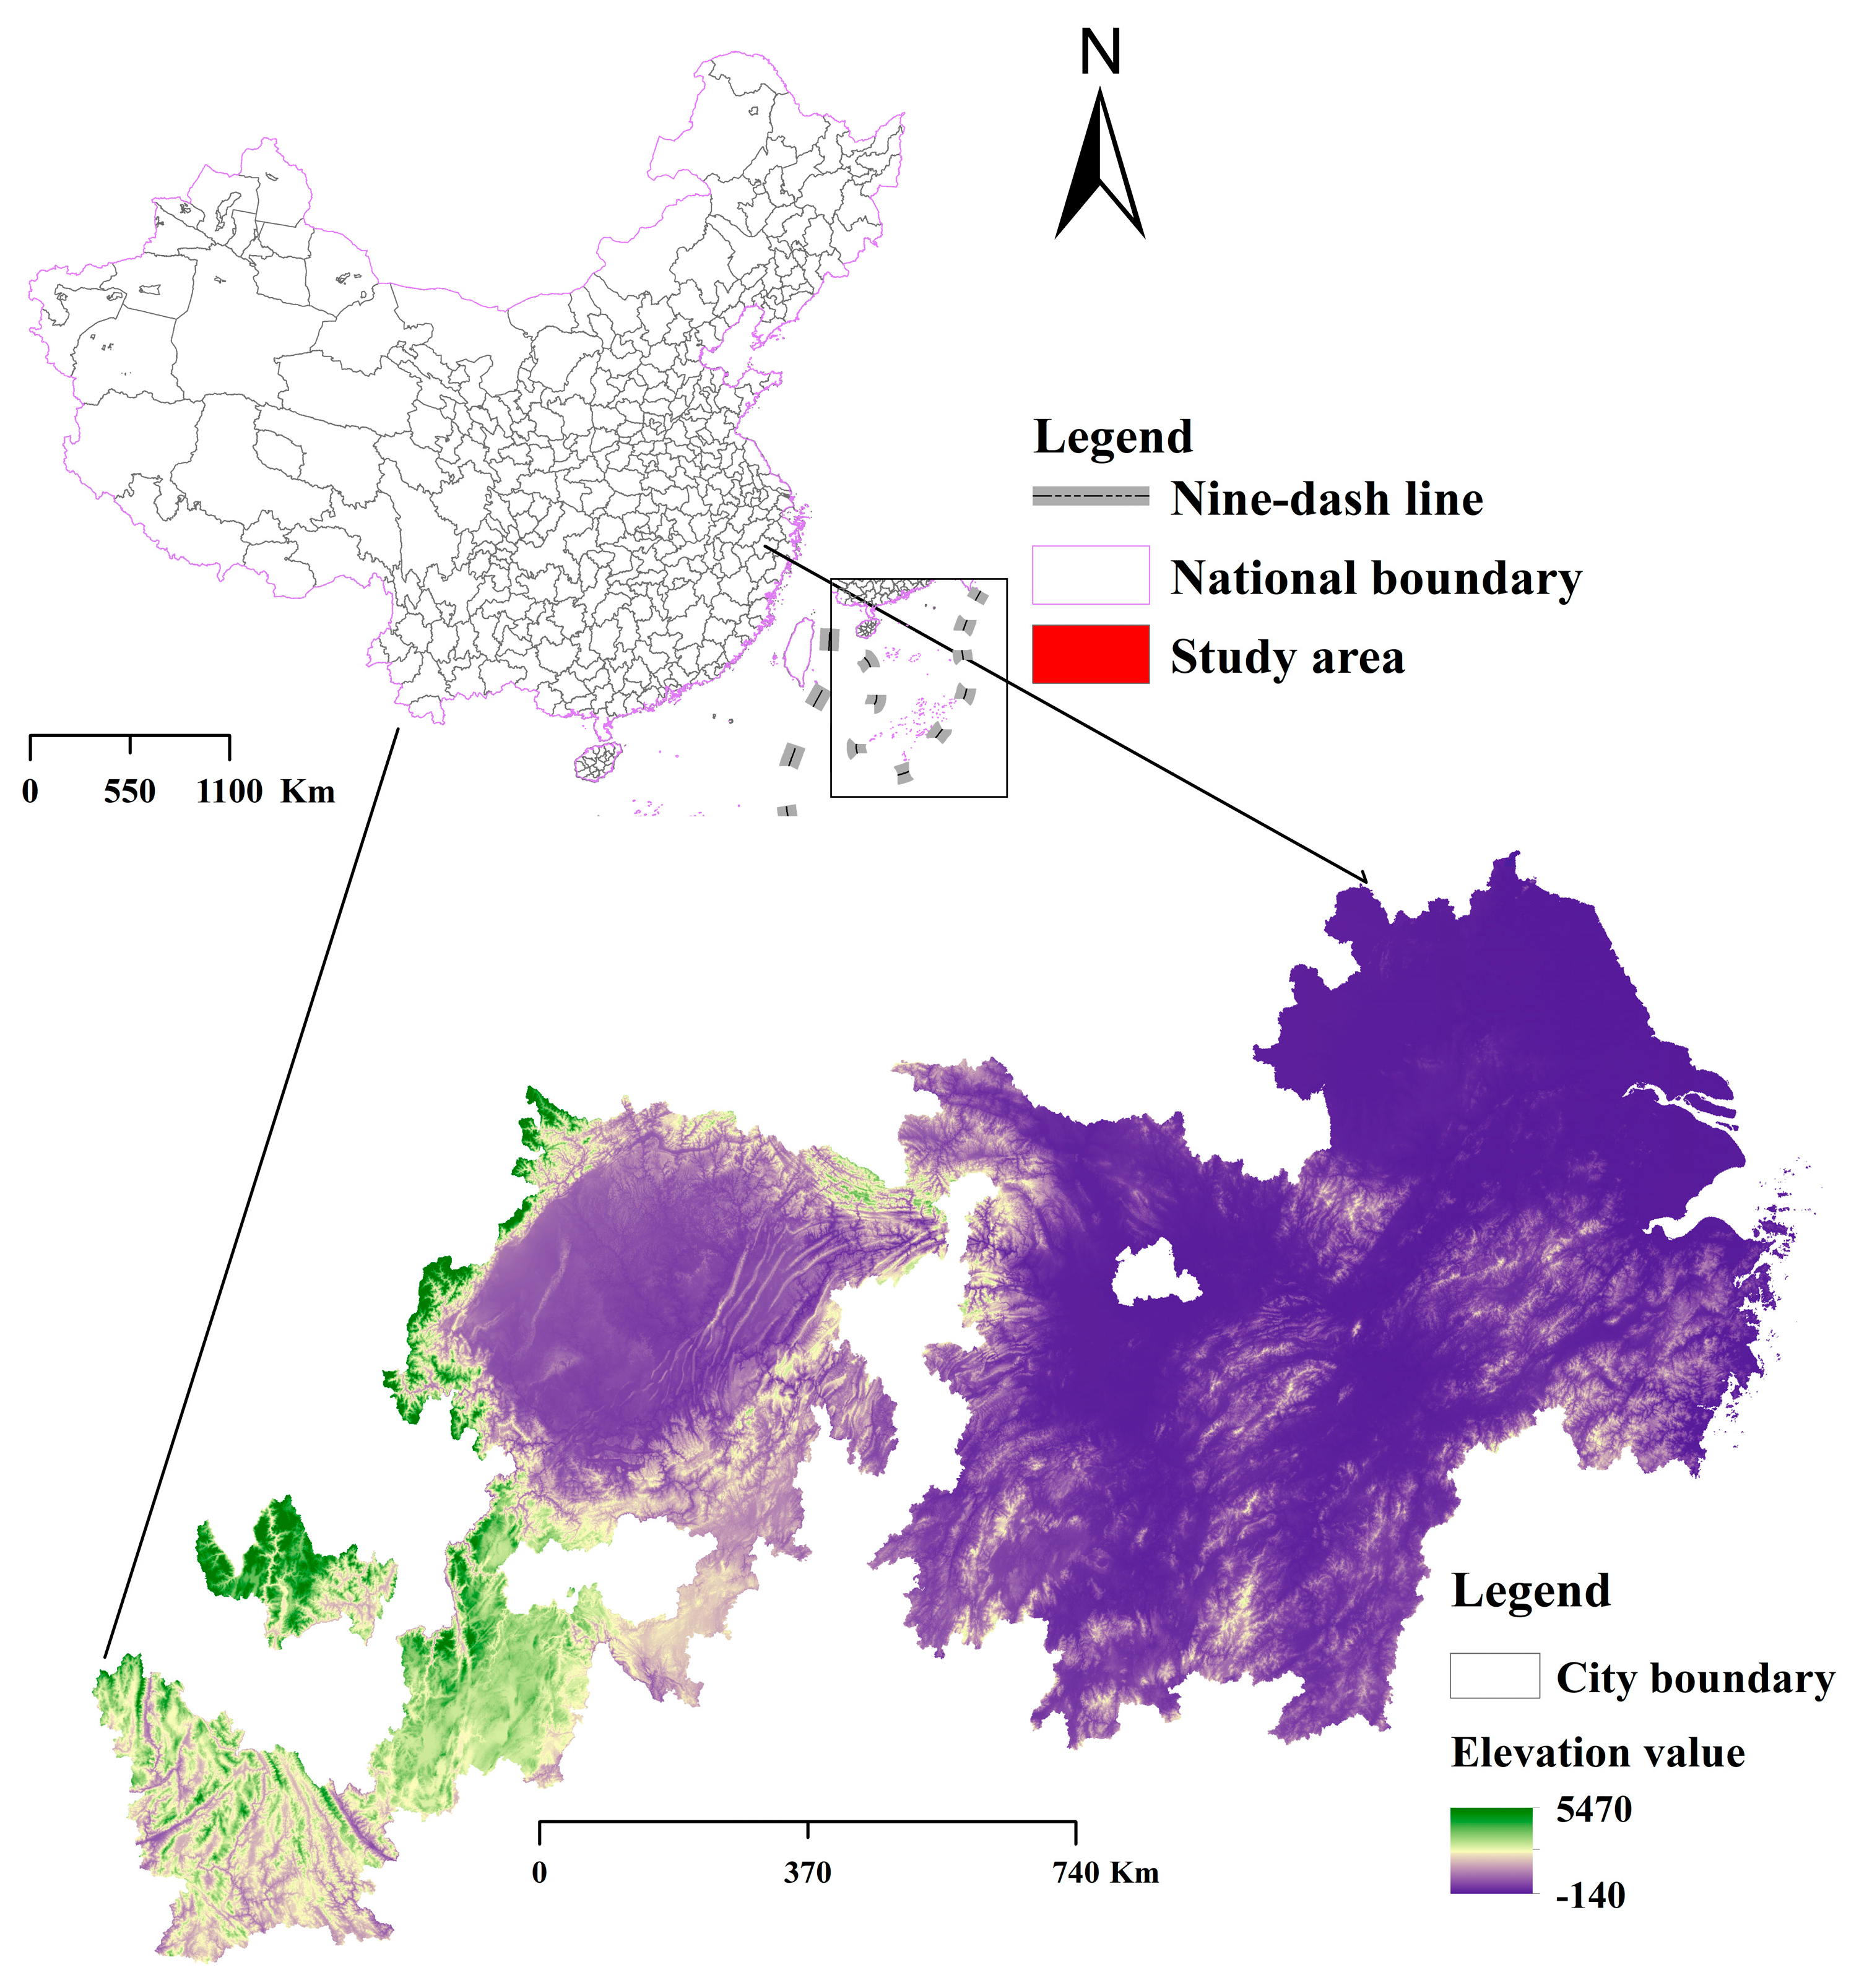
3.1.1. Study Area

The YREB, as an important economic corridor along the Yangtze River of China, covers 11 provinces and cities along the river (see Figure 1) and is an important engine for China’s economic development. This region is known for its rich natural resources, developed industrial base, and dense population, contributing more than 40% of the country’s GDP and 45% of the country’s population in 2023. However, rapid economic growth has also put great pressure on the ecological environment. In terms of ecological environment, the YREB faces many challenges. The issue of water pollution has become alarmingly severe, with several tributaries and lakes falling short of the established water quality benchmarks. The primary culprits behind this degradation are identified as industrial effluents, which are often discharged without proper treatment. Additionally, the non-point source pollution from agricultural activities contributes significantly to the contamination, as does the inadequate management of domestic sewage. To address these concerns comprehensively, it is essential to implement targeted strategies that tackle each of these pollution sources effectively. For industrial discharge, stricter regulations and advanced treatment technologies are imperative. In the case of agricultural runoff, sustainable farming practices and the use of environmentally friendly inputs can help mitigate the impact. Moreover, improving the infrastructure for wastewater treatment can significantly reduce the load of domestic sewage on water bodies [22]. Furthermore, air pollution remains a significant concern that cannot be overlooked. Despite recent improvements through policy regulations and control measures, the issue of winter haze persists in certain regions [23]. Land resources are also facing severe challenges, mainly caused by long-term industrial activities and unreasonable urban expansion [24]. At the social and economic level, the YREB is relatively perfect in terms of public service systems such as education and medical care, but the development within the region is unbalanced, and there is still a gap between the central and western regions and the eastern coastal areas [25]. Migration is brisk, especially to the more economically developed cities on the eastern seaboard. When conducting the research on the YREB, we chose 108 prefecture-level cities as samples based on the principle of data availability. The data for these cities are relatively complete and easily accessible, including key information such as economic indicators, demographics, environmental monitoring, and ecological assessment, thus ensuring the reliability of the study and the accuracy of the analysis. This selected sample of cities can more effectively represent the development trends and challenges faced by the entire YREB, providing solid data support for formulating regional development strategies and environmental governance measures.

3.1.2. Data Source

In order to make the data acquisition method more complete and rational, only 108 cities in the YREB are taken as the research object. According to the coverage of China’s 11th Five-Year Development Plan to the 14th Five-Year Development Plan, the period is chosen from 2006 to 2022. In addition, the social and economic data in this study come from China City Statistical Yearbook, China Statistical Yearbook, and various city statistical yearbooks and statistical bulletins. Relevant data for the estimation of ecological footprint and ecological carrying capacity are derived from the statistical yearbook of each city and the province where it is located. Among them, the data of the national land cover dataset and Chinese urban divisions are derived from the Data Center for Resources and Environmental Sciences, Chinese Academy of Sciences (https://www.resdc.cn, accessed on 26 May 2024). It should be noted in particular that the relevant economic data covered in this article use the GDP deflator to deflate prices, with 2005 as the base year.

3.2. Methods

3.2.1. Ecological Footprint Model

Ecological economist Daly (2004) proposed three criteria for sustainable development, namely the following. The rate of utilization of renewable resources (such as biological resources) should not be faster than the rate of regeneration. Non-renewable resources (such as fossil fuels) should not be consumed faster than the replacement rate of the corresponding renewable resources. Pollution and waste should not be removed faster than ecosystems can be disposed of harmlessly. In short, as long as the stock of natural capital is not reduced, even if the capital flow is fully occupied, it still meets the minimum level of sustainable development [26]. Based on this guideline, the ecological footprint is widely used to measure the extent of natural resource consumption in an area [27]. Its calculation formula is as follows:
E F = N × e f = N × a a i = N × r i × C i P i
E C = N × e c = 0.88 × N × a j × r j × y j
where E F is the ecological footprint (hm2); e f is per capita ecological footprint (hm2/cap); E C is the ecological carrying capacity (hm2); e c is the per capita ecological carrying capacity (hm2/cap); N is the number of people; and i is the category of consumables. a a i refers to the per capita land use area of biological production after converting type i consumables. r i is the equilibrium factor of consumable i . r j is the equilibrium factor of consumable j . C i is the per capita consumption of consumable i ; P i is the global average production of consumable i ; a j is the per capita area of class j land use type; y j is the yield factor of class j land use type. In the calculation of ecological footprint, the determination of equilibrium factor and yield factor refer to the study of [13].

3.2.2. Measure the HDI

The HDI is an extremely important index; it is a comprehensive index to measure the human development level of a country proposed by the United Nations Development Programme in 1990 [28]. Drawing on the research of [29], we first constructed the HDI measurement index system of cities in the YREB from three aspects: economy, education, and health (Table 1), and then completed the evaluation by entropy weight method.
The calculation formula of the entropy weight method is as follows:
H D I i = Z i j * ω j
ω j = 1 e j ( 1 e j )
e j = p i j ln ( p i j ) ln ( m )
p i j = Z i j Z i j
Here, Z i j and Z i j represent the original value and the dimensionless value of the evaluation index, respectively. e j and ω j represent the information entropy and entropy weight of the j indicator, respectively (note: the calculation results of the entropy weight have been reported in Table 1).

3.2.3. Measure the EWP

Based on the per capita ecological footprint and HDI calculated by the above method as the basic data, the EWP level of each city is calculated according to the following formula:
E W P = H D I E F I E F I = E F max ( E F ) , max ( E F ) 0
Here, E W P is the ecological welfare performance, and the higher the value, the higher the level of ecological welfare and the stronger the ability of sustainable development; E F I is the ecological footprint index, and the higher the value, the greater the ecological resource consumption and the greater the pressure on the ecological environment; E F and H D I represent, respectively, the ecological footprint and human development index measured in the preceding method.

3.2.4. ST-LMDI Model

Firstly, ST-LMDI method was adopted to decompose the driving factors of urban EWP in the YREB from the time and space dimensions, respectively. Compared with the traditional LMDI method, ST-LMDI can not only eliminate decomposition residual terms and better solve the zero value problem, but also has the advantage of spatio-temporal comparison across regions and time periods, which is conducive to inter-regional comparison and trend development analysis [30]. Based on existing studies [31,32], this study decomposes EWP from six aspects: social benefit, economic benefit, population dispersion, urban population density, urban scale, and ecological sustainability, and builds the basic decomposition model as follows:
E W P = H D I E F I                   = H D I G D P × G D P P t × P t P c × P c A b × A b E c × E c E F I                   = S o c B × E c o B × P o p D × U p o p × U b a S × E c o S
Here, P t and P c represent the total population of the city and the population of the municipal district, respectively; A b and E c represent urban built-up area and ecological carrying capacity, respectively. Through decomposition, six factors are obtained in turn: S o c B , social benefit, which represents the level of residents’ welfare that can be transformed by a unit of national economic output, and measures the contribution of economic growth to the improvement of residents’ welfare; E c o B , economic benefits, which refers to the economic level enjoyed per capita, which can reflect regional economic growth and living standards; P o p D , population dispersion, which reflects the population dispersion of the regional total population in the municipal district and other areas. Combined with the meaning of the index, the decrease in population dispersion indicates that the level of regional population agglomeration in the municipal district has increased. U p o p is the population density of urban areas in each city, which can reflect the quality of urbanization development. Considering that regional population is concentrated in municipal districts, although it can bring certain positive spillover effects on economic development, for EWP, if the expansion rate of land area in built-up areas exceeds the population growth rate, the negative benefits of population agglomeration, industrial agglomeration, and urban land area expansion on the ecosystem of a municipal district may be higher than the positive benefits on the welfare level of residents [33]. Therefore, P o p D and U p o p were used to discuss the driving effect of population factors on EWP. U b a S , the scale of urbanization, is quantified by the ecological carrying capacity per unit area of the urban built-up area, which not only reflects the occupation of ecological carrying capacity by urbanization construction, but also reflects the expansion of urban area in the process of urbanization, and also helps to realize the horizontal comparison between regions. E c o S refers to ecological sustainability. Generally speaking, the higher the ecological carrying capacity and the lower the ecological footprint, the larger the value, and the higher the ecological sustainability of the region.
Secondly, the ST-LMDI method is used to compare the decomposition results in a larger spatio-temporal range. The average value of all samples can be used to build the target city (denoted as T c ) and compare it with all cities in different periods, so as to ensure that the comparison between all cities and years is based on a standard. The target city is calculated as follows:
E W P T c = 1 1836 i = 1 108 j 17 E W P i j
Here, E W P i j represents the EWP value of city i in year j . Then, when t = k in any year, the spatial difference of EWP between cities in the YERB and city T c (denoted as Δ E W P i k T c ) can be decomposed into:
Δ E W P i k T c = E W P i k E W P T c                                       = Δ E W P i k T c S o c B + Δ E W P i k T c E c o B + Δ E W P i k T c P o p D + Δ E W P i k T c U p o p + Δ E W P i k T c U b a S + Δ E W P i k T c E c o S
Here, E W P i j represents the EWP value of the city i in that year k ; Δ E W P i k T c S o c B ,   Δ E W P i k T c E c o B ,   Δ E W P i k T c P o p D ,   Δ E W P i k T c U p o p ,   Δ E W P i k T c U b a S ,   Δ E W P i k T c E c o S , respectively, represent the contribution degree of six driving factors in the spatial difference between the city and the target city, which is calculated as follows:
Δ E W P i k T c S o c B = E W P i k E W P T c ln E W P i k ln E W P T c × ( ln S o c B i k ln S o c B T c )
Δ E W P i k T c E c o B = E W P i k E W P T c ln E W P i k ln E W P T c × ( ln E c o B i k ln E c o B T c )
Δ E W P i k T c P o p D = E W P i k E W P T c ln E W P i k ln E W P T c × ( ln P o p D i k ln P o p D T c )
Δ E W P i k T c U p o p = E W P i k E W P T c ln E W P i k ln E W P T c × ( ln U p o p i k ln U p o p T c )
Δ E W P i k T c U b a S = E W P i k E W P T c ln E W P i k ln E W P T c × ( ln U b a S i k ln U b a S T c )
Δ E W P i k T c E c o S = E W P i k E W P T c ln E W P i k ln E W P T c × ( ln E c o S i k ln E c o S T c )
Similarly, on the change of a period (t0tT), the spatial decomposition result of city i and the target city is expressed as:
Δ E W P i 0 T c = E W P i 0 E W P T c                                       = Δ E W P i 0 T c S o c B + Δ E W P i 0 T c E c o B + Δ E W P i 0 T c P o p D + Δ E W P i 0 T c U p o p + Δ E W P i 0 T c U b a S + Δ E W P i 0 T c E c o S
Δ E W P i T T c = E W P i T E W P T c                                       = Δ E W P i T T c S o c B + Δ E W P i T T c E c o B + Δ E W P i T T c P o p D + Δ E W P i T T c U p o p + Δ E W P i T T c U b a S + Δ E W P i T T c E c o S
Therefore, the time decomposition result of the change in EWP of city i from t 0 to t T is as follows:
Δ E W P i T i 0 = E W P i T E W P i 0                                       = ( E W P i T E W P T c ) ( E W P i 0 E W P T c )                                       = Δ E W P i T T c Δ E W P i 0 T c                                       = ( Δ E W P i T T c δ Δ E W P i 0 T c δ ) δ = { S o c B , E c o B , P o p D , U p o p , U b a S , E c o S }
Due to the different number of cities in the middle and lower reaches of the YREB, in order to compare different regions of the YREB, we first obtained the average values of the upper, middle, and lower reaches of the YREB, and then conducted spatial decomposition of the EWP of region r at time t k through the following formula:
Δ E W P r k T c = 1 r j i = 1 r j ( Δ E W P i k Δ E W P T c ) = 1 r j i = 1 r j Δ E W P i k T c δ δ = { S o c B , E c o B , P o p D , U p o p , U b a S , E c o S }                  
Therefore, the time decomposition result of the change in EWP of region r from time t 0 to t T is as follows:
Δ E W P r T r 0 = 1 r j i = 1 r j ( Δ E W P r T Δ E W P r 0 ) = 1 r j i = 1 r j ( Δ E W P i T T c δ Δ E W P i 0 T c δ ) δ = { S o c B , E c o B , P o p D , U p o p , U b a S , E c o S }

4. Results

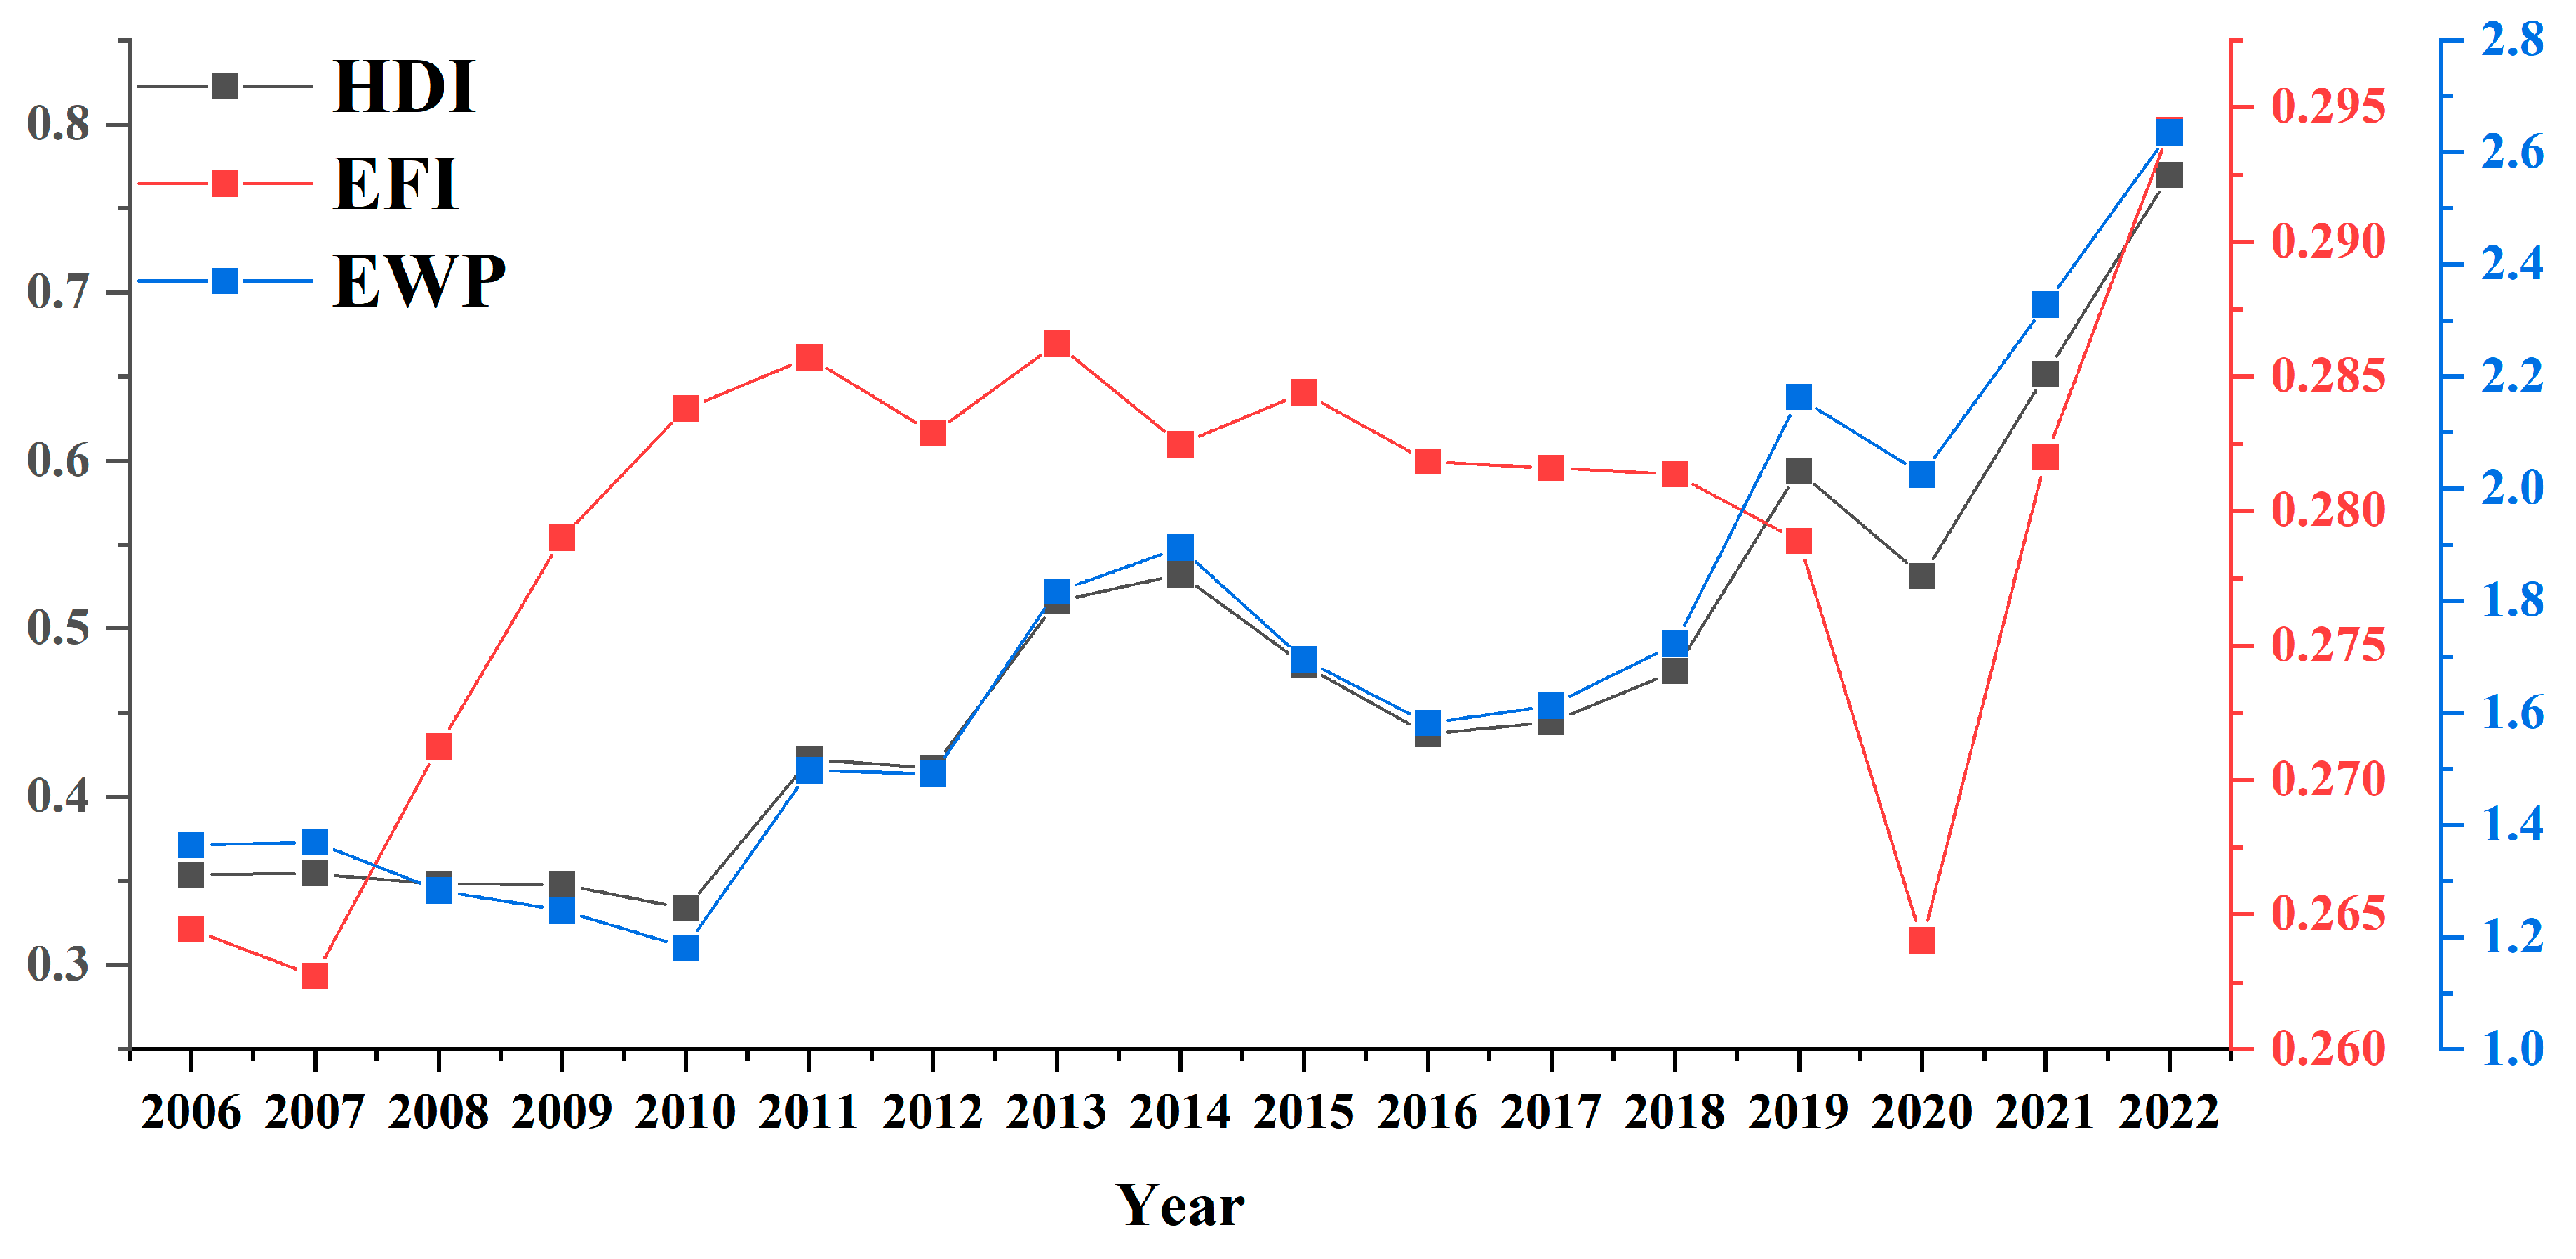
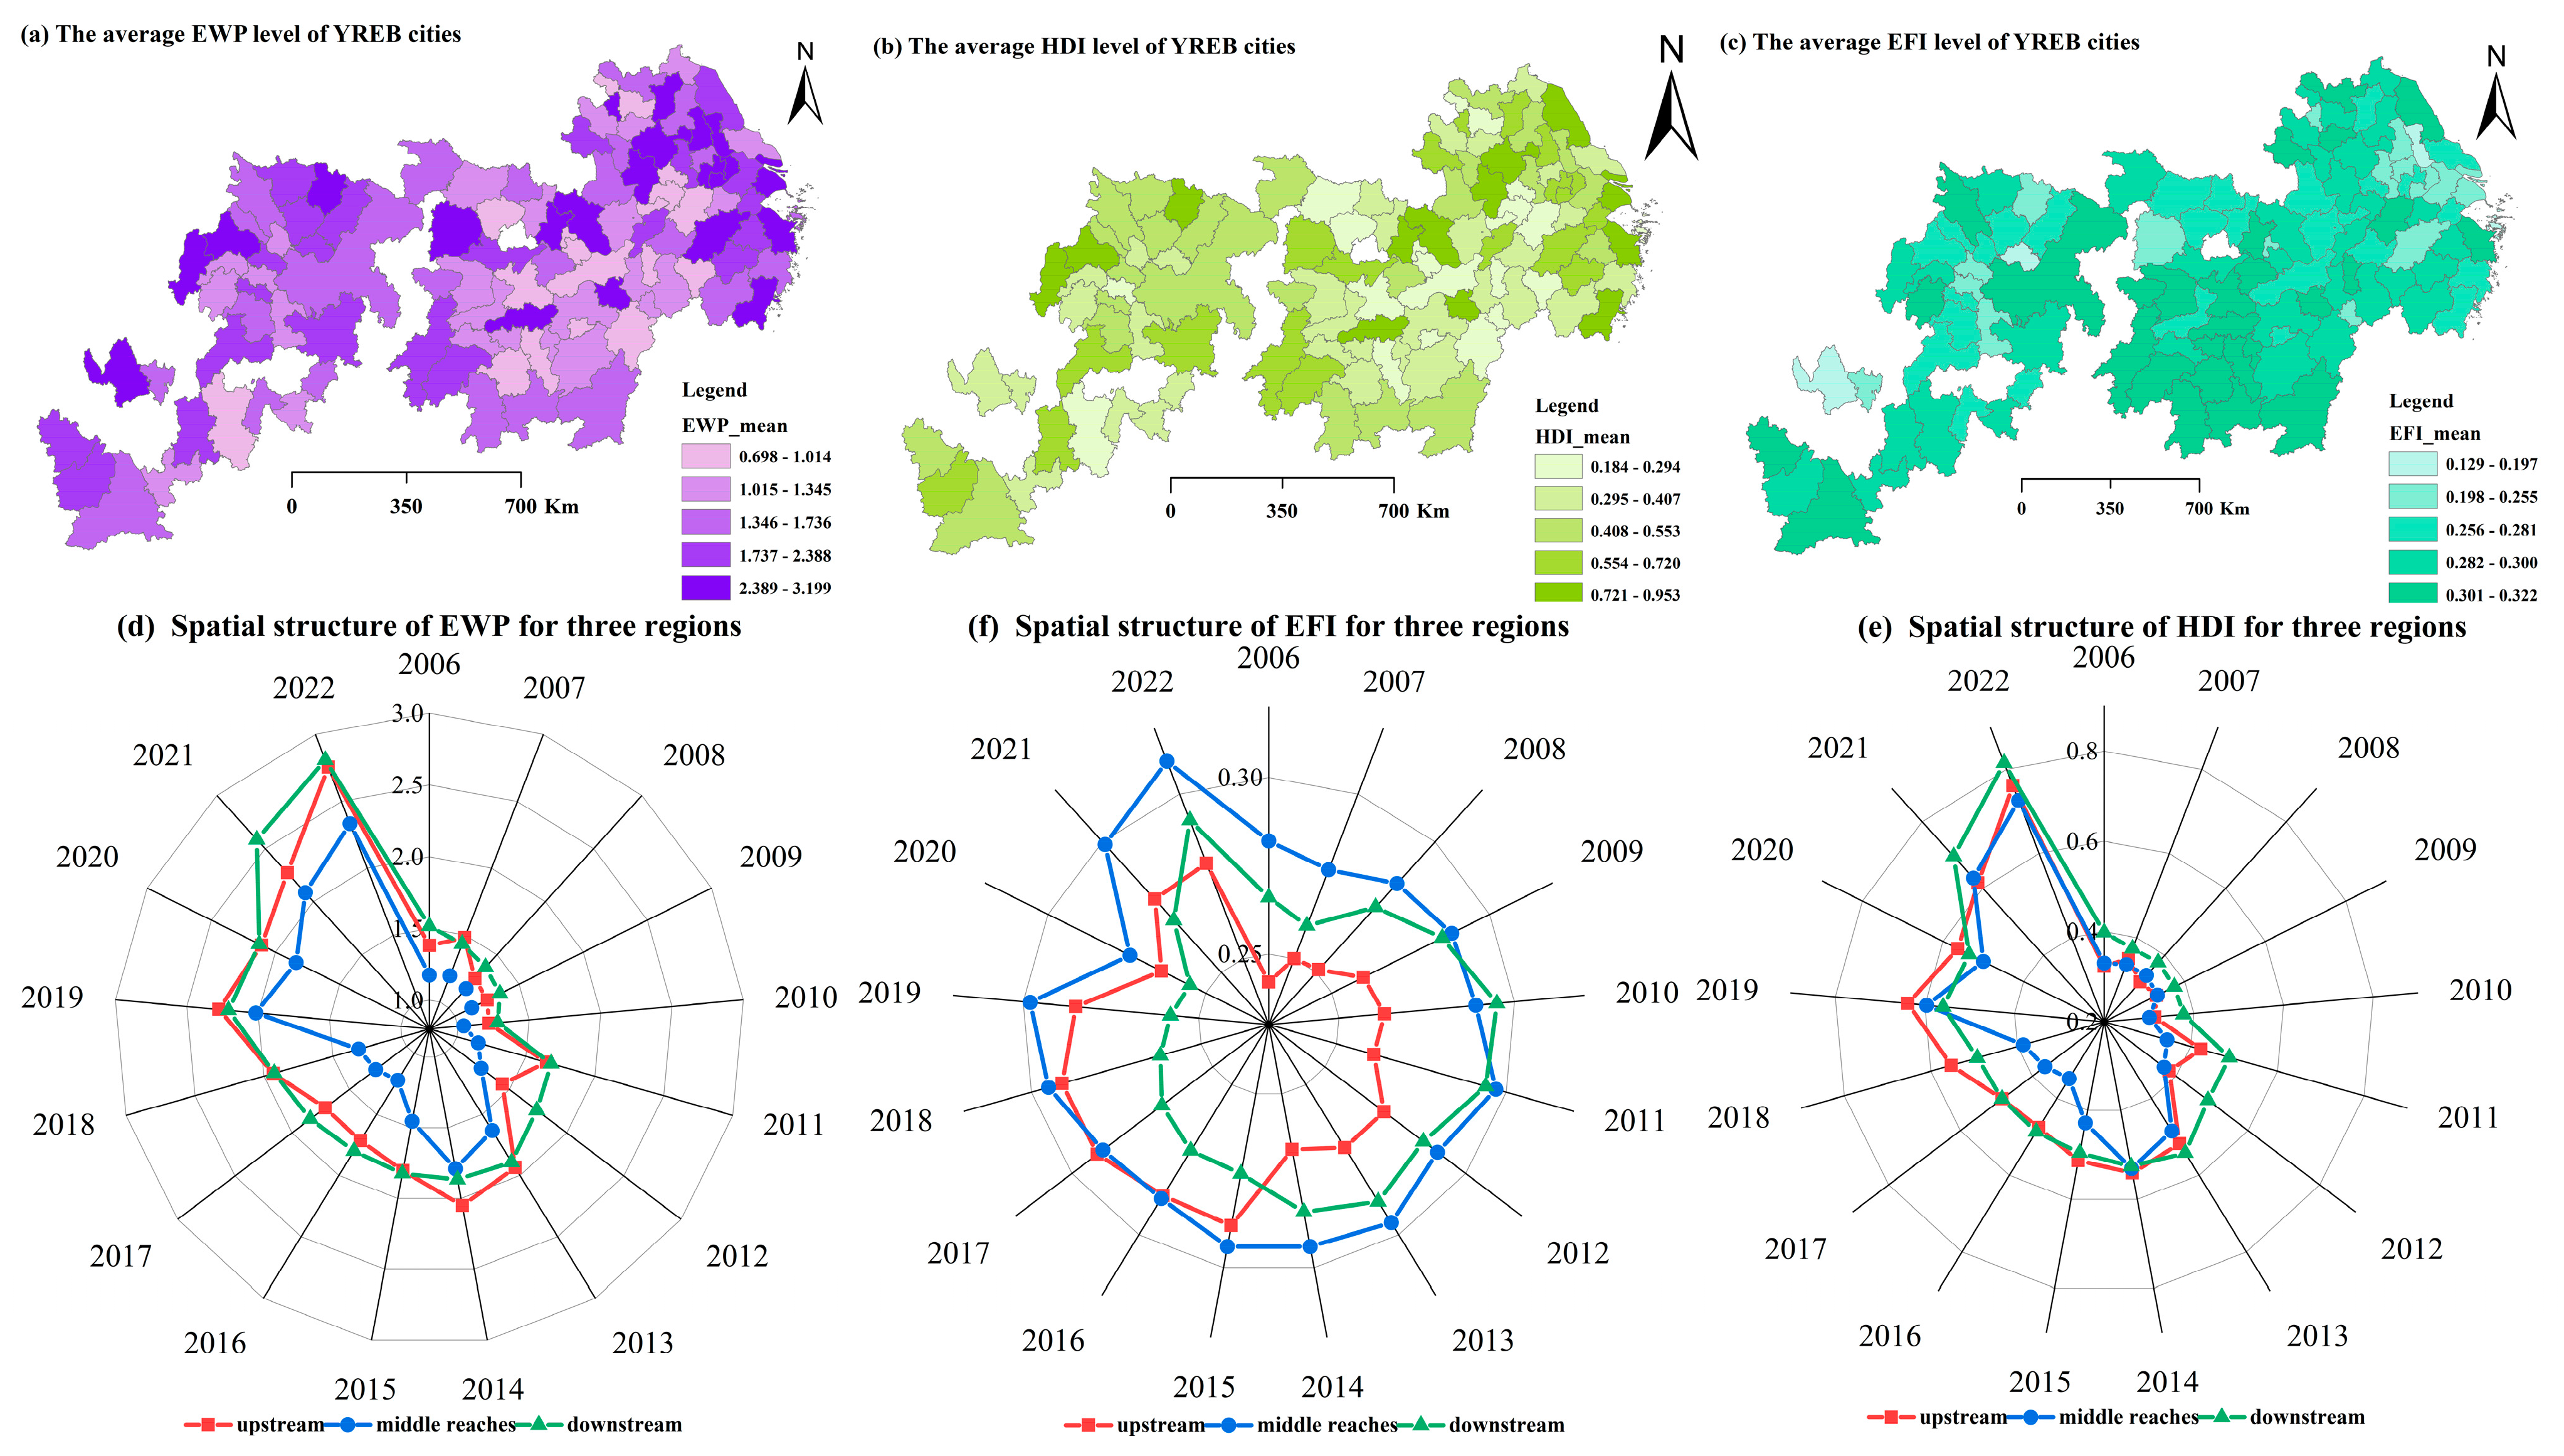
4.1. Spatiotemporal Evolution of EWP in the YREB

The HDI, EFI, and EWP of 108 cities in the YREB over 17 years were measured by the methods described in Section 3.2.1, Section 3.2.2, and Section 3.2.3, and the temporal variation chart of the overall mean value of the study area was drawn (Figure 2).
Figure 2 shows that the YREB has gone through different stages of development during the 11th Five-Year Plan (2006–2010), 12th Five-Year Plan (2011–2015), 13th Five-Year Plan (2016–2020), and 14th Five-Year Plan (2021–2025). On the whole, both EWP and HDI showed a “W” type of change, which decreased first, then increased and then decreased. During the 11th Five-Year Plan period, the HDI of the YREB showed a slow growth and the EFI was relatively stable, but the EWP declined in 2008. This may reflect an increase in ecological pressures during this period, despite an increase in the level of human development, leading to a decline in EWP. During the 11th Five-Year Plan period, the government began to attach importance to ecological environmental protection and promote economic restructuring and industrial upgrading to achieve sustainable development [34]. Entering the 12th Five-Year Plan, HDI has increased significantly in 2011, EFI has decreased, and EWP has also increased, indicating that during this period, policies that pay more attention to ecological protection and sustainable development may have been implemented, promoting the harmony between human development and the ecological environment. The 12th Five-Year Plan emphasizes the construction of ecological civilization and puts forward the concept of green development, circular development, and low-carbon development [35]. During the 13th Five-Year Plan period, although HDI declined in 2020 due to the possible impact of COVID-19, EFI continued to decline and EWP increased significantly in 2021, which may be related to policies to strengthen ecological civilization construction and promote green development. The 13th Five-Year Plan further emphasizes the construction of ecological safety barriers and the improvement of ecological environment quality [36]. By the beginning of the 14th Five-Year Plan, both HDI and EWP reached historic highs, and EFI also rose, which may indicate that the YREB is actively taking measures to reduce its ecological footprint and improve ecological welfare while promoting high-quality development. The 14th Five-Year Plan will continue to deepen the construction of ecological civilization and promote the formation of green development methods and lifestyles to achieve harmonious coexistence between man and nature [37].
According to the Outline of the YREB development plan, 108 cities in the YREB are divided into three regions according to geographical location: upper, middle, and lower reaches [38]. The upstream region includes four provincial administrative units of Sichuan, Yunnan, Chongqing, and Guizhou, with a total of 31 urban units. The middle reaches region includes Hunan, Hubei, and Jiangxi provinces, with a total of 36 urban units. The downstream area is composed of 41 urban units supplied by Anhui, Jiangsu, Zhejiang, and Shanghai. The average of the HDI, EFI, and EWP for each region was calculated and visualized (Figure 3).
Figure 3a, 3b, and 3c, respectively, show the average EWP, HDI, and EFI levels of 108 cities in the YREB from 2006 to 2022, which helps us quickly grasp the overall trend. Figure 3d, 3e, and 3f, respectively, show the spatial structure evolution of EWP, EFI, and HDI in the three regions, which helps us to understand the development characteristics of different regions and the differences among them. On the one hand, from the average level of individual cities (Figure 3a–c), the EWP of these cities shows a significant increase from 2006 to 2022, with the value range increasing from 0.698 to 3.199, reflecting that the balance between ecological protection and economic development is gradually being realized. This result objectively reflects the status quo of urban EWP in the YREB. At the same time, the HDI also showed a positive upward trend, increasing from 0.184 to 0.953, which indicates that the quality of life and development potential of residents have been significantly improved, which is basically consistent with previous studies [39]. In terms of the EFI, the range of values is small, remaining between 0.129 and 0.322. On the other hand, from the perspective of regional spatio-temporal evolution (Figure 3d–f), the development of the three regions of the YREB from 2006 to 2022 in terms of EWP, EFI, and HDI showed obvious regional characteristics and time trends. On the whole, EWP increased most significantly in the downstream region, from 1.515 to 2.809, reflecting that the region has achieved remarkable results in ecological protection and economic development [40]. Although the upstream region declined in 2008, it quickly recovered and continued to grow, reaching 2.754 by 2022, showing positive progress in the coordinated development of ecology and economy. EWP growth in the middle reaches was relatively stable, from 1.176 to 2.334, showing the stability of regional development. The EFI values in the three regions are relatively stable, indicating that the YREB maintains a certain balance in terms of ecological resource consumption, although the EFI in the downstream region declined slightly in 2022, which may indicate an improvement in resource utilization efficiency in the region [41]. The significant increase in HDI, especially in the downstream region from 0.398 to 0.815, reflects the significant progress of the YREB in improving the quality of life of residents, while the HDI growth in the upper and middle reaches also increased from 0.323 to 0.761 and from 0.330 to 0.726, respectively. It shows the efforts of these areas to improve the living standards of their residents. In short, the development trend of the three regions of the YREB shows the importance of placing equal emphasis on ecological protection and economic development. In the future, we should continue to promote coordinated regional development, strengthen ecological protection, and optimize industrial structure to achieve more sustainable and balanced economic growth.

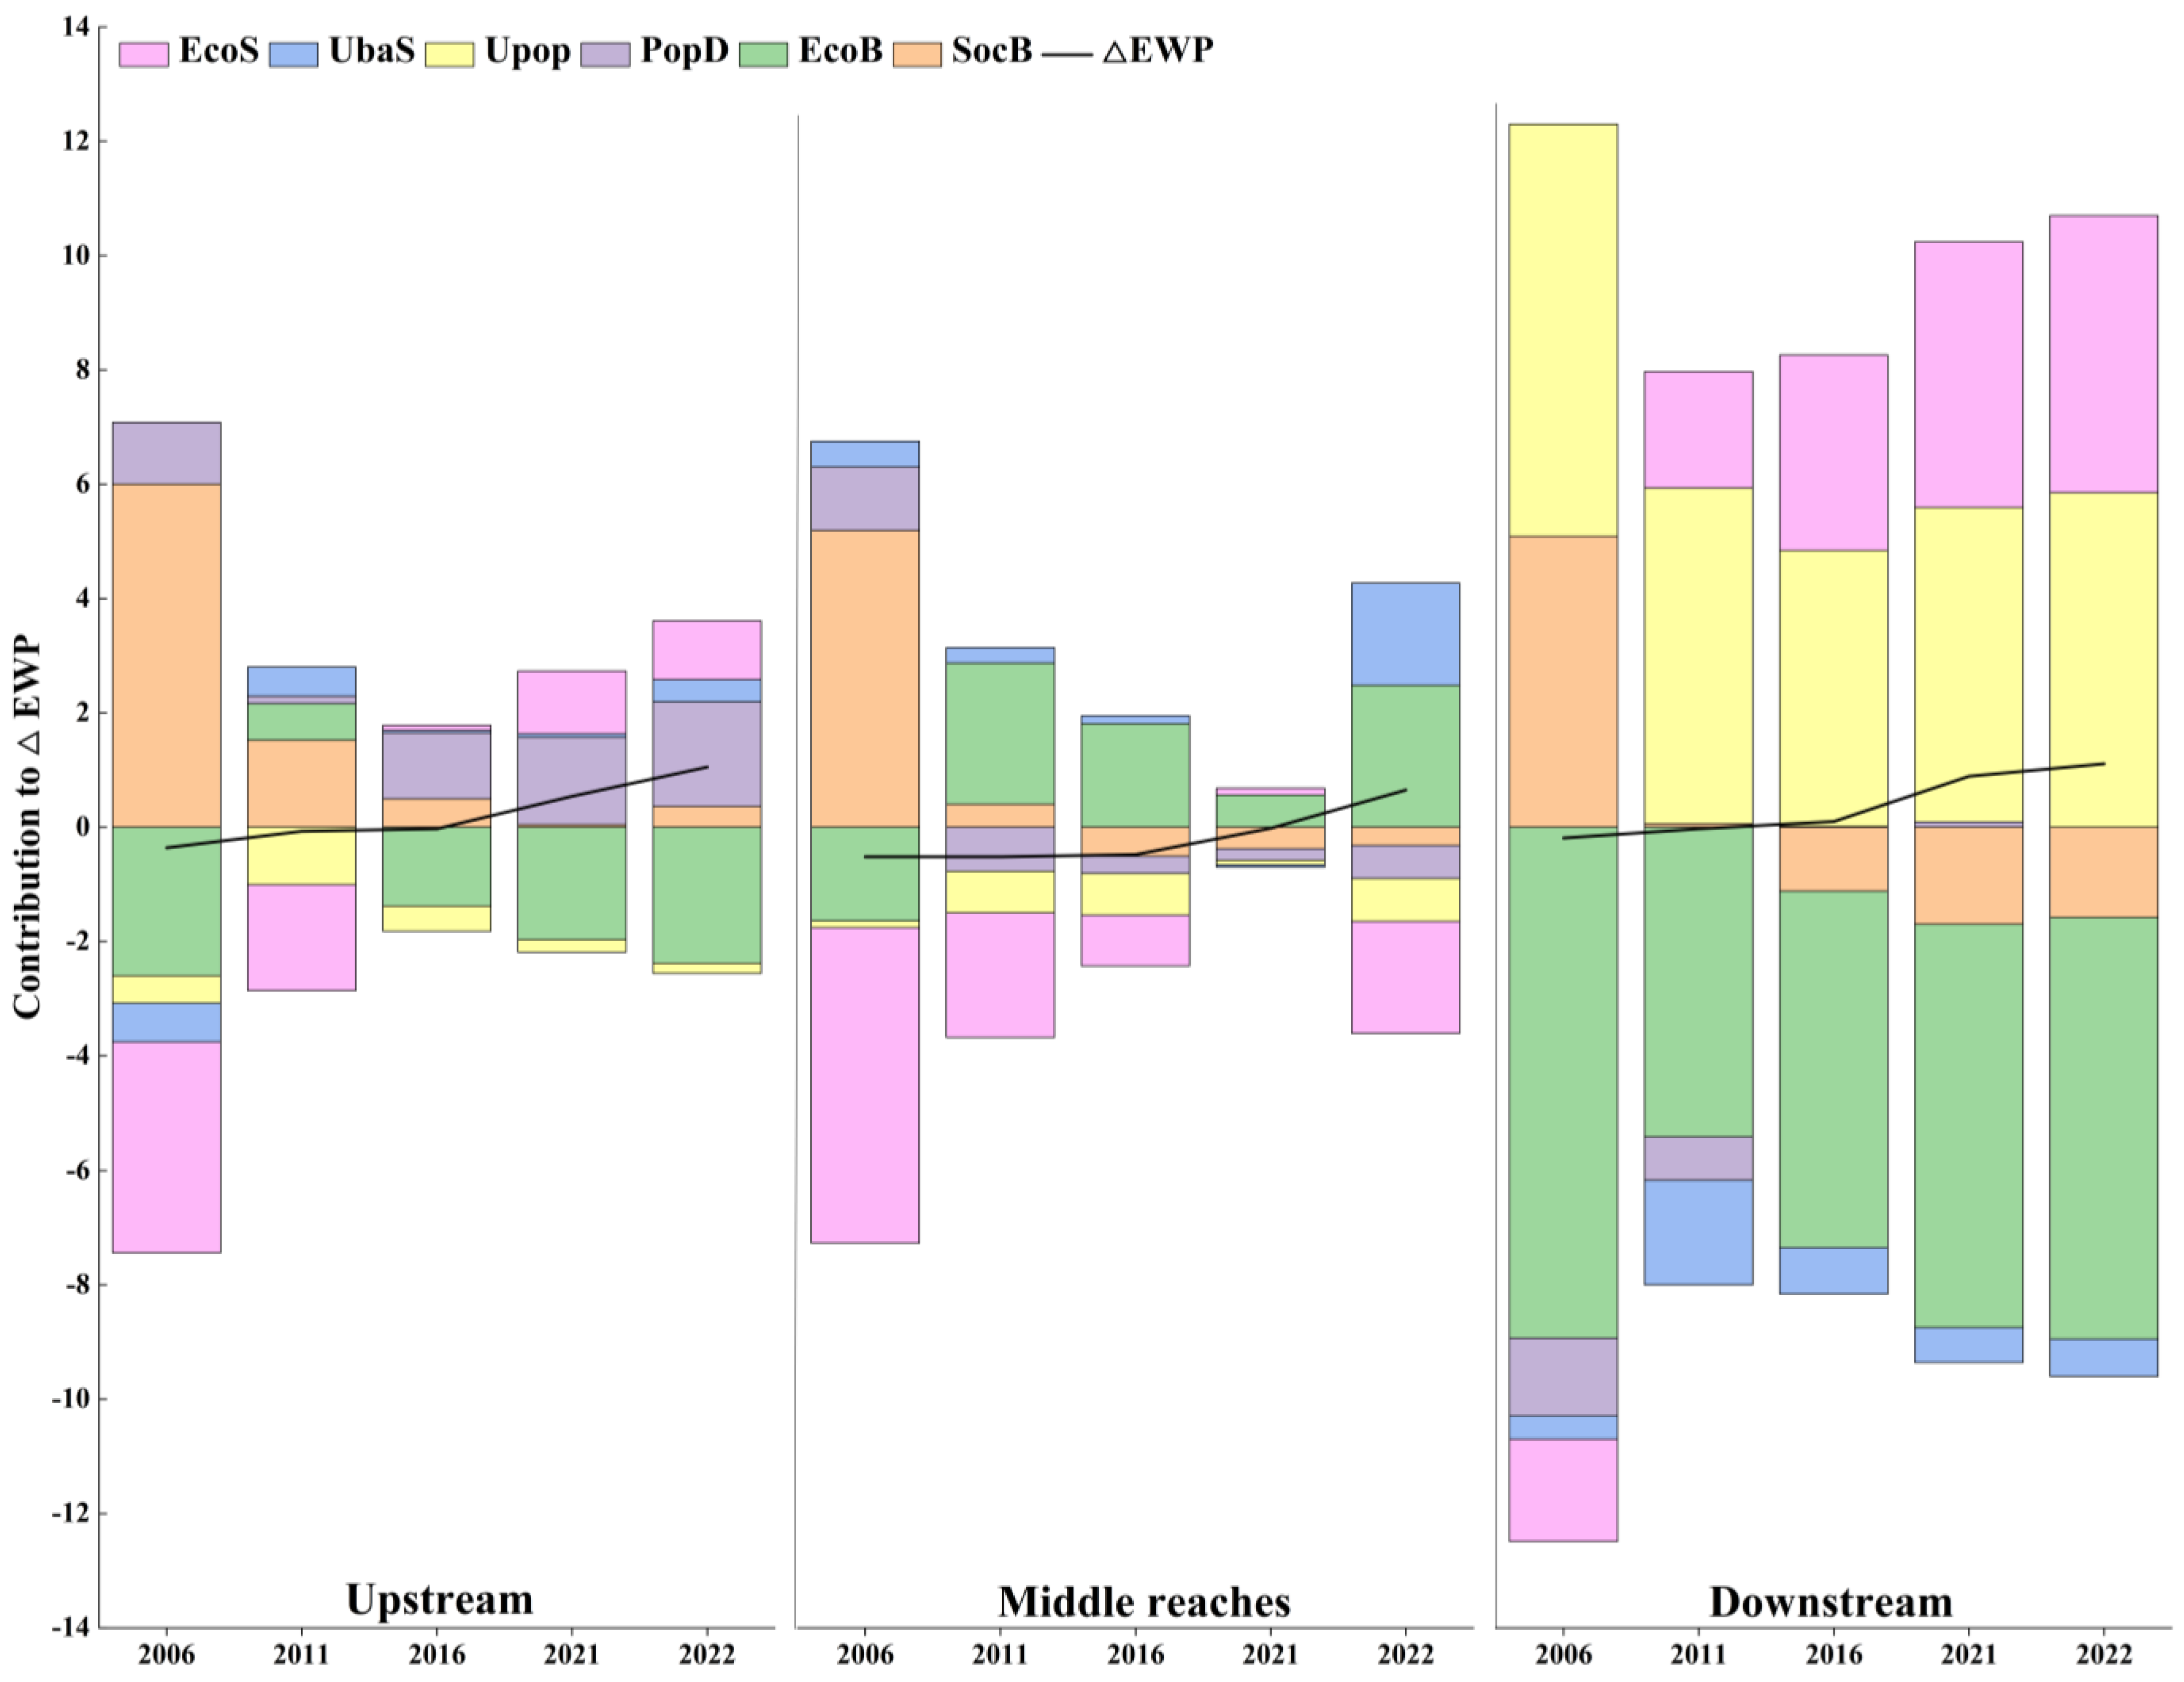
4.2. Temporal Decomposition Results of EWP in the YREB

Through the comprehensive analysis of the EWP, ecological footprint index, and human development index of the three regions of the YREB from 2006 to 2022, we have a preliminary understanding of the sustainable development status of these regions. These indicators not only reveal the overall trend of regional development, but also provide a basis for us to further explore the influencing factors. Next, in order to deeply understand the driving force behind the changes in these indicators, we adopted the ST-LMDI model to conduct a performance-driven decomposition study on ecological welfare.

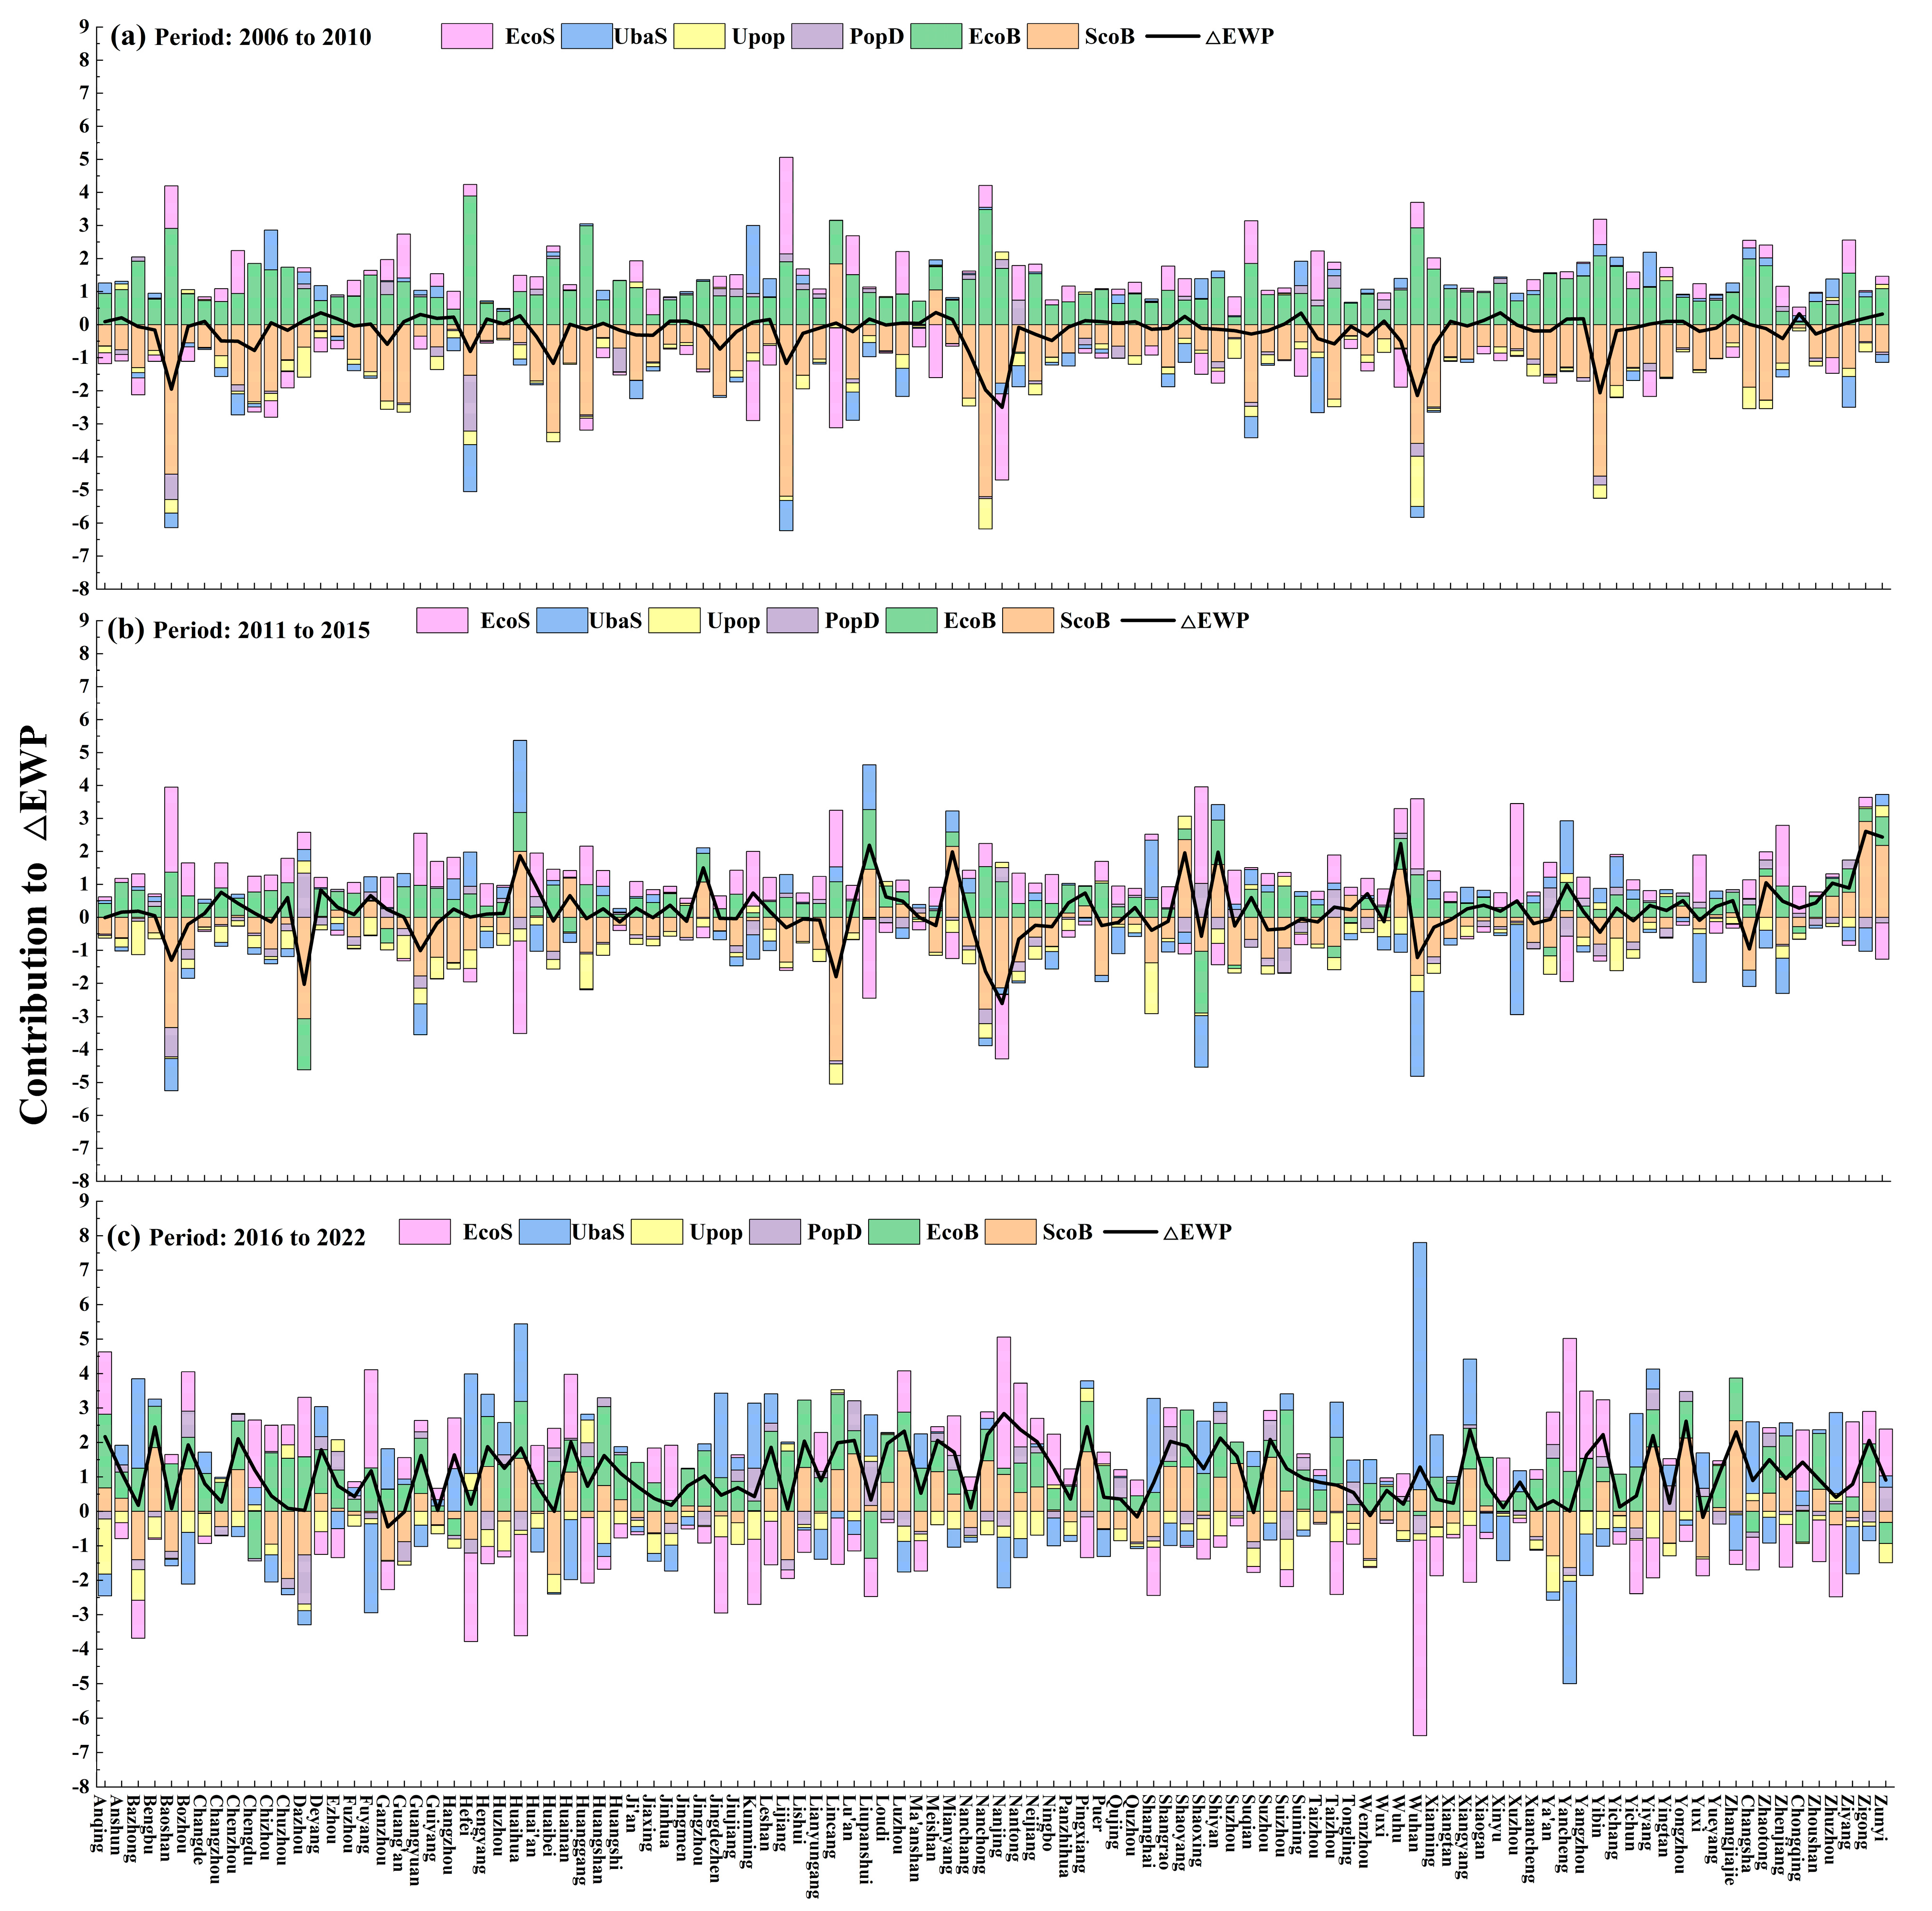
4.2.1. City-Level Decomposition Results

The ST-LMDI method was used to analyze the EWP of 108 cities in the YREB based on economic benefit (EcoB), social benefit (SocB), population dispersion (PopD), built-up area population density (Upop), urbanization scale (UbaS), and ecological sustainability (EcoS). The decomposition results of the three periods of 2006–2010, 2011–2015, and 2016–2022 were obtained (Figure 4). The basis for this division is to match the five-year plan.
According to Figure 4, it is not difficult to find the following:
(1) During 2006–2010, social benefits were generally negatively inhibited, which was related to the rapid expansion of urbanization in China at that time, and the rapid change in urban social structure may have led to an increase in social problems, such as unemployment, unequal distribution of education, and medical resources [42,43]. From 2011 to 2015, with the implementation of the 12th Five-Year Plan, the government increased its investment in social programs, including education, health care, and social security, which may have contributed to the positive contribution of social benefits. From 2016 to 2022, with the completion of the 13th Five-Year Plan and the start of the 14th Five-Year Plan, more attention has been paid to social equity and sustainable development, and the positive contribution of social benefits has been further enhanced. For example, the contribution degree of social benefits in Chenzhou City is 1.21, indicating that the optimization of social policies and the improvement of public services have a positive impact on EWP.
(2) Economic benefits generally show a positive promoting effect in the three time periods, which is consistent with the trend of China’s economic growth and rapid urbanization. However, as the economy has entered the new normal and the growth rate has slowed down, the economic benefit contribution of some cities has declined, such as Changzhou’s economic benefit contribution of 0.89 from 2011 to 2015 [44].
(3) Population dispersion was generally negatively inhibited from 2006 to 2010, which is related to the excessive concentration of population in urban centers in the process of urbanization [45]. With the emphasis on the overall development of urban and rural areas and new-type urbanization in the 11th and 12th Five-Year Plans, the negative impact of population dispersion has been reduced, and some cities have begun to achieve reasonable population distribution. The optimization of the spatial pattern of urban population will help improve the performance of ecological welfare [45].
(4) The negative contribution of urban population density may be related to urban center congestion, resource strain, and environmental pressure. With the emphasis on the optimization of urban spatial structure and the division of urban functional areas in the “12th Five-Year Plan” and “13th Five-Year Plan”, the management of urban population density has been improved, for example, Changzhou City’s contribution of urban population density in 2016–2022 was 0.107.
(5) Urbanization scale had a positive effect on EWP from 2006 to 2010, reflecting the economic benefits and scale effects brought by urbanization. However, with the emergence of resource and environmental problems in the process of urbanization, this promoting effect has been weakened, indicating that the urbanization process needs to pay more attention to ecological benefits. Therefore, it is particularly urgent to comprehensively promote the development of higher-quality new-type urbanization in the YREB [46].
(6) The inhibitory effect of ecological sustainability on EWP was more common from 2006 to 2010, which was related to the insufficient attention paid to ecological environment protection at that time. Therefore, with the emphasis on the construction of ecological civilization and sustainable development in the “Eleventh Five-Year” and “Twelfth Five-Year” plans, the positive promoting effect of ecological sustainability capability has gradually emerged. For example, the contribution degree of ecological sustainability capability in Chengdu from 2016 to 2022 is 1.96, which is a significant result of the implementation of the strategy of park city construction in Chengdu [47].

4.2.2. Region-Level Decomposition Results

According to the LMDI time decomposition results of EWP in the three regions of the YREB (upper, middle, and lower reaches) (Figure 5), we can observe the changing trend of regional driving factors and their contribution to EWP during 2006–2022. On the whole, the three regions of the YREB generally experienced the improvement of EWP during 2006–2022, especially during 2016–2022; the positive driving effect of economic efficiency and urbanization scale was significant. First of all, for the upstream, although the social benefit showed a negative contribution (−1.31) from 2006 to 2010, the positive contribution of economic benefit (1.25) mitigated the impact to a certain extent. However, the positive contribution of urbanization scale and ecological sustainability failed to fully offset the negative impact of other factors, resulting in a negative total contribution (−0.17). Between 2011 and 2015, the negative impact of social benefits decreased and economic benefits decreased slightly, but the positive contribution of ecological sustainability increased significantly, driving the total contribution up to 0.15. From 2016 to 2022, the social benefit turned to a positive contribution (0.02), the economic benefit increased significantly (0.77), and the positive contribution of urbanization scale and ecological sustainability capacity further increased, with the total contribution reaching 1.04, indicating a significant improvement in EWP. Secondly, the middle reaches also showed a negative contribution of social benefit (−1.26) from 2006 to 2010, but the positive contribution of economic benefit (1.16) helped to balance this effect. Nevertheless, the total contribution is still negative (−0.14). From 2011 to 2015, the negative impact of social benefits further decreased, the economic benefits remained stable, and the positive contribution of urbanization scale began to appear, with the total contribution rising to 0.30. From 2016 to 2022, the social benefit turned into a positive contribution (0.42), the economic benefit increased significantly (1.02), and the urbanization scale and ecological sustainability made a significant positive contribution. Despite the negative contribution of ecological sustainability (−0.71), the total contribution still reached 1.12, reflecting the substantial improvement of EWP. Finally, the negative contribution of social benefit (−1.07) and positive contribution of economic benefit (0.99) in the downstream region from 2006 to 2010 could not be fully compensated. The total contribution for this period is negative (−0.24). From 2011 to 2015, the negative impact of social benefits further decreased and economic benefits declined, but the positive contribution of ecological sustainability increased, driving the total contribution up to 0.14. From 2016 to 2022, although the social benefit decreased slightly, the economic benefit increased significantly (0.97), and the positive contribution of urbanization scale and ecological sustainability also increased, with the total contribution reaching 1.01, indicating that the EWP had a significant positive growth.

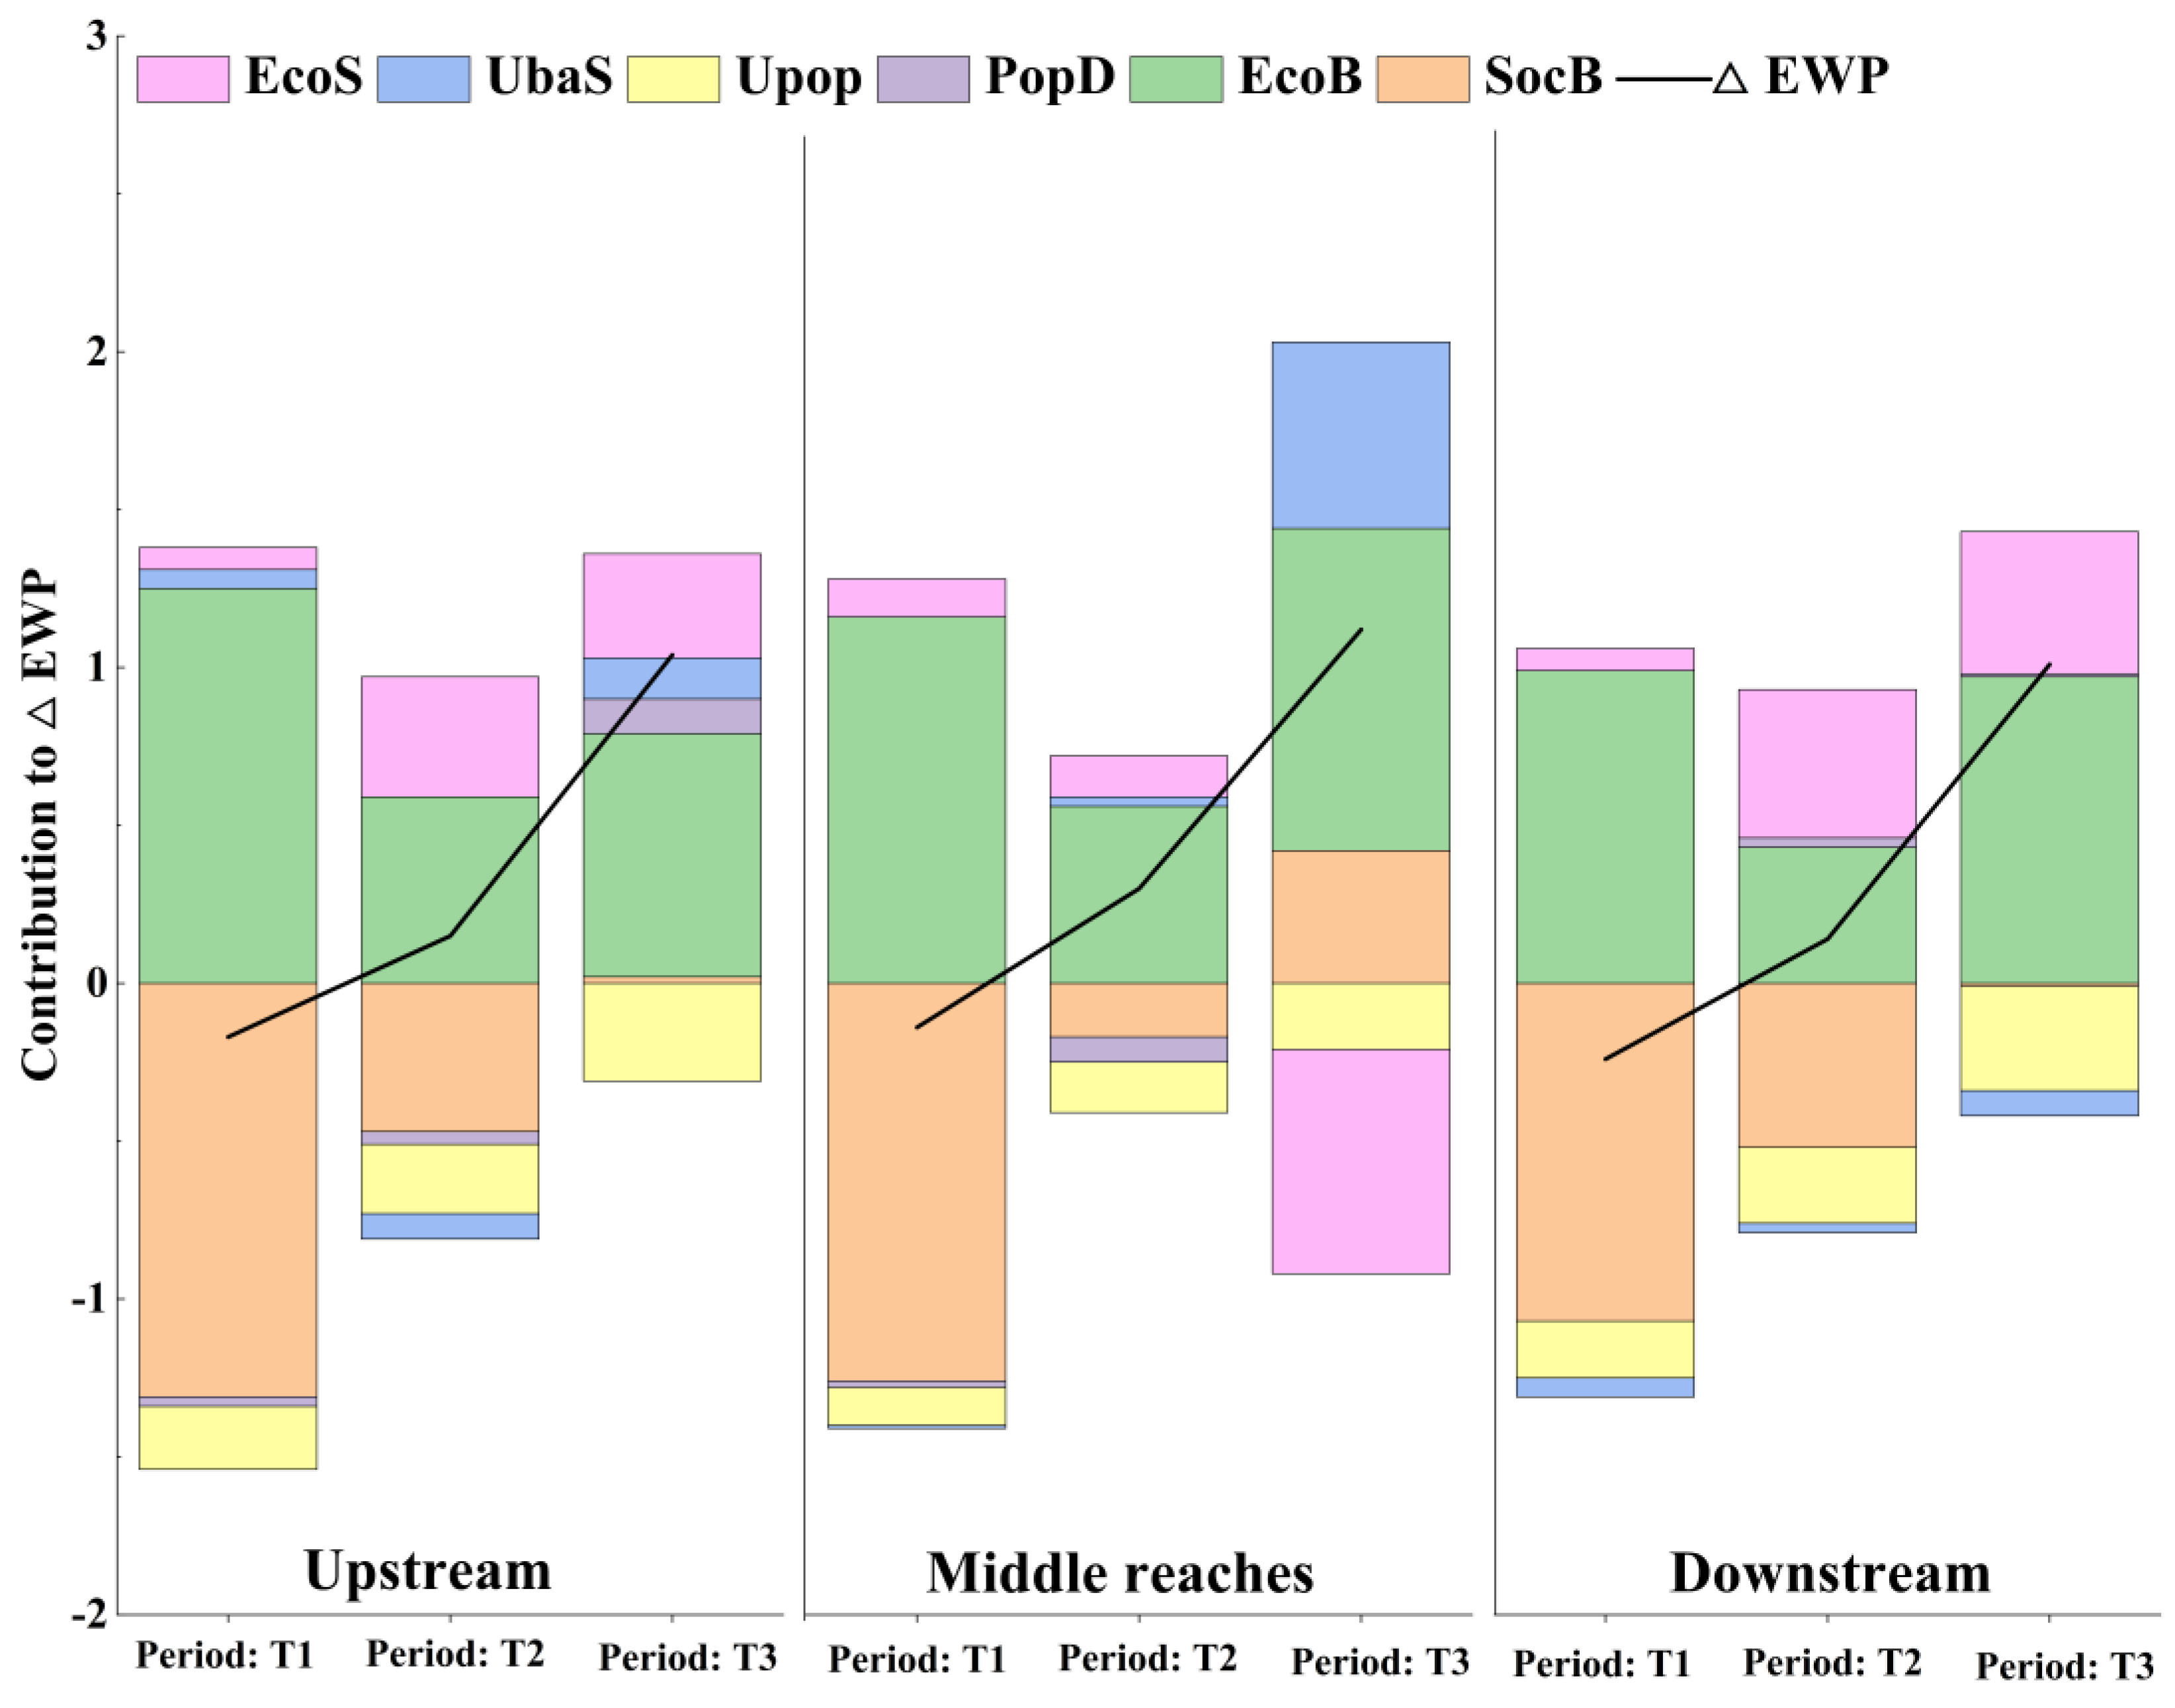
4.3. Spatial Decomposition Results of EWP in the YREB

4.3.1. City-Level Decomposition Results

The EWP of 108 cities in the YREB at four time nodes in 2006, 2011, 2016, and 2022 was spatially decomposed, and the decomposition results were visualized to obtain Figure 6. Figure 6 reveals the development patterns and challenges of different cities. For example, as one of the important cities, the positive change in EWP in Chengdu may reflect the effectiveness of environmental policies and urban planning. Anqing City may face ecological challenges, and the negative contribution of its social and economic benefits indicates the tension between socio-economic development and environmental protection. Yichang’s EWP may be significantly influenced by water resource management and industrial development strategies, while Shanghai’s high ecological sustainability score may reflect its advanced experience in environmental protection. Specifically, we find that social and economic benefits fluctuate greatly among different cities, and population dispersion and ecological sustainability generally have positive contributions to EWP. The impact of urbanization scale is more complex, and some cities show a positive effect, especially in areas with rapid urbanization quality improvement, such as Chengdu. The positive impact of urbanization scale in Chengdu may be related to the emphasis on quality and sustainability in the urbanization process. For example, Chengdu may have implemented efficient urban planning, optimized the urban spatial layout, increased the proportion of urban green space, strengthened the construction of public transportation systems, and promoted the application of green buildings and energy-saving technologies. These measures help to alleviate the excessive consumption of resources and environmental pollution that may occur in the process of urbanization, while improving the ecological carrying capacity of cities and the quality of life of residents. In addition, urban population density has a negative impact on EWP in most cities, suggesting that excessive population concentration may put pressure on the ecological environment.

4.3.2. Region-Level Decomposition Results

The EWP of the three regions of the YREB is spatially decomposed, and the results are shown in Figure 7. As can be seen from Figure 7, the EWP analysis of the upper reaches of the YREB shows that the positive contribution of social benefits has declined over time, from 6.00 in 2006 to 0.36 in 2022, possibly due to the adjustment of social policies or changes in economic structure. The economic performance fluctuated greatly, from −2.60 in 2006, to a positive 0.64 in 2011, and then to −2.38 in 2022. Population dispersion increased year by year, from 1.08 to 1.83, indicating that regional development planning and population policy may promote the improvement of EWP. Urban population density and urbanization scale are negative in most years, reflecting that over-concentration of population may have a negative impact on EWP. The improvement of ecological sustainability has a significant positive contribution to EWP in the later period, increasing from −3.68 to 1.03 year by year, which may be related to the strengthening of environmental protection policies and ecological protection measures. The social benefit of the middle reaches showed a downward trend, from 5.19 in 2006 to −0.32 in 2022, and the economic benefit showed a strong positive contribution in 2011 and 2022, at 2.47 and 2.48, respectively. Population dispersion was negative in most years (−0.58 in 2022), while the growth of urbanization scale had a positive effect on EWP in the later period, decreasing from 0.45 to 1.79. Although the ecological sustainability capacity has been improved, the overall contribution degree is still low, increasing from −5.51 to −1.96 year by year, indicating that there is still a large room for improvement in ecological protection in this region. The social benefits of the downstream region continued to decline, from 5.09 to −1.58, and the economic benefits also continued to be negative, from −8.93 to −7.37, reflecting the challenges facing the regional economy. Population dispersion reaches zero in 2022, and the positive contribution of urban population density indicates that the population distribution in the downstream region is more reasonable, at 5.85. The increase in urbanization scale had a positive effect on EWP in the later period, which decreased from −0.40 to −0.65. The improvement of ecological sustainability has a significant positive contribution to EWP, especially in 2022, which increases year by year from −1.79 to 4.85.

5. Discussion

5.1. Temporal and Spatial Changes in EWP and Their Causes

The findings of this study reaffirm the non-linear relationship between ecological welfare performance (EWP) and socio-economic development as identified in prior research, particularly within the Yangtze River Economic Belt (YREB) [48]. This relationship is complex and multifaceted, displaying a “W” shape that reflects the varied impacts of economic development on ecological systems over time [15]. For instance, earlier studies, such as those by [16], also identified similar non-linear patterns in other regions, emphasizing the importance of considering regional economic characteristics in analyzing EWP [49]. However, this study adds to the literature by demonstrating how these dynamics evolve across different Five-Year Plan periods, influenced by policy shifts and changes in urbanization strategies.
The positive correlation between human development index (HDI) and EWP observed here is consistent with global findings that link human development improvements to better ecological outcomes [50]. However, this study also identifies an intriguing contrast; while economic efficiency has been a consistent driver of positive EWP outcomes, its impact appears to diminish over time, likely due to the environmental costs associated with sustained economic growth. This finding aligns with the ecological Kuznets curve hypothesis, yet it diverges in emphasizing the weakening of benefits rather than a simple turning point [51].
Moreover, the analysis highlights the critical role of urbanization scale in influencing EWP, particularly in the context of China’s urban expansion. This aspect has been less explored in the literature, where the focus often remains on the direct environmental impacts of urbanization rather than its nuanced effects on ecological welfare. The enhancement of ecological sustainability during the “Thirteenth Five-Year Plan” period underscores the importance of ecological protection measures—a finding that parallels recent studies emphasizing the benefits of green urban policies [52]. However, this study contributes uniquely by demonstrating the cumulative impact of these policies over multiple planning periods.

5.2. Regional Heterogeneity and Its Policy Implications

This research extends the existing literature on regional heterogeneity in EWP by offering a detailed analysis of the upper, middle, and lower reaches of the YREB. While previous studies, such as those by [53,54], have recognized the uneven development across these regions, this study goes further in linking these disparities to specific socio-economic and environmental policies implemented over different Five-Year Plan periods [55]. For example, the weaker EWP in the upper reaches due to delayed industrialization and insufficient ecological awareness provides a contrast to the middle and lower reaches, where earlier interventions have led to better outcomes [56].
This study’s findings also resonate with the broader literature on the importance of balanced socio-economic and ecological development. The fluctuating effects of economic benefits on different regions call for a more nuanced approach to policymaking, one that considers the long-term impacts of socio-economic policies on EWP [57]. This aligns with recent recommendations in the field for integrated policy frameworks that can simultaneously address economic growth and ecological sustainability.
Moreover, the positive effect of urbanization in Chengdu on EWP, attributed to high-quality population urbanization, provides a case study that contrasts with findings from other megacities where rapid urbanization has often led to ecological degradation [58]. This divergence suggests that the quality of urbanization, rather than its scale, may be a critical determinant of its impact on ecological welfare, an insight that has significant implications for urban planning across developing regions [59,60].

5.3. Research Limitations and Future Prospects

While this study offers a comprehensive analysis of EWP in the YREB, certain limitations remain. The reliance on data from specific time periods may limit the generalizability of the findings, particularly in the context of long-term trends in socio-economic and ecological interactions. Future research could expand the temporal scope to capture more nuanced changes and explore the applicability of the ST-LMDI model in different regional contexts. Additionally, the potential impacts of technological advances and international collaborations on EWP, as suggested by recent studies, were not fully explored here [46,48,55]. Future studies could delve deeper into these aspects, providing a more global perspective on the factors influencing EWP.
In conclusion, this study highlights the complex and dynamic interactions between socio-economic development and ecological welfare in the YREB, offering new insights into the temporal and regional variations in these relationships. The findings contribute to the growing body of literature on sustainable development by emphasizing the importance of tailored policies that balance economic growth with ecological preservation.

6. Conclusions

By introducing the spatio-temporal LMDI model, this study has significantly contributed to and expanded the research on the influencing factors of ecological welfare performance (EWP). Special attention has been paid to six key factors: the economic benefit, social benefit, population dispersion, urban population density, urbanization scale, and ecological sustainability. This comprehensive consideration, particularly the inclusion of ecological sustainability—a factor often overlooked in previous studies—offers a more holistic perspective for understanding EWP at the urban scale. In contrast to macro-level provincial studies, this research homes in on the 108 cities within the Yangtze River Economic Belt, adopting a more micro-level perspective to examine regional development. It reveals the heterogeneity of EWP among different cities, thereby providing a more precise basis for the formulation of regional policies. The main conclusions of this study are as follows:
(1)
From 2006 to 2022, the EWP of the Yangtze River Economic Belt exhibited a “W”-shaped trend in both time and space, underscoring the intricate interplay and dynamic equilibrium between urban ecological conservation and economic growth.
(2)
Significant regional heterogeneity characterizes the urban EWP within the Yangtze River Economic Belt, with higher performance notably in the downstream area. This can be attributed to the region’s earlier industrialization and market-oriented reforms.
(3)
Social and economic benefits are paramount among the factors influencing EWP. Social benefits exert varying influences—positive and negative—at different times, while economic benefits consistently demonstrate a positive, propelling effect.
(4)
In the context of the Yangtze River Economic Belt, it is essential to account for the impact of three key factors on EWP: population dispersion, urban population density, and ecological sustainability.
(5)
To attain the Yangtze River Economic Belt’s long-term objectives of harmonized regional development, ecological stewardship, and green transformation, it is imperative to devise tailored EWP enhancement strategies for each city. These strategies should address both the consumption of urban ecological resources and the improvement of residents’ comprehensive welfare. They should also aim to strengthen ecological resource management, thereby boosting urban ecological sustainability, fostering regional urban–rural integration, and optimizing urban population distribution to elevate the overall welfare of residents.

Author Contributions

J.Y.: conceptualization, funding acquisition, methodology, writing—review and editing. Z.L.: data curation. All authors have read and agreed to the published version of the manuscript.

Funding

This research was funded by key social science research bases of Sichuan Province: Sichuan center for rural development research, grant number CR202415; the School-level Fund Project of The Engineering and Technical College of Chengdu University of Technology, grant number C122023007; the philosophy and social science planning project of Leshan city, grant number SKL2023D84.

Data Availability Statement

The data used in this study are reasonably available through the corresponding author.

Conflicts of Interest

The authors declare no conflicts of interest.

References

  1. Cui, S.; Wang, Y.; Xu, P.; Li, L. Ecological welfare performance, industrial agglomeration and technological innovation: An empirical study based on Beijing–Tianjin–Hebei, Yangtze River Delta and Pearl River Delta. Environ. Dev. Sustain. 2022, 26, 1505–1528. [Google Scholar] [CrossRef]
  2. Peng, J.; Liu, Y.; Wang, Q.; Tu, G.; Huang, X. The Impact of New Urbanization Policy on In Situ Urbanization—Policy Test Based on Difference-in-Differences Model. Land 2021, 10, 178. [Google Scholar] [CrossRef]
  3. Bian, J.; Lan, F.; Hui, Z.; Bai, J.; Wang, Y. Ecological Well-Being Performance Evaluation of Chinese Major Node Cities along the Belt and Road. Land 2022, 11, 1928. [Google Scholar] [CrossRef]
  4. Lan, F.; Hui, Z.; Bian, J.; Wang, Y.; Shen, W. Ecological Well-Being Performance Evaluation and Spatio-Temporal Evolution Characteristics of Urban Agglomerations in the Yellow River Basin. Land 2022, 11, 2044. [Google Scholar] [CrossRef]
  5. Daly, H.E. Sustainable Development: From Concept and Theory to Operational Principles. Popul. Dev. Rev. 1990, 16, 25–43. [Google Scholar] [CrossRef]
  6. Zhang, X. Theory of Sustainable Development: Concept Evolution, Dimension and Prospect. Bull. Chin. Acad. Sci. 2018, 33, 10–19. [Google Scholar] [CrossRef]
  7. Yang, J.; Li, Z.; Zhang, D.; Yu, K.; Zhong, J. An empirical analysis of the coupling and coordinated development of new urbanization and ecological welfare performance in China’s Chengdu–Chongqing economic circle. Sci. Rep. 2024, 14, 13197. [Google Scholar] [CrossRef] [PubMed]
  8. Pezzey, J.C.V. Strong sustainability. In Dictionary of Ecological Economic; Edward Elgar: Cheltenham, UK, 2023; pp. 512–513. [Google Scholar] [CrossRef]
  9. Dillman, K.J.; Heinonen, J.; Davíðsdóttir, B. A development of intergenerational sustainability indicators and thresholds for mobility system provisioning: A socio-ecological framework in the context of strong sustainability. Environ. Sustain. Indic. 2023, 18, 100240. [Google Scholar] [CrossRef]
  10. He, S.; Fang, B.; Xie, X. Temporal and Spatial Evolution and Driving Mechanism of Urban Ecological Welfare Performance from the Perspective of High-Quality Development: A Case Study of Jiangsu Province, China. Land 2022, 10, 1607. [Google Scholar] [CrossRef]
  11. Wang, R.; Feng, Y. Research on China’s Ecological Welfare Performance Evaluation and Improvement Path from the Perspective of High-Quality Development. Math. Probl. Eng. 2020, 1, 5476089. [Google Scholar] [CrossRef]
  12. Long, X.; Yu, H.; Sun, M.; Wang, X.-C.; Klemeš, J.J.; Xie, W.; Wang, C.; Li, W.; Wang, Y. Sustainability evaluation based on the Three-dimensional Ecological Footprint and Human Development Index: A case study on the four island regions in China. J. Environ. Manag. 2020, 265, 110509. [Google Scholar] [CrossRef]
  13. Li, Z.; Yang, J.; Zhong, J.; Zhang, D. Assessment of Urban Agglomeration Ecological Sustainability and Identification of Influencing Factors: Based on the 3DEF Model and the Random Forest. Int. J. Environ. Res. Public Health 2022, 20, 422. [Google Scholar] [CrossRef] [PubMed]
  14. Zhang, Q.; Kong, Q.; Zhang, M.; Huang, H. New-type urbanization and ecological well-being performance: A coupling coordination analysis in the middle reaches of the Yangtze River urban agglomerations, China. Ecol. Indic. 2024, 159, 111678. [Google Scholar] [CrossRef]
  15. Zhou, L.; Zhang, Z. Ecological well-being performance and influencing factors in China: From the perspective of income inequality. Kybernetes 2023, 52, 1269–1293. [Google Scholar] [CrossRef]
  16. Liu, N.; Wang, Y. Urban Agglomeration Ecological Welfare Performance and Spatial Convergence Research in the Yellow River Basin. Land 2022, 11, 2073. [Google Scholar] [CrossRef]
  17. Deng, Y.; Ma, Y.; Yang, X. Provincial ecological well-being performance level measurement and its spatial-temporal evolution analysis in China. Front. Environ. Sci. 2022, 10, 1007231. [Google Scholar] [CrossRef]
  18. Xu, G.; Zhao, T.; Wang, R. Decomposition and Decoupling Analysis of Factors Affecting Carbon Emissions in China’s Regional Logistics Industry. Sustainability 2022, 14, 6061. [Google Scholar] [CrossRef]
  19. Wang, S.; Duan, L.; Jiang, S. Research on Spatial Differences and Driving Effects of Ecological Well-Being Performance in China. Int. J. Environ. Res. Public Health 2022, 19, 9310. [Google Scholar] [CrossRef]
  20. Fang, D.; Hao, P.; Hao, J. Study of the influence mechanism of China’s electricity consumption based on multi-period ST-LMDI model. Energy 2019, 170, 730–743. [Google Scholar] [CrossRef]
  21. Yu, K.Y.; Li, Z.G. Assessing Carbon Emission and Energy Efficiency in Yangtze River Economic Belt Cities, China. Econ. Chang. Restruct. 2024, 57, 4. [Google Scholar] [CrossRef]
  22. He, P.; Lv, J.; He, L.; Ma, K.; Hu, Q.; Liu, X. Spatial and temporal evolution of air pollution and verification of the environmental Kuznets curve in the Yangtze River Basin during 1980–2019. Eur. J. Remote Sens. 2023, 56, 2265157. [Google Scholar] [CrossRef]
  23. Liu, P.; Zhong, F.; Yang, C.; Jiang, D.; Luo, X.; Song, X.; Guo, J. Influence mechanism of urban polycentric spatial structure on PM2.5 emissions in the Yangtze River Economic Belt, China. J. Clean. Prod. 2022, 365, 132721. [Google Scholar] [CrossRef]
  24. Li, Z.; Guo, J.; You, X. A study on spatio-temporal coordination and driving forces of urban land and water resources utilization efficiency in the Yangtze River Economic Belt. J. Water Clim. Chang. 2023, 14, 272–288. [Google Scholar] [CrossRef]
  25. Zhang, B.; Li, Y.; Xia, C.; Zeng, C. Study on the coupling coordination of socio-economic and ecological environment under the background of land use transition: A case study of the cities along the Yangtze River. J. Ecol. Rural. Environ. 2023, 39, 436–449. [Google Scholar] [CrossRef]
  26. Daly, H.E.; Farley, J. Ecological Economics: Principles and Applications; Island Press: Washington, DC, USA, 2004; pp. 29–36. [Google Scholar] [CrossRef]
  27. Erdogan, S. Linking Natural Resources and Environmental Sustainability: A Panel Data Approach Based on the Load Capacity Curve Hypothesis. Sustain. Dev. 2024, 32, 3182–3194. [Google Scholar] [CrossRef]
  28. Dasic, B.; Devic, Z.; Denic, N.; Zlatkovic, D.; Ilic, I.D.; Cao, Y.; Jermsittiparsert, K.; Van Le, H. Human development index in a context of human development: Review on the western Balkans countries. Brain Behav. 2020, 10, 01755. [Google Scholar] [CrossRef]
  29. Jin, H.; Qian, X.; Chin, T.; Zhang, H. A global assessment of sustainable development based on modification of the Human Development Index via the entropy method. Sustainability 2020, 12, 3251. [Google Scholar] [CrossRef]
  30. Wang, L. Assessment of Land Use Change and Carbon Emission: A Log Mean Divisa (LMDI) Approach. Helion 2024, 10, 25669. [Google Scholar] [CrossRef]
  31. Wang, S.; Han, Y.; Ren, H.; Li, J. Evaluation of provincial ecological well-being performance and its driving effect decomposition in China. Resour. Sci. 2020, 42, 840–855. [Google Scholar] [CrossRef]
  32. Dong, Y.; Sun, Y.; Ding, J. Decomposition of ecological welfare performance drivers in China. Acta Geogr. Sin. 2024, 79, 1337–1354. [Google Scholar] [CrossRef]
  33. Ding, R.; Zhu, Y.; Shen, S.; Du, L.; Fu, J.; Zou, J.; Peng, L. Does Urban Shrinkage Inhibit Residents’ Welfare? From the Perspective of Urban–Rural Development in China. Soc. Indic. Res. 2024, 171, 847–876. [Google Scholar] [CrossRef]
  34. Outline of the 11th Five-Year Plan for National Economic and Social Development of the People’s Republic of China. Available online: https://www.gov.cn/gongbao/content/2006/content_268766.htm (accessed on 20 June 2024).
  35. 12th Five-Year Plan Outline for National Economic and Social Development. Available online: https://www.gov.cn/zhuanti/2011-03/16/content_2623428_2.htm (accessed on 20 June 2024).
  36. Outline of the 13th Five-Year Plan for National Economic and Social Development of the People’s Republic of China. Available online: https://www.gov.cn/xinwen/2016-03/17/content_5054992.htm (accessed on 20 June 2024).
  37. 14th Five-Year Plan for National Economic and Social Development of the People’s Republic of China. Available online: https://www.ah.gov.cn/public/1681/554051211.html (accessed on 20 June 2024).
  38. Official Release of the Yangtze River Economic Belt Development Plan Outlines a New Pattern of “One Axis, Two Wings, Three Poles, and Multiple Points” Sichuan Daily. Available online: https://www.sc.gov.cn/10462/10464/10797/2016/9/12/10395446.shtml (accessed on 20 June 2024).
  39. Li, Y.; Wu, S.; Yan, B. Spatial characteristics and influential mechanism of the coupling coordination degree of urban accessibility and human development index in China. Environ. Sci. Pollut. Res. 2022, 29, 29793–29807. [Google Scholar] [CrossRef] [PubMed]
  40. Chen, Y.; Wang, L.; Yu, P.; Cheng, C. Linkages between digital economy and ecosystem services: Revealing the spatiotemporal relationship based on U-shaped effect. Technol. Forecast. Soc. Change 2024, 207, 123601. [Google Scholar] [CrossRef]
  41. Wang, J.; Su, D.; Wu, Q.; Li, G.; Cao, Y. Study on eco-efficiency of cultivated land utilization based on the improvement of ecosystem services and emergy analysis. Sci. Total Environ. 2023, 882, 163489. [Google Scholar] [CrossRef] [PubMed]
  42. Cheng, K.M.; Liu, S.C. Does Urbanization Promote the Urban-Rural Equalization of Basic Public Services? Evidence from Prefectural Cities in China. Appl. Econ. 2023, 56, 3445–3459. [Google Scholar] [CrossRef]
  43. Wu, F.; Chen, W.; Lin, L.; Ren, X.; Qu, Y. The Balanced Allocation of Medical and Health Resources in Urban Areas of China from the Perspective of Sustainable Development: A Case Study of Nanjing. Sustainability 2022, 14, 6707. [Google Scholar] [CrossRef]
  44. Li, Y.; Liu, X. How did urban polycentricity and dispersion affect economic productivity? A case study of 306 Chinese cities. Landsc. Urban Plan. 2018, 173, 51–59. [Google Scholar] [CrossRef]
  45. Yu, P.; Yung, E.H.; Chan, E.H.; Wang, S.; Chen, Y.; Chen, Y. Capturing open space fragmentation in high–density cities: Towards sustainable open space planning. Appl. Geogr. 2023, 154, 102927. [Google Scholar] [CrossRef]
  46. Bao, L.; Ding, X.; Zhang, J.; Ma, D. Can New Urbanization Construction Improve Ecological Welfare Performance in the Yangtze River Economic Belt? Sustainability 2023, 15, 8758. [Google Scholar] [CrossRef]
  47. Li, Z.; Liu, Q.; Zhang, Y.; Yan, K.; Yan, Y.; Xu, P. Characteristics of Urban Parks in Chengdu and Their Relation to Public Behaviour and Preferences. Sustainability 2022, 14, 6761. [Google Scholar] [CrossRef]
  48. Lu, H.; Tong, J.; Tang, Y. Analysis of Green Credit and the Ecological Welfare Performance Based on Empirical Models and ARIMA(2,3,2): Taking China as an Example. Sustainability 2022, 14, 11919. [Google Scholar] [CrossRef]
  49. Ahmed, Z.; Zhang, B.; Cary, M. Linking economic globalization, economic growth, financial development, and ecological footprint: Evidence from symmetric and asymmetric ARDL. Ecol. Indic. 2021, 121, 107060. [Google Scholar] [CrossRef]
  50. Das, D.; Skelton, T. Hydrating Hyderabad: Rapid urbanisation, water scarcity and the difficulties and possibilities of human flourishing. Urban Stud. 2020, 57, 1553–1569. [Google Scholar] [CrossRef]
  51. Rong, B.; Chu, C.; Zhang, Z.; Li, Y.; Yang, S.; Wang, Q. Assessing the Coordinate Development Between Economy and Ecological Environment in China’s 30 Provinces from 2013 to 2019. Environ. Model. Assess. 2023, 28, 303–316. [Google Scholar] [CrossRef]
  52. Dudzic-Gyurkovich, K. Urban Development and Population Pressure: The Case of Młynówka Królewska Park in Krakow, Poland. Sustainability 2021, 13, 1116. [Google Scholar] [CrossRef]
  53. Ma, D.; Zhang, J.; Wang, Z.; Sun, D. Spatio-Temporal Evolution and Influencing Factors of Open Economy Development in the Yangtze River Delta Area. Land 2022, 11, 1813. [Google Scholar] [CrossRef]
  54. Zhang, Z.; Zhang, L.; Liang, T.; Cheng, L.; Fang, L.; Zhao, B.; Zhang, J.; Wen, C. Has the Yangtze river economic belt strategy promoted the construction of ecological civilization in the upper reaches of the Yangtze river? Front. Environ. Sci. 2022, 10, 1046323. [Google Scholar] [CrossRef]
  55. Su, Y.; Li, W.; Chen, M.; Wu, C.; Tan, X. Innovation policy and ecological welfare performance: Evidence from a quasi-natural experiment of China. Environ. Sci. Pollut. Res. 2023, 30, 100994–101013. [Google Scholar] [CrossRef]
  56. Chen, Y.; Zhang, X. Investigating the interactions between Chinese economic growth, energy consumption and its air environmental cost during 1989–2016 and forecasting their future trends. Ecol. Model. 2021, 461, 109765. [Google Scholar] [CrossRef]
  57. Jiang, Y.; Shi, B.; Su, G.; Lu, Y.; Li, Q.; Meng, J.; Ding, Y.; Song, S.; Dai, L. Spatiotemporal Analysis of Ecological Vulnerability in the Tibet Autonomous Region Based on a Pressure-State-Response-Management Framework. Ecol. Indic. 2021, 130, 108054. [Google Scholar] [CrossRef]
  58. Xie, X.; Zhu, Q. Research on the Impact of Urban Expansion on Habitat Quality in Chengdu. Sustainability 2023, 15, 6271. [Google Scholar] [CrossRef]
  59. Zhang, D.; Li, Z.; Zhong, J.; Yang, J. A framework for prioritizing urban ecological infrastructure (UEI) implementation tasks based on residents’ ecological demands and government policies. J. Environ. Manag. 2024, 354, 120369. [Google Scholar] [CrossRef]
  60. Li, Z.; Zhong, J.; Yang, J.; Zhang, D.; He, S. Assessment framework and empirical analysis of the ecological protection importance for key town agglomerations in China. J. Clean. Prod. 2022, 372, 133682. [Google Scholar] [CrossRef]
Figure 1. Location of the study area in China.
Land 13 01318 g001
Figure 2. Temporal changes in EWP, HDI, and EFI in YREB 2006 to 2022.
Land 13 01318 g002
Figure 3. Spatial distribution of EWP, HDI, and EFI in YREB from 2006 to 2022.
Land 13 01318 g003
Figure 4. Contribution of six driving factors to the change in EWP of cities in YREB from 2006 to 2022.
Land 13 01318 g004
Figure 5. The contribution of six driving factors to the change in EWP in three regions of YREB from 2006 to 2022. Nots: the T1 is from 2006 to 2010, T2 is from 2011 to 2015, T3 is from 2016 to 2022.
Land 13 01318 g005
Figure 6. Spatial decomposition results of urban ecological welfare performance in the YREB from 2006 to 2022.
Land 13 01318 g006
Figure 7. Spatial decomposition results of EWP in three economic regions of the YREB from 2006 to 2022.
Land 13 01318 g007
Table 1. HDI measurement index system.
TargetDimensionIndicatorEntropy Weight
Human Development IndexeconomyPer capita GDP0.301
educationAdult literacy rate0.146
Comprehensive enrollment rate0.193
healthNumber of medical institution beds per ten thousand inhabitants0.199
Doctors per ten thousand inhabitants0.161
Disclaimer/Publisher’s Note: The statements, opinions and data contained in all publications are solely those of the individual author(s) and contributor(s) and not of MDPI and/or the editor(s). MDPI and/or the editor(s) disclaim responsibility for any injury to people or property resulting from any ideas, methods, instructions or products referred to in the content.

