Abstract
The geographical environment and economic conditions that influence the spatial distribution of minority villages vary significantly, particularly in mountainous regions where they face different levels of disaster risks. Environmental suitability assessment can help us gain a deeper understanding of the differences and degrees of differences among different villages and provide a basis for resource allocation and planning. This study focuses on 499 national level and 68 provincial level minority villages in Fujian province and evaluates the environmental suitability of their spatial distribution using analysis tools such as ArcMap and GeoDetector. The research findings indicated: (1) The ratio between the influence strengths of natural geographical, socioeconomic, and disaster constraint indicators on the environmental suitability of minority villages in mountainous areas is 5:10:7, with the highest influence being the regional gross domestic product (RGDP) in the socioeconomic indicator (0.509) and the lowest influence being flood sensitivity (0.011). (2) Areas with high suitability values are in the southeast coastal and central regions. From east to west, the suitability values gradually decrease. The suitable areas cover 87.2% of the total region, including 91.9% of the minority villages. (3) The geographical correlation coefficient between the spatial distribution of minority villages and environmental suitability is 86.87, indicating a high degree of spatial interaction and fit between the two. This validates the rationality of the multi-factor evaluation model for assessing the environmental suitability of ethnic village spatial distribution in mountainous areas. (4) There is an inverse “U” relationship between environmental suitability and the distribution of national and provincial level minority villages. With the increase in the suitability index, the number of national level minority villages tends to increase, while the number of provincial level minority villages tends to decrease. The research findings have significant implications for promoting the sustainable development of minority villages in Fujian province and provide reference for the regional development and protection of minority villages in other mountainous areas.
1. Introduction
Minority villages refer to natural villages where ethnic minority populations are relatively concentrated, with a high proportion of minority residents, relatively complete production and living facilities, and obvious ethnic cultural and settlement characteristics [1,2]. Mountainous areas are the homeland to a large proportion of ethnic minority populations in China. According to the latest population census data, approximately 106 million minority residents live in mountainous areas, accounting for more than 8% of the total population of China [3]. The spatial distribution of these minority settlements is closely related to the local natural environment and resources. Evaluating the environmental suitability of these settlements is crucial for understanding the sustainability of minority villages and guiding future development planning. Mountainous areas have complex terrain, diverse ecosystems, and fragile ecological conditions. Compared to other regions, these areas often face more severe natural disasters such as landslides, mudslides, and floods [4,5]. The steep slopes, heavy rainfall, and unstable geological features in mountainous areas may trigger various types of natural hazards, posing significant threats to the livelihoods and well-being of minority villages residing in these areas [6,7]. For example, a study on the Mountains in Guizhou province found that most of the Miao and Dong villages are in high-risk areas for geological disasters, making them highly vulnerable to the impacts of disasters [8]. Therefore, evaluating the environmental suitability of minority villages in these challenging mountainous environments is particularly important. By understanding the constraints and opportunities brought by the natural environment, policymakers and planners can make wiser decisions to support the sustainable development of minority communities [9,10]. This is especially important considering the ongoing urbanization and infrastructure development in many mountainous areas in China, which may have profound impacts on the traditional livelihoods and cultural customs of minorities [11,12].
In recent years, research on minority villages has been widely conducted across various disciplines. These studies cover a range of scales, from national [13] to provincial [14], municipal [15], and even individual village levels [16,17]. This research primarily delves into spatial distribution characteristics and influencing factors [8,14,18], spatiotemporal evolution [19,20,21], evaluation index systems [22], economic development [23,24,25,26], and cultural dissemination [27]. The majority of these studies adopt qualitative approaches, with only a few employing quantitative methods related to evaluation systems. For instance, Jiang Ai conducted an evaluation of the resettlement of minority villages [28], Chen Liqun assessed the public space of minority villages [29], and Zheng Gantian explored the construction of minority villages [30]. There are also some studies on the cultural heritage conservation [31] and economic development [32] of minority villages, but these research efforts tend to be goal-oriented, focusing on individual villages or ethnic groups. When expanding the research scale to the provincial level, the studies mainly concentrated on Guizhou, Yunnan, and Hunan, with a lack of relevant research on Fujian province. With the development of geographic information systems technology, significant achievements have been made in various fields such as land use [33,34], terrain features [35], landscape evaluation [36], rural construction [37], and ecotourism [38,39] based on ArcGIS 10.8 technology. Presently, some scholars have leveraged this technology to study the spatiotemporal distribution characteristics of villages. Overall, existing research mainly focuses on using various factors to elucidate the distribution pattern of minority villages, with relatively limited exploration of their suitability in the contemporary context, especially in terms of considering the impacts of terrain on disaster issues.
Fujian province is in a typical mountainous and hilly area, with a diverse population of ethnic minorities. The mountainous terrain provides favorable conditions for the formation of material and cultural heritage in minority villages, but it also makes these areas more prone to disasters such as mudslides, especially during typhoons and heavy rainfall. Currently, the protection of ethnic village heritage in Fujian province is facing a series of issues due to the serious threats posed by these disasters. As a coastal and economically developed Fujian has attempted to protect minority villages through the implementation of plans for the protection and development plans [40], financial aid for poverty alleviation [41], and the selection of ethnic minority characteristic villages [42]. Presently, the Department of Ethnic and Religious Affairs of Fujian province has designated a total of 567 minority villages based on indicators such as the ethnic minority population proportion, total household count, and proportion of characteristic ethnic dwellings. Among these, 68 villages exhibiting high indicator values have been accorded the status of “Chinese Ethnic Minority Characteristic Villages” (also referred to as “National-level minority villages”) by the State Ethnic Affairs Commission, while the remaining 499 are recognized as “Provincial Ethnic Minority Characteristic Villages” in Fujian. However, challenges still exist in terms of the village selection process, funding assistance, and other protection measures. Firstly, the environmental factors and opportunities that restrict the settlement of minority villages in the current context need to be further evaluated. Secondly, there may be differences in the protection and development of minority villages in different regions, thus necessitating targeted policies.
This research focuses on 567 minority villages at the national and provincial levels in Fujian province as research subjects. To consider the unique challenges posed by natural disasters in the mountainous areas of Fujian, we have constructed an environmental suitability assessment model from the perspectives of natural geography, socioeconomics, and disaster limitations. This model assesses the suitability of the spatial distribution of minority villages in Fujian. The findings of the research will facilitate the adjustment and optimization of development strategies for ethnic villages across various regions of Fujian. Moreover, it will aid governments at all levels in rational resource allocation, enhance the precision of ethnic village development, and serve as a significant direction for the study of minority villages in Fujian. Additionally, the research methods employed herein can be extrapolated to other regions, bearing substantial practical significance in guiding the development of minority villages.
2. Research Scope and Data Sources
2.1. Research Area Overview
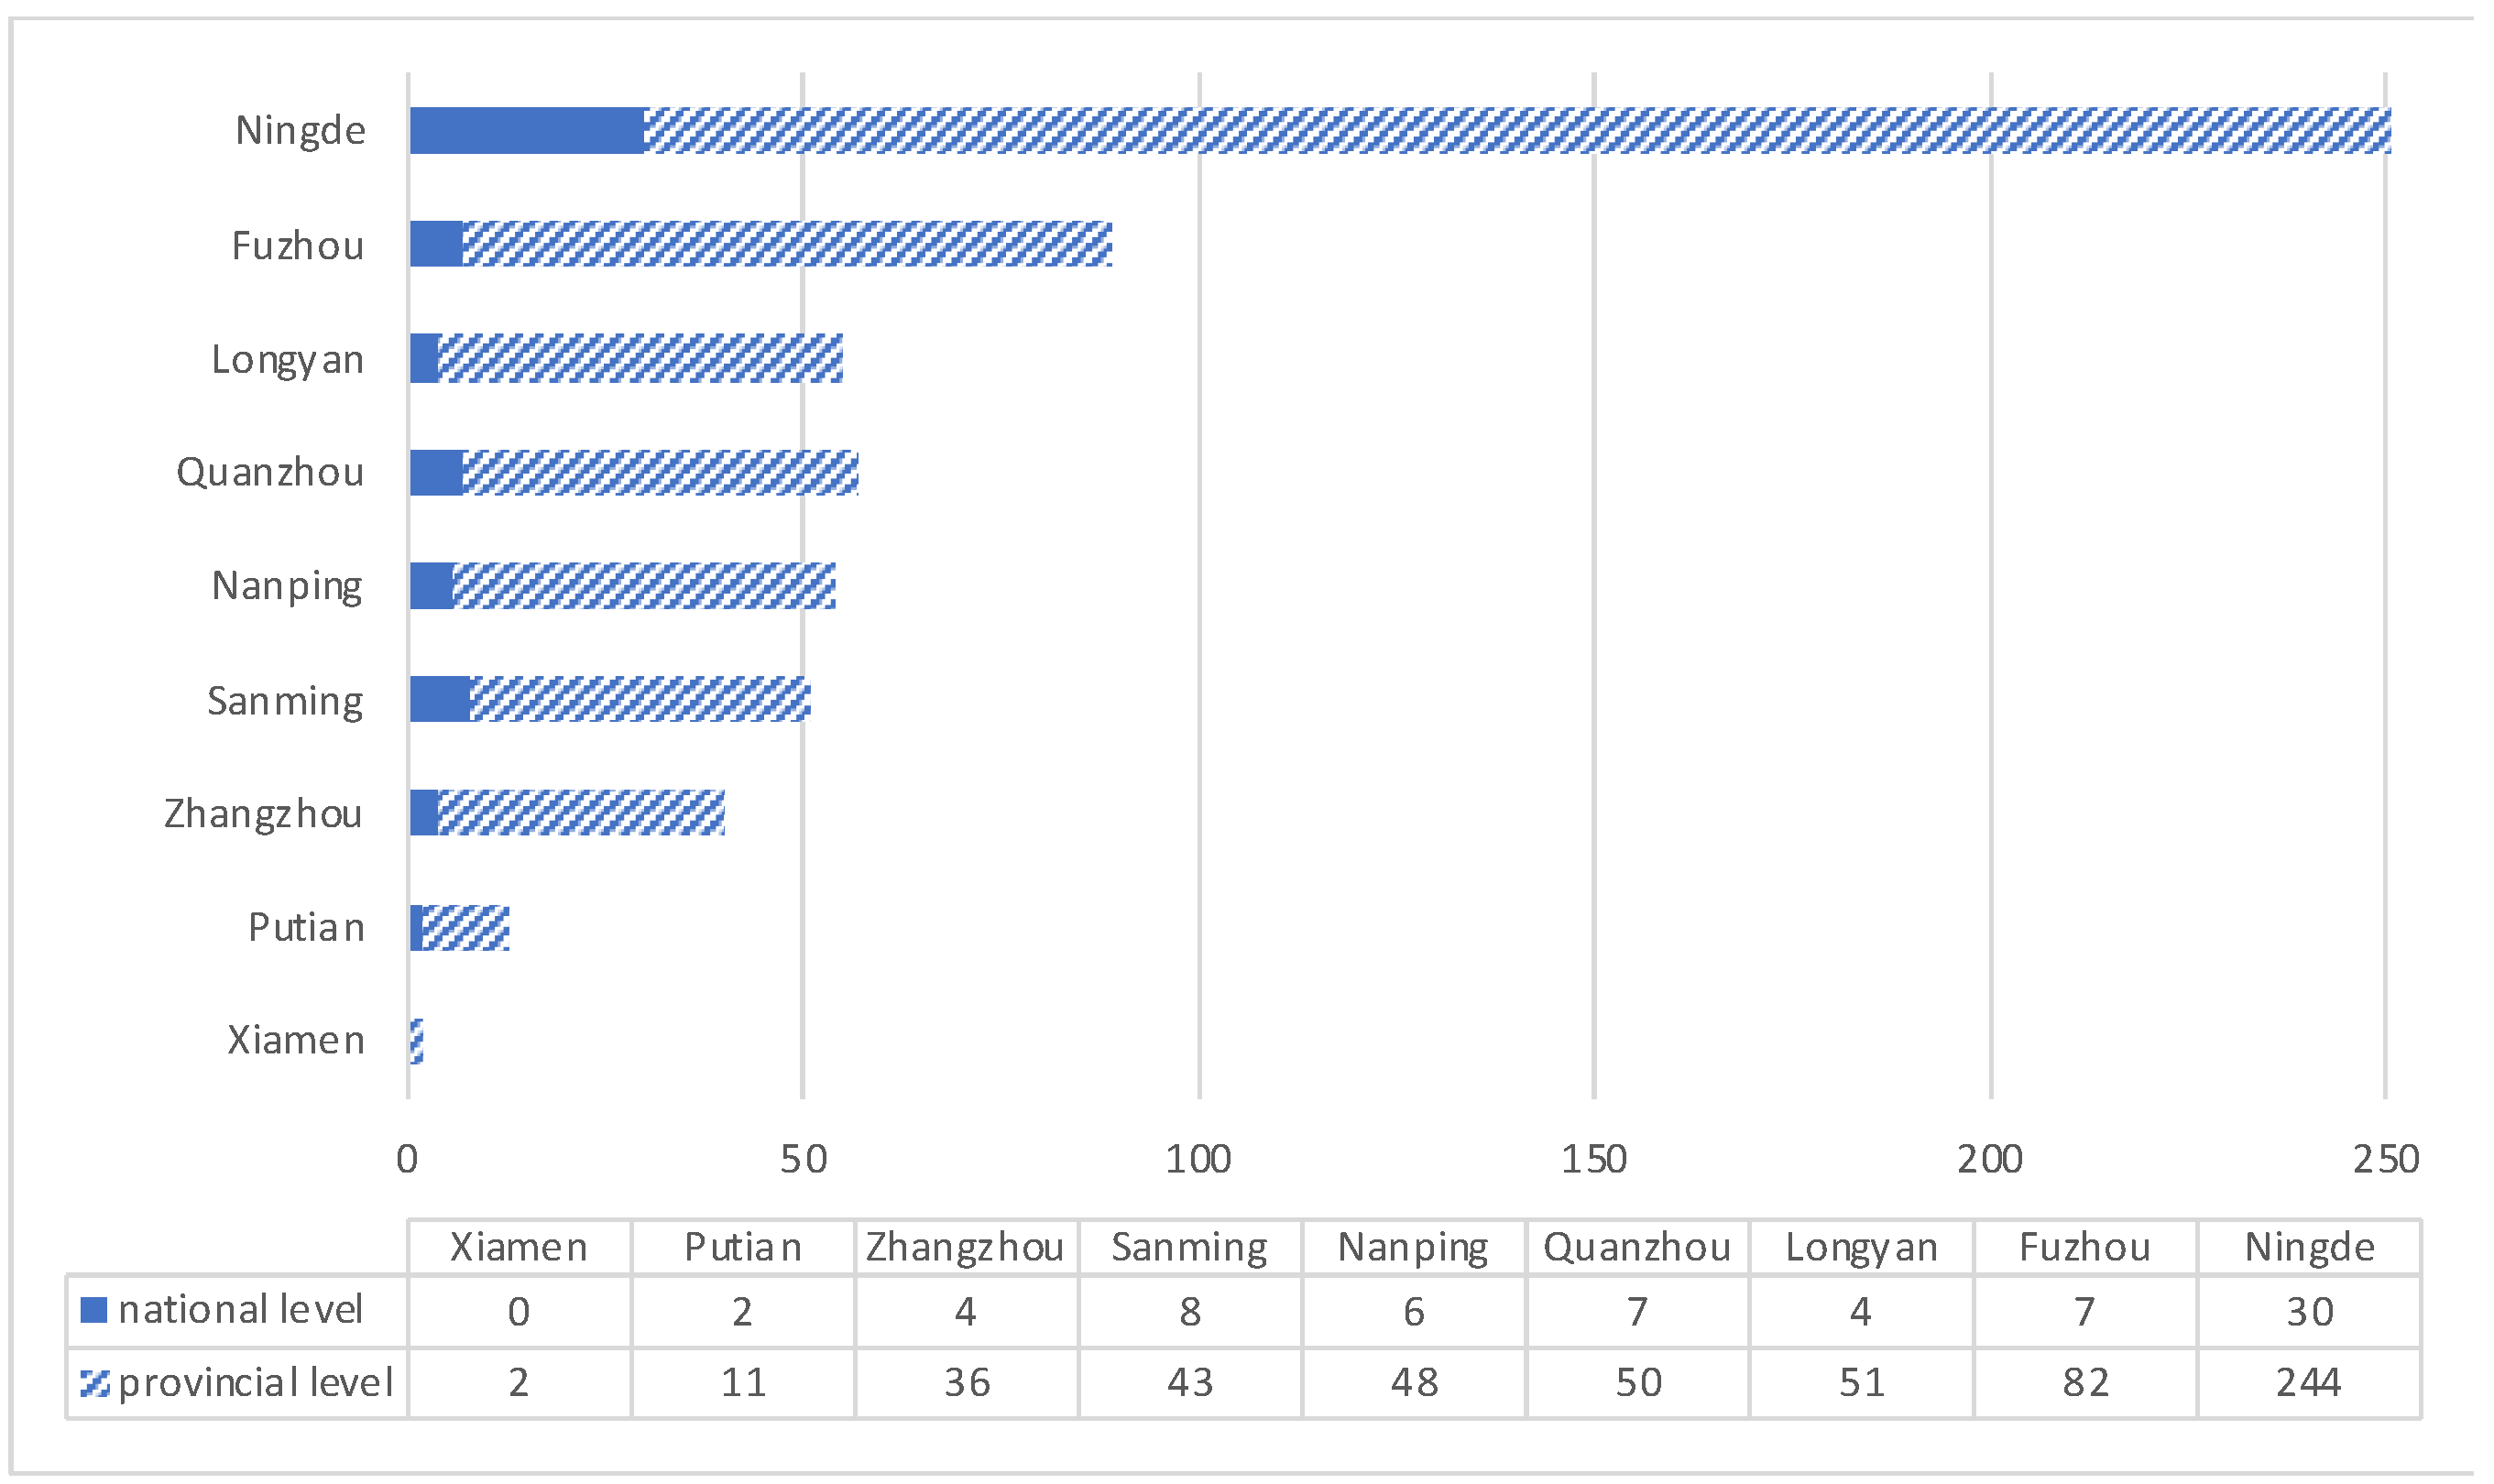
Fujian province is situated on the southeast coast of China, spanning a land area between 23°30′ to 28°22′ North latitude and 115°50′ to 120°40′ East longitude (Figure 1). As of April 2022, the province comprises a total of 19 ethnic townships, which encompass 18 shē ethnic townships and 1 huí ethnic township. Additionally, Fujian hosts 1 provincial level ethnic economic development zone, namely the Fu’an shē ethnic economic development zone, along with 567 ethnic villages. The ethnic minority population accounts for 2.16% of the province’s total population. Notably, the number and distribution of minority villages exhibit significant variations across different cities (Figure 2). Indigenous ethnic groups in Fujian include the Shē, Huí, Manchu, Mongolian, and others. Among these, the Shē ethnic group boasts the largest population nationwide, totaling 365,500 individuals, which accounts for 51.58% of the national shē ethnic population and 45.87% of the province’s ethnic minority population.
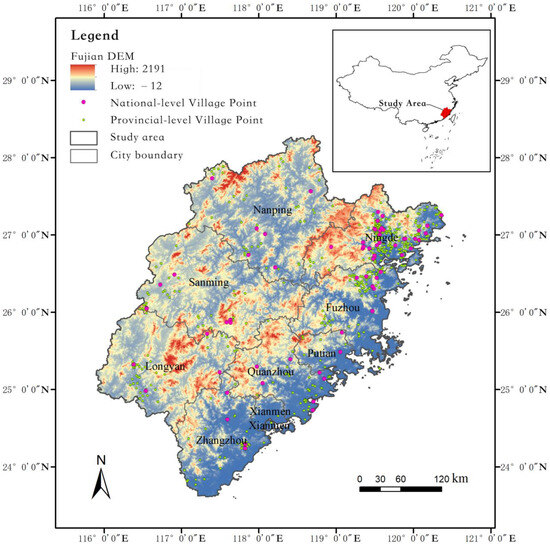
Figure 1.
Location and distribution map of minority villages in Fujian province.

Figure 2.
Statistical diagram of the number of minority villages in cities of Fujian province.
The terrain of Fujian province is predominantly mountainous and hilly, encompassing over 80% of the total area. The terrain generally slopes from northwest to southeast, giving rise to the Western Fujian Mountain Range and the Central Fujian Mountain Range in the western and central regions, respectively. These mountain ranges are separated by non-communicating valleys and basins. Conversely, the eastern coastal areas feature hills, plateaus, and coastal plains. However, the region is susceptible to geological hazards such as mudslides, landslides, and flash floods [43].
2.2. Data Sources and Processing
2.2.1. Data Sources
At the provincial scale, minority villages are represented as point features. Thus, in this study, the specific regular shapes were replaced by spatial point coordinates of minority villages. Detailed listings and relevant information for the 499 national level and 68 provincial level minority villages were acquired through field surveys, consultations with the Fujian Provincial Department of Ethnic and Religious Affairs, and research conducted on the websites of provincial and municipal governments, as well as historical documents. Utilizing this information, Geosharp software V1.0 was employed to obtain the spatial locations of minority villages on Baidu Maps as Points of Interest (POI) for positioning and coordinate selection (with the village committee location serving as the reference point, as of June 2023).
Data pertaining to county administrative centers, roads, rivers, and point data for natural disasters such as mudslides and landslides, along with statistical data for hydrological stations, were sourced from the geographic remote sensing ecological network. The vector map of administrative boundaries for Fujian province, cities, and counties was extracted from the China Basic Geographic Information Database. The 30 m resolution Digital Elevation Model (DEM) was obtained from the Chinese Academy of Sciences Resource and Environment Science Data Center, and data on elevation, slope, and terrain ruggedness were extracted using ArcMap 10.8 software. Economic indicators, population statistics, urbanization rates, urban water coverage rates, and urban gas coverage rates were sourced from the 2021 Statistical Yearbook published by the Fujian Provincial Bureau of Statistics (Table 1).

Table 1.
Data source details.
2.2.2. Data Processing
To analyze the factors of relief fragmentation, elevation, and slope, raster layers were generated using 30 m Digital Elevation Model (DEM) analysis. For rivers, roads, and county centers, the Euclidean distance from each village to the nearest feature was calculated using straight-line distance, and raster layers were subsequently generated. Economic, population, and infrastructure completeness, represented by the average values of urbanization rate, water coverage rate, and gas coverage rate from the 2023 Statistical Yearbook published by the Fujian Provincial Bureau of Statistics, were utilized to create economic, population, and infrastructure completeness raster layers through density mapping. Additionally, historical maximum flood levels, 20-year flood levels, and 10-year flood levels for hydrological stations in Fujian province were employed to calculate flood sensitivity at different safety levels using the “seed spread algorithm” [44]. Lastly, landslide sensitivity raster layers were obtained through density mapping based on the occurrence data of the landslides and mudslides in Fujian province.
3. Research Methodology and Experiments
3.1. Study Method for Spatial Distribution Characteristics of Minority Villages
3.1.1. Kernel Density Analysis
Kernel density analysis is a non-parametric method for estimating surface density, which uses dynamic cells to estimate the density of spatial points. In this study, kernel density analysis was used to analyze the spatial distribution characteristics of minority villages in Fujian province. The kernel density estimation expression is:
where () is the kernel density function of minority villages, is the location of minority villages, is the village located within the circle with as the center, h is the threshold distance for the search radius ( > 0), and is the number of minority villages within the threshold. The kernel density value is proportional to the density of the distribution of minority villages. The larger the kernel density value, the higher the concentration of ethnic minority village distribution and the stronger the spatial clustering; the smaller the kernel density value, the sparser the distribution of minority villages and the weaker the spatial clustering. The search radius for kernel density analysis is set to 5 km based on the distribution density of villages, and natural breaks are used to classify the results.
3.1.2. Voronoi Diagram
The Voronoi diagram is a set of continuous polygons formed by connecting line segments between neighboring points, where any point inside a polygon is closer to the controlling point that forms that polygon than to other controlling points, and the area of the polygon changes with the distribution of point features [45]. Therefore, applying the coefficient of variation (CV) of the Voronoi diagram from computational geometry can be used to assess the distribution type of minority villages. The coefficient of variation (CV) value calculated based on the Voronoi area is the standard deviation of the Voronoi area divided by its mean, and its calculation formula is:
where R represents the standard deviation of the Voronoi diagram area, and S represents the average value of the Voronoi diagram area. When the spatial distribution type is “uniform distribution”, the CV value is smaller; when the spatial distribution type is “clustered distribution”, the CV value is larger. Thomas Duyckaerts proposed recommended values for CV to assess the distribution type of point features. When CV = 29% (including <33%), the point features are uniformly distributed; when CV = 57% (including 33–64%), the point features are randomly distributed; when CV = 92% (including >64%), the point features are clustered.
3.2. Study Methods for Environmental Suitability
This paper uses a multi-factor weighted evaluation model to assess the environmental suitability of the spatial distribution of minority villages. The multi-factor weighted evaluation model utilizes fuzzy set theory for decision-making. Its advantage lies in assigning corresponding weights to different factors in a fuzzy environment with multiple determining factors, ultimately providing a relatively scientific, comprehensive evaluation result for the evaluation object [13,14]. The calculation formula for the multi-factor weighted evaluation model is:
where Suit represents the comprehensive evaluation value of the environmental suitability of minority villages for a certain evaluation unit, is the weight value of factor i, is the score of the i-th single factor corresponding to the evaluation unit, and n is the total number of factors.
3.3. Study Method of the Relationship Between Spatial Distribution Characteristics of Ethnic Minorities and Environmental Suitability
3.3.1. Geodetector
Geodetector is one of the powerful tools currently used by scholars for driving force and factor analysis, which can detect both numerical and qualitative data [45]. By statistically analyzing the superimposed results of factors and village distribution, the influence of each factor on the village distribution characteristics can be quantified. The influence of each factor is measured using q values, and the algorithm is as follows:
where h = 1, 2, ···, L represents the stratification of the variable Y or the detection factor X, i.e., classification or zoning. and are the variances of the total Y values and layer h, respectively; N and are the number of units in the total area and layer h, respectively; SST is the total variance of the entire area; SSW is the sum of within-layer variances, and the range of q values is [0–1]. The larger the q value, the stronger the impact of the detection factor on the spatial distribution of minority villages; conversely, the weaker the impact.
3.3.2. Geographic Association Rate
The geographic association rate can reflect the matching situation between two geographic activities or elements within a region [46]. By reflecting the differences in similarity, it can be used to indicate the overall spatial association level of the distribution characteristics of minority villages and environmental suitability. Its calculation formula is:
where GL represents the geographic association rate of the distribution characteristics of minority villages and environmental suitability; n is the number of prefecture-level administrative units; and , respectively represent the percentage values of various elements within region i. The larger the GL value, the closer the geographic association and the more consistent the geographic distribution.
3.3.3. Bivariate Spatial Autocorrelation
Bivariate spatial autocorrelation (Moran’s I) has high effectiveness and applicability in describing the relationship between two geographic phenomena, including global spatial autocorrelation and local spatial autocorrelation [46]. It can be used to describe the consistency and correlation of the spatial distribution characteristics of minority villages and environmental suitability in space. The calculation formula is:
where I represent the spatial correlation strength between two types of geographic phenomena; and represent phenomena i and j, respectively; n is the number of units; is the sample variance; is the spatial weight matrix. When I = 1, it indicates an absolute spatial correlation between the two; when I = −1, it indicates an absolute dispersion phenomenon; and when I = 0, it indicates a random distribution.
3.4. Establishment of a Multi-Factor Weighted Evaluation Model
First, the ArcMap software is utilized to conduct overlay analysis on the spatial distribution points of minority villages and the natural geographical environment, social and economic environment, and natural disaster aspects of 12 factors. This process aims to ascertain the classification outcomes of these factors and establish an environmental suitability evaluation index system for minority villages in Fujian based on the identified influencing elements. Subsequently, expert scoring is employed to assign values to the classification of each influencing factor. The Analytic Hierarchy Process (AHP) is then applied to determine the weight values of each factor, leading to the development of a comprehensive table of environmental suitability evaluation indicators for villages. The data of each factor is rasterized using ArcMap, and the raster distribution maps of each factor are overlaid to derive the environmental suitability evaluation outcomes for villages. Through threshold division, an evaluation and classification of the results are conducted to ascertain the environmental suitability classification outcomes for minority villages in Fujian.
3.4.1. Construction of Evaluation Index System
Minority villages, akin to traditional settlements, constitute rural residential areas influenced by a myriad of factors encompassing natural geography and socioeconomic conditions. The evaluation criteria for rural residential areas encompass indicators associated with topographical characteristics and environmental location. For instance, Liu Liwen incorporated elevation, slope, and river factors into the topographical features, along with the distance from the county center in the environmental location, to establish evaluation indicators for rural residential areas [47]. Liao Yanmei expanded the evaluation indicators for rural residential areas in karst mountainous regions by including relief fragmentation in the topographical features [48]. Qi Zengxiang introduced flood sensitivity as an indicator affecting settlement ecology in their study [49]. Some scholars, based on goal orientation, incorporate indicators such as geotechnical [50], climate [51], economy [52], and policy regulations [53] into the evaluation system.
In this study, drawing upon research findings, graphical and textual resources, and the aforementioned analyses, taking into account the relevance and accessibility of ethnic minority village distributions, as well as the impact of disasters on mountainous villages in Fujian, natural geography, socioeconomic conditions, and disaster constraints were identified as the primary influencing factors determining the environmental suitability of ethnic minority village distributions in Fujian province. Within these categories, natural geography comprises four factors: relief fragmentation, slope, elevation, and proximity to rivers; socioeconomic factors encompass five elements: regional GDP, county population, infrastructure completeness level, distance from the county seat, and distance from roads; disaster constraints include three factors: landslide sensitivity, flood sensitivity, and debris flow sensitivity.
3.4.2. Factor Classification Statistics
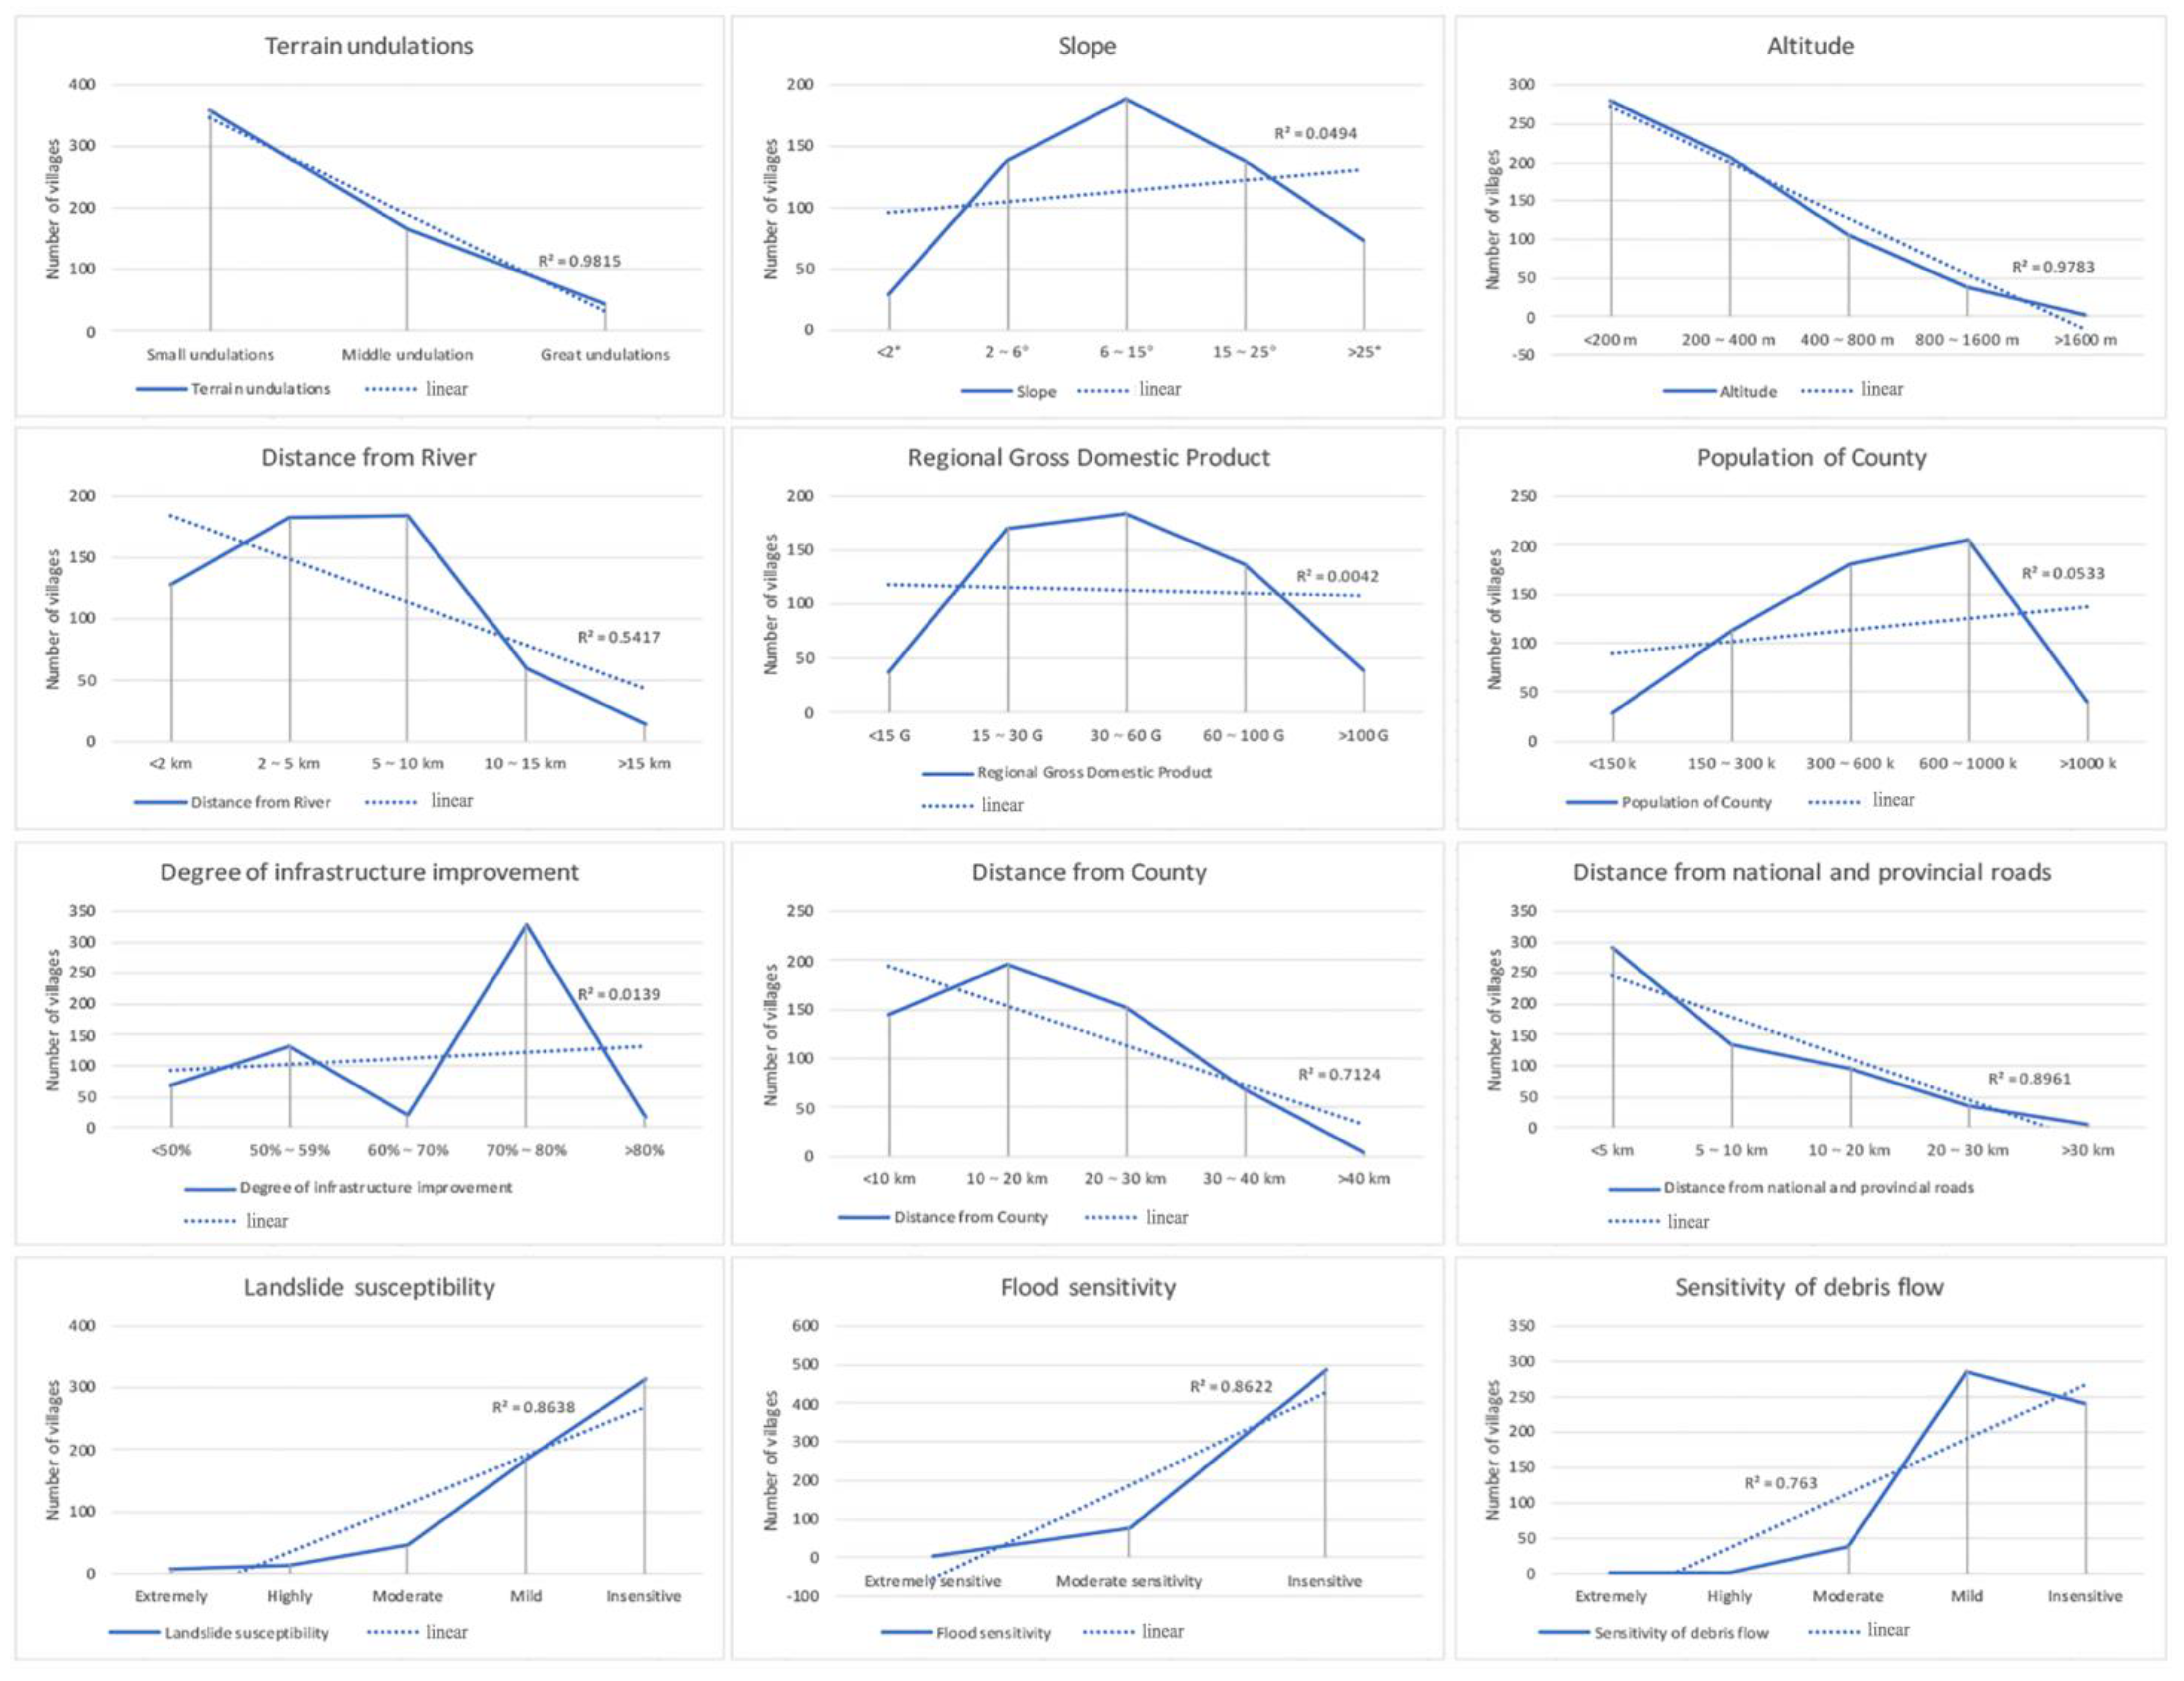
Overlay analysis was conducted between natural geographical indicators, socioeconomic indicators, and disaster constraint indicators with the spatial distribution points of minority villages. This analysis aimed to classify and quantify the number of villages related to each individual factor to preliminarily assess the rationality of the factor classification. In addition, the dashed line in the figure shows the changing trend between the indicators and the number of spatial distribution points in ethnic minority villages. Based on relevant terrain classification standards [54], as well as the actual statistics of village quantity, the natural geographical indicators, including slope, elevation, and distance to rivers, were divided into five levels. The relief fragmentation was categorized into three levels. Referring to local economic development standards [55] and the actual statistics of village quantity, the socioeconomic indicators, such as regional domestic product, population count, infrastructure completeness, distance to county seats, and distance to roads, were classified into five levels. Additionally, based on relevant disaster risk assessment standards [56] and the actual statistics of village quantity, the disaster constraint indicators, including landslide sensitivity and debris flow sensitivity, were divided into five levels, while flood sensitivity was categorized into three levels (Figure 3).
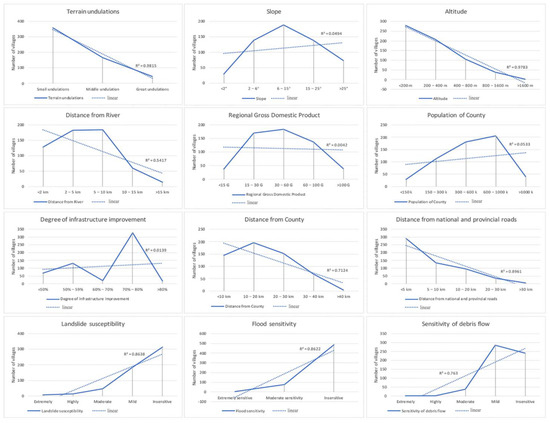
Figure 3.
Statistical map of the number of ethnic minority villages in Fujian province based on the classification of various influencing factors.
3.4.3. Environmental Suitability Evaluation Indicator Table
The study employed the Analytic Hierarchy Process (AHP) to categorize the index system into three distinct levels: the target layer (evaluating the environmental suitability of ethnic minority villages’ spatial distribution), the intermediate layer, and the index layer. Expert scoring was utilized to ascertain the relative importance and strength of relationships of each influencing factor. Two pairwise judgment matrices were formulated for the target layer, intermediate layer, and index layer, and the weights of the factors are calculated using the YaAHP 11.3 software. Subsequently, taking into account the overall impact trend of each factor on village distribution, a grading scale from 0 to 9 was assigned to each factor. This process facilitated the creation of the environmental suitability indicator evaluation table for village spatial distribution (Table 2).
Table 2.
Evaluation index table of the environmental suitability of spatial distribution of minority villages in Fujian province.
4. Research Results
4.1. Spatial Distribution Characteristics of Minority Villages
4.1.1. Spatial Distribution Density Characteristics
The quantity of provincial level minority villages surpasses that of national level minority villages by a factor of seven, with a more extensive geographical distribution. Through the utilization of ArcMap kernel density analysis to examine minority villages in Fujian province, the findings reveal striking similarities in the spatial distribution characteristics of national level and provincial level minority villages within the region (Figure 4). Notably, the presence of the “single core independence” feature is significant, with a spatial distribution demonstrating a notable coexistence of clustering and dispersion. This results in the formation of high-density areas at the territorial center of Ningde City, surrounded by concentric circles of medium-high-density and medium-density areas influenced by the high-density region. A comparison of kernel density distribution maps between provincial level and national level minority villages indicates that the extent of medium-low density areas formed by provincial level villages is comparatively smaller than those formed by national level villages. While provincial level minority villages establish medium-density zones in Longyan City, Quanzhou City, and Zhangzhou City, national level minority villages in these locations do not exhibit similar medium-density areas. This suggests a lack of a centralized gathering mode around the national level surrounded by the provincial level in these cities. The limited gathering nature of both national level and provincial level minority villages poses challenges in forming stable protection circles or ensuring sufficient stability for protection circles, thereby hindering the preservation and cultural inheritance of these villages. Notably, national level minority villages form medium-density areas in Sanming City, despite having fewer provincial level minority villages compared to Longyan City and Quanzhou City. The selection of more national level minority villages in Sanming City contributes to the formation of medium-density areas, indicating favorable conditions for the protection of minority villages and a higher likelihood of providing concentric protection measures in this area.
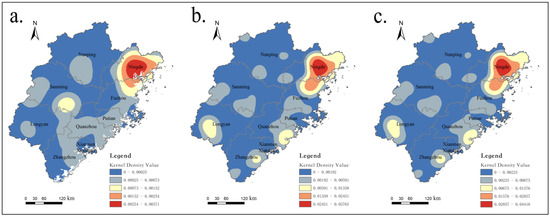
Figure 4.
Kernel density estimation diagram of minority villages: (a) Estimation maps of nuclear density in 68 national level minority villages, (b) Estimation maps of nuclear density in 499 provincial level minority villages, (c) Estimation maps of nuclear density in 567 minority villages in Fujian province.
4.1.2. Regional Distribution Differential Characteristics
The Voronoi method was employed to analyze the spatial distribution characteristics of minority villages across different regions. As depicted in the Thiessen polygon map (Figure 5), the eastern sector of Ningde City displays relatively dense and clustered distribution features, aligning with the outcomes of the kernel density analysis. Notably, the visual inspection of the image reveals a uniform distribution of ethnic minority village patches in other regions, characterized by similar patch sizes. Consequently, it becomes imperative to compute the coefficient of variation (CV) for minority villages in each city (as per Formula (2)) to delineate the distribution characteristics of minority villages in every city (refer to Table 3). Following Duyckaerts’ classification criteria [57], the distribution patterns of national level and provincial level minority villages in Fuzhou, Nanping, Ningde, and Sanming cities exhibit consistent clustered distribution. Conversely, national level minority villages in Longyan and Quanzhou cities demonstrate random distribution, while provincial level villages exhibit clustered distribution. In Putian, national level minority villages display uniform distribution, whereas provincial level villages present random distribution. Notably, Xiamen lacks national level minority villages, resulting in a value of 0, with provincial level minority villages showcasing uniform distribution.
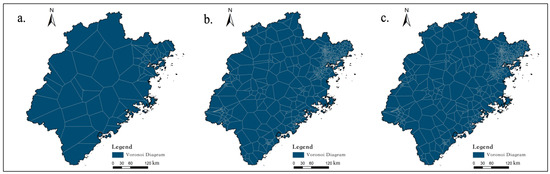
Figure 5.
Voronoi diagram of minority village space in Fujian province: (a) Voronoi diagram of 499 provincial level minority villages, (b) Voronoi diagram of 68 national level minority villages, and (c) Voronoi diagram of 567 minority villages in Fujian province.
Table 3.
CV value of minority villages of each city in Fujian province.
Given that the preservation and inheritance of ethnic minority culture necessitate a conducive overall environment, the clustering of villages can bolster ethnic cultural characteristics and establish a cultural ecological protection circle. Failure to achieve a clustering effect may lead to the alienation of original ethnic culture and village attributes amidst continuous evolution and development. The congruent distribution characteristics at the national and provincial levels indicate that Fuzhou, Nanping, Ningde, and Sanming cities offer a favorable development environment for minority villages, whereas Longyan, Quanzhou, Putian, and Xiamen cities exhibit a trend towards the weakening or potential extinction of ethnic culture within their minority villages. Particularly noteworthy is the stronger impact of national level minority villages on ethnic cultural attributes compared to provincial level villages. Therefore, in instances where national level villages lack clustered distribution or where the distribution characteristics between national level and provincial level villages diverge, it becomes even more crucial to prevent the alienation of ethnic culture and village attributes.
4.2. Environmental Suitability Assessment of the Spatial Distribution of Three Minority Villages
4.2.1. Distribution Characteristics of Village Environmental Suitability
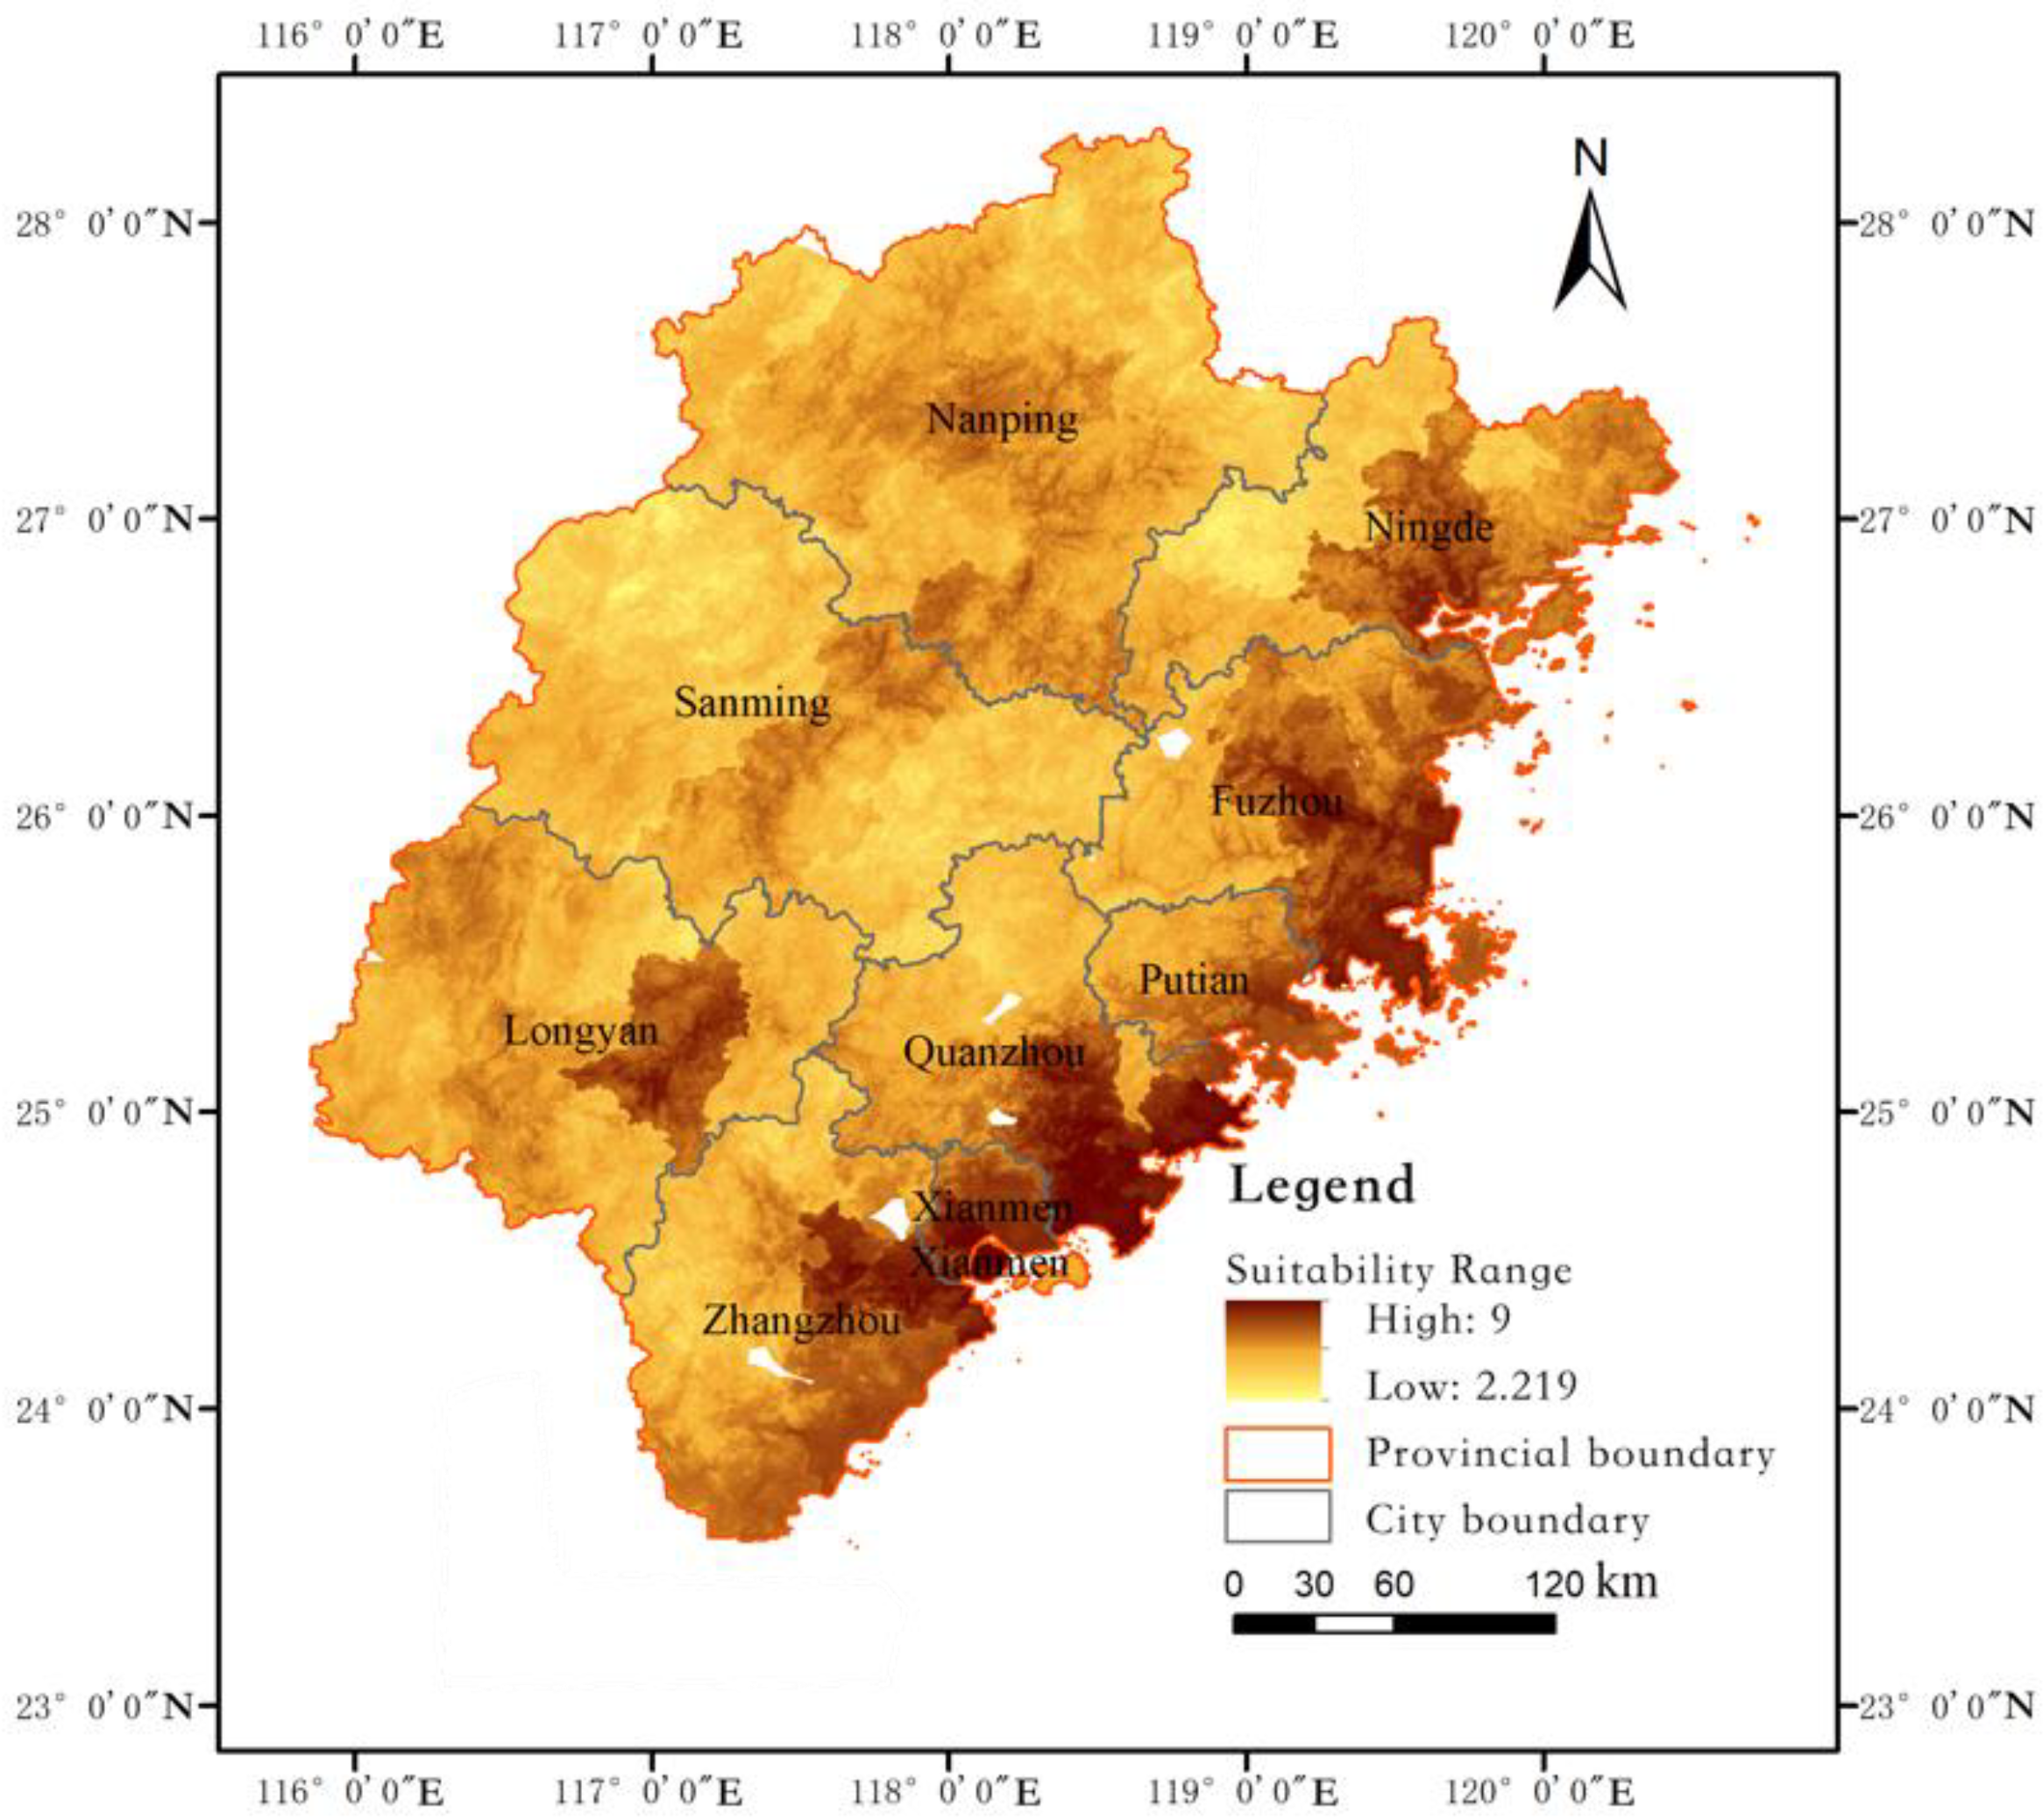
By utilizing the ArcMap analysis tool to rasterize the data of each factor, the grid distribution maps of individual factors are weighted, stacked, and processed using the map algebra method to compute the element values of each grid unit. This process culminates in the creation of a grid surface map for village environmental suitability evaluation (refer to Figure 6). Upon examination of the graph, it becomes evident that the environmental suitability range for villages falls within the range of 2.219 to 9, with elevated values predominantly concentrated in the coastal regions of Fujian province and the eastern segment of Longyan City. The comprehensive evaluation outcomes for minority villages manifest as continuous grid surface maps, with values categorized into four distinct classes utilizing the natural breaks classification method. These categories correspond to the most suitable, generally suitable, basic suitable, and unsuitable (Table 4).
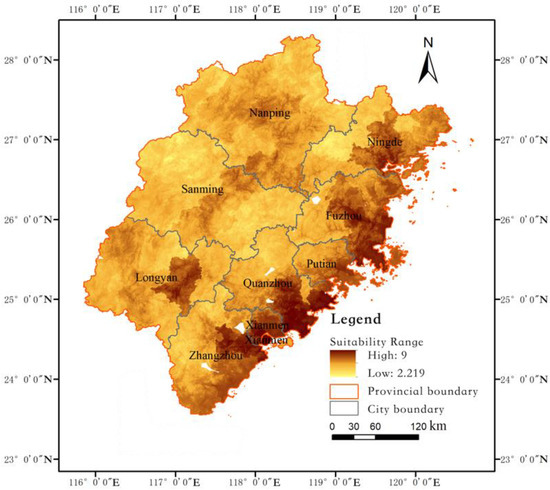
Figure 6.
Grid map of environmental suitability evaluation values of minority villages in Fujian province.
Table 4.
Classification standard for environmental suitability evaluation of minority villages in Fujian province.
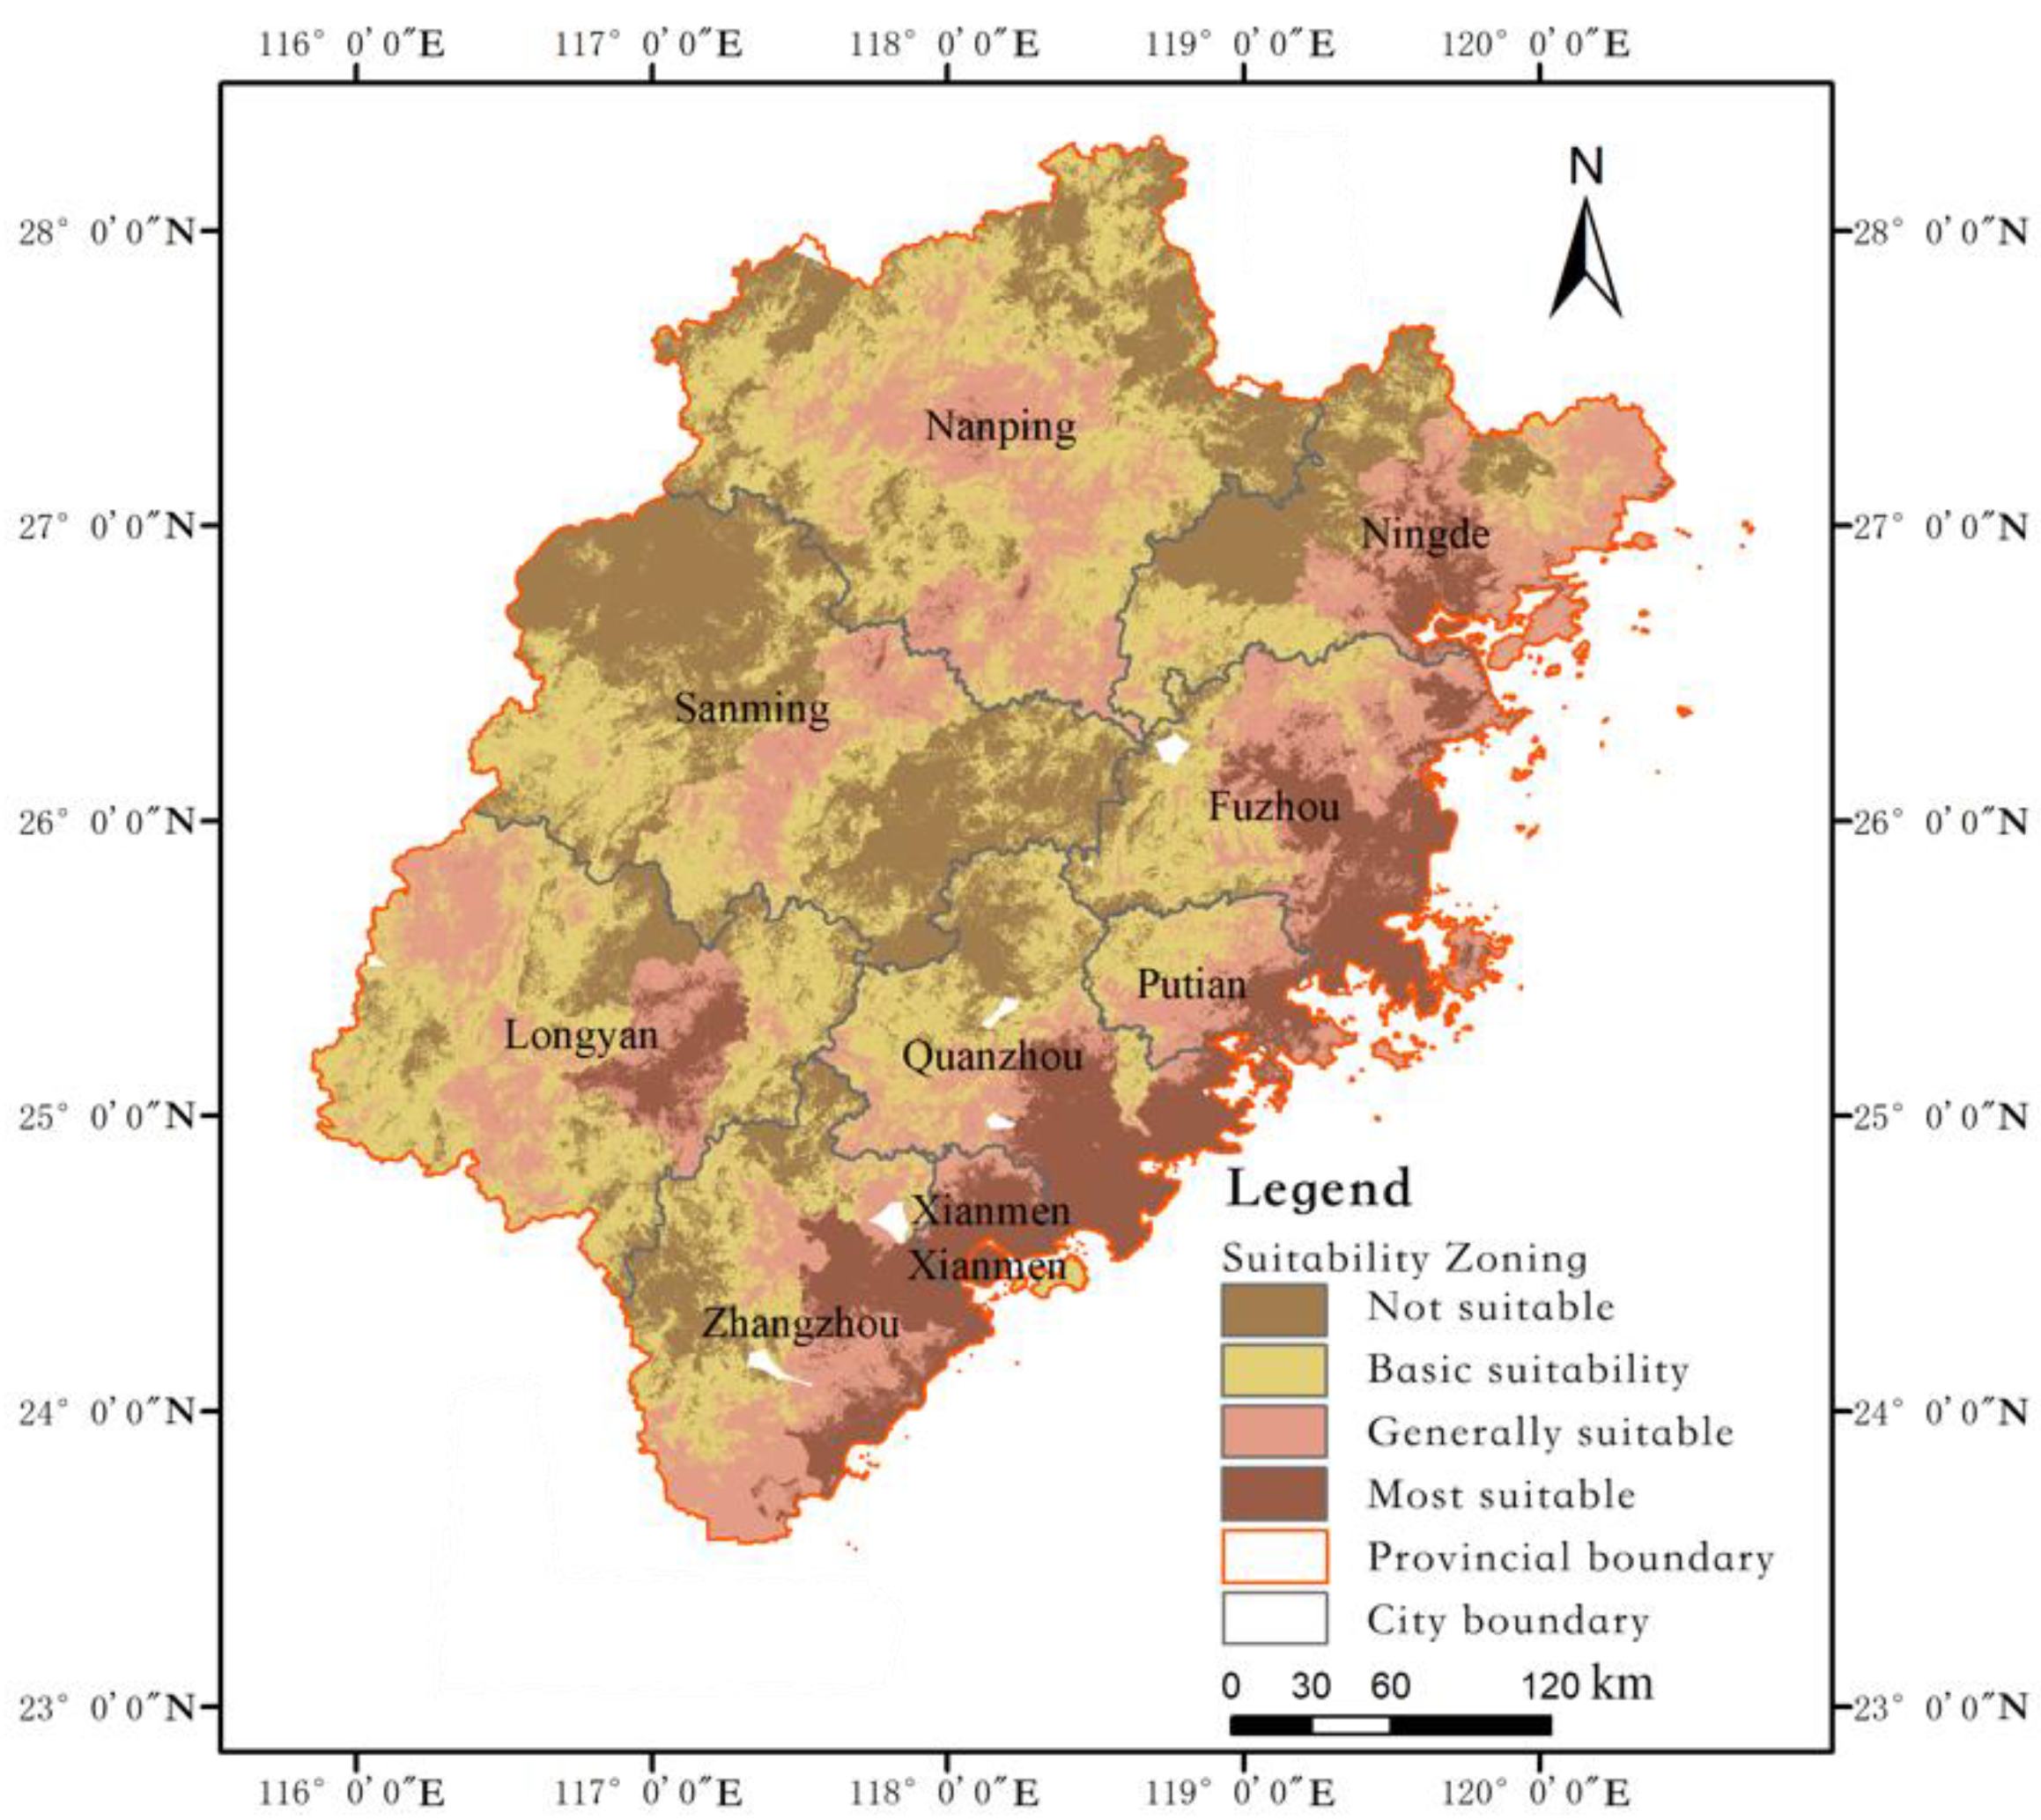
Based on the environmental suitability classification thresholds outlined in Table 4, the environmental suitability evaluation raster map of villages underwent reclassification (refer to Figure 7), and the environmental suitability classification statistics table (refer to Table 5) was generated using a raster calculator. The findings reveal that: The most suitable areas for the development of minority villages constitute 25.8% of the total, primarily concentrated in a strip along the southeast coastal area. This region boasts a developed economy, robust infrastructure, favorable natural geographical conditions, and flat terrain, offering residents the most convenient living conditions. Generally suitable areas encompass 35.9% of the total area, scattered across the southeast coastal area, central and western regions, as well as the northwest and southwest regions. These areas exhibit relatively lower social and economic conditions compared to the most suitable regions, with gentle terrain fostering a more ecologically sound living environment for residents. Basically, suitable areas cover 25.5% of the total area, dispersed throughout the central and northern regions, as well as the southern region. These areas face constraints imposed by natural geographical conditions, characterized by higher average elevation, and heightened susceptibility to natural disasters, significantly impacting residents’ livelihoods. Unsuitable areas represent 12.8% of the total area, predominantly concentrated in the northern, central, and western regions. These regions exhibit underdeveloped economies, sparse road networks, inadequate transportation infrastructure, low levels of urbanization, small population sizes, and relative developmental backwardness within the province. Overall, the majority of areas within Fujian province are deemed suitable for the development of minority villages.

Figure 7.
Classification of the environmental suitability evaluation value of minority villages in Fujian province.
Table 5.
Statistical results of environmental suitability classification of ethnic minorities in Fujian province.
In Fujian province, 27.5% of minority villages are situated in the most suitable areas, 44.6% in generally suitable areas, and 89.1% in basically suitable areas. Notably, there are 46 minority villages located in unsuitable areas, accounting for 10.9% of the total. The prevalence of minority villages in generally suitable areas surpasses those in the most suitable areas significantly. This disparity can be attributed to the fact that the most suitable areas are often situated in central urban zones characterized by higher economic development levels, whereas minority villages tend to be positioned on the peripheries of cities and adjacent regions. In essence, the majority of minority villages in Fujian province are situated in areas deemed suitable for their development.
4.2.2. Differences in the Environmental Suitability Distribution of Municipal Units
According to the statistical analysis of the environmental suitability grading of minority villages at the municipal level (refer to Table 6), the findings indicate that the highest total number of suitable minority villages is observed in Ningde City, accounting for 41.13% of the total. This can be attributed in part to the substantial quantity of minority villages in Ningde City and their clustered distribution near the central urban area due to geographical constraints. Following Ningde City, Fuzhou City ranks second with a proportion of 12.66%. As the provincial capital city, Fuzhou exhibits a more pronounced disparity in socioeconomic aspects between the central urban area and the urban periphery compared to other cities.
Table 6.
Statistical results of environmental suitability classification of minority villages in cities of Fujian province.
Generally, the number of generally suitable villages exceeds the number of most suitable villages by a factor of five, underscoring a higher prevalence of generally suitable villages. Quanzhou, Longyan, Nanping, Sanming, and Zhangzhou demonstrate similar numbers and proportions of suitable minority villages, with Nanping and Sanming exhibiting lower environmental suitability compared to Quanzhou and Longyan. This discrepancy arises from Nanping and Sanming predominantly featuring basic suitable minority villages along with a notable proportion of unsuitable minority villages, particularly prominent in Sanming. Upon comparing the environmental suitability statistical outcomes of national level and provincial level minority villages in each city, it is observed that Ningde City, Longyan City, Sanming City, and Zhangzhou City harbor a greater number of unsuitable national level minority villages in comparison to unsuitable provincial minority villages.
In summary, the prevalence of the most suitable minority villages in Ningde City and Fuzhou City is primarily influenced by distribution density and socioeconomic factors. Conversely, Longyan City, Sanming City, and Zhangzhou City exhibit a higher concentration of unsuitable minority villages in less developed socioeconomic areas compared to Quanzhou and Fuzhou. These areas are also impacted to some extent by natural geography and natural disasters, such as high altitude and limited transportation accessibility leading to developmental isolation.
5. The Spatial Relationship Characteristics of the Distribution and Environmental Suitability of Minority Villages
5.1. Correlation Between Village Distribution Characteristics and Evaluation Factors
Using the GeoDetector to analyze the influence (q) of various factors on the environmental suitability and evaluate the degree of interaction between these factors using an interaction detector [58]. The kernel density of village spatial distribution as the dependent variable (Y). The independent variables encompass relief fragmentation (A), slope (B), altitude (C), distance from rivers (D), regional GDP (E), county population (F), infrastructure completeness (G), distance from county towns (H), distance from roads (I), landslide sensitivity (J), flood sensitivity (K), and debris flow sensitivity (L).
Based on the factor detection results (Table 7), it is evident that each factor exerts a significantly distinct influence on the environmental suitability of the spatial distribution of minority villages. In terms of influence (q), the specific ranking is as follows: E > F > G > J > H > L > I > C > B > A > D > K. The factor with the highest influence is RGDP (0.509), followed by the population size of the county (0.417) and infrastructure completeness (0.376). This indicates that socioeconomic indicators have a significant impact on environmental suitability. As the provincial capital city, Fuzhou has a higher socioeconomic level; therefore, all ethnic minority villages are in areas with suitability levels I, II, and III. The sensitivity of landslides and debris flows in the disaster restriction index also has a significant impact on environmental suitability. For instance, Sanming City and Zhangzhou City are prone to disasters and have underdeveloped socioeconomies; hence there are many ethnic minority villages in unsuitable areas. In contrast, the impact of natural geographical indicators such as slope, topography, and distance from river channels on environmental suitability is relatively small. For example, Ningde City has the highest number of ethnic minority villages, but most of them are in moderately suitable areas. The factor with the least influence is flood sensitivity (0.011). Compared to other natural disasters, the occurrence and impact of large-scale flood events are relatively low and limited to specific geographical regions. In comparison to more extensive landslide and debris flow disasters, floods have a narrower coverage [59,60].
Table 7.
Detection analysis of impact factors on the spatial distribution of villages.
In terms of factor interaction detection results (refer to Table 8), dual-factor enhancement relationships are observed among the factors, while no non-linear enhancement, independent, or weakening relationships are identified. There are positive interactions between each factor, meaning that when the value of one factor increases, it will enhance the influence of other factors on the target variable. Furthermore, the influence of the factors is not independent but rather complex and interconnected. These factors collectively contribute to the spatial distribution of ethnic minority villages through synergistic effects. Therefore, the average value of the interaction strength of factors in natural geography, social economy, and disaster limitation indicators is taken as the impact strength. The results indicate that the impact strength of natural geography indicators is 0.254, the impact strength of social economy indicators is 0.439, and the impact strength of disaster limitation indicators is 0.308. The ratio of the impact strength of natural geography, socioeconomics, and disaster limitation indicators on the environmental suitability of ethnic minority villages in mountainous areas is 5:10:7. This underscores the validity and rationale of the multi-factor evaluation model utilized in the study.
Table 8.
Interactive detection analysis of influencing factors of village spatial distribution.
5.2. Spatial Connectivity Between Village Distribution Characteristics and Environmental Suitability
The density of Ethnic Village Spatial Distribution reflects the degree of agglomeration of villages in a certain region and is closely related to the natural, socioeconomic conditions, etc., of that region [61]. When the natural environment and economic conditions of a certain region are relatively suitable, the density of village distribution in that region is usually higher, showing a more concentrated distribution pattern. This indicates that the spatial density of village distribution can, to some extent, validate the reasonableness of environmental suitability and the spatial linkages between the two.
The geographical connectivity between village spatial distribution and environmental suitability was analyzed using GeoDa V1.20 software; the geographical connectivity value between the distribution of minority villages and environmental suitability is 86.87, indicating a high degree of spatial interaction and mutual influence between the two. From a global spatial autocorrelation perspective, the bivariate Moran’s I index between the distribution of minority villages and environmental suitability is 0.327, with a p-value less than 0.01, signifying a significant positive correlation between the two.
As illustrated in Figure 8, the areas of high-high cluster areas of ethnic village spatial distribution and environmental suitability are mainly concentrated in the Ningde area in the northern part of Fujian, while the low-low cluster areas are widely distributed, mainly in the eastern part of Fujian, including Nanping, Sanming, Longyan, and other counties and cities. The low-high cluster areas are concentrated in the southeastern part of Fujian province, where the suitability is high, but the number of minority villages is relatively small, which is conducive to the protection and development of minority villages. However, this imbalance may hinder the cultural inheritance of minority villages and damage the ecological environment. At the same time, minority villages can also become characteristic tourism resources, driving local economic development. However, if the number of minority villages is too small, it will be difficult to fully leverage this advantage and miss out on opportunities for regional economic development. High-low cluster areas are scattered in Sanming City, which belongs to a mountainous area with frequent natural disasters, which has limited the local economic and social development and affects the construction of minority villages. The above analysis indicates a high degree of compatibility between village spatial distribution and environmental suitability, which suggests the rationality of using a multi-factor evaluation model for environmental suitability assessment in the study.
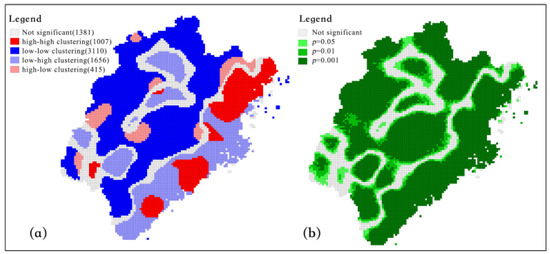
Figure 8.
Lisa cluster of distribution quantity and environmental suitability of minority villages in Fujian province: (a) LISA cluster map; (b) LISA significance map.
5.3. Differences in Village Distribution Characteristics in Environmental Suitability Evaluation
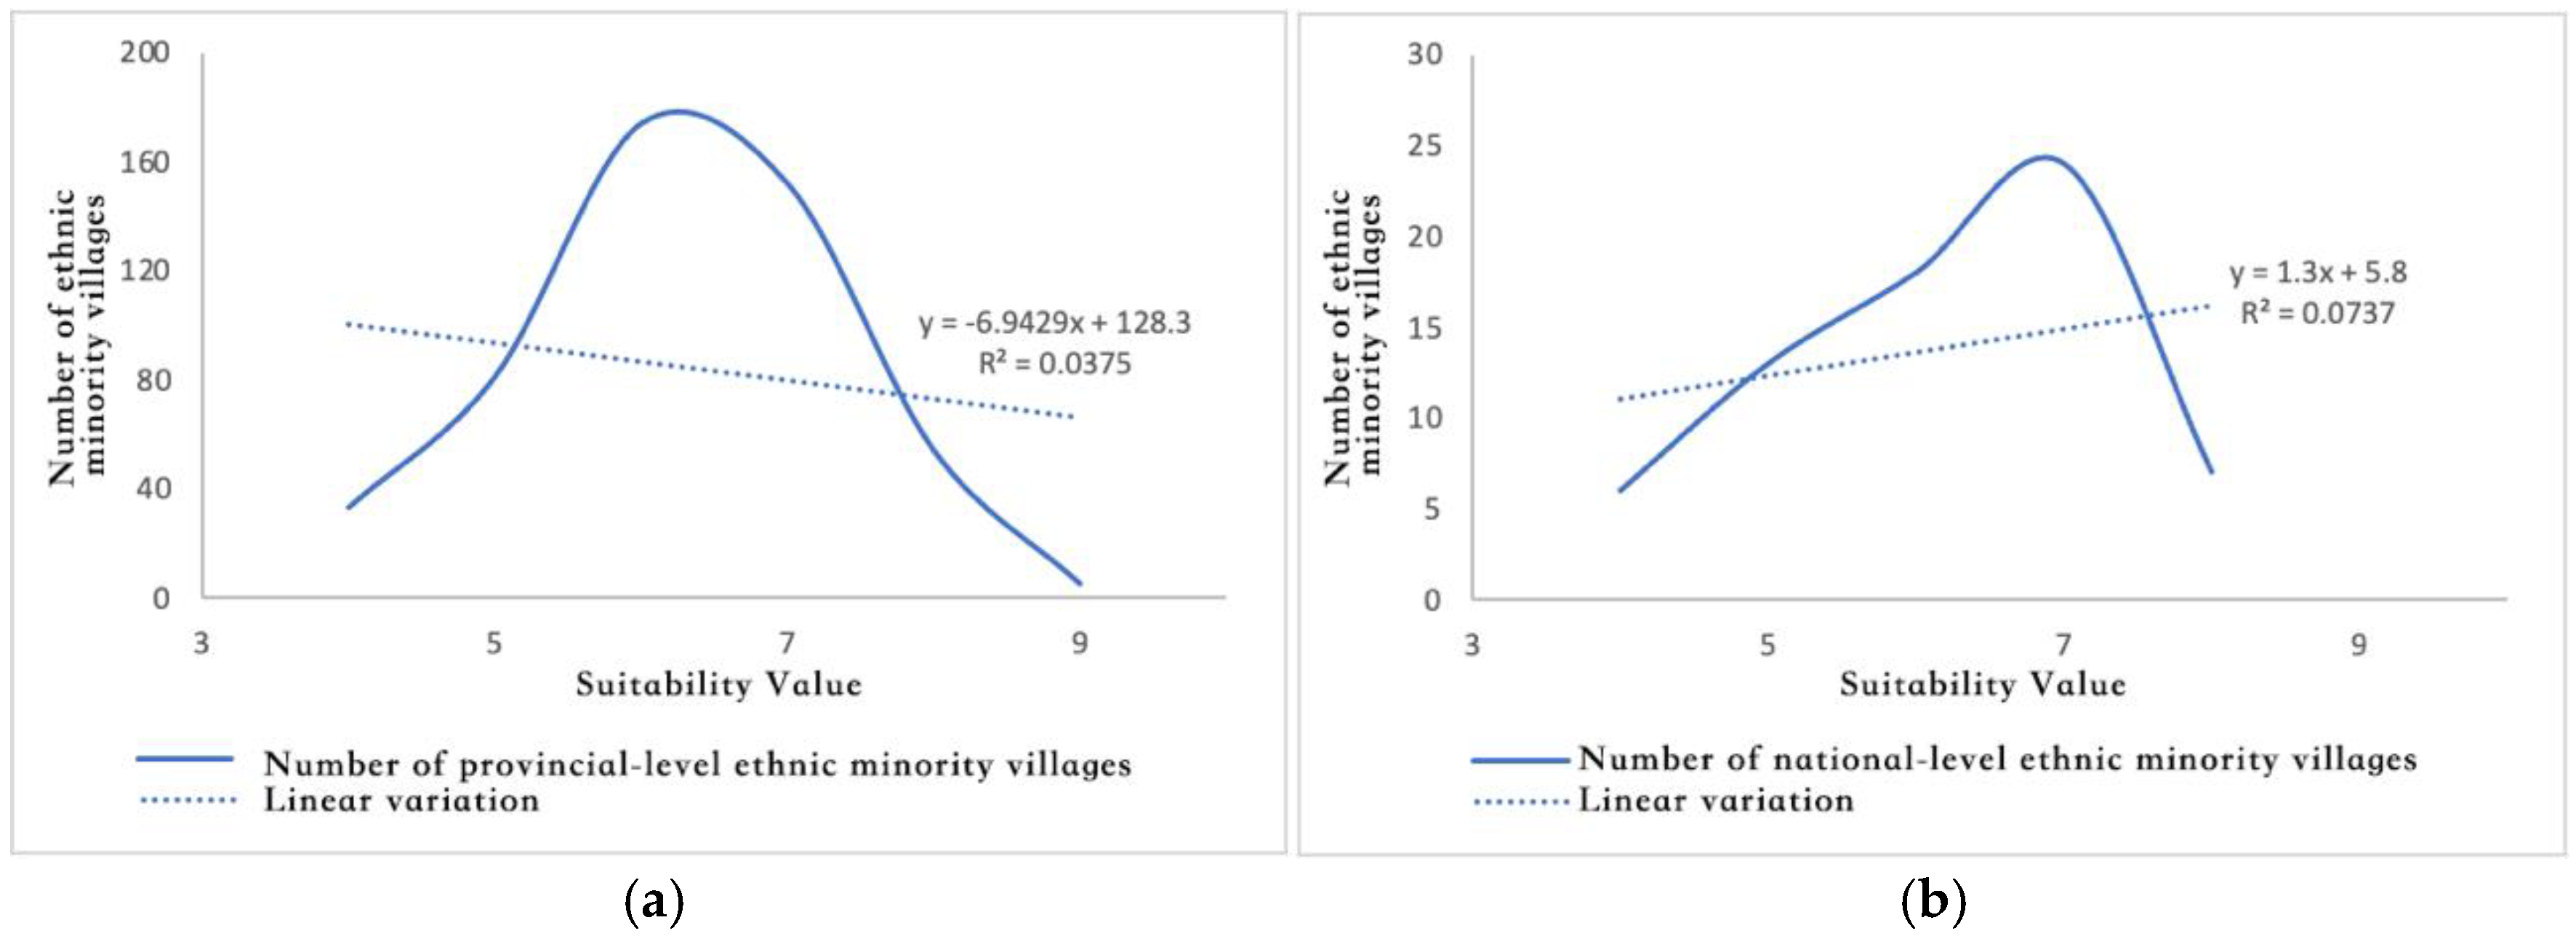
Based on the environmental suitability evaluation and the current distribution of villages, a correlation chart of the environmental suitability index and the number of national level and provincial level minority villages in Fujian province has been generated (refer to Figure 9). The environmental suitability index in Fujian province exhibits an inverted “U” relationship with the distribution quantity of minority villages. Within the environmental suitability range of 5–8, the number of minority villages reaches its peak. However, there are differences between the two. The number of national level minority villages increases within the environmental suitability range of 4–7 and decreases within the range of 7–8. The number of provincial level minority villages rises within the environmental suitability range of 4–6 and declines within the range of 6–8.
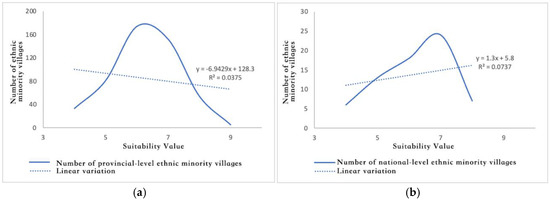
Figure 9.
Classification of environmental suitability evaluation value of minority villages in Fujian province: (a) The relationship between environmental suitability values and the distribution quantity of provincial level minority villages, (b) The relationship between environmental suitability value and the distribution quantity of national level minority villages.
However, when examining the linear index relationship between the environmental suitability index and the number of national level and provincial level minority villages in Fujian, a trend emerges: There is a tendency for an increased number of national level minority villages with a rise in the environmental suitability index. Conversely, there is a trend towards a decreased number of provincial minority villages as the environmental suitability index increases.
6. Conclusions
This study focuses on 68 national level and 499 provincial level minority villages in Fujian province as research subjects. A multi-factor weighted evaluation model was used to study the environmental suitability of the spatial distribution of minority villages. The principal findings are outlined as follows:
- (1)
- The regional gross domestic product (RGDP) in the socioeconomic indicators has the highest influence on the environmental suitability of the spatial distribution of minority villages (0.509), while flood sensitivity has the least influence (0.011). This is because the probability of flood events is low, and their impact is limited and relatively narrow in scope. The ratio of the impact strengths of natural geography, socioeconomic, and disaster restriction indicators on the environmental suitability of the spatial distribution of minority villages in mountainous areas is 5:10:7.
- (2)
- The most suitable area for the spatial distribution of minority villages in Fujian province accounts for 25.8% of the total area and exhibits a belt-like distribution along the southeastern coast. The generally suitable area accounts for 35.9% and is scattered along the southeastern coast, as well as in the valley regions between the mountainous areas of western Fujian and central Fujian. The moderately suitable area accounts for 25.5% and is evenly distributed in areas other than the southeastern coast. The unsuitable area accounts for 12.8% and is mainly concentrated in the northern, central, and western regions. According to the statistical results of village distribution, 27% of the minority villages are in the most suitable areas, 45.9% are in generally suitable areas, and 19% are in moderately suitable areas. It is worth noting that 46 minority villages, accounting for 8.1% of the total, are distributed in unsuitable areas. Overall, areas with high suitability values are concentrated in the southeastern coast and central regions. From east to west, the suitability values gradually decrease. The suitable area accounts for 87.2% of the total area and includes 91.9% of the minority villages. The spatial distribution of minority villages in Ningde City, Fuzhou, and Quanzhou has high environmental suitability, while Sanming City and Nanping City have poor environmental suitability.
- (3)
- The geographical correlation coefficient between the spatial distribution of minority villages and environmental suitability is 86.87, indicating a high degree of spatial interaction and fit between the two. This validates the rationality of the multi-factor evaluation model for assessing the environmental suitability of ethnic village spatial distribution in mountainous areas.
- (4)
- There is an inverted “U” relationship between environmental suitability and the distribution of national level and provincial level minority villages. As the suitability index increases, there is a trend of increasing numbers of national level minority villages and decreasing numbers of provincial level minority villages. Enhancing environmental suitability can help promote the selection of provincial level villages to national level status.
Based on the research findings outlined above, several suggestions for adjusting the protection of minority villages in Fujian province are proposed. (1) For the most suitable and generally suitable areas, it is recommended to develop specialized development plans to reasonably determine the layout and scale of minority villages. It is crucial to make full use of regional and economic advantages by increasing investment in infrastructure construction, such as transportation, water supply, electricity, and communication. Additionally, improving public service facilities such as healthcare, education, and culture to meet the needs of residents is vital. However, it is important to avoid sacrificing cultural preservation in the region as a trade-off for excessive economic development. (2) For the moderately suitable and unsuitable areas, it is essential to increase support and focus on infrastructure construction and the supply of public services. It is necessary to address adverse factors such as frequent natural disasters by strengthening emergency management measures and, if necessary, establishing relocation plans.
Moreover, this study also has limitations. Environmental suitability assessment involves dynamic factors across various disciplines and therefore requires extensive interdisciplinary research. This study primarily focuses on static surveys of minority villages. Future research will focus more on the dynamic evolution of ethnic minority villages, including dynamic suitability analysis, cross-regional comparative studies, and policy impact assessments.
Author Contributions
Conceptualization, X.X. and P.V.G.; methodology, X.X.; software, X.X.; validation, X.X. and H.W. (Hong Wu); formal analysis, X.X. and H.W. (Hantao Wang); investigation, X.X. and D.H.; resources, X.X.; data curation, X.X., D.H. and H.W. (Hantao Wang); writing—original draft preparation, X.X. and P.V.G.; writing—review and editing, X.X. and H.W. (Hong Wu); visualization, X.X.; supervision, P.V.G.; project administration, X.X. and P.V.G.; funding acquisition, P.V.G. All authors have read and agreed to the published version of the manuscript.
Funding
This research is funded by Zhejiang University: 876-211 Class Project, funding project code: 113000*1942221R1/007, and the scientific research start-up fund of Qiushi Distinguished Professor of Zhejiang University School of Construction Engineering, and Anhui Provincial Key Laboratory of Huizhou Architecture 2024 Open Project, funding project code: 2024HPJZ-KF01, Compilation and Interpretation of Spatial Form Information of Ancient Cities in Huizhou Local Gazetteer Map.
Institutional Review Board Statement
Not applicable.
Informed Consent Statement
Not applicable.
Data Availability Statement
No new data were created or analyzed in this study. Data sharing is not applicable to this article.
Conflicts of Interest
The authors declare no conflicts of interest. The funders had no role in the design of the study; in the collection, analyses, or interpretation of data; in the writing of the manuscript; or in the decision to publish the results.
References
- Guo, Z.F.; Sun, L. The planning development and management of tourism: The case of Dangjia, an ancient village in China. Tour. Manag. 2016, 56, 52–62. [Google Scholar] [CrossRef]
- State Ethnic Affairs Commission. Outline of the Protection and Development Plan for Minority Ethnic Villages (2011–2015). Available online: https://www.neac.gov.cn/seac/xxgk/tzgg/index_10.shtml (accessed on 8 March 2022).
- National Bureau of Statistics of China. China Statistical Yearbook 2020; China Statistics Press: Beijing, China, 2020.
- Cui, P.; Zhu, Y.Y.; Han, Y.S.; Chen, X.Q.; Zhuang, J.Q. The 12 May Wenchuan earthquake-induced landslide lakes: Distribution and preliminary risk evaluation. Landslides 2009, 6, 209–223. [Google Scholar] [CrossRef]
- Shi, P.; Kasperson, R. (Eds.) World Atlas of Natural Disaster Risk; Springer: Berlin/Heidelberg, Germany, 2015. [Google Scholar]
- Schneiderbauer, S.; Pisa, P.F.; Delves, J.L.; Pedoth, L.; Rufat, S.; Erschbamer, M.; Thaler, T.; Carnelli, F.; Granados-Chahin, S. Risk perception of climate change and natural hazards in global mountain regions: A critical review. Sci. Total Environ. 2021, 784, 146957. [Google Scholar] [CrossRef]
- Letsie, M.M.; Grab, S.W. Assessment of social vulnerability to natural hazards in the Mountain Kingdom of Lesotho. Mt. Res. Dev. 2015, 35, 115–125. [Google Scholar] [CrossRef]
- Zheng, G.H.; Jiang, D.F.; Luan, Y.F.; Yao, Y. GIS-based spatial differentiation of ethnic minority villages in Guizhou Province, China. J. Mt. Sci. 2022, 19, 987–1000. [Google Scholar] [CrossRef]
- Roseland, M. Sustainable community development: Integrating environmental, economic, and social objectives. Prog. Plan. 2000, 54, 73–132. [Google Scholar] [CrossRef]
- Zhao, F.; Zhang, S.; Du, Q.; Ding, J.; Luan, G.; Xie, Z. Assessment of the sustainable development of rural minority settlements based on multidimensional data and geographical detector method: A case study in Dehong, China. Socio-Econ. Plan. Sci. 2021, 78, 101066. [Google Scholar] [CrossRef]
- Jiao, Y.; Li, X.; Liang, L.; Takeuchi, K.; Okuro, T.; Zhang, D.; Sun, L. Indigenous ecological knowledge and natural resource management in the cultural landscape of China’s Hani Terraces. Ecol. Res. 2012, 27, 247–263. [Google Scholar] [CrossRef]
- Henin, B.; Flaherty, M. Ethnicity, culture, and natural resource use: Forces of change on Dai society, Xishuangbanna, Southwest China. J. Dev. Soc. 1994, 10, 219. [Google Scholar]
- Xu, Y.Z.; Yao, X.Z. A Study on the Spatial Distribution Pattern of minority villages in China. Guizhou Ethn. Stud. 2020, 41, 51–58. [Google Scholar]
- Wei, Z.; Zhang, F.T.; Zhang, Y.; Li, Y.Z.; An, Y.Z.; Sun, C.C.; Yang, Q. Analysis of the Spatial-Temporal Distribution Characteristics and Influencing Factors of minority villages in Guizhou. Guizhou Ethn. Stud. 2021, 42, 113–121. [Google Scholar]
- Xie, F.; Wei, S.Y. Production of Ethnic Minority Village Tourism Space Landscape and Its Discourse Logic—Based on the Investigation of Baimian Yao Village in Longsheng Autonomous County, Guangxi. J. S. Cent. Univ. Natl. Humanit. Soc. Sci. 2019, 39, 48–53. [Google Scholar]
- Meng, J.; Huang, C.Q. The Logic and Practice of Precision Poverty Alleviation of “Intangible Cultural Heritage + Tourism” in minority villages—A Study on Chengyang Bazhai Dong Village in Sanjiang, Guangxi. Agric. Econ. 2021, 2, 92–94. [Google Scholar]
- Henderson, J.; Teck, G.K.; Ng, D.; Si-Rong, T. Tourism in ethnic communities: Two Miao villages in China. Int. J. Herit. Stud. 2009, 15, 529–539. [Google Scholar] [CrossRef]
- Xu, X.; Genovese, P.V. Assessment on the Spatial Distribution Suitability of minority villages in Fujian Province Based on GeoDetector and AHP Method. Land 2022, 11, 1486. [Google Scholar] [CrossRef]
- Tang, M.G.; Hu, J.; Xiao, L.; Chen, X.; Lv, L. Spatial-temporal Evolution and Influencing Factors of minority villages in Guizhou. J. Arid. Land Resour. Environ. 2022, 36, 177–183. [Google Scholar]
- Ding, C.B.; Xiao, D.W. Research on Traditional Villages and Dwellings of Ethnic Minorities Based on Cultural Geography. South Archit. 2022, 72–76. [Google Scholar] [CrossRef]
- Liang, B.Q.; Xiao, D.W.; Tao, J.; Ji, J.J.; Zhuo, X.L.; Huang, Y. Spatial Pattern and Evolution of Hakka Traditional Villages in Ganzhou. Econ. Geogr. 2018, 38, 196–203. [Google Scholar]
- Li, J.; Su, D.D.; Li, Z.B. Research on the Evaluation Index System of Ethnic Minority Village Construction Process. Guangxi Ethn. Stud. 2016, 5, 23–31. [Google Scholar]
- Da, L. Research on Poverty Alleviation Through Tourism in Minority Villages in Guizhou. Ph.D. Thesis, Southwest University for Nationalities, Chengdu, China, 2020. [Google Scholar]
- Zhang, D. Research on the Evolution and Regulation of Benefits of Ethnic Minority Village Tourism in Yunnan Province. Ph.D. Thesis, Yunnan University, Kunming, China, 2019. [Google Scholar]
- Zhu, B.L. Research on Tourism Poverty Alleviation in Ethnic Villages: A Case Study of Miao and Dong Ethnic Villages in Qiandongnan, Guizhou Province. Ph.D. Thesis, Southwest University for Nationalities, Chengdu, China, 2019. [Google Scholar]
- Yang, C.E.; Zhao, J. The Practice Dilemma and Path Exploration of the Revitalization of minority villages—Based on the Investigation of Ethnic Minority Areas in Southwest Hubei. J. Ethnol. 2020, 11, 17–28+152–154. [Google Scholar]
- Tian, Y.M.; Xie, Q.S. Research on the Cultural Communication Path of Ethnic Minority Village in the Internet Era—Taking Three minority villages in Guizhou Province as Examples. Guizhou Ethn. Stud. 2020, 41, 68–74. [Google Scholar]
- Zhou, L.B. Post-Occupancy Evaluation (POE) of the Relocation and Resettlement of Yi Villages in Liupanshui. Master’s Thesis, Guizhou University, Guiyang, China, 2021. [Google Scholar]
- Chen, L.Q.; Cheng, B.; Liu, F.; Yuan, H.Q. Preliminary Analysis and Exploration of Public Space Evaluation System of Qiang Ethnic Villages. J. West. Hum. Settl. 2020, 35, 109–115. [Google Scholar]
- Zheng, G.T. Research on the Evaluation Index System and Application of the Effectiveness of Ethnic Minority Village Construction. Master’s Thesis, South-Central University for Nationalities, Wuhan, China, 2015. [Google Scholar]
- Feng, R. Research on the Development of Agricultural Cultural Heritage Tourism in Traditional Villages of Fujian Ethnic Minorities. Master’s Thesis, Nanjing Agricultural University, Nanjing, China, 2017. [Google Scholar]
- Li, W.R. Village Economy of Scattered Ethnic Minorities—A Case Study of Bajing She Nationality Village in Luoyuan, Fujian. J. Yunnan Univ. Natl. (Philos. Soc. Sci. Ed.) 2008, 11, 39–42. [Google Scholar]
- Zhen, J. Tian Tongyu Evaluation of the suitability of living environment in Inner Mongolia pastoral areas: A case study of Xilingol League. Soil Water Conserv. Res. 2024, 31, 384–394. [Google Scholar]
- Singh, L.; Saravanan, S.; Jennifer, J.J.; Abijith, D. Application of multi-influence factor (MIF) technique for the identification of suitable sites for urban settlement in Tiruchirappalli City, Tamil Nadu, India. Asia-Pac. J. Reg. Sci. 2021, 5, 797–823. [Google Scholar] [CrossRef]
- Yu, H.; Qiang, M.; Liu, S.Q. Territorial suitability assessment and function zoning in the Jiuzhaigou earthquake-stricken area. J. Mt. Sci. 2019, 16, 195–206. [Google Scholar] [CrossRef]
- Saeidi, S.; Mohammadzadeh, M.; Salmanmahiny, A.; Mirkarimi, S.H. Performance evaluation of multiple methods for landscape aesthetic suitability mapping: A comparative study between Multi-Criteria Evaluation, Logistic Regression and Multi-Layer Perceptron neural network. Land Use Policy 2017, 67, 1–12. [Google Scholar] [CrossRef]
- Liu, Y.; Cui, J.; Kong, X.; Zeng, C. Assessing suitability of rural settlements using an improved technique for order preference by similarity to ideal solution. Chin. Geogr. Sci. 2016, 26, 638–655. [Google Scholar] [CrossRef]
- Bunruamkaew, K.; Murayam, Y. Site suitability evaluation for ecotourism using GIS and AHP: A case study of Surat Thani province, Thailand. Procedia Soc. Behav. Sci. 2011, 21, 269–278. [Google Scholar] [CrossRef]
- Abou-Elnour, A.; Pallathucheril, V.; Abou-Elnour, A. Site suitability evaluation for ecotourism potential areas using RS and GIS: A case study of Wadi Wurayah, Fujairah, UAE. In Remote Sensing and Modeling of Ecosystems for Sustainability XII; SPIE: Bellingham, WA, USA, 2015; Volume 9610, p. 961002. [Google Scholar]
- Fujian Provincial People’s Government’s Implementation Opinions on Carrying out the “Thirteenth Five-Year Plan” of the State Council to Promote the Development of Ethnic Areas and Ethnic Groups with Fewer Populations. Available online: http://mzzjt.fujian.gov.cn/xxgk/ghjh/201711/t20171106_2072134.htm (accessed on 2 April 2022).
- Notice from the Department of Ethnic and Religious Affairs of Fujian Province on the Early Issuance of Budget Indicators for the Whole Village Poverty Alleviation (Poverty Alleviation for Minority Villages). Available online: http://www.xianyou.gov.cn/xmzyzjsw/zjjg/400/201803/t20180314_1170478.htm (accessed on 3 April 2022).
- Notice of the State Ethnic Affairs Commission on Issuing Opinions on the Naming and Hanging of Chinese Ethnic Minority Characteristic Villages (Minwei Fa [2013] No. 240). Available online: http://mzw.gxzf.gov.cn/ztzl/zxzt/zgssmztscz/ssmztscz_zcwj/t10458497.shtml (accessed on 3 April 2022).
- He, Q.; Chen, N. Mountainous landform classification in Fujian Province based on joint frequency domain information. Remote Sens. Inf. 2016, 31, 136–141. [Google Scholar]
- Liu, R.; Liu, N. An inundation area disaster assessment method based on digital elevation model (DEM). J. Image Graph. 2001, 6, 118–122. [Google Scholar]
- Wang, J.; Xu, C. Geographic detector: Principles and prospects. Acta Geogr. Sin. 2017, 72, 116–134. [Google Scholar]
- Zeng, G.; Hu, S. Evolution of China’s regional development pattern under a once-in-a-century great transformation. Econ. Geogr. 2021, 41, 42–48+69. [Google Scholar] [CrossRef]
- Liu, L.; Duan, Y.; Li, L.; Xu, L.; Zhang, Y.; Nie, W. Spatial distribution characteristics and suitability evaluation of rural residential areas in Shanxi Province. China Land Sci. 2022, 43, 100–109. [Google Scholar]
- Liao, Y. Research on the Spatial Pattern Characteristics and Layout Optimization of Rural Residential Areas in Karst Mountainous Areas. Master’s Thesis, Guizhou Normal University, Guiyang, China, 2021. [Google Scholar]
- Qi, Z.; Liao, J.; Xu, W.; Ni, Y. GIS-based suitability evaluation of settlement land in the Qinling Mountains. Acta Ecol. Sin. 2015, 35, 1274–1283. [Google Scholar]
- Tzampoglou, P.; Loupasakis, C. Evaluating geological and geotechnical data for the study of land subsidence phenomena at the perimeter of the Amyntaio coalmine, Greece. Int. J. Min. Sci. Technol. 2018, 28, 601–612. [Google Scholar] [CrossRef]
- Yuan, Y.; Zou, X.; Shi, F.; Gao, X.; Hu, L.; Zhang, Z. Study on the suitability distribution of bird habitats in the Dongting Lake Basin under climate change scenarios. J. Aquat. Ecol. 2022, 43, 56–62. [Google Scholar] [CrossRef]
- Feng, Y.; Zhen, J. Comprehensive suitability evaluation and spatial optimization of human settlements in Inner Mongolia Autonomous Region. J. Geo-Inf. Sci. 2022, 24, 1204–1217. [Google Scholar]
- Wang, K.; He, Q.; Zhu, X. Study on the spatial relationship between characteristic towns in the new era and the integrated development of urban and rural areas: A case study of Zhejiang Province. Econ. Geogr. 2022, 8, 1–14. [Google Scholar] [CrossRef]
- Jiao, C.; Zhao, M.; Tang, G.; Liu, X.; Li, X. Correlation between spatial pattern characteristics of vegetation and topographic factors based on GIS. Bull. Soil Water Conserv. 2005, 25, 19–23. [Google Scholar]
- Li, D. Evaluation index system and evaluation method of regional economic development. J. Xi’an Univ. Financ. Econ. 2008, 21, 28–32. [Google Scholar]
- Ma, Y.; Zhang, Y.; Zhang, C.; Wang, J. Theory and method of geological disaster risk assessment. J. Geomech. 2004, 10, 7–18. [Google Scholar]
- Duyckaerts, C.; Godefroy, G. Voronoi tessellation to study the numerical density and the spatial distribution of neurons. J. Chem. Neuroanat. 2000, 20, 83–92. [Google Scholar] [CrossRef]
- Wang, Z.; Liu, Q. Spatial heterogeneity characteristics of characteristic villages of ethnic minorities in China and their influencing factors. Econ. Geogr. 2019, 39, 150–158. [Google Scholar]
- He, J.; Zhang, X.; Deng, Z.; Zhang, H.; Zhang, M.; Liu, Y. Spatial distribution characteristics and influencing factors of rural residential areas at multiple scales. China’s Agric. Resour. Reg. Plan. 2019, 40, 8–17. [Google Scholar]
- Zhou, W.; Shi, P. Research progress on flood risk management and preliminary discussion on China’s flood risk management model. J. Nat. Disasters 1999, 8, 62–72. [Google Scholar]
- Tong, Y. A study on the spatial differentiation of traditional villages in China based on GIS. Hum. Geogr. 2014, 29, 44–51. [Google Scholar]


Disclaimer/Publisher’s Note: The statements, opinions and data contained in all publications are solely those of the individual author(s) and contributor(s) and not of MDPI and/or the editor(s). MDPI and/or the editor(s) disclaim responsibility for any injury to people or property resulting from any ideas, methods, instructions or products referred to in the content. |
© 2025 by the authors. Licensee MDPI, Basel, Switzerland. This article is an open access article distributed under the terms and conditions of the Creative Commons Attribution (CC BY) license (https://creativecommons.org/licenses/by/4.0/).