Article

Research on Groundwater Drought and Sustainability in Badain Jaran Desert and Surrounding Areas Based on GRACE Satellite

1
College of Earth and Environmental Sciences, Lanzhou University, Lanzhou 730030, China
2
Center for Glacier and Desert Research, Lanzhou University, Lanzhou 730030, China
3
Scientific Observing Station for Desert and Glacier, Lanzhou University, Lanzhou 730030, China
4
Tourism School, Lanzhou University of Arts and Science, Lanzhou 730030, China
5
Qinghai Province Institute of Meteorological Sciences, Xining 810001, China
*
Author to whom correspondence should be addressed.
Land 2025, 14(1), 173; https://doi.org/10.3390/land14010173
Submission received: 21 December 2024 / Revised: 8 January 2025 / Accepted: 14 January 2025 / Published: 15 January 2025

Abstract

:
Groundwater plays a crucial role in the formation of the Badain Jaran Desert-Sand Dune Lake System, which has been designated a UNESCO World Heritage Site in 2024. However, the region’s wetland ecosystem is significantly impacted by climate change and human activities. This study utilizes GRACE satellite data and in situ observation data to establish a groundwater storage anomaly (GWSA) time series for the Badain Jaran Desert and its surrounding areas (BJDCA) from 2003 to 2022. The analysis reveals the spatiotemporal patterns of groundwater drought and sustainability, as well as the underlying factors affecting regional groundwater sustainability. The results indicate that 99.2% of the study area exhibited a significant decline in GWSA (α ≤ 0.01), with the annual mean GRACE Groundwater Drought Index (GGDI) dropping from 1.44 to −1.54, reflecting a worsening groundwater drought. In 2022, the GGDI in the southeastern part of the BJDCA reached as low as −3.04, highlighting severe groundwater stress. Furthermore, the Sustainability Index (SI) of the study area declined markedly from 1.00 to 0.01, underscoring the critical impact of human activities on groundwater resources in the BJDCA. These findings provide valuable insights for formulating more effective groundwater resource management policies and promoting sustainable development in arid regions.

1. Introduction

Groundwater, as an essential component of water resources, is characterized by its wide distribution, excellent water quality, and low development cost. It serves not only as a crucial source of water supply but also plays a key role in social and economic development, as well as in ecological and environmental protection [1]. The arid regions of northwestern China are typical groundwater-dependent ecosystems, where groundwater resources are a strategic support for the development of the region [2]. This is especially significant for maintaining the unique landscape of sand dunes and lakes in the Badain Jaran Desert (BJD).
In recent years, the tourism industry in the BJD has developed rapidly, becoming an important part of the local economy. However, the construction of tourism infrastructure and the development of tourism products have led to large-scale groundwater extraction in the region [3]. The decrease in groundwater levels and the growing issue of water pollution due to improper water use have become increasingly serious. In the surrounding areas of the BJD, especially in the oasis regions, the development of the economy and the expansion of agricultural irrigation have significantly increased the groundwater demand, further exacerbating the pressure on groundwater resources [4]. Groundwater systems exhibit clear regional characteristics, yet existing studies are largely based on observation stations to analyze groundwater level changes, lacking systematic research on large-scale regional changes. Therefore, it is essential to conduct a continuous monitoring of groundwater storage dynamics at a regional scale in order to reveal the patterns of groundwater variation and to explore the impact of human activities on groundwater resources.
Traditional groundwater storage monitoring technologies primarily estimate groundwater storage by measuring in situ groundwater levels through observation wells [5,6]. However, due to the vast area, sparse population, and uneven distribution of groundwater level observation stations in the Badain Jaran Desert and its surrounding regions (BJDCA), there are significant challenges related to missing or inconsistent data, as well as poor temporal continuity. These issues hinder the accurate understanding of groundwater storage changes in the region. The emergence of remote sensing technology provides new perspectives and tools for large-scale and long-term monitoring. Its characteristics, such as large spatial coverage, continuous observation time, and low cost, effectively compensate for the limitations of traditional groundwater observation methods [7,8]. Among the available remote sensing techniques, the Gravity Recovery and Climate Experiment (GRACE) satellite data have been increasingly used by researchers to monitor groundwater storage, especially at large regional scales. For instance, Rodell et al. [9] and Feng et al. [10] used GRACE data to study groundwater depletion in India and North China, respectively, exploring the impact of agricultural irrigation on groundwater resources. Additionally, Long et al. [11] used GRACE data to monitor the significant reduction in water storage during the 2011 drought in Texas, analyzing the impact of drought on regional water resources. In the case of the BJD, Jiao et al. [12] used GRACE and the Ice, Cloud, and land Elevation Satellite (ICESat) altimetry data to assess the gradual decline in groundwater storage and lake water levels, emphasizing the effects of over-extraction and the insufficient replenishment by climate-driven rainfall increases. This study forms a critical basis for further research on sustainable groundwater management in arid regions like the BJD.
Groundwater drought is a broader form of hydrological drought, primarily characterized by the persistent effects of reduced groundwater recharge or increased extraction [13], which leads to the continuous decline in groundwater levels and a reduction in subterranean runoff [14]. Persistent groundwater drought depletes both surface and groundwater resources, triggering secondary disasters such as land subsidence and soil salinization. As a typical geographic unit in arid regions, deserts rely heavily on groundwater for maintaining their ecological environment. Groundwater not only provides essential water for vegetation but also contributes to the formation of large sand dunes, lakes, and oases [15,16,17,18]. Sustainable groundwater use is essential to mitigate the groundwater challenges faced by arid and semi-arid areas. Compared to hotspot regions, such as the Hexi Corridor and the Heihe River Basin, studies on groundwater changes in the BJDCA are relatively scarce, mainly focusing on dynamic analyses of groundwater levels at observation points [19,20]. There is a lack of large-scale regional studies. The existing research has largely concentrated on groundwater recharge sources and formation mechanisms [21,22], as well as the interaction between groundwater and surface water [16,22], while less attention has been paid to groundwater storage and its variations.
In light of this, this study uses the BJDCA as a case study. By utilizing GRACE terrestrial water storage data, GLDAS hydrological models, and observed groundwater level data, we reconstruct a long-term regional groundwater storage anomaly dataset. We analyze the spatiotemporal evolution of groundwater drought and the sustainability of groundwater resources, exploring the effects of climate factors and human activities on groundwater. This study provides valuable data support for groundwater resource management and sustainable groundwater use in BJDCA, offering significant insights for scientifically guiding regional sustainable development.

2. Materials and Methods

2.1. Study Area

The study area is located between 38°~42° N and 99°~105° E, covering an area of approximately 22.6 × 10⁵ km2 [23]. This region includes the Badain Jaran Desert (BJD), parts of the Hexi Corridor, and the Qilian Mountains (Figure 1). From the BJD to the Qilian Mountains, precipitation increases significantly with elevation, ranging from an average annual precipitation of 40 mm to 400 mm [20,24,25,26,27]. The Heihe and Shiyang Rivers are the main surface water sources in this region, originating from the Qilian Mountains and flowing through the Hexi Corridor. The meltwater from glaciers and snow in the Qilian Mountains, along with precipitation, serve as the primary recharge sources for these rivers. Supported by the water resources from rivers, numerous cities and oases are distributed along the Hexi Corridor, covering five administrative districts: Wuwei, Jinchang, Zhangye, Jiuquan, and Jiayuguan in Gansu Province. The population of this area has increased from 3.98 million in 1985 [28] to 4.40 million in 2020 [29]. Due to the rapid population growth and continuous expansion of cultivated land, the increase in water usage for agriculture and industry has placed significant pressure on local water resources.
The Badain Jaran Desert (39°04′ N~42°12′ N, 99°23′ E~104°34′ E) is located in the western part of Inner Mongolia, China, in the central region of the Alxa Plateau. It covers an area of approximately 5.2 × 10⁴ km2, stretching about 270 km from east to west and 220 km from north to south. It is the fourth largest desert in the world and the second largest in China [30], renowned for its towering sand dunes and numerous lakes. The tallest reaches over 450 m [31], earning it the nickname “The Mount Everest of the World’s Deserts”. The Badain Jaran Desert is home to 110 perennial lakes, 105 of which are located in the interior and southeastern regions [32]. These lakes include both saline and freshwater bodies. The desert has a typical temperate continental desert climate, characterized by extremely low annual precipitation, with a long-term average ranging from 30 to 120 mm. Precipitation decreases from southeast to northwest, while evaporation rates are high, approximately 1400–1500 mm [33], far exceeding the annual rainfall. Due to the arid climate, vegetation is sparse, but drought-tolerant plants, such as nitraria (Nitraria tangutorum) and saxaul (Haloxylon ammodendron), thrive in areas with abundant groundwater, especially around lakes. Desert vegetation form belt-like distributions along the lake shores, and as the distance from the lakes increases, the groundwater depth deepens, leading to a reduction in vegetation cover [23].

2.2. Datasets

2.2.1. GRACE Data

The official GRACE science data system releases monthly solutions from three different processing centers, including the spherical harmonic coefficients (SHC) method and the mass concentration (mascon) solution. This study uses the RL06 GRACE/GRACE-FO Mascon product released by the Center for Space Research (CSR) at the University of Texas [34,35]. This product is characterized by a high resolution, high signal-to-noise ratio, and no need for post-processing [34,36]. Compared to the SHC method, the mascon approach better handles mass leakage and minimizes leakage errors [37,38]. The dataset is available from the Center for Space Research (CSR) at the University of Texas in Austin [39], with a spatial resolution of 0.25° × 0.25°. The study period spans from April 2002 to December 2022, covering 249 months. The missing data due to technical reasons or satellite replacements are interpolated using a Singular Spectrum Analysis (SSA) [40,41].

2.2.2. GLDAS Data

The Global Land Data Assimilation System (GLDAS) integrates ground-based and satellite observation data to provide optimized near-real-time surface state variables [42]. GLDAS utilizes three land surface models (CLM, NOAH, and Mosaic) and the VIC hydrological model. This study uses the shallow surface storage anomalies data (0–200 cm soil moisture anomalies, snow water equivalent anomalies, and canopy water storage anomalies) from the NOAH land surface model in GLDAS, which can be found in the Goddard Earth Sciences Data and Information Services Center (GES DISC) [43]. The time series for shallow surface storage spans from April 2002 to December 2022, with a monthly time resolution and a spatial resolution of 0.25° × 0.25°. To match the GRACE land water storage data, the units of the shallow groundwater storage components in GLDAS are converted to the equivalent water thickness (cm), and anomalies are calculated by subtracting the average values from 2004 to 2009.

2.2.3. In Situ Data

This study uses two sources of observed data to validate the satellite-derived Groundwater Storage Anomaly (GWSA) results. The first source is the China Geological Environmental Monitoring Groundwater Level Yearbook, compiled by the China Geological Environmental Monitoring Institute, which provides published data from 2005 to 2021. The second source is the field station data collected by our research team at the BJD site, with in situ groundwater level monitoring beginning in 2010 and continuing to the present. We conducted a quality check on the data to ensure the continuity of the time series. Monitoring wells with observation periods of less than three years were excluded. Problematic data were identified, and corrections or exclusions were made as necessary.
The temperature and precipitation data utilized in this study were obtained from MAWS-301 meteorological stations (Vaisala, Helsinki, Finland) deployed by our research team in the central Badain Jaran Desert between May 2010 and July 2013. These meteorological stations were equipped with various instruments, including a VRQ101 rain gauge, a QMH102 temperature and humidity sensor, a WAA151 wind speed sensor, among others. The data regarding the population and crop planting area in the counties surrounding the BJD were primarily sourced from the Gansu Statistical Yearbook, with any missing data supplemented from the Zhangye City Statistical Yearbook.

2.3. Methods

2.3.1. Groundwater Storage Estimation

(1)
Water Balance Equation
Terrestrial water storage primarily consists of surface water, snow water equivalent, canopy water, soil moisture, and groundwater. Since changes in biological water storage are smaller in magnitude compared to other components, and because both biological water and surface water are difficult to measure, their variations are generally negligible in arid and semi-arid regions [44,45]. Theoretically, anomalous changes in groundwater storage can be estimated by removing the variations in GLDAS data:
G W S A = T W S A S W E A C W S A S M S A
where TWSA, SWEA, CWSA, SMSA and GWSA represent terrestrial water storage anomaly, snow water equivalent anomaly, canopy water storage anomaly, soil moisture storage anomaly, and groundwater storage anomaly, respectively. The Seasonal-Trend decomposition using LOESS (STL) method [46] was applied to detect anomalies in the GRACE-GLDAS derived GWSA data, and interpolation methods were used to correct these anomalies.
(2)
Water Table Fluctuation Method
The Water Table Fluctuation (WTF) method links groundwater storage changes with groundwater level fluctuations. It utilizes groundwater level data, which are relatively easier to obtain, to represent trends in groundwater storage changes. This method can be applied to monthly data from single observation wells, annual data, or even extrapolated to cover the entire study area [47]. The principle is that groundwater storage anomalies (ΔGWS) are equal to groundwater recharge over a certain time period and can be calculated using the following formula:
Δ G W S = R = S y Δ h  
where R is the groundwater recharge, S y is the specific yield of the aquifer, and Δ h is the change in groundwater head within a specific time interval.
The specific yield of groundwater monitoring wells in the central BJD was derived from the research results of our team [48]. For unmeasured monitoring stations, the average value of the measured wells (0.21) was used. As for the specific yield of groundwater monitoring wells in the surrounding areas of the BJD, it was determined based on the hydrogeological unit of the monitoring well location and referencing the specific yield data for the relatively stable regions of the fluctuation zone from the 2021 and 2022 editions of the Gansu Province Water Resources Bulletin.

2.3.2. Groundwater Drought Evaluation

This study adopts the GRACE Groundwater Drought Index (GGDI) proposed by Thomas et al. [49], which is a standardized, dimensionless drought index. The unique feature of GGDI lies in its ability to assess groundwater drought by incorporating deficits or surpluses in groundwater storage. When GGDI > 0, it indicates a surplus, whereas a value less than 0 signifies a deficit. The formula is as follows:
C i = 1 n i GWSA i n i ,   i = 1 , , 12
G S D i = GWSA i C i
GGDI = G S D t X ¯ G S D S G S D
where C i represents the monthly climate values used to remove the monthly variations affecting groundwater storage; GWSA i denotes the groundwater storage anomaly for month i ; G S D i represents the net deviation in groundwater storage; G S D t is the time series of groundwater storage deviation; and X ¯ G S D and S G S D are the mean and standard deviation of G S D t respectively.

2.3.3. Groundwater Sustainability Evaluation

This study uses a combined approach of the GGDI and the Sustainability Index (SI) to assess the sustainability of groundwater resources in the BJDCA. The SI is a function of three key indicators: reliability (REL), resilience (RES), and vulnerability (VUL) [50]. The relationship is defined as:
S I = R E L × R E S × 1 V U L
Here, REL represents the proportion of time the GGDI is within a reliable range, indicating the historical probability that aquifer storage exceeds normal conditions. RES signifies the likelihood that the GGDI will recover from negative to positive values, representing the potential for the system to transition from an unsatisfactory to a satisfactory state. VUL is defined as the severity and probability of occurrence, referring to both the magnitude of the GGDI value and the probability of its occurrence [51,52]. An extremely unsustainable condition is indicated by 0 ≤ SI ≤ 0.2; 0.2 < SI ≤ 0.3 signifies a severely unsustainable condition; 0.3 < SI ≤ 0.5 indicates a slightly unsustainable condition; 0.5 < SI ≤ 0.75 represents a moderately sustainable condition; and 0.75 < SI ≤ 1 suggests a highly sustainable condition.

3. Results

3.1. Reliability of Satellite Data

This study selected 29 groundwater monitoring stations located within the BDJCA region (Figure 1). These stations spatially overlap with the GRACE-GLDAS data and include a total of 33 groundwater monitoring wells. Notably, some stations have more than one monitoring well. For instance, station N3 includes two monitoring wells (N3-1 and N3-2), while stations N4 and N5 each include three monitoring wells. The credibility of the satellite-derived groundwater storage anomaly (GWSAGRACE) was validated by calculating the correlation coefficient between the GWSAGRACE and the observed GWSA from the monitoring wells (GWSAWTF).
In the 17 monitoring wells located in the oasis areas surrounding the BJD, 12 wells showed a significant positive correlation between GWSAWTF and GWSAGRACE, while 3 wells exhibited a significant negative correlation (Table 1). The maximum correlation coefficient reached 0.720 (p < 0.01). Notably, some unconfined wells (such as N1, N8, N11) exhibited correlation coefficients between 0.5 and 0.7, indicating that the GRACE satellite data can reliably reflect the trend of groundwater changes. However, due to the localized nature of groundwater systems in oasis areas [53], rapid changes in recharge and consumption may occur over short periods, which do not align with the longer time-scale average change data provided by GRACE. In contrast, the recharge and consumption processes in confined aquifer systems are slower and more complex [54], responding less quickly to climatic and precipitation changes compared to unconfined aquifers. Therefore, the gravity field changes observed by the GRACE satellite may primarily reflect changes in surface water bodies or shallow groundwater, with a relatively weaker ability to monitor deep confined aquifers [55].
In the central region of the BJD, among the 16 monitoring wells, 11 exhibited a significant positive correlation (Table 2), while 2 showed a significant negative correlation (Table 2), with the highest correlation coefficient being 0.564 (p < 0.01). The analysis revealed that monitoring wells with a moderate validation accuracy were typically located in grid cells that overlapped with multiple lakes, such as the G4, G10, and G13 wells (corresponding to satellite monitoring grids 184 and 216). Groundwater serves as a primary source of recharge for the lakes in the desert interior [56], and groundwater levels are influenced by the variations in lake water levels. As a result, the spatial representativeness of individual monitoring wells is limited. In grid cells containing multiple lakes, groundwater level fluctuations observed at different wells may differ significantly, leading to discrepancies between the estimated groundwater storage changes derived from GRACE and the actual changes in groundwater storage across the grid. Furthermore, most of the piezometers in the desert interior are situated near lakes, where drought-tolerant vegetation is prevalent and human groundwater extraction is more intensive, which may introduce errors in the GRACE satellite’s ability to capture localized groundwater fluctuations.
When analyzing the groundwater storage anomalies (GWSA) for four in situ monitoring wells (G6, G7, G9, and G11) located in grids 200 and 216, we observed a lagged response of both GWSAGRACE and GWSAWTF to precipitation (Figure 2). Specifically, the groundwater changes recorded by in situ monitoring wells exhibited greater variability compared to satellite-derived results. Notably, although the results from the G7 monitoring well showed a negative correlation with the satellite data, the two datasets exhibited consistent peak alignment. For the G9 monitoring well, a strong correlation was observed between GRACE-216 and WTF-G9 prior to June 2014; however, after this period, groundwater changes recorded by the monitoring well led those observed by the satellite. This phenomenon may be attributed to the higher sensitivity of the monitoring wells to localized groundwater changes.

3.2. Temporal and Spatial Variability of Groundwater Drought

This study employed the Theil-Sen slope estimation method [57] and Mann–Kendall significance test [58] to analyze the monthly variation trends of GWSA in BJDCA from April 2002 to December 2022 (Figure 3). The analysis results indicate that 99.2% of the region experienced a significant negative trend (p < 0.01), clearly signaling a continuous decline in groundwater storage. Notably, the decline was particularly pronounced near the Qilian Mountains and in the southeastern region adjacent to and extending beyond the BJD. Throughout the study area, the rate of change in groundwater storage showed relative uniformity, with the monthly average decline in GWSA concentrated between 0.013 and 0.038 cm. These findings highlight the significant reduction in groundwater storage and its relatively consistent downward trend across spatial scales.
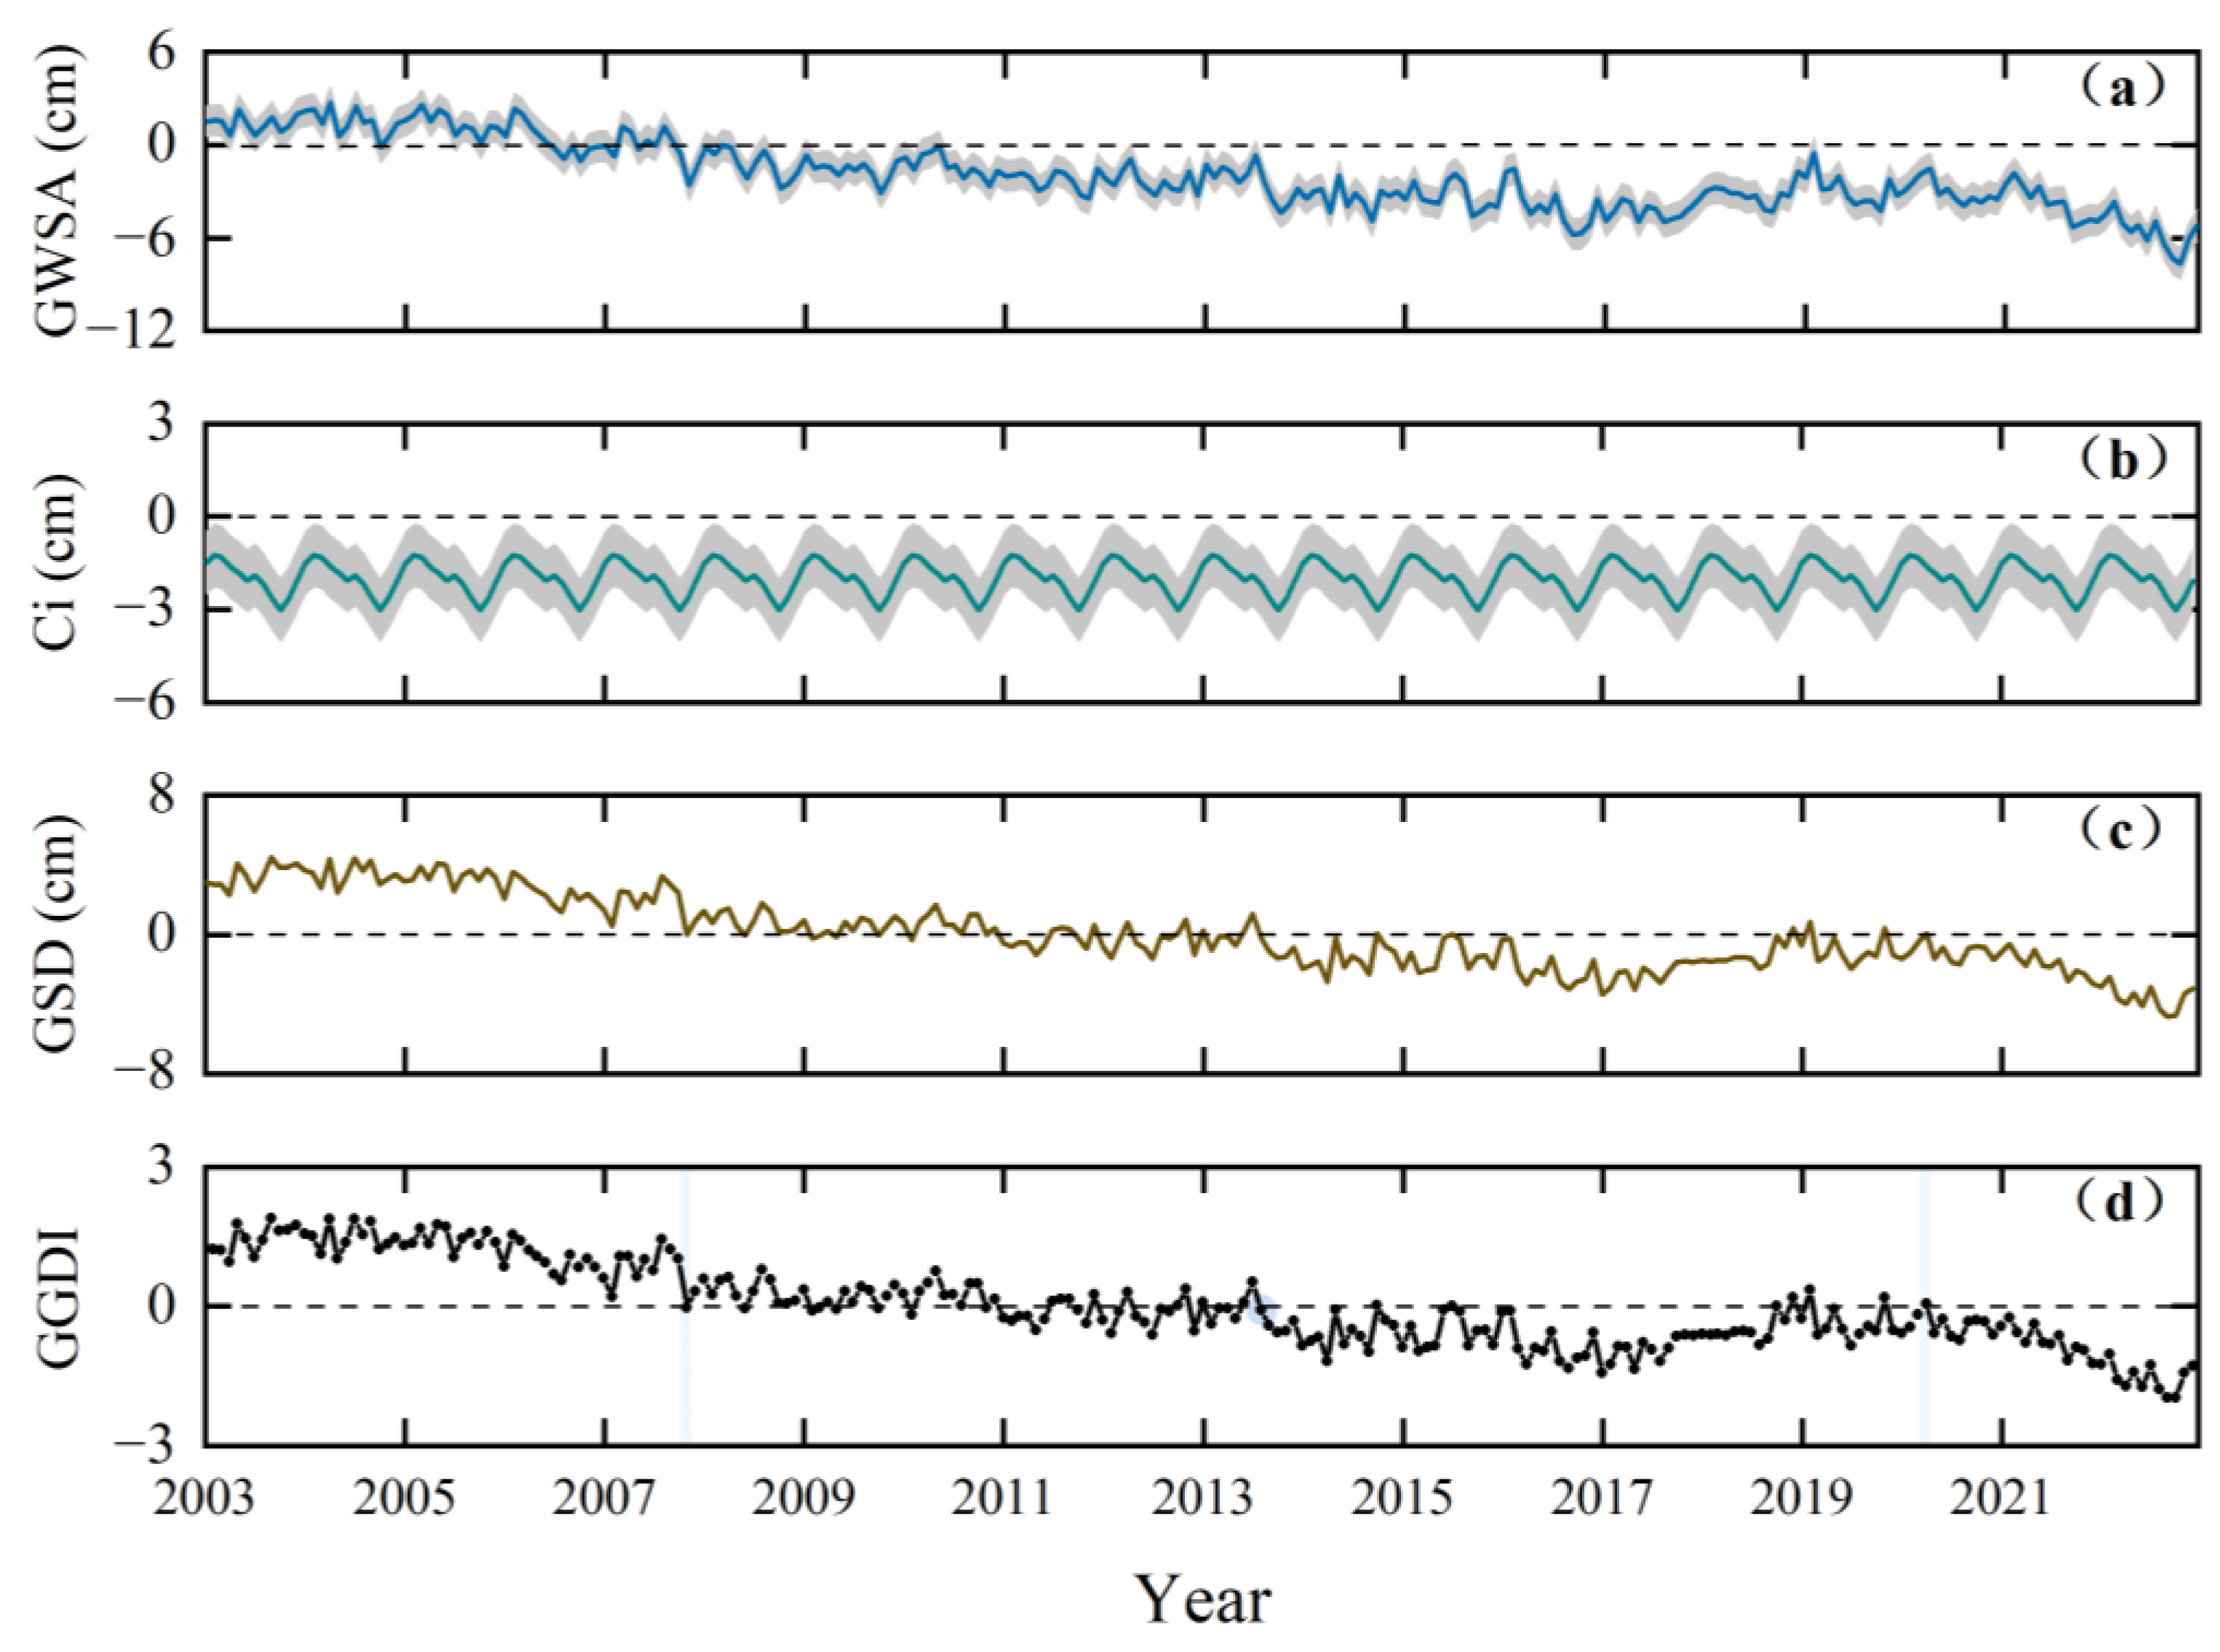
After evaluating the reliability of GRACE data, the GGDI was calculated based on Formulas (3) to (5), with the results shown in Figure 4. The GGDI for BJDCA exhibits a continuous declining trend, indicating an increasingly severe groundwater drought. The annual average GGDI decreased from 1.44 in 2003 to −1.54 in 2022. The changes in groundwater drought across the study area from 2003 to 2022 can be divided into three distinct phases: (1) from January 2003 to November 2007, the GGDI remained above 0 consistently, with the highest value recorded in September 2003 (1.89). During this phase, groundwater storage was largely in surplus and relatively stable. (2) Between November 2007 and April 2020, the GGDI fluctuated around 0, with alternating periods of groundwater surplus and deficit. Notably, after 2014, the GGDI was below 0 for most months, reflecting an intensifying groundwater drought. (3) After April 2020, the GGDI remained persistently below 0 and exhibited a clear declining trend, reaching its lowest value of −1.97 in October 2022.
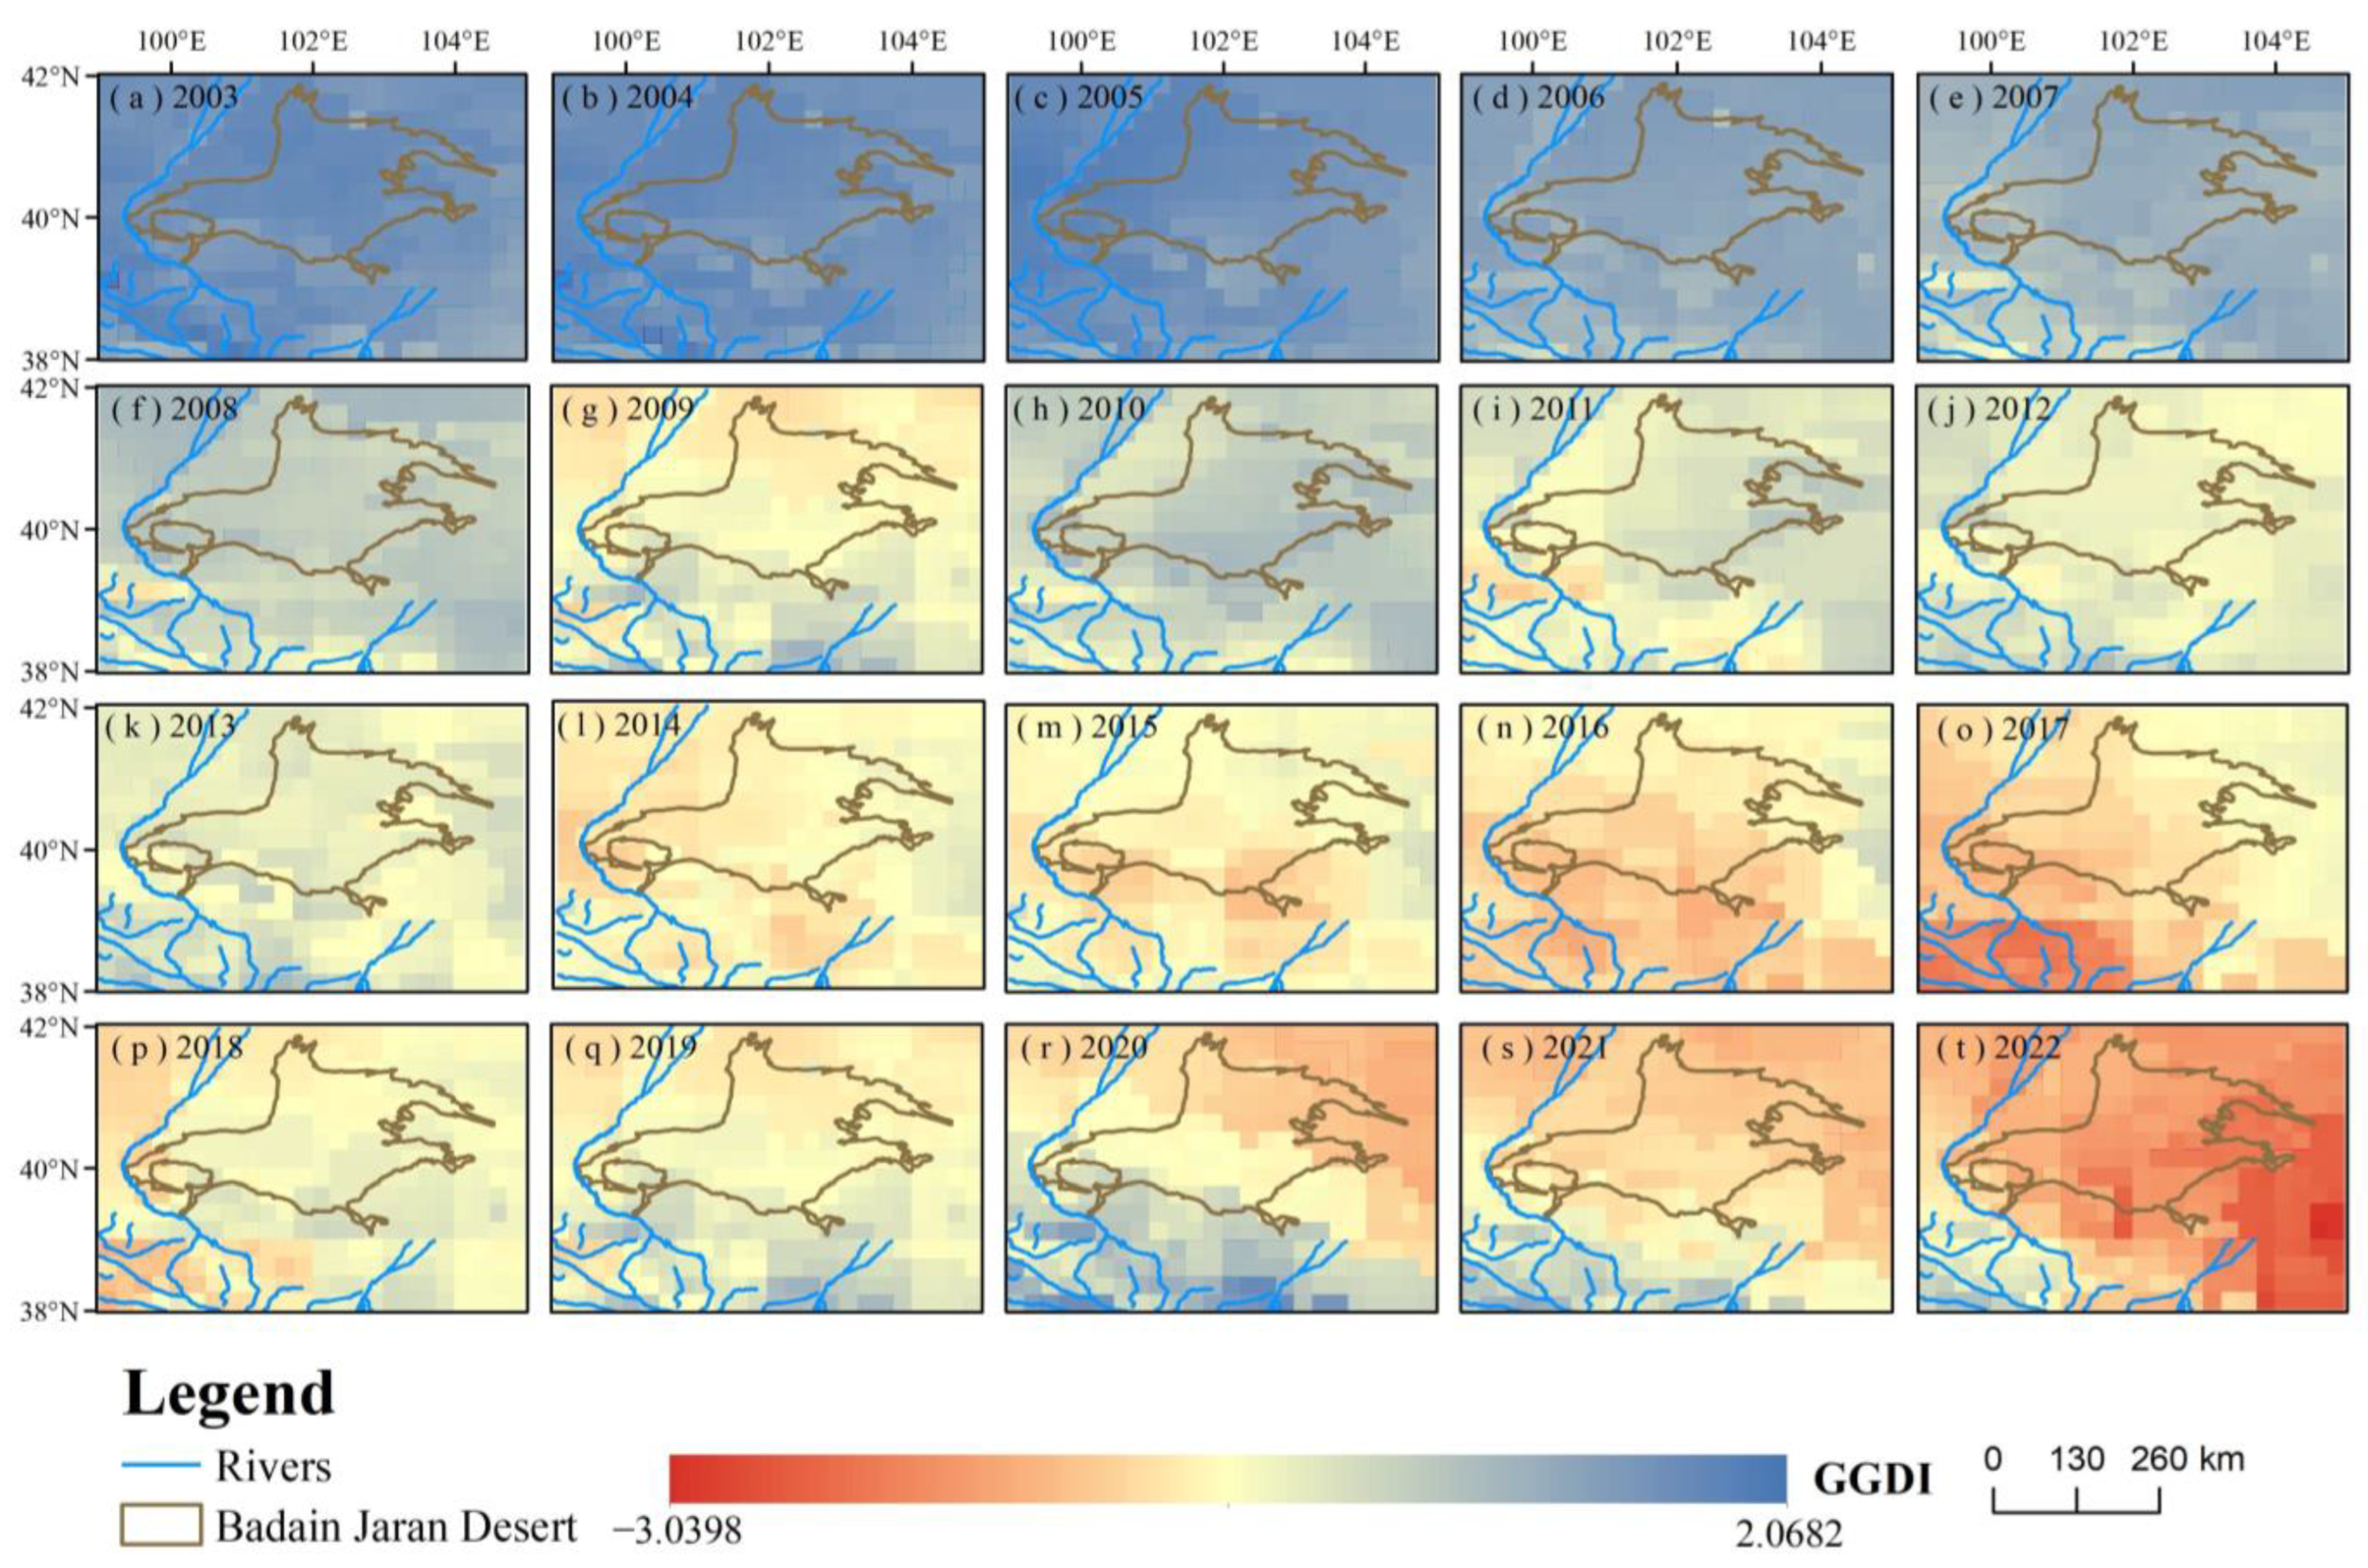
Figure 5 reveals the spatial distribution pattern of the GGDI in BJDCA from 2003 to 2022. The results show that the issue of groundwater depletion has been increasingly severe, with significant spatial heterogeneity in the distribution of GGDI. During the study period, the groundwater drought was mildest in 2004 and 2005, with average GGDI values of 1.48 and 1.46, respectively. In contrast, the most severe groundwater drought occurred in 2022, with an average GGDI value of −1.54, indicating that nearly the entire study area experienced significant groundwater drought. In particular, in 2017, the groundwater drought around the Qilian Mountains was particularly severe. From 2020 to 2022, intensified groundwater drought was observed in areas to the northeast of the Badain Jaran Desert. Notably, in 2022, the groundwater drought in the southeastern part of the Yabulai Mountains and its surrounding areas reached its most critical level (average GGDI = −2.49).
A spatial analysis of the annual GGDI maps illustrates a continuous contraction of areas with higher GGDI values (indicating less severe drought), while the extent of areas with lower GGDI values (indicating more severe drought) has progressively expanded over time. This trend further underscores the deteriorating groundwater drought situation and highlights the urgent challenges regarding groundwater sustainability in the region.

3.3. Groundwater Resource Sustainability Assessment

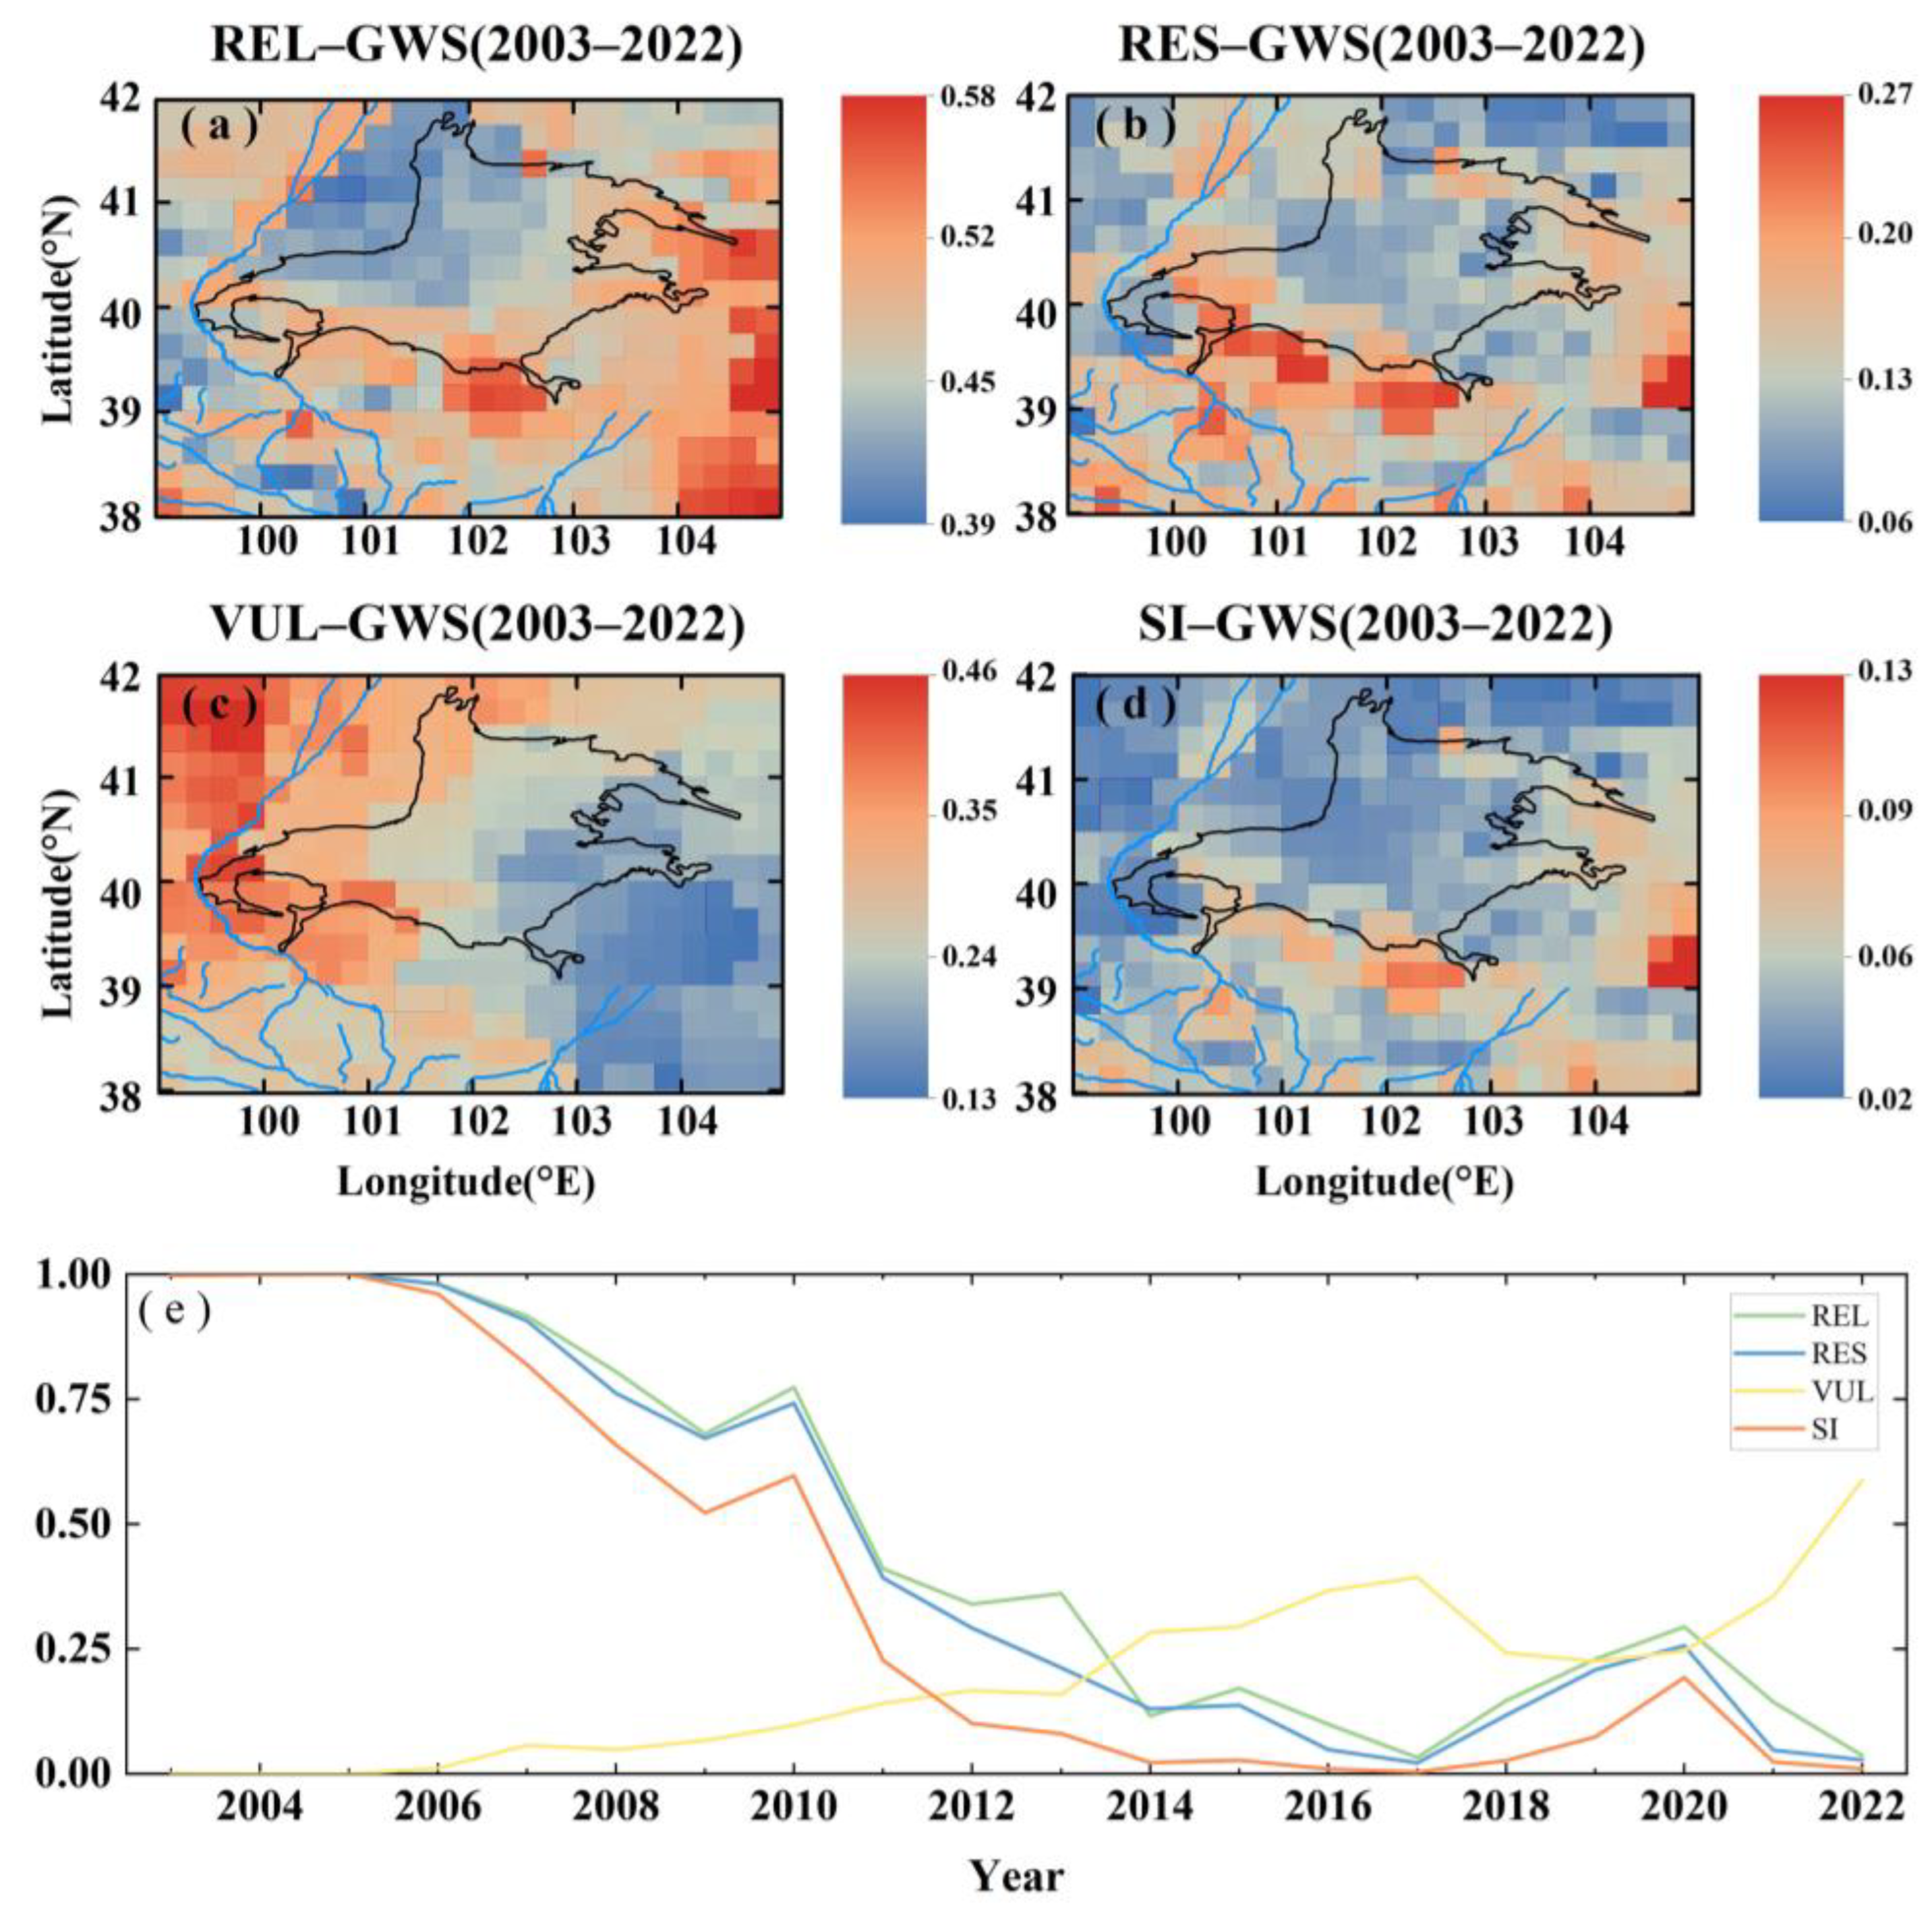
This study assesses the sustainability of groundwater in the BJDCA region from 2003 to 2022 using the GGDI and SI (Figure 6). Specifically, the SI has shown a declining trend since 2005, with a sharp decrease after 2006. Although there were some recoveries in 2010 and during 2018~2020, the overall sustainability of the groundwater system has significantly deteriorated, dropping from a maximum value of 1.00 to a minimum of 0.01 (Figure 6e). Additionally, we analyzed the spatial distribution of groundwater sustainability and found that, throughout the study period, the groundwater system in BJDCA exhibited a widespread extreme unsustainability (Figure 6d). The areas with the lowest SI values are mainly concentrated in the Badain Jaran Desert and the Heihe River Basin, while the Beida Mountain Region shows a relatively higher SI, though it still falls within the extremely unsustainable range. A further analysis of groundwater reliability (Figure 6a), resilience (Figure 6b), and vulnerability (Figure 6c) reveals that the high vulnerability of the groundwater system in the Heihe River Basin is the primary factor contributing to its low SI values, while the relatively higher SI in the Beida Mountain Region is mainly driven by the higher resilience of its groundwater system.
In recent years, two inland river basins in the BJDCA region have implemented water resource management plans. The water resource management plan for the Heihe River basin began in 2000 and has continued throughout the study period; therefore, we focused on the water resource management plan for the Shiyang River basin. Since December 2007, the Shiyang River basin has been continuously implementing and advancing the water resource management plan. We assessed the SI before (2003–2007) and after (2008–2022) the initiation of the plan. The results show that before the plan’s implementation, groundwater development had a moderate sustainability (SI = 0.819). However, after the plan’s initiation, the overall sustainability trend of groundwater did not improve and even worsened (SI = 0.658). This trend aligns with the results observed in the spatial variation map of groundwater drought (Figure 5).

3.4. Potential Influencing Factors on Groundwater Storage

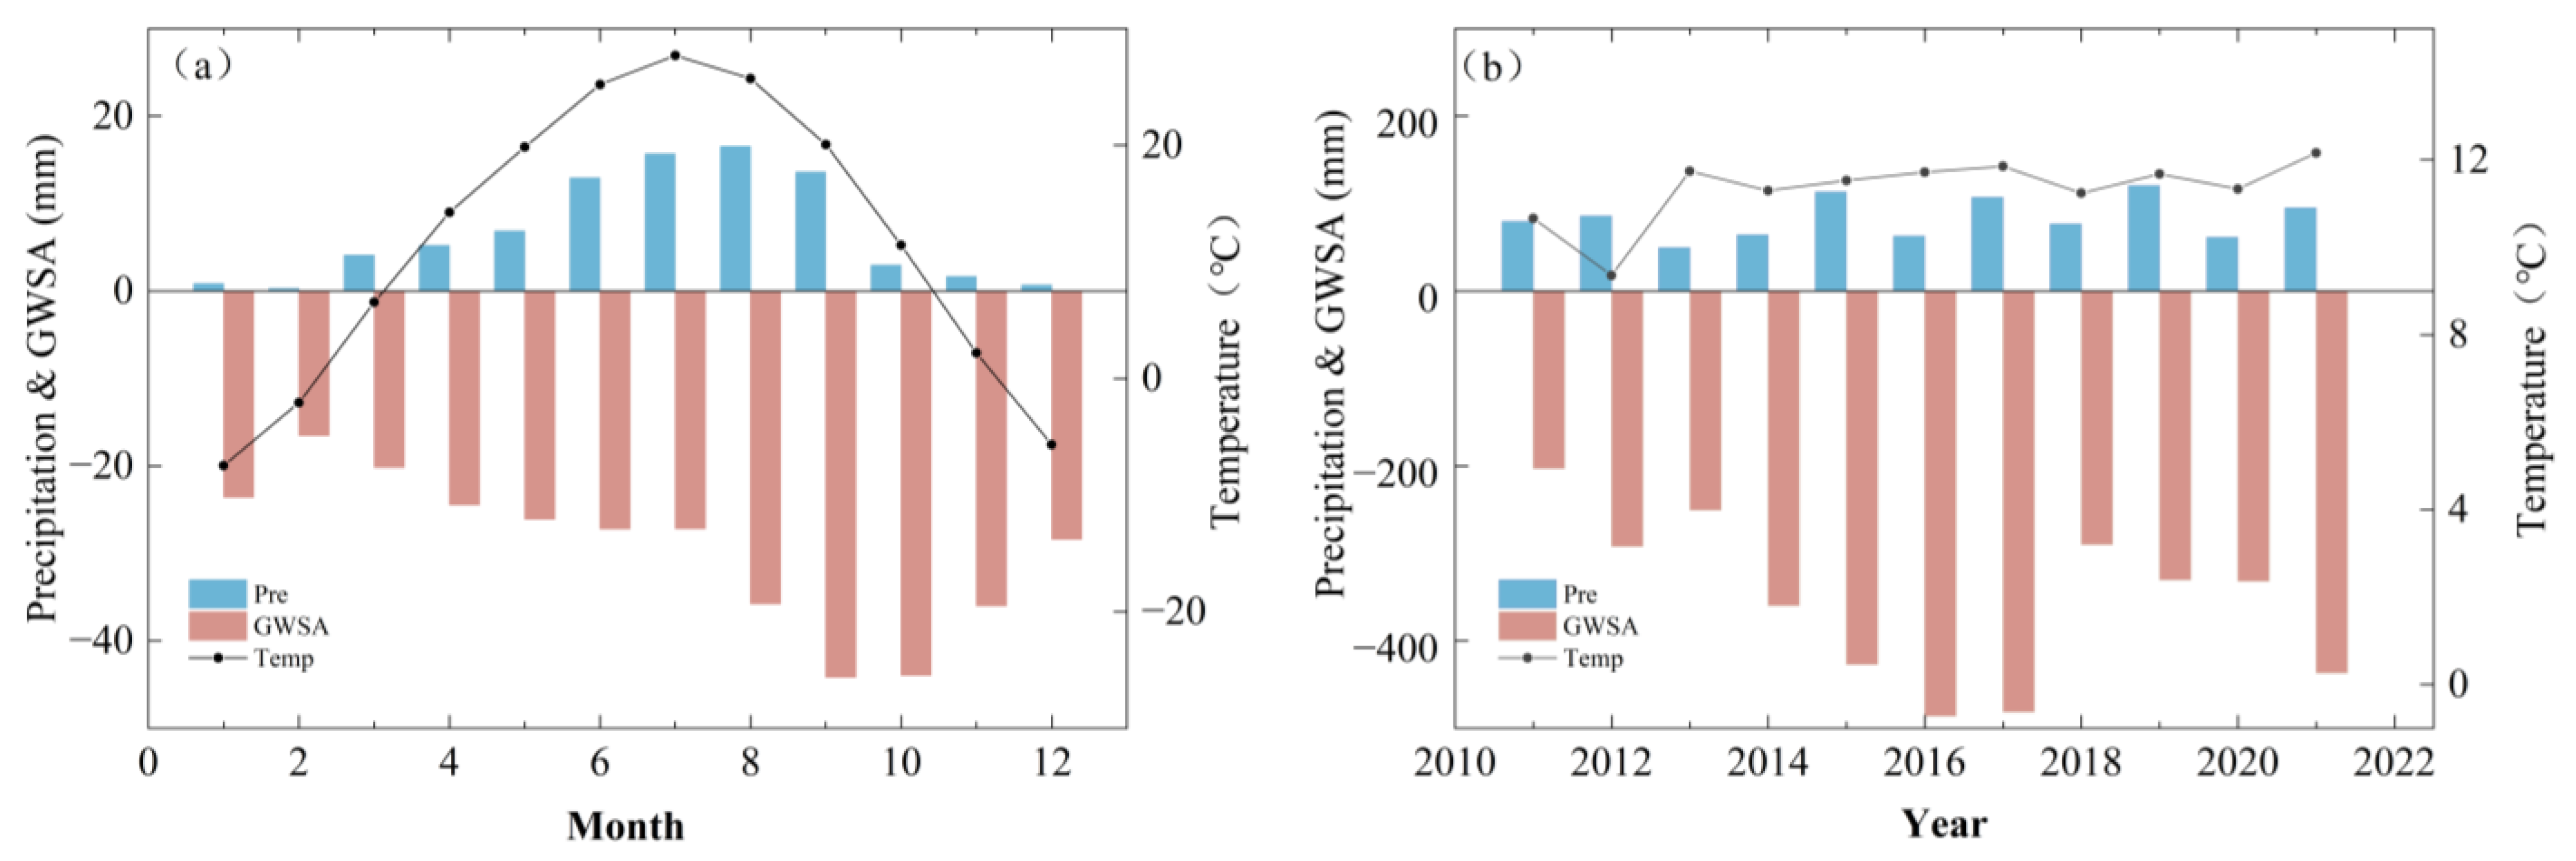
By comparing the relationship between climate factors and GWSA over both intra-annual and inter-annual scales in the BJD region from 2011 to 2021 (Figure 7), we can explore the influence of climate factors on groundwater sustainability. On the intra-annual scale, variations in precipitation and temperature exhibit a generally consistent trend, that is, high in summer and low in winter; yet the changes in GWSA, as derived from satellite-based observations, do not fully align with these patterns. On the inter-annual scale, the inconsistent pattern between GWSA and climate factors suggests that groundwater storage changes are likely influenced by a combination of climatic variability, human activities, and local geological conditions.
Although human activities are typically low and concentrated in a few areas of BJDCA, such activities can have a significant impact on the water cycle over a large area. To evaluate the influence of human activities on GWSA in the area surrounding the BJD, we analyzed the annual trends in total population (in tens of thousands), total cultivated area of crops (CTA, in thousands of hectares), groundwater level (GWL, relative to the recorded level in 2005, in meters), and satellite-monitored grid-based groundwater storage anomalies (GWSA, in centimeters) for six counties from 2000 to 2022 (Figure 8, Table 3). The results reveal significant spatial and temporal variations in the interactions between these factors.
CTA showed a consistently strong negative correlation with GWSA in most counties, indicating agricultural expansion as a major driver of groundwater depletion. Gaotai County had the strongest negative correlation (r = −0.876, p < 0.01), followed by Yongchang County (r = −0.598, p < 0.01) and Linze County (r = −0.626, p < 0.05). In contrast, no significant correlation was found in Minqin County (r = 0.179, p > 0.05), which may indicate effective water management practices or external water supplies mitigating the impact of agricultural activities. The impact of population on GWSA varied across counties. Positive correlations were observed in Gaotai (r = 0.831, p < 0.01) and Linze (r = 0.635, p < 0.01), despite the declining population trends. This may be due to the persistent demand for agricultural irrigation or other forms of water consumption, which offset the effects of population reduction. Conversely, Ganzhou District showed a significant negative correlation between population and GWSA (r = −0.691, p < 0.01), reflecting groundwater depletion due to population growth and increased water demand. Groundwater levels declined consistently across all counties, with reductions ranging from −2.83 m to −6.03 m, aligning with the downward trends in GWSA. These results underscore that agricultural expansion is a dominant driver of groundwater depletion in the region, while population impacts on GWSA are more variable and region-specific.

4. Discussion

4.1. Monitoring Accuracy of GRACE Satellites

In this study, we selected 33 monitoring wells to evaluate the accuracy of satellite-based groundwater monitoring. The results indicate that 23 of the monitoring wells showed a significant positive correlation between the observed GWSA and the satellite-estimated GWSA data, with 9 wells showing a correlation coefficient greater than 0.4. In the areas surrounding BJD, satellite monitoring demonstrated a high accuracy. In contrast, although the accuracy was relatively lower in the interior of BJD, the satellite-estimated GWSA still corresponded well with the observed peak values. This correspondence was evident even in lake regions significantly affected by human activities. The findings of this study provide critical data support for grid-scale research on groundwater drought and sustainability.
During the data collection process, the redeployment of hydrological gauges may cause changes in their positions, resulting in abrupt shifts in the recorded water level data. Additionally, variations in GRACE data versions, auxiliary hydrological datasets (e.g., surface water, soil moisture, and snowmelt), and post-processing methods may influence the results [4]. The spatial resolution of GRACE data and the uneven distribution of in situ groundwater monitoring wells limit their ability to comprehensively represent the study area’s overall conditions [59], potentially introducing biases in correlation analysis. Furthermore, in arid or semi-arid regions, frequent interactions between groundwater, vegetation, soil moisture, and surface water increase uncertainties in satellite-based groundwater storage estimates [60,61].

4.2. Spatiotemporal Variations in Groundwater Drought

From 2003 to 2022, the groundwater storage in BJDCA exhibited a consistent decline, accompanied by increasing groundwater drought, a trend corroborated by existing studies. Wang et al. [4] reported that groundwater storage in the Hexi Corridor has been continuously declining since 2002, with significant fluctuations after 2010, yet the overall trend remained downward. Similarly, Jiao et al. [12] found that both terrestrial water storage (TWS) and groundwater storage in the BJD region showed a decreasing trend from 2003 to 2013. Wang et al. [62], in their study of groundwater depletion patterns in the Alxa Plateau, also pointed out a persistent decline in groundwater storage in the BJD region between 2003 and 2016.
During the study period, groundwater drought in BJDCA displayed two major patterns of spatial expansion (Figure 5). From 2014 to 2017, drought expanded northeastward from the Qilian Mountains, eventually reaching the central region of the BJD. The conditions began to improve in 2018. However, starting in 2020, the drought spread southwestward from the northeastern region of BJD to the upper reaches of the Heihe River. In 2017, the Hexi Corridor experienced the most severe groundwater drought, followed by the interior of the BJD and Ejin Banner. This pattern may be attributed to the Hexi Corridor’s position as an upstream runoff area of the Ejina Basin and as a major groundwater recharge zone of BJD [24]. In 2022, groundwater drought in the BJD eased from southeast to northwest, consistent with the groundwater flow direction proposed by Zhang et al. [63,64], where groundwater flows from east to west and south to north. However, whether groundwater drought strictly follows the flow direction remains to be further investigated.
Under the warming and humidification trend in Northwest China, the evaporation effect in the BJD gradually intensifies from south to north [25], which may partially explain why groundwater drought was more severe in the northern desert than in the south during 2020 and 2021. Over a longer timescale, from 1960 to 2018, the annual mean temperature in the surrounding areas of the BJD increased significantly, while the trend of increasing annual precipitation was not evident. The precipitation in the BJD region exhibits spatial variability, whereas temperature shows almost no spatial difference [65]. This suggests that precipitation is likely the primary factor contributing to the spatial heterogeneity of groundwater drought. Furthermore, regions with river systems can mitigate groundwater drought through surface water recharge, whereas groundwater drought in desert areas, such as the BJD, is more challenging to recover from in the short term. Therefore, it is critical to prioritize the sustainable management of groundwater resources in desert regions lacking surface runoff.

4.3. Impacts of Climate Change and Human Activities on Groundwater

Groundwater is a critical resource for maintaining the ecological environment and supporting human activities in BJDCA. Its sustainability is a key factor influencing the region’s development. Identifying the dominant factors affecting groundwater sustainability is therefore essential. Fundamentally, the main threats to groundwater sustainability stem from changes in groundwater storage caused by climate change and human activities.
The scarcity of precipitation is a key underlying factor contributing to groundwater depletion in BJDCA. Simultaneously, rising temperatures exacerbate evaporation rates, further increasing groundwater resource consumption. In particular, during summer, although precipitation increases, the intense evaporation prevents effective groundwater recharge. The influence of climate factors on groundwater primarily reflects the net effect between precipitation recharge and high-temperature evaporation. Moreover, there is a notable lag effect between precipitation and groundwater recharge, especially in desert regions where precipitation infiltrates slowly into groundwater aquifers, resulting in asynchronous changes between precipitation and groundwater levels [66]. This lag effect underscores the complexity of climatic impacts on groundwater dynamics and highlights the need for further research into the temporal patterns of groundwater recharge in arid environments.
Human activities, particularly agricultural practices, tourism development, and groundwater extraction in recent years, have significantly impacted groundwater storage in BJDCA, further reducing groundwater sustainability. Agricultural irrigation in BJDCA relies heavily on groundwater, particularly during drought seasons. Excessive groundwater extraction has caused consistently low and highly variable groundwater levels in irrigation areas [62]. Zhang et al. [23] observed a significant increase in vegetation greenness, primarily concentrated in areas heavily influenced by human activities, such as farmlands and urban areas, and the vegetation growth trend is attributed to groundwater extraction for artificial irrigation. These findings align with this study’s results, which reveal strong negative correlations between the total sown area of crops (CTA) and GWSA in most counties surrounding the BJD. Gaotai County (r = −0.876, p < 0.01) and Yongchang County (r = −0.598, p < 0.01) exhibited the strongest negative correlations, indicating that agricultural expansion is a dominant driver of groundwater depletion. The substantial increase in the total sown area of crops, with an average growth of 91.1%, has significantly intensified irrigation demands, further exacerbating groundwater depletion. Notably, despite population declines in most counties, the intensified agricultural activities have offset these declines, maintaining or even increasing the pressure on groundwater resources. Combined with the findings in Figure 6, it is evident that the expansion of crop sown areas after 2010 has contributed to the decline in groundwater sustainability. In addition, the feasibility of using satellite data to monitor the impact of large-scale human activities on groundwater storage has also been demonstrated. In recent years, the rapid development of tourism in BJD has driven the construction of infrastructure such as hotels, resorts, and roads. The maintenance and operation of these facilities rely heavily on groundwater resources, leading to a significant non-natural consumption of groundwater. This directly depletes groundwater reserves, further threatening its sustainability. Given the severe water scarcity and increasing desertification in the region, several water management projects have been initiated to mitigate the environmental challenges. However, this study found that the implementation of these measures has had limited success in improving groundwater sustainability in BJDCA.

4.4. Limitations

This study has the following limitations: first, when estimating groundwater changes in BJDCA using satellite methods, the influence of surface water resources from the Heihe River and Shiyang River, as well as lake water resources in the interior of the BJD, was not fully accounted for. Future research could incorporate data, such as ERA5-Land, to deduct these water storage components and further improve the accuracy of the analysis. Secondly, the GGDI at the grid scale was derived from the GWSA time series within each grid, making the selected study period a potential factor influencing the GGDI values. GRACE satellite monitoring began in April 2002, and as the observation time increases in the future, the precision of groundwater drought assessments based on the GGDI is expected to improve. Furthermore, although this study has quantified the impact of human activities (e.g., agricultural practices and population dynamics) on GWSA using statistical correlation analysis, the influence of other natural and anthropogenic drivers remains unquantified. Key factors such as climate variability (e.g., precipitation and evapotranspiration), grazing, tourism development, and urban expansion were not comprehensively assessed. These factors likely interact with groundwater resources in complex ways, and future research should aim to quantify their relative contributions to groundwater sustainability in the BJDCA. Lastly, this study does not address the spatial patterns of surface and groundwater distribution, such as talweg distributions, surface water unloading directions, or groundwater accumulation zones. Addressing these aspects requires high-resolution DEM data and extensive field investigations. However, the currently available data are insufficient to support such analyses. Future studies should incorporate these analyses to enhance the understanding of groundwater conservation in arid regions.

5. Conclusions

This study analyzed the spatiotemporal evolution of groundwater drought and its sustainability in BJDCA over the past 20 years based on GRACE satellite monitoring data. The main conclusions are as follows: (1) during the study period (2003~2022), the satellite-estimated groundwater storage anomaly (GWSA) demonstrated a relatively high level of consistency with the observed water level data in terms of time series, with the highest correlation coefficient reaching 0.720. (2) GWSA showed a general declining trend, with the monthly reductions ranging between 0.013 and 0.038 cm. Groundwater drought has become increasingly severe, with significant spatial heterogeneity in its distribution. The year 2022 recorded the most severe groundwater drought (GGDI = −2.49), with groundwater depletion particularly pronounced in the BJD and its southeastern region. (3) From 2003 to 2022, the overall sustainability of the groundwater system exhibited a downward trend. Recent human activities, particularly the expansion of agricultural cultivation and the rapid development of tourism in the desert interior, have intensified groundwater depletion, thereby adversely affecting the sustainability of the groundwater system.

Author Contributions

Conceptualization, X.L. and N.W.; methodology, X.L.; software, X.L.; validation, X.L. and N.W.; formal analysis, X.L.; investigation, X.L., N.W., Y.W. (Yixin Wang), N.M., Y.W. (Yuchen Wang), B.Q., R.L. and D.Y.; resources, N.W.; data curation, X.L.; writing—original draft preparation, X.L.; writing—review and editing, X.L.; visualization, X.L.; supervision, N.W.; project administration, N.W.; funding acquisition, N.W. All authors have read and agreed to the published version of the manuscript.

Funding

This research was funded by the National Natural Science Foundation of China (Grant No. 42271131).

Data Availability Statement

The data presented in this study are available upon request from the corresponding author. The data are not publicly available due to privacy reasons.

Acknowledgments

The authors sincerely thank Liqiang Zhao for his invaluable support during the field data collection process at the Badain Jaran Desert. Special thanks are extended to Meng Li and Xiaoyang Zhao for their assistance in refining the manuscript’s language and expression. The authors also appreciate Yuanhao Song for his guidance in figure preparation.

Conflicts of Interest

The authors declare no conflicts of interest.

Abbreviations

The following abbreviations are used in this manuscript:
GWSAGroundwater Storage Anomaly
BJDCABadain Jaran Desert and its surrounding areas
BJDBadain Jaran Desert
GGDIGrace Groundwater Drought Index
SISustainability Index

References

  1. Lin, X.; Li, W.; Bai, X.; Han, L.; Ming, D. Spatial variation in groundwater depletion across China under multiple stresses. Front. Environ. Sci. 2022, 10, 1067766. [Google Scholar] [CrossRef]
  2. Ruan, Y.; Wu, X. Evaluation of groundwater sustainability in arid regions of Northwest China based on GRACE and GLDAS. Arid Zone Res. 2022, 39, 787–800. (In Chinese) [Google Scholar]
  3. Xi, H.; Chen, Y.; Zhao, X.; Sindikubwabo, C.; Cheng, W. Safety assessment of fragile environment in Badain Jaran Desert and its surrounding areas based on the DPSIR model. Ecol. Indic. 2023, 146, 109874. [Google Scholar] [CrossRef]
  4. Wang, S.; Liu, H.; Yu, Y.; Zhao, W.; Yang, Q.; Liu, J. Evaluation of groundwater sustainability in the arid Hexi Corridor of Northwestern China, using GRACE, GLDAS and measured groundwater data products. Sci. Total Environ. 2020, 705, 135829. [Google Scholar] [CrossRef] [PubMed]
  5. Rateb, A.; Scanlon, B.R.; Pool, D.R.; Sun, A.; Zhang, Z.; Chen, J.; Clark, B.; Faunt, C.C.; Haugh, C.J.; Hill, M.; et al. Comparison of groundwater storage changes from GRACE satellites with monitoring and modeling of major U.S. aquifers. Water Resour. Res. 2020, 56, e2020WR027556. [Google Scholar] [CrossRef]
  6. Bhanja, S.N.; Mukherjee, A.; Saha, D.; Velicogna, I.; Famiglietti, J.S. Validation of GRACE-based groundwater storage anomaly using in-situ groundwater level measurements in India. J. Hydrol. 2016, 543, 729–738. [Google Scholar] [CrossRef]
  7. Upadhyay, S.; Shrestha, S.; Loc, H.H.; Mohanasundaram, S.; Dhungana, S.; Lim, S.; Tangdamrongsub, N. Satellite-based estimates of declining groundwater storage in the transboundary Cambodia-Mekong River Delta Aquifer of the Lower Mekong region, Southeast Asia. Hydrogeol. J. 2024, 32, 601–619. [Google Scholar] [CrossRef]
  8. Ali, S.; Wang, Q.; Liu, D.; Fu, Q.; Mafuzur Rahaman, M.; Abrar Faiz, M.; Cheema, J.M. Estimation of spatio-temporal groundwater storage variations in the Lower Transboundary Indus Basin using GRACE satellite. J. Hydrol. 2022, 605, 127315. [Google Scholar] [CrossRef]
  9. Rodell, M.; Velicogna, I.; Famiglietti, J.S. Satellite-based estimates of groundwater depletion in India. Nature 2009, 460, 999–1002. [Google Scholar] [CrossRef] [PubMed]
  10. Feng, W.; Zhong, M.; Lemoine, J.M.; Biancale, R.; Hsu, H.T.; Xia, J. Evaluation of groundwater depletion in North China using the Gravity Recovery and Climate Experiment (GRACE) data and ground-based measurements. Water Resour. Res. 2013, 49, 2110–2118. [Google Scholar] [CrossRef]
  11. Long, D.; Scanlon, B.R.; Longuevergne, L.; Sun, A.Y.; Fernando, D.N.; Save, H. GRACE satellite monitoring of large depletion in water storage in response to the 2011 drought in Texas. Geophys. Res. Lett. 2013, 40, 3395–3401. [Google Scholar] [CrossRef]
  12. Jiao, J.J.; Zhang, X.; Wang, X. Satellite-based estimates of groundwater depletion in the Badain Jaran Desert, China. Sci. Rep. 2015, 5, 8960. [Google Scholar] [CrossRef] [PubMed]
  13. Mishra, A.K.; Singh, V.P. A review of drought concepts. J. Hydrol. 2010, 391, 202–216. [Google Scholar] [CrossRef]
  14. Bloomfield, J.P.; Marchant, B.P.; Bricker, S.H.; Morgan, R.B. Regional analysis of groundwater droughts using hydrograph classification. Hydrol. Earth Syst. Sci. 2015, 19, 4327–4344. [Google Scholar] [CrossRef]
  15. Wang, N.; Ning, K.; Li, Z.; Wang, Y.; Jia, P.; Ma, L. Holocene high lake levels and pan-lake period on Badain Jaran Desert. Sci. China Earth Sci. 2016, 59, 1633–1641. [Google Scholar] [CrossRef]
  16. Zhang, H.; Ming, Q. Hydrology and Lake Evolution in the Hyper-Arid Northwest of China and the Formation of Megadunes in the Badain Jaran Desert. Adv. Earth Sci. 2006, 21, 532–538. (In Chinese) [Google Scholar] [CrossRef]
  17. Yang, X.; Williams, M.A.J. The ion chemistry of lakes and late Holocene desiccation in the Badain Jaran Desert, Inner Mongolia, China. Catena 2003, 51, 45–60. [Google Scholar] [CrossRef]
  18. Dong, Z.; Wang, T.; Wang, X. Geomorphology of the megadunes in the Badain Jaran Desert. Geomorphology 2004, 60, 191–203. [Google Scholar] [CrossRef]
  19. Zhang, W.; Wang, N.; Yu, X.; Zhenmin, N.; Liqiang, Z. Groundwater evaporation estimation based on groundwater dynamics and empirical models: A case study of Sumujilin Lake, Badain Jaran Desert. Arid Zone Res. 2020, 37, 1215–1222. (In Chinese) [Google Scholar] [CrossRef]
  20. Ma, N.; Wang, N.; Zhao, L.; Zhang, Z.; Dong, C.; Shen, S. Observation of mega-dune evaporation after various rain events in the hinterland of Badain Jaran Desert, China. Chin. Sci. Bull. 2014, 59, 175–182. [Google Scholar] [CrossRef]
  21. Chen, J.S.; Zhao, X.; Sheng, X.F.; Wang, J.Y.; Gu, W.Z.; Chen, L. Geochemical Information Indicating the Water Recharge to Lakes and Immovable Megadunes in the Badain Jaran Desert. Acta Geol. Sin. Engl. Ed. 2005, 79, 540–546. [Google Scholar] [CrossRef]
  22. Jin, K.; Rao, W.; Zhang, W.; Zheng, F.; Wang, S. Strontium isotopic and hydrochemical characteristics of shallow groundwater and lake water in the Badain Jaran Desert, North China. Isot. Environ. Health Stud. 2021, 57, 516–534. [Google Scholar] [CrossRef] [PubMed]
  23. Zhang, X.; Wang, N.; Xie, Z.; Ma, X.; Huete, A. Water loss due to increasing planted vegetation over the Badain Jaran Desert, China. Remote Sens. 2018, 10, 134. [Google Scholar] [CrossRef]
  24. Zhang, H.C.; Chang, F.Q.; Chen, G.J.; Zhen, Q.; Cai, Y.F.; Li, H. Human impact on climate and eco-hydrological systems in the Badain Fijaran desert in northwest China. E3 J. Environ. Res Manag. 2013, 4, 310–317. [Google Scholar]
  25. Jin, K.; Rao, W.; Wang, S.; Zhang, W.; Zheng, F.; Li, T.; Lu, Y.; Zhang, Q. Stable isotopes (δ18o and δ2h) and chemical characteristics of soil solution in the unsaturated zone of an arid desert. J. Radioanal. Nucl. Chem. 2021, 330, 367–380. [Google Scholar] [CrossRef]
  26. Chen, R.; Han, C.; Liu, J.; Yang, Y.; Liu, Z.; Wang, L.; Kang, E. Maximum precipitation altitude on the northern flank of the Qilian Mountains, northwest China. Hydrol. Res. 2018, 49, 1696–1710. [Google Scholar] [CrossRef]
  27. Geng, H.; Pan, B.; Huang, B.; Cao, B.; Gao, H. The spatial distribution of precipitation and topography in the Qilian Shan Mountains, northeastern Tibetan Plateau. Geomorphology 2017, 297, 43–54. [Google Scholar] [CrossRef]
  28. Gansu Provincial Bureau of Statistics. Population and Labor. In Gansu Statistical Yearbook 1985; China Statistics Press: Beijing, China, 1987; pp. 43–84. [Google Scholar]
  29. Gansu Provincial Bureau of Statistics; National Bureau of Statistics Gansu Survey Team. Population. In Gansu Development Yearbook 2020; China Statistics Press: Beijing, China, 2021; pp. 300–320. [Google Scholar]
  30. Zhu, J.; Wang, N.; Chen, H.; Dong, C.; Zhang, H. Study on the boundary and the area of Badain Jaran Desert based on remote sensing imagery. Prog. Geogr. 2010, 29, 1087–1094. (In Chinese) [Google Scholar]
  31. Niu, Z.; Wang, N.A.; Meng, N.; Liu, J.; Liang, X.; Cheng, H.; Liang, X. Contribution of lake-dune patterning to the dune height of mega-dunes in the Badain Jaran sand sea, Northern China. Remote Sens. 2021, 13, 4915. [Google Scholar] [CrossRef]
  32. Zhang, Z. Study on the Area Changes of Lakes and Their Driving Factors in the Badain Jaran Desert Based on Remote Sensing Data. Master’s Thesis, Lanzhou University, Lanzhou, China, 2014. (In Chinese). [Google Scholar]
  33. Niu, Z. Mechanism and Evolutionary Simulation of Mega-Dunes in the Badain Jaran Desert. Master’s Thesis, Lanzhou University, Lanzhou, China, 2022. (In Chinese). [Google Scholar]
  34. Save, H.; Bettadpur, S.; Tapley, B.D. High-resolution CSR GRACE RL05 mascons. J. Geophys. Res. Solid Earth 2016, 121, 7547–7569. [Google Scholar] [CrossRef]
  35. Save, H. CSR GRACE and GRACE-FO RL06 Mascon Solutions v02; University of Texas at Austin: Austin, TX, USA, 2020. [Google Scholar]
  36. Watkins, M.M.; Wiese, D.N.; Yuan, D.; Boening, C.; Landerer, F.W. Improved methods for observing Earth’s time variable mass distribution with GRACE using spherical cap mascons. J. Geophys. Res. Solid Earth 2015, 120, 2648–2671. [Google Scholar] [CrossRef]
  37. Chen, H.; Zhang, W.; Nie, N.; Guo, Y. Long-term groundwater storage variations estimated in the Songhua River Basin by using GRACE products, land surface models, and in-situ observations. Sci. Total Environ. 2019, 649, 372–387. [Google Scholar] [CrossRef]
  38. Su, Y.; Guo, B.; Zhou, Z.; Zhong, Y.; Min, L. Spatio-temporal variations in groundwater revealed by GRACE and its driving factors in the Huang-Huai-Hai Plain, China. Sensors 2020, 20, 922. [Google Scholar] [CrossRef]
  39. Center for Space Research (CSR). GRACE RL06 Mascons. Available online: https://www2.csr.utexas.edu/grace/RL06_mascons.html (accessed on 5 March 2024).
  40. Vautard, R.; Yiou, P.; Ghil, M. Singular-spectrum analysis: A toolkit for short, noisy chaotic signals. Phys. D Nonlinear Phenom. 1992, 58, 95–126. [Google Scholar] [CrossRef]
  41. Kondrashov, D.; Ghil, M. Spatio-temporal filling of missing points in geophysical data sets. Nonlinear Process. Geophys. 2006, 13, 151–159. [Google Scholar] [CrossRef]
  42. Rodell, M.; Houser, P.R.; Jambor, U.E.A.; Gottschalck, J.; Mitchell, K.; Meng, C.J.; Toll, D. The global land data assimilation system. Bull. Am. Meteorol. Soc. 2004, 85, 381–394. [Google Scholar] [CrossRef]
  43. Global Land Data Assimilation Systems (GLDAS). Goddard Earth Sciences Data and Information Services Center (GES DISC). Available online: https://disc.gsfc.nasa.gov/datasets (accessed on 5 July 2023).
  44. Rodell, M.; Chao, B.F.; Au, A.Y.; Kimball, J.S.; McDonald, K.C. Global biomass variation and its geodynamic effects: 1982–1998. Earth Interact. 2005, 9, 305–319. [Google Scholar] [CrossRef]
  45. Wang, F.; Wang, Z.; Yang, H.; Di, D.; Zhao, Y.; Liang, Q. Utilizing GRACE-based groundwater drought index for drought characterization and teleconnection factors analysis in the North China Plain. J. Hydrol. 2020, 585, 124849. [Google Scholar] [CrossRef]
  46. Cleveland, R.B.; Cleveland, W.S.; Mcrae, J.E.; Terpenning, I. STL: A seasonal-trend decomposition procedure based on LOESS. J. Off. Stat. 1990, 6, 3–73. [Google Scholar]
  47. Henry, C.M.; Allen, D.M.; Huang, J. Groundwater storage variability and annual recharge using well-hydrograph and GRACE satellite data. Hydrogeol. J. 2011, 19, 741–755. [Google Scholar] [CrossRef]
  48. Zhang, W.; Zhao, L.; Yu, X.; Zhang, L.; Wang, N. Estimation of groundwater evapotranspiration using diurnal groundwater level fluctuations under three vegetation covers at the hinterland of the Badain Jaran Desert. Adv. Meteorol. 2020, 2020, 8478140. [Google Scholar] [CrossRef]
  49. Thomas, B.F.; Famiglietti, J.S.; Landerer, F.W.; Wiese, D.N.; Molotch, N.P.; Argus, D.F. GRACE groundwater drought index: Evaluation of California Central Valley groundwater drought. Remote Sens. Environ. 2017, 198, 384–392. [Google Scholar] [CrossRef]
  50. Loucks, D.P. Quantifying trends in system sustainability. Hydrol. Sci. J. 1997, 42, 513–530. [Google Scholar] [CrossRef]
  51. Thomas, B.F.; Caineta, J.; Nanteza, J. Global assessment of groundwater sustainability based on storage anomalies. Geophys. Res. Lett. 2017, 44, 11445–11455. [Google Scholar] [CrossRef]
  52. Hashimoto, T.; Stedinger, J.R.; Loucks, D.P. Reliability, resiliency, and vulnerability criteria for water resource system performance evaluation. Water Resour. Res. 1982, 18, 14–20. [Google Scholar] [CrossRef]
  53. Liu, M.; Jiang, Y.; Xu, X.; Huang, Q.; Huo, Z.; Huang, G. Long-term groundwater dynamics affected by intense agricultural activities in oasis areas of arid inland river basins, Northwest China. Agric. Water Manag. 2018, 203, 37–52. [Google Scholar] [CrossRef]
  54. Palma Nava, A.; González Villarreal, F.J.; Mendoza Mata, A. The development of a managed aquifer recharge project with recycled water for Chihuahua, Mexico. Sustain. Water Resour. Manag. 2018, 4, 371–382. [Google Scholar] [CrossRef]
  55. Scanlon, B.R.; Jolly, I.; Sophocleous, M.; Zhang, L. Global impacts of conversions from natural to agricultural ecosystems on water resources: Quantity versus quality. Water Resour. Res. 2007, 43, W03437. [Google Scholar] [CrossRef]
  56. Yu, X. Study on the dynamic characteristics and recharge sources of water levels in the Badain Jaran Desert lakes region. Master’s Thesis, Lanzhou University, Lanzhou, China, 2020. (In Chinese). [Google Scholar]
  57. Sen, P.K. Estimates of regression coefficient based on Kendall’s tau. J. Am. Stat. Assoc. 1968, 63, 1379–1389. [Google Scholar] [CrossRef]
  58. Mann, H.B. Nonparametric tests against trend. Econometrica 1945, 13, 245–259. [Google Scholar] [CrossRef]
  59. Guo, Y.; Gan, F.; Yan, B.; Bai, J.; Wang, F.; Jiang, R.; Xing, N.; Liu, Q. Evaluation of groundwater storage depletion using GRACE/GRACE Follow-On data with land surface models and its driving factors in Haihe River Basin, China. Sustainability 2022, 14, 1108. [Google Scholar] [CrossRef]
  60. Shamsudduha, M.; Taylor, R.G. Groundwater storage dynamics in the world’s large aquifer systems from GRACE: Uncertainty and role of extreme precipitation. Earth Syst. Dyn. 2020, 11, 755–774. [Google Scholar] [CrossRef]
  61. Shao, F.; Wang, W.; He, J. Groundwater–surface water exchange and spatial distribution of arsenic in arid and semi-arid regions: The case of Aksu River in Xinjiang, Northwestern China. Water 2023, 15, 2391. [Google Scholar] [CrossRef]
  62. Wang, T.Y.; Wang, P.; Zhang, Y.C.; Yu, J.J.; Du, C.Y.; Fang, Y.H. Contrasting groundwater depletion patterns induced by anthropogenic and climate-driven factors on Alxa Plateau, Northwestern China. J. Hydrol. 2019, 576, 262–272. [Google Scholar] [CrossRef]
  63. Zhang, J.; Wang, X.; Hu, X.; Lu, H.; Gong, Y.; Wan, L. Macroscopic characteristics of groundwater flow in the Badain Jaran Desert. J. Desert Res. 2015, 35, 774–782. (In Chinese) [Google Scholar]
  64. Zhang, J.; Wang, X.; Jia, F.; Li, G.; Dong, Y. New insights into groundwater flow direction in western Alxa, Inner Mongolia. Geosci. Front. 2015, 29, 213–219. (In Chinese) [Google Scholar]
  65. Ning, W.; Liu, X.; Wang, Z. Characteristics and spatial stratification heterogeneity of temperature and precipitation in the Badain Jaran Desert. J. Univ. Chin. Acad. Sci. 2021, 38, 103–113. (In Chinese) [Google Scholar]
  66. Scanlon, B.R.; Keese, K.E.; Flint, A.L.; Flint, L.E.; Gaye, C.B.; Edmunds, W.M.; Simmers, I. Global synthesis of groundwater recharge in semiarid and arid regions. Hydrol. Process. 2006, 20, 3335–3370. [Google Scholar] [CrossRef]
Figure 1. Location of the study area and the counties. The spatial distribution of the groundwater monitoring stations is presented as points on the map.
Land 14 00173 g001
Figure 2. Temporal variation in monthly average precipitation, satellite-derived groundwater storage anomalies (GWSAGRACE), and measured groundwater storage anomalies (GWSAWTF). Note: to facilitate comparison, the selected satellite monitoring period covers the longest available duration of precipitation and measured groundwater data, with different monitoring wells starting at different times.
Land 14 00173 g002
Figure 3. Spatial pattern of GWSA from April 2002 to December 2022.
Land 14 00173 g003
Figure 4. Calculation of GGDI for the BJDCA; gray shading represents uncertainty, and blue shading denotes phase divisions. (a) Groundwater storage anomaly (GWSA); (b) monthly climate values (Ci); (c) groundwater storage deviation (GSD); and (d) GRACE Groundwater Drought Index (GGDI).
Land 14 00173 g004
Figure 5. Spatial distribution characteristics of groundwater drought from 2003 to 2022, with red and blue denoting areas of severe and mild groundwater drought, respectively.
Land 14 00173 g005
Figure 6. Groundwater storage reliability (a), resilience (b), vulnerability (c), and groundwater sustainability (d,e) of the BJDCA with a spatial resolution of 0.25° × 0.25°.
Land 14 00173 g006
Figure 7. Changes in temperature, precipitation, and groundwater storage in the Badain Jaran Desert interior from 2011 to 2021. (a) Intra-annual variation in climate factors and groundwater storage anomaly (GWSA); and (b) inter-annual variation in climate factors and groundwater storage anomaly (GWSA).
Land 14 00173 g007
Figure 8. Total population (diamonds), total crop planting area (squares), groundwater level changes (triangles), and satellite-based GWSA changes (dots) in six counties and districts surrounding the BJD from 2000 to 2022: (a) Gaotai County; (b) Linze County; (c) Ganzhou District; (d) Minle County; (e) Yongchang County; and (f) Minqin County. Different colors represent different monitoring wells or grids.
Land 14 00173 g008
Table 1. Correlation between GWSAWTF and GWSAGRACE around the BJD.
Monitoring WellSatellite GridMonitoring
Depth (m)
Ground
Elevation (m)
Groundwater TypeCorrelation Coefficient
N13831.79~75.851425.04Unconfined0.720 **
N2540.78~22.321343.36Unconfined0.576 **
N3-16918.60~50.991450.99Confined−0.216 **
N3-2693.60~12.491450.92Unconfined−0.323 **
N4-17083.10~139.001388.90Confined0.420 **
N4-27021.00~80.801389.29Confined0.321 **
N4-3701.72~15.001389.43Unconfined0.332 **
N5-184138.43~185.001482.26Confined0.257 **
N5-28420.00~100.181482.26Confined0.286 **
N5-3840.43~11.561481.93Unconfined0.440 **
N6848.21~31.231481.87Unconfined−0.051
N78533.86~100.511472.54Unconfined0.344 **
N8115218.03~300.112032.06Unconfined0.574 **
N922511.15~12.701511.8Unconfined0.097
N102422.46~28.991441.37Unconfined0.362 **
N1127621.83~25.481320.99Unconfined0.653 **
N12293131.00~282.241312.75Confined−0.456 **
Note: ** indicates that the result passed the 99% significance test; “_” indicates no correlation.
Table 2. Correlation between GWSAWTF and GWSAGRACE in the BJD hinterland.
Monitoring WellSatellite GridGround
Elevation (m)
Monitoring PeriodCorrelation
Coefficient
G11521072.80282012.08~2019.040.347 **
G21681084.51192013.07~2022.060.373 **
G31841095.17062013.07~2020.080.355 **
G41841095.60292013.07~2018.070.012
G51991155.33452013.07~2019.040.363 **
G62001100.2682011.05~2022.060.417 **
G72001099.41172010.08~2020.08−0.316 **
G82011096.4982011.05~2019.040.236 *
G92161109.89632010.08~2020.08−0.456 **
G102161122.72392011.05~2016.060.097
G112161134.22422011.05~2022.060.271 **
G122161127.26722011.05~2011.100.306 **
G132161127.51892011.05~2020.080.163
G142161133.10192011.05~2020.080.284 **
G152311248.67332010.08~2020.080.564 **
G162321154.59362010.08~2020.080.409 **
Note: * and ** indicate that the results have passed the 95% and 99% significance tests, respectively; “_” indicates that some years are missing; and “‗” indicates not relevant.
Table 3. Correlations between human activity indicators and GWSA.
IndicatorGaotai CountyLinze CountyGanzhou DistrictMinle CountyYongchang CountyMinqin County
Population0.831 **0.635 **−0.691 **0.544 *0.4420.774 **
CTA−0.876 **−0.626 *−0.503 *−0.510 *−0.598 **0.179
Note: * and ** indicate that the results have passed the 95% and 99% significance tests.
Disclaimer/Publisher’s Note: The statements, opinions and data contained in all publications are solely those of the individual author(s) and contributor(s) and not of MDPI and/or the editor(s). MDPI and/or the editor(s) disclaim responsibility for any injury to people or property resulting from any ideas, methods, instructions or products referred to in the content.