Article

Effect of Weathering on Cd Mobilization in Different Sedimentary Bedrock Soils

1
Kunming General Survey of Natural Resources Center, Kunming 650506, China
2
Hubei Key Laboratory of Critical Zone Evolution, School of Earth Sciences, China University of Geosciences, Wuhan 430074, China
3
Southwest Mountain Ecological Geological Evolution and Conservation and Restoration Innovation Base, Kunming 650100, China
*
Author to whom correspondence should be addressed.
Land 2025, 14(1), 176; https://doi.org/10.3390/land14010176
Submission received: 4 December 2024 / Revised: 3 January 2025 / Accepted: 8 January 2025 / Published: 16 January 2025

Abstract

:
Cd (cadmium) has been categorized as a crucial food pollutant by the World Health Organization. Research regarding Cd pollution mainly centers on the source of anthropogenic pollution. Nevertheless, there is scarce knowledge concerning the natural weathering input of Cd, particularly that from sedimentary rocks as bedrocks. Herein, we endeavored to explore the contribution of various sedimentary rocks (Quaternary sediments, mudstone, limestone, sandstone, shale, greywacke, and marl) under similar weathering conditions to the input of Cd in agricultural soils. The concentrations of Cd in soils with different bedrocks are as follows: sandstone: 0.30 ± 0.03 mg/kg (SME) > Quaternary sediments: 0.30 ± 0.04 mg/kg (SME) > shale: 0.25 ± 0.04 mg/kg (SME) > greywacke: 0.24 ± 0.03 mg/kg (SME) > mudstone: 0.24 ± 0.01 mg/kg (SME) > marl: 0.22 ± 0.02 mg/kg (SME) > limestone: 0.21 ± 0.03 mg/kg (SME). The results of major element oxides (K2O, MgO, Na2O, Fe2O3, and CaO) imply that Cd in soil primarily stems from the weathering of bedrocks. However, random forest analysis reveals that the soil formation processes of greywacke, mudstone, and marl lead to the loss of Cd in the soil, while those of shale and limestone result in the input of Cd into the soil. This study emphasizes that the process of Cd import and loss in soil is closely related to the type of bedrock and the weathering process.

1. Introduction

Cadmium (Cd) is not deemed an essential element within the human body and can infiltrate the body via oral and dermal exposure [1]. Once it gains entry into the body, Cd demonstrates limited susceptibility to elimination through metabolic processes, thereby giving rise to its accumulation in diverse physiological systems [2]. Consequently, this might potentially exert adverse effects on renal, osseous, and hepatic systems [2]. The matter of Cd pollution has long been a prime concern and focal point of global attention [3,4]. In accordance with the findings of China’s national soil pollution survey, the extent of Cd contamination in cultivated land surpasses 4 × 10⁶ ha (40% of the total area affected by plowland pollution [5]. Rice production on the contaminated land constitutes 10% of Chinese total rice production, amounting to approximately 20 million tons and resulting in direct economic losses estimated at approximately CNY 20 billion [5,6]. Furthermore, the soil is capable of retaining Cd pollution for an extended duration, leading to persistent contamination of agricultural produce and groundwater resources [7]. Hence, it is indispensable to regulate the emissions of Cd and mitigate the contamination of agricultural soil with Cd in China.
The presence of Cd in the environment can be categorized into anthropogenic and natural sources [8,9,10]. Anthropogenic sources encompass activities such as sewage irrigation, fertilizer application, mining, smelting, and fuel combustion [11,12,13,14,15,16,17,18]. For instance, a previous study has demonstrated that the primary sources of Cd contamination in farmland located in North China are atmospheric deposition from smelting (56.5%) and factory emissions and automobile exhaust emissions (56.5%), followed by irrigation water (13.7%), livestock and poultry manure (23.8%), fertilizer application (3.9%), and municipal sludge (2.1%) [12]. Natural sources primarily consist of geological weathering [13,14,15,16,17,18,19,20,21,22]. The concentration of Cd in local soil is elevated due to the presence of Cd-rich carbonate rocks in the Jura Mountains, Switzerland [13]. The weathering of black shales in South Korea leads to significantly higher Cd concentrations (5.7 mg/kg) compared to background levels in the soil [14]. The concentration of Cd in soils derived from sedimentary rocks is significantly higher than that in soils derived from igneous rocks, observed in the Santa Monica Mountains of California, USA [15]. Moreover, previous studies have demonstrated that the weathering of sedimentary rocks is likely the predominant source of Cd in soils, with the contribution from bed-rock weathering potentially exceeding 50% [21,22]. Hence, comprehensively understanding the sources of Cd remains crucial for effectively mitigating soil Cd pollution, particularly in regions with low levels of contamination.
In order to investigate the source, contribution, and influencing factors of Cd in soils of different types of bedrock under similar weathering conditions, we chose the Chuxiong city of Yunnan Province as our research area. The Chuxiong area primarily falls within the South China, Yangtze, and Kangdian stratigraphic regions, characterized by an extensive distribution of diverse sedimentary rocks. Moreover, this region exhibits minimal anthropogenic disturbance compared to more developed areas, making it an ideal location for investigating the natural weathering processes and their impact on cadmium (Cd). The aims of our study are as follows: (1) to clarify the spatial distribution patterns of Cd under different parent materials; (2) to analyze the sources and contributions of Cd; (3) to explore the key factors influencing the distribution of Cd.

2. Materials and Method

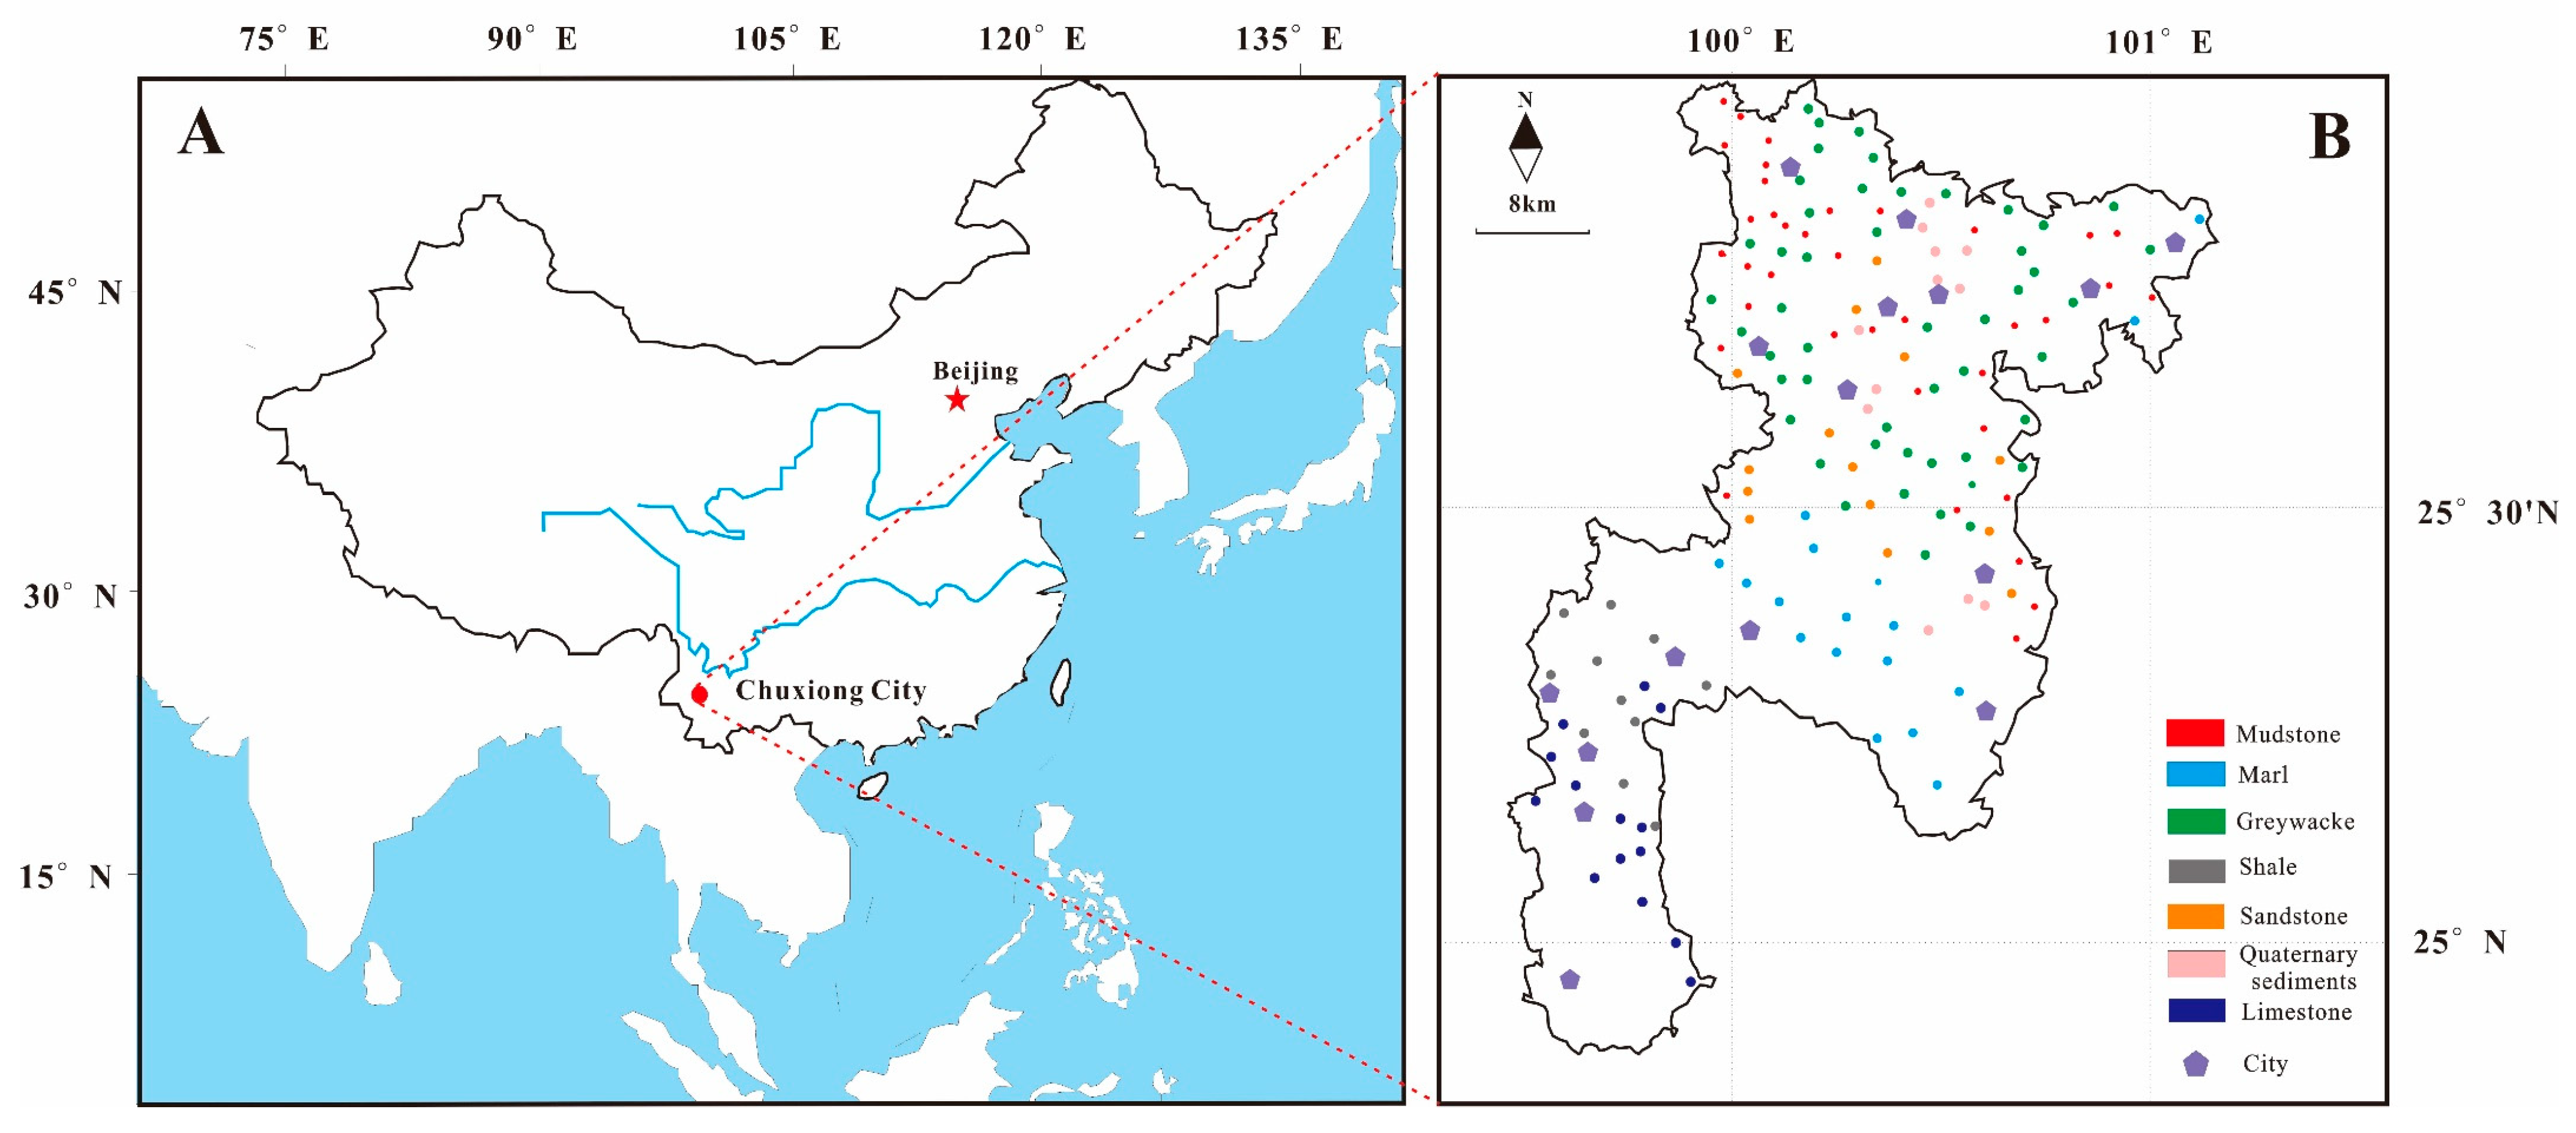
2.1. Study Area and Sample Preparation

Chuxiong city lies east of the Hengduan Mountains in southwest China (N 24°13′00″–26°24′00″, E 100°44′00″–102°2′00″) (Figure 1). The average annual temperature of Chuxiong city ranges from 14.8 to 21.9 °C [23]. Precipitation is relatively meager, with an average annual precipitation of 800 to 1000 mm, and is mainly concentrated from July to October [24]. The sampling area is primarily situated in the Yangtze landmass–Upper Yangtze Paleo-landmass, and the tertiary tectonic units pertain to the Chuxiong intracontinental basin and Kangdian basement uplift belt from west to east [25].
The surface soil (5–15 cm, n = 170) and bedrock samples were collected in September 2022 (Figure 1). The soil sample collection method adhered to the guidelines outlined in the Chinese Standard for Multi-Target Regional Geochemical Survey [26]. After removing surface debris such as branches, leaves, stones, and other extraneous materials, a sampling shovel was used to collect soil samples from the 0–20 cm depth layer. A bamboo knife was then employed to excise portions in direct contact with the sampling shovel. Three additional sites were selected at approximately 50 m from the primary sampling site for further soil sample collection. The four subsamples were thoroughly mixed to form a composite soil sample. The bedrocks of the soil comprise slope deposits and alluvial deposits of Quaternary Holocene (Q) (n = 22), purple-red mudstone of Changhe (K1p) (n = 39), gray limestone of Yunnanyi (T3y2) (n = 15), gray sandstone of Gaofengsi (K1g) (n = 14), gray-black shale of Luojiadashan (T3l3) (n = 11), greywacke of Jiangdihe (Kej1) (n = 49), and marl of Tongzhanghe (J2Z2) (n = 17).

2.2. Chemical Analysis

The soil and rock samples were dried, thoroughly homogenized, and then pulverized through a 200-mesh sieve to fulfill the previous analysis requirements.
The metal (Cu, Pb, Hg, Cd, and Zn) fractions, oxide concentrations (K2O, MgO, Na2O, Fe2O3, and CaO), total carbon (TC), and pH in each sample were determined using the method of Chinese specification for multi-target regional geochemical survey (1:250,000) [26], Chinese geological and mineral laboratory test quality management code [27], and Chinese technical requirements for the analysis of samples for eco-geochemical evaluation [28].
We weighed 0.25 g of the sample into a 100 mL PTFE beaker. Then, we added 5 mL HNO3 (65% v/v), 10 mL HF (40% v/v), and 2 mL HCLO4 (70% v/v). We placed the beaker on a hot plate and gradually increased the temperature to 200 °C until the white fumes ceased. While still hot, we added 8 mL of aqua regia (HCl:HNO3, 3:1) and continued heating until the solution volume was reduced to 2–3 mL. We rinsed the beaker walls with 10 mL of deionized water, and gently heated it for an additional 5–10 min until the solution became clear. We allowed the beaker to cool; then, we transferred the solution to a 25 mL polyethylene volumetric flask, and diluted it to the mark with deionized water. After 1 mL of digestion solution was diluted ten times with 3% HNO3, the heavy metal content (Cu, Pb, Cd and Zn) in it was measured by an inductively coupled plasma mass spectrometer (ICAP-QC, Thermo Fisher Scientific, Omaha, NE, USA). The K, Mg, Na, Fe, and Ca concentrations in the digestion solution were determined using coupled plasma emission spectrometry (ICAP PRO, Thermo Scientific, USA). According to the Chinese specification for multi-target regional geochemical surveys (1:250,000) [26], the relative content of oxide was calculated according to the element content (K, Mg, Na, Fe, and Ca) according to the molecular weight of oxide (K2O, MgO, Na2O, Fe2O3, and CaO).
We weighed 0.2 g of the sample into a 25 mL colorimetric tube. We added 3 mL of aqua regia (HCl:HNO3, 3:1), shook the solution thoroughly, and heated it in a water bath for 2 h, shaking 2–3 times during this period. After heating, we allowed the solution to cool for 10 min. Then, we added 5 mL CH4N2S (5% v/v) and C6H8O6 (5% v/v) solution into the tube. Finally, we added C6H8O6 (25% v/v) with HCl (0.5% v/v) to reach 25 mL. And the Hg content in the digestion solution was determined using atomic fluorescence spectrometry (XGY-1011A, Institute of Geophysical and Geochemical Exploration, Peking, China) for Hg.
A 0.05 g sample was placed in a crucible, followed by the addition of approximately 0.5 g of pure iron co-solvent and approximately 1.5 g of COREY-1 co-solvent (containing tungsten particles). The crucible was gently tapped to ensure that the co-solvents completely covered the sample. The crucible was then placed in a high-frequency infrared carbon–sulfur analyzer (Multi EA 4000, Analytik Jena, Jena, Germany), where the sample was calcined at 950 °C for 4 h to determine the total carbon content.
An amount of 4.0 g of test material was accurately weighed and placed into a polyethylene mold, ensuring a flat surface. It was then pressed under 30 t of pressure to form a specimen with a sample diameter of 32 mm and an outer diameter exceeding 40 mm. Aluminum (Al) and silicon (Si) were analyzed using X-ray fluorescence spectrometry (XRF). The matrix effect between elements was corrected using the empirical coefficient method and the scattering line internal standard method, and the interference from spectral line overlap was accounted for in the calculation of elemental content.
We accurately weighed the 10 g sample, placed the sample in a 50 mL beaker, added 25 mL ultra-pure water, stirred the sample with a magnetic stirrer for 5 min, and then allowed it to stand for 0.5~2 h. Then, we placed the beaker containing the sample and built-in rotor on the magnetic stirrer, inserted a pH electrode (HI1045P, Hanna instruments, Woonsocket, RI, USA) into the beaker, and read the pH directly after the reading was stable.
The limits of detection (LODs) for the experimental method were established using blank samples with 12 replicate determinations. The LODs for different elements detected by various instruments were as follows: Cd (0.03 mg/kg), Cu (0.46 mg/kg), Pb (1 mg/kg), Zn (2 mg/kg), Hg (0.003 mg/kg), CaO (0.01%), TFe2O3 (0.01%), K2O (0.01%), MgO (0.01%), Na2O (0.05%), Al2O3 (0.03%), SiO2 (0.06%), and TC (0.076%). The statistical standard deviation was computed, and three times this value was designated as the laboratory detection limit. To validate the precision and accuracy of the test method, national-level soil standard substances were selected and analyzed according to the specified protocol. Each sample underwent 12 parallel analyses. The precision (expressed as relative standard deviation, RSD) and accuracy (expressed as ΔlgC) were assessed through rigorous statistical evaluation, conforming to the Chinese national standards [26,27,28].
Δ lg C ¯ = i = 1 12 lg C R i lg C R S 12
ΔlgC is precision, CRi is the measured element value, and CRS is the element content value in the standard sample.

2.3. Assessment of Soil Weathering Degree

Soil weathering is frequently evaluated by using the ratio of readily mobile cationic oxides to those that are not, such as aluminum (Al) to magnesium (Mg), calcium (Ca), and sodium (Na) [29]. In this research, the variance in the weathering intensity of diverse bedrocks was inspected through four weathering indices for the soils. These indices were derived from the analysis of major elements, including silicon (Si), Al, iron (Fe), Ca, Mg, potassium (K), and Na. Specifically, these indices are the residual coefficient (KI), chemical index of alteration (CIA), weathering leaching coefficient (Ba), and dealkalization coefficient (W). The indices were calculated based on the molar amounts of the corresponding oxides using the following formulas:
CIA = [Al2O3 × 100/(Al2O3 + CaO* + Na2O + K2O)]
BA = (CaO* + K2O + Na2O)/Al2O3 × 100%
W = (Na2O + CaO*)/Al2O3
KI = (Al2O3 + Fe2O3)/(K2O + Na2O + CaO* + MgO)
CaO* specifically denotes CaO within the context of silicate minerals, and the calculation was based on the mole quantities of the corresponding oxides [29,30,31].

2.4. Statistical Analysis

The non-parametric Kruskal–Wallis test was employed to evaluate the differences in median values. Principal and trace elements were analyzed using Origin 2019b (9.65) 32 bit, while principal component analysis facilitated the identification of correlations among various elements through correlation matrices following data standardization. The average clustering method, along with the sum of squared Euclidean distances and data distances, was utilized for systematic clustering analysis. Additionally, random forest analysis was conducted to ascertain the contributions of major oxide, pH and TC to Cd.

3. Results and Discussion

3.1. Analytical Quality

As outlined in Section 2.2, a comparative table evaluating data quality based on the established criteria [26,27,28] is presented in Table 1. The values of Cu (19.5 mg/kg), Pb (19.3 mg/kg), Cd (0.15 mg/kg), and Hg (0.015 mg/kg) of GBW07403 were close to the reference values (19.5, 20, 0.14, and 0.016, respectively) (Chinese national first-class geochemical standard material certificate set). The values of K2O (2.97%), MgO (0.62%), Na2O (2.82%), Fe2O3 (1.96%), SiO2 (74.03%), and CaO (1.22%) of GBW07404 were close to the reference values (3.04, 0.62, 2.82, 1.96, 74.72, and 0.016, respectively) (Chinese national first-class geochemical standard material certificate set). The relative standard deviation (RSD) of the parallel samples was found to be less than 10%. Additionally, the ΔlgC values were all below 0.05. Both the RSD and ΔlgC values comply with the Chinese experimental test regulation criteria [26,27,28].

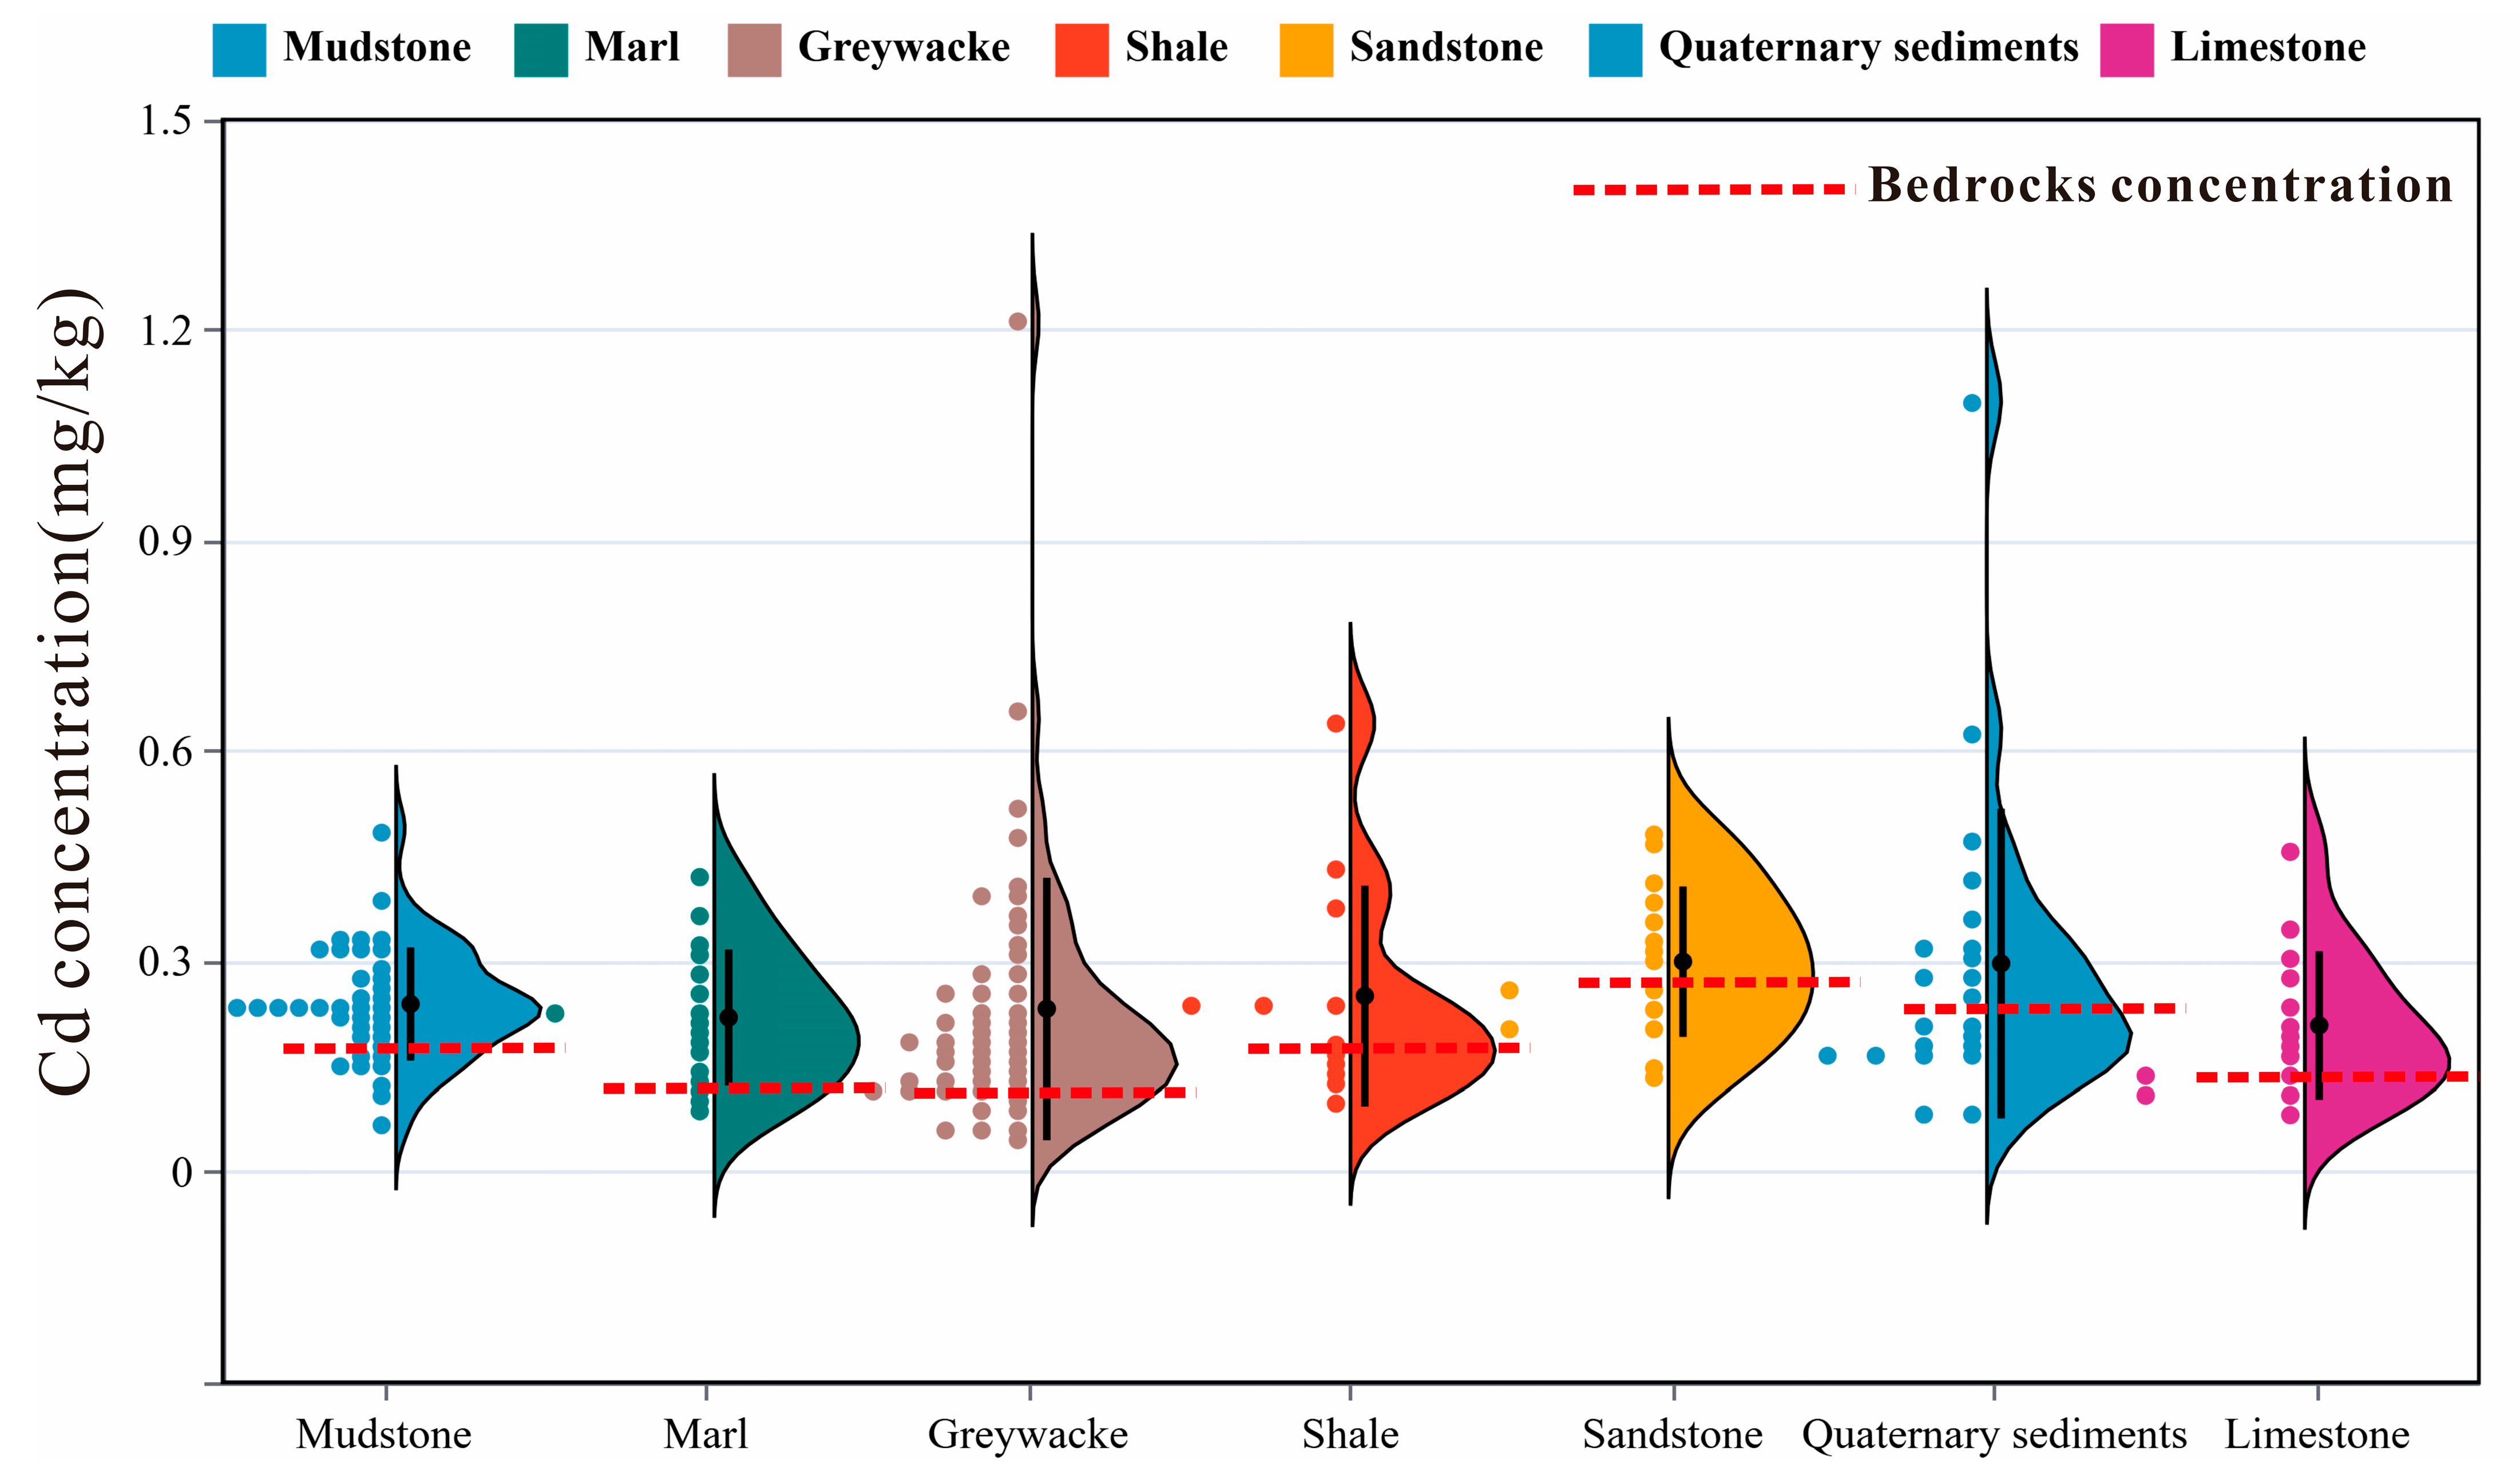
3.2. Distribution of Cd Concentration in Soil of Different Bedrocks

The arable soils in Chuxiong city demonstrate Cd concentrations of 0.25 ± 0.15 mg/kg, approximately three times the background level reported for Chinese soils (0.09 mg/kg). The coefficient of variation for Cd concentration in soils derived from various bedrock types is 61%, suggesting a significant disparity in Cd concentrations across different soil types. The concentrations of Cd in soils with different bedrocks are shown in Figure 2, and are as follows: gray sandstone of Gaofengsi (K1g): 0.30 ± 0.03 mg/kg (SME) > slope deposits and alluvial deposits of Quaternary Holocene (Q): 0.30 ± 0.04 mg/kg (SME) > gray-black shale of Luojiadashan (T3l3): 0.25 ± 0.04 mg/kg (SME) > greywacke of Jiangdihe (Kej1) 0.24 ± 0.03 mg/kg (SME) > purple-red mudstone of Changhe (K1p): 0.24 ± 0.01 mg/kg (SME) > marl of Tongzhanghe (J2Z2): 0.22 ± 0.02 mg/kg (SME) > gray limestone of Yunnanyi (T3y2): 0.21 ± 0.03 mg/kg (SME).
These findings suggest that bedrock types may influence Cd concentrations in soil. The concentrations of Cd in different types of bed rocks are shown in Figure 2, and are as follows: sandstone of Gaofengsi (K1g) (0.28 mg/kg) > alluvial deposits of Quaternary Holocene (Q) (0.20 mg/kg) > mudstone of Changhe (K1p) (0.18 mg/kg) > shale of Luojiadashan (T3l3) (0.17 mg/kg) > limestone of Yunnanyi (T3y2) (0.12 mg/kg) > marl of Tongzhanghe (J2Z2) (0.12 mg/kg) > greywacke of Jiangdihe (Kej1) (0.11 mg/kg). The concentration of Cd in bedrocks constitutes a significant factor influencing the concentration of Cd in soil. It is notable that the Cd concentration in the soil does not precisely correspond to that in the bedrock. This disparity might suggest that the variations in the weathering resistance among different bedrock types also exert an influence on the observed Cd concentrations in soils. The concentration of heavy metals resulting from the weathering of various bedrock types can vary considerably [11,17,19]. An analysis of the distribution of Cd across diverse soil types derived from distinct bedrock sources reveals that siliceous soils show a greater tendency for Cd migration compared to carbonaceous soils [19]. In southern China, the heavy metal concentrations within sandstone are markedly higher than those present in the soils formed through slate weathering processes [17]. In eastern China, when black shale and carbonate rocks serve as parent materials, the Cd concentrations are substantially elevated, in contrast to those associated with other types of bedrock [11]. Consequently, a comprehensive understanding of the weathering processes affecting bedrock is indispensable for accurately assessing the sources and contributions of Cd in soil. Additionally, variations in anthropogenic inputs represent another crucial factor influencing the Cd concentration in soil [19]. To elucidate the geochemical behavior of Cd in different bedrock contexts, it is essential to initially delineate the sources and contributions of Cd within various regions.

3.3. Sources of Cd in Soil of Different Bedrocks

The concentrations of oxides, metal, and TC in the soil are summarized in Table 2. Oxide concentrations reflect the weathering contribution from the bedrock, while the ratios of different oxides serve as indicators of soil weathering intensity. The levels of various heavy metals in the soil provide critical insights into anthropogenic inputs. For example, Pb concentrations may originate from coal combustion and automobile emissions; Hg levels can indicate long-distance atmospheric transport; Cu and Zn concentrations may be associated with agricultural activities, such as the application of organic fertilizers. Data on the concentrations of binding oxides and heavy metals can effectively elucidate the sources of Cd in the soil. The origin of Cd in soil was clarified through a combination of principal component analysis (PCA) and cluster analysis (Figure 3). Both PCA and cluster analysis (CA) were carried out on the entire dataset as well as on data classified by distinct soil types. These findings from the overall dataset are in close accordance with those derived from individual soil types. The results of PCA identified two primary factors influencing the concentration of Cd. Factor 1 accounts for 56.36% of the total variance, characterized by typical oxide loadings (Al2O3, CaO, K2O, MgO, and Fe2O3) along with positive loadings of certain metals (Zn, Cr, and Cu). The variation in oxide concentration associated with Factor 1 is evidently related to the alteration and weathering processes of the bedrocks. Previous studies have demonstrated that changes in oxide concentrations serve as crucial indicators of soil weathering and leaching intensity [29,30,31]. Factor 2 explains an additional 29.30% of variance and is distinguished by positive loadings of Zn, Pb, and Cu. Exogenous anthropogenic inputs significantly affect metal enrichment in soils [17]. Zn, Cu, and their compounds are widely utilized as additives in agricultural fertilizers and pesticides, as antibacterial agents and growth promoters [32,33]. Prior research has shown that the application of irrigation water along with heavy metals from pesticides markedly increases the concentrations of Cu and Zn in soils [8,34]. Factor 2 might represent the contributions from agricultural inputs. Notably, while Zn, Pb, and Cu show positive loadings across both factors 1 and 2, these contrast sharply with the factor loading for Cd itself, indicating that Cd might not have originated from human input. The CA results categorized elements across different soil types into two distinct groups: one comprising oxides (Al2O3, CaO, K2O, MgO, and Fe2O3) along with heavy metals (Cd, Hg, Cu, and Pb), and another including Zn, SiO2, and Cr. Elements with statistically significant correlated concentrations may share similar sources [33,35]. Both the CA and PCA results indicated that the Cd sources mainly stem from the weathering input related to bedrock material. In addition, Cr, Zn, and SiO2 are grouped together, which indicates that the concentration of Zn and Cr in soil may also be closely related to soil weathering. The SiO2 concentration, which affects the cation exchange capacity within soils, is related to the content of clay minerals formed in the weathering process [36,37]. Generally, with the advancement of the weathering process, the concentration of SiO2 in the soil will increase [29,31]. High clay mineral concentration in soil is conducive to the adsorption and preservation of Zn and Cr [38,39]. Hence, the presence of heavy metals within cultivated lands throughout Chuxiong City is primarily influenced by geological origins.

3.4. Parameters of Wind Erosion Under Varying Geological Parent Material Conditions

The average composition of major elements in diverse soil samples was compared with that of the Earth’s upper crust (UCC) [40], as depicted in Figure 4. With the exception of Al2O3 and SiO2, substantial losses are noted for the remaining major elements (MgO, Na2O, CaO, K2O), particularly for Ca and K2O, which exhibit the highest degrees of depletion. The liability of CaO and Na2O to weathering implies a distinct chemical weathering process [29]. And all soil types present a similar trend of variation regarding major elements (Figure 4A). This consistent trend indicates that different soil types within the same region share comparable weathering and deposition. However, variations exist in their respective degrees of elemental loss. For instance, relative to the crustal abundance, the degree of CaO loss follows the following sequence: shale (0.65) > limestone (0.23) > sandstone (0.19) > Quaternary sediment (0.15) > greywacke (0.14) > marl (0.14) > mudstone (0.13). Similarly, the loss of Na2O relative to crustal levels is ranked as follows: limestone (0.46) > shale (0.22) > marl (0.17) > sandstone (0.17) > Quaternary sediment (0.14) > mudstone (0.14) > greywacke (0.10). The loss of CaO and Na2O reflects the significant weathering loss of Ca- and Na-rich minerals such as plagioclase [41,42]. The main structure of feldspar is the silico-oxygen tetrahedron, which is influenced by numerous factors such as water and carbon dioxide during weathering, leading to gradual weakening of the lattice structure. Among them, Ca, K, and Na are prone to being lost in the form of acidic carbonate [36,43]. The difference in potassium oxide loss in sandstone (1.01) > marl (0.88) > limestone (0.87) > mudstone (0.79) > greywacke (0.74) > shale (0.66) > Quaternary sediment (0.66) reflects the loss of potassium-containing minerals, such as K-rich biotite, illite, and potassium feldspar. These differences may be ascribed to the varying weathering resistances among different rock types and their elemental compositions.
To quantify this process, we employed the leaching coefficient (W), dealkalization coefficient (BA), chemical alteration coefficient (CIA), and residual coefficient (KI) to assess the weathering degree of soils derived from different parent materials [29,30,31]. The CIAs of various parent materials range from 65 to 85, and the reaction tends to fall within the medium chemical weathering level under warm and humid conditions (Figure 4B). The average alteration coefficient varies among different soil types, specifically shale (66) < limestone (68) < sandstone (75) < marl (78) < Quaternary sediment (79) < mudstone (79) < greywacke (80). The CIA indicates the degree of transformation of a mineral into a clay mineral [30,31]. The KI reflects the enrichment degree of stable elements [30,31]. These results are in line with those of the chemical alteration coefficient. Our findings demonstrate that the weathering degree of greywacke is the highest, while that of shale is the lowest. The disparity in weathering resistance is not only associated with its chemical composition but also closely tied to the rock structure [36,43]. Other distinct types of rocks, such as sandstone, mudstone, and shale, have different proportions of clay mineral particles and cements, as well as varying porosities, water permeabilities, and structural strengths among structures [44]. Shale is mainly composed of clay minerals and has an argillaceous structure. It is easily fractured by physical weathering but is less prone to further weathering [45]. And sandstone, greywacke, mudstone, etc., contain feldspar and other minerals susceptible to chemical weathering [46]. Shale has higher potential for weathering resistance than mudstone and sandstone. The W and BA coefficients reflect the migration of soluble elements [31]. The average dealkalization coefficient of the reaction is greywacke (26%) < mudstone (27%) < marl (30%) < Quaternary sediment (28%) < sandstone (33%) < limestone (48%) < shale (64%). There is good consistency between the results of W and BA (Figure 4B). These results suggest that under the same weathering conditions, soluble elements in heterolith, mudstone, and marl are more readily lost and preferentially form a large number of clay minerals, while limestone and shale retain more information from the bedrocks than the soil formed by heterolith.

3.5. Factors Affecting Cd Concentration in Soil

No correlation is discerned between the Cd concentration within the bedrock and the degree of rock weathering (Figure 5). Random forest constitutes an ensemble learning algorithm that arrives at a final decision by establishing multiple decision trees and summarizing their predictions [47]. Random forest analysis is capable of determining the influence exerted by the input process of bedrock weathering and the subsequent loss process of soil formation on soil Cd concentration. The key factors influencing Cd in various types of parent material source soil were determined through random forest analysis, and the results are presented in Figure 5. For different soil types, the contribution factors are notably different. For Quaternary sediments, greywacke, marl, and mudstone, the IncMSE% value of CaO is positive, with the p value being less than 0.05. The contribution rate of the W in sandstone, greywacke, and mudstone is also among the top three, and the p value is less than 0.05. These results imply that the concentrations of CaO and Na2O in the soil affect the concentration of Cd in the soil. CaO and K2O are the elements in the soil that are prone to loss during weathering [31]. For Quaternary sediments, greywacke, marl, and mudstone, the close correlation between the Cd concentration and soil weathering indicates that soil weathering can facilitate the loss of Cd. Additionally, mudstone, marl, and greywacke weathering contribute more to Cd loss than Quaternary sediments. For limestone and shale, the contribution of soil significantly differs from that of other types of bedrocks, and both Al2O3 and SiO2 are of great significance. Al2O3 and SiO2 are the main components that cannot easily migrate during the weathering process, and their concentrations reflect the degree of the soil weathering process [30,31]. With the advancement of weathering, the Cd concentration in the soil increases, suggesting that weathering promotes the release of Cd from the bedrocks of limestone and shale, and the formed clay minerals are conducive to the retention of Cd. Our study area is characterized by moderate chemical weathering. However, under varying climatic conditions, the influence of weathering on soil formation and elemental loss will exhibit significant differences. In warm and humid climates, enhanced chemical leaching accelerates the depletion of Ca and Mg, thereby intensifying the weathering of mudstone, marl, and limestone, and facilitating the transfer of elements from bedrocks into the soil. Conversely, in cold and dry climates, the rate of weathering diminishes, reducing the contribution of mudstone, marl, and limestone to overall weathering processes relative to warm and humid conditions [29,41,42]. Over time, prolonged exposure to warm and moist environments leads to the accumulation of Cd in limestone and mudstone, ultimately resulting in increased erosion and loss of soils derived from these parent materials.
It is worthy of note that the pH value of greywacke and marl is also a crucial factor influencing the Cd concentration, which indicates that the alkaline conditions during the formation of greywacke and marl are conducive to the retention of Cd. When the pH is acidic, H+ and Cd ions compete for adsorption sites, and exchangeable Cd is released from the soil, resulting in its loss [48,49]. When the pH is alkaline, the hydrolysis of Cd is enhanced, and the hydroxyl metal ions adsorbed by soil colloids can form surface complexes with single or double coordination, facilitating the retention of Cd in the soil [48,49]. The IncMSE% value of TC indicates that organic matter also makes a significant contribution to the Cd concentration in soil formed by Quaternary sediments and mudstones. The surface of organic matter is rich in carboxyl, phenol hydroxyl, carbonyl, quinone, and other functional groups, and has a large specific surface area, porosity, and ion exchange capacity, which can effectively fix and adsorb Cd [50,51]. Compared with other types of parent materials (TC: 19~35%), mudstone (TC: 37%) and Quaternary sediments (TC: 38%) may have more abundant clay minerals and a finer particle size, and possess a higher retention capacity for organic matter, which directly affects the Cd concentration in the soil. Consequently, for various parent materials of soil formation, the influence of weathering varies. Moreover, while weathering bedrocks into soil, factors such as soil pH and organic matter concentration will also indirectly affect the Cd concentration in the soil.

4. Conclusions

Our research findings indicate that under the identical weathering background of diverse bedrock, the concentration of Cd in soil formed by sandstone is the highest, followed by Quaternary sediments and shale, while that in soil formed by limestone is the lowest. The Cd in Chuxiong city farmland soil mainly stems from the weathering of the bedrocks. Nevertheless, the contributions of weathering input from different types of bedrocks are notably different. The soil formation processes of sandstone, mudstone, Quaternary sediment, and gritstone not only introduce Cd but also facilitate the loss of Cd. The process of weathering limestone and shale into soil promotes the input of Cd from the bedrocks to the soil. Hence, in soil control, targeted strategies should be adopted based on the type of soil bedrock and the weathering stage.

Author Contributions

Conceptualization, methodology, software: Y.N.; validation, M.Y. and J.H.; formal analysis, Y.N. and C.L.; investigation, Y.N.; resources, M.Y. and J.H.; data curation, M.Y. and J.H.; writing—original draft preparation, Y.N.; writing—review and editing, Y.P. and Q.L.; visualization, M.Y. and T.W.; supervision, Y.P. and Q.L.; project administration, M.Y.; funding acquisition, M.Y. All authors have read and agreed to the published version of the manuscript.

Funding

This study was supported by the National natural science foundation of China: 42307058; Investigation and evaluation of key investigation area of Laowangzhai-Mojiang Gold Factory gold mine in Zhenyuan, Yunnan Province: DD20230385; Geochemical survey of land quality in Dayao, Yaoan, Nanhua and Shuangbai counties in central Yunnan Province: DD20211577; Comprehensive Investigation and Potential Evaluation of Natural Resource Carbon Sinks in Key Regions of China: DD20220877.

Data Availability Statement

The data presented in this study is available in the article.

Acknowledgments

The authors wish to express their sincere appreciation to Liankai Zhang, Can Xu and Guiren Chen for their invaluable feedback and financial support during the preparation of this manuscript.

Conflicts of Interest

The authors declare no conflict of interest.

References

  1. Kubier, A.; Wilkin, R.T.; Pichler, T. Cd in soils and groundwater: A review. Appl. Geochem. 2019, 108, 104388. [Google Scholar] [CrossRef] [PubMed]
  2. Järup, L.; Åkesson, A. Current status of Cd as an environmental health problem. Toxicol. Appl. Pharm. 2009, 238, 201–208. [Google Scholar] [CrossRef] [PubMed]
  3. Imseng, M.; Wiggenhauser, M.; Keller, A.; Müller, M.; Rehkämper, M.; Murphy, K.; Kreissig, K.; Frossard, E.; Wilcke, W.; Bigalke, M. Fate of Cd in agricultural soils: A stable isotope approach to anthropogenic impact, soil formation, and soil-plant cycling. Environ. Sci. Technol. 2018, 52, 1919–1928. [Google Scholar] [CrossRef] [PubMed]
  4. Wang, J.; Wang, P.-M.; Gu, Y.; Kopittke, P.M.; Zhao, F.-J.; Wang, P. Iron–manganese (oxyhydro) oxides, rather than oxidation of sulfides, determine mobilization of Cd during soil drainage in paddy soil systems. Environ. Sci. Technol. 2019, 53, 2500–2508. [Google Scholar] [CrossRef]
  5. Zhang, J.S. Exposure risk assessment and pollution control status of Cd contaminated soil. AGR Technol. 2021, 12, 96–99. (In Chinese) [Google Scholar]
  6. Zou, M.; Zhou, S.; Zhou, Y.; Jia, Z.; Guo, T.; Wang, J. Cd pollution of soil-rice ecosystems in rice cultivation dominated regions in China: A review. Environ. Pollut. 2021, 280, 116965. [Google Scholar] [CrossRef]
  7. Yang, S.; Feng, W.; Wang, S.; Chen, L.; Zheng, X.; Li, X.; Zhou, D. Farmland heavy metals can migrate to deep soil at a regional scale: A case study on a wastewater-irrigated area in China. Environ. Pollut. 2021, 281, 116977. [Google Scholar] [CrossRef]
  8. Luo, L.; Ma, Y.B.; Zhang, S.; Wei, D.; Zhu, Y.-G. An inventory of trace element inputs to agricultural soils in China. J. Environ. Manag. 2009, 90, 2524–2530. [Google Scholar] [CrossRef]
  9. Liu, Y.Z.; Xiao, T.F.; Ning, Z.P.; Li, H.; Tang, J.; Zhou, G. High Cd concentrations in soil in the Three Gorges region: Geogenic source and potential bioavailability. Appl. Geochem. 2013, 37, 149–156. [Google Scholar] [CrossRef]
  10. Liu, Y.; Xia, Y.; Zhu, J.-M.; Wang, Z.; Liu, C.; Qi, M.; Lv, Y.; Gao, T. Cd mobilization in mining-impacted soils with different bedrock lithology: Insights from stable Cd isotopes. J. Hazard. Mater. 2024, 480, 135798. [Google Scholar] [CrossRef]
  11. Liu, Y.; Xiao, T.; Perkins, R.B.; Zhu, J.; Zhu, Z.; Xiong, Y.; Ning, Z. Geogenic Cd pollution and potential health risks, with emphasis on black shale. J. Geochem. Explor. 2017, 176, 42–49. [Google Scholar] [CrossRef]
  12. Liu, J.; Pan, Y.P.; Shi, H.D. Cd sources and contribution of atmospheric deposition in farmland soil in North China. J. Agro-Environ. Sci. 2022, 41, 1698–1708. [Google Scholar]
  13. Quezada-Hinojosa, R.P.; Matera, V.; Adatte, T.; Rambeau, C.; Föllmi, K.B. Cd distribution in soils covering Jurassic oolitic limestone with high Cd concentrations in the Swiss Jura. Geoderma 2009, 150, 287–301. [Google Scholar] [CrossRef]
  14. Park, M.; Chon, H.-T.; Marton, L. Mobility and accumulation of selenium and its relationship with other heavy metals in the system rocks/soils–crops in areas covered by black shale in Korea. J. Geochem. Explor. 2010, 107, 161–168. [Google Scholar] [CrossRef]
  15. Lund, L.J.; Betty, E.E.; Page, A.L.; Elliott, R.A. Occurrence of naturally high Cd levels in soils and its accumulation by vegetation. J. Environ. Qual. 1981, 10, 551–556. [Google Scholar] [CrossRef]
  16. Cheng, H.X.; Yang, Z.F.; Xi, X.H.; Zhao, C.D.; Wu, X.M.; Zhuang, G.M.; Liu, Y.H.; Chen, G.G. A research framework for source tracking and quantitative assessment of the Cd anomalies along the Yangtze River Basin. Earth Sci. Front. 2005, 12, 261–272, (In Chinese with English Abstract). [Google Scholar]
  17. Ning, Y.; Yang, B.; Yang, S.; Ye, J.; Li, J.; Ren, L.; Liu, Z.; Bi, X.; Liu, J. Application of Pb isotopes and REY patterns in tracing heavy metals in farmland soils from the Upper-Middle area of Yangtze River. Int. J. Environ. Res. Public Health 2023, 20, 966. [Google Scholar] [CrossRef]
  18. Yu, C.X.; Peng, B.; Peltola, P.; Tang, X.; Xie, S. Effect of weathering on abundance and release of potentially toxic elements in soils developed on Lower Cambrian black shales, P.R. China. Environ. Geochem. Health 2011, 34, 375–390. [Google Scholar] [CrossRef]
  19. Xia, X.; Ji, J.; Yang, Z.; Han, H.; Huang, C.; Li, Y.; Zhang, W. Cd risk in the soil-plant system caused by weathering of carbonate bedrock. Chemosphere 2020, 254, 126799. [Google Scholar] [CrossRef]
  20. Tuttle, M.L.W.; Breit, G.N.; Goldhaber, M.B. Weathering of the New Albany Shale, Kentucky: II. Redistribution of minor and trace elements. Appl. Geochem. 2009, 24, 1565–1578. [Google Scholar] [CrossRef]
  21. Wu, S.; Peng, B.; Wu, N.; Xie, S.; Yang, X.; Fang, X.; Song, Z. Mobility and environmental impact of cadmium (Cd) during weathering of carbonaceous black shales in western Hunan, China. J. Hazard. Mater. 2024, 470, 134267. [Google Scholar] [CrossRef] [PubMed]
  22. Wen, Y.; Li, W.; Yang, Z.; Zhang, Q.; Ji, J. Enrichment and source identification of Cd and other heavy metals in soils with high geochemical background in the karst region, Southwestern China. Chemosphere 2020, 245, 125620. [Google Scholar] [CrossRef] [PubMed]
  23. Jun, W.; Xinhua, W.; Meihua, G.; Xuyan, X. Impact of climate change on reference crop evapotranspiration in Chuxiong City, Yunnan Province. Procedia Earth Planet. Sci. 2012, 5, 113–119. [Google Scholar] [CrossRef]
  24. Zhong, H.U.; Wei, L.; Jun, T.A.N.; Bing, T.A.N.G.; Gaozhao, L.V. Evaluation and Analysis of Ecological Climatic Index of Tobacco-growing Areas in Chuxiong. Chin. Tob. Sci. 2012, 33, 63–68. [Google Scholar]
  25. Yang, P.; Ren, Z.L.; Tian, T.; Cui, J.; Liu, C.; Wu, H. Tectono-thermal evolution and its relationship with petroleum generation in the Chuxiong Basin, southeastern Tibetan Plateau. Chin. J. Geophys. 2023, 66, 5057–5073. [Google Scholar]
  26. DZ/T 0258-2014; Specification of Multi-Purpose Regional Geochemical Survey (1:250000). Ministry of Land and Resources of the People’s Republic of China: Beijing, China; Standards Press of China: Beijing, China, 2014; pp. 1–46. (In Chinese)
  27. DZ/T 0130-2006; The National Standard Method Used for Chemical Analysis and Its Quality Control Included the Specification of Testing Quality Management for Geological Laboratories. Ministry of Land and Resources of the People’s Republic of China: Beijing, China; Standards Press of China: Beijing, China, 2006; pp. 1–17. (In Chinese)
  28. DD2005-03; Geological Survey Technical Standard. China Geological Survey: Beijing, China; Standards Press of China: Beijing, China, 2005; pp. 1–22. (In Chinese)
  29. Gjoka, F.; Miho, L.; Spaholli, A.; Kasa, E. Weathering patterns in alluvial soils under Mediterranean climatic conditions in Albania and implications for soil fertility. Carpathian J. Earth Environ. Sci. 2023, 18, 461–474. [Google Scholar] [CrossRef]
  30. Fedo, C.M.; Nesbitt, H.W.; Young, G.M. Unraveling the effects of potassium metasomatism in sedimentary rocks and paleosols, with implications for paleo-weathering conditions and provenance. Geology 1995, 23, 921–924. [Google Scholar] [CrossRef]
  31. Nadłonek, W.; Bojakowska, I. Variability of chemical weathering indices in modern sediments of the Vistula and Odra Rivers (Poland). Appl. Ecol. Environ. Res. 2018, 16, 2453–2473. [Google Scholar] [CrossRef]
  32. Niu, L.L.; Yang, F.; Xu, C.; Yang, H.; Liu, W. Status of metal accumulation in farmland soils across China: From distribution to risk assessment. Environ. Pollut. 2013, 176, 55–62. [Google Scholar] [CrossRef]
  33. Wang, P.; Li, Z.; Liu, J.; Bi, X.; Ning, Y.; Yang, S.; Yang, X. Apportionment of sources of heavy metals to agricultural soils using isotope fingerprints and multivariate statistical analyses. Environ. Pollut. 2019, 249, 208–216. [Google Scholar] [CrossRef]
  34. Nicholson, F.A.; Smith, S.R.; Alloway, B.J.; Carlton-Smith, C.; Chambers, B.J. Aninventory of heavy metals inputs to agricultural soils in England and Wales. Sci. Total Environ. 2003, 311, 205–219. [Google Scholar] [CrossRef] [PubMed]
  35. Gramatica, P.; Battaini, F.; Giani, E.; Papa, E.; Jones, R.J.A.; Cenci, R.M. Multivariate analysis of heavy metal concentrations in soils and mosses of two northItaly regions. Fresenius Environ. Bull. 2006, 15, 731–737. [Google Scholar]
  36. Nesbitt, H.W.; Fedo, C.M.; Young, G.M. Quartz and feldspar stability, steady and non-steady-state weathering, and petrogenesis of siliciclastic sands and muds. J. Geol. 1997, 105, 173–192. [Google Scholar] [CrossRef]
  37. Oke, S.A.; Tijani, M.N.; Adeyemo, O.M. Influence of bedrock weathering of the shallow ground water system around felsic metasediment and amphibolites of the Ilesha schist bel. Transnatl. J. Sci. Tech. 2013, 3, 36–53. [Google Scholar]
  38. Janusz, W.; Patkowski, J.; Chibowski, S. Competitive adsorption of Ca2+ and Zn (II) ions at monodispersed SiO2/electrolyte solution interface. J. Colloid Interface Sci. 2003, 266, 259–268. [Google Scholar] [CrossRef]
  39. Shi, S.; Yang, J.; Liang, S.; Li, M.; Gan, Q.; Xiao, K.; Hu, J. Enhanced Cr(VI) removal from acidic solutions using biochar modified by Fe3O4@SiO2-NH2 particles. Sci. Total. Environ. 2018, 628, 499–508. [Google Scholar] [CrossRef]
  40. Rudnick, R.; Gao, S. Composition of the continental crust. In Treatise on Geochemistry; Rudnick, R.L., Holland, H.D., Turekian, K.K., Eds.; Elsevier: Amsterdam, The Netherlands, 2003; Volume 3, pp. 1–64. [Google Scholar]
  41. Armstrong-Altrin, J.S.; Lee, Y.I.; Verma, S.P.; Ramasamy, S. Geochemistry of sandstones from the Upper Miocene Kudankulam For-mation, southern India: Implications for provenance, weathering, and tectonic setting. J. Sediment. Res. 2004, 74, 285–297. [Google Scholar] [CrossRef]
  42. Cai, D.-W.; Li, L.-B.; Zhu, Y.-Q.; Ren, M.-Q. Behaviors of Major and Trace Elements in Soils Developed from Weathering Basalt in Western Guizhou, China. IOP Conf. Ser. Earth Environ. Sci. 2021, 861, 072006. [Google Scholar] [CrossRef]
  43. Deng, K.; Yang, S.; Guo, Y. A global temperature control of silicate weathering intensity. Nat. Commun. 2022, 13, 1781. [Google Scholar] [CrossRef]
  44. McQueen, K.G.; Scott, K.M. Rock weathering and structure of the regolith. Regolith Sci. 2008, 1, 105–126. [Google Scholar]
  45. Gu, X.; Rempe, D.M.; Dietrich, W.E.; West, A.J.; Lin, T.-C.; Jin, L.; Brantley, S.L. Chemical reactions, porosity, and microfracturing in shale during weathering: The effect of erosion rate. Geochim. Cosmochim. Acta 2019, 269, 63–100. [Google Scholar] [CrossRef]
  46. Turkington, A.V.; Paradise, T.R. Sandstone weathering: A century of research and innovation. Geomorphology 2005, 67, 229–253. [Google Scholar] [CrossRef]
  47. Rigatti, S.J. Random forest. J. Insur. Med. 2017, 47, 31–39. [Google Scholar] [CrossRef]
  48. Kicińska, A.; Pomykała, R.; Izquierdo-Diaz, M. Changes in soil pH and mobility of heavy metals in contaminated soils. Eur. J. Soil Sci. 2021, 73, e13203. [Google Scholar] [CrossRef]
  49. Wang, A.S.; Angle, J.S.; Chaney, R.L.; Delorme, T.A.; Reeves, R.D. Soil pH effects on uptake of Cd and Zn by Thlaspi caerulescens. Plant Soil 2006, 281, 325–337. [Google Scholar] [CrossRef]
  50. Guo, X.; Zhang, S.; Shan, X.; Luo, L.; Pei, Z.; Zhu, Y.; Liu, T.; Xie, Y.; Gault, A. Characterization of Pb, Cu, and Cd adsorption on particulate organic matter in soil. Environ. Toxicol. Chem. 2006, 25, 2366–2373. [Google Scholar] [CrossRef]
  51. Borggaard, O.K.; Holm, P.E.; Strobel, B.W. Potential of dissolved organic matter (DOM) to extract As, Cd, Co, Cr, Cu, Ni, Pb and Zn from polluted soils: A review. Geoderma 2019, 343, 235–246. [Google Scholar] [CrossRef]
Figure 1. Sampling area (A) and sampling points in different bedrocks (mudstone, marl, greywacke, shale, sandstone, Quaternary sediments and limestone) distribution area (B).
Land 14 00176 g001
Figure 2. Total soil Cd concentrations grouped by type of bedrock in Chuxiong City.
Land 14 00176 g002
Figure 3. Principal component analysis (PCA) of different types of bedrock soils (mudstone, marl, greywacke, shale, sandstone, Quaternary sediments, and limestone).
Land 14 00176 g003
Figure 4. Characteristics of major elements in different types of bedrock soils. (A) UCC-normalized pattern of major elements of the loess in Chuxiong City. (B) Weathering index of different types of bedrock soils (BA, W, CIA, and KI).
Land 14 00176 g004
Figure 5. Random forest applied to Cd source contribution (red indicates that an increase in percentage concentration makes a positive contribution to the soil Cd concentration, and blue indicates that an increase in percentage concentration makes a negative contribution to the soil Cd concentration).
Land 14 00176 g005
Table 1. Analytical quality of experimental results.
StandardGBW07403 (GSS-3)GBW07447 (GSS-18)
Al2O3
(%)
TFe2O3
(%)
CaO
(%)
MgO
(%)
Na2O
(%)
K2O
(%)
SiO2
(%)
Zn
(mg/kg)
Cu
(mg/kg)
Cd
(mg/kg)
Pb
(mg/kg)
Hg
(mg/kg)
Standard value12.2%2.00%1.27%0.58%2.71%3.0474.7231.019.50.1520.00.015
Mean value11.6%1.96%1.22%0.62%2.82%2.9774.0330.619.50.1419.30.016
RSD%0.100.100.201.071.260.90.041.911.1060.502.62
Specification RSD%≤8≤8≤8≤8≤8≤8≤8≤10≤10≤10≤10≤10
ΔlgC−0.03−0.01−0.020.030.0170.01−0.0040.0060.00040.040.010.03
Specification ΔlgC≤0.04≤0.04≤0.04≤0.04≤0.04≤0.05≤0.04≤0.05≤0.05≤0.05≤0.05≤0.05
The data control standards referenced are DZ/T 0258-2014, DZ/T 0130-2, and DD2005-03.
Table 2. Contents of metal, oxides, pH, and TC of different types of soil.
SoilPb
(mg/kg)
Zn (mg/kg)Cr (mg/kg)Cu (mg/kg)Hg (mg/kg)K2O
(%)
MgO
(%)
Na2O
(%)
CaO
(%)
SiO2
(%)
Fe2O3
(%)
Al2O3
(%)
pHTC
(%)
Mudstone77.0687.68127.2738.610.062.221.500.460.4761.816.0615.315.8737.07
Marl28.86229.12108.4634.380.082.451.370.550.5161.626.2515.636.0034.69
Greywacke35.0979.1094.1734.140.062.091.000.330.5366.035.4314.925.4633.01
Shale24.9270.58112.4927.890.041.871.310.722.3361.184.8812.606.9434.16
Sandstone34.9095.39114.9839.540.042.841.750.550.6861.896.3215.686.0932.00
Quaternary33.1588.85124.9031.640.061.851.220.470.5462.845.6113.886.0138.45
Limestone24.9574.52110.9235.690.032.431.631.510.8461.235.5714.126.7819.07
Disclaimer/Publisher’s Note: The statements, opinions and data contained in all publications are solely those of the individual author(s) and contributor(s) and not of MDPI and/or the editor(s). MDPI and/or the editor(s) disclaim responsibility for any injury to people or property resulting from any ideas, methods, instructions or products referred to in the content.

