
A Digital Twin Framework to Improve Urban Sustainability and Resiliency: The Case Study of Venice


Abstract
:1. Introduction
2. State-of-the-Art
3. Urban DT Key Features
- Technology: This includes the digital infrastructure, such as IoT devices, sensors, and communication networks, that enable data collection, analysis, and connectivity among various city systems.
- Data: The collection, management, and utilisation of data are crucial for informed decision making. This encompasses big data analytics, data privacy, and security measures to ensure that the information collected is used effectively and responsibly.
- People: The involvement of citizens, stakeholders, and government entities is essential. This component focuses on community engagement, public participation, and the role of residents in shaping their urban environment.
- Governance: Effective governance structures and policies are necessary to manage the complexities of a smart city. This includes regulatory frameworks, collaboration among different levels of government, and strategies for sustainable development.
Monitorable Data
- 1.
- Energy: the assessment, monitoring, and forecasting of city energy flows.
- Electricity: Main and secondary electrical devices and loads (up to the single socket), energy produced from distributed renewable sources (photovoltaic plants, cogenerators, wind power, etc.), and electricity stored through batteries or converted to hydrogen for future usage. By monitoring electrical flows, it is possible to optimise consumption and production according to the parameters and preferences of users [42].
- Thermal loads: Air conditioning is one of the main energy consumptions of buildings [43]. By knowing the preferences of users, the internal and external thermohydrometric conditions, the national regulations, and the availability of thermal energy, it is possible to reduce energy loads for air conditioning [44,45]. Moreover, many cities are using district heating to reduce consumption during winter seasons, so they can be connected to a DT system to optimise the load–production profiles [46,47,48,49].
- Hydrogen, gas, and other energy vectors: Electricity is not the only energy vector used inside a city, but natural gas, hydrogen (in future), and other energy vectors (wood wastes, biodiesel, etc.) are commonly used to produce power or heat. The control of the flows and the potential benefits of integrating hydrogen into the energy mix can be exploited by using DTs [50]. This would be particularly suitable in cities with a wide availability of water as Venice.
- 2.
- Environment: the real-time assessment and monitoring of the main environmental quality parameters.
- Noise: As with air quality, noise must also be monitored in Italy following the D.lgs 42/2017 (Italian legislative decree). Although the decree is inherent to open environments, the risk assessment due to noisy environments also appears in the INAIL (National Institute for Insurance against Accidents at Work) recommendations and is, therefore, one of the risks present in the D.lgs 81/08 on safety in the workplace. Noise monitoring, also due to the presence of machinery and industrial activities, is a fundamental element of an urban DT to increase the safety and comfort of citizens [53,54].
- Lighting: The maintenance of an adequate level of illuminance on public land is required by the Italian D.lgs 81/08, and the recommended levels are expressed in national regulations. In addition to the evaluation of the maintenance of these levels, the proper management of lighting systems includes a reduction in energy consumption, allowing the lights to be switched off or dimmed according to the presence and activities carried out both indoors and outdoors [55,56,57]. The management and control of lighting systems can also reduce light pollution during nighttime.
- 3.
- Water: the monitoring and forecasting of water consumed, collected, and stored.
- 4.
- Green: the monitoring of natural matrices and agriculture.
- Vegetation system: The monitoring of plant essences, irrigation, and the state of health. Through proper monitoring, it is possible to predict pruning and mowing interventions, any risk elements due to weeds or pollutants, optimise water consumption, and provide for the removal of trees at risk of falling [66]. In addition, it is also possible to assess the risk of fires due to the presence of dry areas.
- Agriculture: DT is today used in agriculture to develop virtual models of farming entities to enhance productivity, decision making, and quality. Key applications include the real-time monitoring of variables, like soil health, resource optimisation for water and fertilisers, predictive analytics for forecasting crop issues, precision farming for controlled environments, and machinery management for predictive maintenance [67,68].
- 5.
- Safety and Security: the maintenance of high standards of physical and digital security, protection, and prevention of citizens’ safety.
- Cyber security: The application of cryptographic standards to protect data flow and storage, separation between the external and internal network, the use of authentication portals, databases on local servers, firewalls, and a separate sensor network not connected to the internet [56,69,70,71,72]. Cyber security is a very sensitive topic in urban applications, where accessing the data can cause severe damage on working activities and expose citizens to risk.
- Physical security: The assessment of safety risks inherent in the use of actuators and sensors (unwanted or dangerous actuation) [73,74] and the installation of sensors for physical security (gas leakage [75], flooding [76], seismic [77], short circuit, and electrocution [78], fire [79,80], workers safety [81,82], etc.).
- Management of emergency interventions: The automatic opening of intervention tickets and priority to critical interventions (as an example where is the possibility of injured people) [83]. Real-time analysis of the status of the intervention and data sharing among the various connected emergency services (fire brigade, police, first aid, etc.) [84,85].
- 6.
- Maintenance: the monitoring, fault forecasting, and scheduling of maintenance interventions.
- FDD: The monitoring of the operating status of connected systems with predictive capabilities for fault detection and diagnosis (FDD), monitoring also extended to connected sensors and network devices. By monitoring the status of the systems, it is possible to manage maintenance interventions, organise warehouses for spare parts, and keep the systems efficient, with a consequent reduction in inefficiencies and operating costs [86,87,88,89].
- 7.
- Presence and activities: the monitoring, forecasting, and management of occupation.
- Occupancy: Presence monitoring using dedicated hardware, such as radar sensors and cameras, and other data coming from device usage, lights, computers, etc. [92]. Occupancy data can be used for the evaluation of presence, for medical prevention, as example from COVID SARS cases [93,94], and for the optimisation and reduction in energy consumption [95] due to lighting [96] and air conditioning [97], and to ensure the safety of environments from external intrusions.
- Activity: Evaluating the activity carried out is an additional parameter useful for improving the accuracy of control over air conditioning and lighting systems. Thermal loads and recommended illuminance may vary depending on the type of activity carried out in the environment, an environment that could be used for different and simultaneous activities [98,99,100].
- 8.
- Wastes and pest control: monitoring and forecasting for pest control and waste produced.
- Pest control: The monitoring of pests (rodents, insects) and IoT capture systems with remote sensors for the identification of pest presence [103,104]. The automation of pest monitoring systems makes it possible to act in time before the creation of out-of-control colonies and their interference with inhabited spaces [105].
- Wastes: The monitoring and evaluation of trash bins through dedicated sensors and the notification of filling, the assessment of the mass of waste produced, and its travel through the territory considering construction waste and special waste [106,107,108]. The automatic management and evaluation of the wastes produced provide valuable information on environmental pollution and allow to optimisation waste management operations, avoiding the proliferation of animal pest colonies [109].
- 9.
- Mobility: the monitoring and forecasting of parking, micro-mobility systems for public and private transport, and charging systems for electric vehicles.
4. Methodological Approach: A Three-Axis Framework for DT Implementation
- Analysis of the state-of-the-art for DT systems at an urban scale. As outlined in the work of Bauer et al. (2021), various cities are progressing towards the digital transition by developing their own urban DT systems [26]. Many cities are starting to adopt DT systems; however, the application is usually focused on a single topic of urban management.
- The development of a list of general requirements for the proper development of a DT system, based on guidelines, such as detailed in Luarini’s work about smart city planning [40]. Moreover, the international framework for future development was also considered, which focuses on the main fields of intervention to be addressed. In this way, an open-access monitorable database is fundamental to start the assembly of general requirements.
- The definition and aggregation of the investigation topics detailed in international frameworks and the state-of-the-art can be divided into three main axes: mobility, energy, and residence. A higher number of axes would lead to more different services and platforms being developed, increasing the overall complexity of the resulting DT. Instead, based on the monitorable data study and state-of-the-art, a lower number of services would lead to an excessive simplification that does not suit the international framework for sustainable development.
- The identification for each axis of a list of fields of intervention can define where it is possible to digitalise the urban environment processes. Then, the fields of interventions are translated into operative services, for which the DT system shall be made. As an example, the field of intervention “monitoring of air quality levels” of the mobility axis shall be contained in the “environmental impact service”.
- The analysis of the data available in the Venice city open-source database.
- The identification of new data to be integrated into the Venice data portal to establish a DT system. If data related to a specific service are available in the database, then it must be used in the DT system; if no data are available, it is recommended to add new tables to make information available for the citizens, for the future development of the DT system using innovative and secure technologies [133,134,135,136,137,138], or other uses (as an example for a private company that wants to improve urban quality of life using such data).
- City mobility: The management of road and channel infrastructure and traffic analysis, including pedestrian flows, parking, environmental pollution, and a consequent reduction in traffic.
- Energy: The energy management of city infrastructures and buildings, capable of optimizing and reducing energy consumption, considering the potential beneficial effects of developing local energy communities, and outlining possible future scenarios.
- Resiliency: The management of emergencies, such as floods, earthquakes, fires, heat islands, waste, city parks, and change detection on new buildings due to urbanisation.
4.1. General Directives for Mobility Axis
- Reduction in fossil fuels and traffic in public and private transport: The optimisation of routes with consequent prediction and reduction in traffic and the monitoring of environmental pollutants produced and carbon footprint; the extension of the monitoring service also to maritime traffic within the canals of Venice; the management and scheduling of electric vehicle (EV) charging stations.
- Energy optimisation of on-road systems: the efficiency of public lighting and traffic light systems, point-to-point remote control of public lighting systems, adaptive street and pedestrian lighting, and the evaluation of infrastructure management costs.
- Service management: predictive road lighting by machine learning and real-time data analysis (probabilistic, geo-referenced, and prioritised for critical services), the intelligent monitoring of parking lots, the monitoring of electrical vehicles recharging stations, a reduction in intervention time of emergency and security services (fire brigades, ambulances, police, etc.) through best route identification, data infrastructure shared among different stakeholders (governance, mobility service companies), and intelligent management of traffic light systems based on traffic data.
- Travel: the monitoring of the flows of people (tourists, citizens, and commuters), through and within the different urban areas to identify the most used routes, and the most visited areas, providing indications and guidelines for urban planning.
4.2. General Directives for Energy Axis
- Reduction in fossil fuels: the optimisation and reduction in energy consumption from fossil sources, integration with RES (renewable energy sources), cogeneration, heating by traditional gas boilers, and the management of REC (renewable energy communities); monitoring natural gas and LPG (liquid propane gas) is necessary for assessing carbon emissions.
- Reduction in electricity consumption: referring to air conditioning and lighting systems through increasing the efficiency of electrical devices, the management and control of air conditioning systems, integration with REC and cogeneration systems, adaptive lighting, and the assessment of energy costs; the storage capacity of batteries must be considered for the smart management of energy consumption.
- Smart planning of intervention: based on real consumption data for building upgrading and interventions of the built environment (insulation, fixtures, etc.) and pre-existing energy systems (boilers, air conditioners, etc.) with the capability of forecasting the advantages in terms of energy savings due to the installation of new systems with greater efficiency (geothermal heat pumps, congenators, etc.) and new renewable energy sources (PV, wind, hydrogen, etc.).
- Energy management system: the development of an integrated system able to manage, control, and predict energy consumption through predictive algorithms at different scales (from single building up to districts). All the data collected can be integrated into a unified management system dedicated to city management. It will, therefore, be possible to make this system available both to the public administrators and energy managers, with complete control over the various elements, and to the public through open data.
- Hydrogen systems: the monitoring of hydrogen production, storage, and flows; this element will be necessary in the future for the implementation of natural gas and hydrogen mixtures in pipelines [143,144] and to divide the quota between fossil fuel usage and hydrogen for the assessment of carbon emissions.
4.3. General Directives for Resiliency Axis
- Protection from natural disasters and extreme events: identification and early warning for extreme events (heavy rains, hails, floods, fire, etc.), the assessment of risk area, the management of mitigation strategies, support to emergency planning with what-if analysis, the early identification of heatwaves, the identification of urban heat islands, early warning system, coastal erosion assessment, and the centralisation and monitoring of emergency procedures.
- Monitoring of built environment resilience: the analysis of the displacement map and identification of area subject to hydrogeological instability, maintenance intervention planning, and renovation planning.
- Preservation of cultural heritage and strategic infrastructure: dedicated and more accurate track change analysis, the analysis of pollutants impact on building structures, maintenance and restoration intervention planning, and dedicated what-if analysis for extreme events impact.
- Anthropic impact and urbanisation: air quality and noise monitoring and forecasting, land use assessment, waste and dump monitoring on the territory, urban track-change, comparison with land register plans, what-if analysis for urban planning, and the identification of illegal dumps and unauthorised buildings.
5. Results and Discussion
5.1. Venice City and Open Data
5.2. Mobility Axis
5.2.1. Fields of Intervention
- Evaluation of fossil fuel use by traffic monitoring.
- Monitoring, management, and forecasting of traffic.
- Monitoring, management, and forecasting of public lighting systems.
- Monitoring, management, and forecasting of parking lots.
- Scheduling and management of electric vehicle charging stations.
- Centralisation of traffic light control and data integration with the municipal traffic management centre.
- Integrated management of all assets on a single system equipped with dashboards, satellite data, and monitoring, management, and simulation capabilities.
- Installation of new sensors and devices dedicated to the analysis of the status of roads, streets, and waterways in real time.
- Intelligent and dynamic priority to emergency vehicles.
- Monitoring of air quality levels.
- Monitoring of noise pollution levels.
- Data integration with the other services (energy and resiliency).
- Data availability to citizens and stakeholders.
- Maintaining high cybersecurity standards and a full risk regime.
- Privacy and protection of sensible data.
- Creation of a dedicated ticketing and assistance system.
5.2.2. Mobility Services
- Traffic and parking service: Dedicated to the citizen and public administration, possibly open to third parties. The service scope is to manage and record mobility data (road and maritime), providing information on traffic and parking to control (for public administration) and information (for citizens). Parking lots can be monitored to ensure the effective presence of parking spaces before travel and to avoid circular routes that can increase on-road time and pollution. This assessment can be carried out through image analysis and computer vision, expanding monitoring even on free road stalls [110,111]. This information can then be made available to citizens through mobile apps and variable message signs, as well as being integrated into an application dedicated to parking management for the purchase of parking tickets and payment control. The service will also provide data to the road management service for traffic light control and limited traffic areas. Pedestrian flows can be analysed by the same system and reported within dedicated maps, which, in the case of the insular Venice, can also be significant for designing strategies and policies to counteract over-tourism.
- Environmental impact service: The service will be entrusted to the urban manager and will use traffic data and dedicated sensors (IoT) to calculate the pollution produced by on-road and naval mobility and then monitor its evolution in space and time. The municipal administration will be able to use those data to carry out interventions aimed at reducing environmental and noise pollution or to highlight any critical situations with punctual accuracy on all monitored roads and waterways. Considering the presence of air pollution services managed by ARPA Veneto (Regional Agency for Environmental Prevention and Protection of Veneto region), the data could be integrated between the two databases to increase the accuracy of forecasting. The main pollutants to be monitored are reported in point “#2 Environment” of the list in the “Monitorable Data” section. The analysis of these data will also allow the operator to monitor situations of potential accidents, such as the presence of fires (increase in PM and localised CO2), gas leakages on the pipeline system, or safety alarms. The electricity consumption data of street lighting can also be integrated into the service with the calculation of the average savings in terms of tons of CO2 equivalent.
- Roads and waterways management service: The proposed service allows the management and monitoring of all roads, streets, and waterways present in the city: public lighting, traffic light systems, and digital signs. The service shall also be able to propose automatic strategies for the reduction in traffic, automatically controlling road intersections according to the logic of green wave and smart priority (emergency vehicles). Public lighting systems on roads (driveways, cycle, and pedestrian paths), and waterways shall be controlled automatically by the service based on cameras, light meters, and presence sensor data, as well as through sonar, radar, and the GPS localisation system of all circulating public and private vessels. This would allow lights to be automatically reduced according to actual need. Turning off lights is not an option because of safety navigation concerns. However, regulating the light fluxes can reduce the overall energy consumption of lighting systems as well as reduce lighting pollution.
5.2.3. Venice Open Data Analysis
5.2.4. Interaction Among Services, General Directives, and Fields of Intervention
5.3. Energy Axis
5.3.1. Fields of Intervention
- Assessment and reduction in the use of fossil fuels (methane, LPG).
- Monitoring and forecasting of hydrogen production and storage.
- Monitoring and management of RES with and without storage.
- Monitoring and management of air conditioning systems.
- Use of occupancy data for energy optimisation (lighting and air conditioning).
- Development of Renewable Energy Communities (RECs).
- Centralisation and unification of data from BMS and BACS on a city platform.
- Integrated management of all assets on a single system (with dashboards, satellite data, monitoring, management, and simulation capabilities).
- Installation of new sensors and devices dedicated to the analysis of energy consumption systems (air conditioning, power systems, lighting, handling, elevators, etc.).
- Intelligent and dynamic prioritisation of RES sources.
- Monitoring and control of the operating status of the devices (FDD—fault detection and diagnosis).
- Safety analysis (full-risk assessment).
- Data integration with existing databases and services.
- Accessibility to data to stakeholders.
- Maintaining high cybersecurity standards.
- Privacy protection.
- Scalability of systems, from the single asset to the smart city level.
- Creation of a dedicated ticketing and assistance system.
- Multizone climate management: temperature regulation according to different modes of use and environments.
- Automatic identification analysis of efficiency interventions (replacement of fixtures and installation of thermal coats, insulation, reduction in thermal bridges, use of low-emission paints).
- Replacement of gas heating systems with more efficient systems (heat pumps).
- Installation of new RES plants (photovoltaic, wind, etc.).
- Maintenance of indoor environmental comfort standards.
- Combined interventions for NZEBs (near zero energy buildings).
5.3.2. Energy Services
- Energy service: Dedicated to the citizen and the manager, and possibly open to third parties. The service will be responsible for managing and recording data on production from RES, consumption, and exchange of electricity dedicated to the establishment of REC. Starting from the data monitored within the infrastructures in terms of electricity produced and consumed, it is possible to monitor and optimise energy flows, preferring the renewable quota for the power supply of all the connected systems monitored by the DT. The consumption of individual devices equipped with smart sockets or digital communication interfaces (heat pumps, lights, load lifting motors, etc.) and the electricity produced in real time by the connected RES systems (photovoltaic, wind, etc.) or cogeneration systems can be monitored. Electricity can be fed into the grid, stored on batteries, converted into green hydrogen, or used on-site, preferring its use within neighbouring infrastructures (energy districts) whenever possible, thus saving energy the lost by its transport. The service shall be extended to any private RES systems, providing real-time and predictive data on the energy produced and consumed locally and globally. Any faults or malfunctions can be detected based on the data and transmitted to the management and maintenance to reduce downtime and maintain a high overall efficiency. The monitored data will, therefore, have different levels of authorisation to allow them to be read and written by the managers of the individual connected infrastructures, the stakeholders who will rely on this system, and the municipal administration (which has full access).
- BACS service: The service is dedicated to building managers and will use data from sensors and installed actuators (IoT) to monitor the status of all connected systems belonging to the same building. The manager will be able to use these data to carry out further interventions and maintenance activities, as well as have a complete overview of the operating status of all connected systems. This will make it possible to propose coherent strategies based on the current situation of buildings aimed at reducing environmental pollution, reducing the carbon footprint, increasing sustainability and resilience, and reducing inefficiencies. The analysis of these data will also make it possible to monitor accidental situations, such as the presence of dangerous failures from a safety point of view (e.g., breakage of elevators) or alarms (interruption of power). The service will also manage the efficiency parameters of the systems starting from electricity consumption and production data, to control and regulate thermal, air conditioning, and lighting systems and all non-critical and regulable systems. Occupancy data for the reduction in consumption (for example dimming lights and regulating air conditioning systems in the event of the absence of people inside the rooms), data on energy stored through storage, and ticketing data can be integrated into the service.
5.3.3. Venice Open Data Analysis
5.3.4. Interaction Among Services, General Directives, and Fields of Intervention
5.4. Resiliency Axis
5.4.1. Fields of Intervention
- Monitoring of flooding and rainwater: The DT can be integrated with flooding data for critical infrastructures, concerning the mobility systems most subject to this type of scenario (underpasses), and all those systems subject to obstructions due to the presence of external agents (gratings, rainwater disposal wells, etc.). The management of these systems can be achieved through dedicated sensors supported by weather data and statistical analysis tools (last maintenance, adverse weather) to ensure the fulfilment of all maintenance operations and the correct operation of anti-flooding systems. This process can also integrate data from existing flow meters or through punctual analysis on nodes of interest (underpasses, underground areas, riverbanks, etc.) to ensure high precision and accuracy and display the status of the monitored systems, allowing operators to act in time through targeted interventions, thus reducing critical and dangerous situations, for example by closing a road before its flooding and giving travel alternatives to citizens. The presence of any flooding should be signalled to the operators through automatic alarms able to detect even potentially dangerous situations (i.e., excessive water on the road surface or high water levels on rivers). In addition, the wastewater collection tanks used for the disposal of water of meteoric origin should also be monitored. It is important to install, where necessary, digital road signs for vehicles (traffic lights), depending on the type of alarm and the level of danger. The monitoring data should be integrated centrally with Earth Observation data and transmitted by independent and high-reliability networks (GPRS or SatCom). Using satellites, it is possible to develop a “change detection” analysis capable of detecting the differences between two scans carried out at different times [166,167,168]. Given the presence of a flooding control system for the historic centre of Venice, these systems should be implemented for the entire area outside the lagoon and interfaced to get information on the water level in the lagoon [140,165,169].
- Fire risk analysis: Using satellite data and “change detection” techniques based on vegetative indices, it is possible to monitor the areas at risk of fire and the possible extension of fires [170,171,172]. In addition, it is possible to estimate the environmental damage on the territory in terms of area burned and ecosystemic damages. Using visible and hyperspectral bands, it is also possible to identify high-risk areas of fire, such as illegal landfills [173,174,175].
- Heatwaves and urban heat island: The use of satellite surveys for the evaluation of heatwaves is an advanced methodology that exploits the capabilities of satellites to detect and monitor thermal variations on the Earth’s surface. This approach, in combination with medium–long range weather forecasts, provides a precise and detailed assessment of heatwaves, allowing for a timely and targeted response to mitigate the associated risks. The evaluation activities of the heatwaves are based on the processing of the time series of satellite images acquired during the period of interest [176,177,178]. The urban heat islands are areas subject to higher temperatures than the neighbouring territory due to specific local urban geometry and the building and ground pavement materials used. The raw satellite imagery is then processed to remove any artefacts, correct geometric distortions, and calibrate thermal data to obtain accurate measurements of surface temperatures. Using advanced thermal analysis and anomaly detection algorithms, these areas can be identified. The analysis is carried out by studying the historical average of local temperatures or using pre-established threshold limits. Areas with high temperatures can then be segmented into polygons to create a vector representation of these phenomena and provide the city manager with an accurate and detailed visualisation of the territory, allowing any urban planning interventions aimed at reducing their intensity or size [179,180,181].
- Urbanisation analysis: Comparing two satellite images with a change detection analysis, it is possible to identify the change in building geometry and identify anomalies by comparison with the land registry database [182,183,184]. The result is represented by a vector file composed of one or more polygons that shows every intervention made during the period between the images.
- Waste and pest control: Using satellite images and GIS data, it is possible to identify wastes [173,174,175], track its movements [109], control landfills, and identify illegal dumps. Pest control can be made by dedicated sensors able to monitor traps and movement and analyse images to obtain information on the fauna present inside urban and agricultural areas. Using these data, specific intervention strategies can be adopted to reduce pest numbers.
- Urban green areas and agriculture: Vegetative index and weather data obtained from EO services can be combined with water data (rivers water levels, meteoric water basins, etc.) to provide information on actual crop status and to plan future interventions to increase water basins and quality, preserving food production and urban green areas also in case of extreme heat [185,186,187]. The risk is not only related to heat but also cold or hail. Therefore, the development of an automatic alert system can help farmers to save their crops allowing them to act in time. Data can be also obtained from local sensors or dedicated UAVs (unmanned aerial vehicles) [188,189,190,191].
5.4.2. Resiliency Services
- Emergency monitoring and coordination service: Through Earth Observation data and meteorological IoT sensors distributed throughout the city, the service allows for the monitoring of weather, providing on-time alerts in case of potentially dangerous situations (fire, flooding, tornadoes, earthquakes, etc.). The data must be updated in real time in the event of extraordinary weather conditions, including intense thunderstorms, strong winds, heatwaves, drought, heavy snowfall, excessive pollutants, hail, and other severe events. The service must also integrate tide forecasting data to monitor the lagoon and surrounding rivers, air quality and noise data, data from ARPA Veneto, NOAA datasets on sea conditions, and any other relevant database. The service will allow citizens to be informed in advance about potential adverse events, giving the competent authorities the time to activate emergency plans as well as monitoring the real-time situation with high precision. Emergencies must be coordinated centrally to quicken response and recovery interventions and to not cause interferences between the various authorities. The service must provide a communication system to allow rapid dissemination of information and must be manned by a control room belonging to the service for civil protection. Using georeferenced data from the hydrogeological risk management service and from the services belonging to the mobility axis (traffic and parking service and road and channels management service), it will be possible to act with real-time information and to make consistent emergency plans based on real data and the road situation. Emergencies must also include extreme heat phenomena that represent a significant risk to public health and agriculture, serious road accidents, landslides, collapses, explosions, and all situations that require timely intervention.
- Infrastructures and land monitoring service: All maintenance interventions and the state of conservation must be planned within this service, which will have to consider separately the protected cultural heritage and the city’s strategic infrastructures. The separation is necessary to ensure the adoption of higher standards relating to data processing for all structures considered components of the World Heritage Sites or that may jeopardise the safety of citizens or the performance of production and services activities. The service must allow the development of what-if scenarios to analyse the impact (economic, social and mobility) due to the execution of the interventions [192]. Data can be acquired through IoT sensors placed on the territory (accelerometers, Lidar, crack meters, etc.), from the energy axis (BACS service), have a historical origin (last maintenance), or be based on information from citizen reports. FEM models can be used for data analysis [193,194,195] or FDD [89,196,197,198] in the case of interventions on structures, or it is possible to use other models for the assessment of costs [199], downtime [200,201], environmental impact [202], life cycle [200,203], and all other parameters of interest by the competent authority. Using hydrological and rainfall data from monitoring stations distributed along watercourses, the lagoon, basins, and flood risk areas, the service will allow us to monitor the level of the rivers, the water flows and tidal movements. Data relating to water quality (pollutants, turbidity, etc.) and soil erosion can also be integrated into the service. It will make it possible to identify potential risk situations related to hydrogeological instability and will allow authorities to take preventive and mitigating actions before the occurrence of accidental events. The service must also consider the maintenance of public land, including gardens, parks, and uncultivated territories owned by the municipality, to ensure the absence of fire risk or the proliferation of pests.
- Urban planning: The service is intended to control the evolution of urban areas and land register discrepancies over time by a track change analysis performed using Earth Observation data. Moreover, using the same data, it will be possible to monitor the presence of unauthorised building interventions, the presence of illegal landfills, and the tracking of waste through the territory. The service must also allow the assessment of the effects due to fire scenarios and potential areas at risk and to draw safety perimeters for preventing any risks for the population. The service must include a toolkit to allow urban planning (districts, roads, gas pipelines, power lines, etc.) according to city expansion through what-if scenarios supported by AI. Finally, by monitoring and forecasting temperatures and climate patterns, the service can identify areas at high health risk due to the presence of heat islands and coordinate targeted interventions to mitigate their effects.
5.4.3. Venice Open Data Analysis
5.4.4. Interaction Among Services, General Directives, and Fields of Intervention
6. Discussion
6.1. Improvements Related to the Mobility Axis
- Service Management: the number of individual free and occupied stalls in specific areas of interest, analysis of permanence time and stops on monitored roads and waterways, forecast and real-time data of availability of parking spaces, accidents, disservice time, and smart traffic light location.
- Travel: data relating to sensors location, measurements, and forecast (IAQ, noise, smart lights’ location, crowding, public transport usage, parking availability, etc.).
- Reduction in fossil fuels and traffic in public and private transport: traffic analysis data on primary and secondary roads, travel times, carbon footprint due to public and private mobility, average speed on roads, location, and use of EV charging stations.
- Energy optimisation of on-road system: the monitoring of energy consumed for street and waterways, lighting and other devices, and the evaluation of energy consumption on a daily/monthly/annual basis.
6.2. Improvements Related to the Energy Axis
- Reduction in fossil fuels: Energy produced by renewable energy systems (RESs) encompasses the number of installations, types of systems in place, and the energy generated on a daily, monthly, and annual basis. To support the reduction in fossil fuels, it is essential to monitor both average and peak power output over these periods, alongside tracking revenues from energy sales. Additionally, assessing the operational status and geographical location of each installation provides critical insights. Incorporating data on energy storage and the equivalent amount of CO2 saved further enhances the evaluation process. These comprehensive metrics enable an accurate assessment of how RESs contribute to lowering fossil fuel consumption, highlighting their relevance and positioning within the energy landscape.
- Reduction in electricity consumption: Energy consumption by buildings and facilities involves the detailed tracking of energy used on a daily, monthly, and annual basis, encompassing specific systems, such as air conditioning and indoor lighting. To effectively reduce electricity usage, it is essential to monitor both instantaneous peak power and average power across these timeframes, along with associated energy costs. Additionally, collecting data on the operational status, the purpose of each building, and their locations is necessary to identify areas with significant consumption and determine where energy efficiency measures should be applied. Monitoring the percentage of energy sourced from renewable energy systems (RES) and calculating the equivalent amount of CO2 produced further enhances the understanding of overall energy performance. By integrating these comprehensive metrics, organisations can accurately assess energy usage patterns, identify high-consumption areas, and implement targeted strategies to minimise consumption and improve overall energy efficiency.
- Preventive and predictive maintenance: Gathering comprehensive data on energy efficiency improvements is essential for enhancing overall efficiency. This includes details about the positioning of new sensors and systems installed for activities such as lighting and air conditioning, as well as information on the target areas, cost, timeline, and location of these installations. Additionally, tracking the initial and final energy ratings of the facilities or systems involved allows for continuous monitoring of the long-term benefits of energy saving measures. Monitoring the connected system status, the date of the last maintenance, and the operational condition of these systems facilitate effective planning for future predictive maintenance. By integrating these elements, organisations can effectively evaluate the impact of energy efficiency initiatives, ensure sustained benefits, and optimise the performance of their energy-saving strategies.
- Smart planning of intervention: Energy efficiency interventions encompass various types, such as maintenance, efficiency upgrades, and restoration, each associated with specific costs, timelines, and locations. Detailed information on these interventions includes the starting and final energy classes of the facilities or systems involved, as well as the power installed by renewable energy systems (RES). Monitoring local energy consumption, particularly within renewable energy communities (RECs), is crucial for coordinating energy production and usage. This involves collecting data on energy fed into and drawn from the grid, enabling the optimisation of renewable resource utilisation and contributing to the reduction in overall energy impact. By integrating data on energy efficiency measures with insights from local energy consumption patterns, organisations can effectively plan and implement interventions that enhance energy performance, optimise RES deployment, and achieve sustained energy savings within their communities.
- Energy management system: monitoring of the energy consumed on a local (district/community) level and consequent estimation of the energy injected, stored, and subtracted from the grid.
- Hydrogen system: Including comprehensive information about the monitored installations is fundamental for effective oversight. This encompasses details on the production and storage of hydrogen from renewable energy systems (RES), as well as the placement of new sensors and systems, such as lighting and air conditioning controls. Currently, data on hydrogen production amounts and storage capacities are essential, and future monitoring will extend to hydrogen flows within gas ducts. By integrating information on the positioning and operation of these new sensors and systems with hydrogen-related metrics, organisations can ensure efficient management and optimisation of their energy infrastructure. These elements are vital to enhance renewable resource utilisation, support the expansion of hydrogen infrastructure, and maintain the robust oversight of all energy systems.
6.3. Improvements Related to the Resiliency Axis
- Urban planning and maintenance: implement a dynamic information system for construction sites, land use, and maintenance using extensive sensor networks that monitor infrastructure, traffic, and city activities; integrate real-time and historical data for predictive simulations to assess the impacts of urban expansion or new constructions; develop a 3D parametric model of buildings, streets, and public properties to enhance planning and visualisation, linking data with the city’s physical representation.
- Disaster response and civil protection: enhance data analysis with real-time information on critical conditions to enable effective crisis scenario simulations; establish an instant feedback mechanism for emergency data to ensure timely and efficient responses.
- Cultural heritage: upgrade Venice’s open data portal with a real-time database by combining sensor data on building facades (monitoring humidity, movement, integrity, and geometry) with satellite data to reduce errors; create a 3D parametric interactive model of historic buildings to facilitate restoration simulations and prevent damage.
- Urban pollutant surveillance: develop a dynamic mapping system for pollutant sources and correlate pollutant levels with health indicators; utilise a Digital Twin (DT) system to analyse the interactions between climate change, pollution, and public health and propose mitigation actions through simulations.
7. Conclusions
Author Contributions
Funding
Data Availability Statement
Acknowledgments
Conflicts of Interest
References
- Ashton, K. That Internet of Things Thing. RFID J. 2009, 22, 97–114. [Google Scholar]
- Bai, C.; Dallasega, P.; Orzes, G.; Sarkis, J. Industry 4.0 Technologies Assessment: A Sustainability Perspective. Int. J. Prod. Econ. 2020, 229, 107776. [Google Scholar] [CrossRef]
- Sezgin, S. The Third Industrial Revolution: How Lateral Power Is Transforming Energy, the Economy, and the World. Turk. J. Bus. Ethics 2018, 11, 50–52. [Google Scholar] [CrossRef]
- Schwab, K. The Fourth Industrial Revolution, by Klaus Schwab|World Economic Forum; World Economic Forum: Cologny, Switzerland, 2017. [Google Scholar]
- Grabowska, S.; Saniuk, S.; Gajdzik, B. Industry 5.0: Improving Humanization and Sustainability of Industry 4.0. Scientometrics 2022, 127, 3117–3144. [Google Scholar] [CrossRef]
- European Commission. Communication from the Commission Establishing Union-Level Projected Trajectories for the Digital Targets; European Commission: Brusselsg, Belgium, 2023.
- Presidenza del Consiglio dei Ministri Piano Nazionale Di Ripresa e Resilienza. Piano Nazionale Di Ripresa E Resilienza 2021. Available online: https://www.italiadomani.gov.it/content/dam/sogei-ng/documenti/PNRR%20Aggiornato.pdf (accessed on 29 December 2024).
- Verschuur, J.; Koks, E.E.; Hall, J.W. Global Economic Impacts of COVID-19 Lockdown Measures Stand out in Highfrequency Shipping Data. PLoS ONE 2021, 16, e0248818. [Google Scholar] [CrossRef]
- Vet, J.M.D.E.; Nigohosyan, D.; Ferrer, J.N.; Gross, A.-K.; Kuehl, S.; Flickenschild, M. Impacts of the COVID-19 Pandemic on EU Industries; Policy Department for Economic, Scientific and Quality of Life Policies, European Parliament: Strasbourg, France, 2021. [Google Scholar]
- Zamfir, I.C.; Iordache, A.M.M. The Influences of Covid-19 Pandemic on Macroeconomic Indexes for European Countries. Appl. Econ. 2022, 54, 4519–4531. [Google Scholar] [CrossRef]
- Cinquepalmi, F. Towards (R)Evolving Cities Urban Fragilities and Prospects in the 21st Century, the Challenge of Pandemics in Urban Societies, 1st ed.; Diapress: Florence, Italy, 2021; Volume 1, ISBN 978-88-3338-137-4. [Google Scholar]
- Baldwin, R.; Weder, B. Economics in the Time of COVID-19; CEPR Press: Washington, DC, USA, 2020. [Google Scholar]
- Grieves, M.W. Digital twins: Past, present, and future. In The Digital Twin; Crespi, N., Drobot, A.T., Minerva, R., Eds.; Springer: Cham, Switzerland, 2023; pp. 97–121. [Google Scholar] [CrossRef]
- Mateev, M. Industry 4.0 and the Digital Twin For Building Industry. Int. Sci. J. Ind. 4.0 2020, 5, 29–32. [Google Scholar]
- Ikudayisi, A.E.; Chan, A.P.C.; Darko, A.; Adedeji, Y.M.D. Integrated Practices in the Architecture, Engineering, and Construction Industry: Current Scope and Pathway towards Industry 5.0. J. Build. Eng. 2023, 73, 106788. [Google Scholar] [CrossRef]
- Yitmen, I. Cognitive Digital Twins for Smart Lifecycle Management of Built Environment and Infrastructure Challenges, Opportunities and Practices; CRC Press: Boca Raton, FL, USA, 2023. [Google Scholar]
- Cinquepalmi, F.; Piras, G. Earth Observation Technologies for Mitigating Urban Climate Changes. In Urban Book Series; Springer International Publishing: Cham, Switzerland, 2023; Volume Part F813. [Google Scholar]
- Bourdeau, M.; Zhai, X.q.; Nefzaoui, E.; Guo, X.; Chatellier, P. Modeling and Forecasting Building Energy Consumption: A Review of Data-Driven Techniques. Sustain. Cities Soc. 2019, 48, 101533. [Google Scholar] [CrossRef]
- Teng, S.Y.; Touš, M.; Leong, W.D.; How, B.S.; Lam, H.L.; Máša, V. Recent Advances on Industrial Data-Driven Energy Savings: Digital Twins and Infrastructures. Renew. Sustain. Energy Rev. 2021, 135, 110208. [Google Scholar] [CrossRef]
- Zhang, J.; Tai, Y. Secure Medical Digital Twin via Human-Centric Interaction and Cyber Vulnerability Resilience. Conn. Sci. 2022, 34, 895–910. [Google Scholar] [CrossRef]
- Saad, A.; Faddel, S.; Mohammed, O. IoT-Based Digital Twin for Energy Cyber-Physical Systems: Design and Implementation. Energies 2020, 13, 4762. [Google Scholar] [CrossRef]
- Wang, X.; Yang, J.; Wang, Y.; Miao, Q.; Wang, F.Y.; Zhao, A.; Deng, J.L.; Li, L.; Na, X.; Vlacic, L. Steps Toward Industry 5.0: Building “6S” Parallel Industries with Cyber-Physical-Social Intelligence. IEEE/CAA J. Autom. Sin. 2023, 10, 1692–1703. [Google Scholar] [CrossRef]
- Li, H.; Yu, L.; He, W. The Impact of GDPR on Global Technology Development. J. Glob. Inf. Technol. Manag. 2019, 22, 1–6. [Google Scholar] [CrossRef]
- Hassani, H.; Huang, X.; MacFeely, S. Enabling Digital Twins to Support the UN SDGs. Big Data Cogn. Comput. 2022, 6, 115. [Google Scholar] [CrossRef]
- Sun, M.; Han, C.; Nie, Q.; Xu, J.; Zhang, F.; Zhao, Q. Understanding Building Energy Efficiency with Administrative and Emerging Urban Big Data by Deep Learning in Glasgow. Energy Build. 2022, 273, 112331. [Google Scholar] [CrossRef]
- Bauer, M.; Cirillo, F.; Fürst, J.; Solmaz, G.; Kovacs, E. Urban Digital Twins-A FIWARE-Based Model. At-Automatisierungstechnik 2021, 69, 1106–1115. [Google Scholar] [CrossRef]
- Kartakoullis, A.; Slamnik-Kriještorac, N.; Carlan, V.; Vulpe, A.; Suciu, G.; Iordache, M.; Brenes, J.; Landi, G.; Trichias, K. VITAL-5G: A Novel 5G-Enabled Platform for Vertical Innovations in Transport and Logistics. In Proceedings of the Transportation Research Procedia, Lisboa, Portugal, 14–17 November 2023; Volume 72. [Google Scholar]
- Meyer, C.; Gerlitz, L.; Prause, G. Small and Medium-Sized Port Greening Initiatives as Trigger for a Servitisation Port Ecosystem. Environ. Clim. Technol. 2023, 27, 476–488. [Google Scholar] [CrossRef]
- Alshammari, K.; Beach, T.; Rezgui, Y. Cybersecurity for Digital Twins in the Built Environment: Current Research and Future Directions. J. Inf. Technol. Constr. 2021, 26, 159–173. [Google Scholar] [CrossRef]
- Loss, S.; Singh, H.P.; Cacho, N.; Lopes, F. Using FIWARE and Blockchain in Smart Cities Solutions. Clust. Comput. 2023, 26, 2115–2128. [Google Scholar] [CrossRef]
- Maragno, D.; Dall’omo, C.F.; Pozzer, G.; Musco, F. Multi-Risk Climate Mapping for the Adaptation of the Venice Metropolitan Area. Sustainability 2021, 13, 1334. [Google Scholar] [CrossRef]
- Linkov, I.; Fox-Lent, C.; Keisler, J.; Sala, S.D.; Sieweke, J. Risk and Resilience Lessons from Venice. Environ. Syst. Decis. 2014, 34, 378–382. [Google Scholar] [CrossRef]
- Schlumberger, J.; Ferrarin, C.; Jonkman, S.N.; Diaz Loaiza, M.A.; Antonini, A.; Fatorić, S. Developing a Framework for the Assessment of Current and Future Flood Risk in Venice, Italy. Nat. Hazards Earth Syst. Sci. 2022, 22, 2381–2400. [Google Scholar] [CrossRef]
- Fondazione Gianni Pellicani. Ri-Pensare Venezia: Primo Focus, 1st ed.; Fondazione Gianni Pellicani: Venice, Italy, 2023; Volume 1. [Google Scholar]
- Tomczyk, M.; van der Valk, H. Digital Twin Paradigm Shift: The Journey of the Digital Twin Definition. In Proceedings of the International Conference on Enterprise Information Systems, ICEIS-Proceedings, Virtual, 25–27 April 2022; Volume 2. [Google Scholar]
- VanDerHorn, E.; Mahadevan, S. Digital Twin: Generalization, Characterization and Implementation. Decis. Support. Syst. 2021, 145, 113524. [Google Scholar] [CrossRef]
- Guibaud, A.; Mindeguia, J.C.; Albuerne, A.; Parent, T.; Torero, J. Notre-Dame de Paris as a Validation Case to Improve Fire Safety Modelling in Historic Buildings. J. Cult. Herit. 2023, 65, 145–154. [Google Scholar] [CrossRef]
- Gros, A.; Guillem, A.; De Luca, L.; Baillieul, É.; Duvocelle, B.; Malavergne, O.; Leroux, L.; Zimmer, T. Faceting the Post-Disaster Built Heritage Reconstruction Process within the Digital Twin Framework for Notre-Dame de Paris. Sci. Rep. 2023, 13, 5981. [Google Scholar] [CrossRef] [PubMed]
- Cinquepalmi, F.; Cumo, F. Using digital twin models (dtm) for managing, protecting and restoring historical buildings. Conserv. Sci. Cult. Herit. 2022, 22, 425–445. [Google Scholar] [CrossRef]
- Laurini, R. Towards Smart Urban Planning through Knowledge Infrastructure. In Proceedings of the Ninth International Conference on Advanced Geographic Information Systems, Applications, and Services, Nice, France, 19–23 March 2017. [Google Scholar]
- Sampedro, R. The Sustainable Development Goals (SDG). Carreteras 2021, 4, 9. [Google Scholar] [CrossRef]
- Zhang, X.; Shen, J.; Saini, P.K.; Lovati, M.; Han, M.; Huang, P.; Huang, Z. Digital Twin for Accelerating Sustainability in Positive Energy District: A Review of Simulation Tools and Applications. Front. Sustain. Cities 2021, 3, 663269. [Google Scholar] [CrossRef]
- IEA Global Status Report for Buildings and Construction 2019—Analysis; IEA: Paris, France, 2019.
- Simonsson, J.; Atta, K.T.; Schweiger, G.; Birk, W. Experiences from City-Scale Simulation of Thermal Grids. Resources 2021, 10, 10. [Google Scholar] [CrossRef]
- Zheng, X.; Shi, Z.; Wang, Y.; Zhang, H.; Tang, Z. Digital Twin Modeling for District Heating Network Based on Hydraulic Resistance Identification and Heat Load Prediction. Energy 2024, 288, 129726. [Google Scholar] [CrossRef]
- Casella, E.; Khamesi, A.R.; Silvestri, S.; Baker, D.A.; Das, S.K. HVAC Power Conservation through Reverse Auctions and Machine Learning. In Proceedings of the 2022 IEEE International Conference on Pervasive Computing and Communications, PerCom 2022, Pisa, Italy, 21–25 March 2022. [Google Scholar]
- Wang, M.; Wang, Z.; Geng, Y.; Lin, B. Interpreting the Neural Network Model for HVAC System Energy Data Mining. Build. Environ. 2022, 209, 108449. [Google Scholar] [CrossRef]
- Pang, Z.; O’Neill, Z.; Chen, Y.; Zhang, J.; Cheng, H.; Dong, B. Adopting Occupancy-Based HVAC Controls in Commercial Building Energy Codes: Analysis of Cost-Effectiveness and Decarbonization Potential. Appl. Energy 2023, 349, 121594. [Google Scholar] [CrossRef]
- Nikdel, L.; Janoyan, K.; Bird, S.D.; Powers, S.E. Multiple Perspectives of the Value of Occupancy-Based HVAC Control Systems. Build. Environ. 2018, 129, 15–25. [Google Scholar] [CrossRef]
- Jiang, Y.; Shen, X. Construction and Application of Digital Twin in Hydrogen Production System of Alkaline Water Electrolyzer. Gaodianya Jishu/High Volt. Eng. 2022, 48, 1673–1683. [Google Scholar] [CrossRef]
- Topping, D.; Bannan, T.J.; Coe, H.; Evans, J.; Jay, C.; Murabito, E.; Robinson, N. Digital Twins of Urban Air Quality: Opportunities and Challenges. Front. Sustain. Cities 2021, 3, 786563. [Google Scholar] [CrossRef]
- Ariansyah, D.; Isnan, M.; Rahutomo, R.; Pardamean, B. Digital Twin (DT) Smart City for Air Quality Management. Procedia Comput. Sci. 2023, 227, 524–533. [Google Scholar] [CrossRef]
- Yang, S.; Kim, S.; Sungah, K. BIM-Based Design Automation Tool and Digital Twin Interoperability-Case of the Next Generation Noise Barrier Tunnel. KIBIM Mag. 2021, 11, 31–41. [Google Scholar]
- Miller, C. What’s in the Box?! Towards Explainable Machine Learning Applied to Non-Residential Building Smart Meter Classification. Energy Build. 2019, 199, 523–536. [Google Scholar] [CrossRef]
- Lv, Z.; Gander, A.J.; Lv, H. Digital Twins of Sustainable City. In Encyclopedia of Sustainable Technologies; Elsevier: Amsterdam, The Netherlands, 2024. [Google Scholar]
- Barcik, P.; Coufalikova, A.; Frantis, P.; Vavra, J. The Future Possibilities and Security Challenges of City Digitalization. Smart Cities 2023, 6, 137–155. [Google Scholar] [CrossRef]
- Piper, W.; Sun, H.; Jiang, J. Digital Twins for Smart Cities: Case Study and Visualisation via Mixed Reality. In Proceedings of the IEEE Vehicular Technology Conference, Beijing, China; London, UK, 26–29 September 2022; Volume 2022. [Google Scholar]
- Ramos, H.M.; Kuriqi, A.; Besharat, M.; Creaco, E.; Tasca, E.; Coronado-Hernández, O.E.; Pienika, R.; Iglesias-Rey, P. Smart Water Grids and Digital Twin for the Management of System Efficiency in Water Distribution Networks. Water 2023, 15, 1129. [Google Scholar] [CrossRef]
- Wei, Y.; Law, A.W.K.; Yang, C. Real-Time Data-Processing Framework with Model Updating for Digital Twins of Water Treatment Facilities. Water 2022, 14, 3591. [Google Scholar] [CrossRef]
- Sheng, D.; Lou, Y.; Sun, F.; Xie, J.; Yu, Y. Reengineering and Its Reliability: An Analysis of Water Projects and Watershed Management under a Digital Twin Scheme in China. Water 2023, 15, 3203. [Google Scholar] [CrossRef]
- Cesco, S.; Sambo, P.; Borin, M.; Basso, B.; Orzes, G.; Mazzetto, F. Smart Agriculture and Digital Twins: Applications and Challenges in a Vision of Sustainability. Eur. J. Agron. 2023, 146, 126809. [Google Scholar] [CrossRef]
- Ramos, H.M.; Morani, M.C.; Carravetta, A.; Fecarrotta, O.; Adeyeye, K.; López-Jiménez, P.A.; Pérez-Sánchez, M. New Challenges towards Smart Systems’ Efficiency by Digital Twin in Water Distribution Networks. Water 2022, 14, 1304. [Google Scholar] [CrossRef]
- Girotto, C.D.; Piadeh, F.; Bkhtiari, V.; Behzadian, K.; Chen, A.S.; Campos, L.C.; Zolgharni, M. A Critical Review of Digital Technology Innovations for Early Warning of Water-Related Disease Outbreaks Associated with Climatic Hazards. Int. J. Disaster Risk Reduct. 2024, 100, 104151. [Google Scholar] [CrossRef]
- Loos, R.; Gawlik, B.M.; Locoro, G.; Rimaviciute, E.; Contini, S.; Bidoglio, G. EU-Wide Survey of Polar Organic Persistent Pollutants in European River Waters. Environ. Pollut. 2009, 157, 561–568. [Google Scholar] [CrossRef] [PubMed]
- Semyachkov, A.I.; Semyachkov, K. Al Digital Model of Groundwater Technogenesis as an Element of Sustainable Development of the Urban Environment. Sustain. Dev. Mt. Territ. 2022, 14, 362–369. [Google Scholar] [CrossRef]
- Zhao, D.; Li, X.; Wang, X.; Shen, X.; Gao, W. Applying Digital Twins to Research the Relationship Between Urban Expansion and Vegetation Coverage: A Case Study of Natural Preserve. Front. Plant Sci. 2022, 13, 840471. [Google Scholar] [CrossRef] [PubMed]
- Peladarinos, N.; Piromalis, D.; Cheimaras, V.; Tserepas, E.; Munteanu, R.A.; Papageorgas, P. Enhancing Smart Agriculture by Implementing Digital Twins: A Comprehensive Review. Sensors 2023, 23, 7128. [Google Scholar] [CrossRef] [PubMed]
- Ariesen-Verschuur, N.; Verdouw, C.; Tekinerdogan, B. Digital Twins in Greenhouse Horticulture: A Review. Comput. Electron. Agric. 2022, 199, 107183. [Google Scholar] [CrossRef]
- Laufs, J.; Borrion, H.; Bradford, B. Security and the Smart City: A Systematic Review. Sustain. Cities Soc. 2020, 55, 102023. [Google Scholar] [CrossRef]
- Murthy Pedapudi, S.; Vadlamani, N. A Comprehensive Network Security Management in Virtual Private Network Environment. In Proceedings of the Proceedings-International Conference on Applied Artificial Intelligence and Computing, ICAAIC 2022, Salem, India, 9–11 May 2022. [Google Scholar]
- Burhan, M.; Rehman, R.A.; Khan, B.; Kim, B.S. IoT Elements, Layered Architectures and Security Issues: A Comprehensive Survey. Sensors 2018, 18, 2796. [Google Scholar] [CrossRef] [PubMed]
- Pimple, N.; Salunke, T.; Pawar, U.; Sangoi, J. Wireless Security-An Approach Towards Secured Wi-Fi Connectivity. In Proceedings of the 2020 6th International Conference on Advanced Computing and Communication Systems, ICACCS 2020, Coimbatore, India, 6–7 March 2020. [Google Scholar]
- Eckhart, M.; Ekelhart, A. Digital Twins for Cyber-Physical Systems Security: State of the Art and Outlook. In Security and Quality in Cyber-Physical Systems Engineering; Springer: Berlin/Heidelberg, Germany, 2019. [Google Scholar]
- Zhao, T.; Foo, E.; Tian, H. A Digital Twin Framework for Cyber Security in Cyber-Physical Systems. arXiv 2022, arXiv:2204.13859. [Google Scholar]
- Wang, D.; Shi, S.; Lu, J.; Hu, Z.; Chen, J. Research on Gas Pipeline Leakage Model Identification Driven by Digital Twin. Syst. Sci. Control Eng. 2023, 11, 2180687. [Google Scholar] [CrossRef]
- Ghaith, M.; Yosri, A.; El-Dakhakhni, W. Synchronization-Enhanced Deep Learning Early Flood Risk Predictions: The Core of Data-Driven City Digital Twins for Climate Resilience Planning. Water 2022, 14, 3619. [Google Scholar] [CrossRef]
- Mokhtari, F.; Imanpour, A. A Digital Twin-Based Framework for Multi-Element Seismic Hybrid Simulation of Structures. Mech. Syst. Signal Process. 2023, 186, 109909. [Google Scholar] [CrossRef]
- Mansour, D.E.A.; Numair, M.; Zalhaf, A.S.; Ramadan, R.; Darwish, M.M.F.; Huang, Q.; Hussien, M.G.; Abdel-Rahim, O. Applications of IoT and Digital Twin in Electrical Power Systems: A Comprehensive Survey. IET Gener. Transm. Distrib. 2023, 17, 4457–4479. [Google Scholar] [CrossRef]
- Almatared, M.; Liu, H.; Abudayyeh, O.; Hakim, O.; Sulaiman, M. Digital-Twin-Based Fire Safety Management Framework for Smart Buildings. Buildings 2024, 14, 4. [Google Scholar] [CrossRef]
- Zhang, X.; Jiang, Y.; Wu, X.; Nan, Z.; Jiang, Y.; Shi, J.; Zhang, Y.; Huang, X.; Huang, G.G.Q. AIoT-Enabled Digital Twin System for Smart Tunnel Fire Safety Management. Dev. Built Environ. 2024, 18, 100381. [Google Scholar] [CrossRef]
- Berti, N.; Finco, S.; Guidolin, M.; Battini, D. Towards Human Digital Twins to Enhance Workers’ Safety and Production System Resilience. In Proceedings of the IFAC-PapersOnLine, Yokohama, Japan, 9–14 November 2023; Volume 56. [Google Scholar]
- Paul, A.; Pulani, S.; Maheswari, J.U. Digital Twin Framework for Worker Safety Using RFID Technology. In Proceedings of the International Symposium on Automation and Robotics in Construction, Chennai, India, 3–9 July 2023. [Google Scholar]
- Wang, E.; Tayebi, P.; Song, Y.T. Cloud-Based Digital Twins’ Storage in Emergency Healthcare. Int. J. Networked Distrib. Comput. 2023, 11, 75–87. [Google Scholar] [CrossRef]
- Moyaux, T.; Liu, Y.; Bouleux, G.; Cheutet, V. An Agent-Based Architecture of the Digital Twin for an Emergency Department. Sustainability 2023, 15, 3412. [Google Scholar] [CrossRef]
- Meschini, S.; Accardo, D.; Locatelli, M.; Pellegrini, L.; Tagliabue, L.C.; Di Giuda, G.M. BIM-GIS Integration and Crowd Simulation for Fire Emergency Management in a Large, Diffused University. In Proceedings of the International Symposium on Automation and Robotics in Construction, Chennai, India, 3–9 July 2023. [Google Scholar]
- Yan, K.; Zhong, C.; Ji, Z.; Huang, J. Semi-Supervised Learning for Early Detection and Diagnosis of Various Air Handling Unit Faults. Energy Build. 2018, 181, 75–83. [Google Scholar] [CrossRef]
- Zenebe, T.M.; Midtgård, O.M.; Völler, S.; Cali, Ü. Machine Learning for PV System Operational Fault Analysis: Literature Review. In Proceedings of the Communications in Computer and Information Science, Grimstad, Norway, 11–13 October 2022; Volume 1616. [Google Scholar]
- Hussain, M.; Memon, T.D.; Hussain, I.; Memon, Z.A.; Kumar, D. Fault Detection and Identification Using Deep Learning Algorithms in Induction Motors. CMES-Comput. Model. Eng. Sci. 2022, 133, 435–470. [Google Scholar] [CrossRef]
- Ciaburro, G. Machine Fault Detection Methods Based on Machine Learning Algorithms: A Review. Math. Biosci. Eng. 2022, 19, 11453–11490. [Google Scholar] [CrossRef]
- Yitmen, I.; Alizadehsalehi, S.; Akıner, İ.; Akıner, M.E. An Adapted Model of Cognitive Digital Twins for Building Lifecycle Management. Appl. Sci. 2021, 11, 4276. [Google Scholar] [CrossRef]
- El Mokhtari, K.; Panushev, I.; McArthur, J.J. Development of a Cognitive Digital Twin for Building Management and Operations. Front. Built Environ. 2022, 8, 856873. [Google Scholar] [CrossRef]
- Hobson, B.W.; Lowcay, D.; Gunay, H.B.; Ashouri, A.; Newsham, G.R. Opportunistic Occupancy-Count Estimation Using Sensor Fusion: A Case Study. Build. Environ. 2019, 159, 106154. [Google Scholar] [CrossRef]
- Eyiokur, F.I.; Kantarcı, A.; Erakın, M.E.; Damer, N.; Ofli, F.; Imran, M.; Križaj, J.; Salah, A.A.; Waibel, A.; Štruc, V.; et al. A Survey on Computer Vision Based Human Analysis in the COVID-19 Era. Image Vis. Comput. 2023, 130, 104610. [Google Scholar] [CrossRef]
- Lv, Z.; Chen, D.; Lv, H. Smart City Construction and Management by Digital Twins and BIM Big Data in COVID-19 Scenario. ACM Trans. Multimed. Comput. Commun. Appl. 2022, 18, 1–21. [Google Scholar] [CrossRef]
- Anand, P.; Deb, C.; Yan, K.; Yang, J.; Cheong, D.; Sekhar, C. Occupancy-Based Energy Consumption Modelling Using Machine Learning Algorithms for Institutional Buildings. Energy Build. 2021, 252, 111478. [Google Scholar] [CrossRef]
- Ding, Y.; Chen, W.; Wei, S.; Yang, F. An Occupancy Prediction Model for Campus Buildings Based on the Diversity of Occupancy Patterns. Sustain. Cities Soc. 2021, 64, 102533. [Google Scholar] [CrossRef]
- Wang, C.; Pattawi, K.; Lee, H. Energy Saving Impact of Occupancy-Driven Thermostat for Residential Buildings. Energy Build. 2020, 211, 109791. [Google Scholar] [CrossRef]
- Kim, E. Interpretable and Accurate Convolutional Neural Networks for Human Activity Recognition. IEEE Trans. Ind. Inf. 2020, 16, 7190–7198. [Google Scholar] [CrossRef]
- Yuan, L.; Andrews, J.; Mu, H.; Vakil, A.; Ewing, R.; Blasch, E.; Li, J. Interpretable Passive Multi-Modal Sensor Fusion for Human Identification and Activity Recognition. Sensors 2022, 22, 5787. [Google Scholar] [CrossRef] [PubMed]
- Cengiz, A.B.; Birant, K.U.; Cengiz, M.; Birant, D.; Baysari, K. Improving the Performance and Explainability of Indoor Human Activity Recognition in the Internet of Things Environment. Symmetry 2022, 14, 2022. [Google Scholar] [CrossRef]
- Ibrahim, M.R.; Haworth, J.; Cheng, T. Understanding Cities with Machine Eyes: A Review of Deep Computer Vision in Urban Analytics. Cities 2020, 96, 102481. [Google Scholar] [CrossRef]
- Kothadiya, D.; Chaudhari, A.; Macwan, R.; Patel, K.; Bhatt, C. The Convergence of Deep Learning and Computer Vision: Smart City Applications and Research Challenges. In Proceedings of the 3rd International Conference on Integrated Intelligent Computing Communication & Security (ICIIC 2021), Bangalore, India, 6–7 August 2021; Volume 4. [Google Scholar]
- Cardoso, B.; Silva, C.; Costa, J.; Ribeiro, B. Internet of Things Meets Computer Vision to Make an Intelligent Pest Monitoring Network. Appl. Sci. 2022, 12, 9397. [Google Scholar] [CrossRef]
- Kiobia, D.O.; Mwitta, C.J.; Fue, K.G.; Schmidt, J.M.; Riley, D.G.; Rains, G.C. A Review of Successes and Impeding Challenges of IoT-Based Insect Pest Detection Systems for Estimating Agroecosystem Health and Productivity of Cotton. Sensors 2023, 23, 4127. [Google Scholar] [CrossRef] [PubMed]
- Civantos, E.; Thuiller, W.; Maiorano, L.; Guisan, A.; Arajo, M.B. Potential Impacts of Climate Change on Ecosystem Services in Europe: The Case of Pest Control by Vertebrates. Bioscience 2012, 62, 658–666. [Google Scholar] [CrossRef]
- Chen, Z.; Huang, L. Digital Twin in Circular Economy: Remanufacturing in Construction. In Proceedings of the IOP Conference Series: Earth and Environmental Science, Vienna, Austria, 18–21 May 2020; Volume 588. [Google Scholar]
- Fang, B.; Yu, J.; Chen, Z.; Osman, A.I.; Farghali, M.; Ihara, I.; Hamza, E.H.; Rooney, D.W.; Yap, P.S. Artificial Intelligence for Waste Management in Smart Cities: A Review. Environ. Chem. Lett. 2023, 21, 1959–1989. [Google Scholar] [CrossRef]
- Khan, A.U.R.; Ahmad, R.W. A Blockchain-Based IoT-Enabled E-Waste Tracking and Tracing System for Smart Cities. IEEE Access 2022, 10, 86256–86269. [Google Scholar] [CrossRef]
- Moral, P.; García-Martín, Á.; Escudero-Viñolo, M.; Martínez, J.M.; Bescós, J.; Peñuela, J.; Martínez, J.C.; Alvis, G. Towards Automatic Waste Containers Management in Cities via Computer Vision: Containers Localization and Geo-Positioning in City Maps. Waste Manag. 2022, 152, 59–68. [Google Scholar] [CrossRef] [PubMed]
- Zou, Y.; Ye, F.; Li, A.; Munir, M.; Hjelseth, E.; Sujan, S.F. A Digital Twin Prototype for Smart Parking Management. In eWork and eBusiness in Architecture, Engineering and Construction, Proceedings of the 14th European Conference on Product and Process Modelling, ECPPM 2022, Trondheim, Norway, 14–16 September 2022; CRC Press: Boca Raton, FL, USA, 2023. [Google Scholar]
- Liu, Y.; Pan, S.; Folz, P.; Ramparany, F.; Bolle, S.; Ballot, E.; Coupaye, T. Cognitive Digital Twins for Freight Parking Management in Last Mile Delivery under Smart Cities Paradigm. Comput. Ind. 2023, 153, 104022. [Google Scholar] [CrossRef]
- Shang, K.; Zhang, Y.; Zhang, F. Architecture of Smart Parking Lot Based on Digital Twin Technology. Beijing Hangkong Hangtian Daxue Xuebao/J. Beijing Univ. Aeronaut. Astronaut. 2023, 49, 2029–2038. [Google Scholar] [CrossRef]
- Chaalal, E.; Guerlain, C.; Pardo, E.; Faye, S. Integrating Connected and Automated Shuttles with Other Mobility Systems: Challenges and Future Directions. IEEE Access 2023, 11, 83081–83106. [Google Scholar] [CrossRef]
- García-Luque, R.; Toro-Gálvez, L.; Moreno, N.; Troya, J.; Canal, C.; Pimentel, E. Integrating Citizens’ Avatars in Urban Digital Twins. J. Web Eng. 2023, 22, 913–938. [Google Scholar] [CrossRef]
- Kaewunruen, S.; Xu, N. Digital Twin for Sustainability Evaluation of Railway Station Buildings. Front. Built Environ. 2018, 4, 430624. [Google Scholar] [CrossRef]
- Lv, Z.; Guo, J.; Singh, A.K.; Lv, H. Digital Twins Based VR Simulation for Accident Prevention of Intelligent Vehicle. IEEE Trans. Veh. Technol. 2022, 71, 3414–3428. [Google Scholar] [CrossRef]
- Li, Y.; Zhang, W. Traffic Flow Digital Twin Generation for Highway Scenario Based on Radar-Camera Paired Fusion. Sci. Rep. 2023, 13, 642. [Google Scholar] [CrossRef]
- Fujishima, M.; Takagi, M.; Yokoya, M.; Nakada, R. Digital Twins for Streamlining Road-Traffic Flow. NTT Tech. Rev. 2023, 21, 32–37. [Google Scholar] [CrossRef]
- Korotunov, S.; Tabunshchyk, G.; Arras, P. Utilization of a Digital Twin for an Electric Vehicles Smart Charging Station for Future Use with Engineering Students. In Artificial Intelligence and Online Engineering; Auer, M.E., El-Seoud, S.A., Karam, O.H., Eds.; REV 2022 Lecture Notes in Networks and Systems; Springer: Cham, Switzerland, 2022; Volume 524. [Google Scholar] [CrossRef]
- Francisco, A.M.B.; Monteiro, J.; Cardoso, P.J.S. A Digital Twin of Charging Stations for Fleets of Electric Vehicles. IEEE Access 2023, 11, 125664–125683. [Google Scholar] [CrossRef]
- Farina, A.; Frosolini, M.; Petri, M.; Pratelli, A. Design of an Evacuation and Addressing System in Case of Emergency or Accident in the Port Area of Bastia. In Proceedings of the European Modeling and Simulation Symposium, EMSS, Rome, Italy, 19–21 September 2022. [Google Scholar]
- Martelli, M.; Virdis, A.; Gotta, A.; Cassara, P.; DI Summa, M. An Outlook on the Future Marine Traffic Management System for Autonomous Ships. IEEE Access 2021, 9, 157316–157328. [Google Scholar] [CrossRef]
- Li, Y.; Liu, W.; Zhang, Y.; Zhang, W.; Gao, C.; Chen, Q.; Ji, Y. Interactive Real-Time Monitoring and Information Traceability for Complex Aircraft Assembly Field Based on Digital Twin. IEEE Trans. Ind. Inf. 2023, 19, 9745–9756. [Google Scholar] [CrossRef]
- Zhang, C.; Tian, X.; Zhao, Y.; Li, T.; Zhou, Y.; Zhang, X. Causal Discovery-Based External Attention in Neural Networks for Accurate and Reliable Fault Detection and Diagnosis of Building Energy Systems. Build. Environ. 2022, 222, 109357. [Google Scholar] [CrossRef]
- Jiang, F.; Ma, L.; Broyd, T.; Chen, W.; Luo, H. Digital Twin Enabled Sustainable Urban Road Planning. Sustain. Cities Soc. 2022, 78, 103645. [Google Scholar] [CrossRef]
- Ye, X.; Du, J.; Han, Y.; Newman, G.; Retchless, D.; Zou, L.; Ham, Y.; Cai, Z. Developing Human-Centered Urban Digital Twins for Community Infrastructure Resilience: A Research Agenda. J. Plan. Lit. 2023, 38, 187–199. [Google Scholar] [CrossRef] [PubMed]
- Dembski, F.; Wössner, U.; Letzgus, M.; Ruddat, M.; Yamu, C. Urban Digital Twins for Smart Cities and Citizens: The Case Study of Herrenberg, Germany. Sustainability 2020, 12, 2307. [Google Scholar] [CrossRef]
- Bononi, L.; Donatiello, L.; Longo, D.; Massari, M.; Montori, F.; Stacchio, L.; Marfia, G. Digital Twin Collaborative Platforms: Applications to Humans-in-the-Loop Crafting of Urban Areas. IEEE Consum. Electron. Mag. 2023, 12, 38–46. [Google Scholar] [CrossRef]
- Shaharuddin, S.; Abdul Maulud, K.N.; Syed Abdul Rahman, S.A.F.; Che Ani, A.I. Digital Twin for Indoor Disaster in Smart City: A Systematic Review. In Proceedings of the International Archives of the Photogrammetry, Remote Sensing and Spatial Information Sciences-ISPRS Archives, online, 5–6 October 2022; Volume 46. [Google Scholar]
- Gugliermetti, L.; Cumo, F.; Agostinelli, S. A Future Direction of Machine Learning for Building Energy Management: Interpretable Models. Energies 2024, 17, 700. [Google Scholar] [CrossRef]
- Soe, R.M. Smart Twin Cities via Urban Operating System. In Proceedings of the ACM International Conference Proceeding Series, New Delhi, India, 7–9 March 2017; Volume Part F128003. [Google Scholar]
- Foscari, A. Ateneo Veneto Rivista di Scienze Lettere ed Arti, Anno CXCV, 3rd ed.Ateneo Veneto: Venice, Italy, 2009; Volume 8/2, ISBN 978-1110103003. [Google Scholar]
- ICOMOS. UNESCO World Heritage List n. 394, Venice and Its Lagoon. Available online: https://whc.unesco.org/en/list/394/ (accessed on 29 December 2024).
- Bathla, G.; Rani, R.; Aggarwal, H. Comparative Study of NoSQL Databases for Big Data Storage. Int. J. Eng. Technol. 2018, 7, 83–87. [Google Scholar] [CrossRef]
- Corbellini, A.; Mateos, C.; Zunino, A.; Godoy, D.; Schiaffino, S. Persisting Big-Data: The NoSQL Landscape. Inf. Syst. 2017, 63, 1–23. [Google Scholar] [CrossRef]
- Botha, I. Time Series Forecasting in the Artificial Intelligence Milieu. J. Econ. Financ. Sci. 2022, 15, a836. [Google Scholar] [CrossRef]
- Shah, B.; Jat, P.M.; Sasidhar, K. Performance Study of Time Series Databases. Int. J. Database Manag. Syst. 2022, 14, 1–13. [Google Scholar] [CrossRef]
- Adiono, T.; Marthensa, R.; Muttaqin, R.; Fuada, S.; Harimurti, S.; Adijarto, W. Design of Database and Secure Communication Protocols for Internet-of-Things-Based Smart Home System. In Proceedings of the IEEE Region 10 Annual International Conference, Proceedings/TENCON, Penang, Malaysia, 5–8 November 2017; Volume 2017. [Google Scholar]
- Gentilcore, D. The Cistern-System of Early Modern Venice: Technology, Politics and Culture in a Hydraulic Society. Water Hist. 2021, 13, 375–406. [Google Scholar] [CrossRef]
- Umgiesser, G. The Impact of Operating the Mobile Barriers in Venice (MOSE) under Climate Change. J. Nat. Conserv. 2020, 54, 125783. [Google Scholar] [CrossRef]
- Pham, H.V.; Dal Barco, M.K.; Cadau, M.; Harris, R.; Furlan, E.; Torresan, S.; Rubinetti, S.; Zanchettin, D.; Rubino, A.; Kuznetsov, I.; et al. Multi-Model Chain for Climate Change Scenario Analysis to Support Coastal Erosion and Water Quality Risk Management for the Metropolitan City of Venice. Sci. Total Environ. 2023, 904, 166310. [Google Scholar] [CrossRef] [PubMed]
- Zhang, R.; Hong, T. Modeling of HVAC Operational Faults in Building Performance Simulation. Appl. Energy 2017, 202, 178–188. [Google Scholar] [CrossRef]
- Neacsa, A.; Eparu, C.N.; Stoica, D.B. Hydrogen–Natural Gas Blending in Distribution Systems—An Energy, Economic, and Environmental Assessment. Energies 2022, 15, 6143. [Google Scholar] [CrossRef]
- Zhang, H.; Zhao, J.; Li, J.; Yu, B.; Wang, J.; Lyu, R.; Xi, Q. Research Progress on Corrosion and Hydrogen Embrittlement in Hydrogen–Natural Gas Pipeline Transportation. Nat. Gas Ind. B 2023, 10, 570–582. [Google Scholar] [CrossRef]
- Cinquepalmi, F. The Copernicus Programme: Europe’s Eye on Urban Areas. In Abitare la Terra–Dwelling on Earth Quaderni 2; Portoghesi, P., Ed.; Gangemi: Rome, Italy, 2020; Volume 2, pp. 12–15. ISBN 9788849238983. [Google Scholar]
- Corrado, C.R.; DeLong, S.M.; Holt, E.G.; Hua, E.Y.; Tolk, A. Combining Green Metrics and Digital Twins for Sustainability Planning and Governance of Smart Buildings and Cities. Sustainability 2022, 14, 12988. [Google Scholar] [CrossRef]
- Salem, T.; Dragomir, M. Options for and Challenges of Employing Digital Twins in Construction Management. Appl. Sci. 2022, 12, 2928. [Google Scholar] [CrossRef]
- Goumiri, S.; Yahiaoui, S.; Djahel, S. Smart Mobility in Smart Cities: Emerging Challenges, Recent Advances and Future Directions. J. Intell. Transp. Syst. Technol. Plan. Oper. 2023, 1–37. [Google Scholar] [CrossRef]
- Müller-Eie, D.; Kosmidis, I. Sustainable Mobility in Smart Cities: A Document Study of Mobility Initiatives of Mid-Sized Nordic Smart Cities. Eur. Transp. Res. Rev. 2023, 15, 36. [Google Scholar] [CrossRef]
- Tahmasseby, S. The Implementation of Smart Mobility for Smart Cities: A Case Study in Qatar. Civ. Eng. J. 2022, 8, 2154–2171. [Google Scholar] [CrossRef]
- International Energy Agency International Energy Agency (IEA) World Energy Outlook 2022. Available online: https://www.iea.org/reports/world-energy-outlook-2022/executive-summary (accessed on 22 September 2024).
- Lin, Y.; Li, B.; Moiser, T.M.; Griffel, L.M.; Mahalik, M.R.; Kwon, J.; Alam, S.M.S. Revenue Prediction for Integrated Renewable Energy and Energy Storage System Using Machine Learning Techniques. J. Energy Storage 2022, 50, 104123. [Google Scholar] [CrossRef]
- Ramesh, T.; Prakash, R.; Shukla, K.K. Life Cycle Energy Analysis of Buildings: An Overview. Energy Build. 2010, 42, 1592–1600. [Google Scholar] [CrossRef]
- Agostinelli, S.; Cumo, F.; Nezhad, M.M.; Orsini, G.; Piras, G. Renewable Energy System Controlled by Open-Source Tools and Digital Twin Model: Zero Energy Port Area in Italy. Energies 2022, 15, 1817. [Google Scholar] [CrossRef]
- Yang, B.; Lv, Z.; Wang, F. Digital Twins for Intelligent Green Buildings. Buildings 2022, 12, 856. [Google Scholar] [CrossRef]
- Villa, V.; Chiaia, B. Digital Twin for Smart School Buildings: State of the Art, Challenges, and Opportunities. In Handbook of Research on Developing Smart Cities Based on Digital Twins; IGI Global Scientific Publishing: Hershey, PA, USA, 2021. [Google Scholar]
- Deng, M.; Menassa, C.C.; Kamat, V.R. From BIM to Digital Twins: A Systematic Review of the Evolution of Intelligent Building Representations in the AEC-FM Industry. J. Inf. Technol. Constr. 2021, 26, 58–83. [Google Scholar] [CrossRef]
- Cho, Y.; Kim, J. A Study on Setting the Direction of Digital Twin Implementation for Urban Regeneration Business. Int. J. Adv. Appl. Sci. 2022, 9, 147–154. [Google Scholar] [CrossRef]
- Ascione, F.; De Masi, R.F.; Mastellone, M.; Ruggiero, S.; Vanoli, G.P. Improving the Building Stock Sustainability in European Countries: A Focus on the Italian Case. J. Clean. Prod. 2022, 365, 132699. [Google Scholar] [CrossRef]
- Giuffrida, A. Italy Bans Cruise Ships from Venice Lagoon after Unesco Threat, The Guardian, 2021, July 13. Available online: https://www.theguardian.com/world/2021/jul/13/italy-bans-cruise-ships-from-venice-lagoon-after-unesco-threat (accessed on 29 December 2024).
- Ryan, J.; Silvanto, S. The World Heritage List: The Making and Management of a Brand. Place Brand. Public Dipl. 2009, 5, 290–300. [Google Scholar] [CrossRef]
- Venice Municipality Superfici Amministrative. Available online: https://www.comune.venezia.it/sites/comune.venezia.it/files/immagini/statistica/tabella_superfici_agg2020.pdf (accessed on 16 September 2024).
- Cavalli, R.M. Capability of Remote Sensing Images to Distinguish the Urban Surface Materials: A Case Study of Venice City. Remote Sens. 2021, 13, 3959. [Google Scholar] [CrossRef]
- Agostini, M.; Cammerata, F. PA Risk Map Venice; Venice, Italy. 2023. Available online: https://www.comune.venezia.it/sites/comune.venezia.it/files/documenti/sue/nta_in_salvaguardia.pdf (accessed on 29 December 2024).
- Pirazzoli, P.A.; Umgiesser, G. The Projected “MOSE” Barriers against Flooding in Venice (Italy) and the Expected Global Sea-Level Rise. J. Mar. Environ. Eng. 2006, 8, 247–261. [Google Scholar]
- Abbott, B.N.; Wallace, J.; Nicholas, D.M.; Karim, F.; Waltham, N.J. Bund Removal to Re-Establish Tidal Flow, Remove Aquatic Weeds and Restore Coastal Wetland Services-North Queensland, Australia. PLoS ONE 2020, 15, e0217531. [Google Scholar] [CrossRef]
- Steinmann, R.; Seydoux, L.; Campillo, M. AI-Based Unmixing of Medium and Source Signatures From Seismograms: Ground Freezing Patterns. Geophys. Res. Lett. 2022, 49, e2022GL098854. [Google Scholar] [CrossRef] [PubMed]
- Patel, A.; Vyas, D.; Chaudhari, N.; Patel, R.; Patel, K.; Mehta, D. Novel Approach for the LULC Change Detection Using GIS & Google Earth Engine through Spatiotemporal Analysis to Evaluate the Urbanization Growth of Ahmedabad City. Results Eng. 2024, 21, 101788. [Google Scholar] [CrossRef]
- Alberti, T.; Anzidei, M.; Faranda, D.; Vecchio, A.; Favaro, M.; Papa, A. Dynamical Diagnostic of Extreme Events in Venice Lagoon and Their Mitigation with the MoSE. Sci. Rep. 2023, 13, 10475. [Google Scholar] [CrossRef]
- Lee, K.; Kim, B.; Park, S. Evaluating the Potential of Burn Severity Mapping and Transferability of Copernicus EMS Data Using Sentinel-2 Imagery and Machine Learning Approaches. GIsci Remote Sens. 2023, 60, 2192157. [Google Scholar] [CrossRef]
- Stoof, C.R.; Kok, E.; Cardil Forradellas, A.; van Marle, M.J.E. In Temperate Europe, Fire Is Already Here: The Case of The Netherlands. Ambio 2024, 53, 604–623. [Google Scholar] [CrossRef] [PubMed]
- Tonbul, H.; Colkesen, I.; Kavzoglu, T. Forest Fire and Burn Severity Analysis in Cefalù Region of Italy Using Sentinel-2 Imagery. In Proceedings of the International Symposium on Applied Geoinformatics (ISAG), Istanbul, Turkey, 7–9 November 2019. [Google Scholar]
- Mei, A.; Baiocchi, V.; Mattei, S.; Zampetti, E.; Pai, H.J.; Tratzi, P.; Ragazzo, A.V.; Cuzzucoli, A.; Mancuso, A.; Bearzotti, A.; et al. Conceptualization of a satellite, uas and ugv downscaling approach for abandoned waste detection and waste to energy prospects. Int. Arch. Photogramm. Remote Sens. Spat. Inf. Sci.-ISPRS Arch. 2023, 48, 287–293. [Google Scholar] [CrossRef]
- Slonecker, T.; Fisher, G.B.; Aiello, D.P.; Haack, B. Visible and Infrared Remote Imaging of Hazardous Waste: A Review. Remote Sens. 2010, 2, 2474–2508. [Google Scholar] [CrossRef]
- Lavender, S. Detection of Waste Plastics in the Environment: Application of Copernicus Earth Observation Data. Remote Sens. 2022, 14, 4772. [Google Scholar] [CrossRef]
- Ricciardi, G.; Callegari, G. Digital Twins for Climate-Neutral and Resilient Cities. State of the Art and Future Development as Tools to Support Urban Decision-Making. In Urban Book Series; Springer International Publishing: Cham, Switzerland, 2023; Volume Part F813. [Google Scholar]
- Gustin, M.; McLeod, R.S.; Lomas, K.J. Forecasting Indoor Temperatures during Heatwaves Using Time Series Models. Build. Environ. 2018, 143, 727–739. [Google Scholar] [CrossRef]
- Kim, M.K.; Yu, D.G.; Oh, J.S.; Byun, Y.H.; Boo, K.O.; Chung, I.U.; Park, J.S.; Park, D.S.R.; Min, S.K.; Sung, H.M. Performance Evaluation of CMIP5 and CMIP6 Models on Heatwaves in Korea and Associated Teleconnection Patterns. J. Geophys. Res. Atmos. 2020, 125, e2020JD032583. [Google Scholar] [CrossRef]
- Ghosh, A.; Hafnaoui, R.; Mesloub, A.; Elkhayat, K.; Albaqawy, G.; Alnaim, M.M.; Mayhoub, M.S. Active Smart Switchable Glazing for Smart City: A Review. J. Build. Eng. 2024, 84, 108644. [Google Scholar] [CrossRef]
- Tang, Y.; Gao, F.; Wang, C.; Huang, M.M.; Wu, M.; Li, H.; Li, Z. Vertical Greenery System (VGS) Renovation for Sustainable Arcade-Housing: Building Energy Efficiency Analysis Based on Digital Twin. Sustainability 2023, 15, 2310. [Google Scholar] [CrossRef]
- Qi, Y.; Li, H.; Pang, Z.; Gao, W.; Liu, C. A Case Study of the Relationship Between Vegetation Coverage and Urban Heat Island in a Coastal City by Applying Digital Twins. Front. Plant Sci. 2022, 13, 861768. [Google Scholar] [CrossRef]
- Javed, A.; Kim, T.; Lee, C.; Oh, J.; Han, Y. Deep Learning-Based Detection of Urban Forest Cover Change along with Overall Urban Changes Using Very-High-Resolution Satellite Images. Remote Sens. 2023, 15, 4285. [Google Scholar] [CrossRef]
- Wang, H.; Lv, X.; Zhang, K.; Guo, B. Building Change Detection Based on 3D Co-Segmentation Using Satellite Stereo Imagery. Remote Sens. 2022, 14, 628. [Google Scholar] [CrossRef]
- Shen, L.; Lu, Y.; Chen, H.; Wei, H.; Xie, D.; Yue, J.; Chen, R.; Lv, S.; Jiang, B. S2looking: A Satellite Side-Looking Dataset for Building Change Detection. Remote Sens 2021, 13, 5094. [Google Scholar] [CrossRef]
- El Hachimi, J.; El Harti, A.; Lhissou, R.; Ouzemou, J.E.; Chakouri, M.; Jellouli, A. Combination of Sentinel-2 Satellite Images and Meteorological Data for Crop Water Requirements Estimation in Intensive Agriculture. Agriculture 2022, 12, 1168. [Google Scholar] [CrossRef]
- Veysi, S.; Naseri, A.A.; Hamzeh, S.; Bartholomeus, H. A Satellite Based Crop Water Stress Index for Irrigation Scheduling in Sugarcane Fields. Agric. Water Manag. 2017, 189, 70–86. [Google Scholar] [CrossRef]
- Soni, A.K.; Tripathi, J.N.; Ghosh, K.; Sateesh, M.; Singh, P. Evaluating Crop Water Stress through Satellite-Derived Crop Water Stress Index (CWSI) in Marathwada Region Using Google Earth Engine. J. Agrometeorol. 2023, 25, 539–546. [Google Scholar] [CrossRef]
- Shafi, U.; Mumtaz, R.; García-Nieto, J.; Hassan, S.A.; Zaidi, S.A.R.; Iqbal, N. Precision Agriculture Techniques and Practices: From Considerations to Applications. Sensors 2019, 19, 3796. [Google Scholar] [CrossRef] [PubMed]
- Chamara, N.; Islam, M.D.; Bai, G.F.; Shi, Y.; Ge, Y. Ag-IoT for Crop and Environment Monitoring: Past, Present, and Future. Agric. Syst. 2022, 203, 103497. [Google Scholar] [CrossRef]
- Jiang, J.; Atkinson, P.M.; Chen, C.; Cao, Q.; Tian, Y.; Zhu, Y.; Liu, X.; Cao, W. Combining UAV and Sentinel-2 Satellite Multi-Spectral Images to Diagnose Crop Growth and N Status in Winter Wheat at the County Scale. Field Crops Res. 2023, 294, 108860. [Google Scholar] [CrossRef]
- Maimaitijiang, M.; Sagan, V.; Sidike, P.; Daloye, A.M.; Erkbol, H.; Fritschi, F.B. Crop Monitoring Using Satellite/UAV Data Fusion and Machine Learning. Remote Sens. 2020, 12, 1357. [Google Scholar] [CrossRef]
- Sharif, S.A.; Hammad, A.; Eshraghi, P. Generation of Whole Building Renovation Scenarios Using Variational Autoencoders. Energy Build. 2021, 230, 110520. [Google Scholar] [CrossRef]
- Posada, H.; Chacón, R.; Ramonell, C. I-Twin. Computational Twin Connectors for I-profiles. Towards Unforeseen Interoperability of Digital Tools. Ce/Pap. 2023, 6, 445–451. [Google Scholar] [CrossRef]
- Fareeza, F.; Krishna Veni, S.; Rambabu, C.; Yanore, T.Z.; Rajkumar, P. Future Energy Source for Remote IoT Systems Using MEMS-Based Piezoelectric Energy Harvesting Devices. J. Phys. Conf. Ser. 2021, 1979, 012067. [Google Scholar] [CrossRef]
- Scuro, C.; Alì, G.; Demarco, F.; Porzio, S. Development of a Structural Health Monitoring System with IoT Smart Nodes Based on Mathematical Model of Inverted Pendulums Equipped with Accelerometers. Int. J. Mason. Res. Innov. 2022, 7, 624–649. [Google Scholar] [CrossRef]
- Meyer, A. Vibration Fault Diagnosis in Wind Turbines Based on Automated Feature Learning. Energies 2022, 15, 1514. [Google Scholar] [CrossRef]
- Palacios, I.; Placencia, J.; Muñoz, M.; Samaniego, V.; González, S.; Jiménez, J. MQTT Based Event Detection System for Structural Health Monitoring of Buildings. In Emerging Research in Intelligent Systems; Botto-Tobar, M., Cruz, H., Díaz Cadena, A., Durakovic, B., Eds.; CIT 2021. Lecture Notes in Networks and Systems; Springer: Cham, Switzerland, 2022; Volume 405. [Google Scholar] [CrossRef]
- Komarizadehasl, S.; Huguenet, P.; Lozano, F.; Lozano-Galant, J.A.; Turmo, J. Operational and Analytical Modal Analysis of a Bridge Using Low-Cost Wireless Arduino-Based Accelerometers. Sensors 2022, 22, 9808. [Google Scholar] [CrossRef] [PubMed]
- Sharma, S.; Ahmed, S.; Naseem, M.; Alnumay, W.S.; Singh, S.; Cho, G.H. A Survey on Applications of Artificial Intelligence for Pre-Parametric Project Cost and Soil Shear-Strength Estimation in Construction and Geotechnical Engineering. Sensors 2021, 21, 463. [Google Scholar] [CrossRef] [PubMed]
- Mastrucci, A.; Marvuglia, A.; Benetto, E.; Leopold, U. A Spatio-Temporal Life Cycle Assessment Framework for Building Renovation Scenarios at the Urban Scale. Renew. Sustain. Energy Rev. 2020, 126, 109834. [Google Scholar] [CrossRef]
- Maia, I.; Kranzl, L.; Müller, A. New Step-by-Step Retrofitting Model for Delivering Optimum Timing. Appl. Energy 2021, 290, 116714. [Google Scholar] [CrossRef]
- Nesticò, A.; Marca, M. La Urban Real Estate Values and Ecosystem Disservices: An Estimate Model Based on Regression Analysis. Sustainability 2020, 12, 6304. [Google Scholar] [CrossRef]
- Mulero-Palencia, S.; Álvarez-Díaz, S.; Andrés-Chicote, M. Machine Learning for the Improvement of Deep Renovation Building Projects Using As-Built Bim Models. Sustainability 2021, 13, 6576. [Google Scholar] [CrossRef]
- Bertocchi, D.; Camatti, N. Tourism in Venice: Mapping Overtourism and Exploring Solutions. In A Research Agenda for Urban Tourism; Edward Elgar Publishing: Cheltenham, UK, 2022. [Google Scholar]
- Bertocchi, D.; Camatti, N.; Giove, S.; van der Borg, J. Venice and Overtourism: Simulating Sustainable Development Scenarios through a Tourism Carrying Capacity Model. Sustainability 2020, 12, 512. [Google Scholar] [CrossRef]
- Kryczka, M. Overtourism vs. Sustainable Development of Tourism. Attempts to Handle Overtourism Following the Example of Venice. Stud. Perieget. 2019, 2, 43–61. [Google Scholar]
- Regione Del Veneto; Comune Di Venezia; Università Ca’ Foscari Venezia; Università Iuav Di Venezia; Accademia Di Belle Arti Venezia; Conservatorio Di Musica Benedetto Marcello Venezia; Fondazione Venezia Capitale Mondiale Della Sostenibilità. Venezia Città Campus. Italy. 2023. Available online: https://www.iuav.it/sites/default/files/2024-05/Venezia-Citt--Campus.pdf (accessed on 29 December 2024).
- Università Iuav di Venezia. Piano Strategico 2023–2027; Università Iuav di Venezia: Venice, Italy, 2024; Available online: https://www.iuav.it/sites/default/files/2024-10/piano-strategico-2023_2027_completo.pdf (accessed on 29 December 2024).
- Benno, A. Un nuovo Campus per la città = A new Campus for the city. In WA VE 2022 Workshop Architettura Venezia; Iorio, A., Calogero, L., Eds.; Anteferma Edizioni: Venice, Italy, 2024; Volume 1, ISBN 979-1259530479. [Google Scholar]
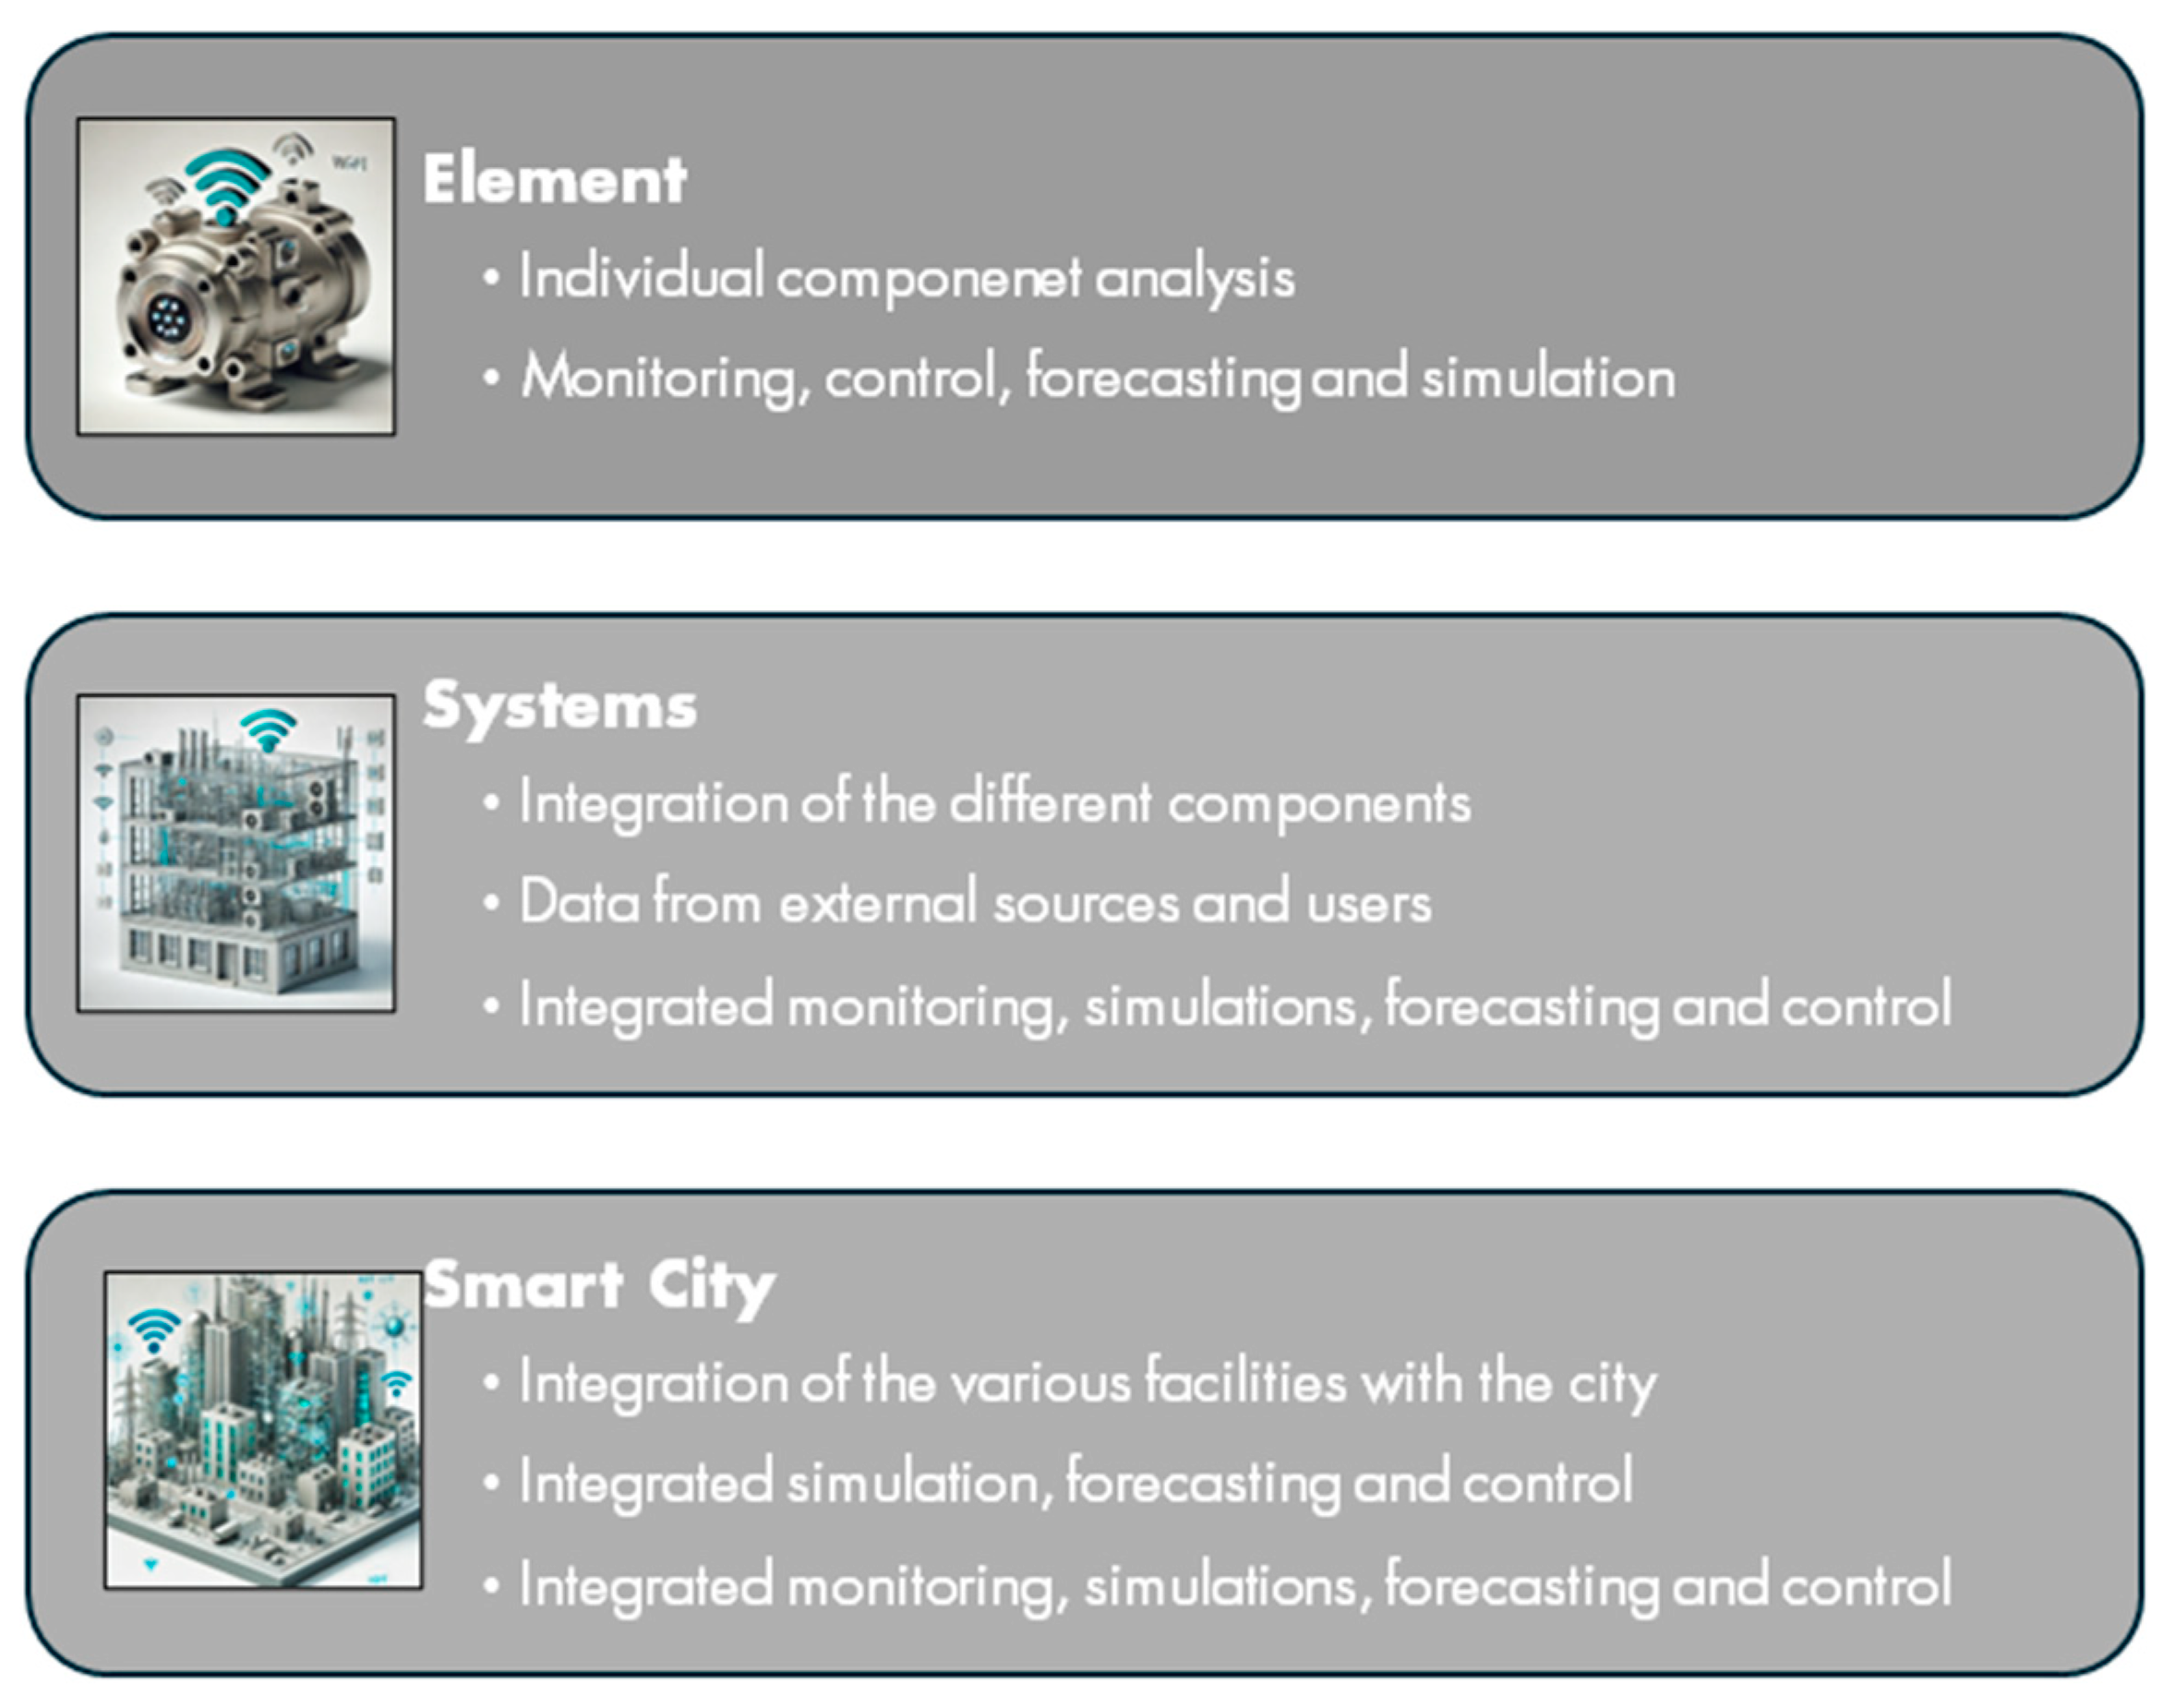
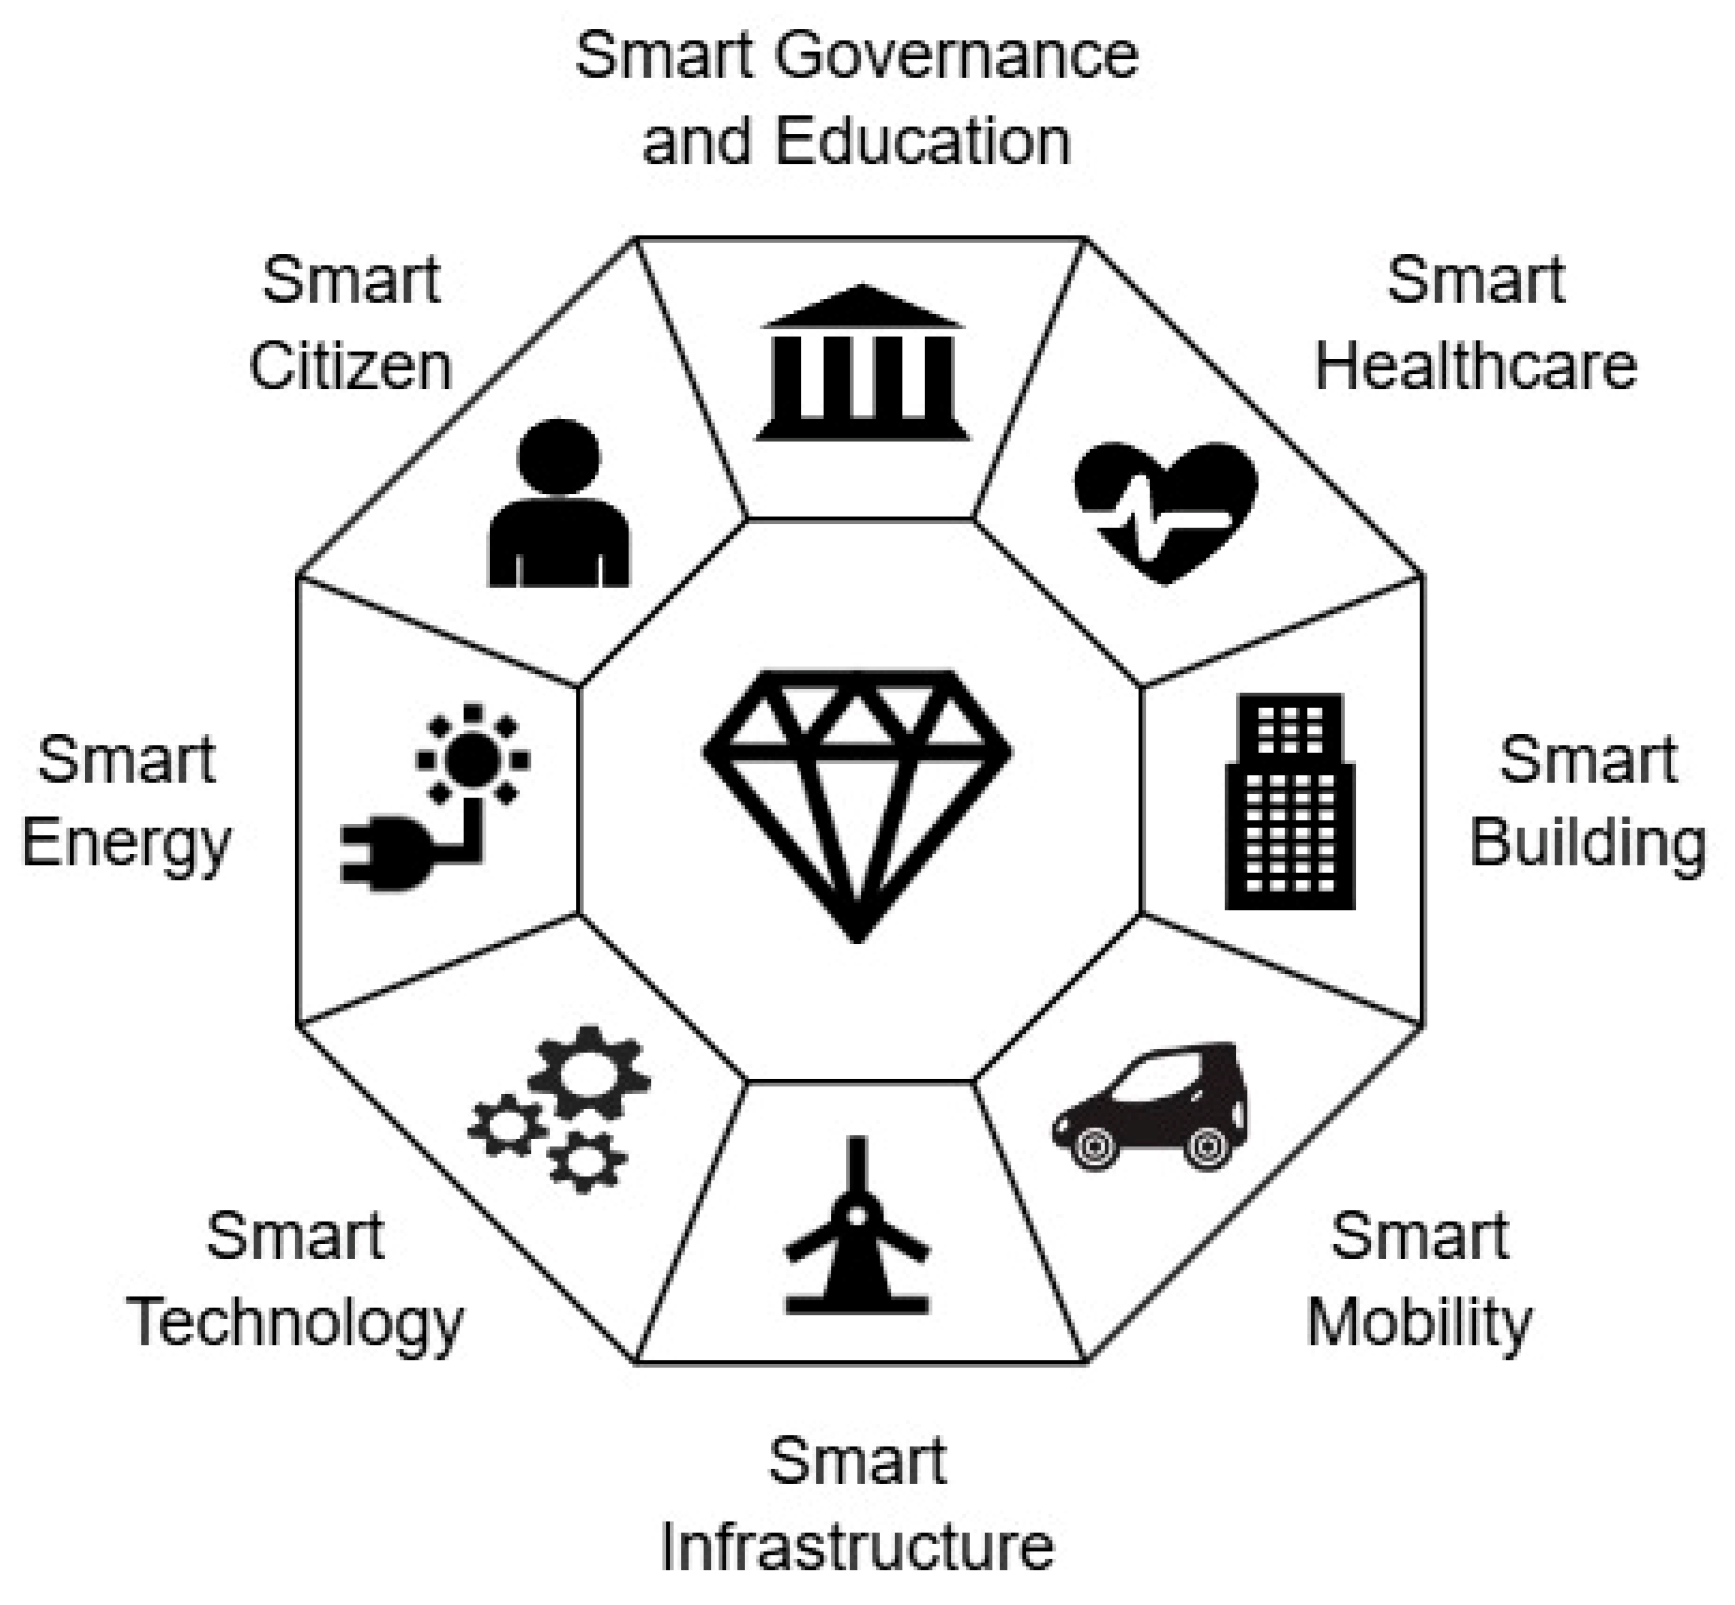
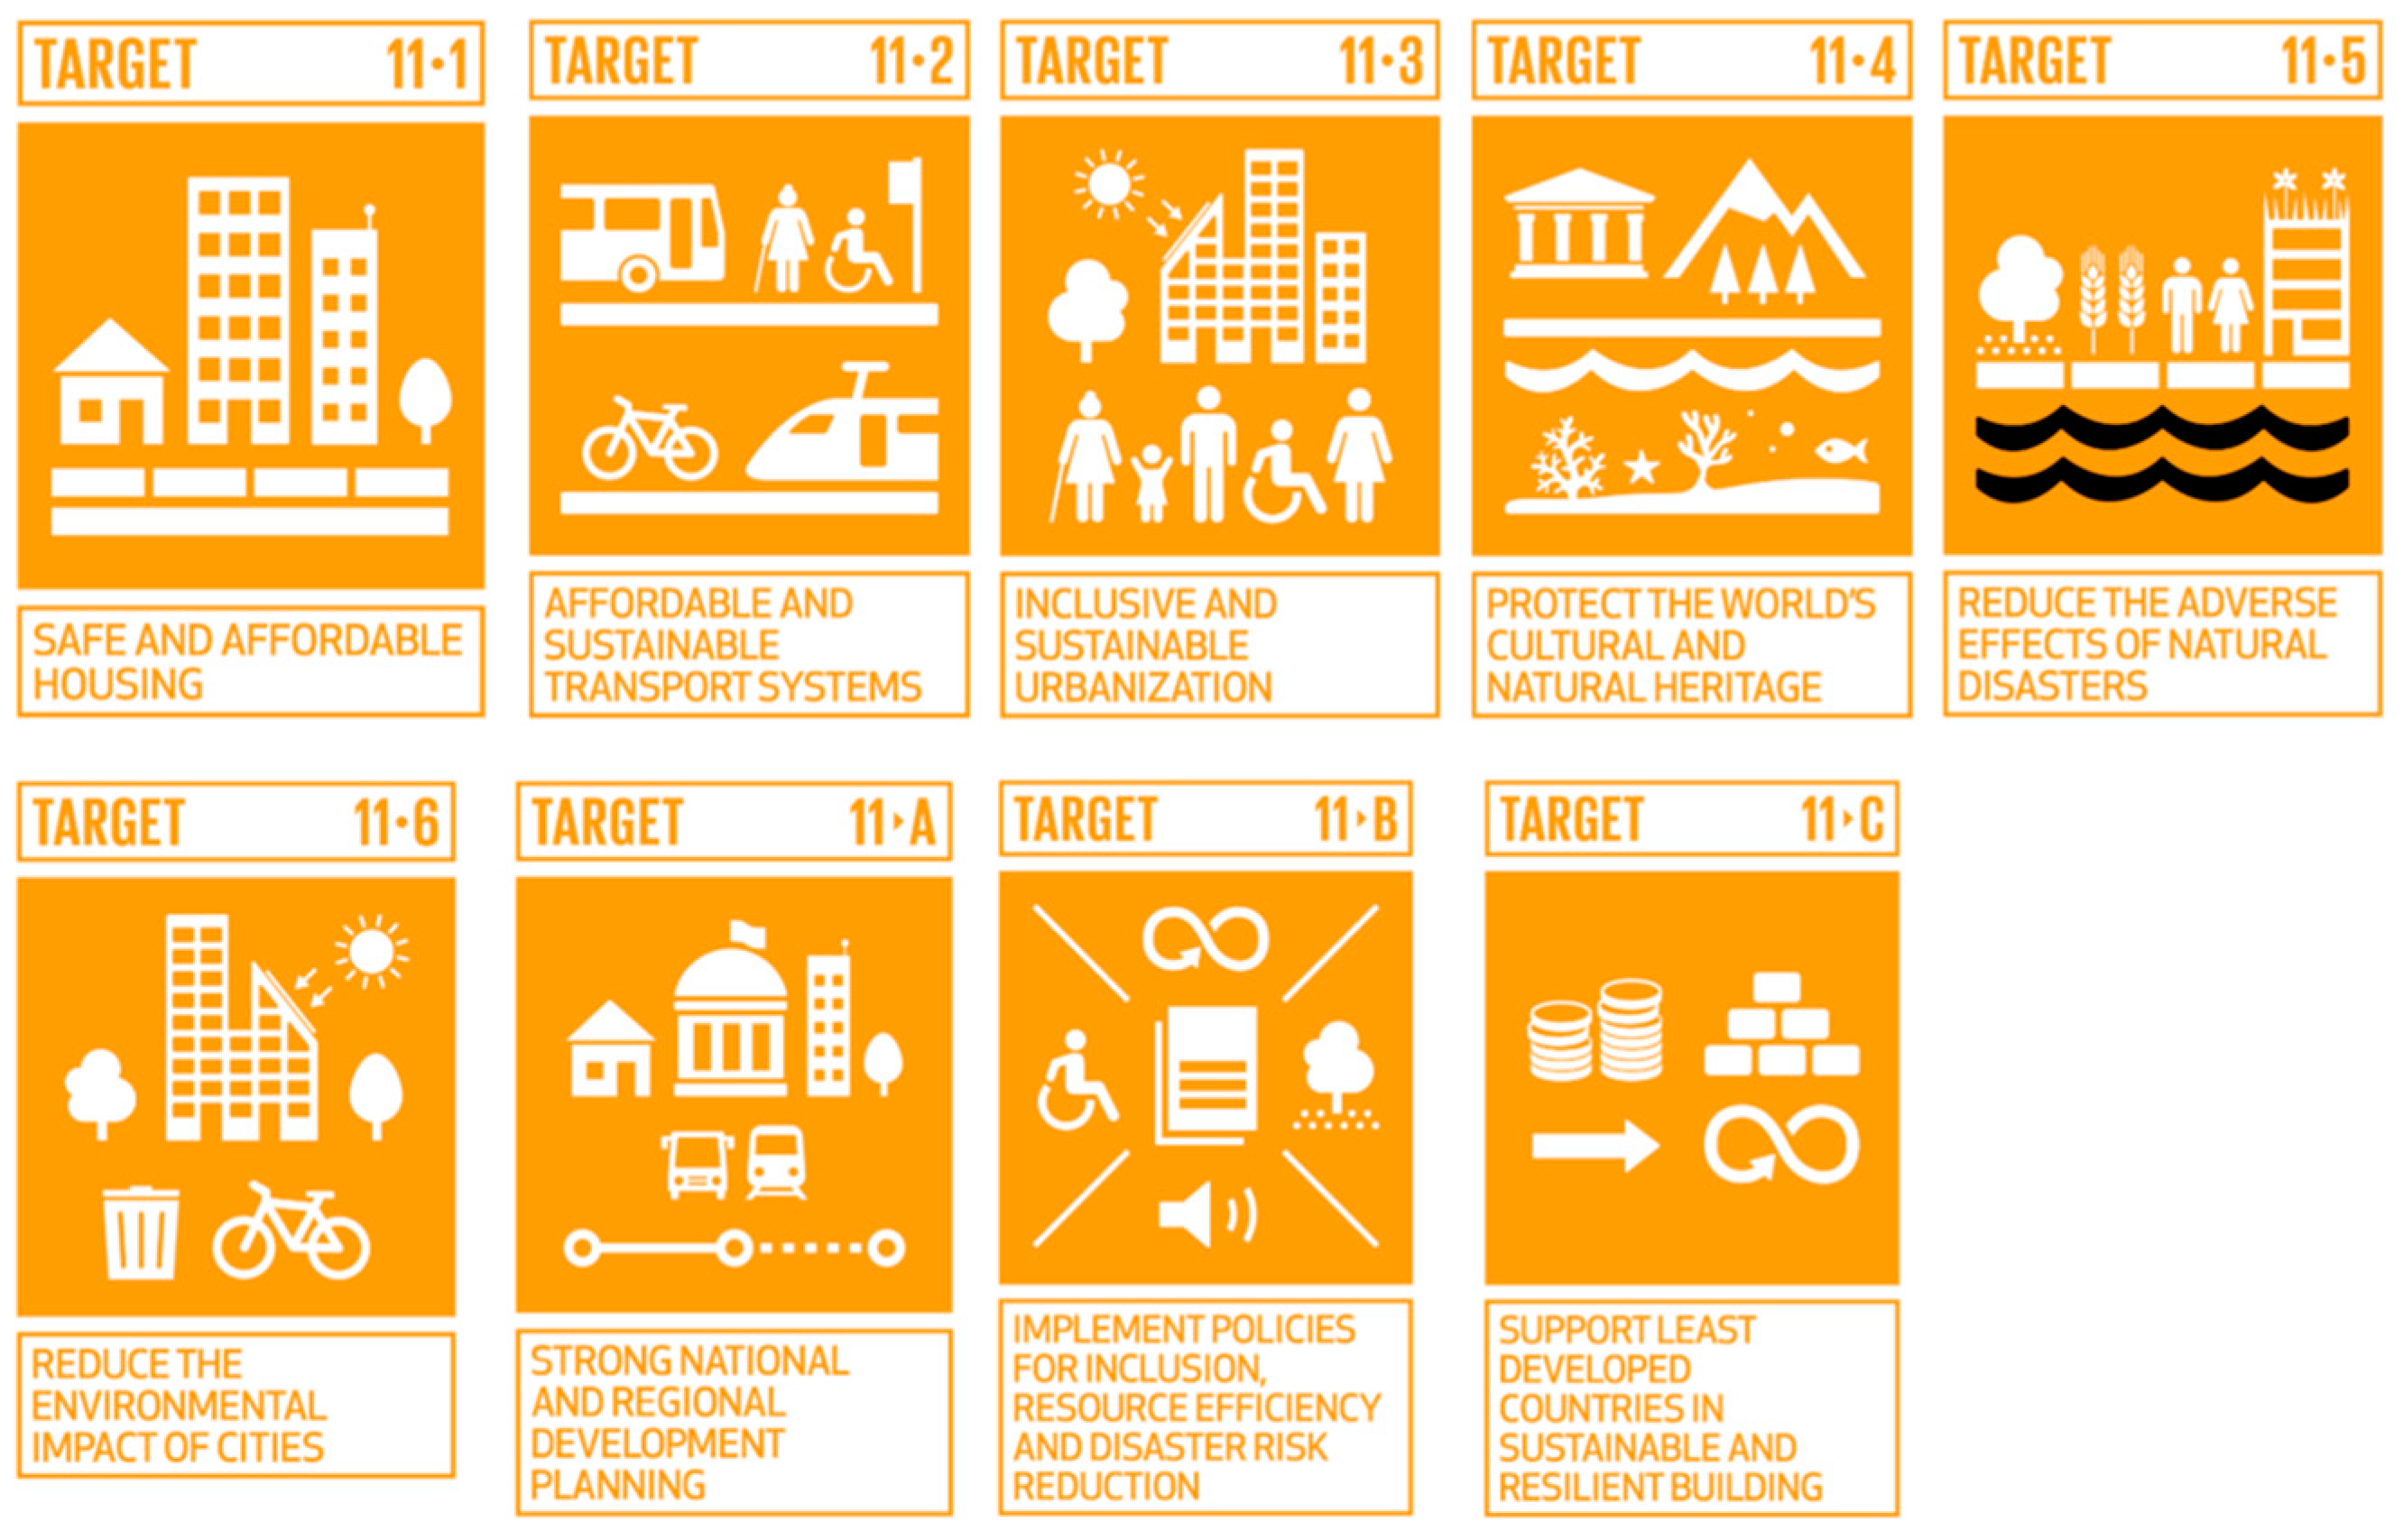
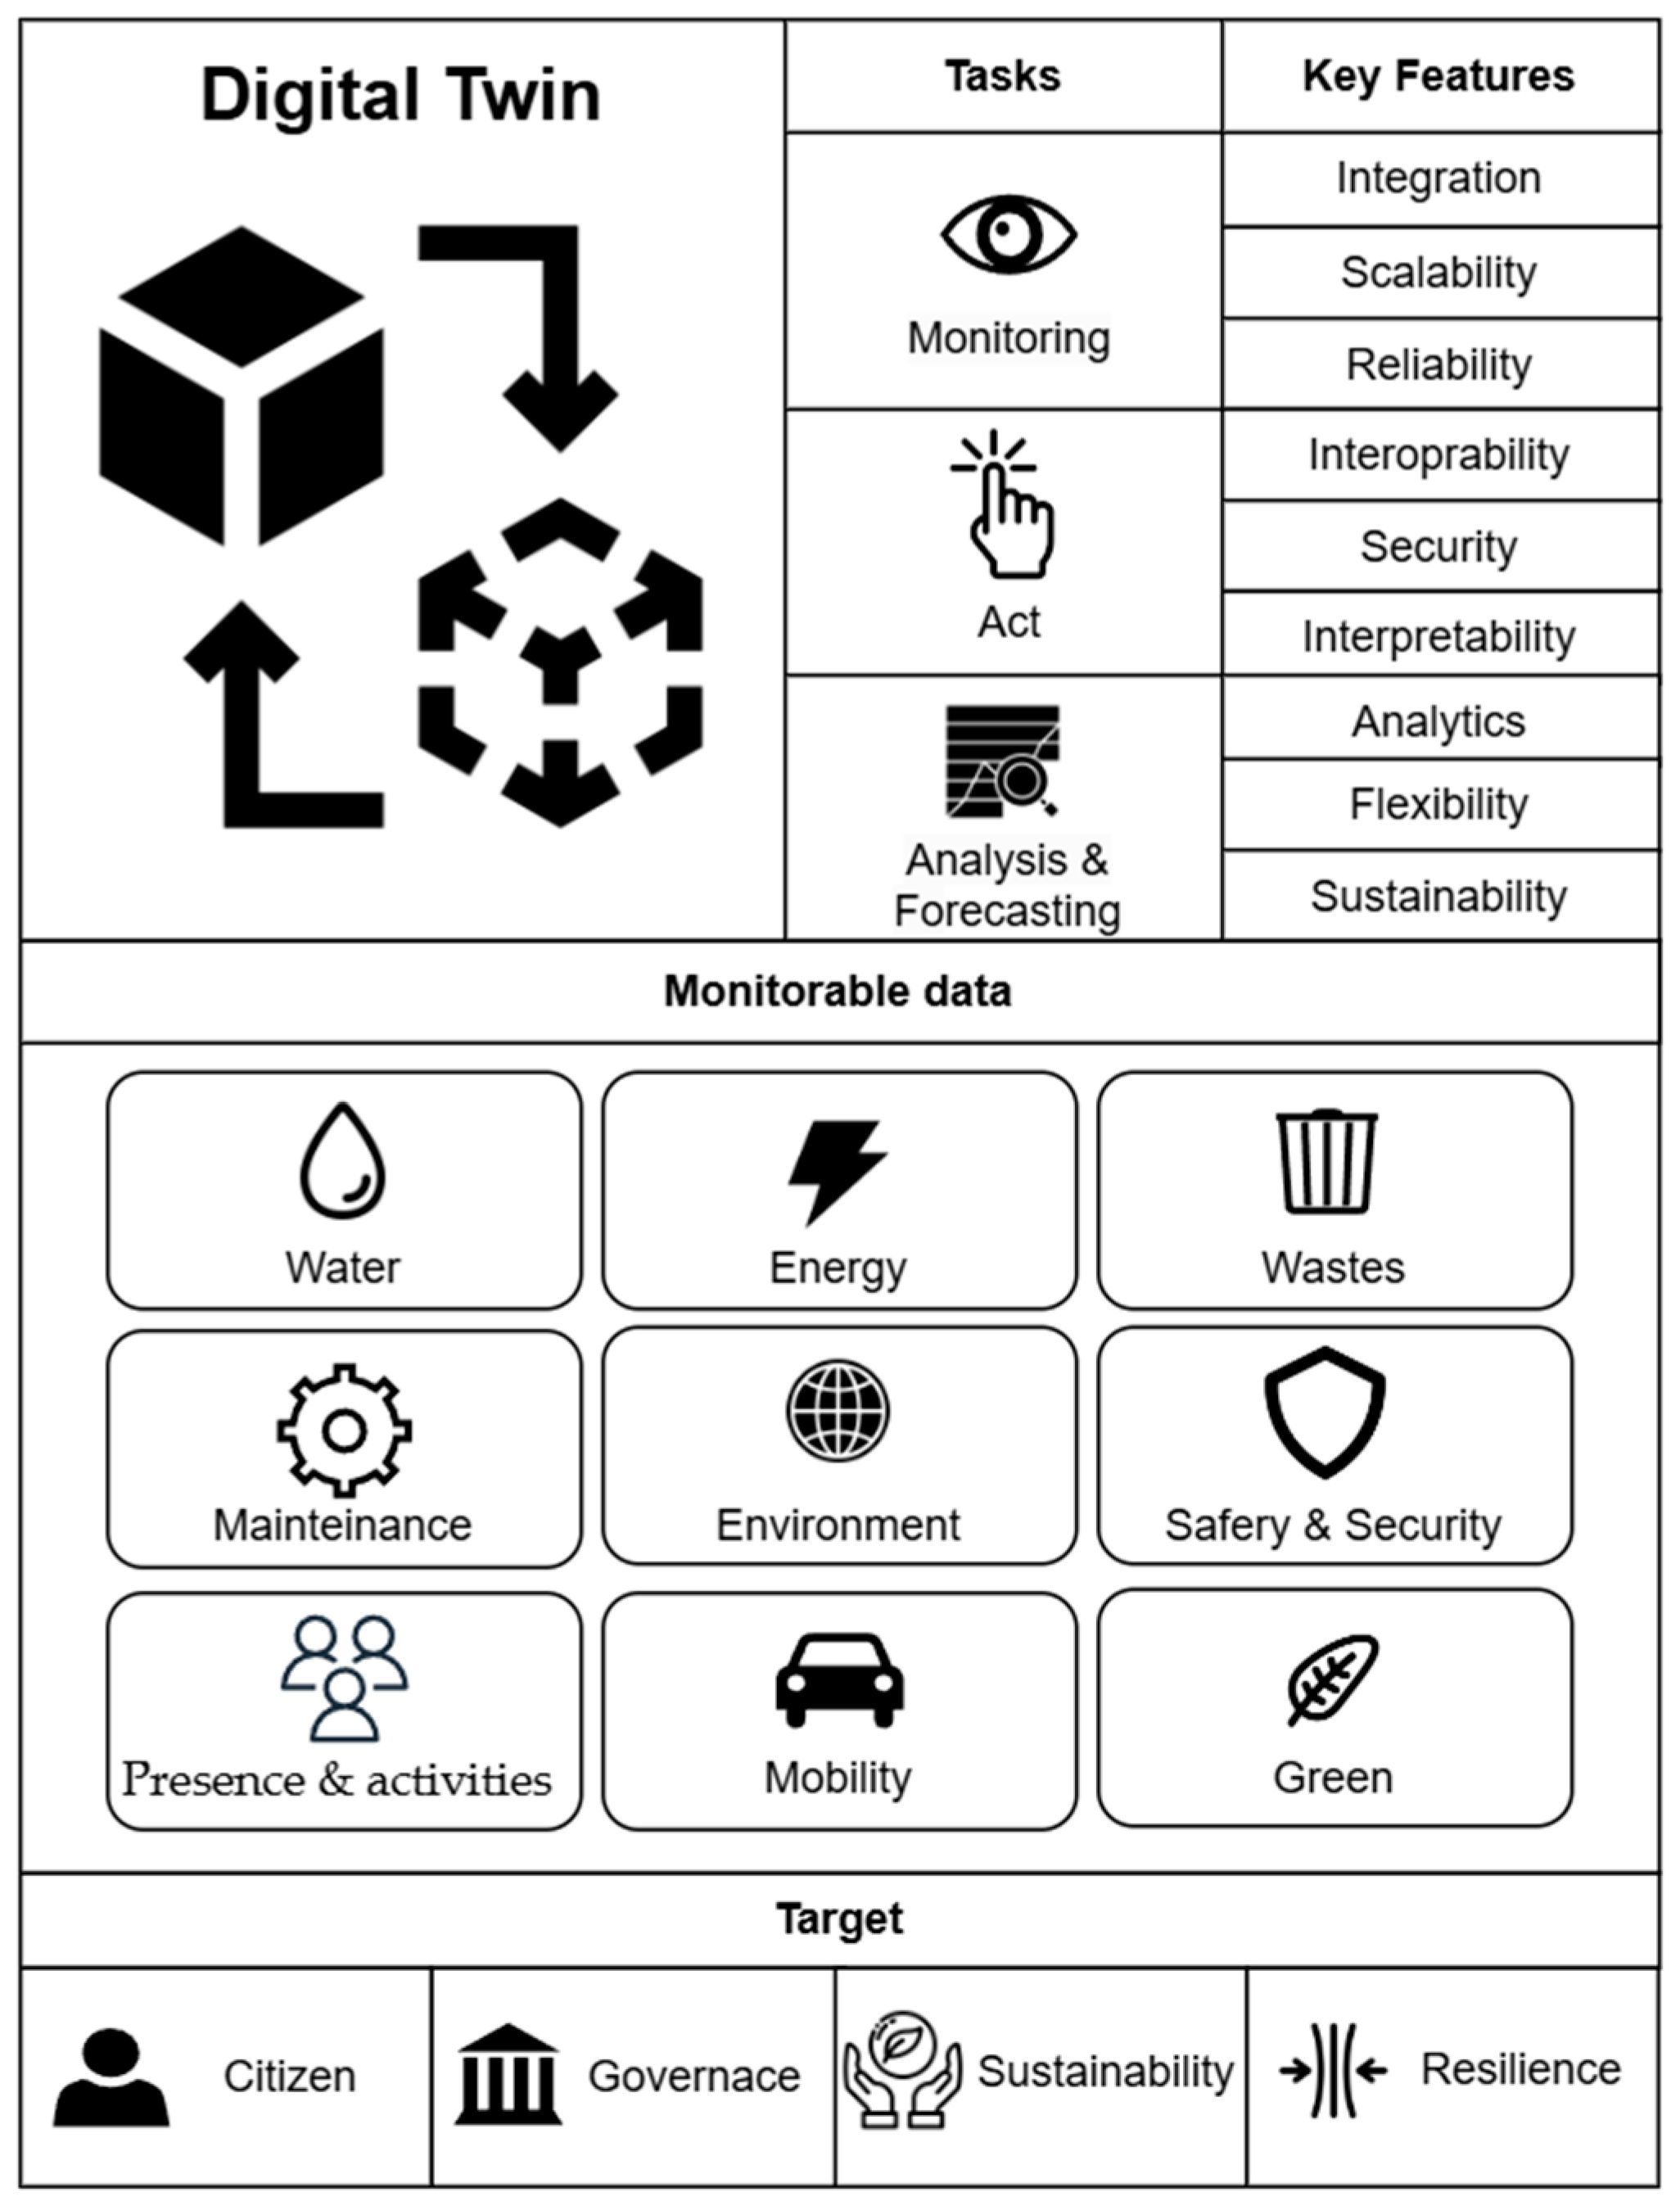

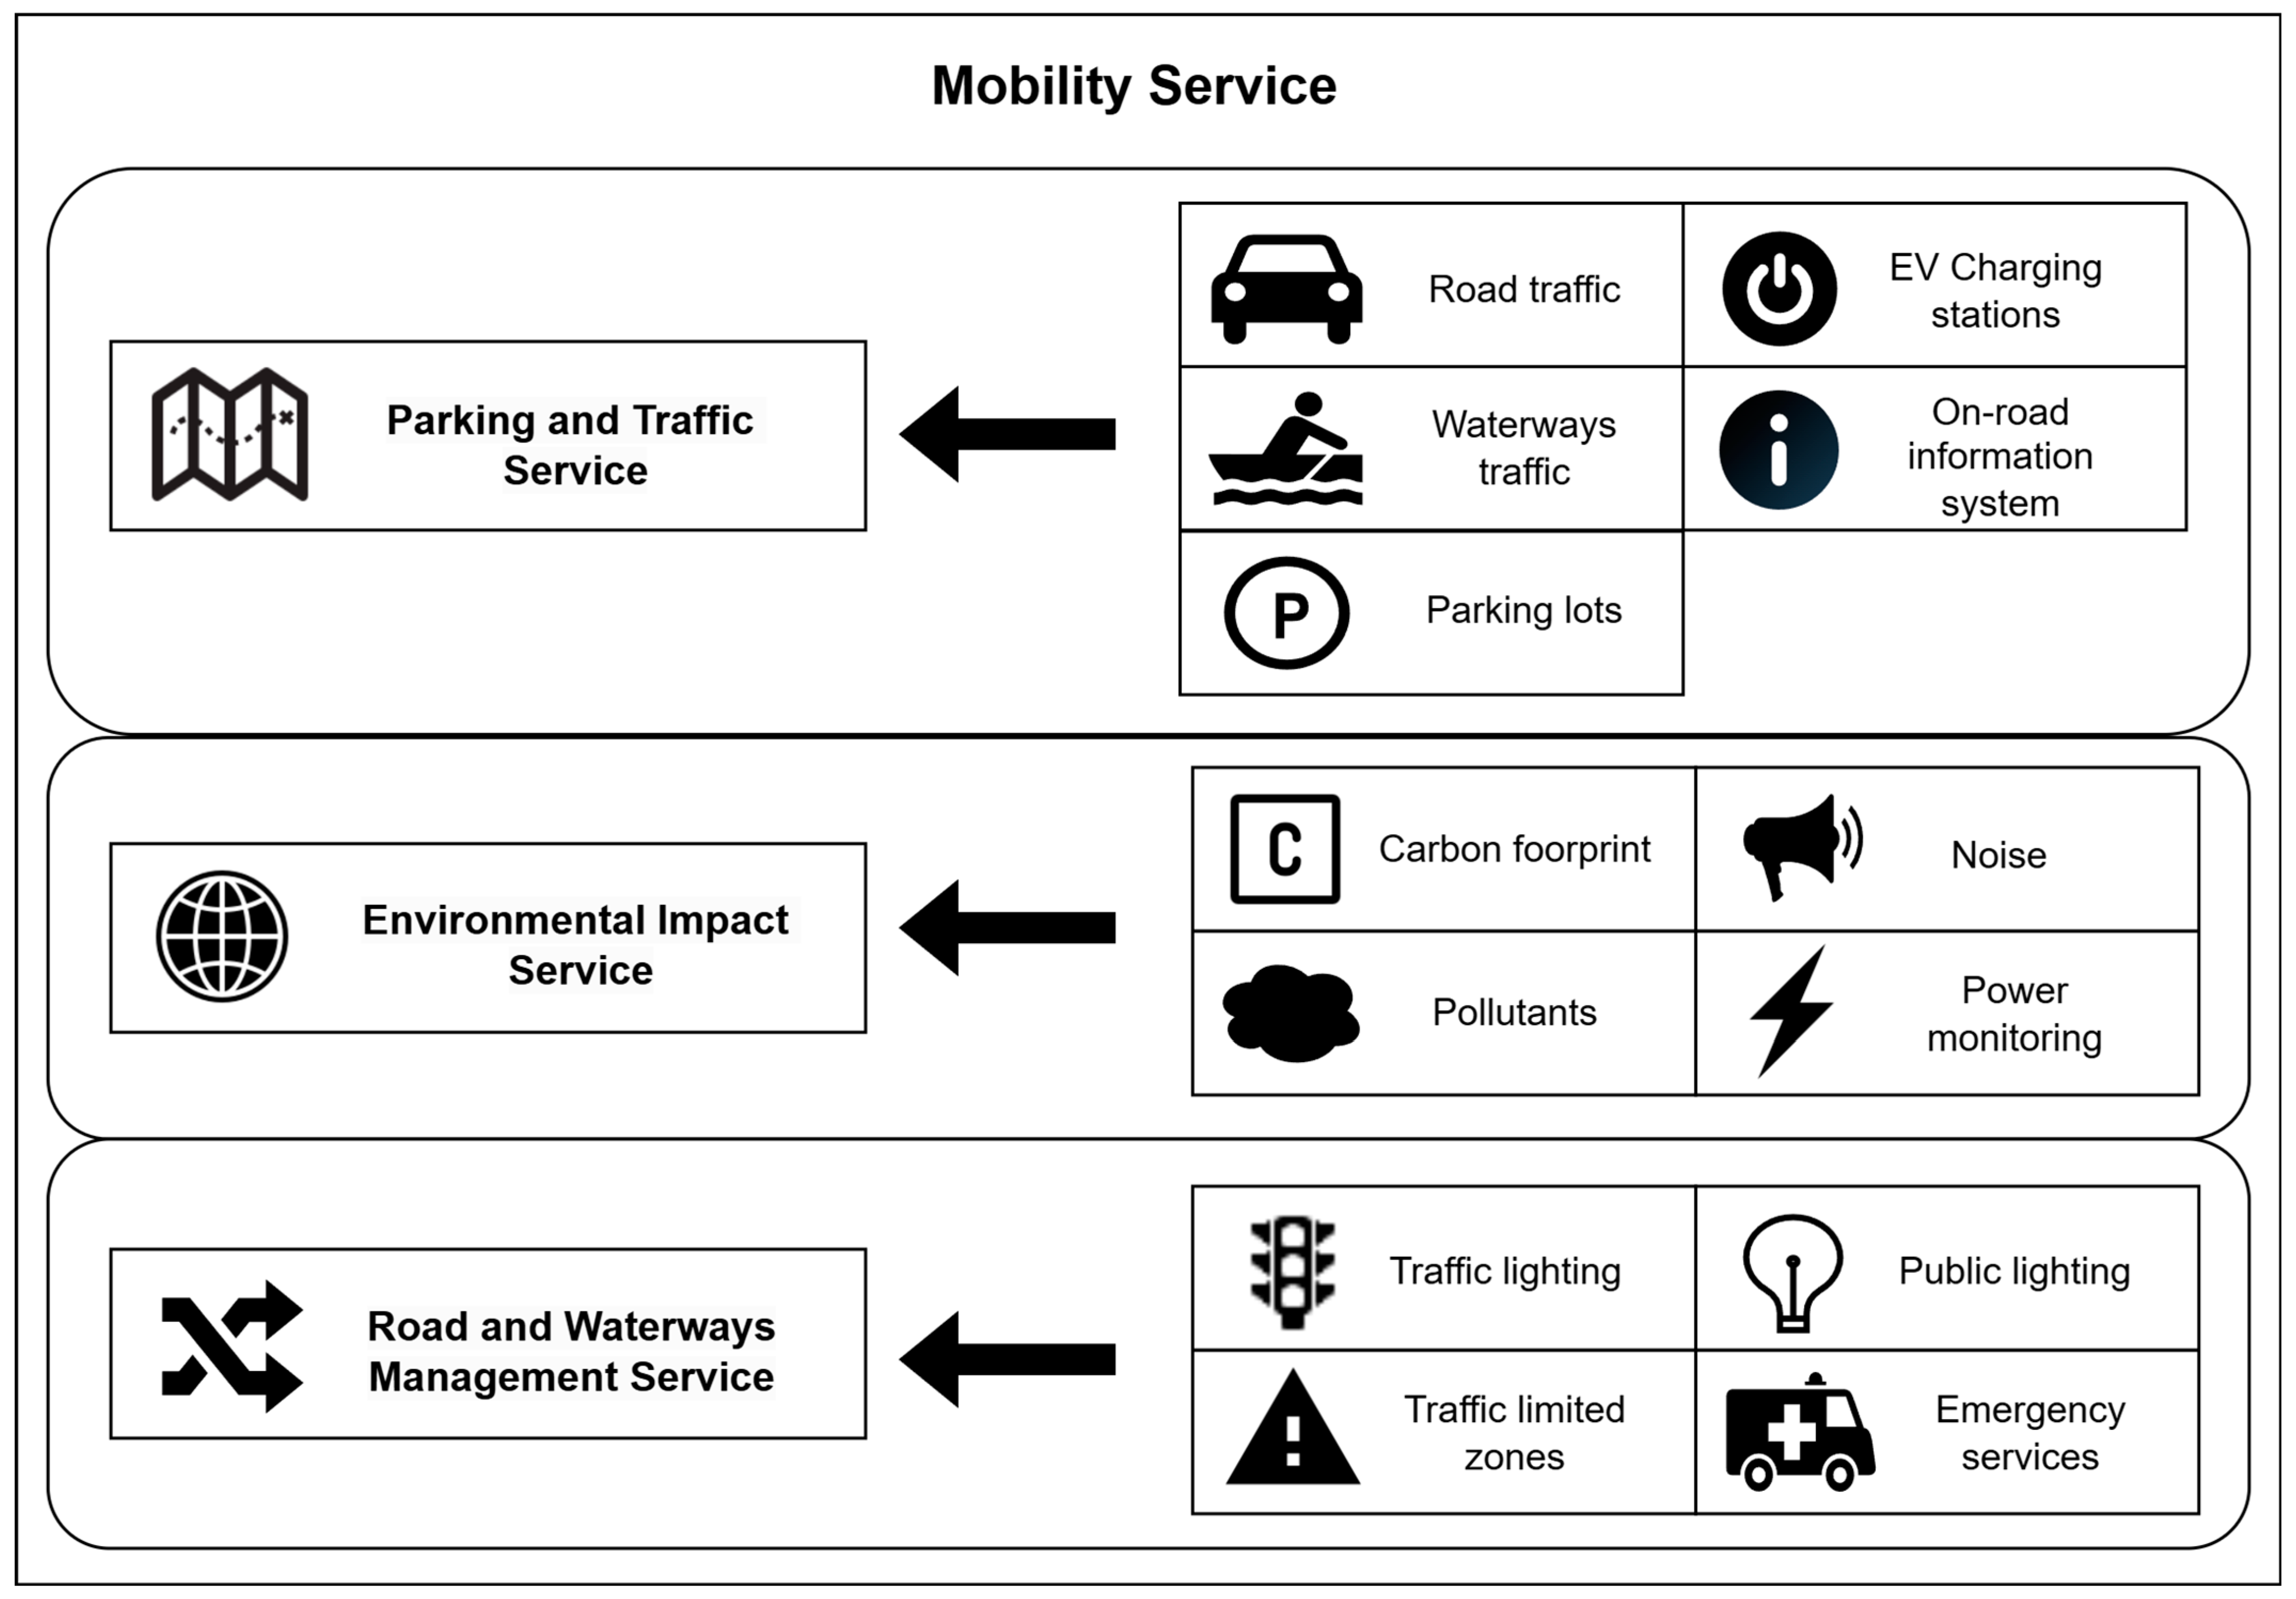

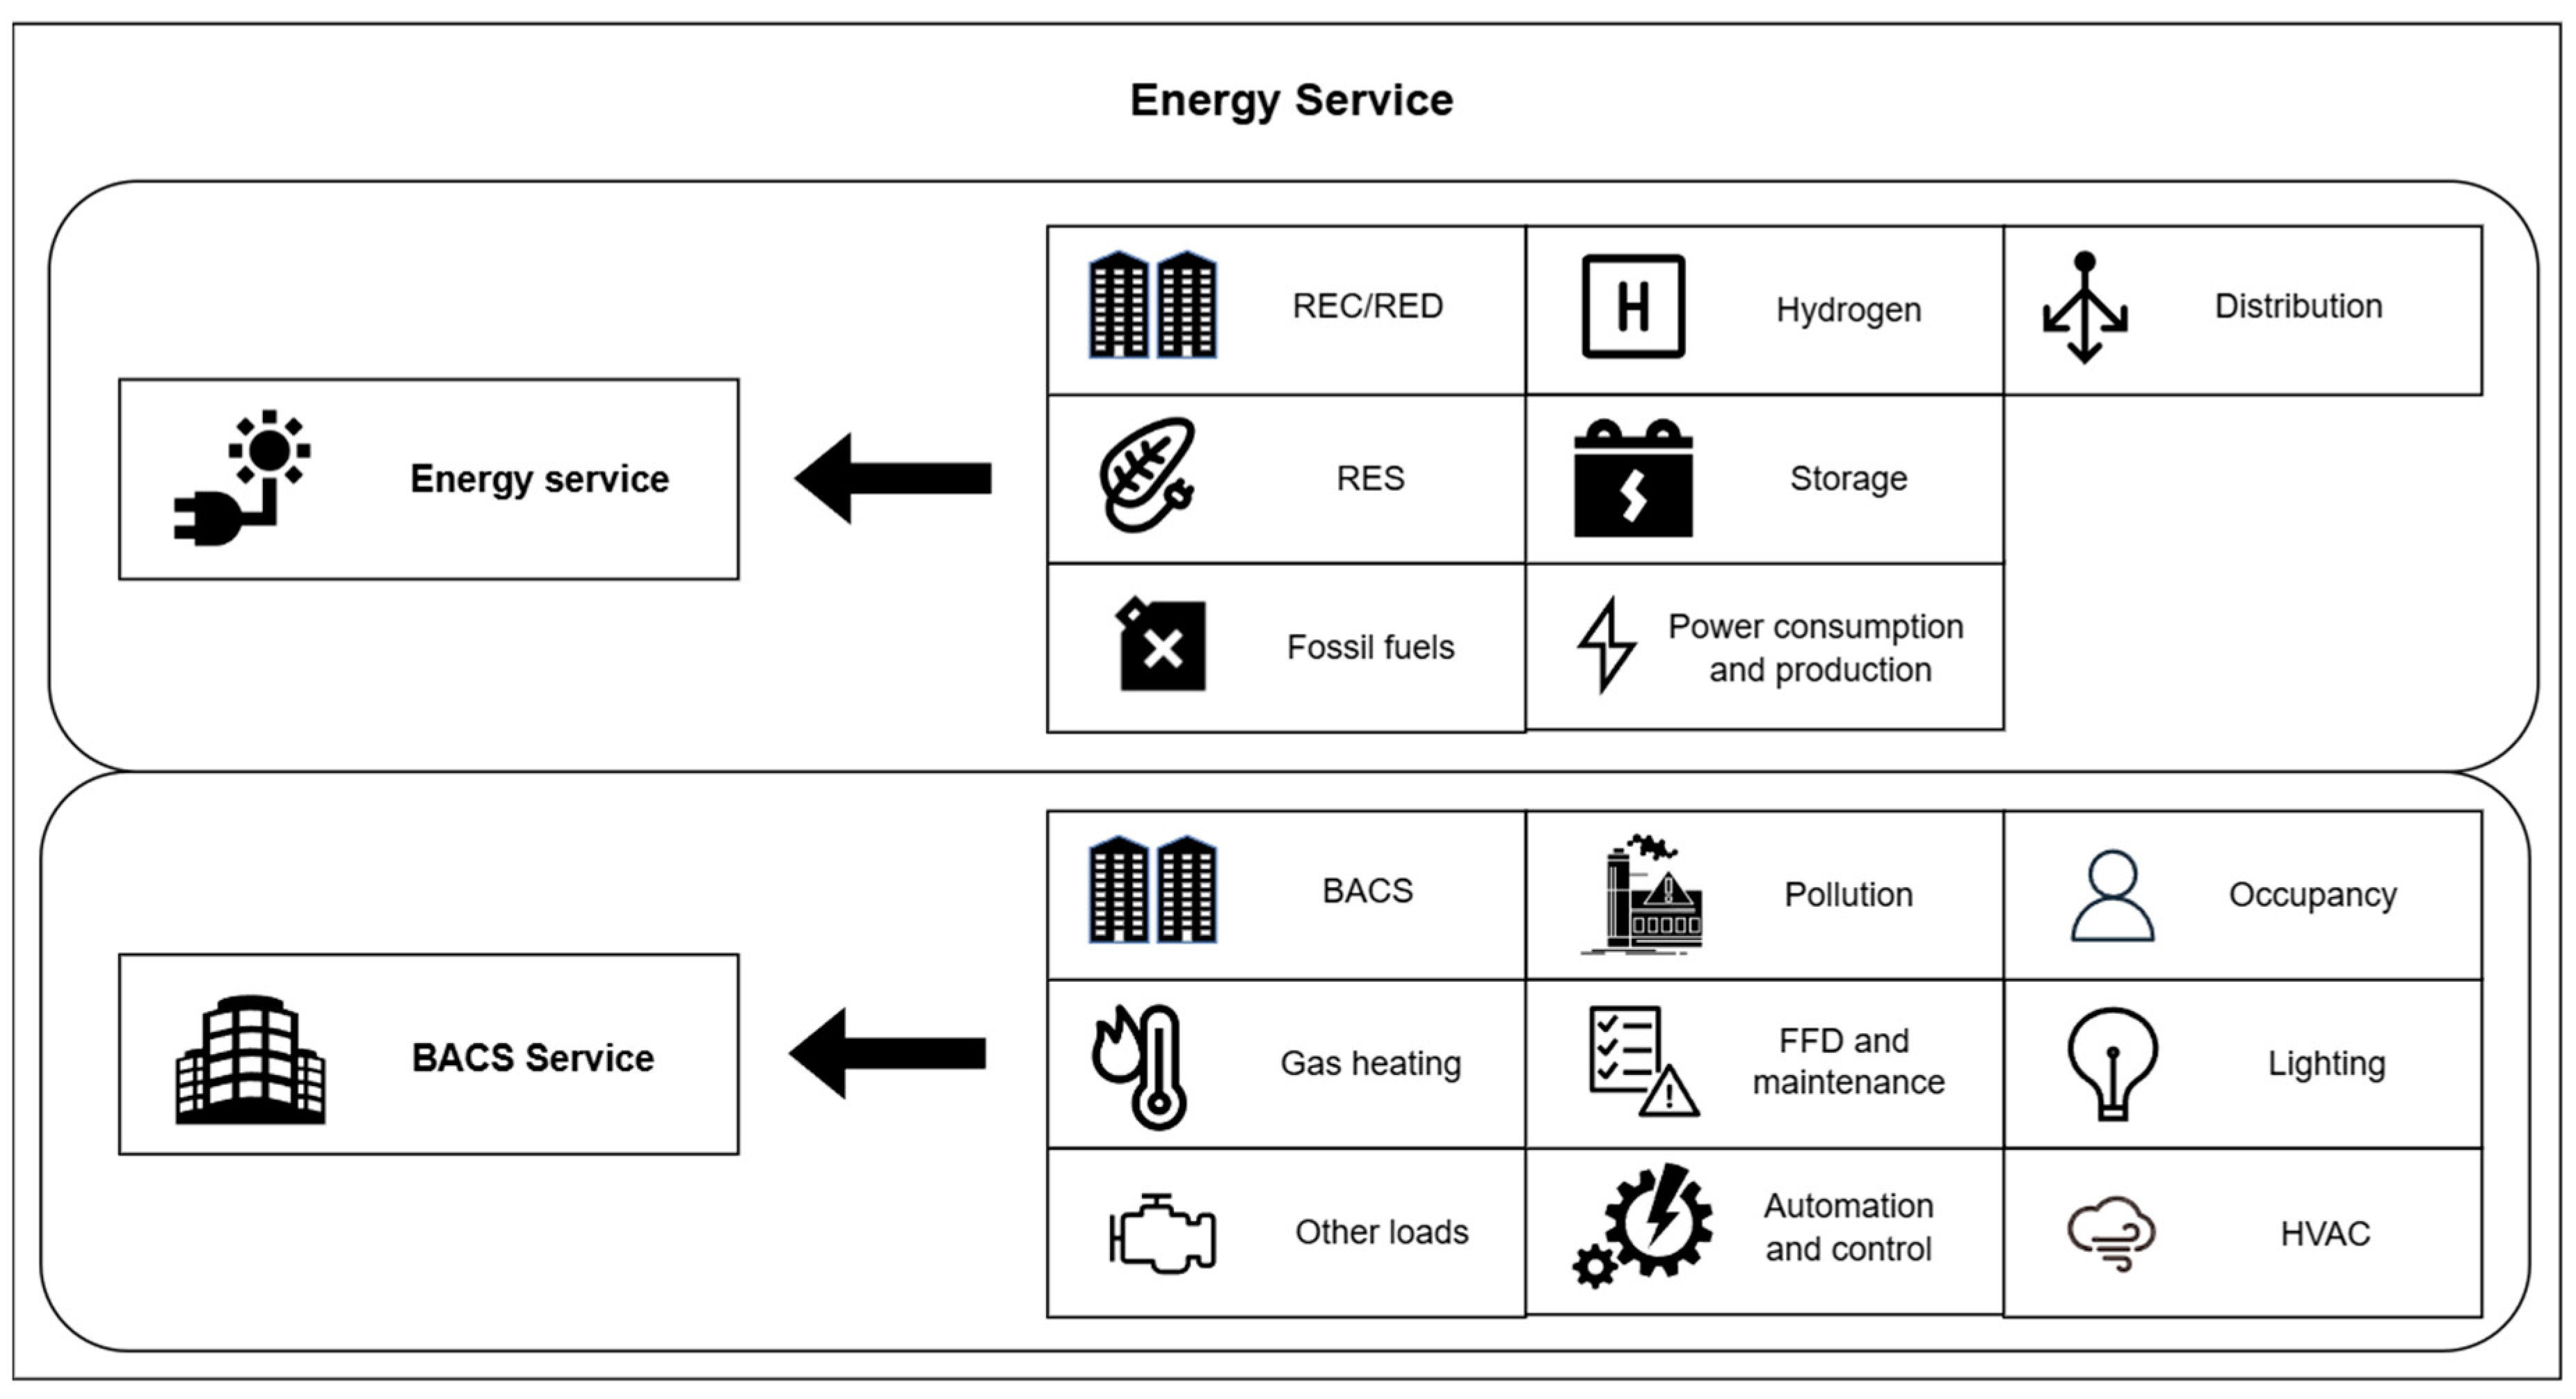
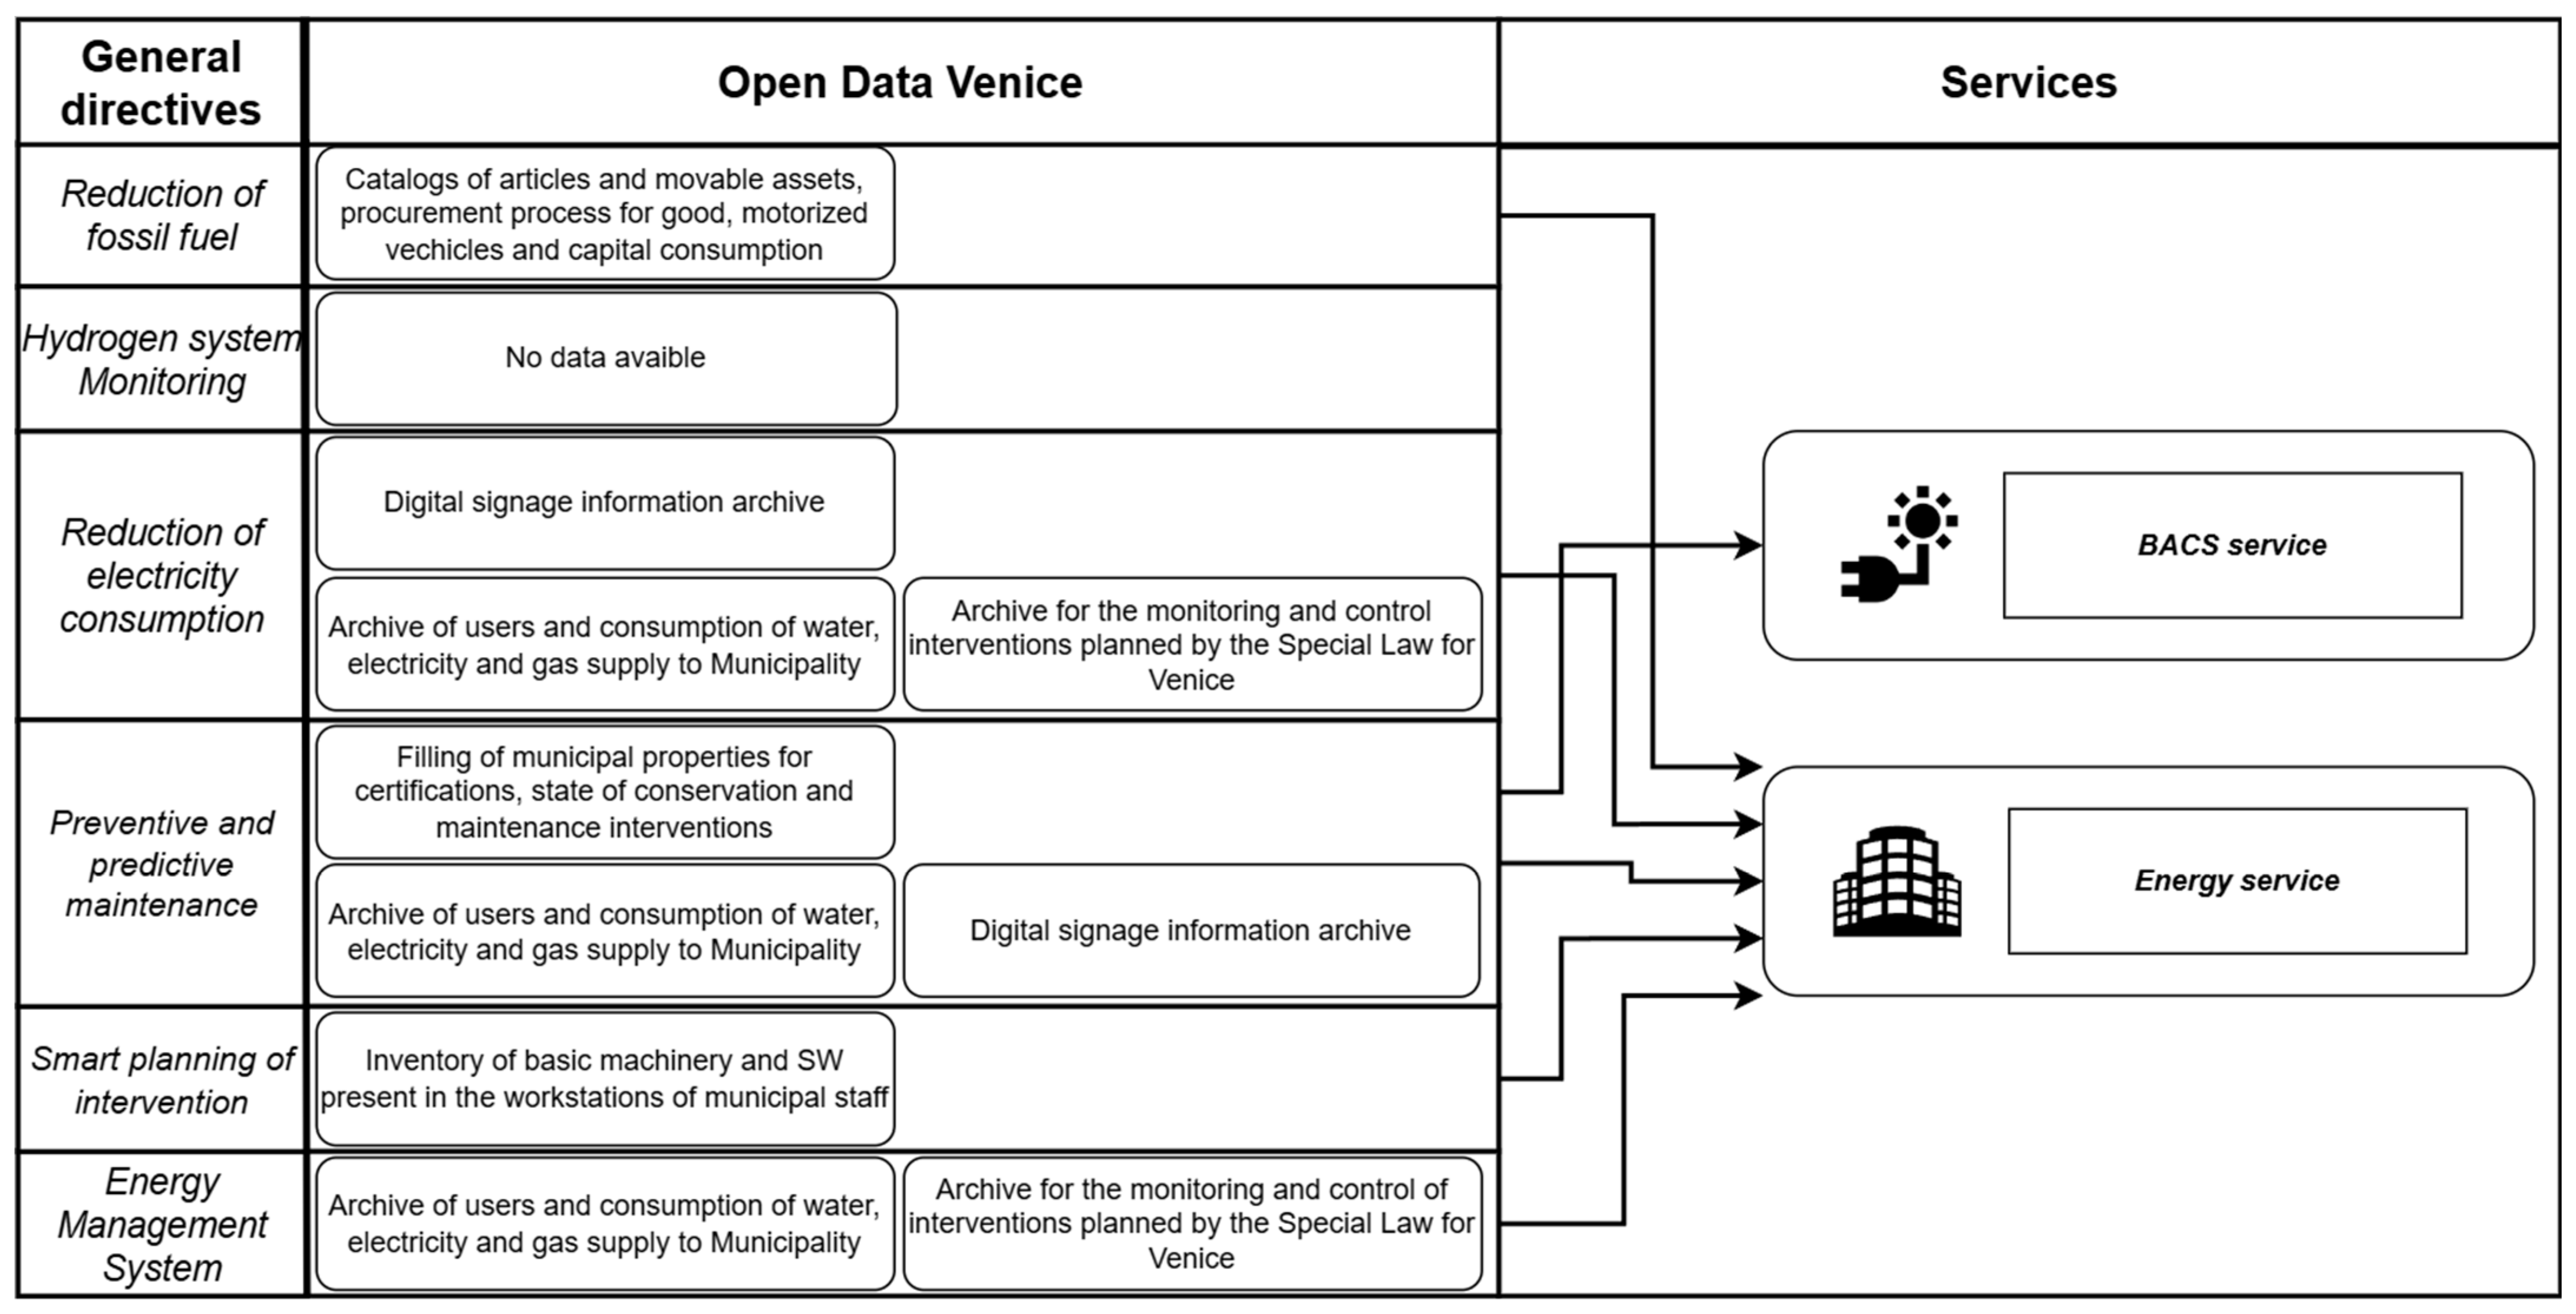
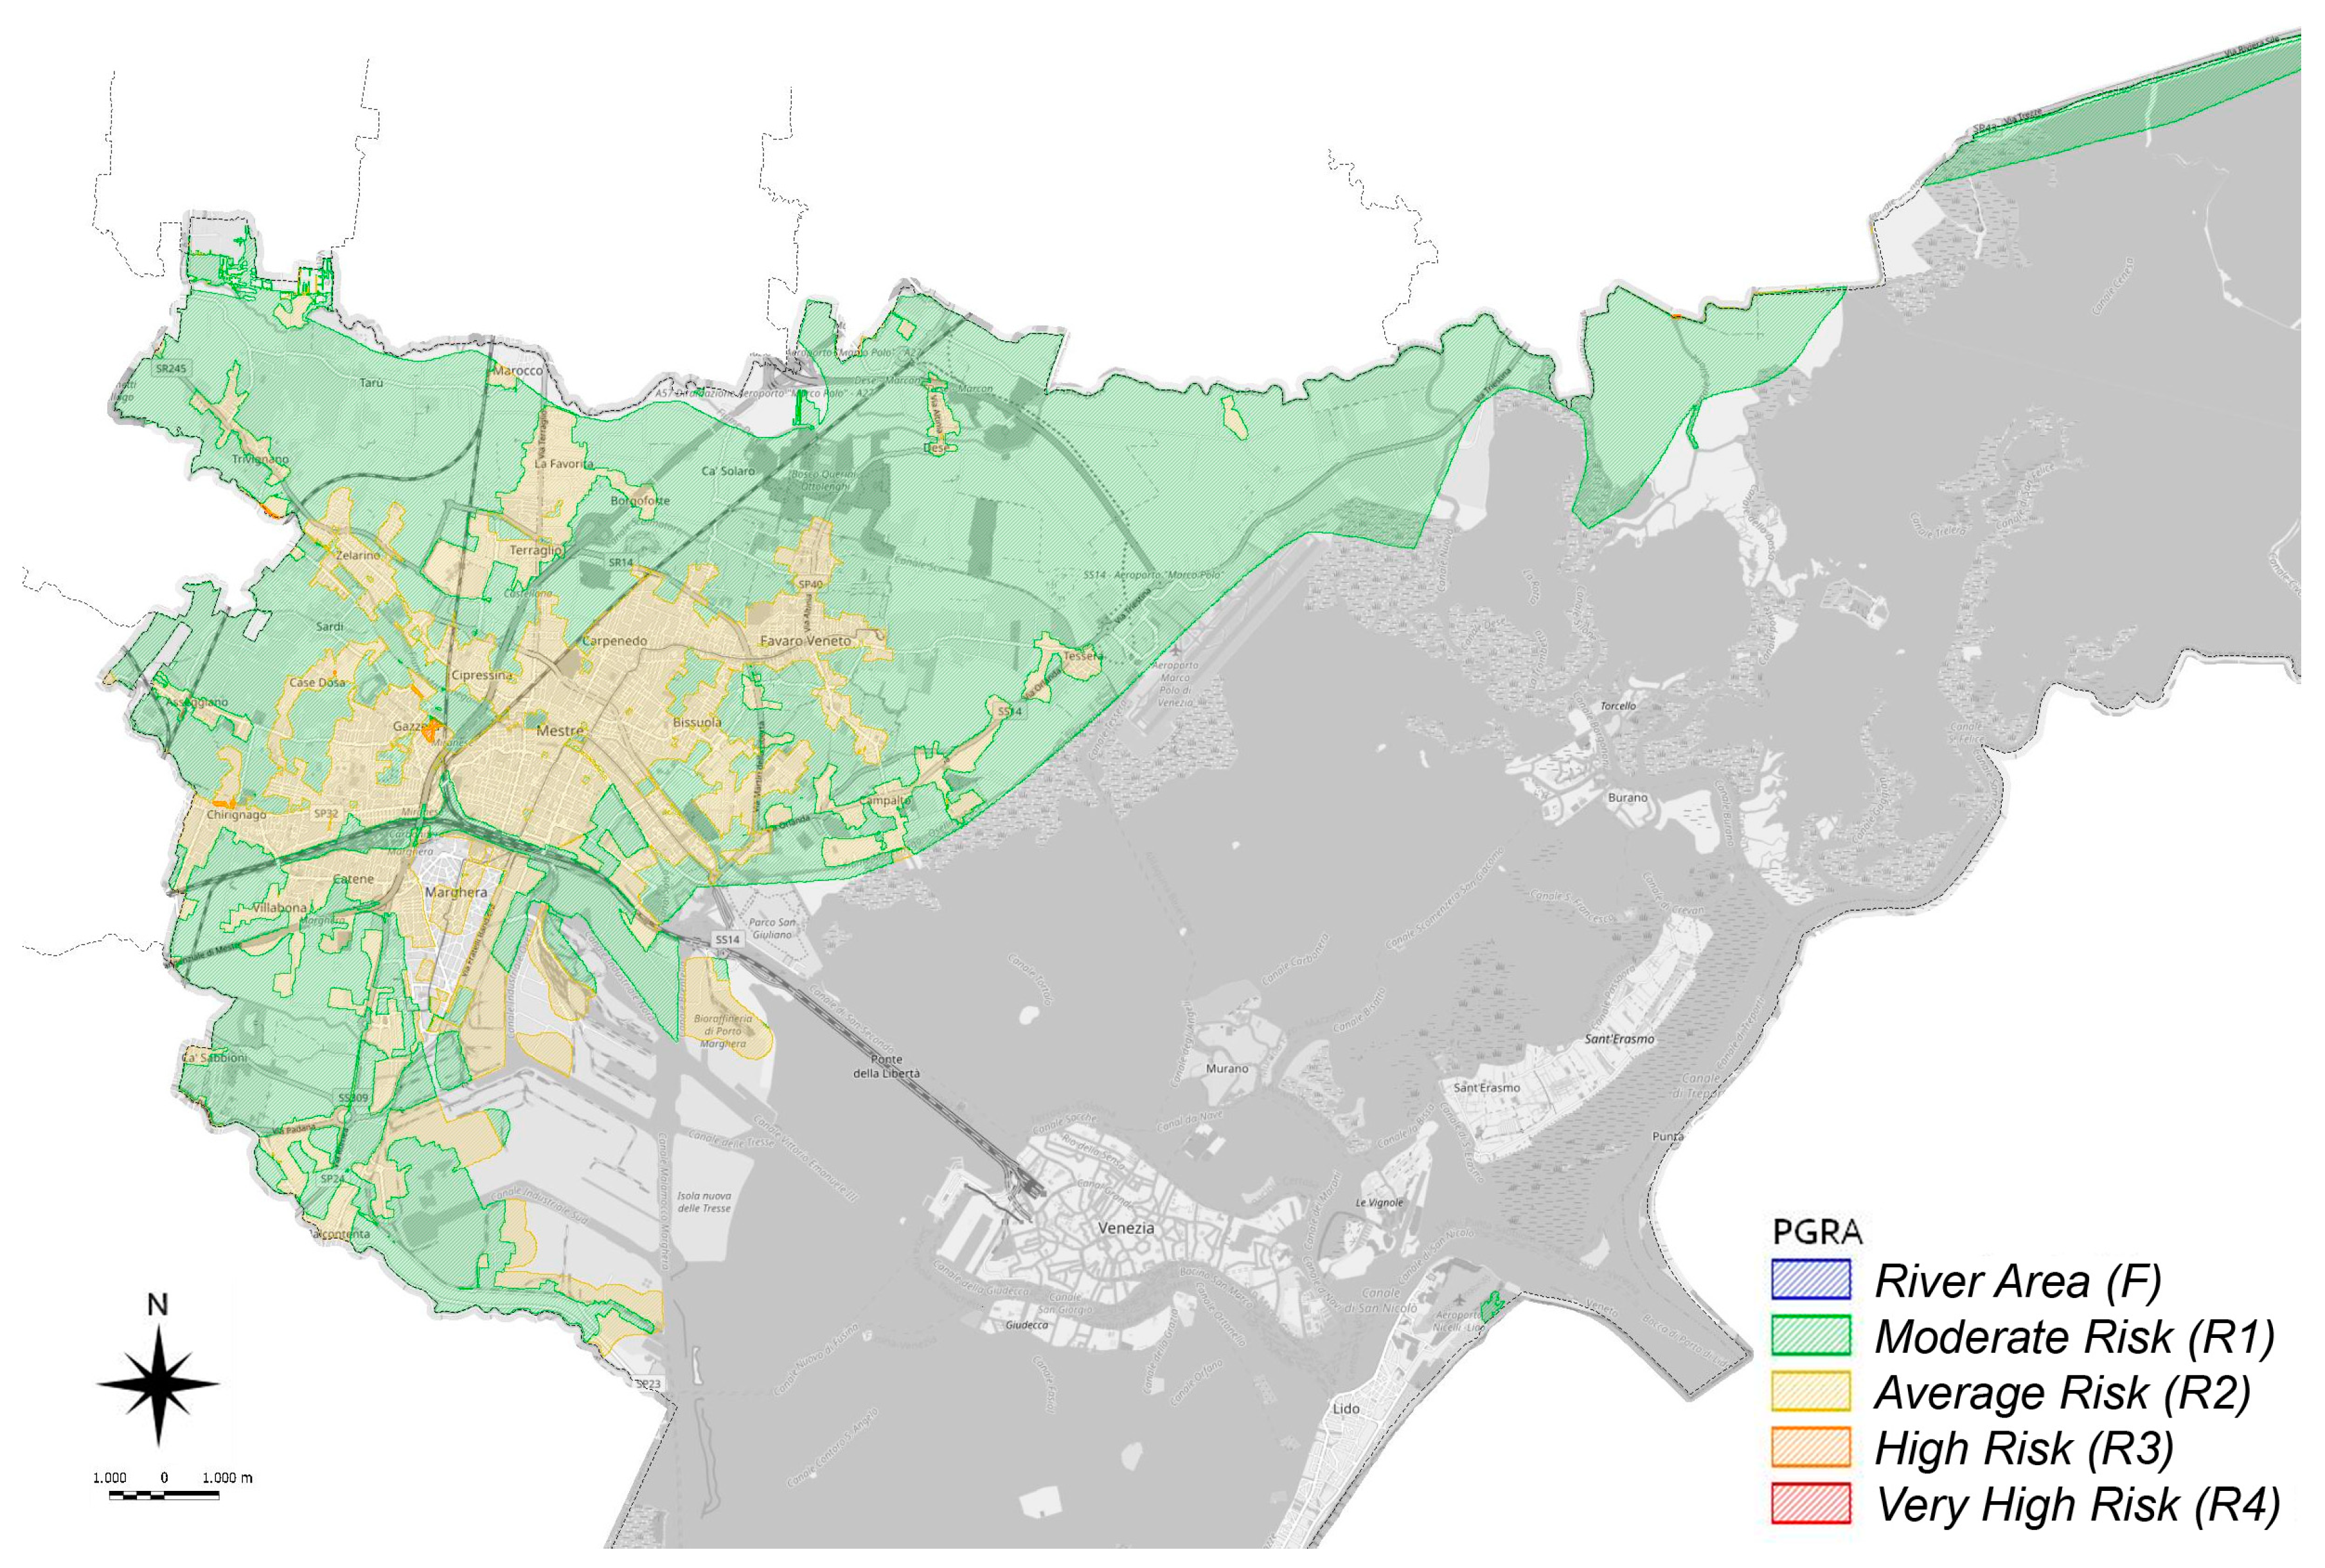
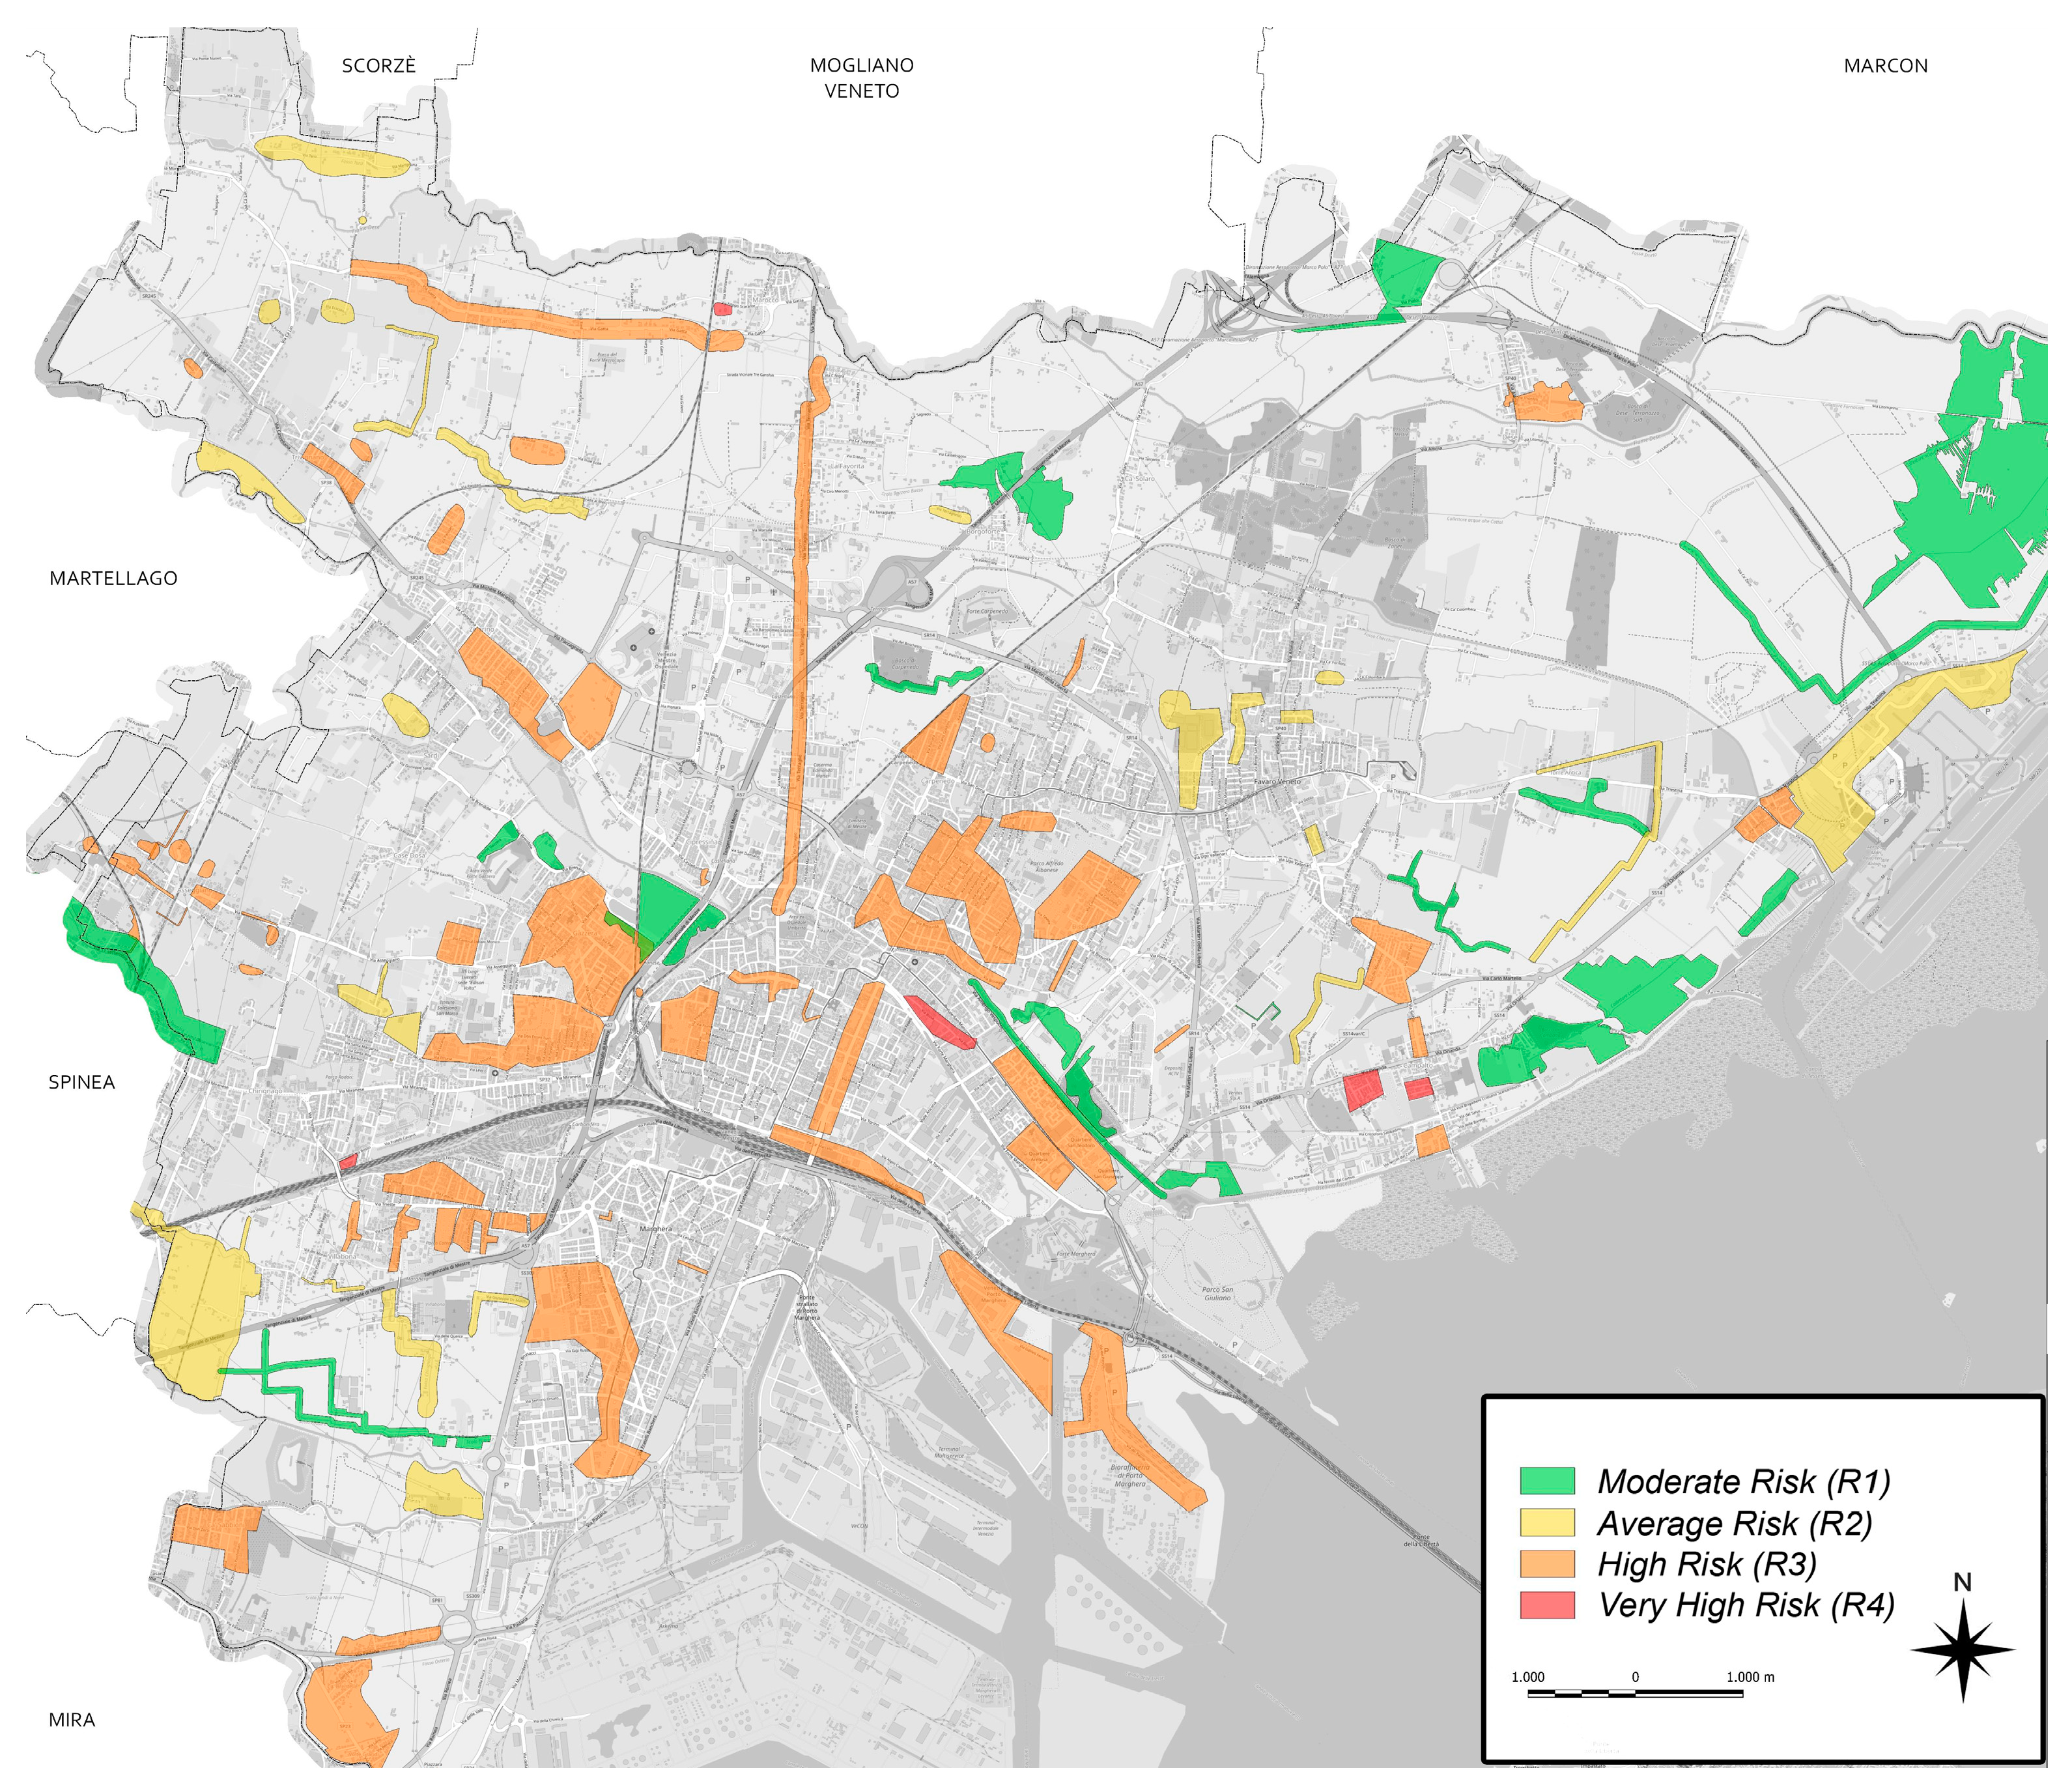
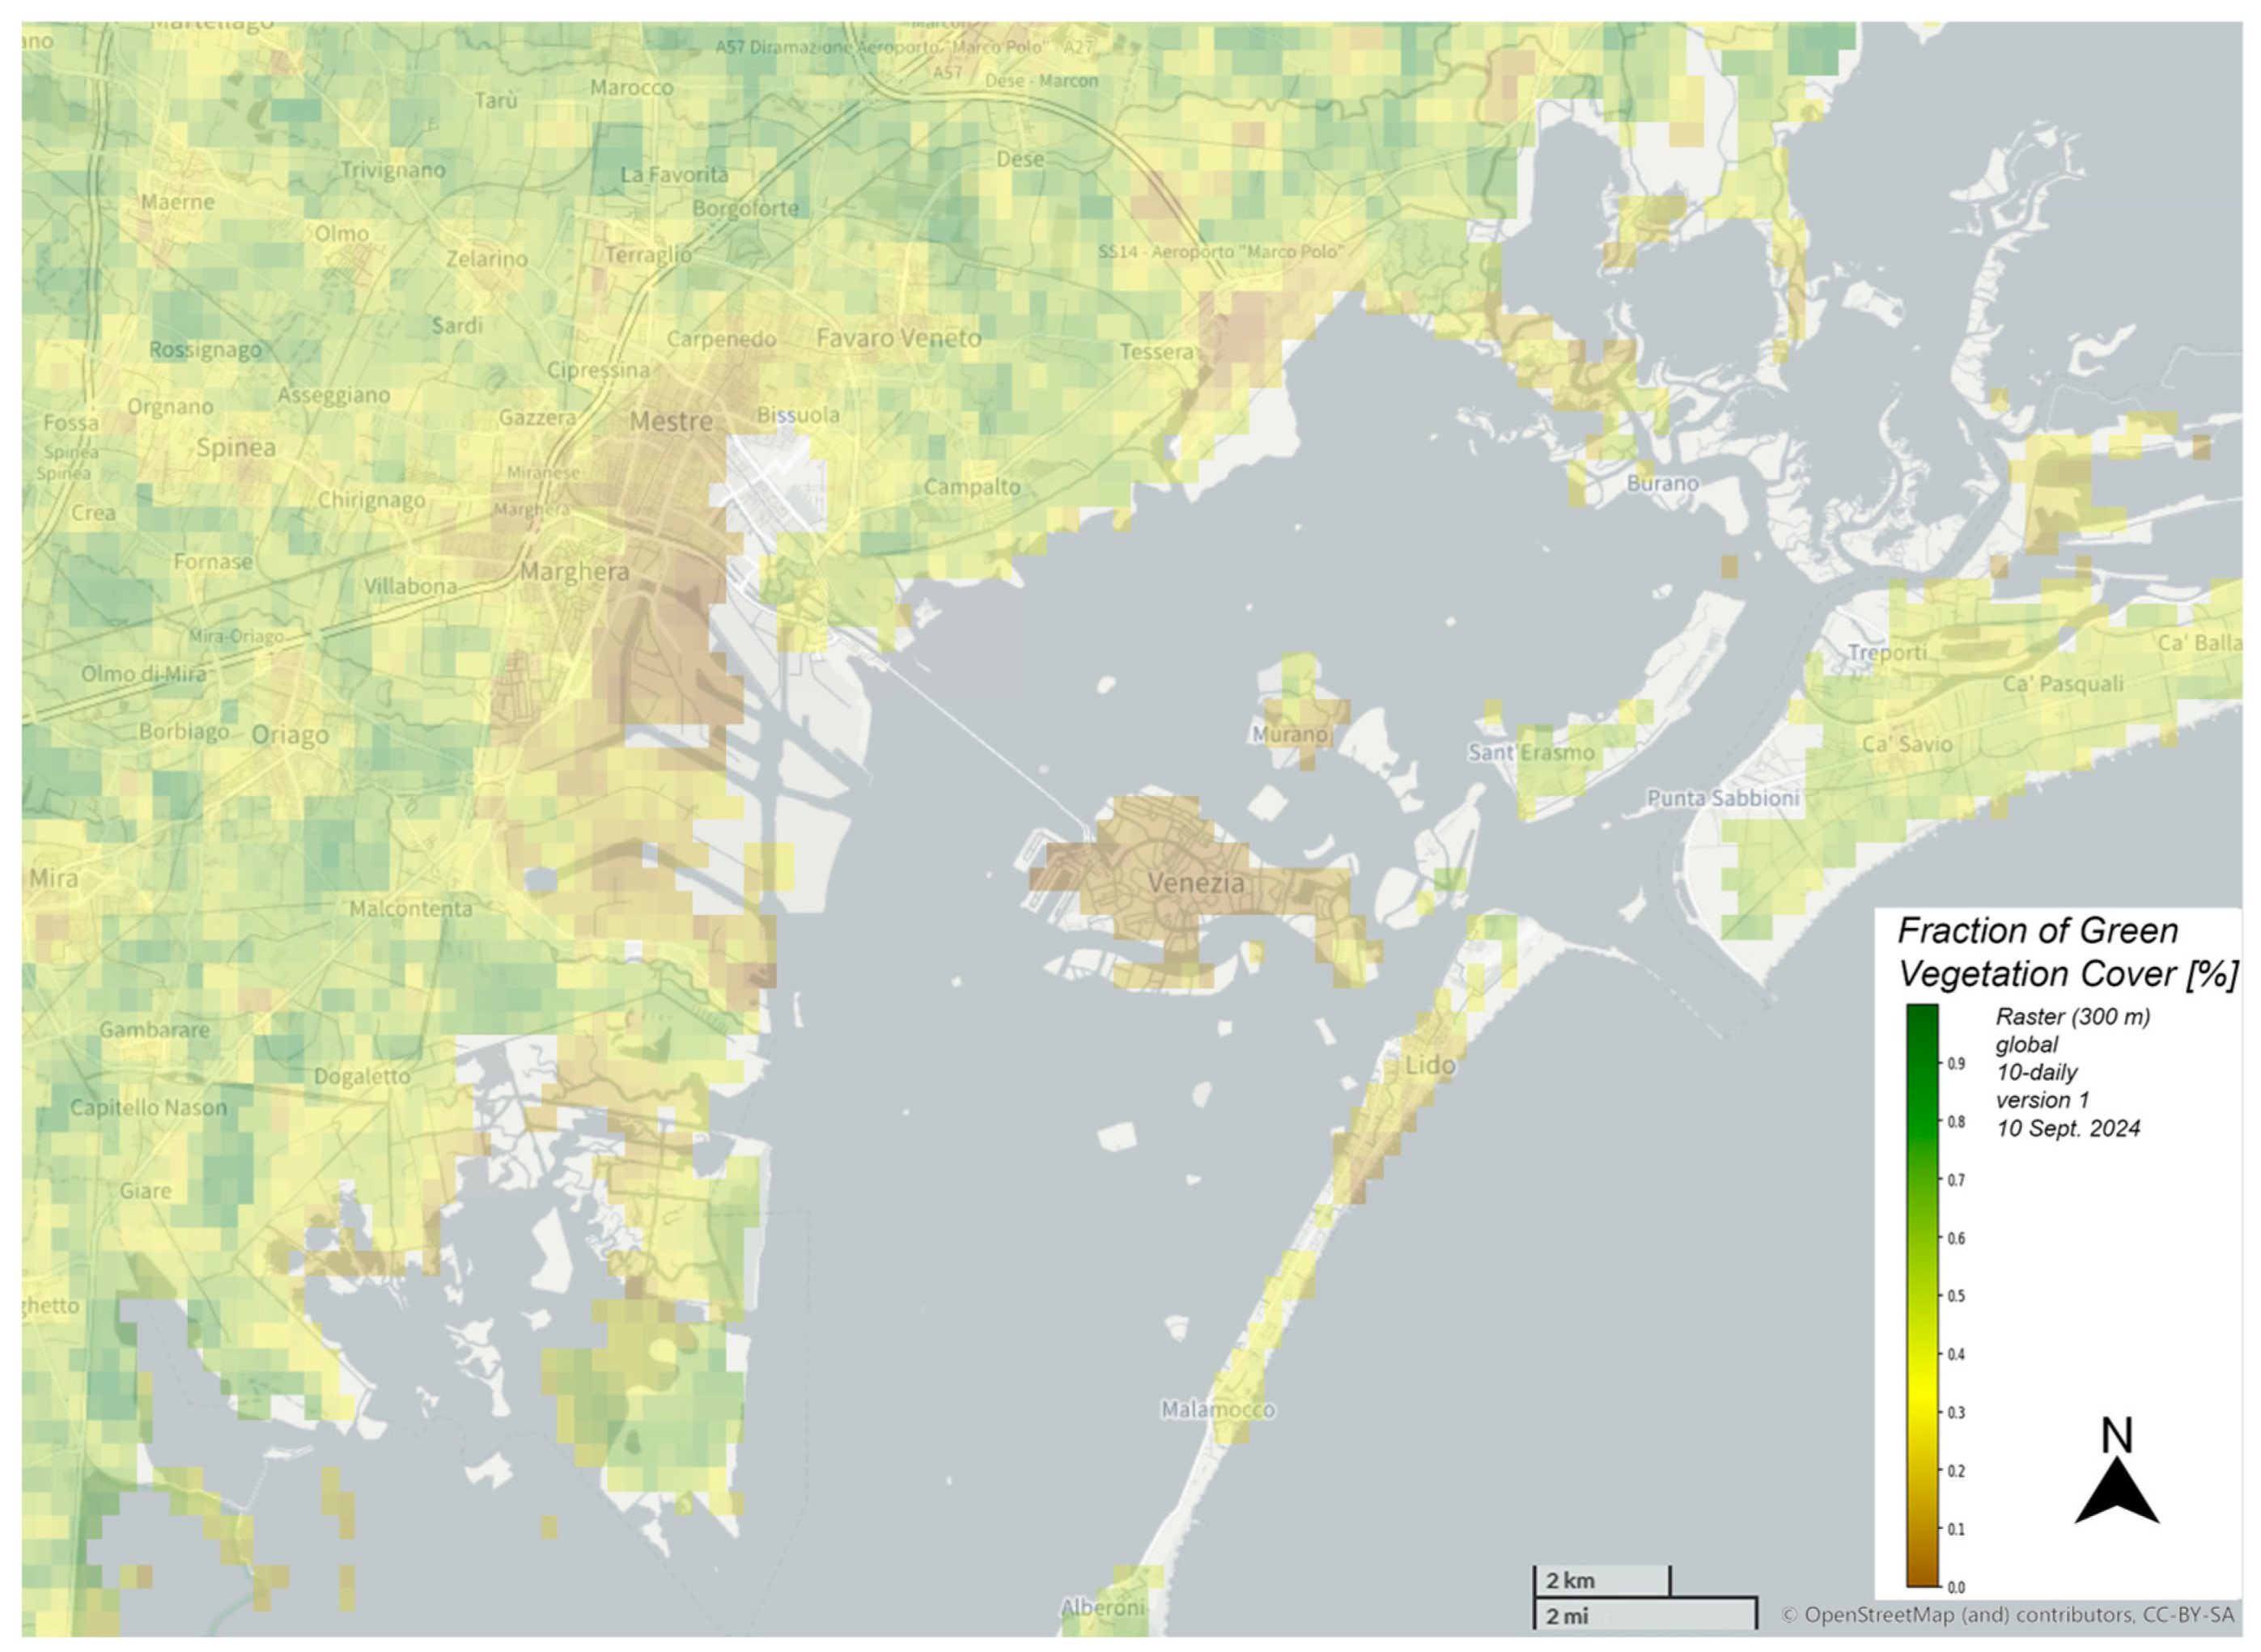
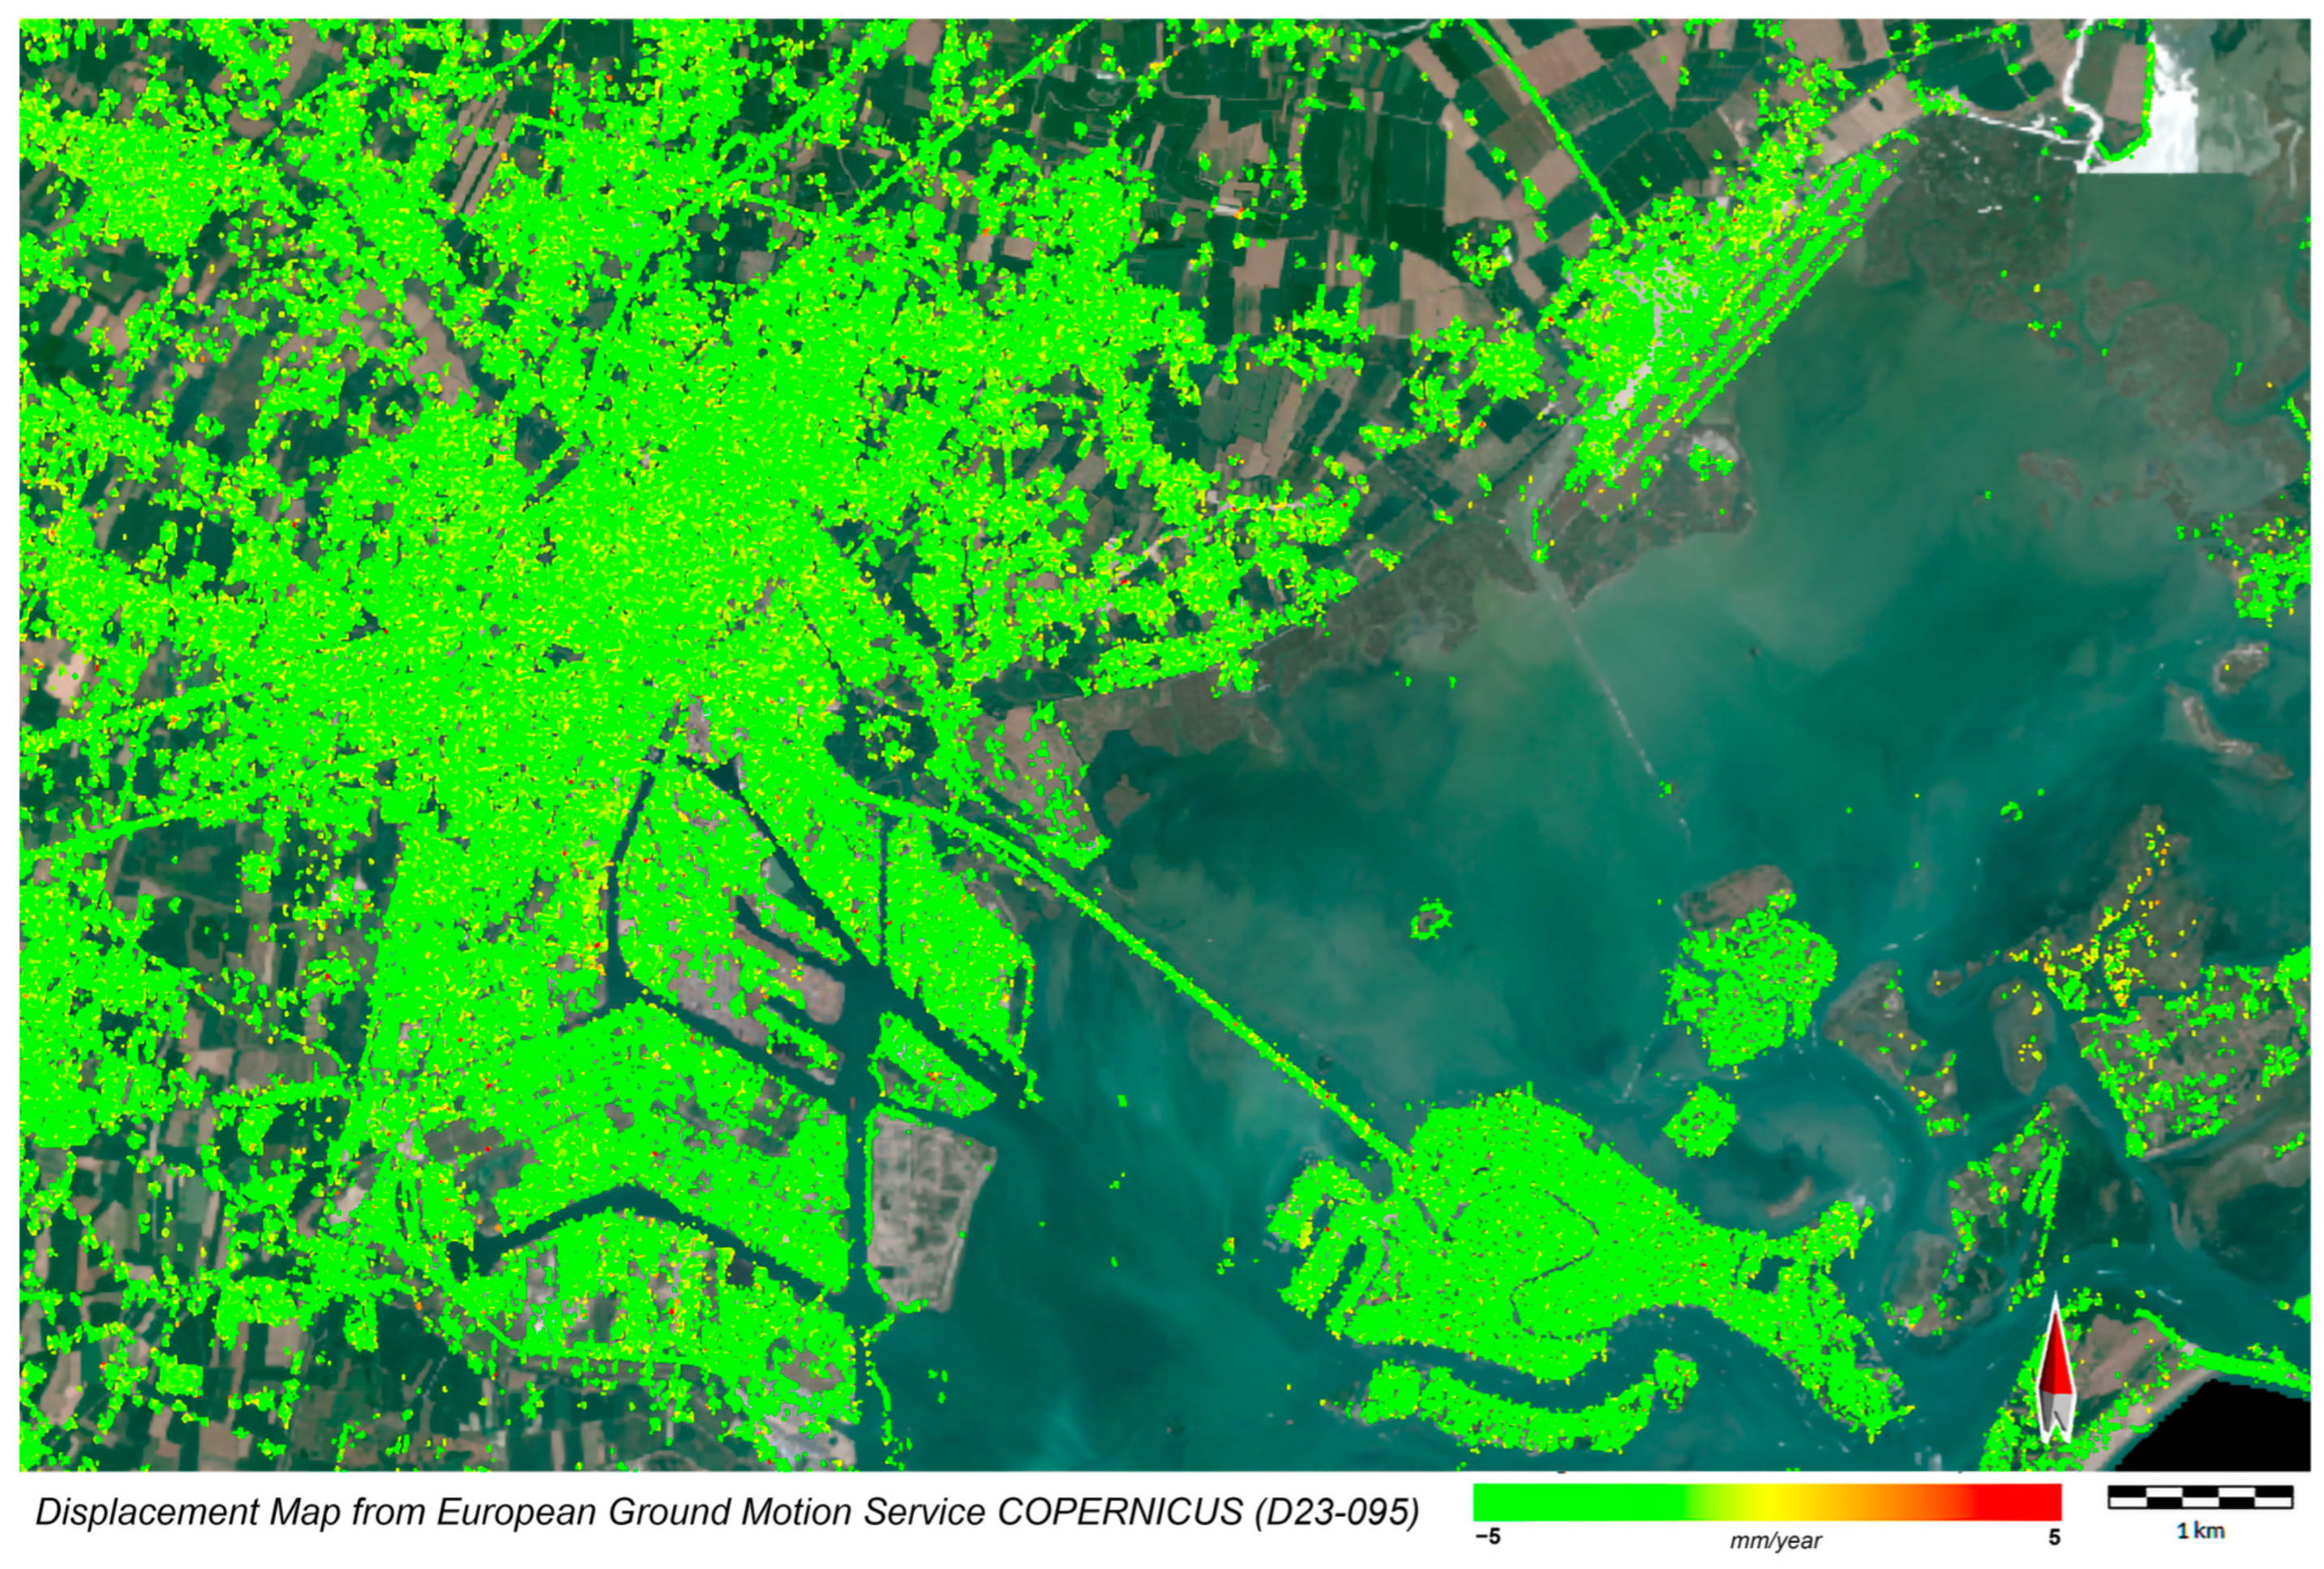
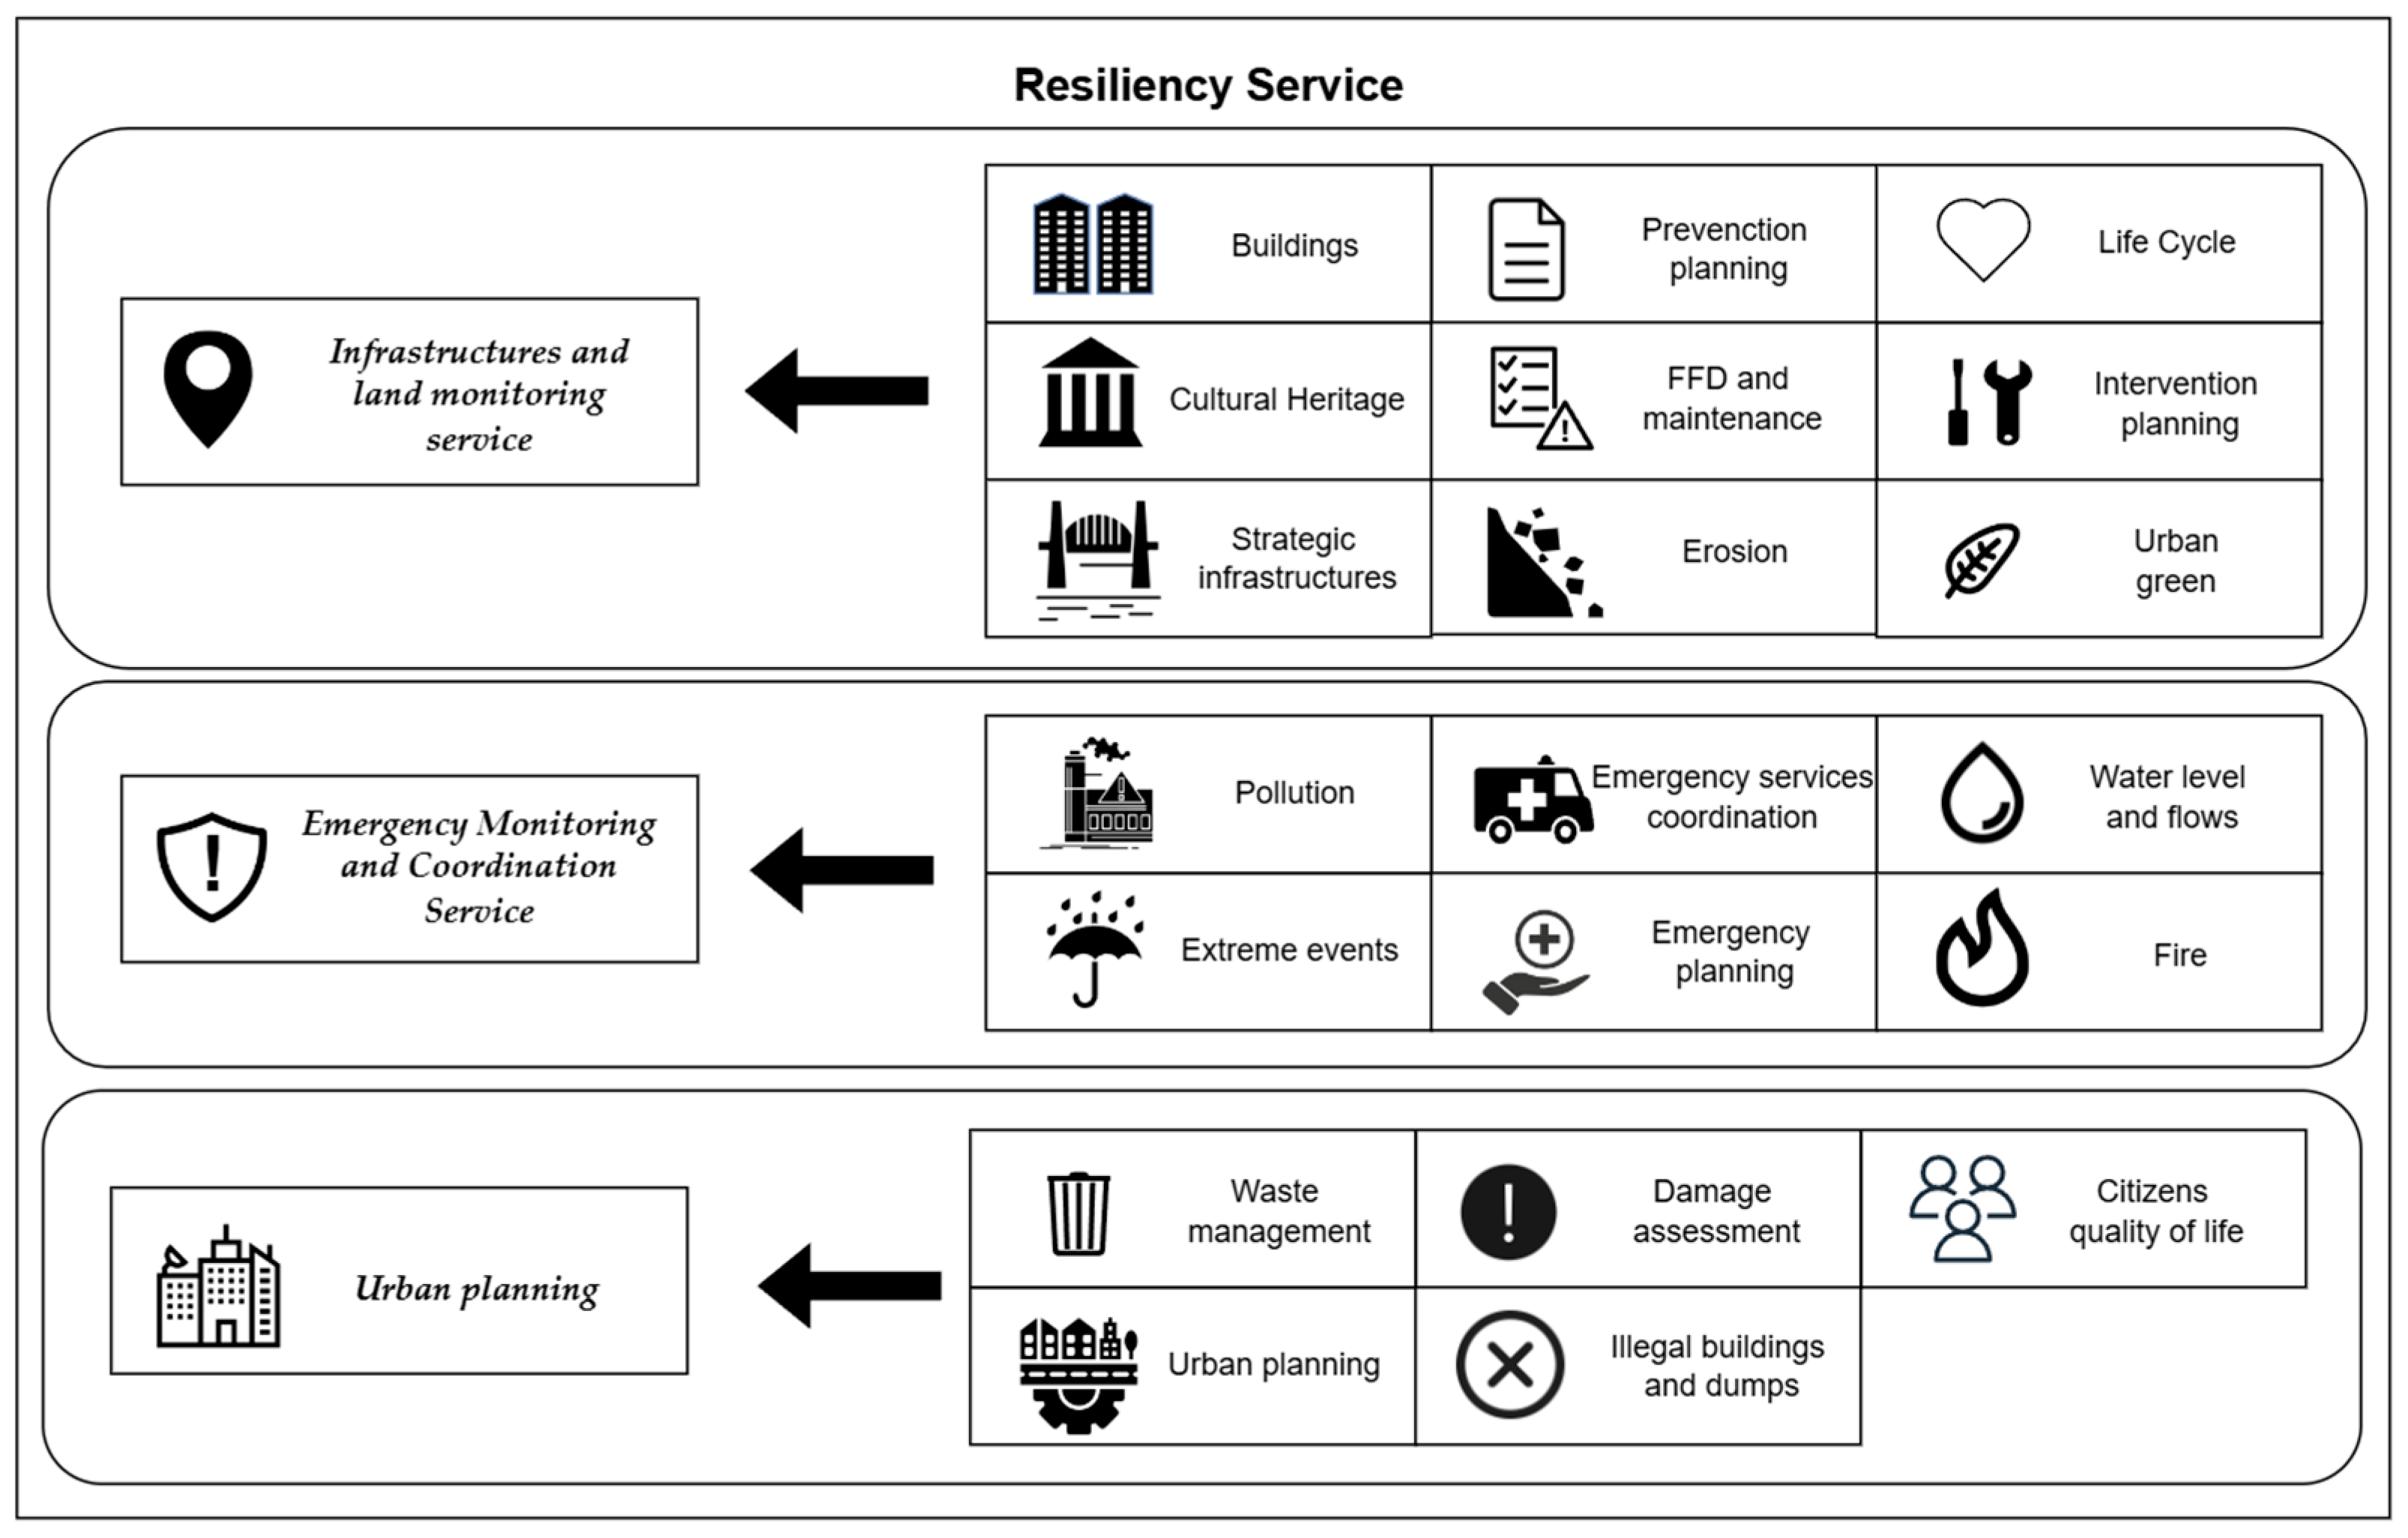
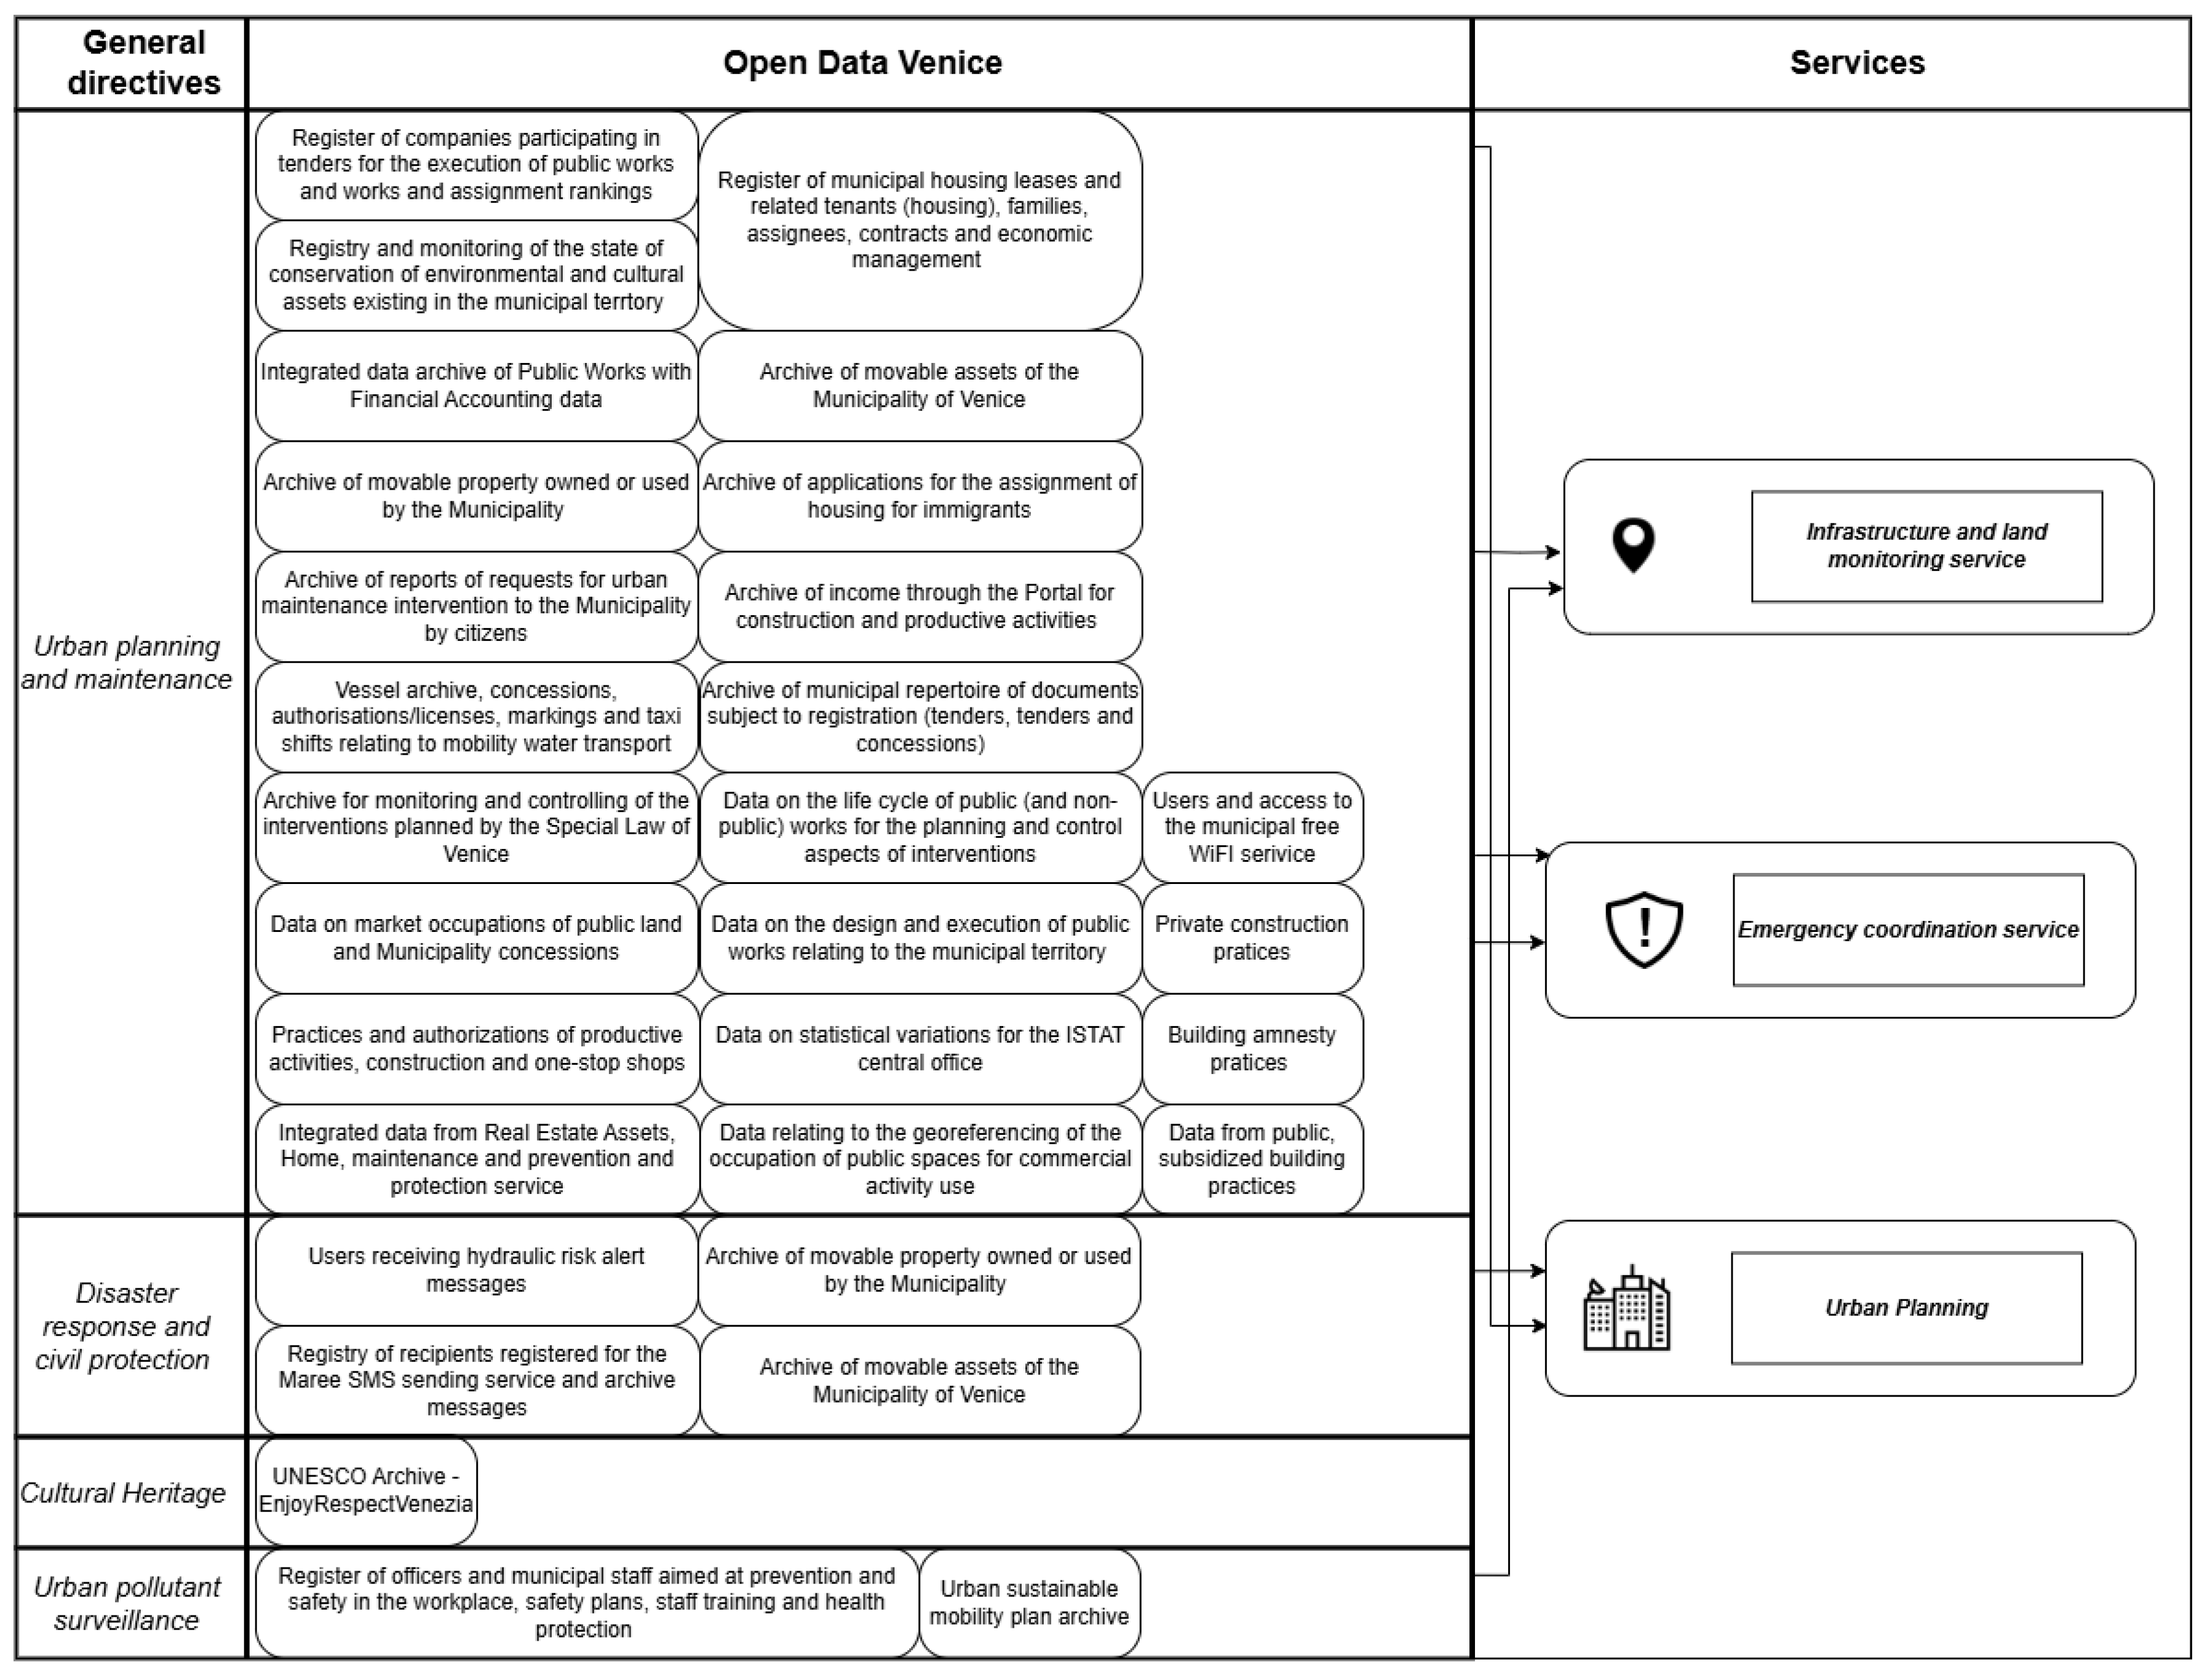

| General Directives | |||||
|---|---|---|---|---|---|
| Reduction in Fossil Fuel Use and Traffic in Public and Private Transport | Energy Optimisation of On-Road Systems | Service Management | Travel | ||
| N. | Fields of Intervention | ||||
| 1 | Evaluation of fossil fuel by traffic monitoring. | X | X | ||
| 2 | Monitoring, management, and forecasting of traffic. | X | X | X | |
| 3 | Monitoring, management, and forecasting of public lighting systems. | X | X | ||
| 4 | Monitoring, management, and forecasting of parking lots. | X | X | X | |
| 5 | Scheduling and management of electric vehicle charging stations. | X | X | ||
| 6 | Centralisation of traffic light control and data integration with the municipal traffic management centre. | X | X | X | |
| 7 | Integrated management of all assets on a single system equipped with dashboards, satellite data and monitoring, management, and simulation capabilities. | X | X | X | X |
| 8 | Installation of new sensors and devices dedicated to the analysis of the status of roads and channels in real time. | X | X | X | |
| 9 | Intelligent and dynamic priority to emergency vehicles. | X | |||
| 10 | Monitoring of air quality levels. | X | X | X | |
| 11 | Monitoring of noise pollution levels. | X | X | X | |
| 12 | Data integration with the other services (energy and resiliency). | X | X | X | |
| 13 | Data availability to citizens and stakeholders. | X | X | ||
| 14 | Maintaining high cybersecurity standards and a full risk regime. | X | X | X | X |
| 15 | Privacy and protection of sensible data. | X | X | ||
| 16 | Creation of a dedicated ticketing and assistance system. | X | X | X | X |
| General Directives | Services |
|---|---|
| Reduction in fossil fuel and traffic in public and private transport | Traffic and parking service Road, streets, and waterways management service |
| Energy optimisation of on-road systems | Road, streets, and waterways management service |
| Service management | Traffic and parking service Road, streets, and waterways management service Environmental impact service |
| Travel | Road, streets, and waterways management service |
| General Directives | |||||||
|---|---|---|---|---|---|---|---|
| Reduction in Fossil Fuels | Reduction in Electricity Consumption | Preventive and Predictive Maintenance | Smart Planning of Intervention | Energy Management System | Hydrogen System Monitoring | ||
| N. | Fields of Intervention | ||||||
| 1 | Assessment of and reduction in the use of fossil fuels. | X | X | ||||
| 2 | Monitoring and forecasting of hydrogen production and storage. | X | X | X | X | ||
| 4 | Monitoring and management of RES with and without storage. | X | X | X | X | X | |
| 5 | Monitoring and management of air conditioning systems. | X | X | X | |||
| 6 | Use of occupancy data for energy optimisation. | X | X | X | |||
| 7 | Development of REC. | X | X | X | X | ||
| 8 | Centralisation and unification of data from BMS and BACS on a city platform. | X | X | X | X | ||
| 9 | Integrated management of all assets on a single system. | X | X | ||||
| 10 | Installation of new sensors and devices dedicated to the analysis of energy consumption systems specific. | X | X | X | X | ||
| 11 | Intelligent and dynamic prioritisation of RES sources. | X | X | X | |||
| 12 | Monitoring and control of the operating status of the devices. | X | X | X | |||
| 13 | Safety analysis. | X | X | ||||
| 14 | Data integration with existing databases and services. | X | X | X | X | ||
| 15 | Accessibility to data to stakeholders. | X | X | X | X | ||
| 16 | Maintaining high cybersecurity standards. | X | X | X | X | X | X |
| 17 | Privacy protection. | X | X | X | X | ||
| 18 | Scalability of systems, from the single asset to the smart city level. | X | X | X | X | ||
| 19 | Creation of a dedicated ticketing and assistance system. | X | X | ||||
| 20 | Multizone climate management | X | X | ||||
| 21 | Automatic identification analysis of efficiency interventions. | X | X | X | X | ||
| 22 | Replacement of gas heating systems with more efficient systems. | X | X | X | X | ||
| 23 | Installation of new RES plants. | X | X | X | X | ||
| 24 | Maintenance of indoor environmental comfort standards. | X | X | ||||
| 25 | Combined interventions for NZEBs. | X | X | ||||
| General Directives | Services |
|---|---|
| Reduction in fossil fuels | Energy service |
| Reduction in electricity consumption | Energy service |
| Preventive and predictive maintenance | BACS service |
| Smart planning of intervention | Energy service BACS service |
| Energy management system | Energy service BACS service |
| Hydrogen system monitoring | Energy service |
| General Directives | |||||
|---|---|---|---|---|---|
| Protection from Natural Disasters and Extreme Events | Monitoring of Built Environment Resilience | Preservation of Cultural Heritage and Strategic Infrastructure: | Anthropic Impact and Urbanisation | ||
| N. | Fields of Intervention | ||||
| 1 | Monitoring of flooding and rainwater | X | X | X | |
| 2 | Fire risk analysis | X | X | X | |
| 4 | Heatwaves and heat island | X | |||
| 5 | Urbanisation analysis | X | X | X | X |
| 6 | Waste and pest control | X | |||
| 7 | Urban green and agriculture | X | X | ||
| General Directives | Services |
|---|---|
| Protection from natural disasters and extreme events | Emergency monitoring and coordination service Infrastructures and land monitoring service |
| Monitoring of built environment resilience | Infrastructures and land monitoring service |
| Preservation of cultural heritage and strategic infrastructure: | Infrastructures and land monitoring service Urban planning |
| Anthropic impact and urbanisation | Infrastructures and land monitoring service Urban planning |
Disclaimer/Publisher’s Note: The statements, opinions and data contained in all publications are solely those of the individual author(s) and contributor(s) and not of MDPI and/or the editor(s). MDPI and/or the editor(s) disclaim responsibility for any injury to people or property resulting from any ideas, methods, instructions or products referred to in the content. |
© 2025 by the authors. Licensee MDPI, Basel, Switzerland. This article is an open access article distributed under the terms and conditions of the Creative Commons Attribution (CC BY) license (https://creativecommons.org/licenses/by/4.0/).
Share and Cite
Villani, L.; Gugliermetti, L.; Barucco, M.A.; Cinquepalmi, F. A Digital Twin Framework to Improve Urban Sustainability and Resiliency: The Case Study of Venice. Land 2025, 14, 83. https://doi.org/10.3390/land14010083
Villani L, Gugliermetti L, Barucco MA, Cinquepalmi F. A Digital Twin Framework to Improve Urban Sustainability and Resiliency: The Case Study of Venice. Land. 2025; 14(1):83. https://doi.org/10.3390/land14010083
Chicago/Turabian StyleVillani, Lorenzo, Luca Gugliermetti, Maria Antonia Barucco, and Federico Cinquepalmi. 2025. "A Digital Twin Framework to Improve Urban Sustainability and Resiliency: The Case Study of Venice" Land 14, no. 1: 83. https://doi.org/10.3390/land14010083
APA StyleVillani, L., Gugliermetti, L., Barucco, M. A., & Cinquepalmi, F. (2025). A Digital Twin Framework to Improve Urban Sustainability and Resiliency: The Case Study of Venice. Land, 14(1), 83. https://doi.org/10.3390/land14010083