Abstract
This study investigates the spatiotemporal variation characteristics and influencing factors of an ecosystem’s carbon sequestration rate (CSR) in the Ningxia region from 2001 to 2023, providing scientific evidence for assessing the regional carbon sequestration capacity and formulating carbon neutrality policies. Based on ground observation data and multimodal datasets, the optimal machine learning model (EXT) was used to invert a 30 m high-resolution vegetation and soil carbon density dataset for Ningxia from 2000 to 2023. Annual variation analysis and geographical detector methods were employed to assess the spatiotemporal distribution characteristics of the CSR from 2001 to 2023 and identify the primary influencing factors. The results show that from 2001 to 2023, the CSR of the Ningxia ecosystem exhibits a spatial distribution pattern characterized by higher values in the south and lower values in the north, with a mean value of 21.95 gC·m−2, and an overall fluctuating increasing trend, with an annual growth rate of 0.53 gC·m−2 a−1. Significant differences in the CSR exist across different ecological regions. In terms of land use types, the ranking of carbon sequestration capacity is forest > farmland > grassland > barren, while the ranking of the carbon sequestration enhancement capacity is farmland > forest > grassland > barren. Among land use change types, the carbon sequestration enhancement capacity significantly increased when grassland was converted to forest or shrubland, farmland to forest–grassland, and bare land to forest–grassland, with increases of 42.9%, 9.2%, and 34.6%, respectively. The NDVI is the primary driver of CSR spatiotemporal variation, while the interaction between the Enhanced Vegetation Index (EVI) and soil bulk density has a more significant explanatory power for CSR spatial differentiation. This study shows that ecological restoration projects, such as the conversion of cropland to forest (or grassland) and protective farmland measures, play a significant role in enhancing the carbon sequestration capacity in Ningxia.
1. Introduction
The carbon sequestration rate (CSR) is an important indicator for measuring the ecosystem carbon sink function [1], which has attracted increasing attention, particularly in the context of intensifying global climate change. It is estimated that global terrestrial ecosystems sequester approximately 2.4 billion tons of carbon per year, absorbing around 30% of the CO₂ emissions caused by human activities [2], thus playing a crucial role in combating climate change and maintaining ecosystem health. However, the differences in natural geographic conditions and human activities lead to significant spatial heterogeneity in the regional CSR, particularly in Ningxia, a semi-arid region with a fragile ecological environment, low vegetation cover, and a high susceptibility to climate conditions and human activities [3]. Therefore, CSR estimates based on fixed values are unable to accurately reflect the carbon sequestration status in different regions, thereby increasing the uncertainty of the results.
In recent years, with the implementation of a series of ecological restoration projects, vegetation conditions in Ningxia have improved; however, systematic research on the spatiotemporal variation characteristics of its CSR is still lacking [4]. Therefore, an in-depth study of the CSR in the Ningxia region will provide scientific support for more accurate carbon sequestration accounting and the implementation of ecological protection and restoration projects. Currently, methods for estimating CSR mainly include traditional approaches based on ground-based measurements and process models or atmospheric inversion methods based on remote sensing data [5]. Traditional methods primarily rely on long-term observational data from ground-based sampling points. While they can provide relatively accurate CSR information, their application on large scales is limited by the number and spatial distribution of the sampling points [6]. With technological advancements, methods such as the eddy covariance technique [7] and ecosystem process models (e.g., CENTURY and Biome-BGC models) [8] have gradually become important tools for assessing the CSR. In recent years, the application of remote sensing technology has provided new perspectives for the large-scale monitoring and assessment of ecosystem carbon stocks [9,10]. For example, Feng et al. (2013) used remote sensing technology to quantitatively assess carbon sink changes from 2000 to 2008 in the Grain for Green project on the Loess Plateau, finding that the total carbon sink in the region was approximately 96.1 Tg [11].
Significant progress has been made in CSR research both domestically and internationally. For example, Lin demonstrated that forests have a higher CSR potential due to their rich biomass [12]. Mitsch, by comparing the CSR of different types of wetlands (e.g., marshes, peatlands, and mangroves), concluded that wetlands, particularly peatlands, have a high carbon sequestration capacity [13]. Lal and Aubrey, among others, have demonstrated the importance of soil carbon sequestration in agricultural lands for global climate change and food security [14,15]. Building on this, CSR research has gradually focused on the synergistic effects of various influencing factors. For instance, Mekonnen et al. demonstrated that climate change is a key factor affecting the CSR [16]. Moisa et al. indicated that human activities, such as land use changes and urbanization, significantly impact the CSR, with large-scale land reclamation and vegetation destruction reducing the carbon storage capacity of ecosystems [17]. Topographic factors (elevation, slope, and aspect), soil factors (the soil organic matter content, fertility, and pH), and vegetation types have all been shown to significantly affect the CSR [18,19,20]. Bu et al.’s study indicated that from 2000 to 2015, Ningxia’s wetland restoration project led to an increase of 204,900 tons of carbon storage [2]. Although previous studies have provided some theoretical support for Ningxia’s carbon sequestration capacity, most existing research focuses on the effects of single ecosystem types or specific factors, lacking a spatiotemporal dynamic analysis of the CSR across the entire terrestrial ecosystem at the regional scale under the influence of multiple factors. Research has mainly focused on regional-scale studies, with less attention given to the spatial heterogeneity of the CSR within the region, and limited studies on the current CSR status in Ningxia.
Therefore, this study proposes to utilize extensive ground-based data, combined with long-term remote sensing data, topographic and soil data, and machine learning techniques to generate vegetation and soil carbon density datasets for the period 2000–2023. The dataset will be further used to derive a 30 m high-resolution CSR dataset for 2001–2023, which will be analyzed for spatial heterogeneity and dynamic characteristics across different ecological regions of Ningxia. This will reveal the evolution of the CSR in Ningxia and provide scientific support for achieving the region’s dual carbon goals. At the same time, this study will assess the impact of different land use types on the regional CSR, providing decision-making references for optimizing the land use structure and the rational layout of vegetation restoration projects. This will contribute to the promotion of ecological environment construction in Ningxia and support the achievement of carbon neutrality goals, offering practical value and scientific support for regional sustainable development.
2. Materials and Methods
2.1. Study Area
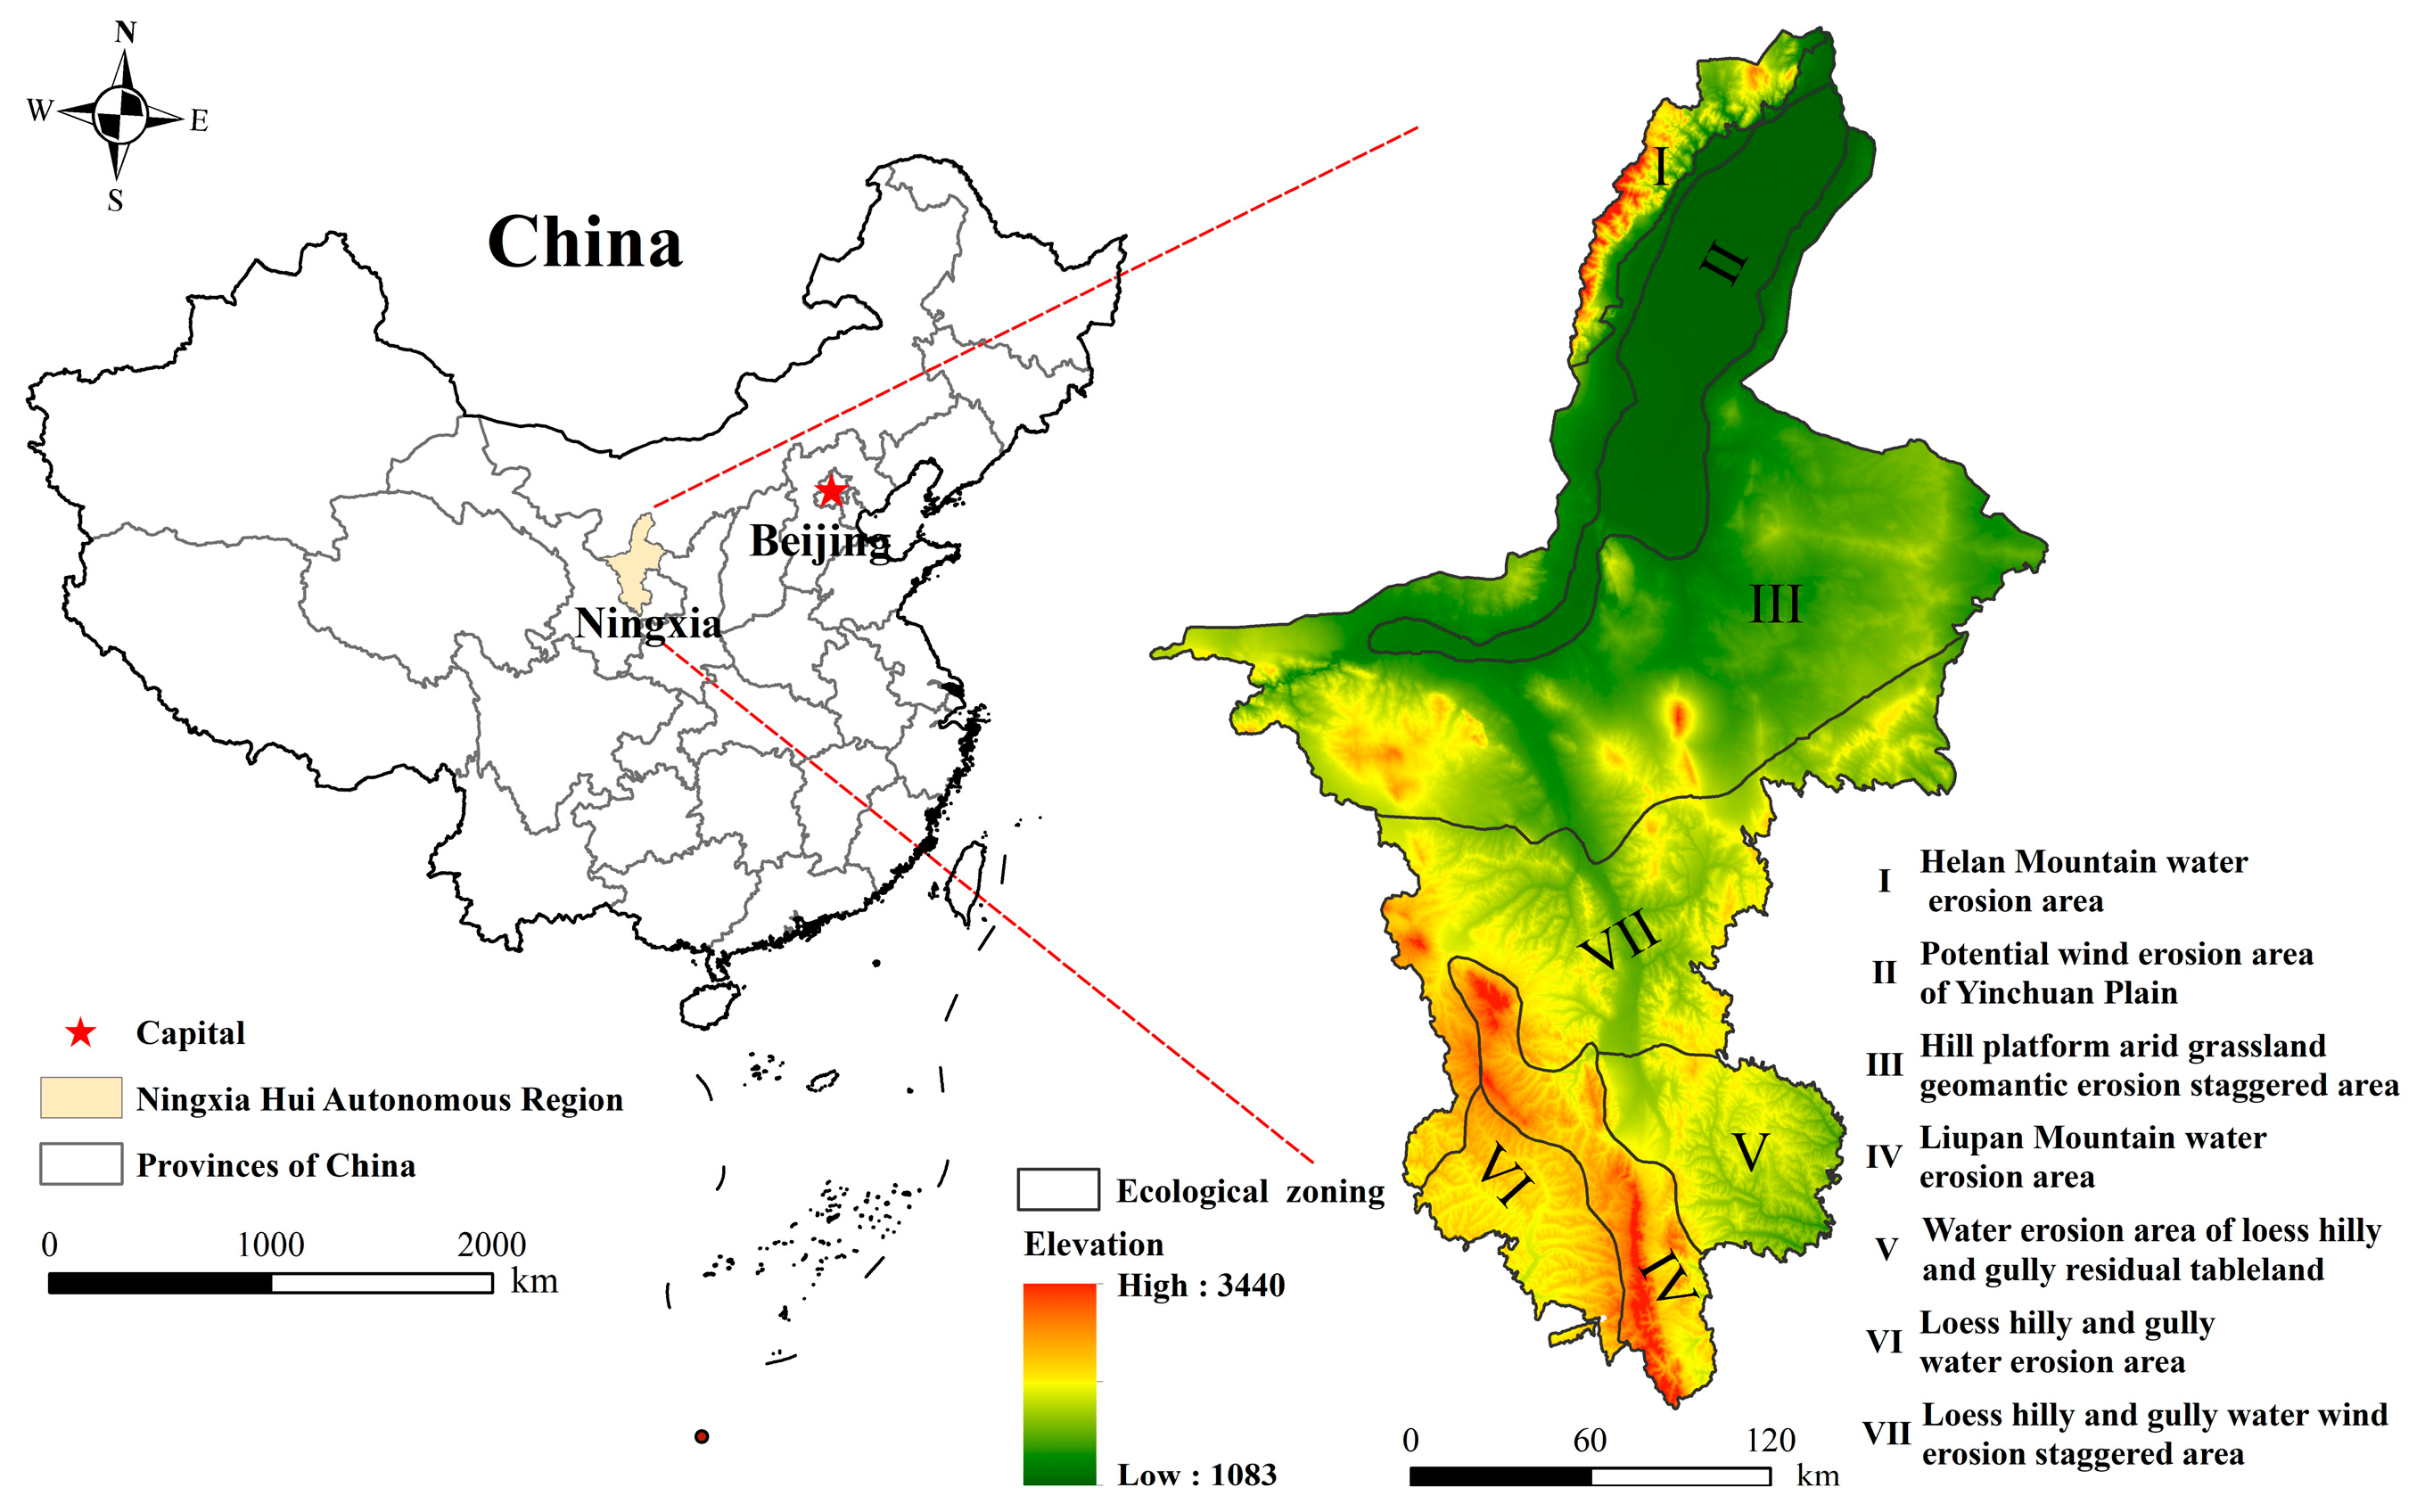
The Ningxia Hui Autonomous Region (104°17′–107°39′ E, 35°14′–39°23′ N) is located in the upper reaches of the Yellow River in northwestern China, covering an area of approximately 66,400 square km(Figure 1). The region has a continental semi-humid, semi-arid climate, characterized by dryness and low precipitation. The annual average temperature ranges from 6.9 °C to 11.5 °C, increasing from south to north. Precipitation is mainly concentrated in the summer, with annual rainfall decreasing from south to north. The southern part receives 350–600 mm of rainfall, while the northern part receives only about 200 mm. The terrain is complex and diverse, with elevations ranging from 1000 to 3500 m. Based on topography, landforms, and soil erosion characteristics, the region can be divided into seven typical ecological zones: Helan Mountain water erosion zone, Potential wind erosion area of Yinchuan Plain zone, Hill platform arid grassland geomantic erosion staggered zone, Liupan Mountain water erosion zone, Water erosion area of Loess hilly and gully residual tableland zone, Loess hilly and gully water erosion zone, and Loess hilly and gully water wind erosion staggered zone. Due to severe climate aridity, soil erosion, and desertification, which have led to significant vegetation degradation, vegetation restoration and the enhancement of the region’s carbon sink function are of great significance for achieving ecological restoration and carbon neutrality goals in Ningxia.
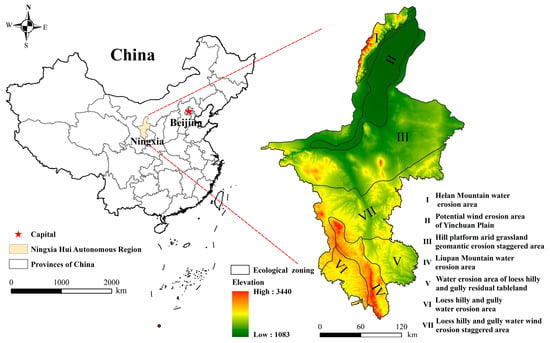
Figure 1.
Geographical location of the study area.
2.2. Data Sources and Preprocessing
2.2.1. Field Survey Data
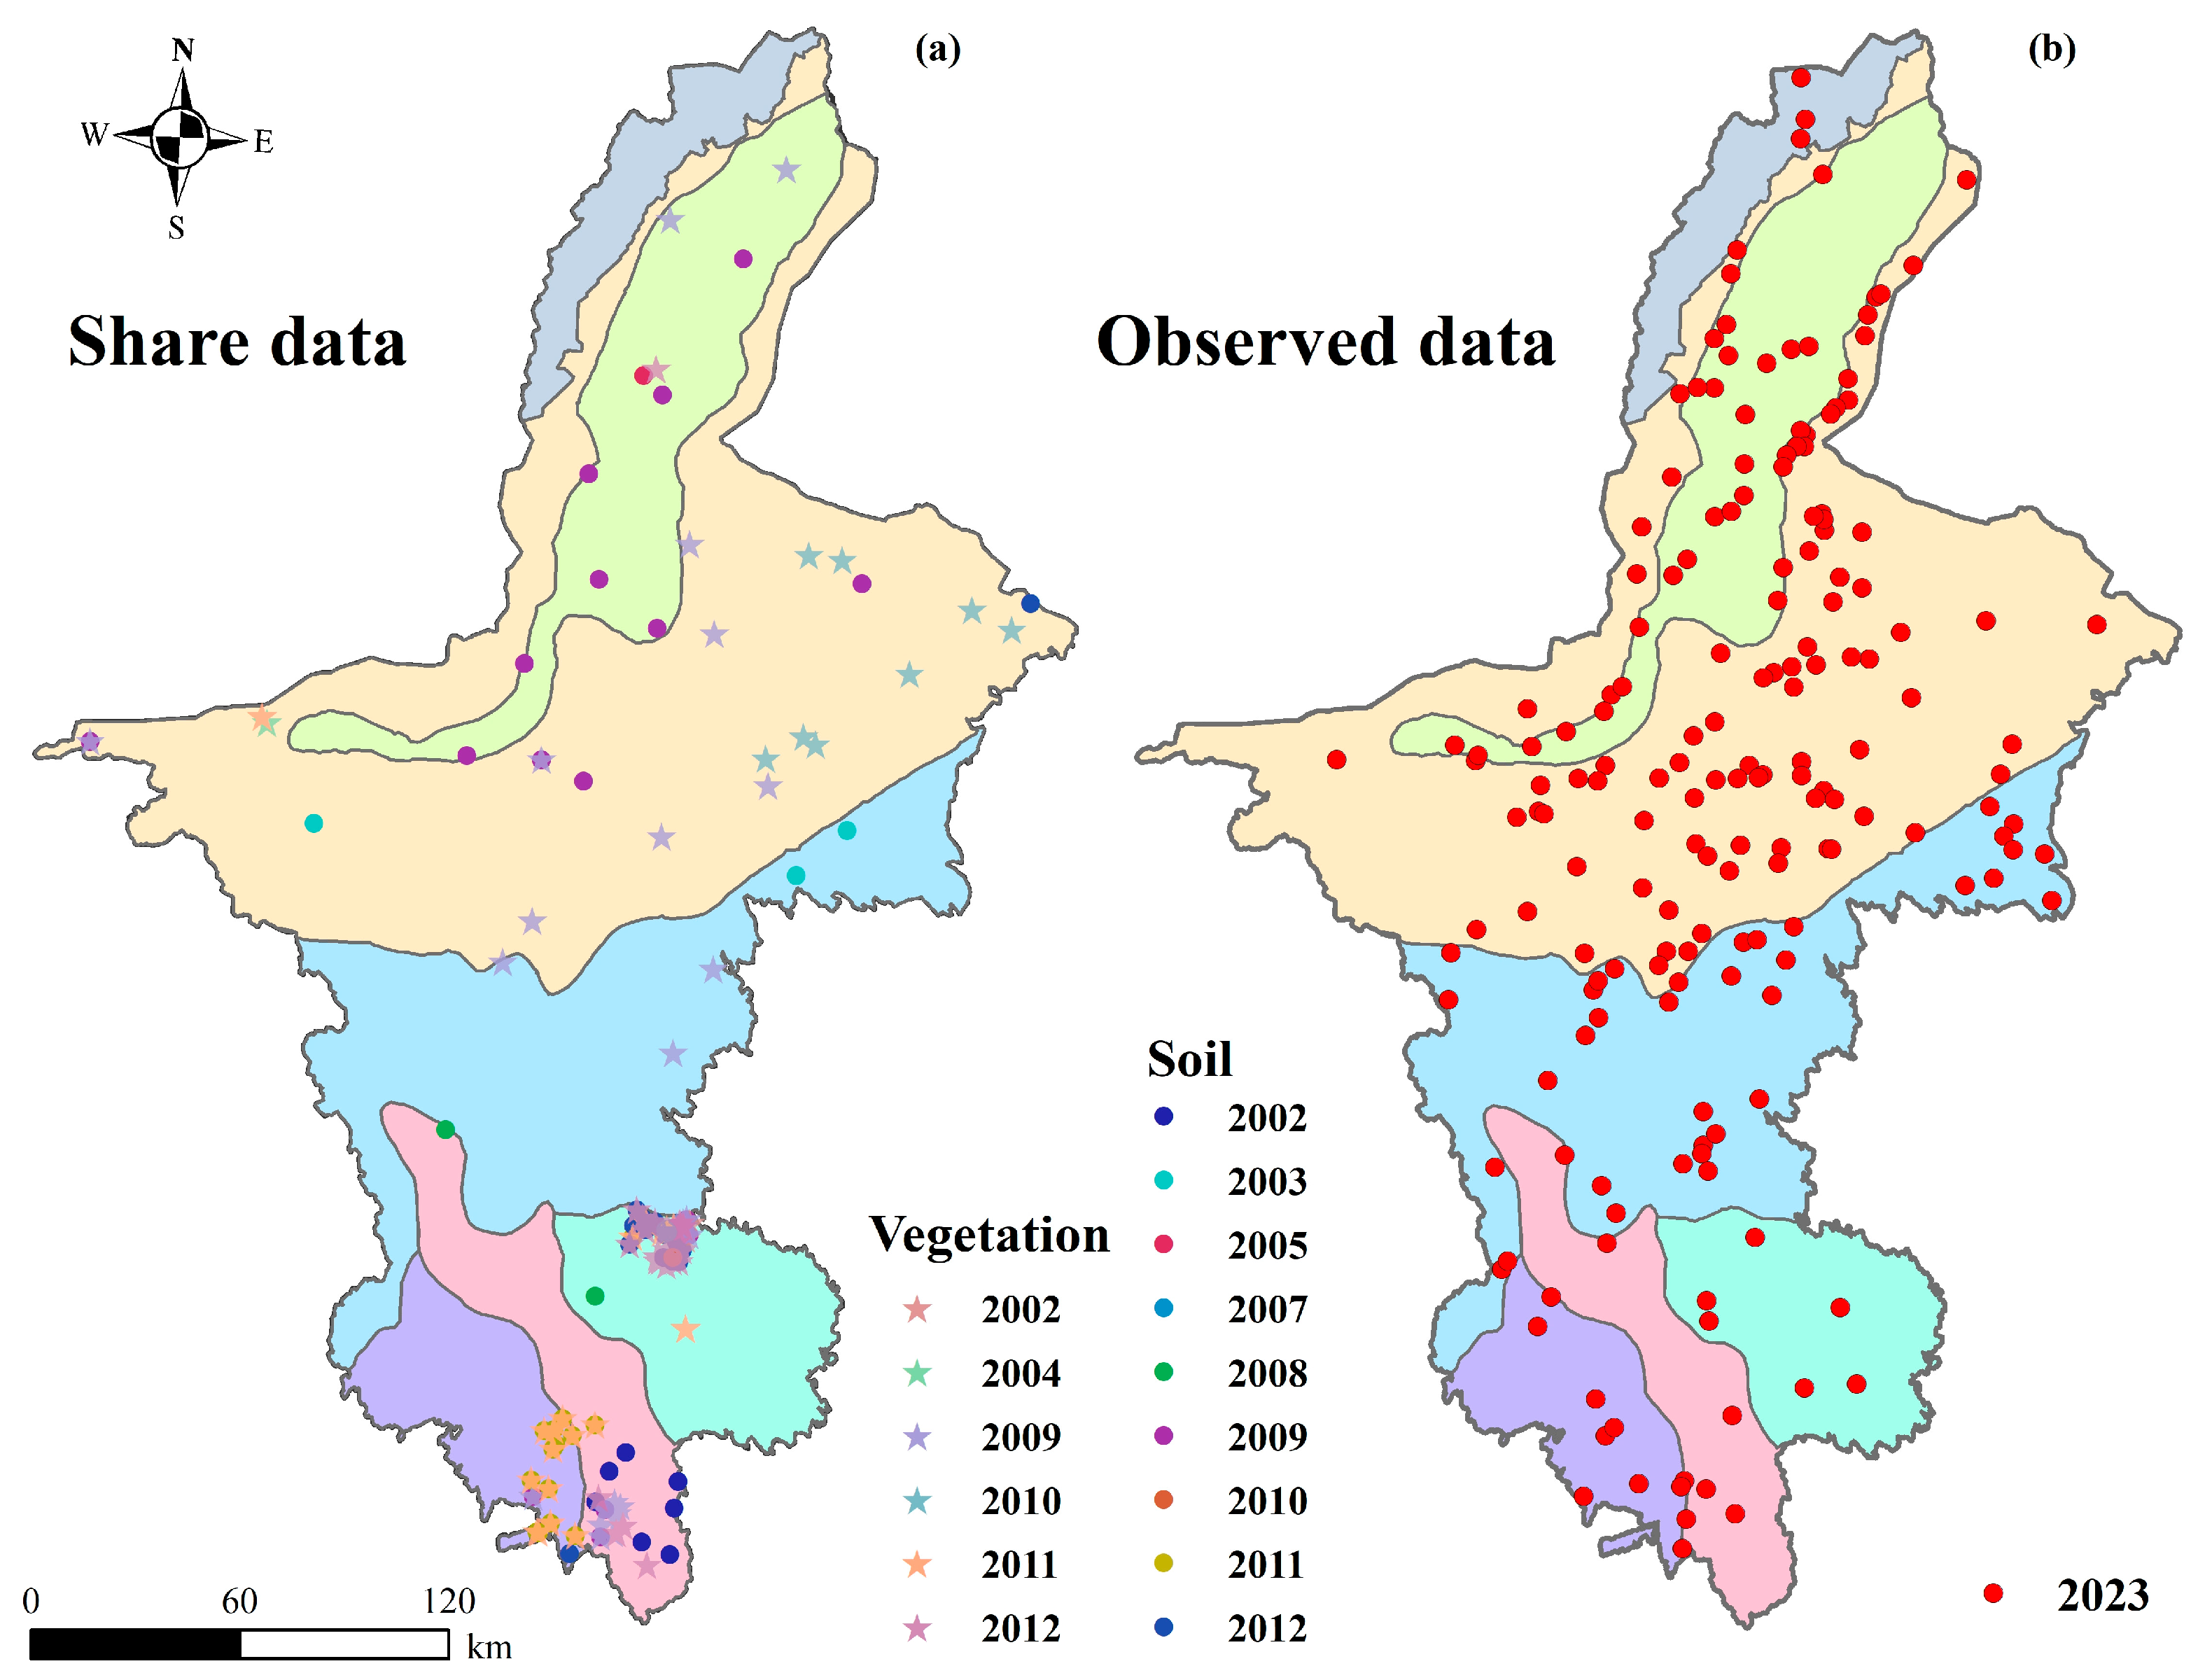
In 2019, Xu [21] compiled a carbon density dataset for China’s terrestrial ecosystems, sourced from 1,036 relevant studies and the author’s field survey plot data. The data were collected between 2004 and 2014 and cover major ecosystems such as forests, grasslands, farmlands, wetlands, and shrub. The shared dataset includes vegetation total biomass (aboveground and belowground) carbon density (VTCD) data and soil organic carbon density (SOCD) data for depths of 0–100 cm. This study extracted all available plot data within Ningxia Hui Autonomous Region from this dataset, including 92 vegetation total biomass density plots and 67 soil carbon density plots(Figure 2). From 28 November to 4 December 2023, a VTCD and SOCD survey and field sampling were conducted in Ningxia Autonomous Region. Considering factors such as the proportion of area under restoration measures, accessibility, plot spacing (5–10 km), and a minimum restoration area of 10,000 m2, 200 survey plots (30 m × 30 m) were selected. Within each plot, three sub-plots with high, medium, and low coverages (50 cm × 50 cm) were selected. All herbaceous vegetation aboveground and belowground biomass within each sub-plot was harvested, dried, weighed, and used to calculate VTCD. Information on tree species and total number of each tree and shrub species was recorded. Diameter at breast height (DBH), height, and crown width were measured using a tape measure and laser hypsometer. The allometric equations for tree and shrub species developed by previous studies [22] were used to estimate aboveground and belowground biomass, which were multiplied by an empirical coefficient to calculate VTCD. Three sampling points were evenly selected within each plot. Soil samples were collected to a depth of 100 cm using a soil auger, and the samples were sent to the laboratory for analysis. Soil organic carbon content was measured and converted into SOCD density.
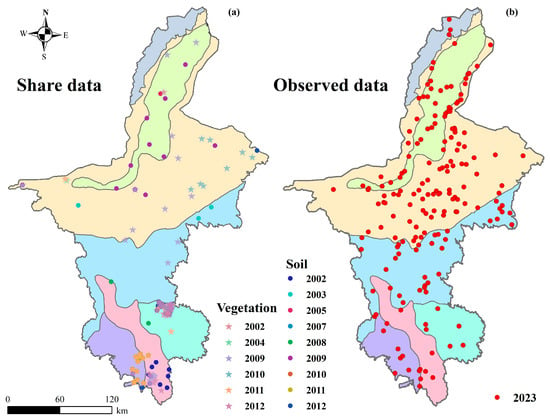
Figure 2.
Spatial distribution of carbon density measurement data: (a) Shared dataset SOCD and VTCD Field Survey data; (b) Vegetation and soil manual measurement sampling points.
2.2.2. Multimodal Datasets
The detailed dataset is shown in Table 1. In this study, the Landsat SR (https://developers.google.com/earth-engine/datasets/catalog/landsat (accessed on 5 May 2024)) product was used to obtain surface reflectance, covering six bands: blue, green, red, near-infrared, shortwave infrared 1, and shortwave infrared 2. Based on these band data, several vegetation indices were calculated, including the Normalized Difference Vegetation Index (NDVI) [23], Enhanced Vegetation Index (EVI) [24], Normalized Difference Moisture Index (NDMI) [25], and Ratio Vegetation Index (RVI) by using GIS (ArcMap 10.8) software. [26]. For meteorological data, rainfall data were provided by the NCEP product from the National Centers for Environmental Prediction (https://www.noaa.gov/jetstream/ncep (accessed on 10 May 2024)), while temperature data were obtained from the ERA5 product of the European Center for Medium-Range Weather Forecasts (https://www.ecmwf.int/en/forecasts/dataset/ecmwf-reanalysis-v5 (accessed on 9 May 2024)). For topographic features, the AW3D30 (https://www.eorc.jaxa.jp/ALOS/en/dataset/aw3d30/aw3d30_e.htm (accessed on 6 May 2024)) product was used to obtain the Digital Elevation Model (DEM), from which slope aspect, slope, topographic index, and soil erosion slope-length factor were extracted. The Terrace dataset (https://figshare.com/articles/dataset/unet_T_d_1_89_LP_tif/17121941 (accessed on 11 May 2024)), based on the distribution map of the Loess Plateau (TDMLP), was developed by the Institute of Geography, Chinese Academy of Sciences (1.89 m) [27]. Additionally, soil type and property data were obtained from the SoilGrids 250m product (https://soilgrids.org/ (accessed on 10 May 2024)). Land use data were sourced from the Yellow River Conservancy Commission’s YRCC_LPLC product (https://doi.org/10.5281/zenodo.10225564 (accessed on 11 May 2024)) [28].

Table 1.
Detailed information about raster dataset used in this study.
2.3. Remote Sensing Inversion Methods for Carbon Density
Taking into account the influence of climate, soil properties, topography, terraces, and vegetation on the spatial–temporal distribution of carbon density [29,30], a total of 16 features were used to estimate VTCD and SOCD, including DEM, slope, aspect, temperature, precipitation, terrace, LS, topographic index, bulk density, clay content, sand, silt, NDVI, EVI, NDMI, and RVI. This study used six machine learning algorithms—Random Forest (RF) [31], Artificial Neural Network (ANN) [32], Support Vector Machine (SVM) [33], Light Gradient-Boosting Machine (Light GBM) [34], eXtreme Gradient Boosting (XGBoost) [35], and Extra Tree Regressor (EXT)—to construct vegetation and soil carbon density inversion models. Various spread values were tested until the mean square error or the number of neurons met the required criteria, optimizing the network parameters to determine the best carbon storage model for each algorithm.
2.4. Carbon Sequestration Rate Calculation
The carbon sequestration rate refers to the change in carbon storage over a unit of time, typically calculated on an annual basis. This study uses the “next year minus previous year” method, based on the 2000–2023 carbon storage dataset, to calculate the carbon sequestration rate in Ningxia from 2001 to 2023. The specific calculation formula is as follows:
where and represent the carbon storage in the following year and the previous year, respectively. The CSR is the change in carbon storage over a unit of time (year).
2.5. Trend Slope Analysis
Combining the Ningxia CSR data from 2000 to 2023, the trend slope analysis method was used to calculate the long-term trend of carbon sequestration rate changes in Ningxia. The formula for calculating the linear slope is as follows:
where Xi is the carbon sequestration rate for year i and n is the total number of years. When the slope > 0, the CSR shows an increasing trend; when the slope < 0, the CSR shows a decreasing trend.
2.6. Geographical Detector
This study employed factor detectors and interaction detectors to reveal the relationships between the carbon sequestration rate of the Ningxia ecosystem and its key driving factors [36]. The factor detector measures the explanatory power of each influencing factor on the spatial differentiation of ecosystem carbon storage by calculating the q-value. The formula is as follows:
where q represents the explanatory power of factor X; C = 1, 2, 3…L are the partitions of explanatory variable X, Nc and N represent the number of sub-zones and the total number of units in the whole region, respectively, and Dc and D represent the variance of Y values in the sub-zones and the whole region, respectively. The q-value ranges from [−1,1], with higher values indicating stronger explanatory power for the spatial differentiation of CSR.
The interaction detector is used to analyze whether there is an interaction between different driving factors and assess how this interaction affects the spatial differentiation of CSR. Specifically, the interaction detector compares the q-values of individual factors X1 and X2 with their interaction q-value q(X1 ∩ X2) to determine the relationship between the driving factors. It indicates that the combined effect of the two factors on CSR is greater than the sum of their individual effects, implying a synergistic effect. This study used the geographical detector to calculate the explanatory power of each factor and their interactions on the long-term average CSR, thereby analyzing the main influencing factors of the spatial changes in CSR in Ningxia from 2000 to 2023.
3. Results
3.1. Carbon Density Inversion Result Accuracy Verification
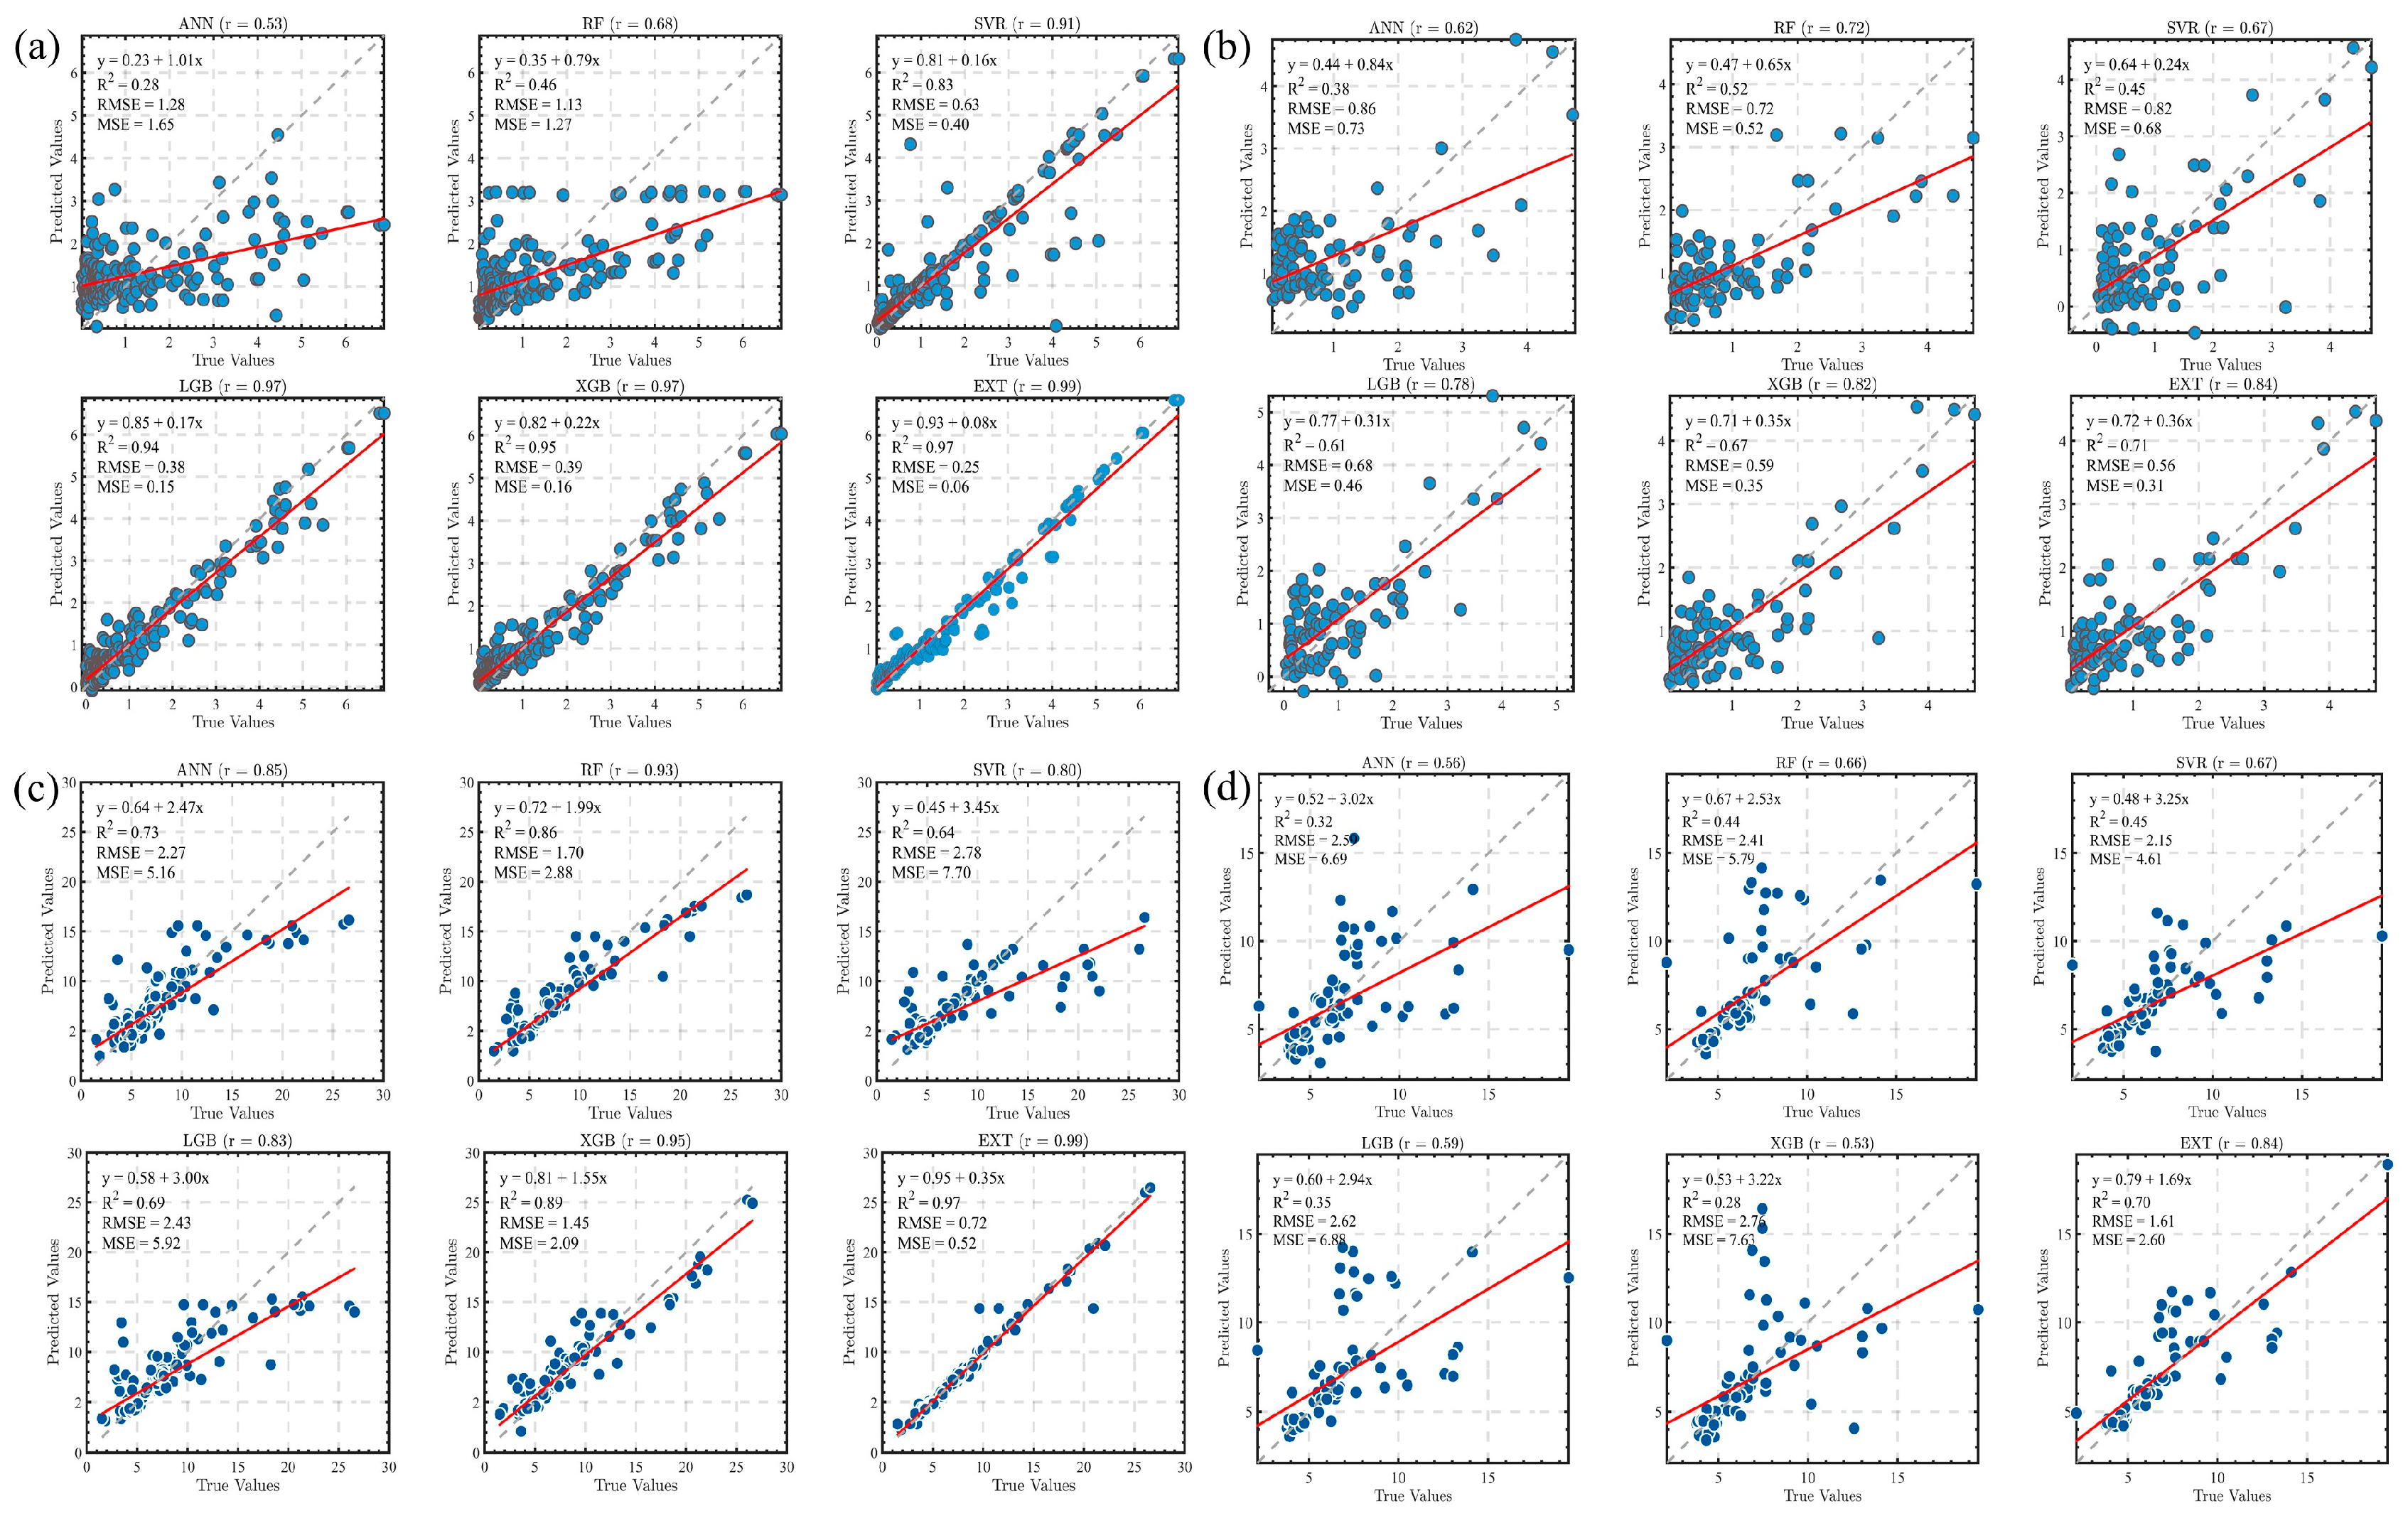
The field observation dataset was randomly divided into a training set (2/3) and a test set (1/3), and prediction models for the VTCD and SOCD were constructed. The best carbon density model was selected by comparing the performance of different machine learning algorithms in the carbon density prediction. The results for vegetation and soil training sets are shown in Figure 3a,b, respectively. All models exhibited a good fitting performance, with the coefficient of determination (R2) for VTCD prediction generally above 0.8, and the root mean square error (RMSE) controlled at a low level. The comparison results for the test set are shown in Figure 3c,d. In the VTCD test set (Figure 3c), the Extreme Random Tree (EXT) model exhibited the best prediction performance (R2 = 0.71, RMSE = 0.56 Kg C m⁻2, MSE = 0.31 Kg C m⁻2), followed by the XGBoost model, while the Artificial Neural Network (ANN) showed relatively lower prediction accuracy. For the SOCD test set (Figure 3d), the EXT model also performed excellently (R2 = 0.70, RMSE = 1.61 Kg C m⁻2, MSE = 2.6 Kg C m⁻2), followed by the Support Vector Regression (SVR) model, while the XGBoost model showed the poorest prediction performance. Considering both the model performance indicators and prediction stability, the EXT model showed the best performance for both the VTCD and SOCD, thus it was chosen as the optimal carbon density model for Ningxia.
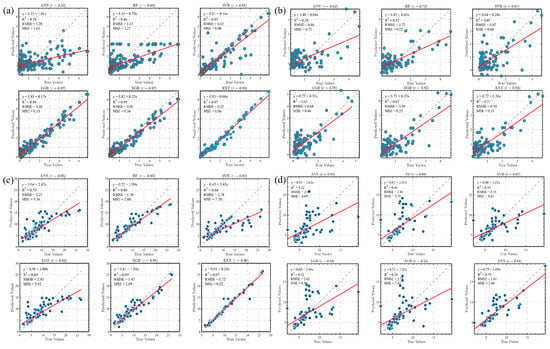
Figure 3.
Accuracy evaluation of VTCD (a,c) and SOCD (b,d) inversion results based on the validation sample dataset.
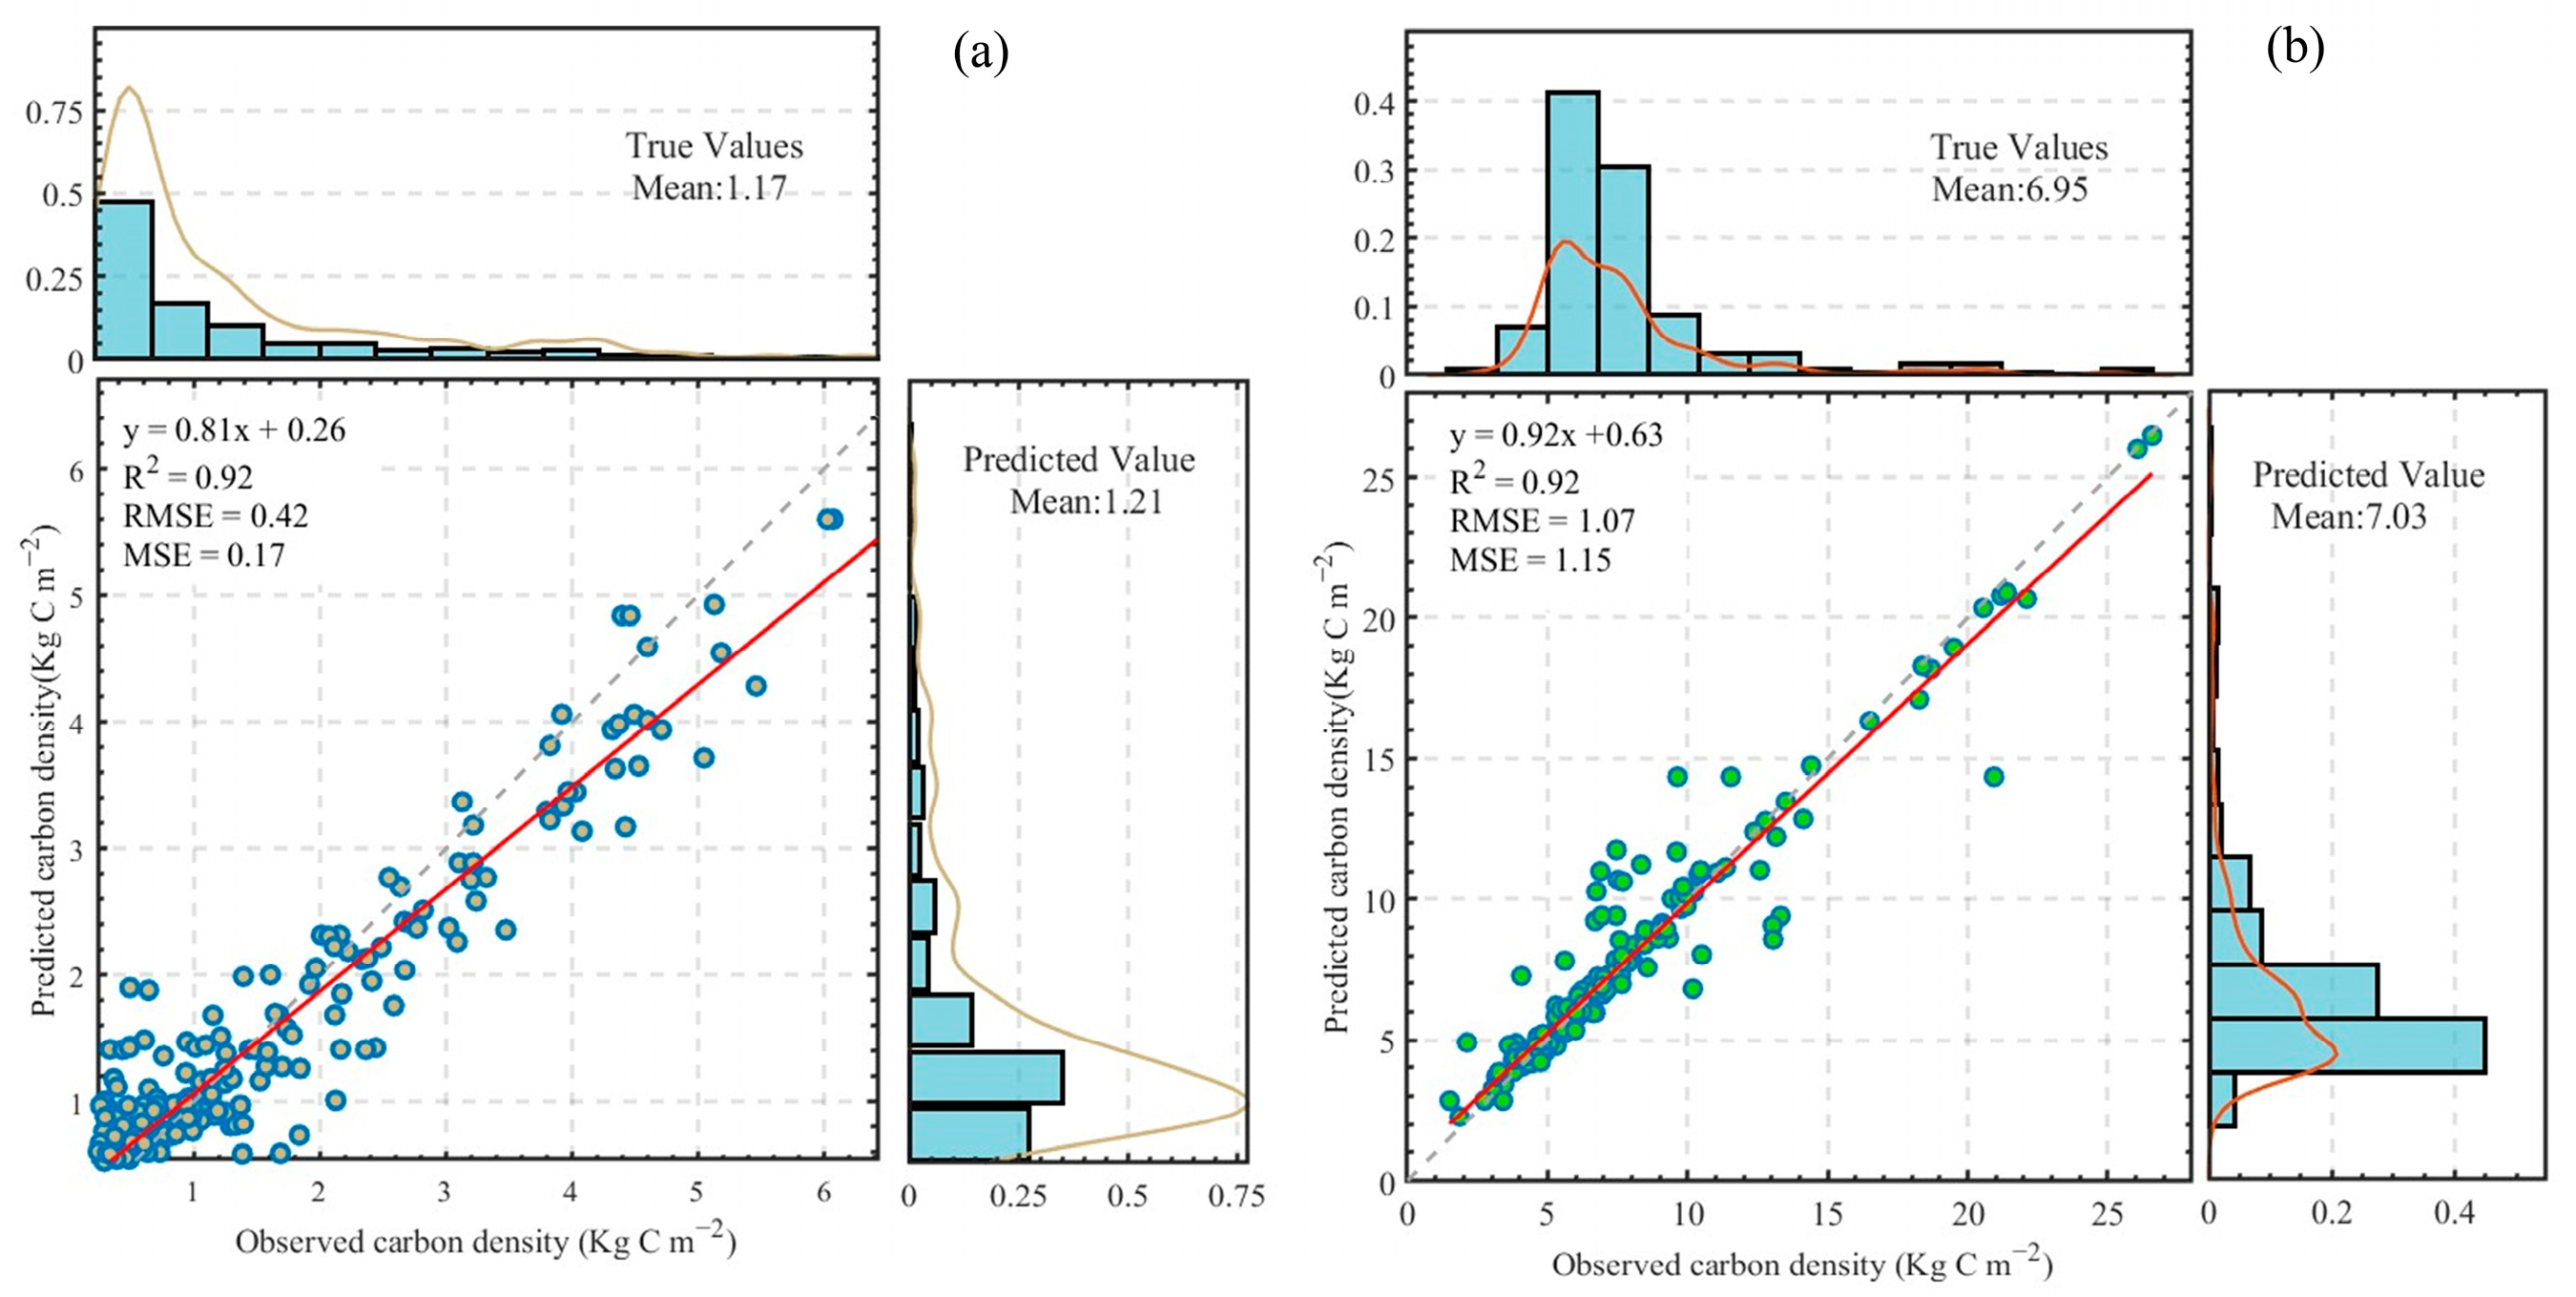
Based on the accuracy metrics of the validation sample dataset, the EXT model was selected to perform the pixel-by-pixel inversion of the vegetation and soil carbon density across Ningxia, generating the 2000–2023 vegetation and soil carbon density dataset. The final inversion dataset was re-extracted using all sample data and compared with measured values to perform accuracy validation (Figure 4). From the scatter plot distribution, a good linear relationship between predicted and measured values is observed, with the points closely aligned to the 1:1 line, indicating high reliability of the model’s predictions.
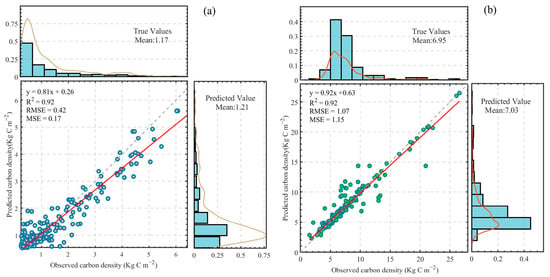
Figure 4.
Accuracy validation of the EXT model prediction results based on the entire sample dataset: (a) VTCD and (b) SOCD.
The EXT model was used to perform the pixel-by-pixel inversion of the vegetation and soil carbon density in the Ningxia region, generating a carbon density dataset from 2000 to 2023. The final inversion dataset was then re-extracted using all sample data, and compared with measured values to generate accuracy validation scatter plots for the vegetation and soil carbon density (Figure 4a,b). From the scatter plot distribution, the predicted values show a strong linear relationship with the measured values, with points tightly clustered around the 1:1 line, indicating high prediction accuracy. Both models exhibit high coefficients of determination (R2 = 0.92) and a low root mean square error (RMSE) and mean square error (MSE), further confirming the reliability of the EXT model in the carbon density prediction.
3.2. Spatial Variation Characteristics of CSR in Ningxia
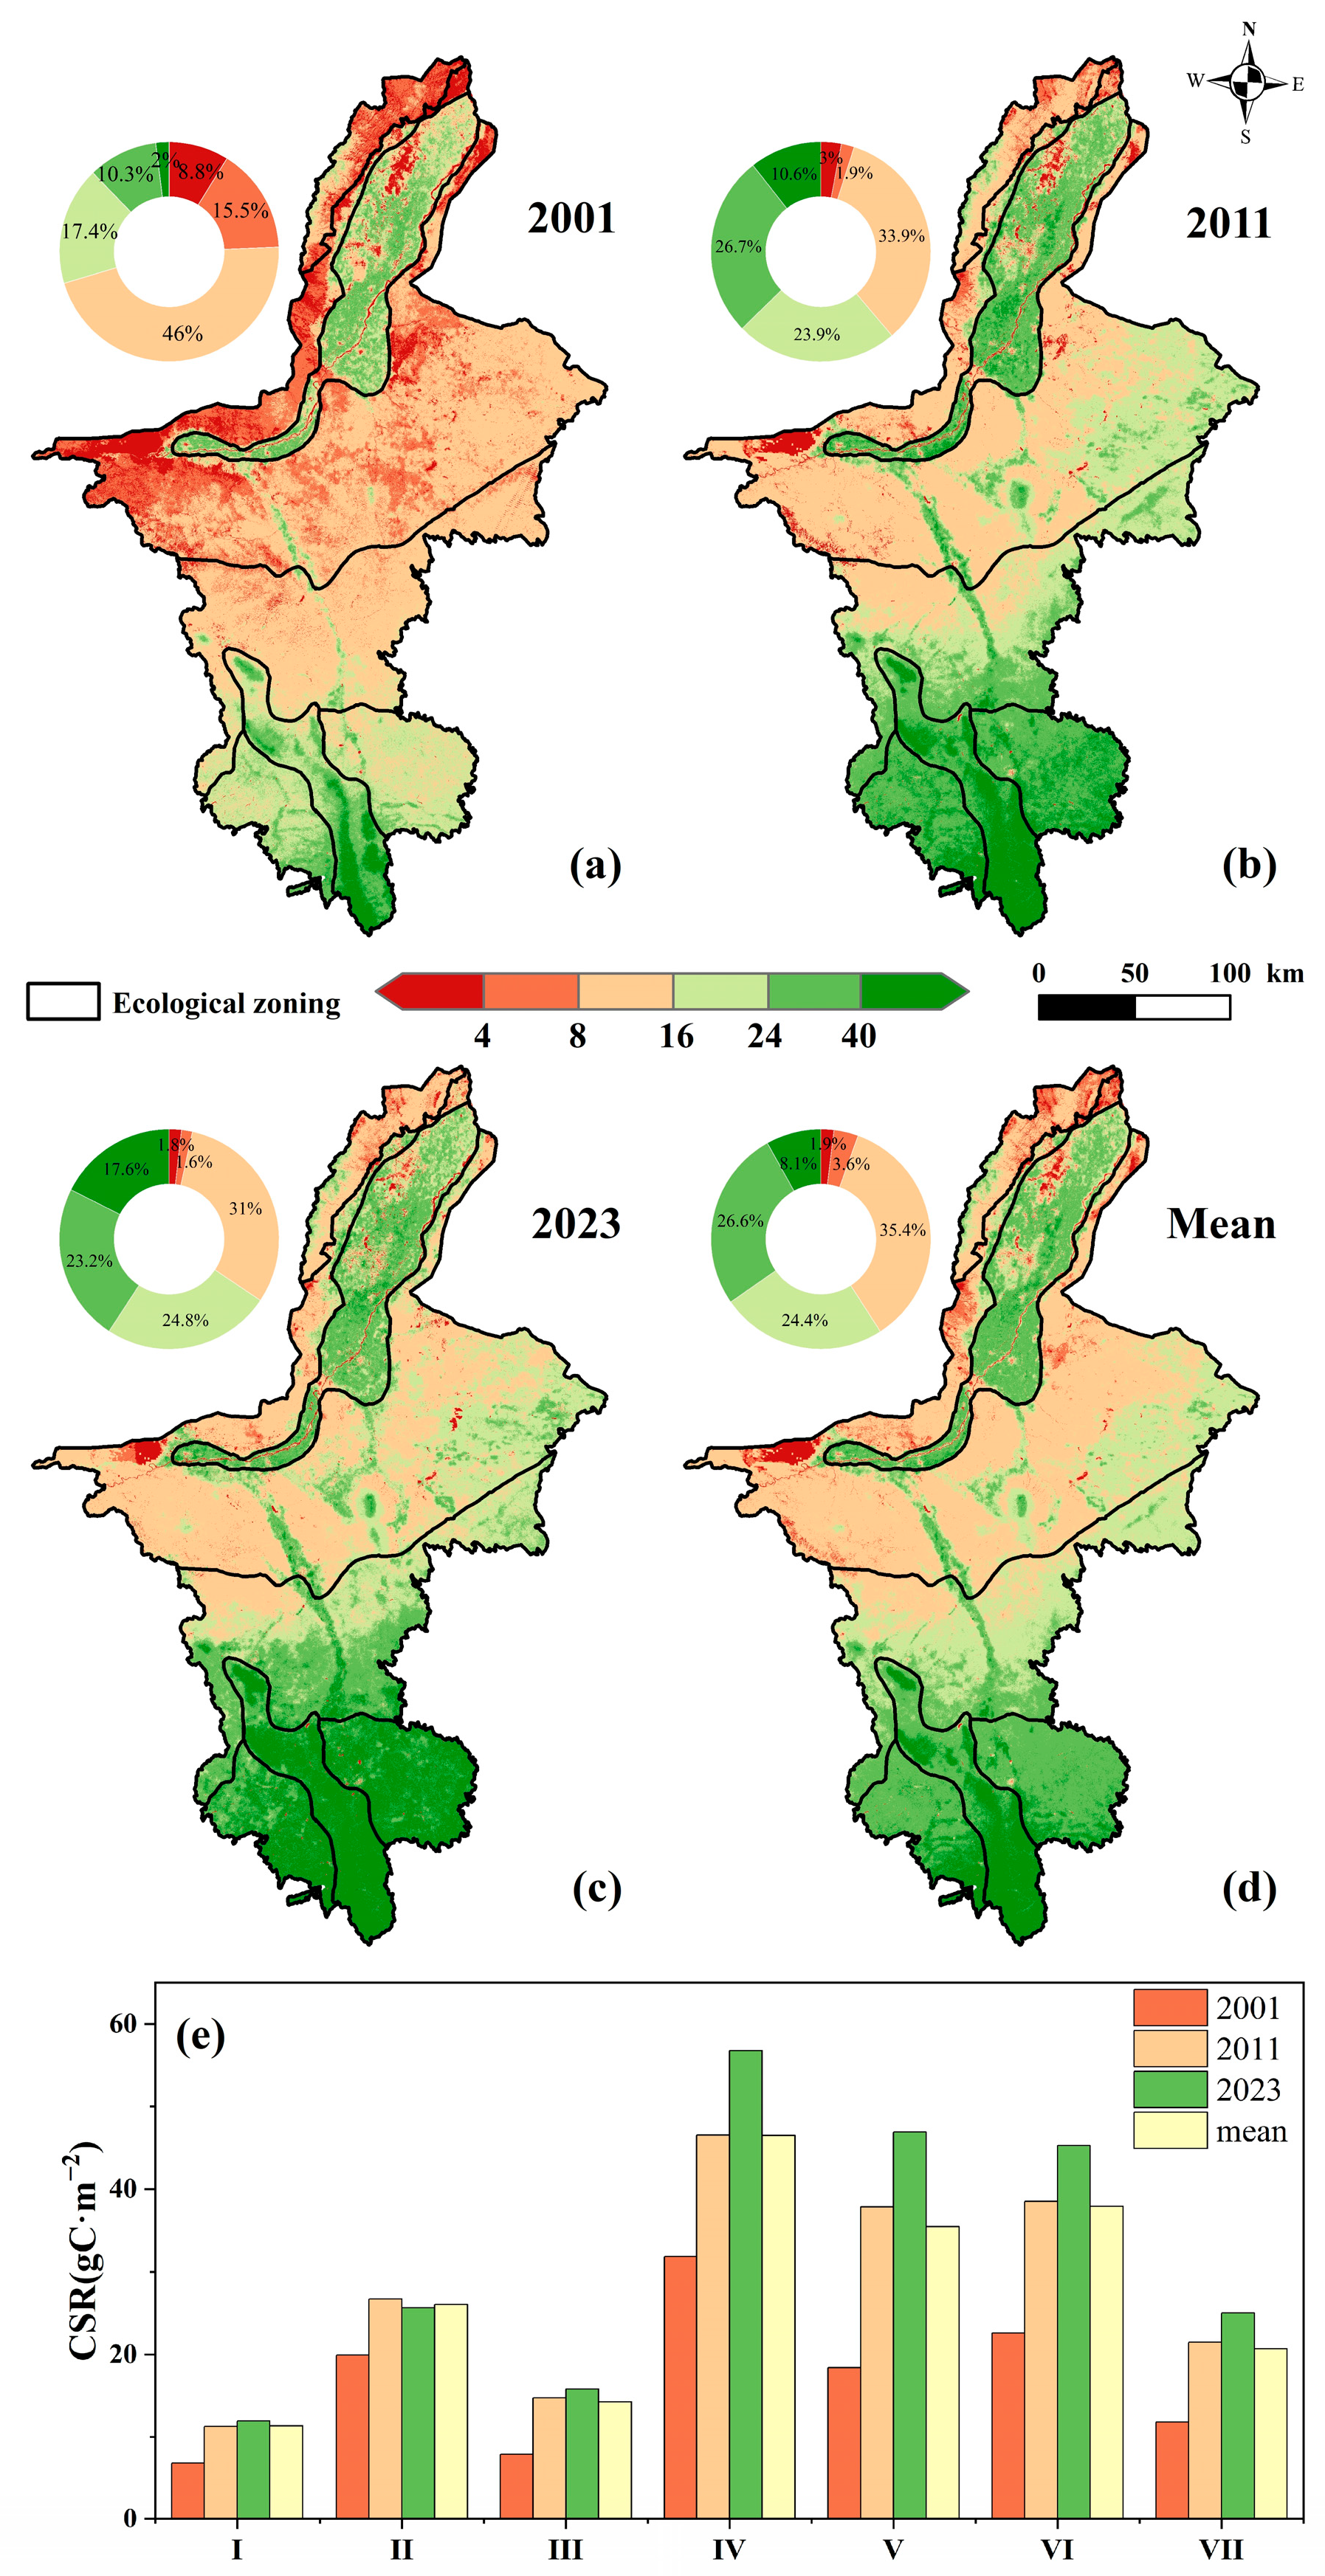
The average CSR values for Ningxia in 2001, 2011, and 2023 were 13.37, 22.59, and 25.41 gC·m⁻2, respectively. As shown in Figure 5a–c, the carbon sequestration rates in the southern and northwestern regions of Ningxia have significantly increased. The percentage of areas with CSR < 4 gC·m⁻2 in Ningxia was 8.8%, 3%, and 1.8% in 2001, 2011, and 2023, showing a decreasing trend year by year. In contrast, the percentage of areas with CSR > 40 gC·m⁻2 increased from 2% in 2001 to 10.6% in 2011 and 17.6% in 2023. From 2001 to 2023, the average CSR for the Ningxia ecosystem exhibited a spatial distribution pattern of decreasing values from south to north, as shown in Figure 5d, with the average CSR of 21.95 gC·m⁻2. Low CSR values are primarily concentrated in the northern region of the Helan Mountain water erosion area and the western region of the Hill platform arid grassland geomantic erosion staggered area. High CSR values are mainly distributed in the Liupan Mountain water erosion zone, the water erosion area of Loess hilly and gully residual tableland, and the southern region of the Loess hilly and gully water erosion zone. As shown in Figure 5e, the Liupan Mountain water erosion zone has the highest CSR, with an average value of 46.51 gC·m⁻2, followed by the Loess hilly and gully water erosion zone, with an average CSR of 37.92 gC·m⁻2. The Helan Mountain water erosion zone has the lowest average CSR, at 11.34 gC·m⁻2.
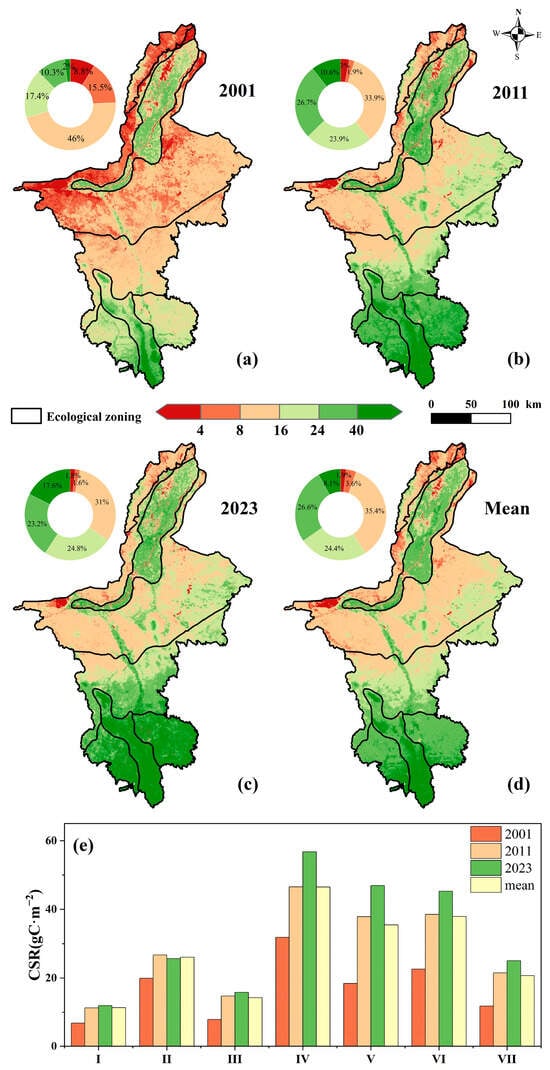
Figure 5.
Spatial Distribution of CSR in Ningxia for 2001 (a), 2011 (b), and 2023 (c), and the average (d) and CSR statistics for different ecological zones (e).
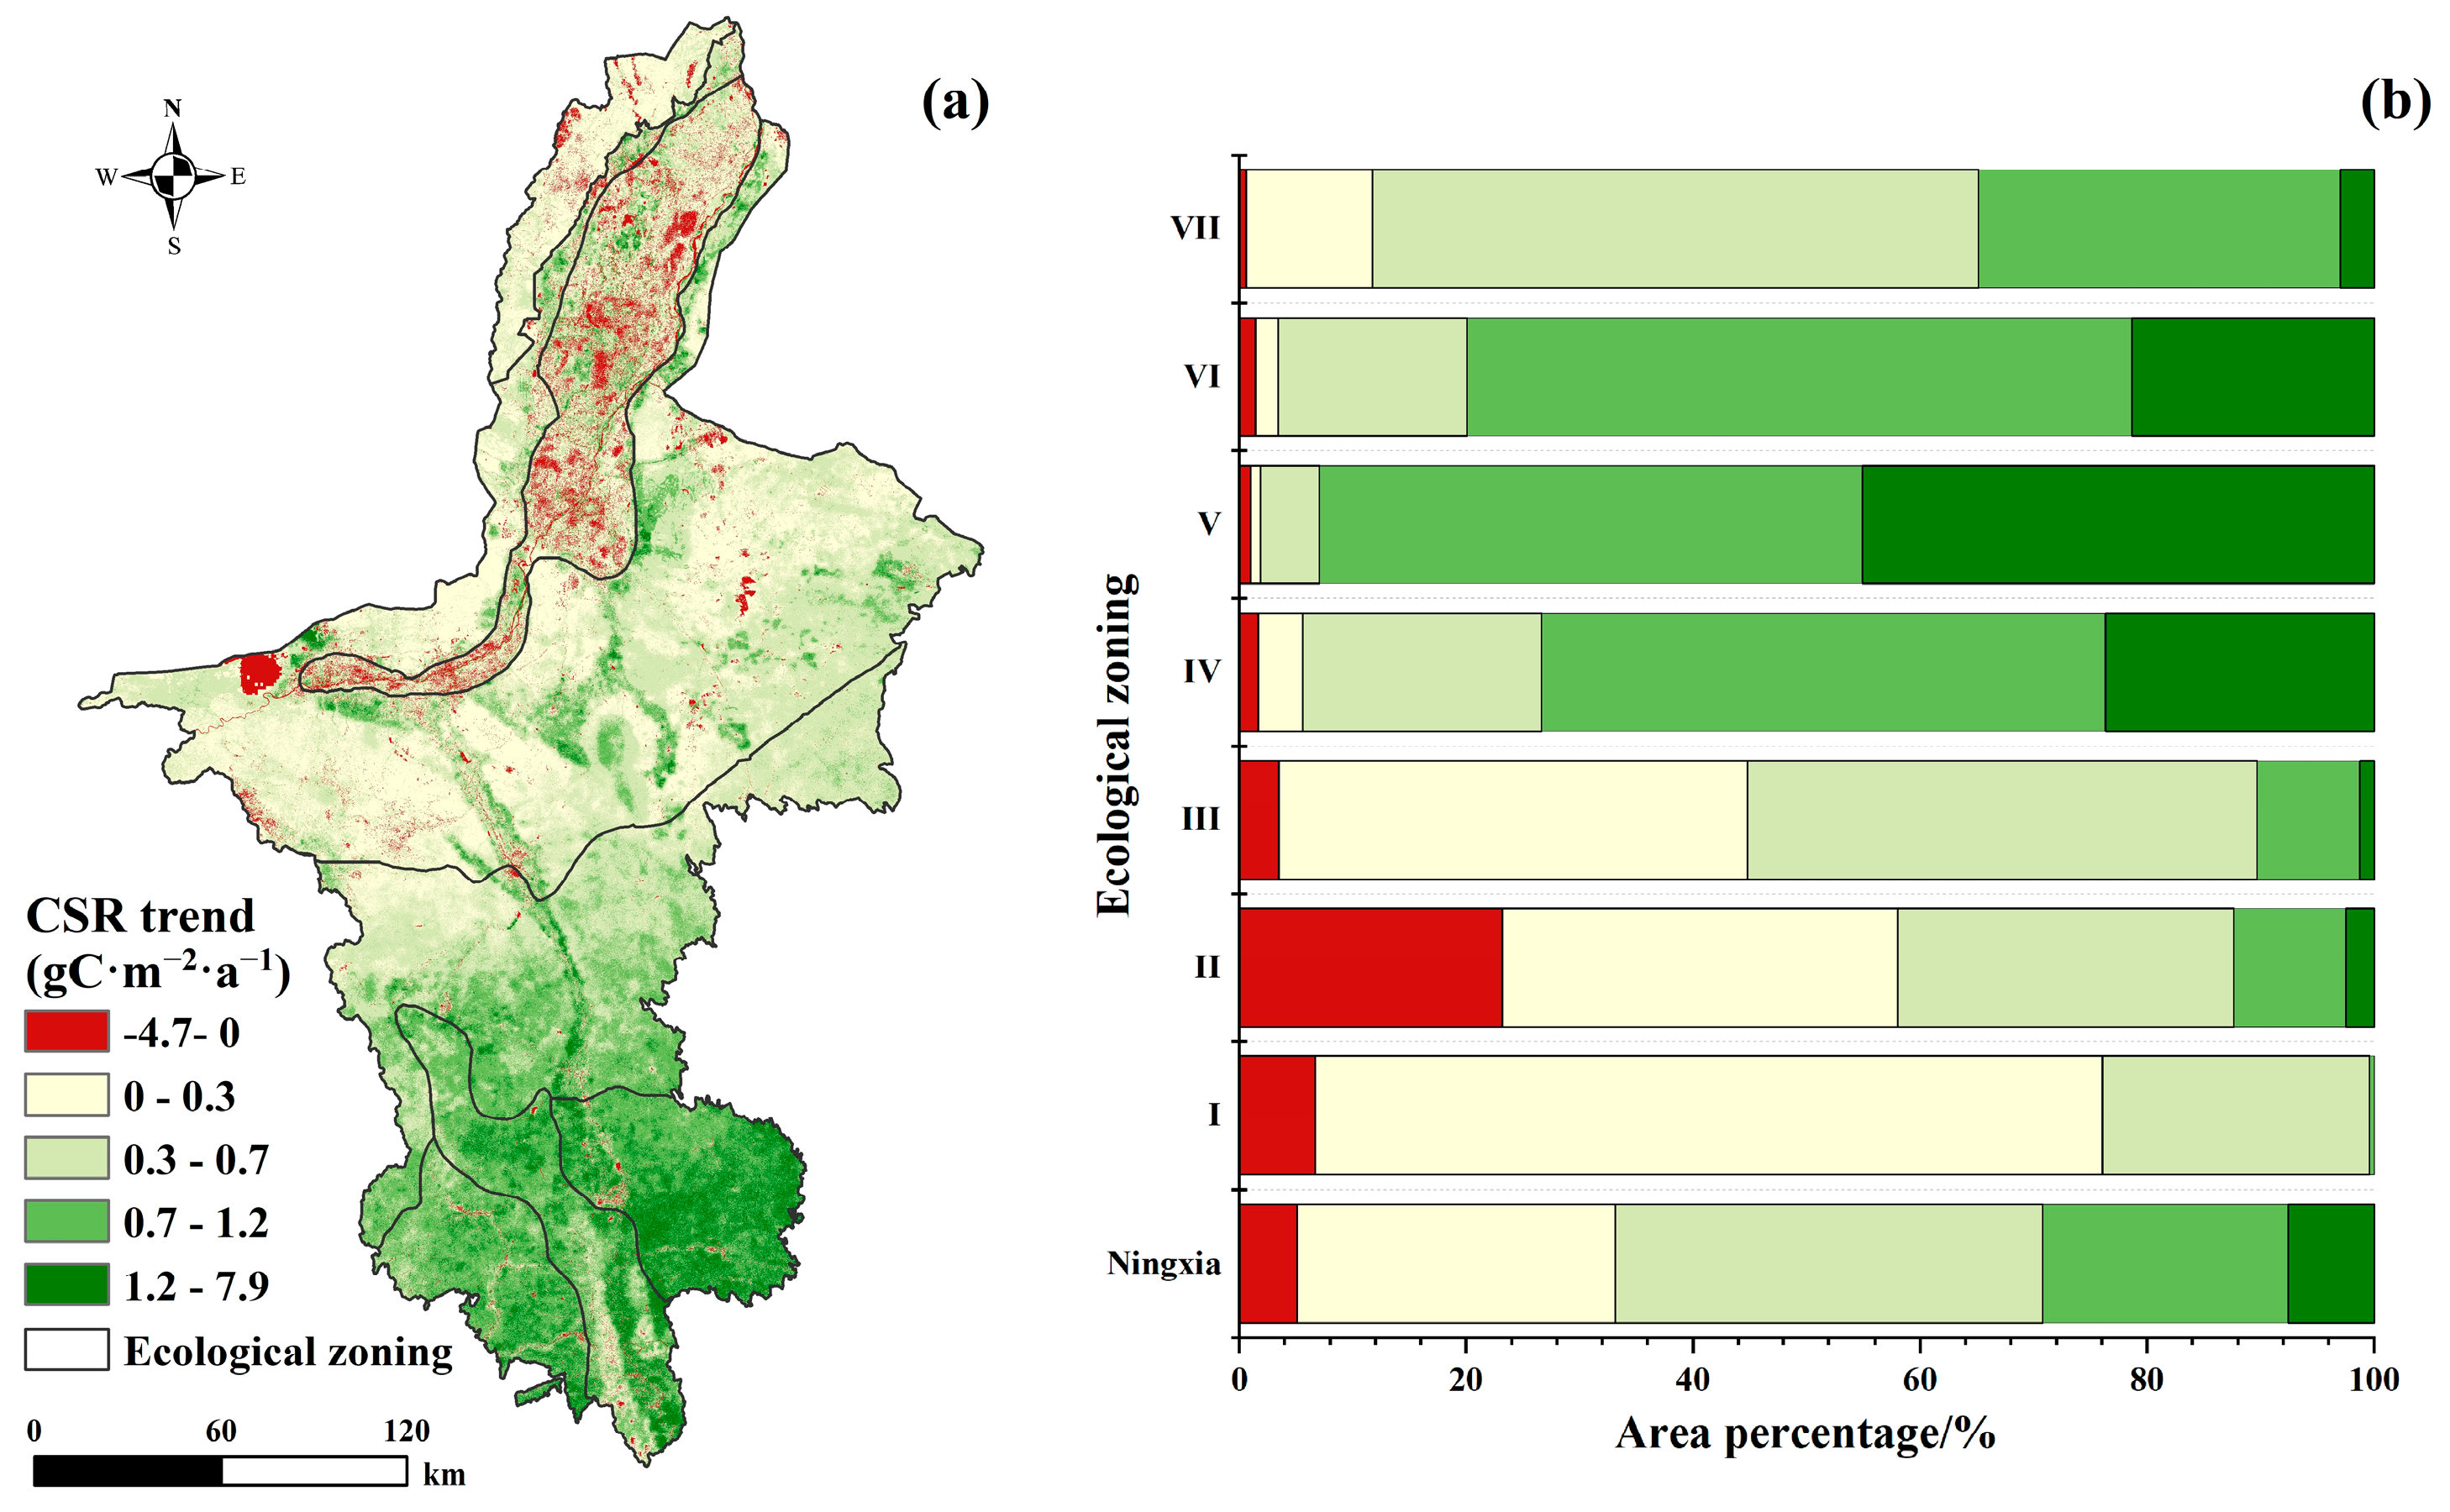
According to Figure 6, the CSR changes in Ningxia and its different ecological zones exhibit significant spatial differentiation. Overall, the carbon sequestration rate in the southern regions of Ningxia has increased significantly, especially in zones V (the Loess hilly and gully residual tableland water erosion zone) and VI (the Loess hilly and gully water erosion zone). A large proportion of land in these regions showed significant increases in the CSR, with growth rates in the range of 0.7–1.2 gC·m⁻2·a⁻1 and 1.2–7.9 gC·m⁻2·a⁻1 accounting for about 90%. However, in the northern part of Ningxia, particularly in zones I (the Helan Mountain water erosion zone) and II (the Yinchuan Plain potential wind erosion zone), some areas showed a downward trend in the CSR. Specifically, in zone II, about 24% of the area showed negative growth in the CSR, indicating a weakening of the carbon sequestration capacity of the ecosystem in that region. Overall, the spatial distribution characteristics of the CSR in Ningxia indicate that the carbon sequestration capacity has significantly increased in the southern regions, while in some northern areas, particularly in the Yinchuan Plain, the carbon sequestration function has weakened.
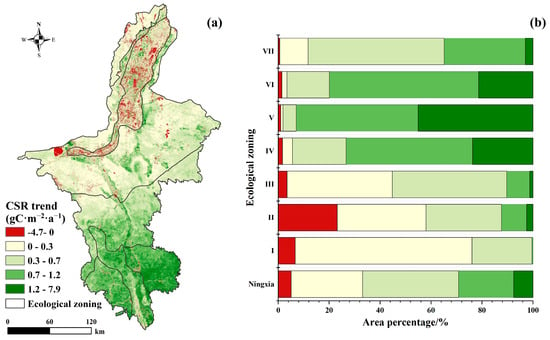
Figure 6.
Spatial distribution of Ningxia CSR trend: (a) Spatial distribution of CSR trend; (b) Statistical proportions of different CSR trend levels within each ecological region.
3.3. Temporal Changes in CSR (2001–2023)
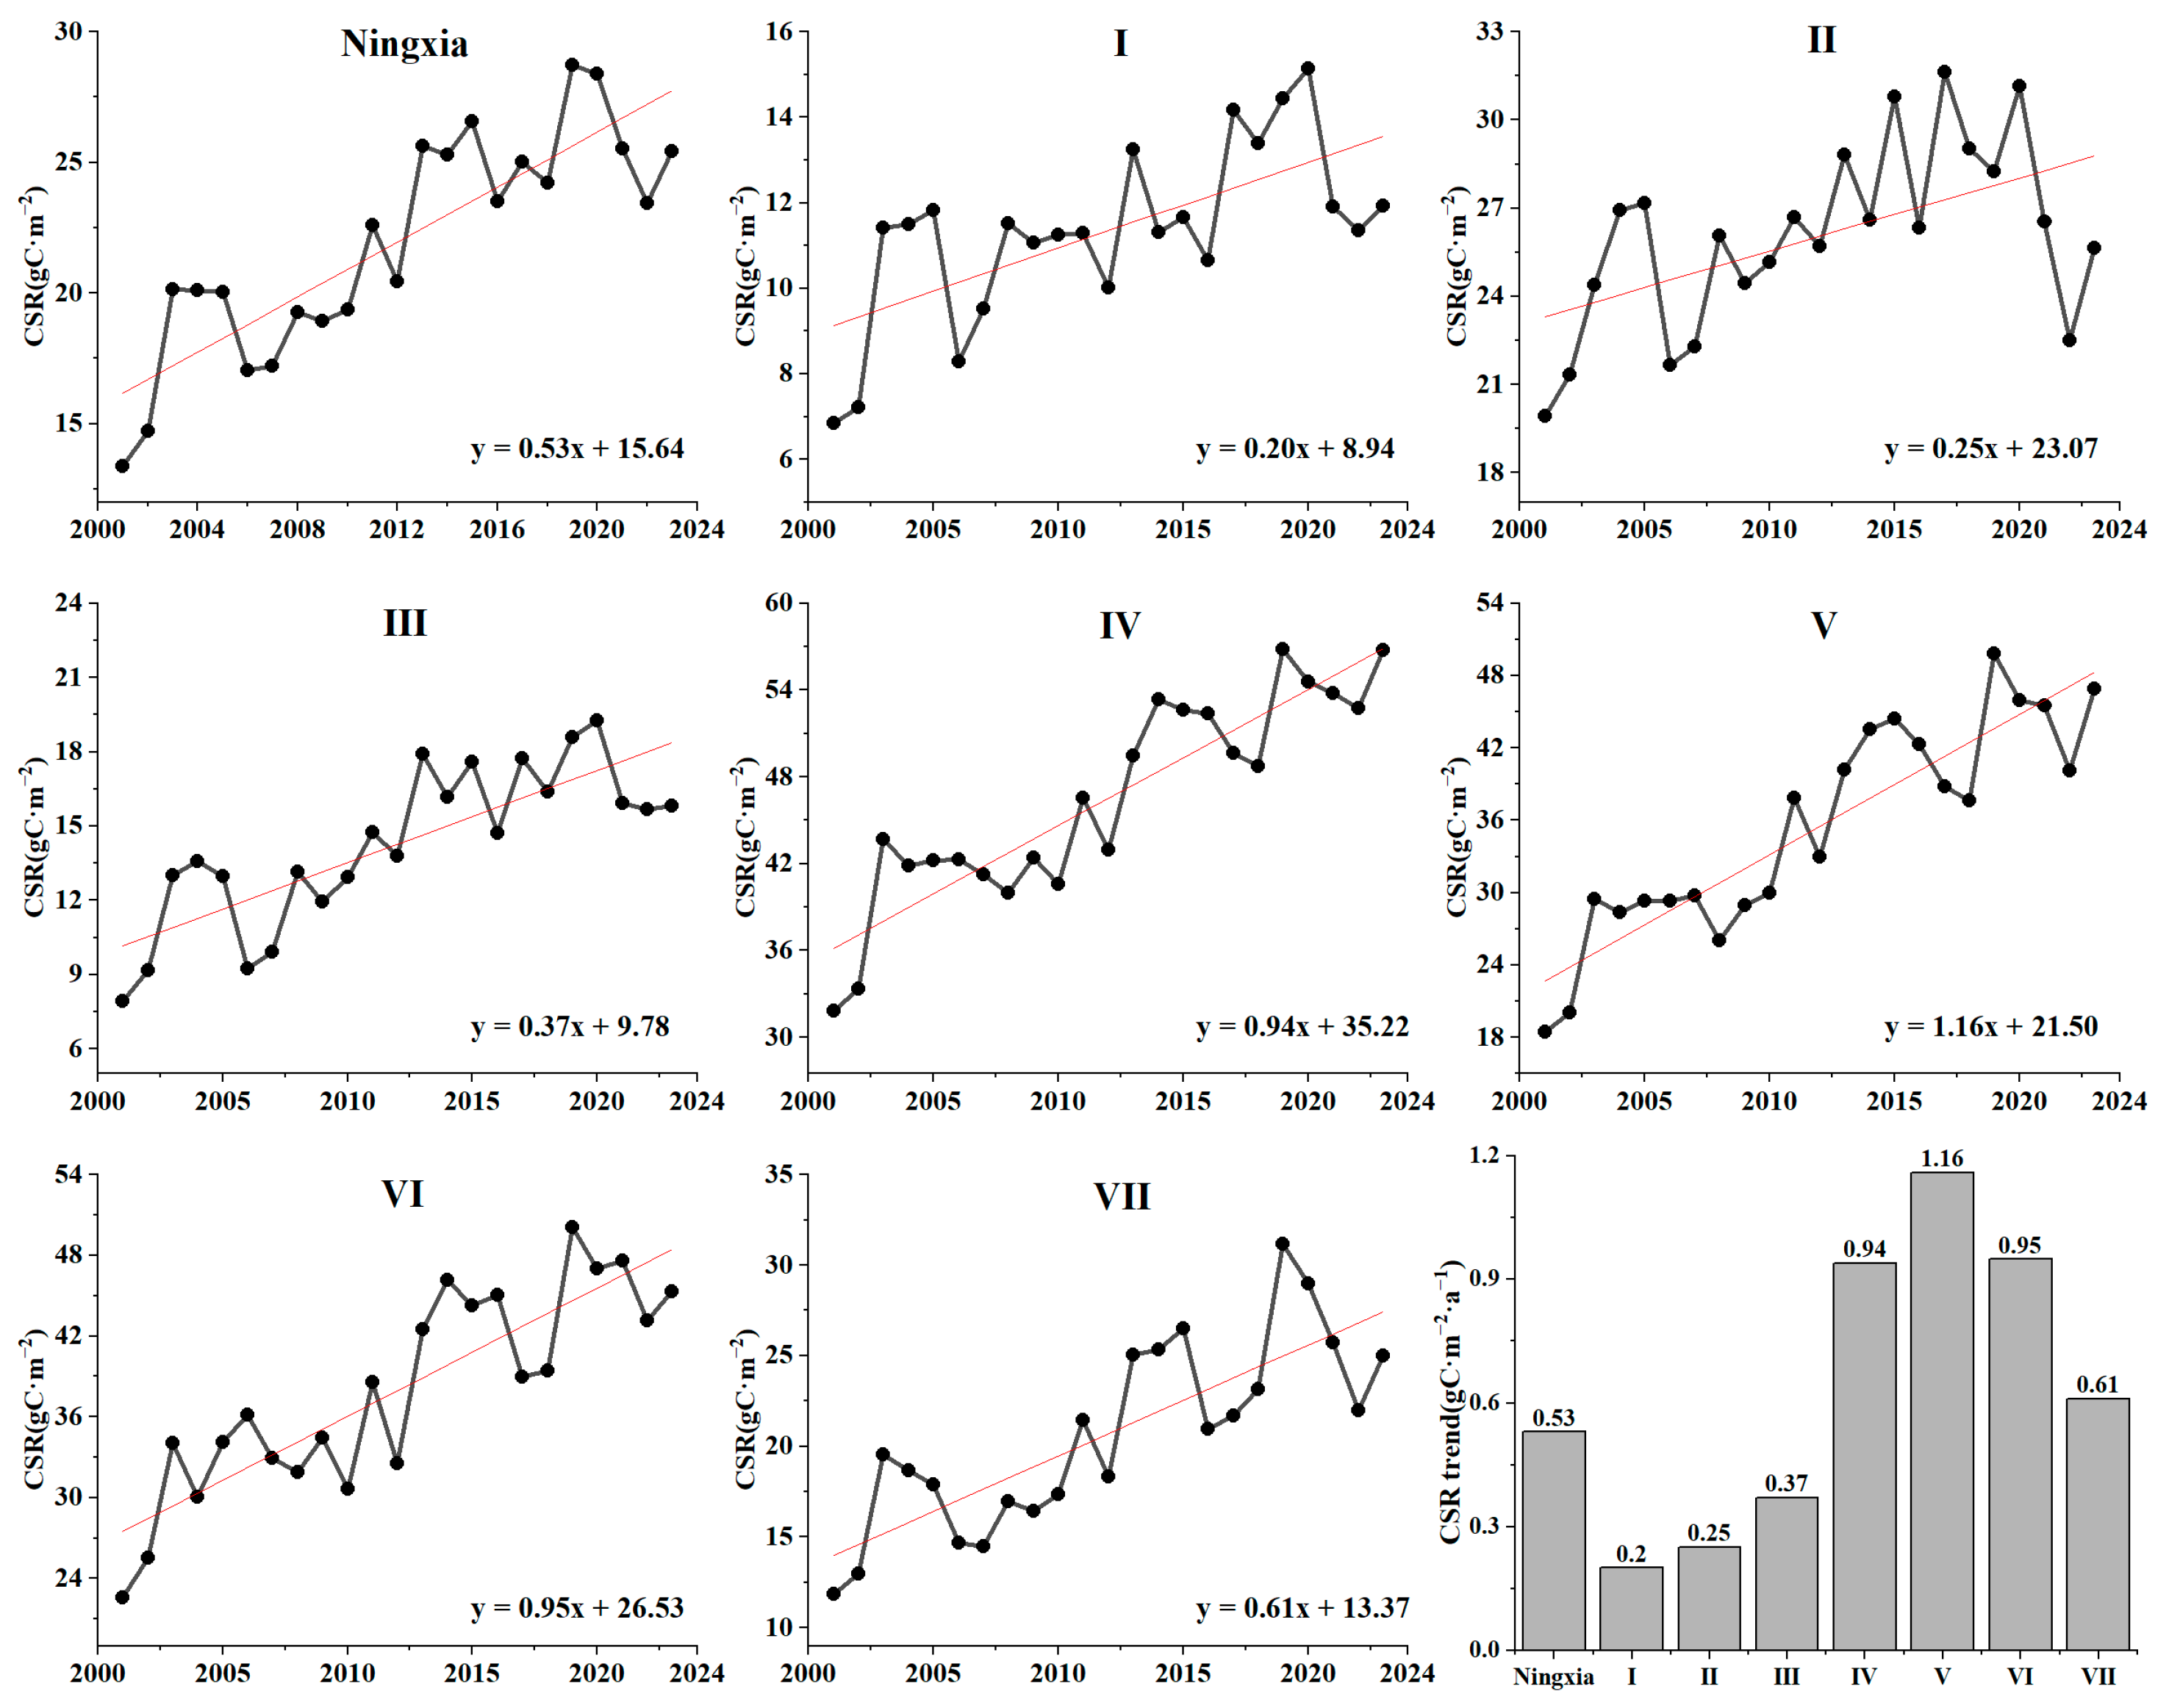
Between 2001 and 2023, the CSR in Ningxia and its seven different ecological zones showed an overall fluctuating increase, peaking in 2019. As shown in Figure 7, the carbon sequestration capacity of the overall Ningxia region has significantly increased, with an average annual growth rate of 0.53 gC·m⁻2·a⁻1. Among the ecological zones, the CSR growth rates vary significantly. Zone V (the water erosion area of Loess hilly and gully residual tableland zone) exhibited the most significant increase, with an average annual growth rate of 1.16 gC·m⁻2·a⁻1. The CSR variations in zones IV (the Liupan Mountain water erosion zone), VI (the Loess hilly and gully water erosion zone), and VII (the Loess hilly and gully water wind erosion staggered zone) were also relatively large, all exceeding the overall level in Ningxia. In contrast, the CSR changes in zones I (the Helan Mountain water erosion zone), II (the potential wind erosion area of Yinchuan Plain zone), and III (the hill platform arid grassland geomantic erosion staggered zone) were relatively stable.
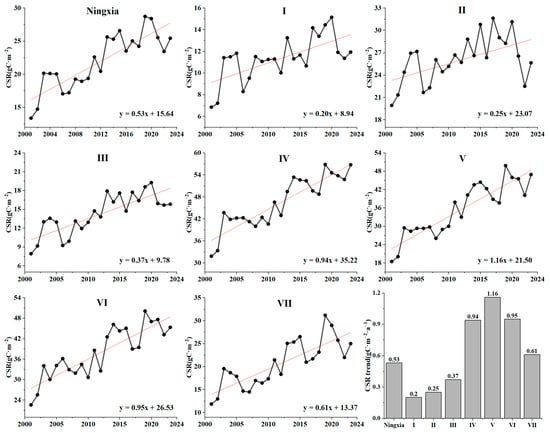
Figure 7.
Interannual variation trends of CSR from 2001 to 2023 in Ningxia and its 7 ecological regions. I (the Helan Mountain water erosion zone), II (the potential wind erosion area of Yinchuan Plain zone), III (the hill platform arid grassland geomantic erosion staggered zone), IV (the Liupan Mountain water erosion zone), V (the water erosion area of Loess hilly and gully residual tableland zone),VI (the Loess hilly and gully water erosion zone), and VII (the Loess hilly and gully water wind erosion staggered zone).
3.4. Influence of Land Cover Types on Ecosystem CSR
Based on land cover products from 2000 to 2020, land use changes in Ningxia were analyzed, as shown in Figure 7. The results show that approximately 68.64% of land use remained unchanged, with arable land, grassland, barren, and forest areas remaining stable, occupying 32.26%, 28.17%, 7.13%, and 1.08% of the total area, respectively. It is noteworthy that the forest coverage rate is the lowest, mainly distributed in the southern Liupan Mountain water erosion zone of Ningxia. In contrast, barren land is primarily distributed in the western region of the Hill platform arid grassland geomantic erosion staggered area. Land use change accounts for approximately 30.83% of the total area, with the largest change being barren to forest–grassland (16.15%), followed by C-Fg (13.68%). The conversion rate of G-F is the lowest, at only 1%. This indicates that Ningxia has undergone significant land cover changes over the past two decades.
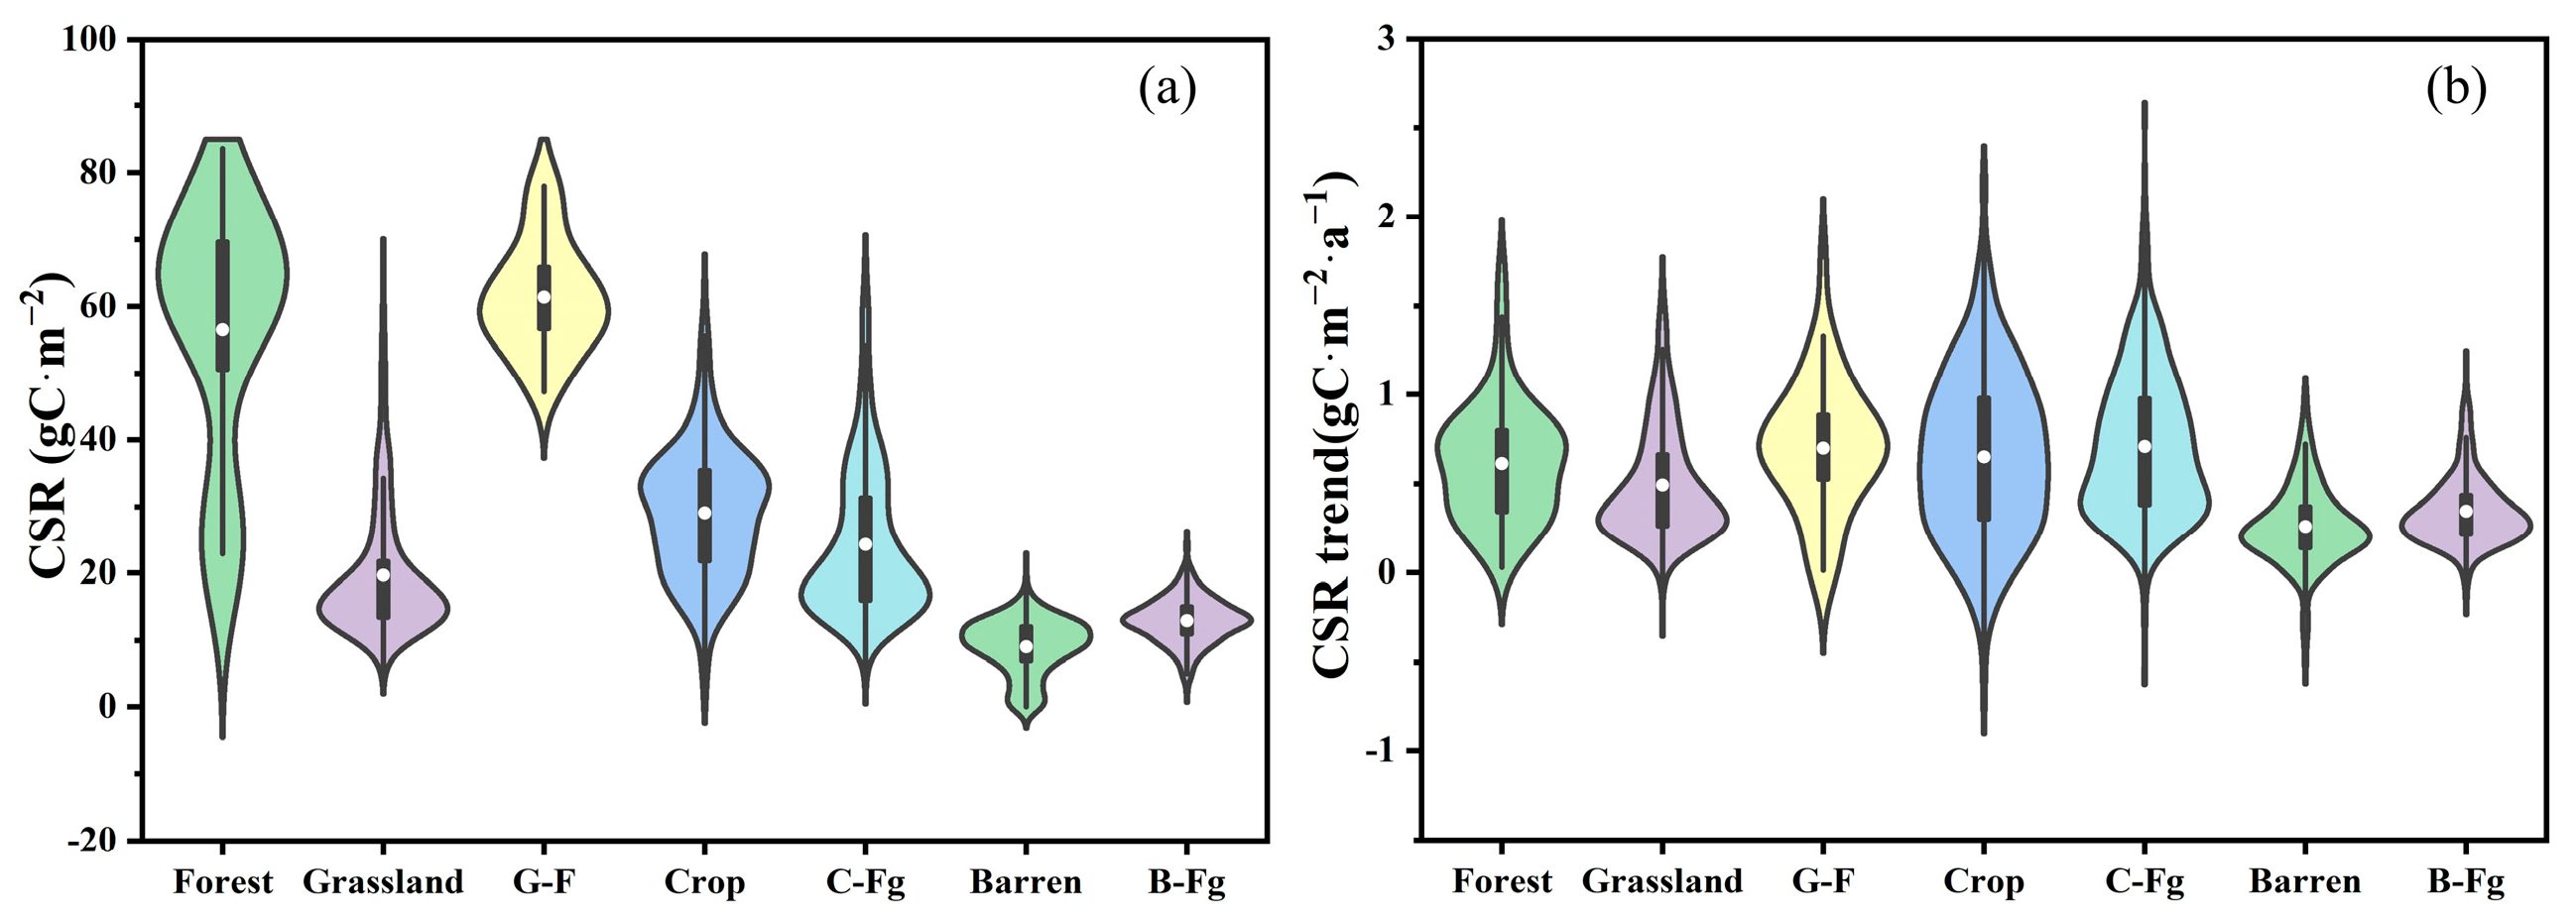
Based on the 2001–2023 CSR, its trend over the years, and land cover-type products, the CSR and carbon accumulation capacities (CSR trend) of different land cover types in Ningxia were calculated, as shown in Figure 8. According to Table 2, the average CSR ranking for unchanged land use types is as follows: forest > cropland > grassland > barren, indicating that forests have the highest carbon sequestration capacity, while barren land has the lowest. The average CSR for forests is 56.53 gC·m⁻2, significantly higher than that of cropland, grassland, and barren land. The total carbon sequestration amount ranks as follows: cropland > grassland > barren > forest. Although forests have the highest per-unit carbon sequestration capacity, cropland has the highest total carbon sequestration due to its larger area, reaching 622.91 Gg C. The CSR growth trends are the highest for cropland and forests, with rates of 0.65 gC·m⁻2·a⁻1 and 0.62 gC·m⁻2·a⁻1, respectively. In particular, cropland shows the highest carbon sequestration increase rate, reaching 13.92 Gg C·a⁻1, indicating that the promotion of conservation tillage and organic agriculture in Ningxia has significantly enhanced cropland’s carbon sequestration potential.
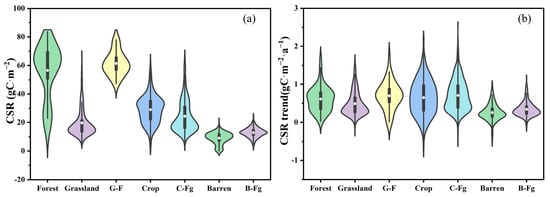
Figure 8.
Chart of CSR (a) and CSR trend (b) for the land cover types.

Table 2.
Statistical table of carbon sequestration capacity and carbon sequestration enhancement capacity for different land cover types.
The ranking of the CSR for land use change types is as follows: G-F > C-Fg > B-Fg. The ranking of the CSR amount is C-Fg > B-Fg > G-F. The total carbon sequestration amount for C-Fg is 221.09 Tg C, far higher than that of other types, while B-FG reaches 138.66 Gg C. Compared to grassland, cropland, and barren land, the conversion of G-F, C-Fg, and B-Fg can, respectively, enhance the carbon sequestration capacity by 42.9%, 9.2%, and 34.6%. After cropland is converted to forest–grassland, although the soil carbon sequestration capacity increases, the improvement is less pronounced than the conversion of grassland to forest–shrub due to the relatively higher carbon sequestration capacity of the cropland itself.
In summary, significant differences exist in the carbon sequestration and enhancement capacities across different land cover types in the Ningxia region. Through scientific land management measures and the optimization of the land-use structure, the carbon sequestration capacity in Ningxia can be effectively improved, contributing to sustainable ecological development.
3.5. Influencing Factors on CSR in Ningxia
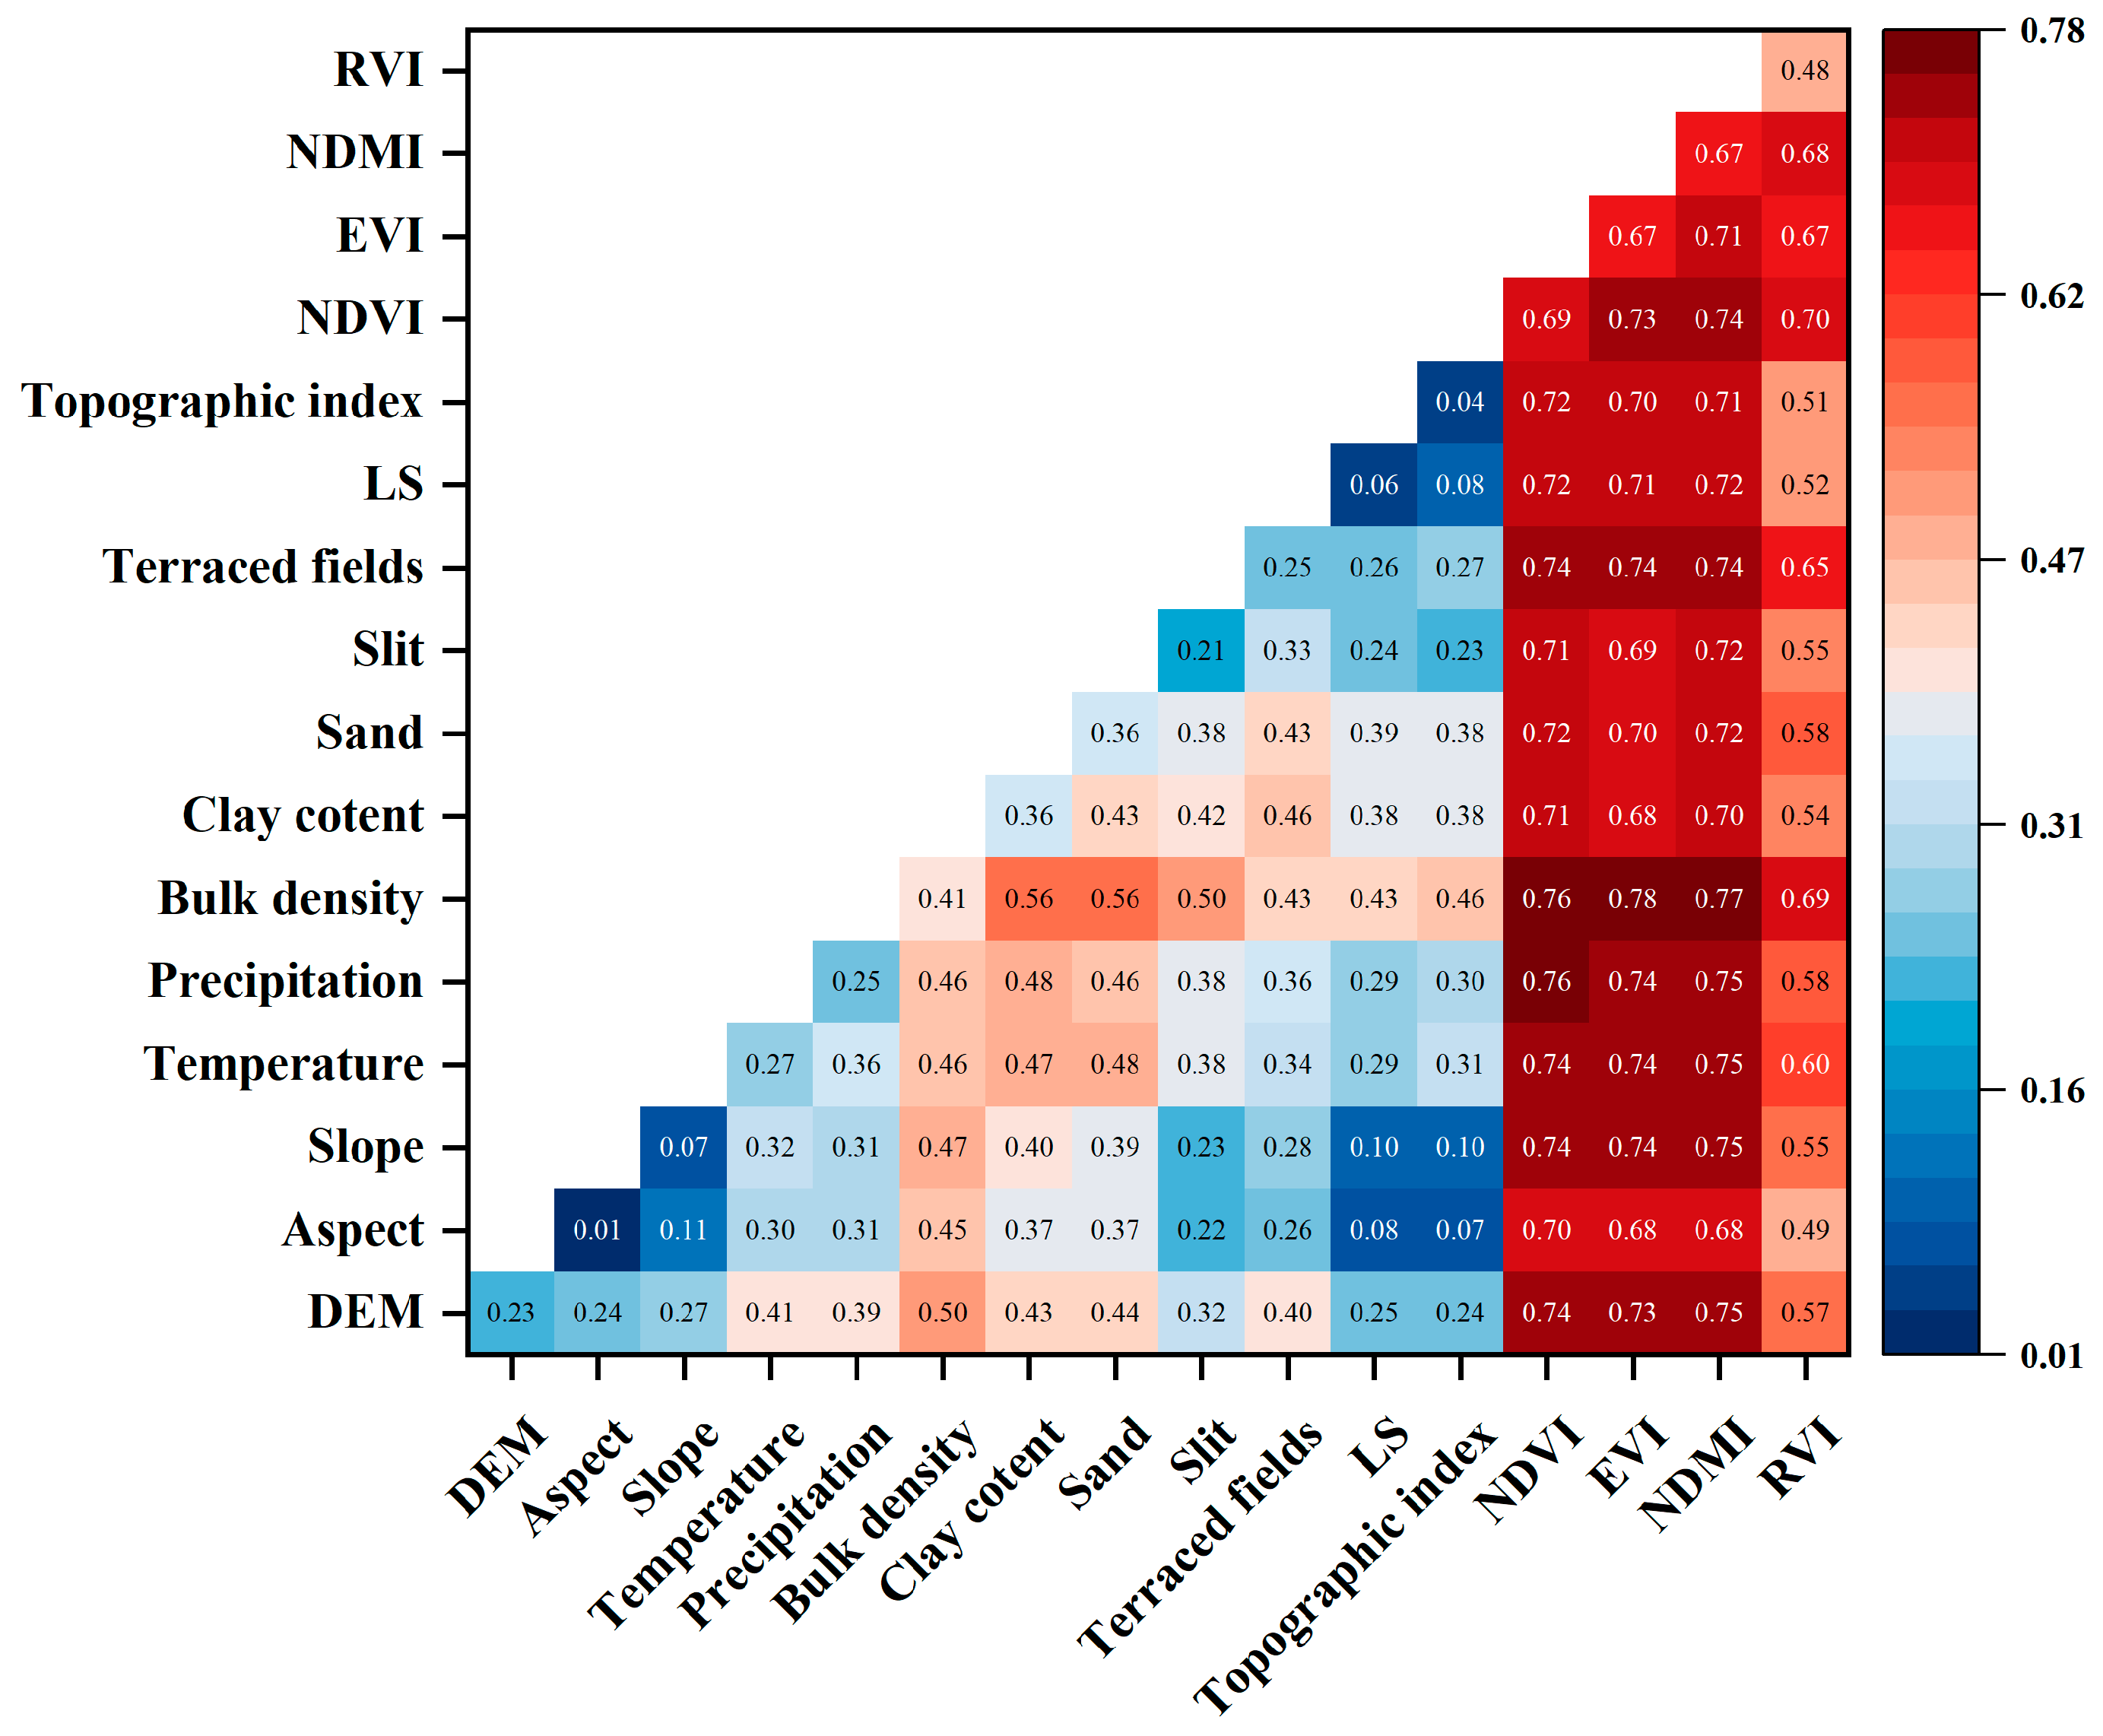
Figure 9 shows the weight and interaction of the CSR’s influencing factors from 2001 to 2023. A univariate analysis shows that the NDVI, with the highest correlation of 0.69, plays a dominant role in the carbon sequestration process. Other vegetation indices such as the EVI, NDMI, and RVI also show a significant influence, reflecting the importance of the vegetation condition on the CSR. Soil property factors such as the bulk density, clay content, sand, and slit also have relatively high q-values of 0.41, 0.36, 0.36, and 0.21, respectively, indicating that these soil characteristics also play a significant role in the CSR. The q-values for DEM, precipitation, and temperature are around 0.25, indicating that elevation and rainfall are also important influencing factors. The interactions between influencing factors exhibit characteristics of two-factor reinforcement or nonlinear amplification. The interaction between the EVI and bulk density has the strongest explanatory power at 0.78, followed by the interaction between the NDMI and bulk density at 0.77. This further confirms the core role of vegetation indices in the CSR.
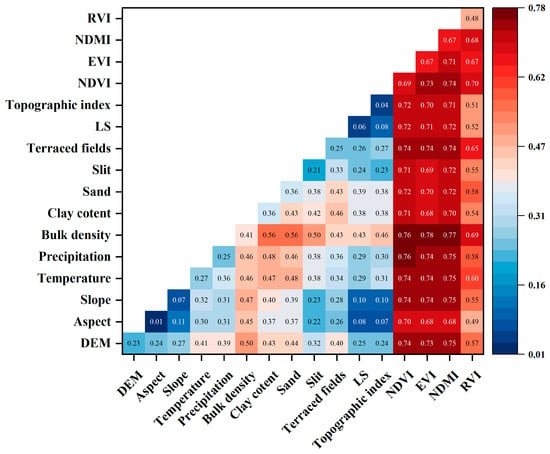
Figure 9.
Weights and interactions of CSR influencing factors in Ningxia from 2001 to 2023.
4. Discussion
4.1. Uncertainty Analysis
Different methods and data sources in various studies lead to discrepancies in the CSR results. This study combines remote sensing inversion with ground observation data to more accurately assess the carbon sequestration capacity in Ningxia, using data with a relatively low spatial resolution to reduce estimation errors. However, this estimation still carries some uncertainty. First, the spatial and temporal resolution of remote sensing data limits the precise capture of small-scale carbon density changes, especially in areas with a complex topography. Related studies have shown that this uncertainty is not an isolated case. For example, Yu et al. (2024) [37] pointed out that remote sensing data can lead to biases in CSR estimates for local areas. Secondly, the insufficient distribution of ground observation points, particularly in the arid regions of northern Ningxia, limits the representativeness of the estimates for this area [38,39]. Therefore, future studies should consider incorporating higher-resolution remote sensing data and expanding the coverage of observation points to reduce these uncertainties [40,41].
Overall, the estimation of the carbon density using remote sensing technology still faces numerous challenges, including insufficient sample sizes, limitations in the accuracy of remote sensing data, constraints on the applicability of research methods, and uncertainties and biases in data sources. These issues significantly affect the accuracy and reliability of CSR estimates. Therefore, it is urgently necessary to expand the coverage and improve the precision of field observation data to provide more comprehensive and high-quality validation data. Simultaneously, enhancing the accuracy of remote sensing products, improving algorithms, and adopting advanced data fusion techniques are critical for reducing uncertainties. Additionally, optimizing simulation methods to enhance their applicability across different ecosystems and spatial scales is crucial. Future research should also focus on the potential of more advanced remote sensing technologies, the further integration of ground-based measurements and multi-source information, and an in-depth exploration of the mechanisms by which various variables influence CSR estimates. These advancements are of great significance for accurately characterizing the spatiotemporal dynamics of the CSR, uncovering its driving mechanisms and providing scientific support for ecosystem management and carbon neutrality policy formulation.
4.2. Comparison with Other MODIS Products
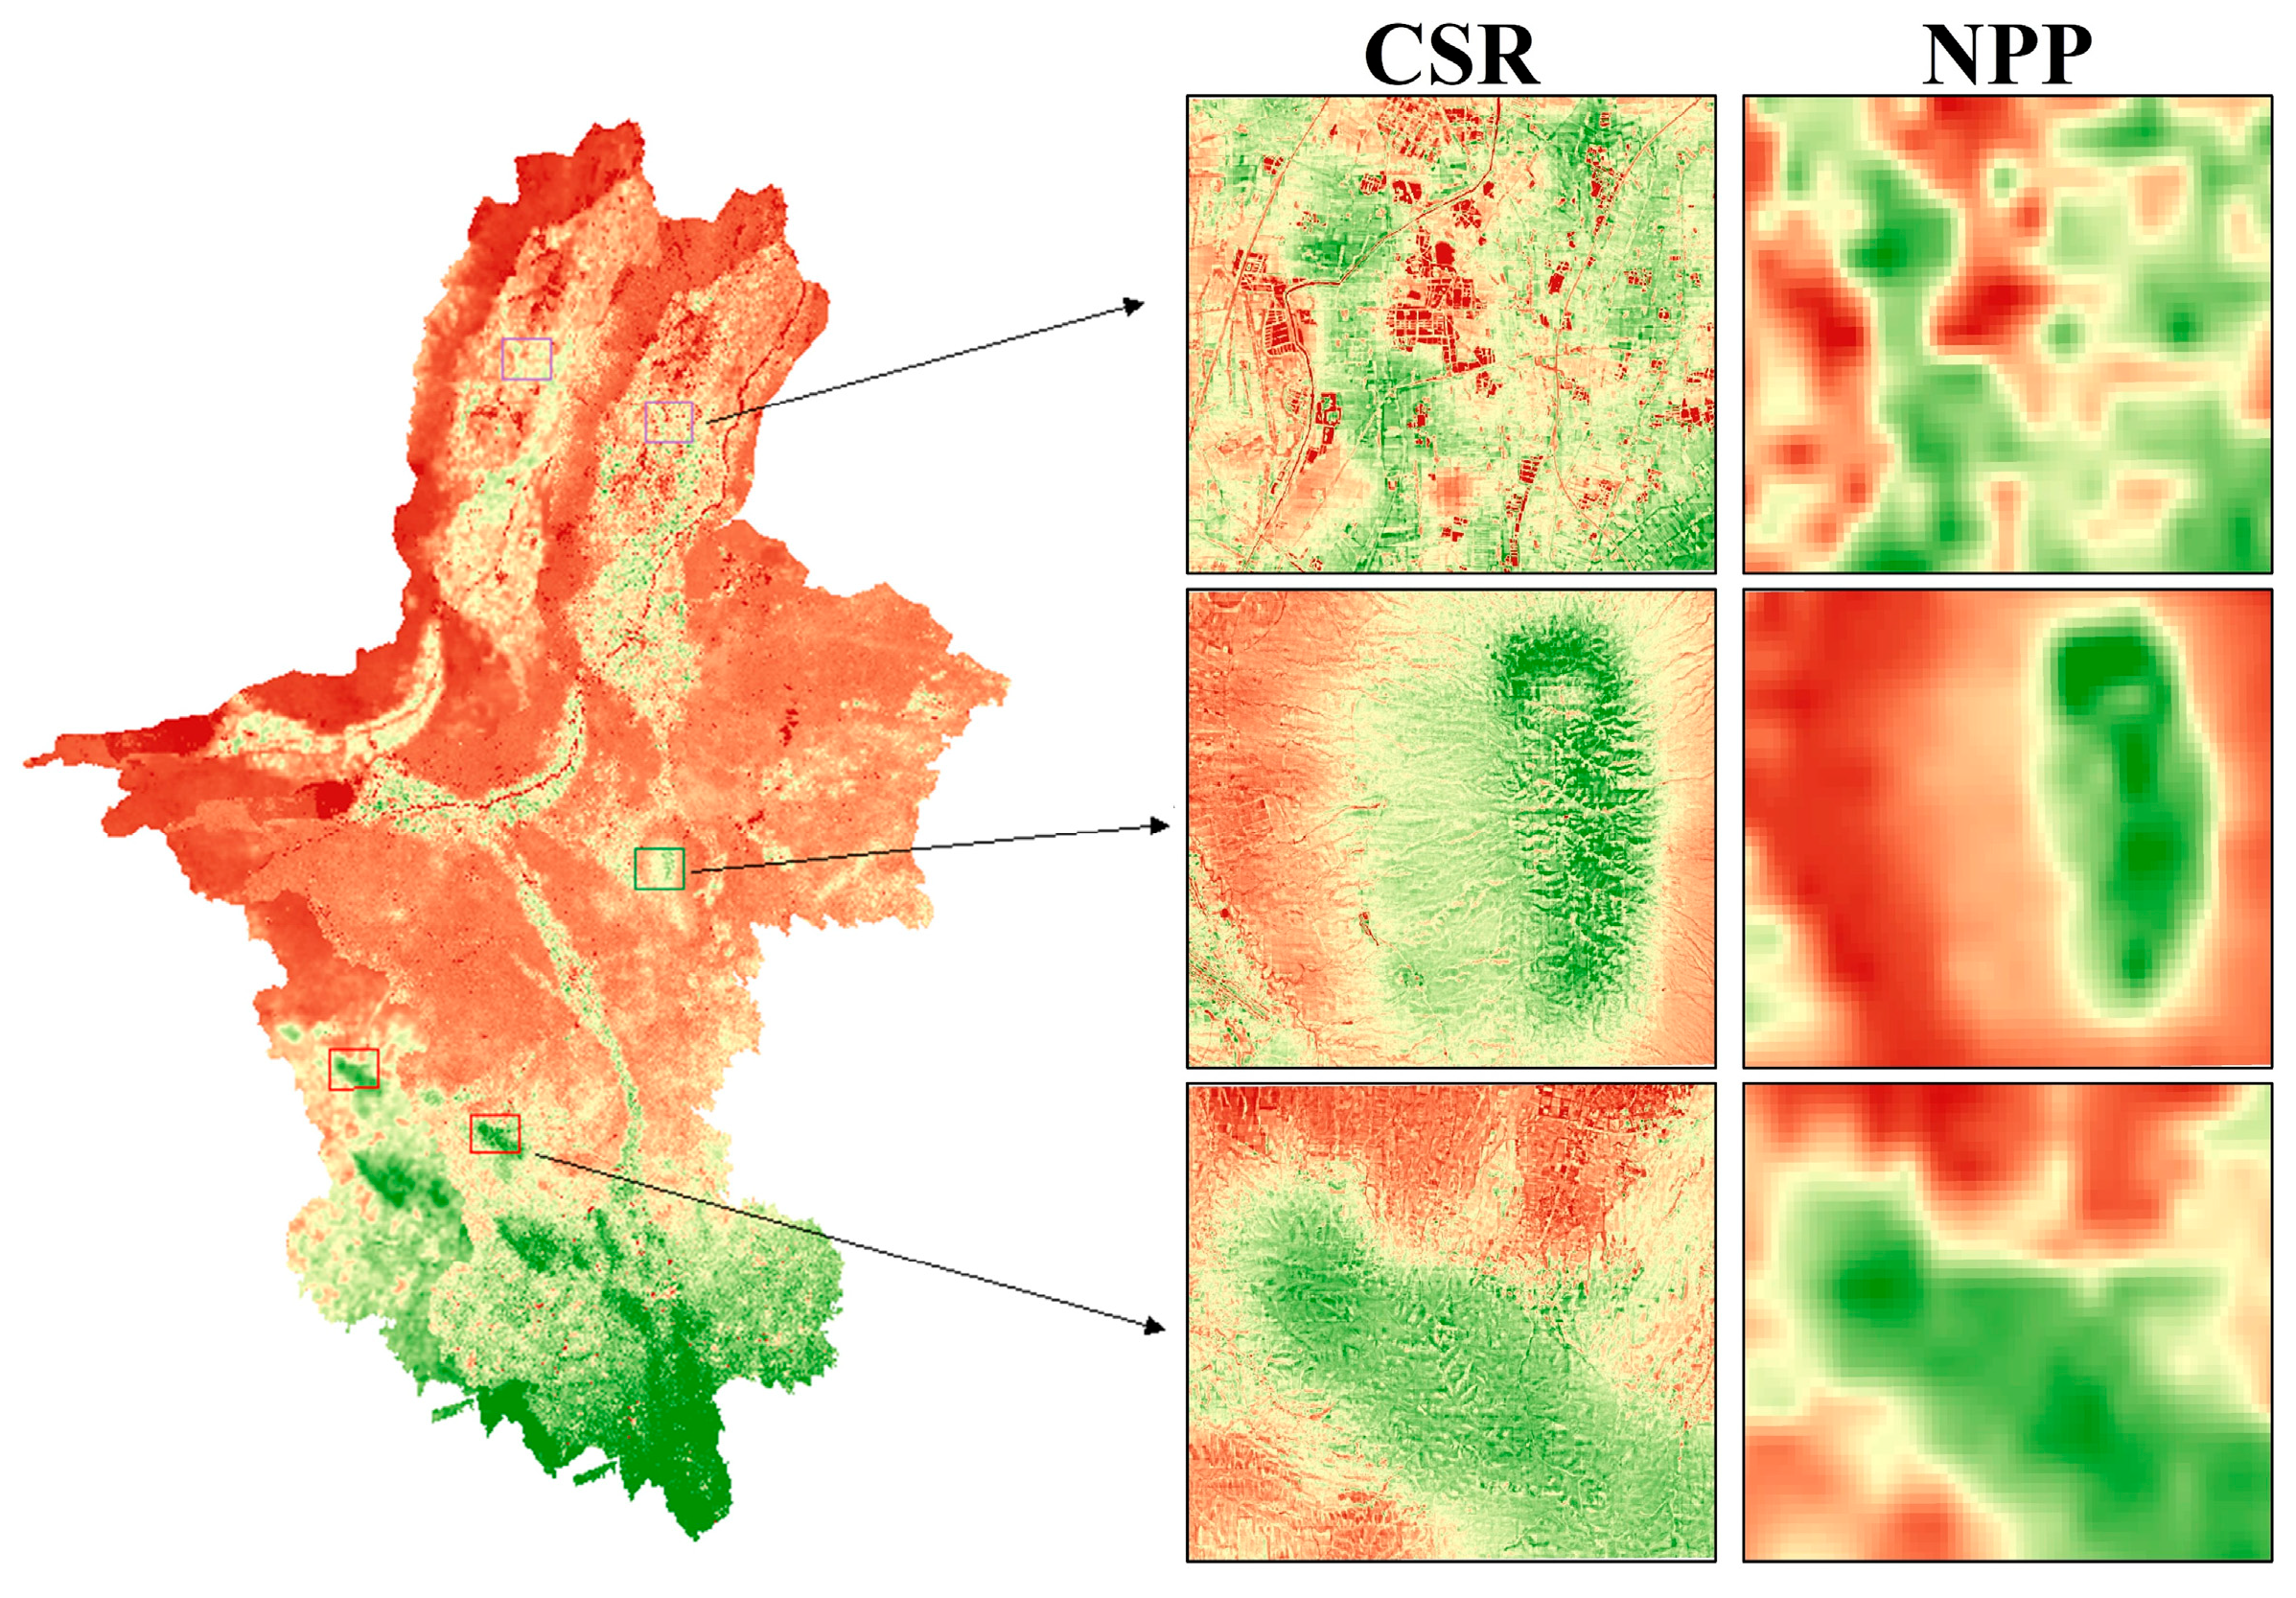
This study estimates a 30 m high-resolution CSR dataset for the Ningxia region and compares it with the net primary productivity (NPP) from the MODIS product MOD17A3HGF(V006), as shown in Figure 10. This comparison reveals the impact of different remote sensing data sources and resolutions on CSR estimation results. As shown in the figure, the 30 m resolution CSR data provide a higher level of spatial detail, offering the better capture of small-scale changes in the carbon sequestration process. This high resolution is particularly important for areas with a complex terrain and diverse vegetation types, as it more accurately reflects the characteristics of local ecosystems. While the 500 m resolution NPP has advantages in terms of the coverage and data acquisition frequency, its lower resolution may fail to capture micro-scale changes within the region, leading to reduced accuracy in carbon sequestration estimation. In conclusion, future research could consider combining both approaches to leverage their respective advantages, improving the accuracy and timeliness of carbon sequestration estimates and providing more comprehensive support for ecosystem management.
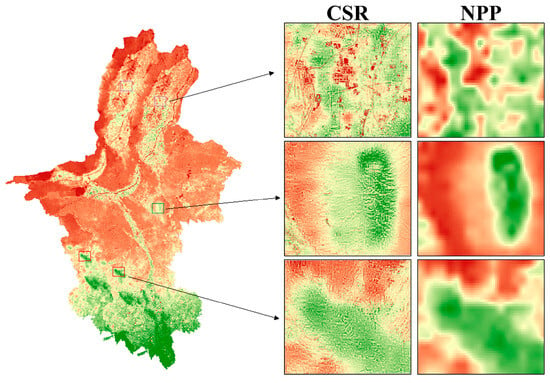
Figure 10.
Comparison of Ningxia CSR dataset with details from other MODIS products.
4.3. Spatial Heterogeneity of CSR in Ningxia and Its Driving Factors
In recent years, Ningxia has implemented large-scale ecological conservation projects such as reforestation, grassland restoration, and protective farming practices, significantly increasing the vegetation coverage and enhancing the CSR function of the ecosystem [42]. The research results indicate that the CSR in Ningxia shows clear spatial heterogeneity, particularly a decreasing trend from south to north [4], which is closely related to regional precipitation, vegetation coverage, and soil fertility. Specifically, the CSR benefits in the southern, more humid regions are significantly higher than those in the northern, arid areas. Precipitation is a crucial climatic factor affecting the CSR, as the higher rainfall in the southern regions promotes plant growth and biomass accumulation, thereby enhancing the carbon storage capacity [43]. At the same time, the increase in vegetation coverage directly improves the soil’s carbon storage capacity, creating a positive CSR effect [44].
Additionally, soil fertility is a key factor influencing the CSR’s spatial heterogeneity [45]. In areas with good vegetation coverage, the soil fertility is typically higher, which aids in plant growth and carbon accumulation [46,47]. In contrast, in areas with poor or severely eroded soils, the CSR remains limited despite moderate precipitation, which further explains why the carbon sequestration capacity is lower in the northern arid regions.
Topographic factors also play an important role in the CSR. Areas with steeper slopes often experience severe soil erosion, leading to a decline in soil fertility and a reduction in the soil carbon storage capacity [48]. This topographic effect exacerbates the CSR differences between regions, suppressing the carbon sequestration capacity in certain areas. Therefore, the combined effects of the climate, topography, and vegetation indices contribute to the spatial heterogeneity of the CSR in Ningxia. Future research could further explore the interactions between these factors to gain a more comprehensive understanding of the driving mechanisms behind the regional carbon sequestration capacity. This will provide more effective management strategies to enhance the regional CSR capacity and promote the sustainable development of ecosystems. By integrating data from climate, vegetation, soil, and topography, targeted measures can be developed to better promote ecological restoration and the CSR in Ningxia.
5. Conclusions
This study, based on ground observation data and multimodal datasets, employs the EXT optimal machine learning model to invert a 30m resolution VTCD and SOCD dataset for Ningxia from 2000 to 2023. It further evaluates the spatiotemporal distribution characteristics of carbon sequestration rates (CSR) from 2001 to 2023 and reveals the associated influencing factors. The results indicate that:
- (1)
- During 2001–2023, the CSR of Ningxia’s ecosystems exhibited a spatial distribution characterized by higher values in the south and lower values in the north. The mean CSR was 21.95 gC·m⁻2, with an overall fluctuating upward trend and a growth rate of 0.53 gC·m⁻2·a⁻1.
- (2)
- The CSR means significantly differ across different ecological regions. The Liupan Mountain water erosion area had the highest carbon sequestration capacity with a mean of 46.51 gC·m⁻2, while the Helan Mountain water erosion zone had the lowest CSR mean of 11.34 gC·m⁻2. The carbon sequestration rate in the Water Erosion Area of Loess Hilly and Gully Residual Tableland showed the most significant increase, with an annual growth rate of 1.16 gC·m⁻2·a⁻1.
- (3)
- For land use types with unchanged coverage, the carbon sequestration capacity is ranked as forest > cropland > grassland > barren, while the enhancement capacity is ranked as cropland > forest > grassland > barren. In terms of land-use change types, the CSR ranking is as follows: G-F > C-Fg > B-Fg. The enhancement capacity ranking is C-Fg > G-F > B-Fg.
Compared to grassland, cropland, and barren land, the transitions of G-F, C-Fg, and B-Fg can enhance carbon sequestration capacity by 42.9%, 9.2%, and 34.6%, respectively.
- (4)
- Among the individual influencing factors, the NDVI is the primary driver of the spatiotemporal dynamics of the CSR in Ningxia’s ecosystems. However, the two-factor interaction between the EVI and Bulk Density provides a more significant explanatory power for the CSR.
This study demonstrates that ecological restoration projects such as returning farmland to forest (grassland) and conservation tillage play a significant role in enhancing the regional carbon sequestration capacity. Future carbon-neutral policies for Ningxia should prioritize the implementation of vegetation restoration measures and further optimize the design and management of restoration projects across different ecological regions to maximize their carbon sequestration benefits.
Author Contributions
Conceptualization, Y.Z. and Z.W.; methodology, Y.Z. and C.C.; software, L.M. and C.C.; validation, H.H., Y.Z., and C.C.; formal analysis, Y.Z.; investigation, Y.Z. and C.C.; resources, Z.W.; data curation, H.H. and L.M.; writing—original draft preparation, Y.Z.; writing—review and editing, Z.W.; visualization, Y.Z.; supervision, Z.W.; project administration, Z.W.; funding acquisition, Z.W. All authors have read and agreed to the published version of the manuscript.
Funding
This research was funded by the National Key Research and Development Program of China (2023YFC3209303), the Science Foundation for Young Elite Talents of YRCC (HQK-202307), and the Henan Provincial Natural Science Foundation (242300421254).
Data Availability Statement
The shared vegetation and soil carbon density data used in this manuscript are available at http://www.cnern.org.cn/data/meta?id=40579 (accessed on 16 May 2024). However, our measured data are not available in a raw form due to laboratory policy or confidentiality agreements. We have fully described the experimental design, analyses, and results, as well as the process of the data analysis and processing. If editors and reviewers have questions about specific data, we will endeavor to provide more detailed explanations and descriptions. Readers interested in further information may contact the corresponding author. All data used in this thesis are publicly available through the websites provided in the text.
Conflicts of Interest
The authors declare no conflicts of interest.
References
- Lv, Y.; Zhang, L.; Li, P.; He, H.; Ren, X.; Zhang, M. Ecological Restoration Projects Enhanced Terrestrial Carbon Sequestration in the Karst Region of Southwest China. Front. Ecol. Evol. 2023, 11, 1179608. [Google Scholar] [CrossRef]
- Bu, X.; Cui, D.; Dong, S.; Mi, W.; Li, Y.; Feng, Y. Effects of Wetland Restoration and Conservation Projects on Soil Carbon Sequestration in the Ningxia Basin of the Yellow River in China from 2000 to 2015. Sustainability 2020, 12, 10284. [Google Scholar] [CrossRef]
- Niu, Y.; Li, Y.; Liu, W.; Wang, X.; Chen, Y. Effects of Environmental Factors on the Carbon Fluxes of Semi-Fixed Sandy Land Recovering from Degradation. Front. Ecol. Evol. 2023, 11, 1178660. [Google Scholar] [CrossRef]
- Wang, M.; Hu, Z.; Wang, X.; Li, X.; Wang, Y.; Liu, H.; Han, C.; Cai, J.; Zhao, W. Spatio-Temporal Variation of Carbon Sources and Sinks in the Loess Plateau under Different Climatic Conditions and Land Use Types. Forests 2023, 14, 1640. [Google Scholar] [CrossRef]
- Khodakarami, L.; Pourmanafi, S.; Soffianian, A.R.; Lotfi, A. Modeling spatial distribution of carbon sequestration, CO2 absorption, and O2 production in an urban area: Integrating ground-based data, remote sensing technique, and GWR model. Earth Space Sci. 2022, 9, e2022EA002261. [Google Scholar] [CrossRef]
- Misiura, K.; Dąbrowska-Zielińska, K.; Gurdak, R.; Grzybowski, P.; Kluczek, M. CO2 Modelling from Eddy Covariance Measurements for Biebrza Wetlands. In Proceedings of the IEEE International Geoscience and Remote Sensing Symposium (IGARSS), Brussels, Belgium, 11–16 July 2021; p. 9554112. [Google Scholar] [CrossRef]
- Goulden, M.L.; Munger, J.W.; Fan, S.M.; Daube, B.C.; Wofsy, S.C. Measurements of carbon sequestration by long-term eddy covariance: Methods and a critical evaluation of accuracy. Glob. Chang. Biol. 1996, 2, 169–182. [Google Scholar] [CrossRef]
- Nathaniel, J.; Klein, L.; Watson, C.; Nyirjesy, G.; Albrecht, C. Above Ground Carbon Biomass Estimate with Physics-Informed Deep Network. In Proceedings of the IGARSS 2023—2023 IEEE International Geoscience and Remote Sensing Symposium, Pasadena, CA, USA, 16–21 July 2023. [Google Scholar] [CrossRef]
- Abbas, S.; Wong, M.S.; Wu, J.; Shahzad, N.; Muhammad Irteza, S. Approaches of Satellite Remote Sensing for the Assessment of Above-Ground Biomass across Tropical Forests: Pan-tropical to National Scales. Remote Sens. 2020, 12, 3351. [Google Scholar] [CrossRef]
- Tripathi, S.; Setia, R.; Ghosh, T.; Uniyal, P.; Kumar, A. Evaluation of Spectral Indices to Monitor the Vegetation Species in a Sanctuary for Carbon Sequestration in Soils Using Landsat Satellite Remote Sensing. Int. J. Environ. Earth Sci. 2022, 10, 357–365. [Google Scholar] [CrossRef]
- Feng, X.; Fu, B.; Lu, N.; Zeng, Y.; Wu, B. How Ecological Restoration Alters Ecosystem Services: An Analysis of Carbon Sequestration in China’s Loess Plateau. Sci. Rep. 2013, 3, 2846. [Google Scholar] [CrossRef] [PubMed]
- Huang, L.; Liu, J.; Shao, Q.; Xu, X. Carbon Sequestration by Forestation across China: Past, Present, and Future. Renew. Sustain. Energy Rev. 2012, 16, 1291–1299. [Google Scholar] [CrossRef]
- Sandi, S.; Rodriguez, J.; Saco, P.; Saintilan, N.; Riccardi, G. Accelerated Sea-Level Rise Limits Vegetation Capacity to Sequester Soil Carbon in Coastal Wetlands. Earth’s Future 2021, 9, e2020EF001901. [Google Scholar] [CrossRef]
- Aubrey, D.; Blake, J.; Zarnoch, S. From Farms to Forests: Landscape Carbon Balance after 50 Years of Afforestation, Harvesting, and Prescribed Fire. Forests 2019, 10, 760. [Google Scholar] [CrossRef]
- Lal, R. Food Security in a Changing Climate. Ecohydrol. Hydrobiol. 2013, 13, 8–21. [Google Scholar] [CrossRef]
- Mekonnen, Z.; Riley, W.J. Climate Change Will Increase Biomass Proportion of Global Forest Carbon Stocks. Geophys. Res. Lett. 2023, 50, e2023GL104612. [Google Scholar] [CrossRef]
- Moisa, M.B.; Dejene, I.N.; Deribew, K.T.; Gurmessa, M.M.; Gemeda, D.O. Impacts of Forest Cover Change on Carbon Stock, Carbon Emission and Land Surface Temperature in Sor Watershed, Baro Akobo Basin, Western Ethiopia. J. Water Clim. Chang. 2023, 14, 323–334. [Google Scholar] [CrossRef]
- Patton, N.; Lohse, K.; Seyfried, M.; Godsey, S.; Parsons, S. Topographic Controls of Soil Organic Carbon on Soil-Mantled Landscapes. Sci. Rep. 2019, 9, 6397. [Google Scholar] [CrossRef] [PubMed]
- Zhang, M.; He, H.; Zhang, L.; Ren, X.; Wu, X.; Qin, K.; Lv, Y.; Chang, Q.; Xu, Q.; Liu, W.; et al. Increased Forest Coverage Will Induce More Carbon Fixation in Vegetation than in Soil during 2015–2060 in China Based on CMIP6. Environ. Res. Lett. 2022, 17, 105002. [Google Scholar] [CrossRef]
- Sharma, S.; Jain, P.K.; Soloman, P. Carbon Storage Potential of Soil in Diverse Terrestrial Ecosystems. Nature Environ. Pollut. Technol. 2023, 22, 567–578. [Google Scholar] [CrossRef]
- Xu, L.; He, N.; Yu, G. A Dataset of Carbon Density in Chinese Terrestrial Ecosystems (2010s). Sci. Data Bank 2019, 4. [Google Scholar] [CrossRef]
- Beets, P.N.; Kimberley, M.O.; Oliver, G.R.; Pearce, S.H.; Graham, J.D.; Brandon, A. Allometric Equations for Estimating Carbon Stocks in Natural Forest in New Zealand. Forests 2012, 3, 818–839. [Google Scholar] [CrossRef]
- Priya, M.V.; Kalpana, R.; Pazhanivelan, S.; Kumaraperumal, R.; Ragunath, K.; Vanitha, G.; Nihar, A.; Prajesh, P.; Vasumathi, V. Monitoring Vegetation Dynamics Using Multi-Temporal Normalized Difference Vegetation Index (NDVI) and Enhanced Vegetation Index (EVI) Images of Tamil Nadu. J. Appl. Nat. Sci. 2023, 15. [Google Scholar] [CrossRef]
- Camps-Valls, G.; Campos-Taberner, M.; Moreno-Martínez, Á.; Walther, S.; Duveiller, G.; Cescatti, A.; Mahecha, M.; Muñoz-Marí, J.; García-Haro, F.J.; Guanter, L.; et al. Generalization of Vegetation Indices for Monitoring the Terrestrial Biosphere. In Proceedings of the EGU General Assembly Conference Abstracts, Vienna, Austria, 19–30 April 2021. [Google Scholar] [CrossRef]
- Kumar, G.K.; Babu, M.; Mani, A.; Luther, M.; Rao, V. Spatio-Temporal Variation of Vegetation in Godavari Eastern Delta. Curr. J. Appl. Sci. Technol. 2019, 38, 1–13. [Google Scholar] [CrossRef]
- Nejad, M.F.; Zoratipour, A. Assessment of LST and NDMI Indices Using MODIS and Landsat Images in Karun Riparian Forest. J. Forest Sci. 2019, 65, 59–67. [Google Scholar] [CrossRef]
- Lu, Y.; Li, X.; Xin, L.; Song, H.; Wang, X. Mapping the Terraces on the Loess Plateau Based on a Deep Learning-Based Model at 1.89 m Resolution. Sci. Data 2023, 10, 115. [Google Scholar] [CrossRef]
- Wang, Z.; Cheng, M.; Zhang, Y.; Peng, S.; Feng, F. Attributing trend in naturalized streamflow to temporally explicit vegetation change and climate variation in the Yellow River basin of China. Hydrol. Earth Syst. Sci. 2022, 26, 5291–5314. [Google Scholar] [CrossRef]
- Liu, S.; Bond-Lamberty, B.; Hicke, J.A.; Vargas, R.; Zhao, S.; Chen, J.; Edburg, S.L.; Hu, Y.; Liu, J.; McGuir, A.D.; et al. Simulating the Impacts of Disturbances on Forest Carbon Cycling in North America: Processes, Data, Models, and Challenges. J. Geophys. Res. Biogeosci. 2011, 116, G00K08. [Google Scholar] [CrossRef]
- de Blécourt, M.; Corre, M.D.; Paudel, E.; Harrison, R.D.; Brumme, R.; Veldkamp, E. Spatial Variability in Soil Organic Carbon in a Tropical Montane Landscape: Associations between Soil Organic Carbon and Land Use, Soil Properties, Vegetation, and Topography Vary Across Plot to Landscape Scales. Soil 2017, 3, 123–137. [Google Scholar] [CrossRef]
- Belgiu, M.; Drăguţ, L. Random Forest in Remote Sensing: A Review of Applications and Future Directions. ISPRS J. Photogramm. Remote Sens. 2016, 114, 24–31. [Google Scholar] [CrossRef]
- Breiman, L. Random Forests. Mach. Learn. 2001, 45, 5–32. [Google Scholar] [CrossRef]
- Trichakis, I.C.; Nikolos, I.K.; Karatzas, G.P. Artificial Neural Network (ANN) Based Modeling for Karstic Groundwater Level Simulation. Water Resour. Manag. 2011, 25, 1143–1152. Available online: https://link.springer.com/article/10.1007/s11269-010-9628-6 (accessed on 5 November 2023). [CrossRef]
- Pisner, D.A.; Schnyer, D.M. Support Vector Machine. In Machine Learning; Academic Press: Cambridge, MA, USA, 2020; pp. 101–121. [Google Scholar] [CrossRef]
- Fan, J.; Ma, X.; Wu, L.; Zhang, F.; Yu, X.; Zeng, W. Light Gradient Boosting Machine: An Efficient Soft Computing Model for Estimating Daily Reference Evapotranspiration with Local and External Meteorological Data. Agric. Water Manag. 2019, 225, 105758. [Google Scholar] [CrossRef]
- Shi, H.; Wang, P.; Zheng, J.; Deng, Y.; Zhuang, C.; Huang, F.; Xiao, R. A Comprehensive Framework for Identifying Contributing Factors of Soil Trace Metal Pollution Using Geodetector and Spatial. Sci. Total Environ. 2023, 857, 159636. [Google Scholar] [CrossRef]
- Yu, Z.; Ciais, P.; Piao, S.; Houghton, R.A.; Lu, C.; Tian, H. Forest Expansion Dominates China’s Land Carbon Sink Since 1980. Nature Commun. 2022, 13, 5374. [Google Scholar] [CrossRef] [PubMed]
- Padrón, R.S.; Gudmundsson, L.; Liu, L.; Humphrey, V.; Seneviratne, S. Drivers of Intermodel Uncertainty in Land Carbon Sink Projections. Biogeosciences 2022, 19, 5435–5452. [Google Scholar] [CrossRef]
- Scholze, M.; Kaminski, T.; Knorr, W.; Vossbeck, M.; Wu, M.; Ferrazzoli, P.; Kerr, Y.; Mialon, A.; Richaume, P.; Rodríguez-Fernández, N.; et al. Mean European Carbon Sink over 2010–2015 Estimated by Simultaneous Assimilation of Atmospheric CO2, Soil Moisture, and Vegetation Optical Depth. Geophys. Res. Lett. 2019, 46, 14169–14178. [Google Scholar] [CrossRef]
- Wang, Y.; Tian, X.; Chevallier, F.; Johnson, M.S.; Philip, S.; Baker, D.; Schuh, A.; Deng, F.; Zhang, X.; Zhang, L.; et al. Constraining China’s Land Carbon Sink from Emerging Satellite CO2 Observations: Progress and Challenges. Global Chang. Biol. 2022, 28, 4364–4382. [Google Scholar] [CrossRef]
- He, W.; Jiang, F.; Wu, M.; Ju, W.; Scholze, M.; Chen, Z.; Byrne, B.; Liu, J.; Wang, H.; Wang, J.; et al. China’s Terrestrial Carbon Sink over 2010–2015 Constrained by Satellite Observations of Atmospheric CO2 and Land Surface Variables. J. Geophys. Res. Biogeosciences 2022, 127, e2021JG006644. [Google Scholar] [CrossRef]
- Bu, X.; Dong, S.; Mi, W.; Li, F. Spatial-Temporal Change of Carbon Storage and Sink of Wetland Ecosystem in Arid Regions, Ningxia Plain. Atmos. Environ. 2019, 204, 89–101. [Google Scholar] [CrossRef]
- Wei, X.; Yang, J.; Luo, P.; Lin, L.; Lin, K.; Guan, J. Assessment of the Variation and Influencing Factors of Vegetation NPP and Carbon Sink Capacity under Different Natural Conditions. Ecol. Indic. 2022, 138, 108834. [Google Scholar] [CrossRef]
- Tu, H.; Jiapaer, G.; Yu, T.; Zhang, L.; Chen, B.; Lin, K.; Li, X. Effects of Land Cover Change on Vegetation Carbon Source/Sink in Arid Terrestrial Ecosystems of Northwest China, 2001–2018. Remote Sens. 2023, 15, 2471. [Google Scholar] [CrossRef]
- Srinivasarao, C.; Kundu, S.; Rakesh, S.; Lakshmi, C.S.; Kumar, G.R.; Manasa, R.; Somashekar, G.; Swamy, G.N.; Mrunalini, K.; Jayaraman, S.; et al. Managing Soil Organic Matter under Dryland Farming Systems for Climate Change Adaptation and Sustaining Agriculture Productivity. In Soil Organic Carbon and Feeding the Future; CRC Press: Boca Raton, FL, USA, 2021; pp. 219–251. [Google Scholar] [CrossRef]
- Ou, Y.; Rousseau, A.N.; Wang, L.; Yan, B. Spatio-Temporal Patterns of Soil Organic Carbon and pH in Relation to Environmental Factors—A Case Study of the Black Soil Region of Northeastern China. Agric. Ecosyst. Environ. 2017, 245, 22–31. [Google Scholar] [CrossRef]
- Nie, X.; Yang, L.; Li, F.; Xiong, F.; Li, C.; Zhou, G. Storage, Patterns and Controls of Soil Organic Carbon in the Alpine Shrubland in the Three Rivers Source Region on the Qinghai-Tibetan Plateau. Catena 2019, 178, 154–162. [Google Scholar] [CrossRef]
- Feyissa, A.; Raza, S.T.; Cheng, X. Soil Carbon Stabilization and Potential Stabilizing Mechanisms along Elevational Gradients in Alpine Forest and Grassland Ecosystems of Southwest China. Catena 2023, 229, 107210. [Google Scholar] [CrossRef]
Disclaimer/Publisher’s Note: The statements, opinions and data contained in all publications are solely those of the individual author(s) and contributor(s) and not of MDPI and/or the editor(s). MDPI and/or the editor(s) disclaim responsibility for any injury to people or property resulting from any ideas, methods, instructions or products referred to in the content. |
© 2025 by the authors. Licensee MDPI, Basel, Switzerland. This article is an open access article distributed under the terms and conditions of the Creative Commons Attribution (CC BY) license (https://creativecommons.org/licenses/by/4.0/).

