Article

Multidimensional Visual Preferences and Sustainable Management of Heritage Canal Waterfront Landscape Based on Panoramic Image Interpretation

1
College of Horticulture, Nanjing Agricultural University, Nanjing 211800, China
2
School of Architecture and Urban Planning, Beijing University of Civil Engineering and Architecture, Beijing 100044, China
3
School of Architecture, Tsinghua University, Beijing 100084, China
4
College of Arts, Tianjin University of Technology, Tianjin 300384, China
5
Graduate School of Creative Science and Engineering, Waseda University, Tokyo 169-8555, Japan
*
Authors to whom correspondence should be addressed.
Land 2025, 14(2), 220; https://doi.org/10.3390/land14020220
Submission received: 17 December 2024 / Revised: 16 January 2025 / Accepted: 20 January 2025 / Published: 22 January 2025

Abstract

:
As an important type of linear cultural heritage and a waterfront landscape that integrates both artificial and natural elements, heritage canals provide the public with a multidimensional perceptual experience encompassing aesthetics, culture, and nature. There remains a lack of refined, micro-level studies on heritage canal landscapes from a multidimensional perspective of visual preference. This study focuses on a typical segment of the Grand Canal in China, specifically the ancient canal section in Yangzhou. We employed SegFormer image semantic segmentation techniques to interpret features from 150 panoramic images, quantitatively identifying the waterfront environmental characteristics of the heritage canal. Four perceptual dimensions were constructed: aesthetic preference, cultural preference, natural preference, and hydrophilic preference. Through a questionnaire survey and various statistical analyses, we revealed the relationships between visual preferences for the waterfront landscape of heritage canals and environmental characteristics. The main findings of the study include the following: (1) Aesthetic preference is positively correlated with cultural, natural, and hydrophilic preferences, while natural preference shows a negative correlation with cultural and hydrophilic preferences. (2) Aesthetic preference is influenced by a combination of blue-green natural elements and artificial factors. Natural preference is primarily affected by increased vegetation visibility, cultural preference is associated with a higher proportion of cultural facilities and high-quality pavements, and hydrophilic preference is linked to larger water surface areas, fewer barriers, and better water quality. (3) There are spatial differences in canal waterfront landscape preferences across different urban areas, with the old city exhibiting higher aesthetic, cultural, and hydrophilic preferences than the new city and suburban areas. Finally, this study proposes strategies for optimising and enhancing the quality of waterfront landscapes of heritage canals, aiming to provide sustainable practical guidance for the future planning and management of these heritage sites.

1. Introduction

1.1. Heritage Canals: Cultural Landscapes Integrating Nature and Artifice

Rivers are often the most vibrant places in a city, and waterfront landscapes can offer enriching experiences. Therefore, it is essential to consider how people perceive, value, and interact with river landscapes in various ways [1,2]. Heritage canals, as artificial waterways, possess more historical value and cultural appeal compared to natural rivers, representing a unique category within the world heritage lists. The 1994 Expert Meeting on Heritage Canals in Canada emphasised that canals are not only artificial waterways but also linear cultural landscapes of outstanding universal value. In 2005, the “Operational Guidelines for the Implementation of the World Heritage Convention” classified heritage canals, heritage routes, cultural landscapes, historic towns, and town centres as special types of applications for world heritage status [3]. For instance, many of the world’s most iconic canals are closely tied to national politics and economies. Strategic canals such as the Suez Canal in Egypt and the Panama Canal [4] play critical roles in ensuring international transportation security. Meanwhile, research on canal landscapes often focuses on the evolution and functionality of historical landscapes [5]. Examples include studies on the rise and decline of the Birmingham canal system in the UK and the Amsterdam canal network in the Netherlands, along with their driving factors [6,7]. Additionally, research has explored the recreational, tourism, and landscape features of canals in cities such as New York and Prague [8,9,10]. However, there has been limited exploration of how individuals perceive and interact with regenerated urban canal landscapes in increasingly diverse urban societies [11].
The Grand Canal dates back to 486 BCE during the Spring and Autumn period and has undergone significant expansion and reconstruction during subsequent dynasties. The Grand Canal of China was inscribed as a UNESCO World Cultural Heritage Site in 2014. As a vital transportation artery connecting the north and south of ancient China, it stretches 1794 km, which represents large-scale living cultural heritage with significant temporal, spatial, and technological depth, playing a crucial role in the social, economic, and cultural development of cities along its route [12]. However, due to rapid urbanisation and tourism development in China, the canal faces challenges such as environmental degradation and insufficient conservation and utilisation. Current research on heritage canals often focuses on their inherent value [13], leaning towards large-scale land use and coverage analysis [14,15]. Studies examining visual perception preferences at the micro-, human scale of waterfront landscapes are relatively rare, leaving a gap in understanding how to shape culturally rich, high-quality canal landscapes, which hampers effective planning and management.

1.2. Literature Review on Multidimensional Landscape Visual Preferences

Landscape preference is a crucial aspect of environmental perception, reflecting a comprehensive result of emotional and cognitive responses to landscapes. Understanding landscape preferences helps explore which landscapes are most favoured based on users’ holistic evaluations [16]. In evaluations of environmental perception and aesthetic satisfaction in South Korea, visual factors have an approximately 76% influence [17]. In another earlier study in the United States, it was proposed that 80% of human sensory experiences depend on visual stimuli [18]. Research on Landscape Visual Aesthetic Quality (LVAQ) originated in the 1960s in the United States and plays a significant role in environmental planning and management [19]. The relationship between environmental quality and landscape preference has been widely emphasised [20]. Numerous studies have confirmed the relationship between landscape biophysical characteristics (LBCs) and visual perception, particularly scenic beauty (SBE) [21,22]. Researchers have primarily focused on streetscapes, greenways, and waterfront landscapes. For instance, Wenping Liu investigated the visual perception characteristics of ten greenway types in Wuhan using streetscape and remote sensing images [23]; Li Xin studied urban channelized riverfront greenways, establishing a batch predictive model for urban river landscape quality [24]; and Luo explored the relationship between the landscape characteristics of blue space (e.g., water quality, aquatic plant populations, accessibility) and aesthetic benefits [25]. It is important to note that street landscapes and waterfront landscapes are not mutually exclusive. In some sections of the river, street views also incorporate canal landscapes (i.e., the street directly abuts the canal), while in sections with wider waterfront green spaces, the street space and waterfront landscape are separate. While research on street landscapes is relatively well established, studies specifically focusing on waterfront landscapes, particularly the visual landscapes of heritage canals, remain limited.
Research on environmental visual perception preferences has largely concentrated on aesthetic effects. Aesthetics are considered an important factor in cultural ecosystem services (CESs), providing aesthetic benefits that enhance living environments and subsequently affect public health and well-being [26,27]. Previous studies have primarily focused on the aesthetic qualities of natural rivers or general urban rivers [24]. However, given that heritage canals are waterfront spaces closely integrating artificial and natural elements, studies on landscape visual preferences should extend beyond aesthetics to include cultural, natural, and hydrophilic experiences [22,28]. Furthermore, some research indicates that the public’s positive attitudes toward the environment can influence their willingness to revisit and use these spaces. Exploring landscape preferences from multiple perceptual dimensions can reveal diverse public cognitions and needs [29], which is valuable for promoting the multifunctional use of heritage canal waterfronts [30].

1.3. Panoramic Image Interpretation Technology Based on Deep Learning

Landscape visual preference research has largely utilised landscape photographs as substitutes for real-world landscapes [31,32]. Studies show that when walking, people observe their surroundings from multiple angles; however, traditional photographs have limited perspectives and fail to reflect the true aesthetic qualities of landscapes or provide complete three-dimensional spatial information [33]. With the maturation and application of technologies such as panoramic photography and virtual reality (VR), 360° panoramic scenes offer a more authentic experience, addressing the spatial limitations of two-dimensional images [34]. This advancement has positively impacted the assessment of street and greenway landscape quality [35,36,37]. Currently, Google Street View data are commonly used for image segmentation processing. However, street views and waterfront landscapes differ in several respects; large-scale streetscape photographs are challenging to apply to waterfront landscape studies, while making use of 360° panoramic photography for capturing riverfront landscapes is an effective means of accurately representing the surrounding environment [38].
On the other hand, with the proliferation of big data, machine learning, and deep learning technologies [39], deep semantic segmentation models based on convolutional neural networks are increasingly employed to extract identifiable features from images for precise element segmentation, aiding in the assessment of specific landscape environmental characteristics’ attractiveness [40]. Deep learning algorithms address limitations in traditional image processing methods, such as small sample sizes and low processing efficiency, by leveraging the value of vast datasets to ensure data completeness and objectivity [41]. To obtain detailed visual element information, previous studies have extensively used semantic segmentation models such as SegNet [36], PSPNet [42], and UNet [43] to estimate pixel-level category information for visual elements (e.g., buildings, green spaces, sky); in particular, SegFormer comprises a novel hierarchically structured Transformer encoder which outputs multiscale features and avoids complex decoders, so it sets a new state-of-the-art in terms of accuracy and robustness, reaching significantly better performance and efficiency than its previous counterparts [44]. However, few studies have specifically targeted the identification of unique waterfront landscape elements in heritage canals (e.g., ancient architecture, boats, barriers), necessitating more precise segmentation calculations combined with manual corrections.

1.4. Research Framework

Various statistical analysis methods can be utilised to explore the relationship between landscape visual preferences and environmental characteristics. Many studies indicate that, in general, artificial objects elicit negative perceptions, whereas natural environments (green spaces, waterbodies) provoke positive perceptions [45]. However, the visual preference patterns for blue-green spaces, such as heritage canals, which integrate artificial and natural elements with strong cultural attributes, have not been thoroughly investigated. Several questions warrant further research: Is there a close relationship between aesthetic preference and cultural, natural, and hydrophilic preferences in heritage canal waterfront landscapes? What are the correlations between the four types of landscape preferences and environmental characteristics, and what environmental factors explain landscape preferences? Are there spatial differences in landscape preferences among river sections in different urban locations? This paper proposes a framework based on panoramic image interpretation. Regarding the research subject, the focus has shifted from general urban rivers to heritage canals. In terms of the research framework, we avoided a singular aesthetic evaluation and established a comprehensive, multidimensional visual preference system. Furthermore, we explored a method for interpreting the landscape characteristics of heritage canals based on panoramic image capturing and Segformer image semantic segmentation technology. The specific research objectives and implementation framework are as follows (Figure 1):
(1)
Acquire an objective description of the heritage canal waterfront landscape through continuous, fixed-point panoramic imaging and use image semantic segmentation models to calculate the proportions of various environmental elements and characteristics.
(2)
Develop a questionnaire on landscape visual preferences encompassing four perceptual dimensions—aesthetic preference (AP), cultural preference (CP), natural preference (NP), and hydrophilic preference (HP)—to measure public perceptions of the heritage canal waterfront landscape.
(3)
Analyse the relationship between the objective environmental characteristics of the heritage canal and landscape visual preferences through a correlation analysis and stepwise multiple regression analysis, identifying environmental elements that explain perceptual results, and compare spatial differences in landscape preferences across different urban canal sections using a non-parametric one-way ANOVA and elucidate the underlying reasons.
(4)
Propose strategies for optimising and enhancing the quality of the waterfront landscape of heritage canals, effectively guiding the planning, design, and sustainable management of the heritage canal environment, improving landscape outcomes, and promoting the multifaceted value of heritage canals.

2. Materials and Methods
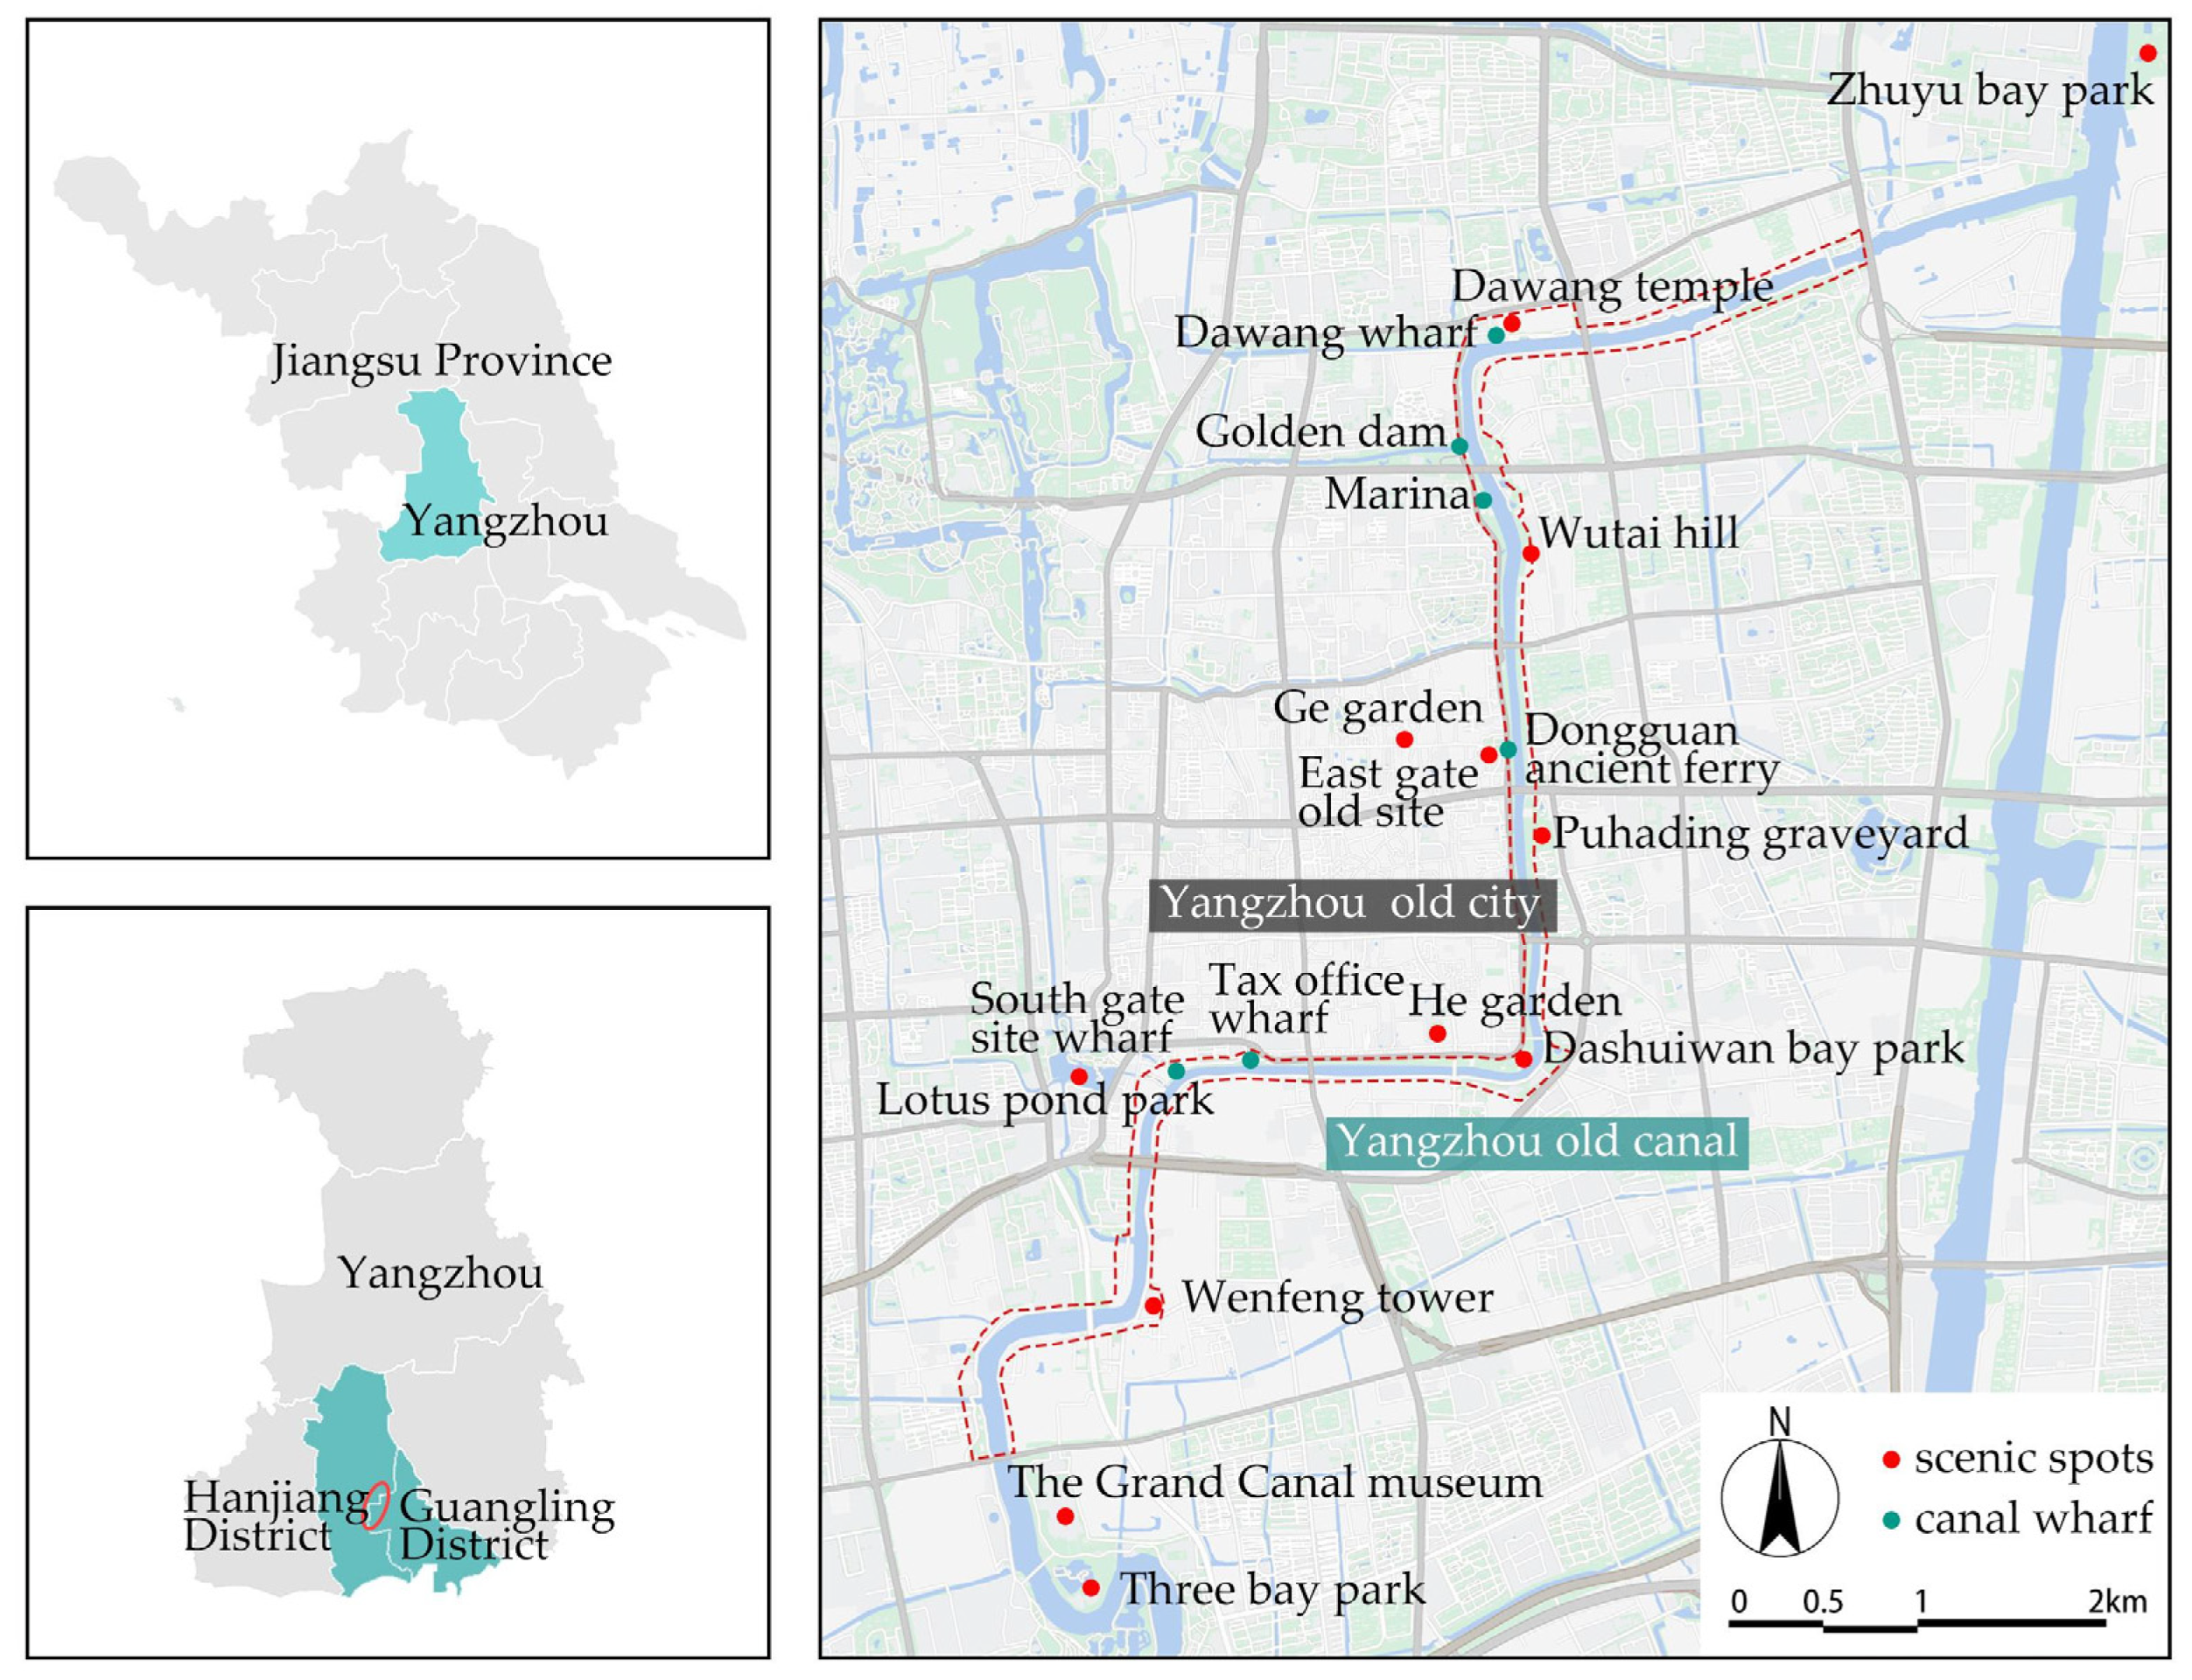
2.1. Study Area

Yangzhou is located in central Jiangsu Province, on the northern bank of the lower Yangtze River. It is the starting point of the Grand Canal, originating from the “Han Canal” excavated by King Fu Chai of Wu in 486 BC. Over more than 2500 years, it has developed into the renowned Yangzhou Canal that runs through the city [46]. Throughout history, the Grand Canal has been a source of inspiration for poets and painters, reflecting its profound cultural and humanistic value. For example, the scenic beauty of the Yangzhou section of the canal has been immortalised in classical Chinese poetry, such as Spring River in the Flower Moon Night by the Tang poet Zhang Ruoxu and Mooring at Guazhou by the Song poet Wang Anshi. Similarly, the canal served as an important subject in traditional Chinese painting. These artistic works highlight the cultural richness and historical significance of the canal. The ancient canal in Yangzhou has witnessed the prosperity and splendour of ancient Chinese canal civilisation, providing valuable historical experience and cultural heritage for contemporary urban development [47]. In modern times, the canal has no longer been the primary channel for material transportation, but its rich historical and cultural connotations, along with its beautiful natural scenery, continue to attract numerous tourists. The government and various sectors of society are increasingly focusing on the conservation and utilisation of the ancient canal, showcasing it as an important urban symbol. Simultaneously, the waterfront greenway serves as a venue for fitness activities and an open urban public space, fulfilling diverse service functions and heritage values.
This study selects the core section of the ancient canal in Yangzhou, from Sanwan to Zhuyuwan, covering a length of 10.2 km, with an average width of 63 m (Figure 2). Located in the northeast of the city, Zhuyuwan serves as the ancient gateway of Yangzhou, while Sanwan in the south is a unique hydraulic structure that has now been developed into a canal park. Many famous historical and cultural relics remain today, such as ancient docks, sluices, and post stations, which have become significant attractions along the ancient canal. This segment of the canal passes through suburban areas, the old city, and the new city, resulting in differences in waterfront landscape characteristics and perceptual preferences due to variations in urban regional styles and built environments. Therefore, using the ancient canal in Yangzhou as a sample is conventional and representative, offering insights applicable to similar canal cities along the Grand Canal.

2.2. Research Methods

2.2.1. Data Collection: Panoramic Image Capture

The panoramic images used in this study were captured with an Insta360 X3 camera, aimed at comprehensively documenting and reflecting the entire landscape surrounding the shooting point. The shooting locations were selected starting from East Development Road (Nan Sanwan Bridge) and ending at North Canal Road (Fu Chai Bridge). The landscapes on both the left and right banks exhibit certain similarities. However, due to the higher connectivity of the road network on the left bank (while the right bank is discontinuous and some green spaces are inaccessible), the entire photographic process was carried out on the left bank of the river. A team of three researchers conducted the full-line photography from 12 July to 13 July 2023, between 9:00 a.m. and 5:00 p.m. These dates were chosen as summer vegetation is lusher, and favourable weather conditions help accurately discern landscape elements. The camera was maintained at human eye level, approximately 170 cm above the ground, facing the direction of the canal, and capturing one image every 50 m. A total of 208 panoramic images were obtained. After excluding images that did not meet our requirements (e.g., bridge underpasses, significant human interference) and those with high visual redundancy (58 images), a total of 150 standard experimental photographs were retained. All images were converted into 720° panoramic images using Insta360 Studio 2020 software.

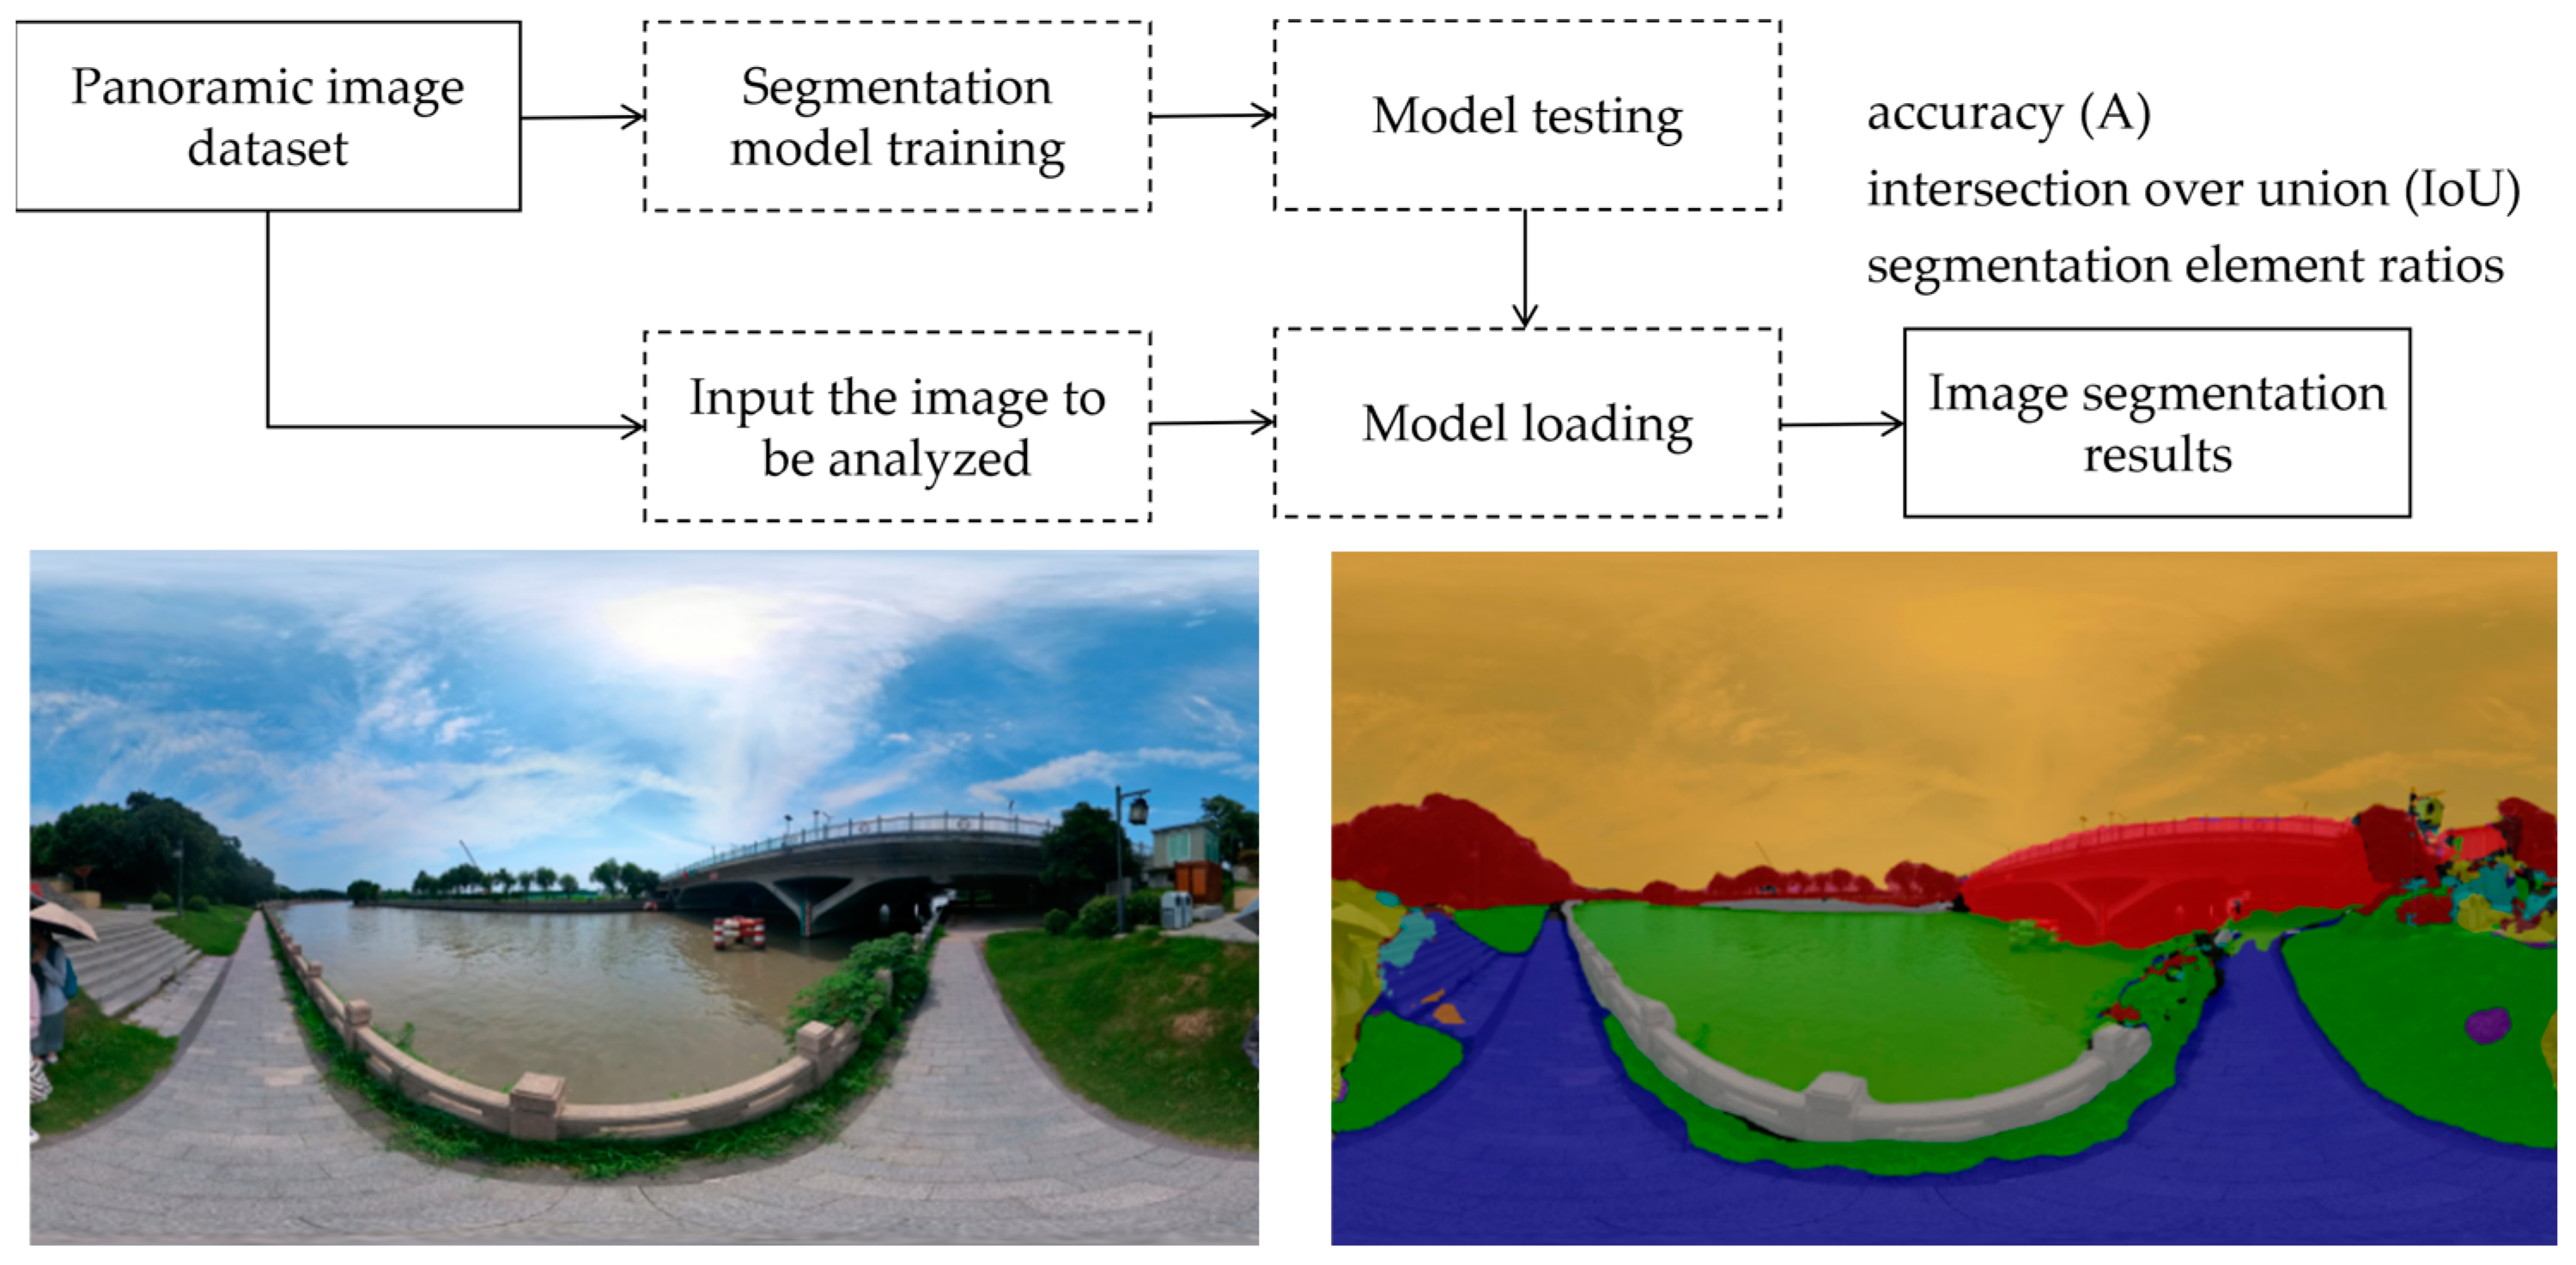
2.2.2. Environmental Feature Identification: Image Semantic Segmentation and Environmental Feature Indicator Calculation

This study intends to employ SegFormer image semantic segmentation technology to analyse objective landscape elements and environmental characteristics. Building on previous studies [48,49] and considering the features of heritage canal waterfront landscapes, the panoramic images were segmented into 16 categories: trees, grass, waterbodies, sky, bare land, fence, people, hard pavement (roads and squares), modern structures, ancient buildings, bridges, landscape facilities (e.g., streetlamps, benches), boats, vehicles, disruptors (e.g., trash bins, clutter, telephone poles), and others (Table 1). Representing environmental characteristics using the proportions of landscape elements is a commonly used and effective method [50]. This study utilised ten spatial morphological metrics to characterise landscape environmental features, including the greenery visibility ratio, water visibility ratio, and hard surface ratio, along with two graded quantification metrics for water quality and pavement quality (averaged scores from ten professionals rated on a scale of 1–5), totalling 12 indicators (Table 2). These were categorised into two main classes: blue-green indicators (related to natural and water elements) and grey indicators (related to artificial constructions).
The continuous advancement of deep learning technology in computer vision has led to significant breakthroughs in image classification, object recognition, and semantic segmentation, especially regarding image segmentation tasks, where the SegFormer architecture has shown promising results. SegFormer, a simple, efficient, yet powerful semantic segmentation framework, unifies Transformers with lightweight multilayer perceptron (MLP) decoders [44]. Encoders capture features from the input images, while decoders map these features back to the original resolution of the input image, generating pixel-level segmentation results. This study first organised the photographed images by number and developed a dataset. Using the SegFormer structure in the MMSegmentation, multiple segmentation models were trained to achieve a high degree of fit, indicating the model’s generalizability for the batch processing of canal waterfront images. This study conducted 100 training cycles, followed by model testing, calculating the accuracy (A) and intersection over union (IoU) of the segmentation results. The 150 images used for analysis were input into the model, producing the segmentation results. The model computed the pixel area of each segmented element in each image and directly output the percentage of each element relative to the total image area, facilitating the calculation of the environmental feature metric system (Figure 3).

2.2.3. Landscape Preference Evaluation

Landscape visual preference rating was conducted through an online questionnaire survey, which offers convenience and is not limited by time and space. The 150 experimental photos were randomly divided into four groups, each containing 37–38 photos for the online questionnaire survey. Many studies have confirmed that the landscape preferences of professionals align with those of the public and can lead to more accurate interpretations of images [51]. Therefore, 80 professionals (students, teachers, and practitioners in landscape architecture, architecture, and urban planning) were invited to participate in the survey, with 20 individuals per group. The questionnaire consisted of two parts: (1) basic personal information, including gender, age, occupation, and familiarity with the canal and visitation experiences, and (2) visual landscape preferences, where testers were first briefed on the research purpose, sampling locations, and four indicators related to each photo—aesthetic preference, cultural preference, natural preference, and hydrophilic preference—with corresponding explanations (Table 3). All photos in the group were presented, and only after confirming that all had been viewed could the participants proceed to the next page, ensuring a general understanding of all images to avoid extreme scoring. Participants then rated all photos using a 5-point Likert scale ranging from 1 to 5 for each of the four questions. Prior to the survey, all participants were fully informed about the purpose and procedures of the study, and their consent was obtained. Participation in the survey was conducted anonymously. The basic information statistics of the participants (Table 4) showed an average age of 27.2 ± 3.3 years, with undergraduates comprising 22.50%, graduate and doctoral students comprising 48.75%, and university teachers and professionals comprising 28.75%. Notably, 61.25% of the respondents reported familiarity with or prior visits to canal-related attractions.

2.2.4. Statistical Analysis

In planning guidance research, statistical methods using SPSS software are widely applied. For instance, correlation analysis and multiple linear regression models can be used to analyse the relationships among various variables; one-way ANOVA can compare the significance of differences between groups [52]. In this study, the independent variables comprised 12 waterfront environmental feature indicators, while the dependent variables included the four components of landscape visual preference: aesthetic preference, cultural preference, natural preference, and hydrophilic preference. Utilising SPSS 27.0.1, multiple analyses were performed on the different datasets: (1) The reliability (internal consistency) of the questionnaire measurement scales was assessed using Cronbach’s α coefficient, along with a descriptive statistical analysis of the results for landscape element segmentation, environmental feature calculations, and landscape preference evaluations. (2) Spearman correlation analysis was employed to examine the bivariate relationships between the internal landscape visual preference indicators and waterfront environmental characteristics, followed by stepwise multiple linear regression analysis (using the “Enter” method) to explore the associations between different environmental features and visual preferences, identifying significant environmental factors influencing the four landscape visual preferences. (3) The canal sections were categorised into suburban, old city, and new city segments, employing a non-parametric one-way ANOVA (Kruskal–Wallis test) to test the significance levels of differences in landscape preferences across different segments, thereby investigating the influence of spatial location on landscape preferences.

3. Results

3.1. Descriptive Statistics of Environmental Characteristics and Landscape Visual Preferences

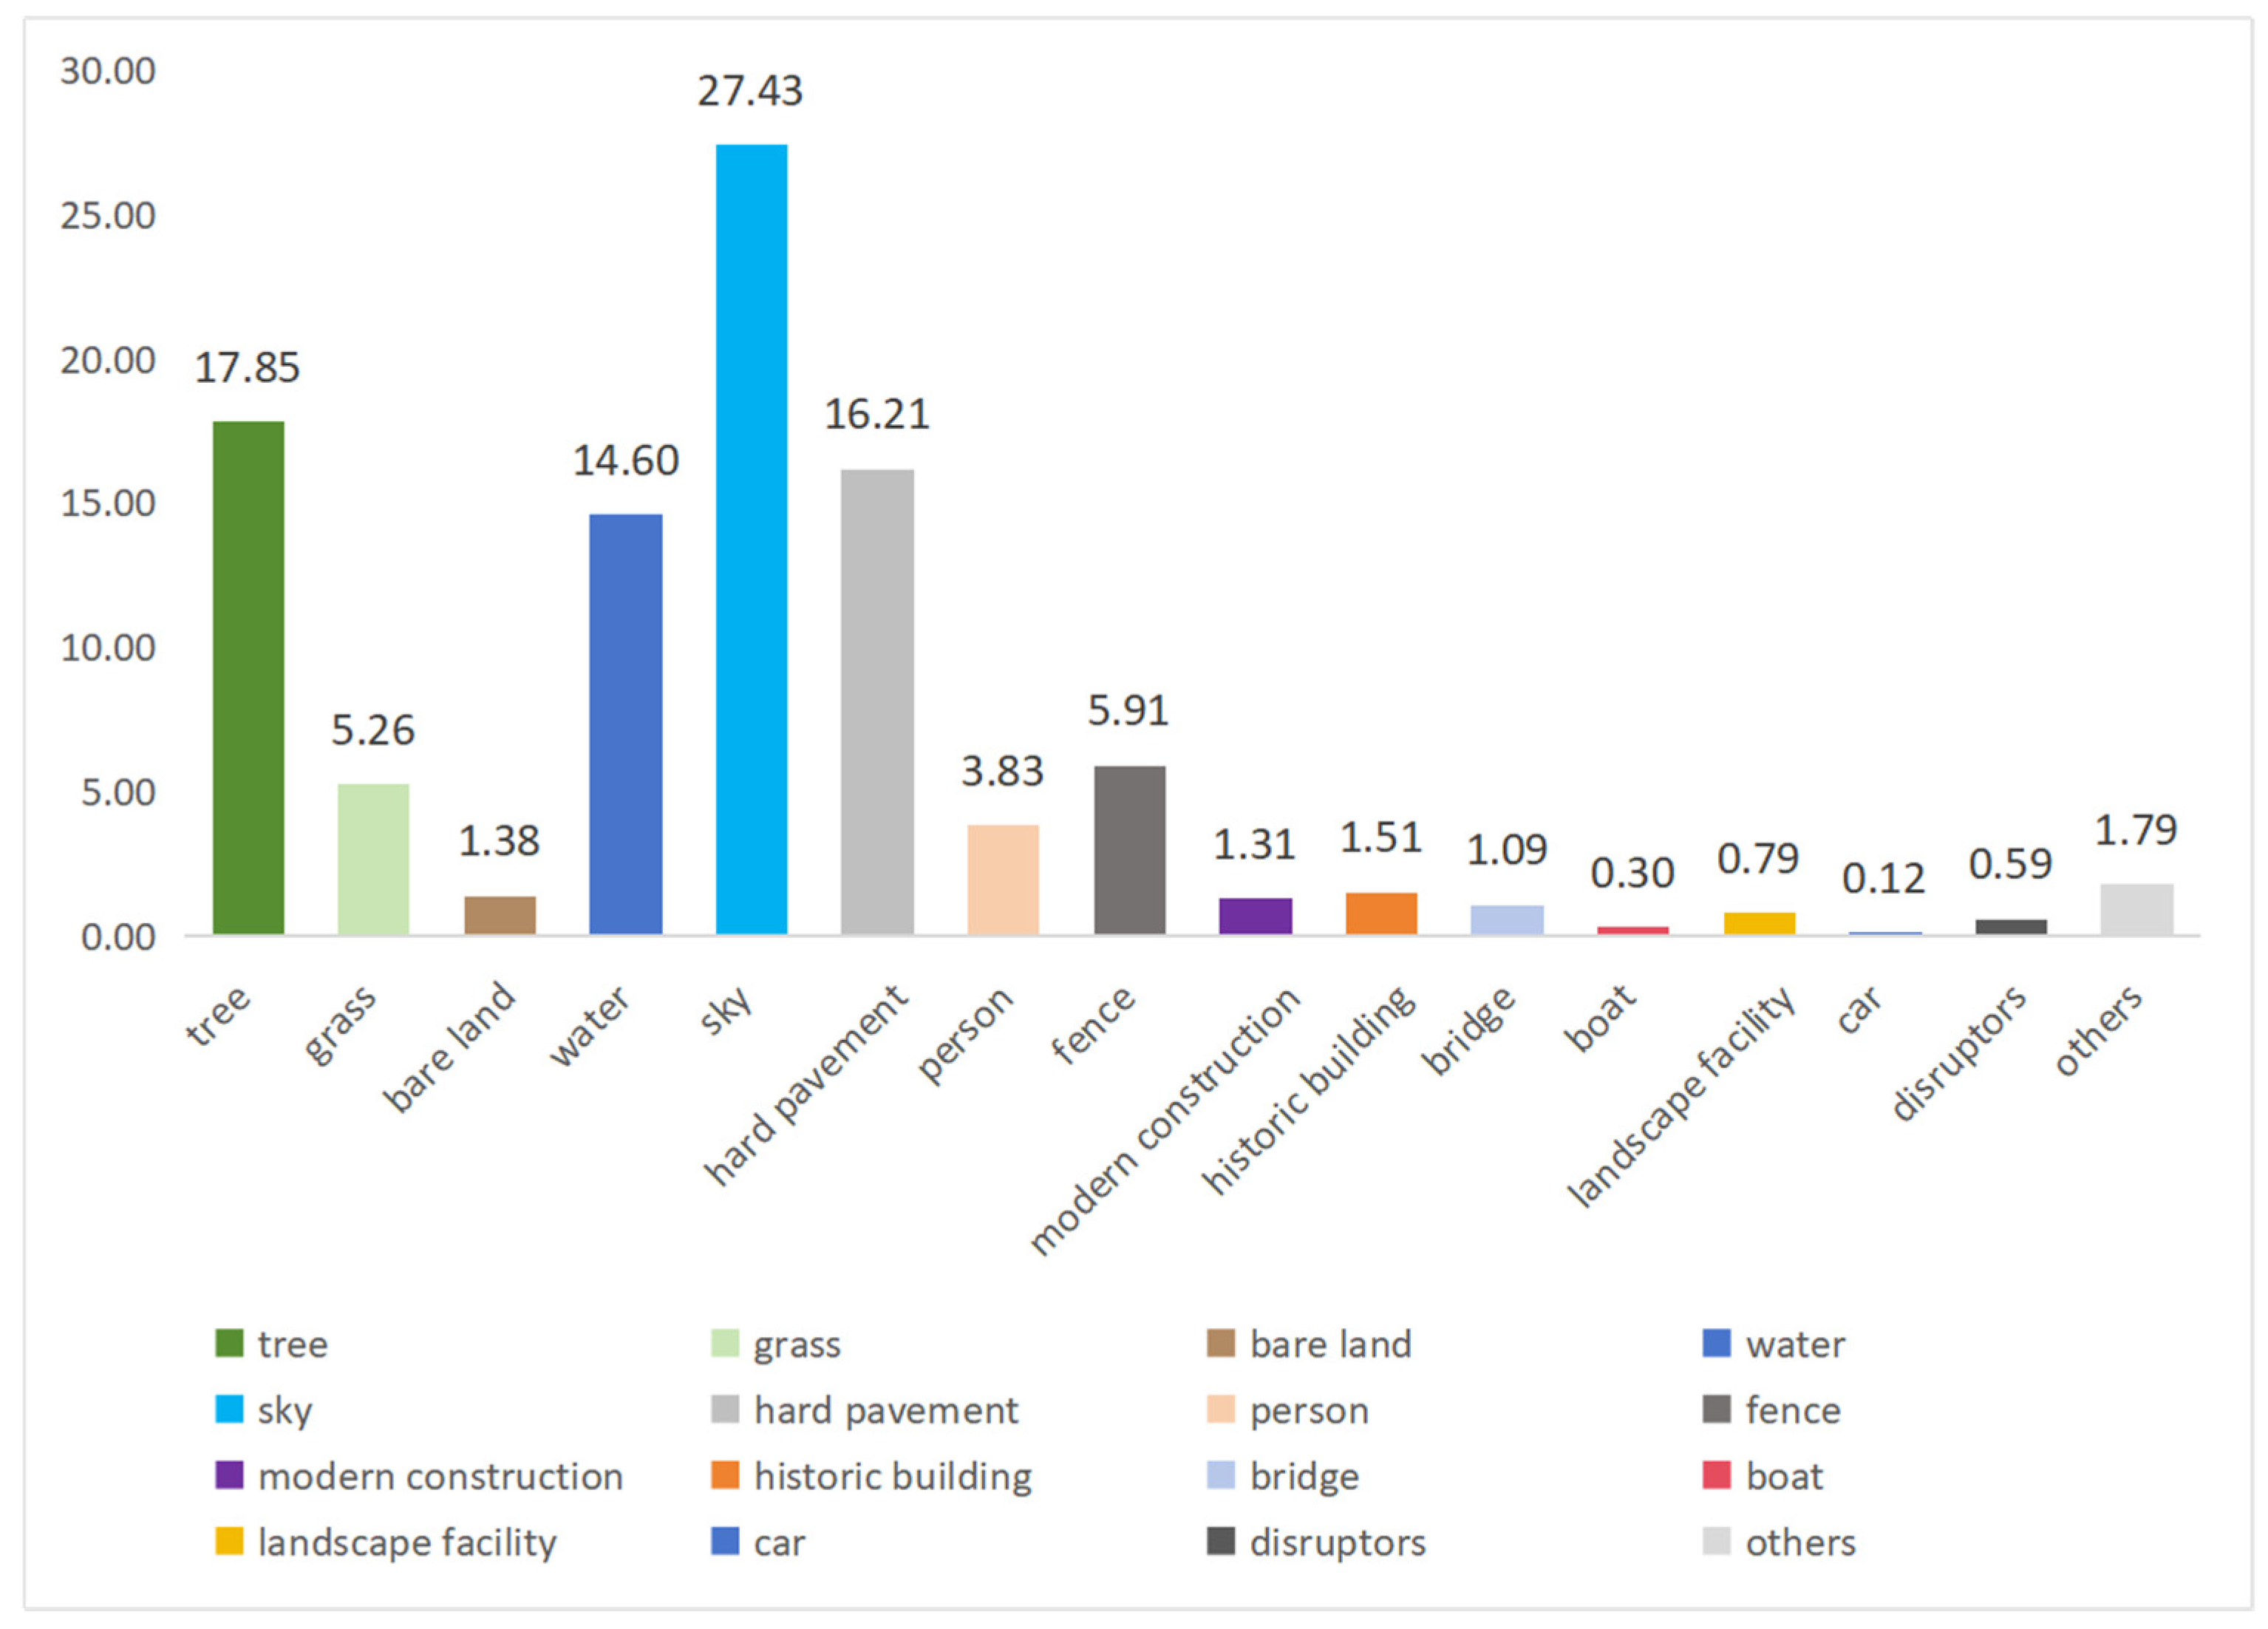
3.1.1. Descriptive Statistics of Environmental Segmentation Element Ratios

After multiple training rounds, the model’s segmentation accuracy met experimental requirements. With this accuracy, the image semantic segmentation resulted in high recognition rates for various labels, with an overall pixel accuracy (PA) of 0.923 and a mean intersection over union (MIoU) of 0.754, enabling the precise batch processing of canal waterfront images. The average ratios of the 16 environmental segmentation elements across the 150 photos were statistically analysed (Figure 4). The highest proportions were recorded for sky (27.43%), tree (17.85%), hard pavement (16.21%), and water (14.60%), while the proportions for modern construction, historic buildings, bridges, and landscape facilities ranged from 0.5% to 1.6%, indicating a predominance of blue-green natural spatial elements.

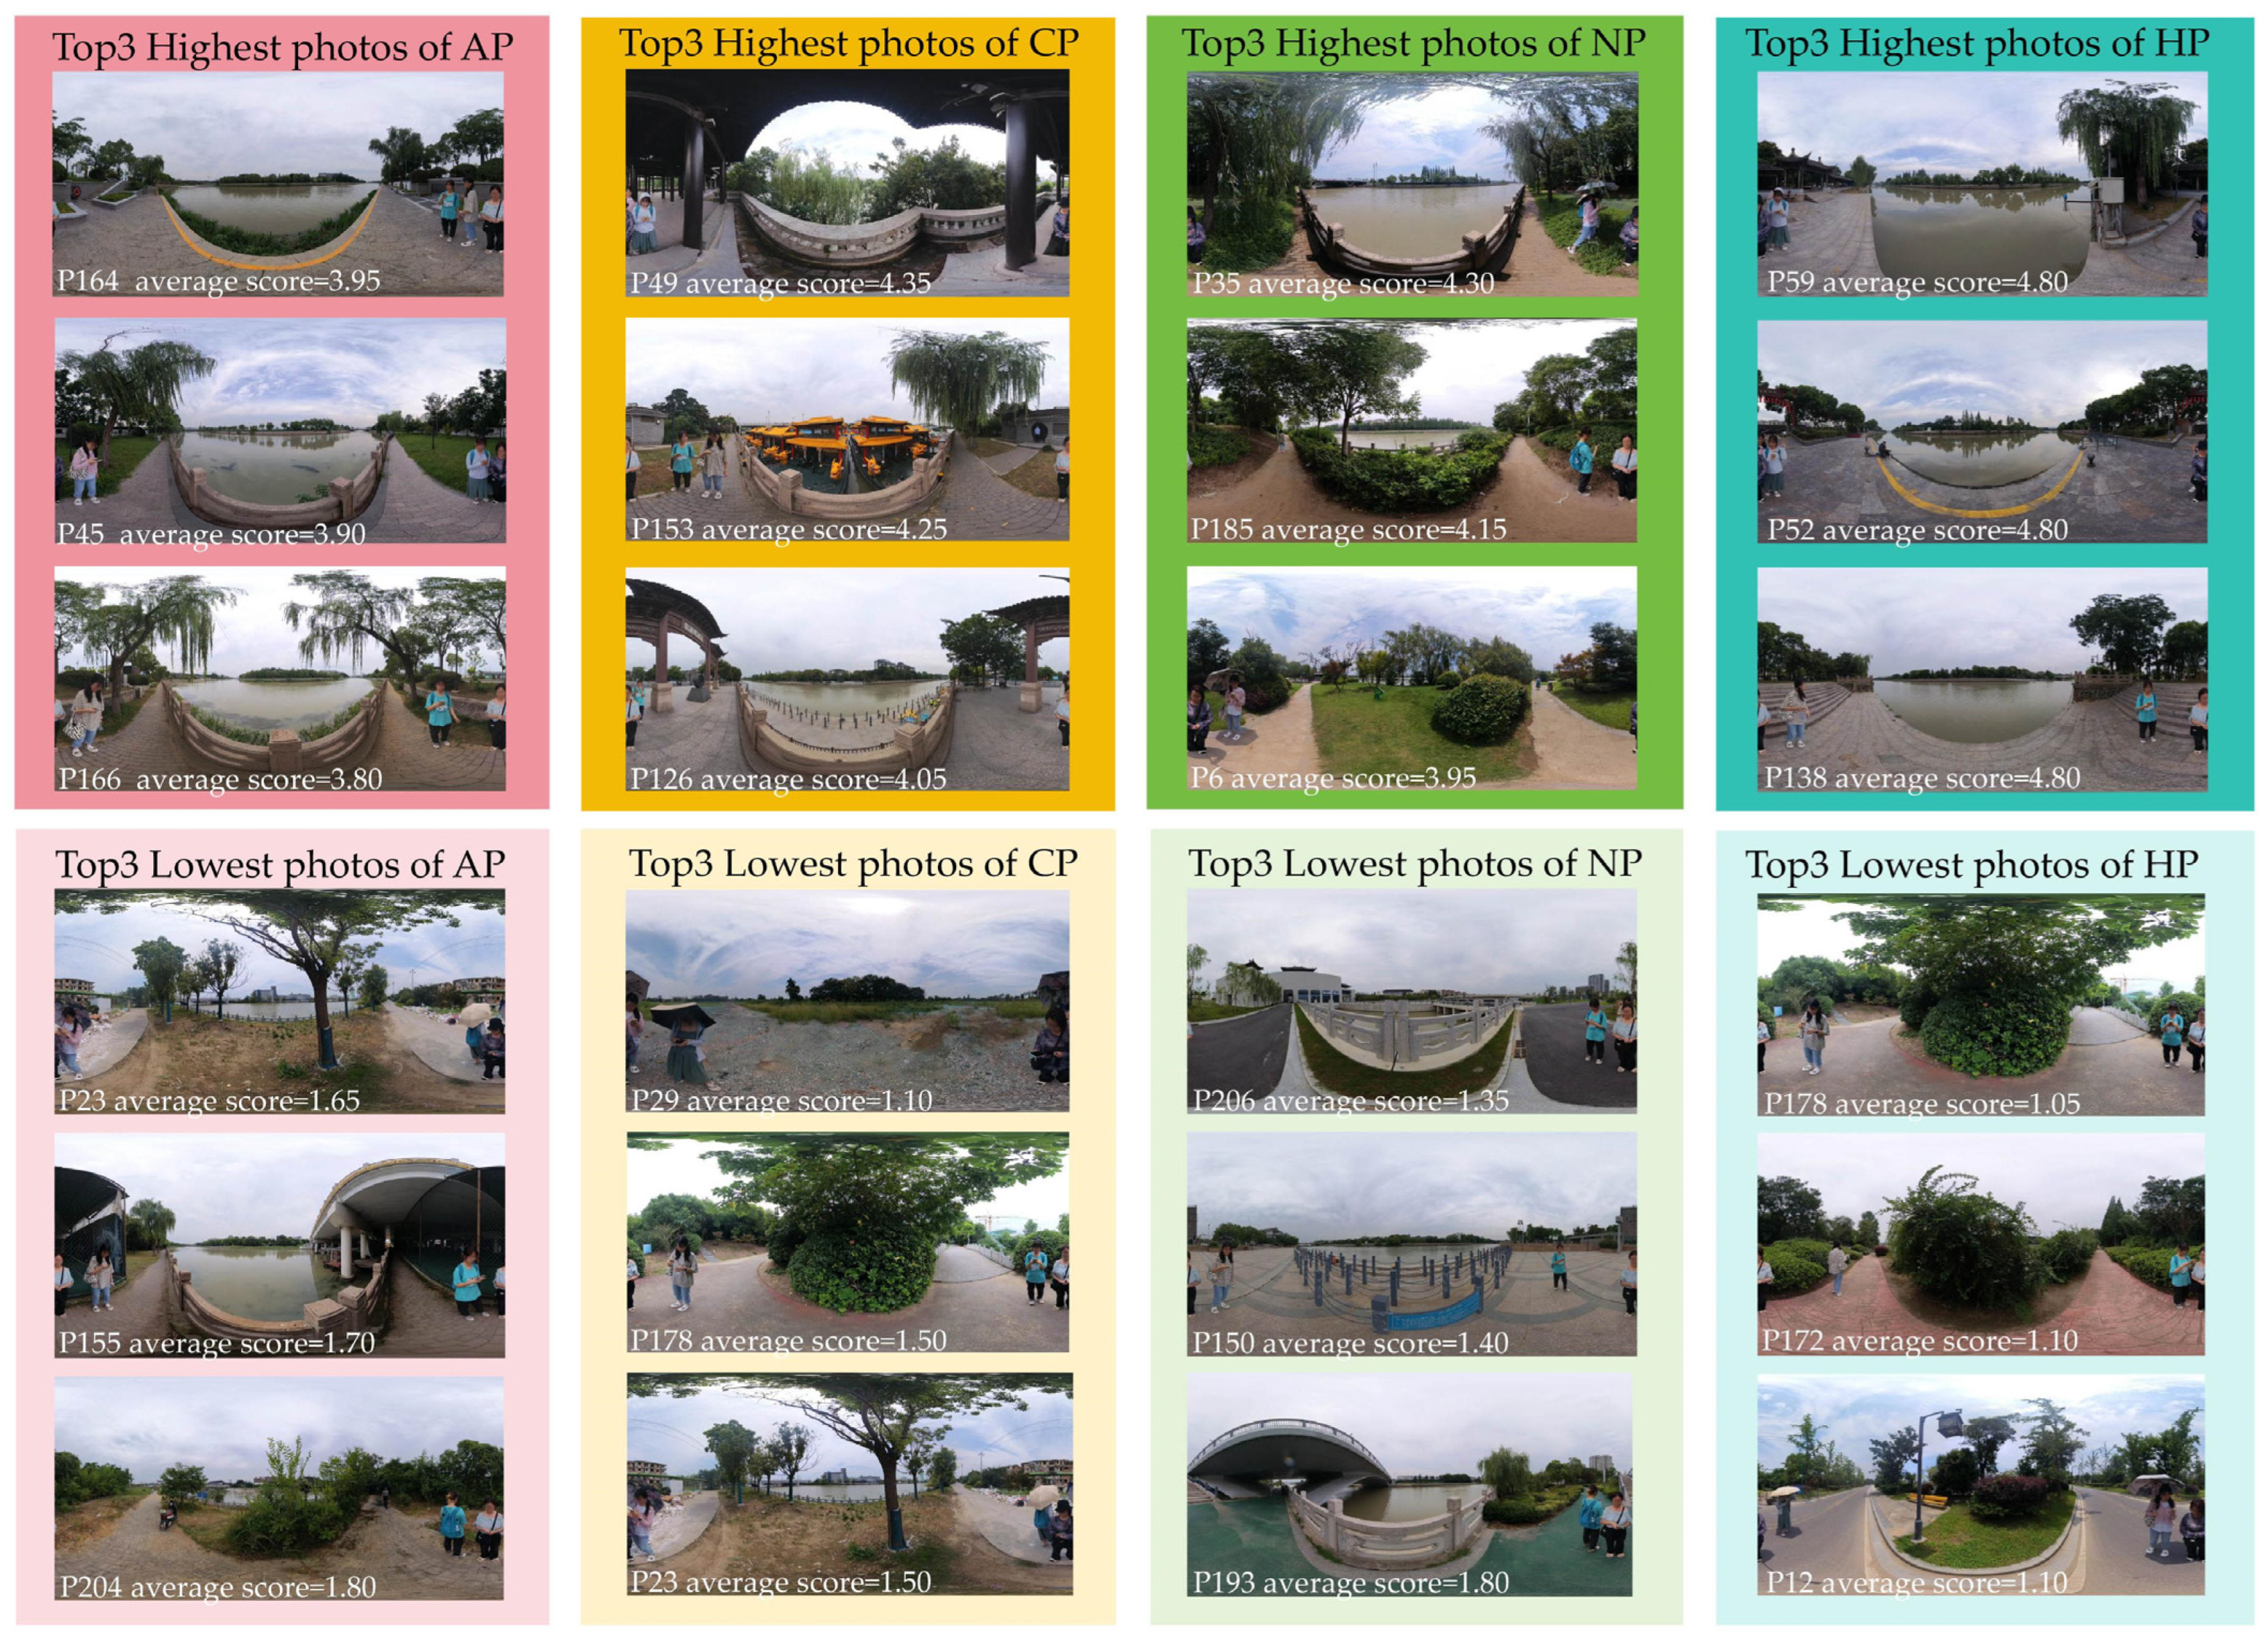
3.1.2. Descriptive Statistics of Landscape Visual Preference Scores

The questionnaire data underwent reliability testing, yielding Cronbach’s α coefficients of greater than 0.8 for all dimensions, indicating high reliability and suitability for further analysis. Descriptive statistics for the scores of the four landscape preference indicators were generated, revealing the following hierarchy: natural preference (3.05 ± 0.61) > aesthetic preference (2.97 ± 0.50) > hydrophilic preference (2.96 ± 0.82) > cultural preference (2.44 ± 0.54). This indicates a stronger overall perception of nature and a weaker perception of culture.
The three photos with the highest and lowest scores for the four visual preferences were compiled (Figure 5). In photos with high aesthetic preference, the proportions of waterbodies and vegetation were higher, and the quality of pavement and water was better. Conversely, in lower-scoring photos, bare land, clutter, and modern structures were more prominent. Photos with higher cultural preference featured classical pavilions, boats, and high-quality pavements, while those with lower scores showed poor visibility of waterbodies and fewer landscape facilities. High-natural-preference photos had a greater proportion of vegetation and higher greenery visibility, whereas photos with lower scores exhibited larger areas of hard surfaces and more artificial structures such as bridges, railings, and buildings. High-hydrophilic-preference photos had a significant water surface area, lower barriers, and better pavement quality, while lower-scoring images were obstructed by plants or railings, resulting in lower visibility of the water.

3.2. Relationship Between Environmental Characteristics and Landscape Visual Preferences

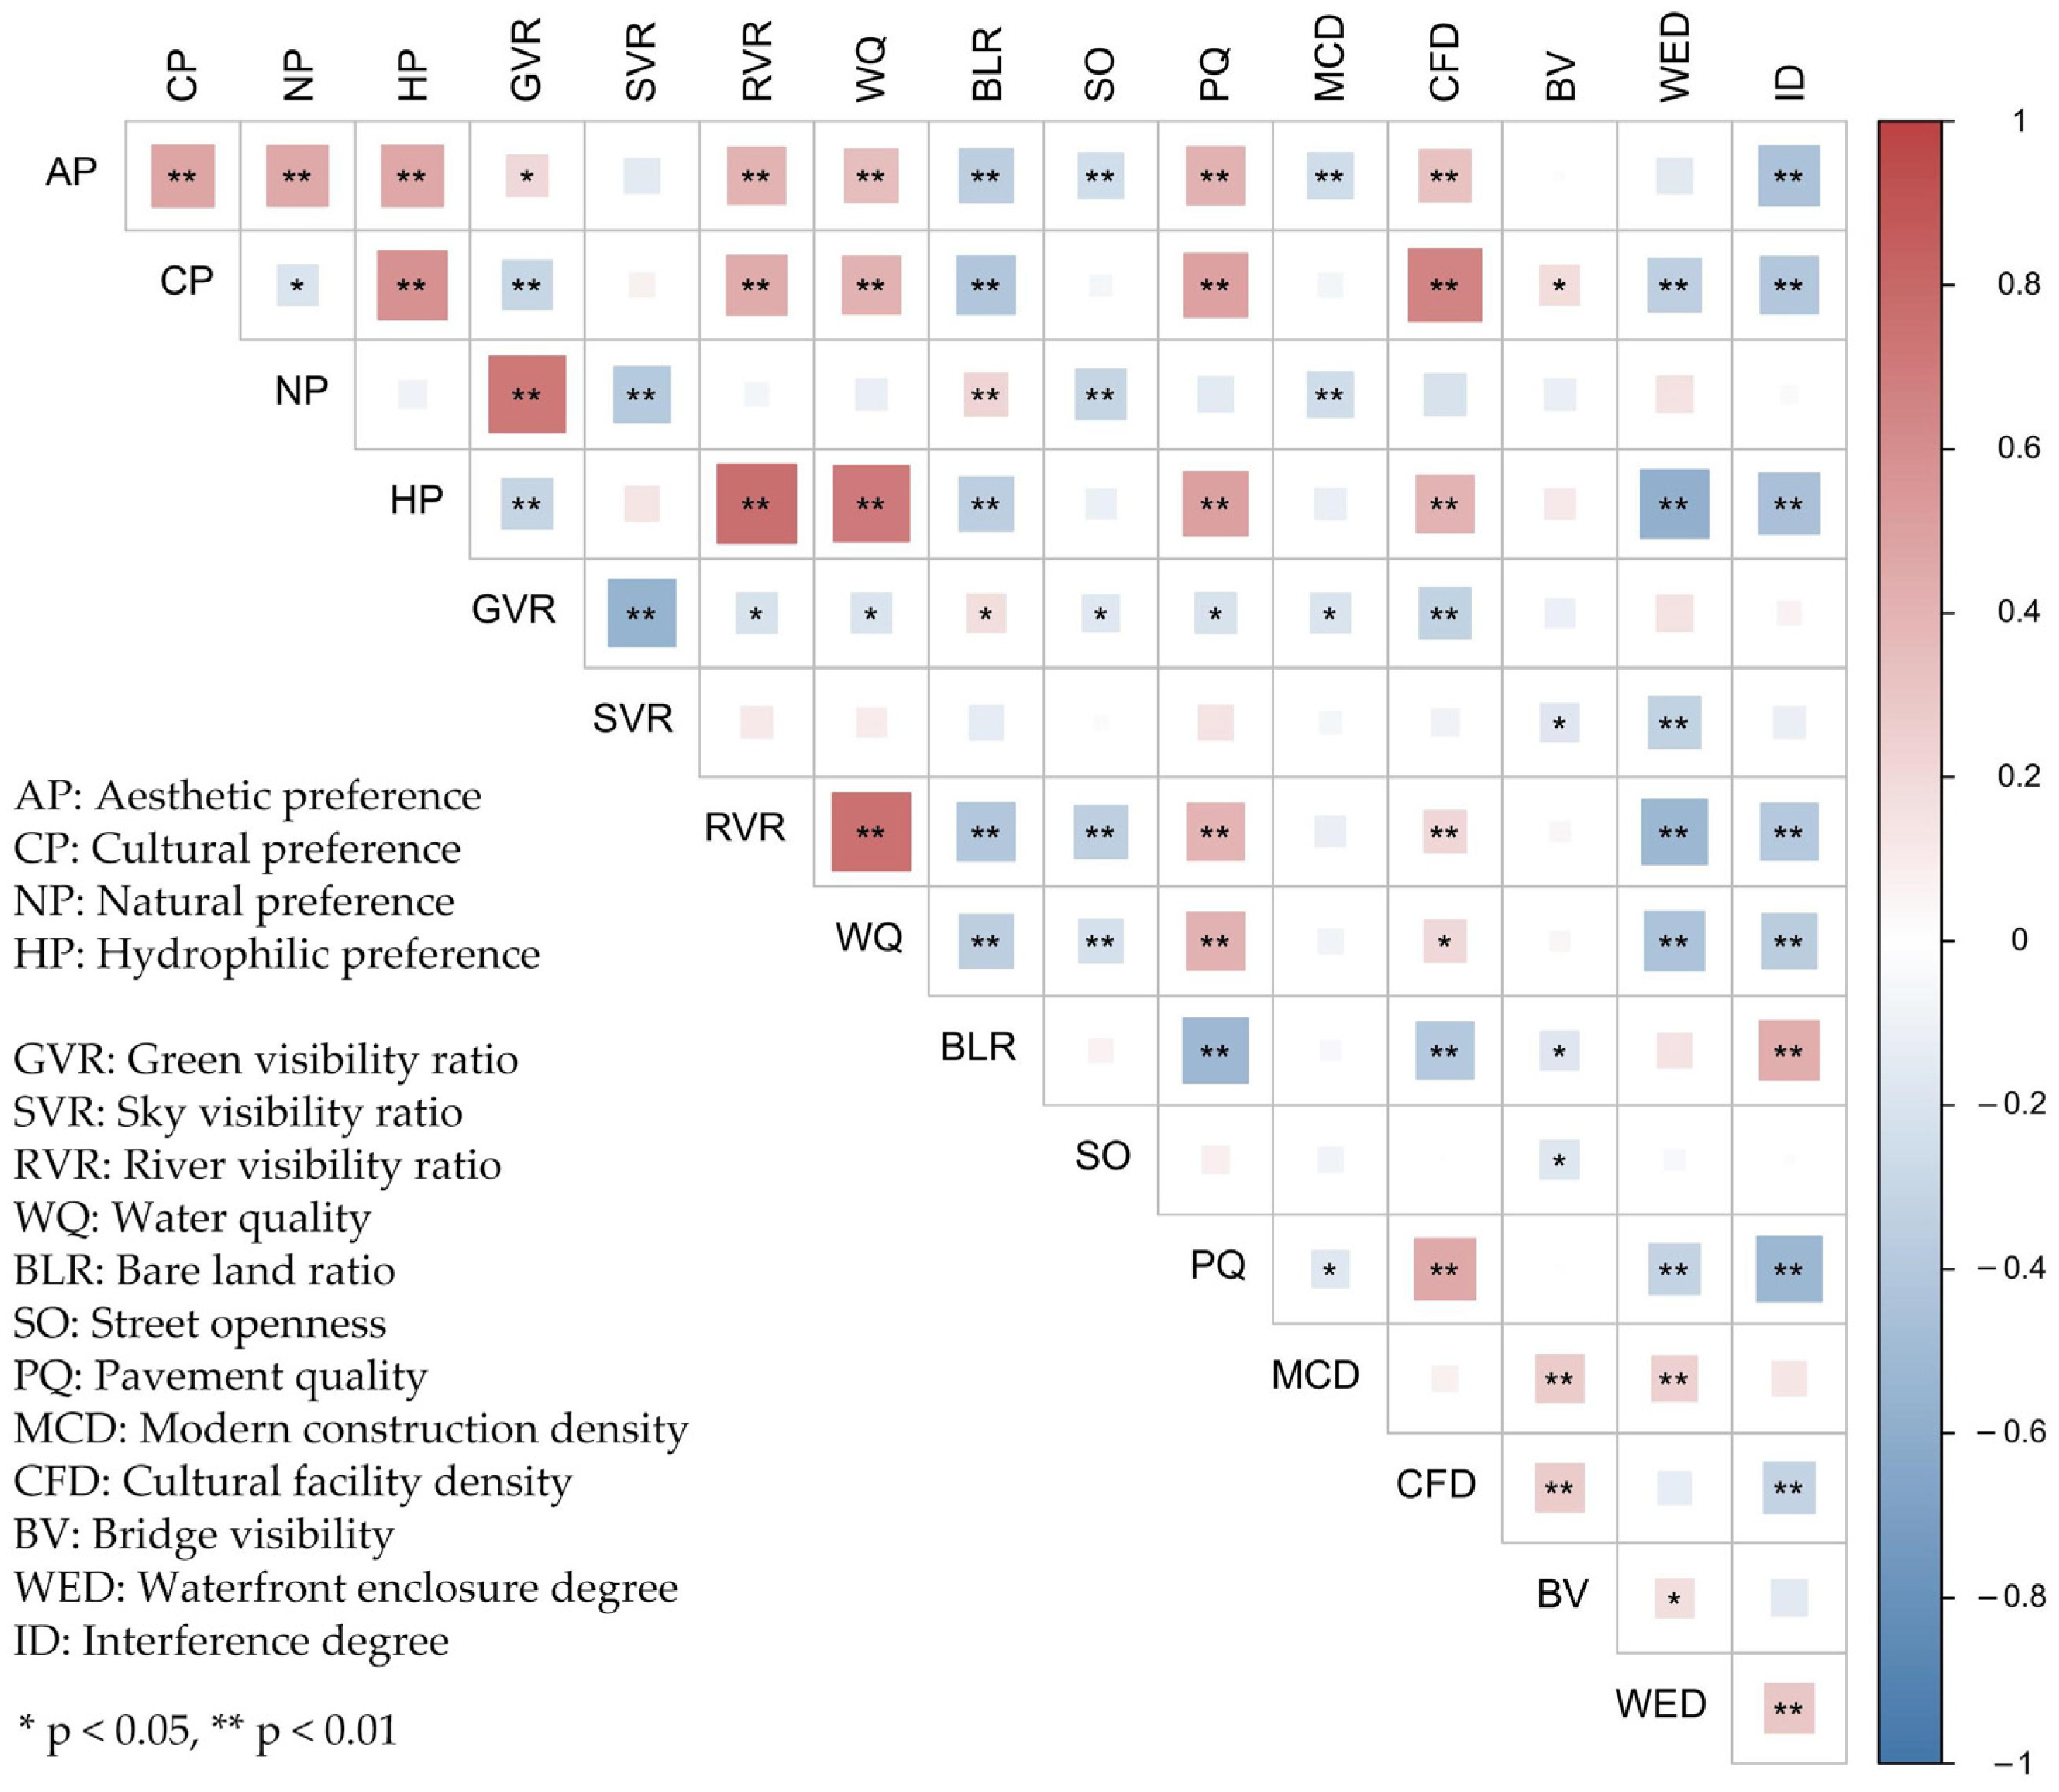
3.2.1. Correlation Analysis

Spearman’s correlation analysis was first conducted to calculate the correlations among the four landscape visual preference indicators (Table 5, Figure 6). The results indicated that aesthetic preference exhibited significant positive correlations with cultural, hydrophilic, and natural preferences; however, cultural preference showed a negative correlation with natural preference and a significant positive correlation with hydrophilic preference.
Subsequently, the correlations between the four landscape visual preference indicators and the twelve environmental characteristic indicators were analysed (Table 6, Figure 6). The findings were as follows: (1) Aesthetic preference showed significant positive correlations with the river visibility ratio (RVR), water quality (WQ), pavement quality (PQ) and cultural facility density (CFD) and significant negative correlations with the bare land ratio (BLR), street openness (SO), modern construction density (MCD), and the interference degree (ID). (2) Cultural preference was significantly positively correlated with the river visibility ratio (RVR), water quality (WQ), pavement quality (PQ), and cultural facility density (CFD) and significantly negatively correlated with the green visibility ratio (GVR), the bare land ratio (BLR), the waterfront enclosure degree (WED), and the interference degree (ID). (3) Natural preference exhibited a significant positive correlation with the green visibility ratio (GVR) and the bare land ratio (BLR) and significant negative correlations with the sky visibility ratio (SVR), street openness (SO), and modern construction density (MCD). (4) Hydrophilic preference was significantly positively correlated with the river visibility ratio (RVR), water quality (WQ), pavement quality (PQ), and cultural facility density (CFD) and significantly negatively correlated with the green visibility ratio (GVR), the bare land ratio (BLR), the waterfront enclosure degree (WED), and the interference degree (ID).

3.2.2. Stepwise Multiple Regression

To further explain the environmental characteristic factors affecting the four landscape visual preferences, a stepwise multiple regression analysis was conducted for each indicator (Table 7). The stepwise regression results indicated the following: (1) Aesthetic preference is positively influenced by the river visibility ratio (RVR), the green visibility ratio (GVR), cultural facility density (CFD), and pavement quality (PQ), while it is negatively influenced by the interference degree (ID). (2) Cultural preference is mainly positively influenced by cultural facility density (CFD) and the water visibility ratio (RVR), but it is negatively impacted by the interference degree (ID), the waterfront enclosure degree (WED), and the bare land ratio (BLR). (3) Natural preference is positively influenced by the green visibility ratio (GVR) and negatively influenced by modern construction density (MCD) and street openness (SO). (4) Hydrophilic preference is positively influenced by the river visibility ratio (RVR), water quality (WQ), and pavement quality (PQ), while it is negatively influenced by the waterfront enclosure degree (WED), the green visibility ratio (GVR), and the sky visibility ratio (SVR). The explanatory power of the environmental characteristic factors for these four indicators (adjusted R2) ranged from 0.525 to 0.835, indicating a good capacity to explain landscape visual preference outcomes.

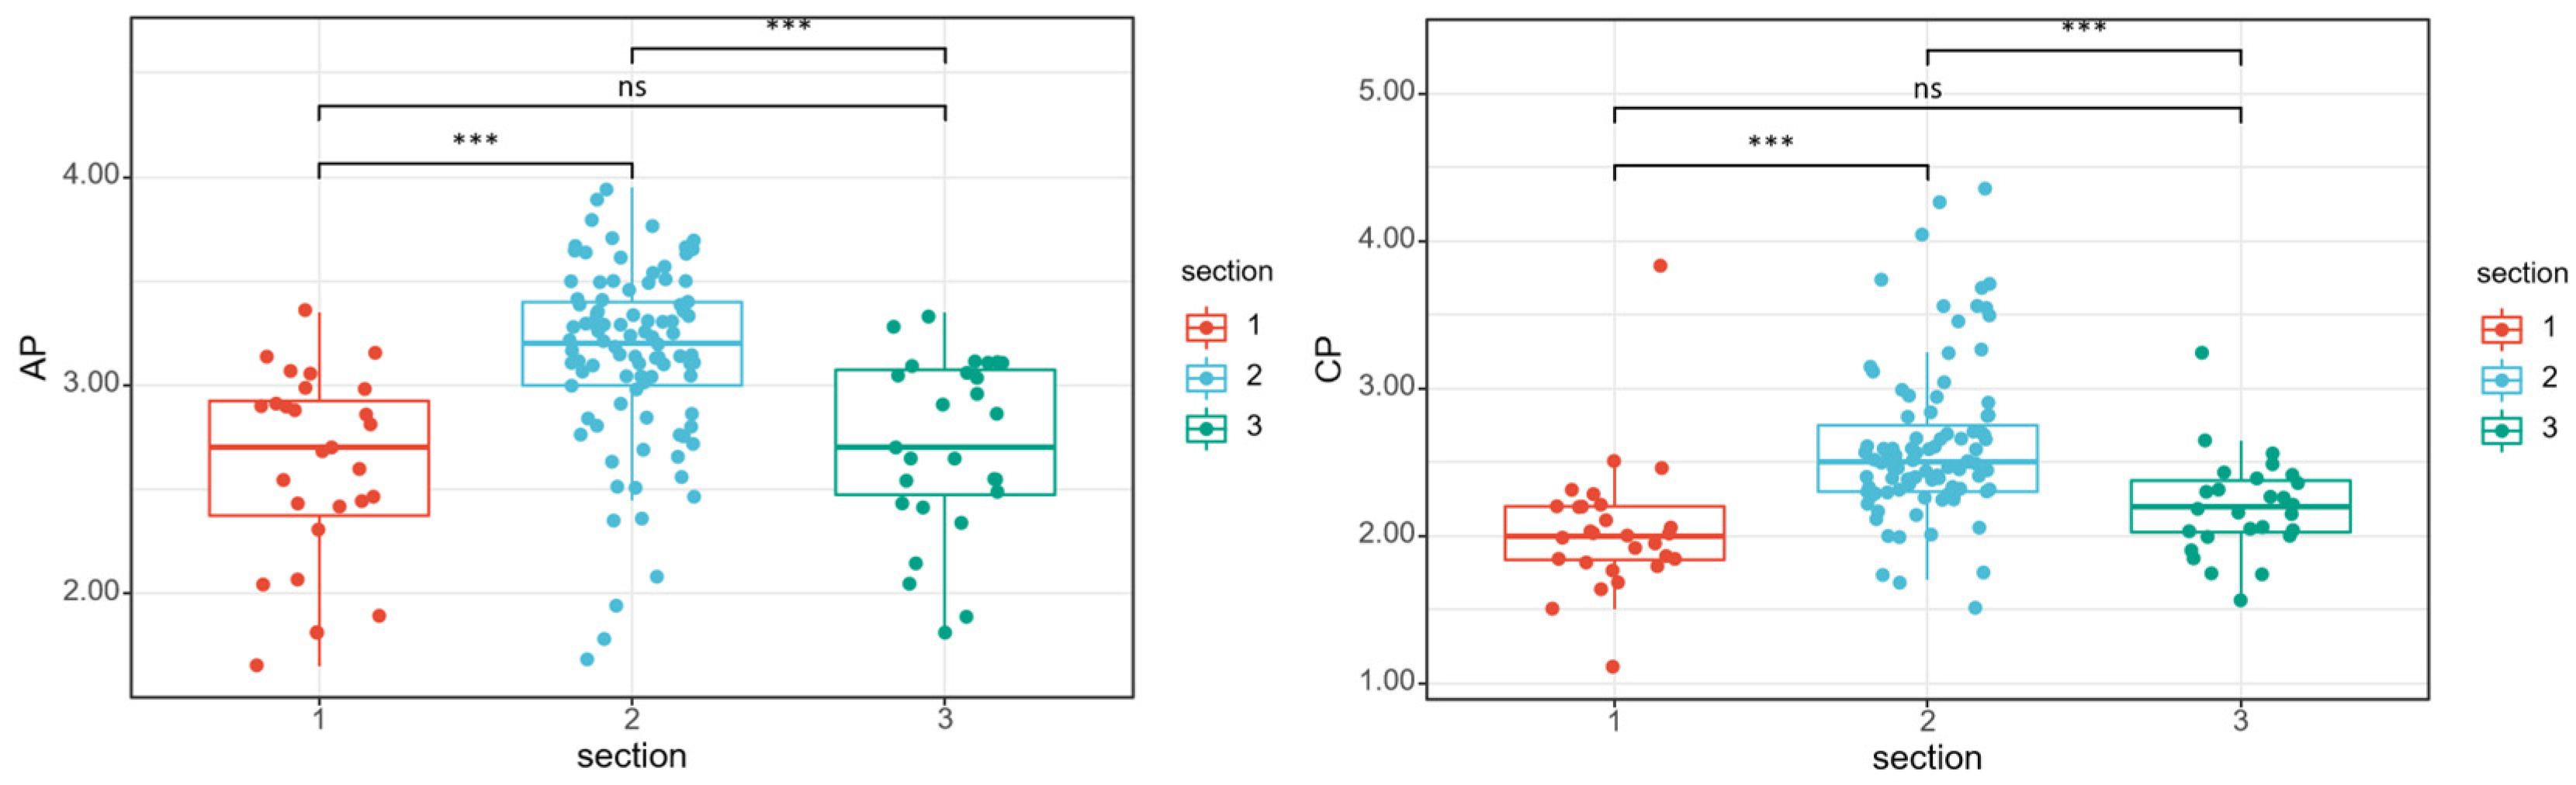
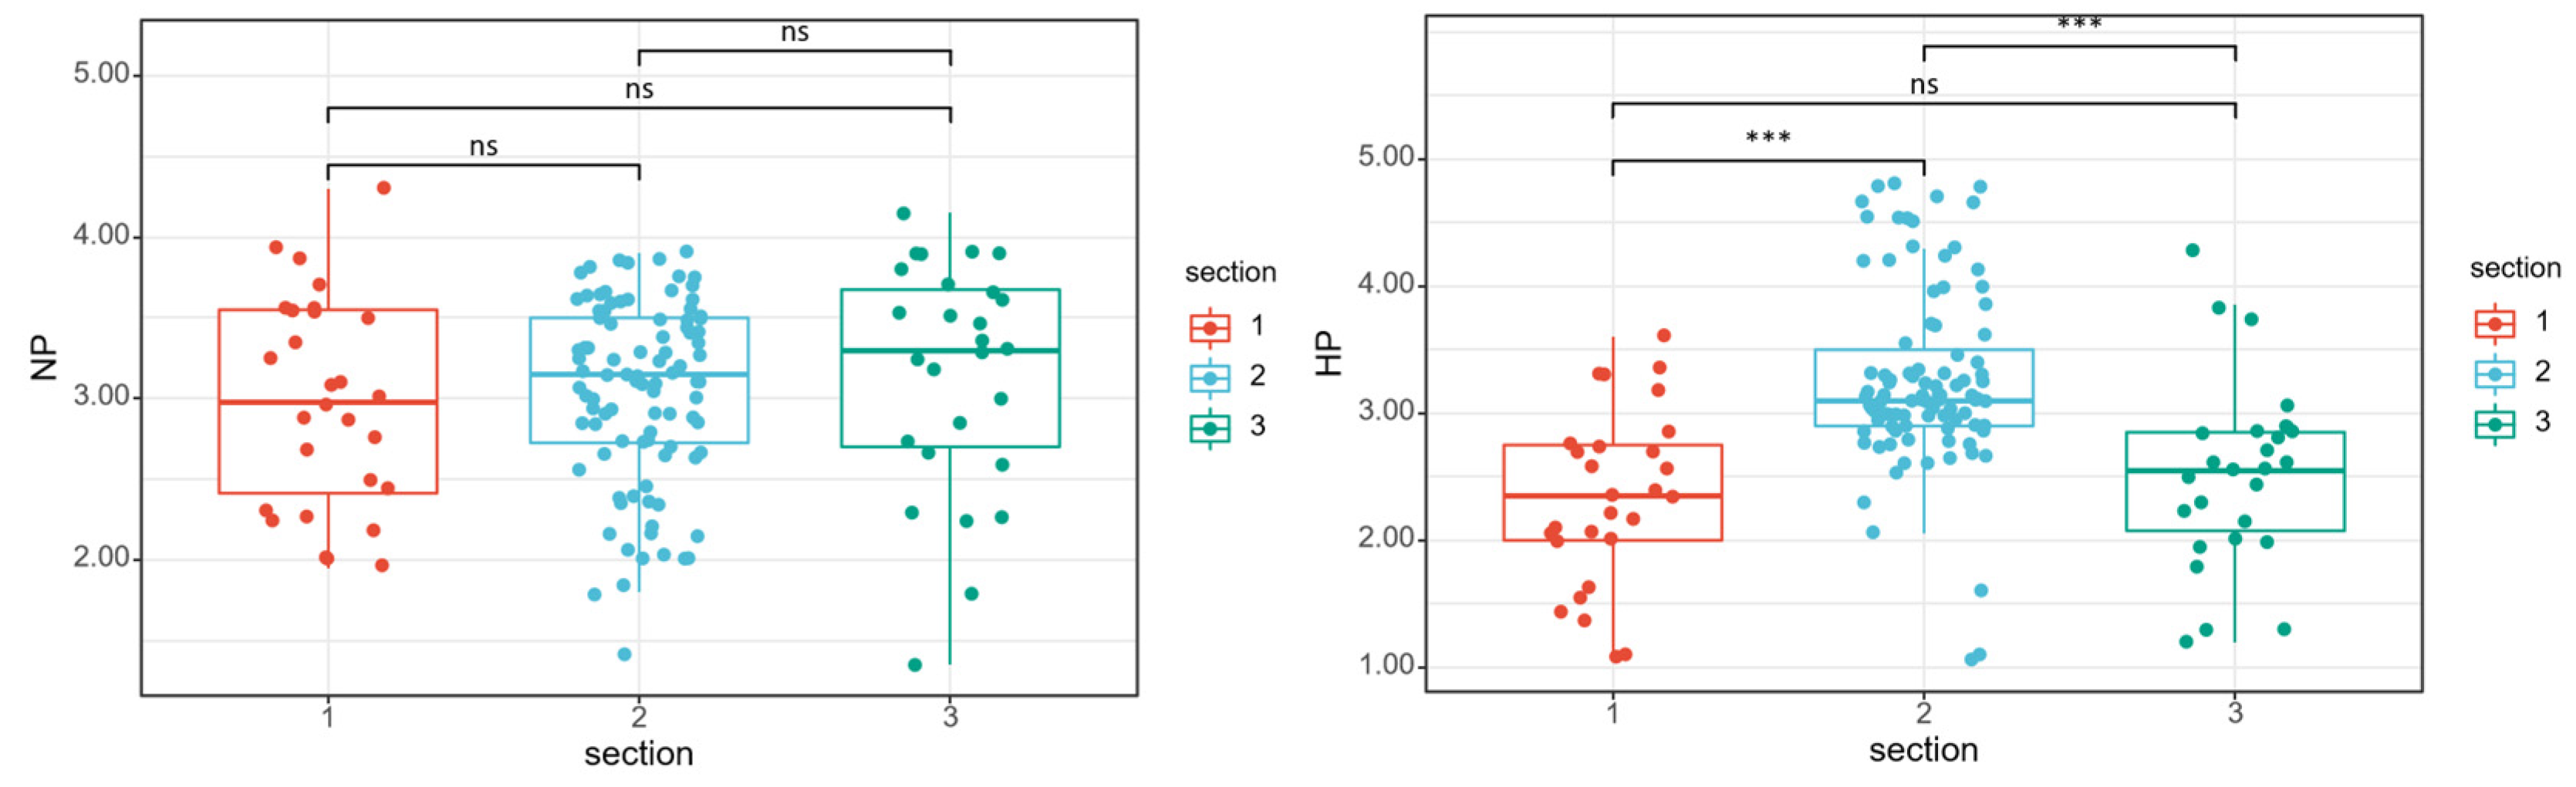
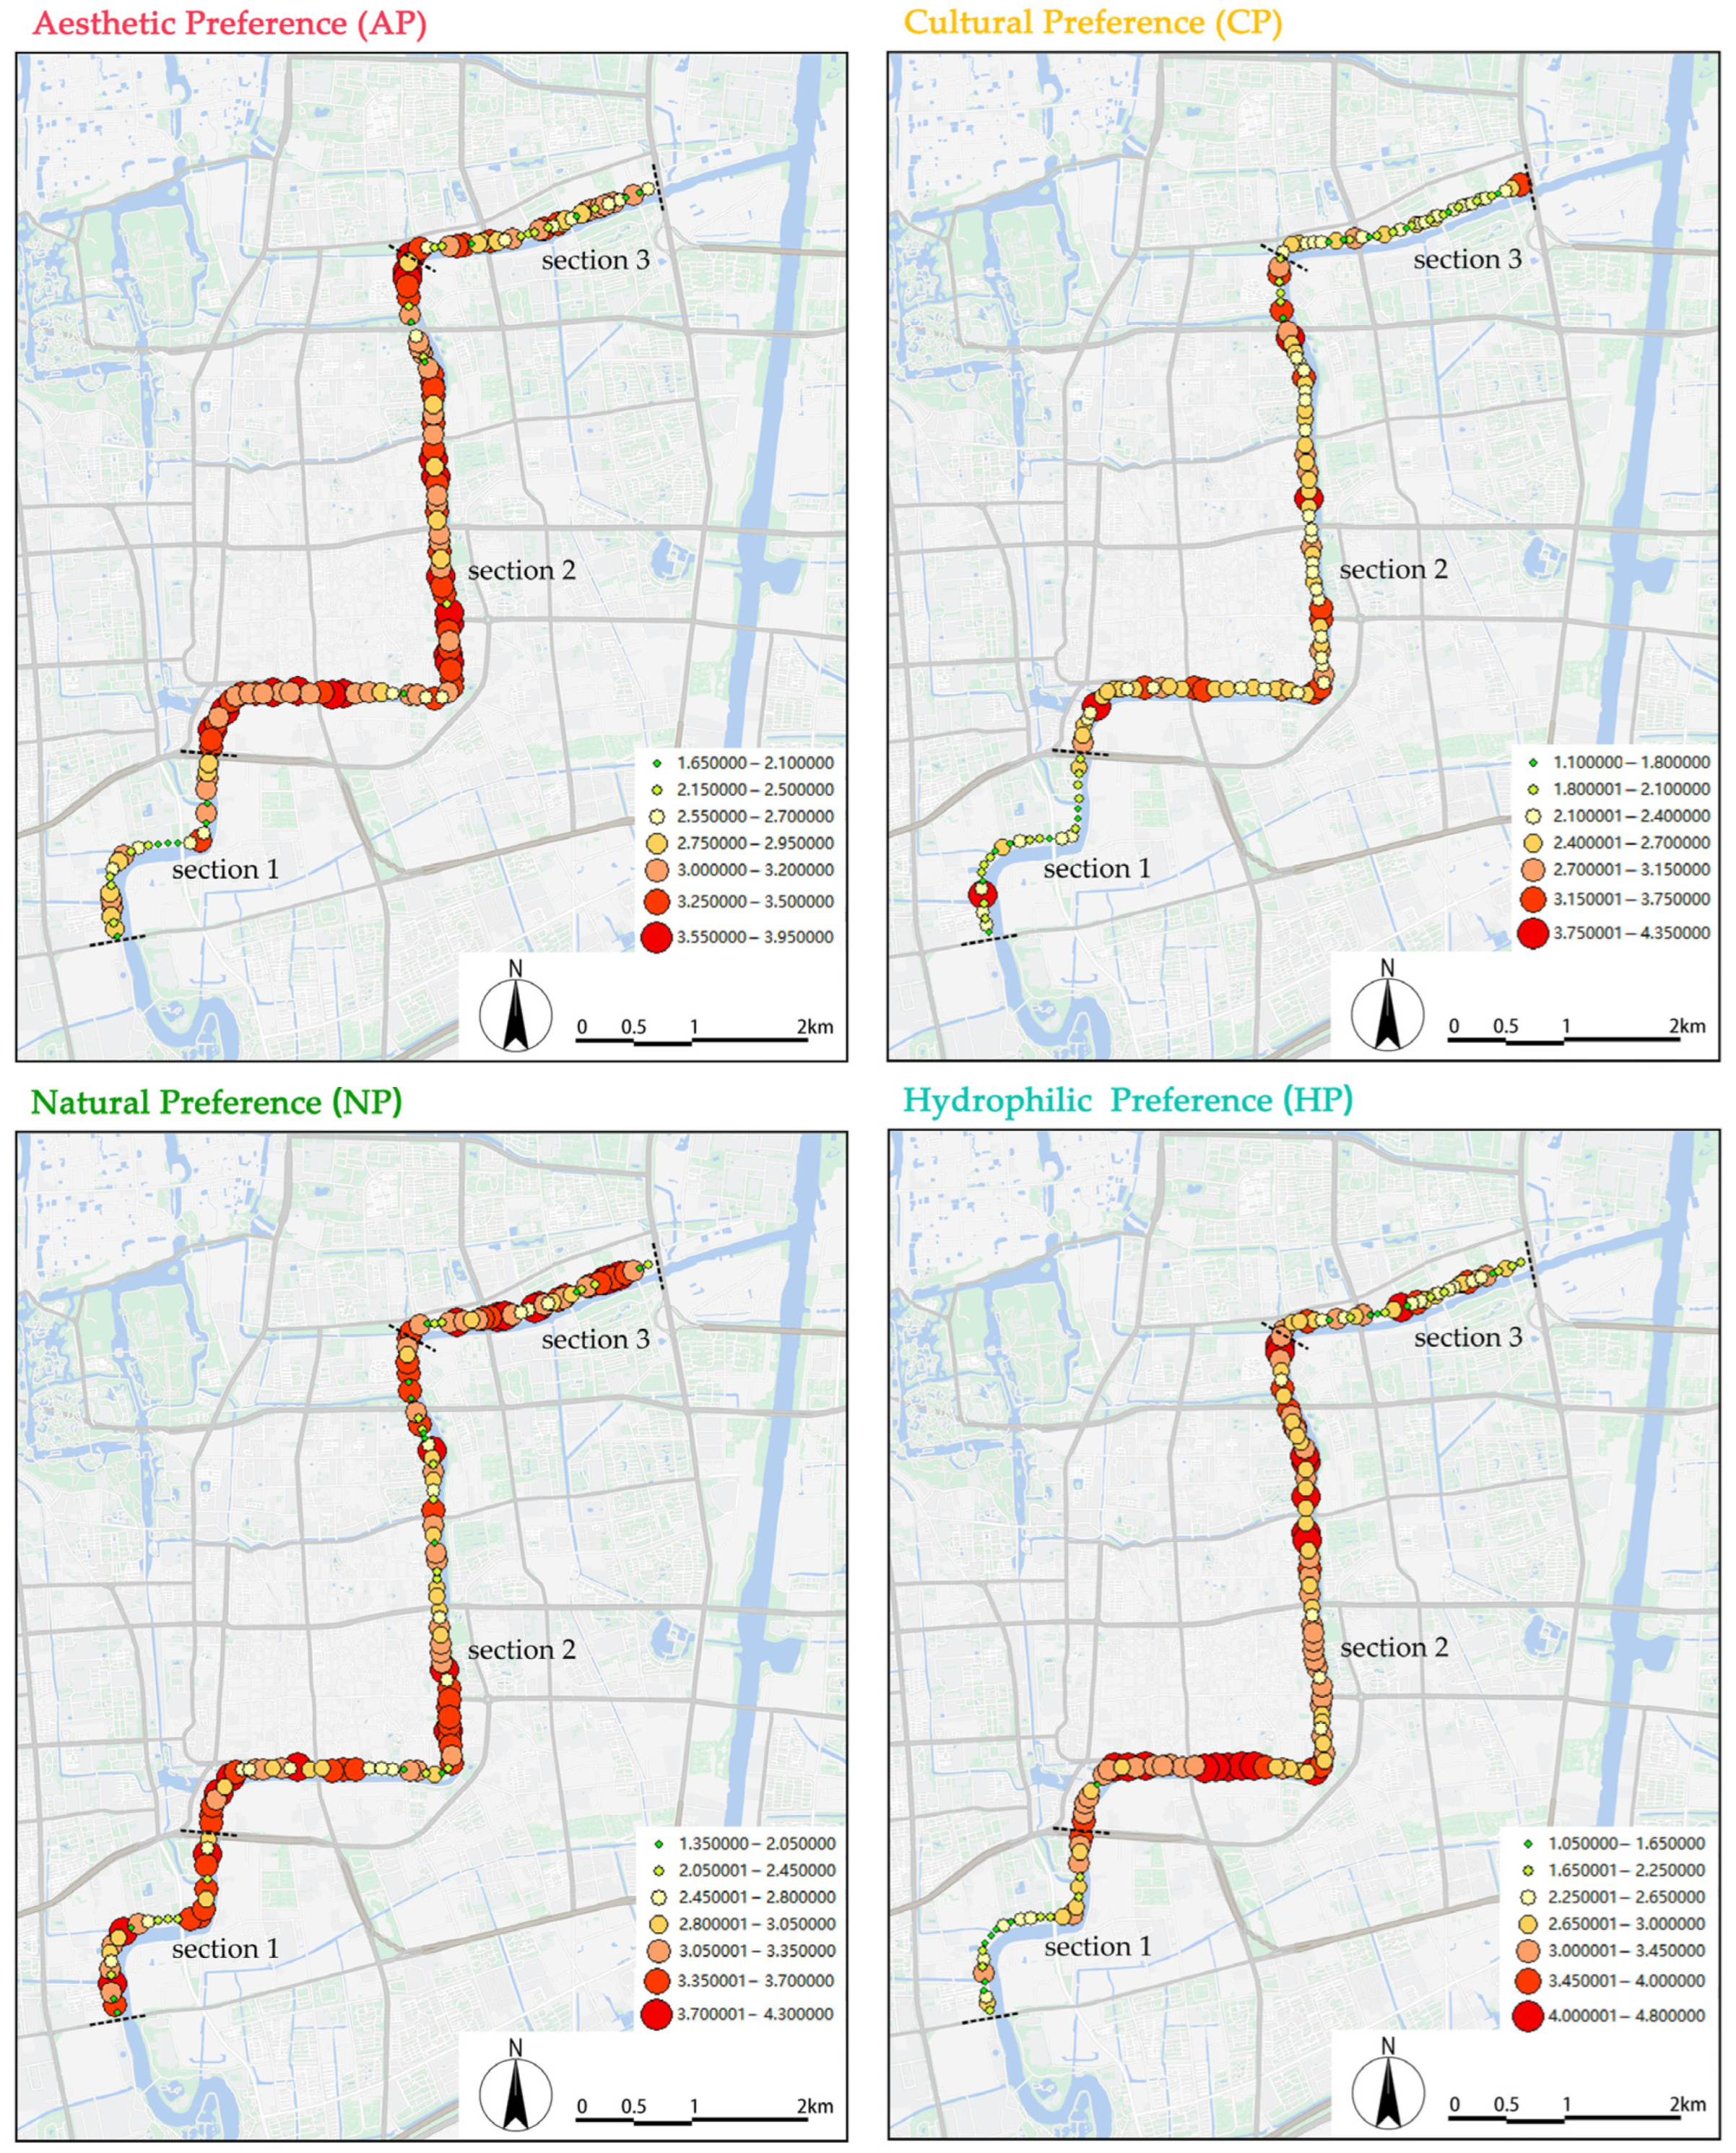
3.3. Differences in Landscape Preferences Across Different Segments

Canal waterfront landscapes exhibit environmental characteristic differences due to variations in spatial location, which in turn affect people’s perceptions and preferences [53]. To investigate the differences in canal landscape preferences across sections, this study classified the canal into three sections: 1—the suburban section; 2—the old city section; and 3—the new city section. A non-parametric one-way ANOVA (Kruskal–Wallis test) was used for post hoc multiple comparisons, resulting in a comparison table and box plots for the four landscape visual preference indicators (Figure 7 and Table 8). The results showed that aesthetic, cultural, and hydrophilic preferences in Section 2 were significantly higher than those in Sections 1 and 3, with no significant differences observed between Sections 1 and 3. The natural preference indicator did not show significant differences across Sections 1, 2, and 3. This corresponds to the environmental characteristic indicators of the three sections, where the river visibility ratio (RVR), water quality (WQ), paving quality (PQ), and cultural facility density (CFD) of Section 2 were significantly higher than those of Section 1 and 3. However, negative artificial indicators such as the bare land ratio (BLR), bridge visibility (BV), waterfront enclosure degree (WED), and interference degree (ID) were significantly lower than in Sections 1 and 3.
Further, using ArcGIS 10.2.2 software, the results of the landscape visual preference evaluations were mapped onto the geographical space of the canal waterfront, creating a visual preference heatmap (Figure 8). The results revealed the following: (1) Areas with high aesthetic preference were mainly concentrated in Section 2 (old city), while Sections 1 (suburban) and 3 (new city) showed significantly lower aesthetic preferences. (2) Cultural preference was generally low overall, but at important nodes in Section 2 (e.g., docks, ferries, ancient buildings), cultural perception was significantly enhanced, exhibiting a node prominence characteristic. (3) The spatial distribution of natural preference was relatively uniform across the three sections, with higher natural perception in the large water bay and South Gate area of Section 3 (new city) and Section 2 (old city), corresponding well with vegetation coverage shown in Google satellite imagery. (4) Hydrophilic preference was higher in Section 2 (old city) overall, mainly concentrated in the South Gate—including Dashuiwan Bay and Dongguan Ancient Ferry—and Dawang Temple sections, whereas hydrophilic perceptions were generally lower in Sections 1 (suburban) and 3 (new city).

4. Discussion

4.1. Factors Influencing Visual Preferences for Heritage Canal Waterfront Landscapes

Heritage canals embody a unique blend of natural and historical cultural characteristics, presenting environmental features distinct from ordinary urban rivers. They have significant historical and cultural value while also playing a role in heritage education [13]. Considering the unique cultural value attributes of heritage canals, exploring the factors influencing visual preferences for these landscapes and the relationships among various landscape preferences is a key objective of this study. The discussion will focus on these two aspects.

4.1.1. Relationships Among Landscape Visual Preferences

Aesthetic preference (or scenic beauty) is generally regarded as one of the most important indicators for evaluating visual preferences. Previous studies have focused on waterfront aesthetic preferences [27,46], but few have explained their associations with other visual perception preferences. This study not only considers aesthetic preference but also incorporates three other significant visual preference indicators: cultural preference, natural preference, and hydrophilic preference. The correlation analysis results in Section 3.1 indicate certain interrelationships among the four visual preference indicators: aesthetic preference is significantly positively correlated with cultural preference, hydrophilic preference, and natural preference, suggesting that all three can enhance people’s aesthetic experience of waterfronts to varying degrees. Conversely, cultural preference exhibits a negative correlation with natural preference but a positive correlation with hydrophilic preference. This may stem from the fact that an increase in hard surfaces, ancient buildings, and cultural facilities enhances cultural perception but diminishes natural perception. Meanwhile, an increase in water area and pavement also positively influences both the cultural and hydrophilic perception indicators.

4.1.2. Environmental Factors Influencing Landscape Visual Preferences

The results from Section 3.2 indicate that the four landscape visual preference indicators are influenced to varying degrees by environmental characteristics, with different environmental elements explaining the indicators to different extents. The specific mechanisms of influence are as follows:
(1)
The factors explaining aesthetic preference include the interference degree (ID), river visibility ratio (RVR), green visibility ratio (GVR), cultural facility density (CFD), and pavement quality (PQ). This indicates that landscape aesthetics involve a complex perceptual process. Increases in blue-green spaces such as waterbodies and vegetation significantly enhance aesthetic inclination value, aligning with findings from numerous previous studies [54,55]. The visibility and strategic positioning of waterbodies, as critical elements of canal waterfront landscapes, contribute positively to visual aesthetic experiences [56,57]. Additionally, natural plant landscapes composed of trees and lawns also promote aesthetic functionality [58,59]. This is similar to the results of a green view index (GVI) analysis of street landscapes [39]. Studies have shown that when the GVI exceeds 15%, people tend to feel comfortable, and a GVI above 30% may lead to a richer impression of greenery [60]. In contrast, some prior studies suggested that artificial structures negatively affect aesthetic preference [48], whereas this research found that cultural structures and landscape facilities (e.g., seating, streetlamps) and high-quality pavements can enhance aesthetic preference to a certain extent. This may be because these well-designed cultural elements achieve a good visual balance with the natural scenery, thereby stimulating the perception of beauty. This can be confirmed through urban river improvement projects such as the Chicago Riverside Trail in the United States and the Cheonggye River in South Korea [61,62], indicating that the aesthetic orientation of heritage canals results from harmonious consideration of both natural and artificial elements.
(2)
Cultural preference is the most unique and significant aspect of landscape perception for heritage canals. With abundant cultural heritage resources such as hydraulic structures, navigation channels, and ancient buildings, cultural significance distinguishes these canals from typical urban rivers. This study found that cultural preference for heritage canal landscapes is primarily influenced by cultural facility density (CFD), the river visibility ratio (RVR), the interference degree (ID), the waterfront enclosure degree (WED), and the bare land ratio (BLR). An increase in cultural facility density and river visibility significantly enhances cultural perception, likely due to the forms of cultural facilities, ancient buildings, and canal water that evoke historical cultural sentiments [63]. The Amsterdam Canal in Netherlands combines landscape architecture with historical and cultural significance, which enriches people’s enjoyment and connection with the environment [7,64]. However, higher disturbance, waterfront enclosure area, and bare land ratios can diminish cultural perception. It is noteworthy that cultural preference scored the lowest among the four indicators, indicating a generally weak cultural perception of the Yangzhou canal waterfront landscape, which requires targeted improvement.
(3)
Natural preference is also an important indicator for measuring canal landscape preferences. This study revealed that natural preference is primarily related to the green visibility ratio (GVR), modern construction density (MCD), and street openness (SO). Abundant vegetation is the most critical factor influencing natural perception. Many studies have confirmed that increased plant density can significantly enhance respondents’ landscape preferences [65,66]. However, an increase in grey artificial structures, such as modern constructions, large bridges, and road squares, significantly reduces natural perception and can impact aesthetic experiences. This may be because the introduction of artificial structures reduces the proportion of natural vegetation, which has also been confirmed in studies related to park green spaces [48].
(4)
Hydrophilic preference serves as an important indicator for measuring the public’s experience and interaction with waterfront landscapes. This study indicated that hydrophilic preference is influenced by the river visibility ratio (RVR), the waterfront enclosure degree (WED), the green visibility ratio (GVR), water quality (WQ), pavement quality (PQ), and the sky visibility ratio (SVR). Larger water surface areas and reduced enclosure can significantly enhance hydrophilicity. Additionally, water quality and pavement quality are crucial factors affecting hydrophilic experiences; clear water and high-quality waterfront pavements are more inviting than murky water and cluttered surfaces. This aligns with previous findings that high-quality river landscapes enhance the overall enjoyment and visual pleasure derived from the surrounding environment [67], encouraging proximity to waterbodies.

4.2. Spatial Differences in Visual Preferences for Canal Waterfront Landscapes Across Different Urban Segments in Urban Areas

Numerous studies have confirmed that differences in environmental characteristics and landscape preferences resulting from geographical location are objectively present [68,69]. The findings in Section 3.3 of this study support this assertion. The canal segment in the old city showed significant differences in aesthetic preference, cultural preference, and hydrophilic preference, which were all higher than in the suburban and new city areas. Higher-rated areas were primarily clustered around docks, ferry crossings, and cultural buildings. This phenomenon can be attributed to two main reasons: (1) The old city possesses richer cultural heritage resources, with more cultural heritage sites and landscape resources due to historical factors, leading to higher aesthetic and cultural quality. Additionally, the fact that it has more open dock spaces contributes to its higher hydrophilicity. (2) Due to cultural heritage protection and tourism development, the canal segment in the core area of the old city benefits from greater construction funding and protective measures. Tourists tend to view the old city as a travel destination, prompting the government to prioritise its development in terms of cultural tourism, resulting in significantly better connectivity and landscape quality compared to surrounding areas. In contrast, the new city and suburban areas often feature disjointed roads and wastelands that have not been effectively preserved or utilised, raising concerns about landscape quality.
These two reasons lead to a significantly higher quality of canal landscapes in the old city compared to the new city and suburban segments. This issue is prevalent and difficult to avoid in the development of many canal cities. However, as a world cultural heritage site, the Grand Canal should be treated as a unified linear entity, and the segments outside the core area also require considerable attention. This study addressed spatial differences in environmental characteristics and landscape preference indicators of heritage canals, which should be prioritised in subsequent planning and design efforts.

4.3. Recommendations for Optimising Planning and Sustainable Management of Heritage Canal Waterfront Landscapes

4.3.1. Enhancing Waterfront Landscape Quality Through Coordination of Blue-Green Natural and Artificial Elements

The evaluation of the quality of heritage canal waterfront landscapes should move away from a singular focus on aesthetics and encompass multiple dimensions, including aesthetic, cultural, natural, and hydrophilic factors. This study’s results indicate that blue-green elements such as vegetation and waterbodies, along with artificial facilities, significantly influence landscape preference for heritage canals. Therefore, improving waterfront landscape quality requires comprehensive consideration of the coordination and integration of blue-green natural and artificial elements. This can be achieved through strategic planting to optimise riverside vegetation, increasing the visibility of canal water surfaces, adding cultural service facilities, and enhancing pavement quality. These measures not only improve aesthetic quality but also ensure a balance among cultural, natural, and hydrophilic elements. In addition, there is a need to enhance urban planners’ and policymakers’ understanding of the multidimensional characteristics of heritage canals, moving beyond traditional planning approaches that prioritise aesthetics. Specifically, it is essential to base the renewal, renovation, and management of these canals on the diverse needs of the public, transforming heritage canal waterfronts into urban public leisure spaces.

4.3.2. Highlighting Historical and Cultural Aspects of the Canal Through Heritage Feature Excavation and Waterfront Space Transformation

Cultural significance is the most important and prominent aspect of landscape perception for heritage canals. This study reveals that the cultural perception indicator of the Yangzhou ancient canal waterfront landscape is relatively weak and significantly lower than the other three visual preference indicators. A key challenge in practical planning and design is how to emphasise the historical and cultural characteristics of the canal’s heritage. This study confirms that cultural constructions, landscape facilities, and pavement quality significantly enhance cultural perception. Elements such as aesthetically designed streetlamps, seating, cultural pavilions, and high-quality pavements in dock squares can evoke a perception of rich historical culture associated with the canal. Additionally, various cultural interpretive displays, tour guide service points, and cultural exhibition walls should be incorporated into the landscape design, utilizing canals as traditional decorative patterns to enhance cultural richness. Furthermore, the canal itself represents a direct carrier of cultural significance; therefore, updating and transforming waterfront space nodes should be prioritised. Excessive barriers and hedges can diminish perceptions of the canal’s cultural significance and hydrophilicity. Thus, at key hydraulic nodes such as docks, sluices, and post stations, it is advisable to increase water accessibility to enhance people’s interaction with and perception of the canal.

4.3.3. Balancing Landscape Quality Disparities Across Different Urban Areas Through Greenway Connectivity and Resource Integration

Significant differences in landscape quality often exist across different urban areas due to variations in historical and cultural resource endowments and management policies. This study found that the canal segment in the old city exhibited significantly higher scores in terms of aesthetic preference, cultural preference, and hydrophilic preference compared to the suburban and new city areas. To address these disparities in actual planning and design processes, different measures are necessary: First, there is a need to establish a continuous greenway along the canal. In particular, many riverside paths in the suburban and new city areas remain disconnected due to inadequate development, which prevents pedestrian access and greatly diminishes waterfront landscape quality. Second, it is crucial to fully integrate various landscape resources into the landscape to create distinct landscape attractions. For instance, while the canal segment in the suburban area may not have as rich cultural resources as the old city, it possesses greater natural landscape resources, and the river morphology is more diverse. Planning should leverage these natural landscape characteristics to highlight the landscape charm of each urban area. Additionally, it is essential to establish an interactive feedback mechanism for canal landscapes, particularly strengthening the relationship between public and private partnerships in canal environment management. By gathering public feedback, issues in different sections of the canal can be identified, and participatory renewal approaches can be used to drive efficient project implementation and management.

5. Conclusions

This study employs image semantic segmentation technology based on panoramic photos to interpret landscape elements and explore the relationships between visual preference indicators for waterfront landscapes of a heritage canal and its environmental characteristics. It investigates the spatial environmental factors influencing the four landscape preference indicators and addresses differences in landscape preference indicators for heritage canals across different urban areas, subsequently proposing relevant planning and design enhancement strategies. This research presents two main innovations: first, it focuses on the unique linear cultural heritage of heritage canals, recognising their distinct attributes compared to typical urban rivers by introducing four indicators—aesthetic preference, cultural preference, natural preference, and hydrophilic preference—to comprehensively assess landscape visual preferences; second, it utilises panoramic photo image semantic segmentation technology to accurately identify 16 landscape elements and compute 12 environmental characteristic indicators, thereby establishing an indicator system for the features of heritage canal waterfront landscapes.
This study identified several significant findings: (1) There are correlations among the four types of landscape preference indicators. Aesthetic preference shows a positive correlation with cultural, natural, and hydrophilic preference, while natural preference displays a negative correlation with both cultural and hydrophilic preference. This highlights the need for a systematic approach to multidimensional preference. (2) Each landscape preference indicator is influenced by different environmental factors. Aesthetic preference is shaped by a combination of blue-green natural elements and artificial features; natural preference is primarily driven by an increase in the green view index; cultural preference is associated with a higher proportion of cultural facilities and high-quality paving; and hydrophilic preference is influenced by larger water surfaces, fewer barriers, and higher water quality. (3) Spatial differences in canal waterfront landscape preference were observed across different urban segments. Overall, the aesthetic, cultural, and hydrophilic preference indicators were higher in the historical city sections compared to the new urban and suburban sections. These findings confirm the link between landscape visual preference and environmental characteristics, providing a robust theoretical basis for the sustainable planning and management of heritage canals.
However, this study has certain limitations, such as its focus on urban parts of heritage canals without extensively addressing rural or suburban areas. Given the disparities between urban and rural areas along the canal, the findings may not be applicable to rural regions. Additionally, to ensure high-quality questionnaire responses, only professionals were invited to participate in the survey, which limits the exploration of differences in landscape preferences among various demographic groups, such as differing ages and occupations. Furthermore, the factors influencing landscape preferences may include complex latent variables like social environment and local policies. This study primarily investigates environmental characteristics and offers preliminary insights into the potential underlying influences of spatial disparities, warranting further research in the future. Nevertheless, this study provides valuable insights and recommendations for the protection and utilisation of heritage canal landscapes. For many urban linear heritage canal corridors that face imbalances between artificial and natural elements or a lack of cultural characteristics, future planning and management should prioritise the integration of blue-green natural elements and artificial components to enhance waterfront landscape quality, highlight the historical and cultural significance of the canal through heritage feature excavation and waterfront space transformation, and balance landscape quality differences across segments through greenway connectivity and resource integration. At the same time, it is important to emphasise the involvement of multiple stakeholders in the heritage management process, strengthening bottom-up public participation in canal planning and management, so that heritage canals can bring greater landscape value and positive experiences to urban residents.

Author Contributions

Conceptualization, X.J. and X.L.; methodology, X.J. and X.Z.; software, X.J. and X.L.; validation, X.J., M.W. and W.Z.; formal analysis, X.J. and X.L.; investigation, X.J. and X.Z.; resources, X.J.; data curation, X.L.; writing—original draft preparation, X.J. and X.L.; writing—review and editing, X.J., M.W. and W.Z.; visualisation, X.J. and X.Z.; supervision, Q.Z., X.C. and Y.L.; project administration, X.J.; funding acquisition, X.J. All authors have read and agreed to the published version of the manuscript.

Funding

This research was funded by the National Natural Science Foundation of China, grant numbers 52408069 and 52408084; the Natural Science Foundation of Jiangsu Province, grant number BK20241563; the Humanities and Social Sciences Research Youth Foundation, Ministry of Education, China, grant numbers 24YJCZH118 and 24YJCZH034.

Data Availability Statement

Due to the privacy and confidentiality of the respondents, the questionnaire data used in this study cannot be made publicly available. However, the data can be accessed upon reasonable request and under the condition that participant privacy is ensured by contacting the corresponding authors.

Acknowledgments

I would like to express my sincere gratitude to the National Natural Science Foundation of China (NSFC), which has been instrumental in the pursuit of my research endeavours. And I extend my thanks to Xingrui Huang, Xiaoyi Wei, and Minjue Wu from the Nanjing Agricultural University for their contributions to the panoramic photo shooting and data processing in this paper.

Conflicts of Interest

The authors declare no conflicts of interest.

References

  1. ReferencesGarau, E.; Torralba, M.; Pueyo-Ros, J. What is a river basin? Assessing and understanding the sociocultural mental constructs of landscapes from different stakeholders across a river basin. Landsc. Urban Plan. 2021, 214, 104192. [Google Scholar] [CrossRef]
  2. Guo, Y.; Fu, B.; Wang, Y.; Xu, P.; Liu, Q. Identifying spatial mismatches between the supply and demand of recreation services for sustainable urban river management: A case study of Jinjiang River in Chengdu, China. Sustain. Cities Soc. 2022, 77, 103547. [Google Scholar] [CrossRef]
  3. Donohoe, H.M. Sustainable heritage tourism marketing and Canada’s Rideau Canal world heritage site. J. Sustain. Tour. 2012, 20, 121–142. [Google Scholar] [CrossRef]
  4. Frenkel, S. Geographical representations of the «Other»: The landscape of the Panama Canal Zone. J. Hist. Geogr. 2002, 28, 85–99. [Google Scholar] [CrossRef]
  5. Simon, A. Mixing Water and Culture: Making the Canal Landscape in Phoenix; Arizona State University: Tempe, AZ, USA, 2002. [Google Scholar]
  6. Won, K.J. The Rise and Decline of Britain’s Canal System: With Special References to the Birmingham Canal Navigations. Sa-Chong 2009, 69, 59–86. [Google Scholar]
  7. Varady, D.P. Amsterdam’s Canal District: Origins, evolution, and future prospects. J. Urban Aff. 2021, 43, 1050–1051. [Google Scholar] [CrossRef]
  8. Tang, L.A.; Jang, S.C. The Evolution from Transportation to Tourism: The Case of the New York Canal System. Tour. Geogr. 2010, 12, 435–459. [Google Scholar] [CrossRef]
  9. Machar, I. The effect of landscape character change on the recreation function of a water management construction in the landscape case study: Bata canal, south moravia (czech republic). In Proceedings of the Conference on Public Recreation and Landscape Protection—With Man Hand in Hand, Mendel Univ, Fac Forestry & Wood Technol, Dept Landscape Management, Brno, Czech Republic, 1–3 May 2013; pp. 190–195. [Google Scholar]
  10. Zhang, S.Y.; Yu, W.T. Canal Heritage Tourism Utilization Models: Experience and Inspirations from the Grand Canal (Beijing Section). Land 2024, 13, 860. [Google Scholar] [CrossRef]
  11. Millman, Z.K. Landscape Narratives and the Construction of Meaning in the Contemporary Urban Canal-Scape; Birmingham City University: England, UK, 2012. [Google Scholar]
  12. Sigley, G.; An, Z.; Song, C.; Su, X. Cultural route heritage as mobility narrative: The world heritage inscription of China’s Grand Canal. Int. J. Herit. Stud. 2024, 30, 997–1009. [Google Scholar] [CrossRef]
  13. Cai, J.; Peng, J. Introduction of Beijing-Hangzhou Grand Canal and analysis of its heritage values. J. Hydro-Environ. Res. 2019, 26, 2–7. [Google Scholar] [CrossRef]
  14. Tang, F.; Wang, L.; Guo, Y.; Fu, M.; Huang, N.; Duan, W.; Luo, M.; Zhang, J.; Li, W.; Song, W. Spatio-temporal variation and coupling coordination relationship between urbanisation and habitat quality in the Grand Canal, China. Land Use Policy 2022, 117, 106119. [Google Scholar] [CrossRef]
  15. Jiang, A.; Sun, F.; Zhang, B.; Wu, Q.; Cai, S.; Yang, Z.; Chang, Y.; Han, R.; Yu, S. Spatiotemporal dynamics and driving factors of vegetation coverage around linear cultural heritage: A case study of the Beijing-Hangzhou Grand Canal. J. Environ. Manag. 2024, 349, 119431. [Google Scholar] [CrossRef]
  16. De Val, G.D.L.F.; Mühlhauser, H.J.U.F.; Greening, U. Visual quality: An examination of a South American Mediterranean landscape, Andean foothills east of Santiago (Chile). Urban For. Urban Green. 2014, 13, 261–271. [Google Scholar] [CrossRef]
  17. Jeon, J.Y.; Jo, H.I. Effects of audio-visual interactions on soundscape and landscape perception and their influence on satisfaction with the urban environment. Build. Environ. 2020, 169, 106544. [Google Scholar] [CrossRef]
  18. Rock, I.; Harris, C.S. Vision and touch. Sci. Am. 1967, 216, 96–104. [Google Scholar] [CrossRef] [PubMed]
  19. Jovanovska, D.; Ruth, S.D.; Fiona, T.S.; Lj, M.J.L.E. Assessing the landscape visual quality of Shar Planina, North Macedonia. Landsc. Ecol. 2020, 35, 2805–2823. [Google Scholar] [CrossRef]
  20. Kalivoda, O.; Vojar, J.; Skřivanová, Z.; Zahradník, D. Consensus in landscape preference judgments: The effects of landscape visual aesthetic quality and respondents’ characteristics. J. Environ. Manag. 2014, 137, 36–44. [Google Scholar] [CrossRef]
  21. Xie, B.; Pang, Z.; He, D.; Lu, Y.; Chen, Y. Effects of neighborhood environment on different aspects of greenway use: Evidence from East Lake Greenway, China. J. Transp. Geogr. 2023, 106, 103488. [Google Scholar] [CrossRef]
  22. Fang, Y.-N.; Tian, J.; Namaiti, A.; Zhang, S.; Zeng, J.; Zhu, X. Visual aesthetic quality assessment of the streetscape from the perspective of landscape-perception coupling. Environ. Impact Assess. Rev. 2024, 106, 107535. [Google Scholar] [CrossRef]
  23. Liu, W.; Hu, X.; Song, Z.; Yuan, X. Identifying the integrated visual characteristics of greenway landscape: A focus on human perception. Sustain. Cities Soc. 2023, 99, 104937. [Google Scholar] [CrossRef]
  24. Li, X.; Wang, X.; Jiang, X.; Han, J.; Wang, Z.; Wu, D.; Lin, Q.; Li, L.; Zhang, S.; Dong, Y. Prediction of riverside greenway landscape aesthetic quality of urban canalized rivers using environmental modeling. J. Clean. Prod. 2022, 367, 133066. [Google Scholar] [CrossRef]
  25. Luo, S.; Xie, J.; Furuya, K.J.L. Assessing the Preference and Restorative Potential of Urban Park Blue Space. Land 2021, 10, 1233. [Google Scholar] [CrossRef]
  26. Clark, N.E.; Lovell, R.; Wheeler, B.W.; Higgins, S.L.; Depledge, M.H.; Norris, K. Evolution. Biodiversity, cultural pathways, and human health: A framework. Trends Ecol. Evol. 2014, 29, 198–204. [Google Scholar] [CrossRef] [PubMed]
  27. Luo, S.; Xie, J.; Furuya, K. Effects of perceived physical and aesthetic quality of urban blue spaces on user preferences–A case study of three urban blue spaces in Japan. Heliyon 2023, 9, e15033. [Google Scholar] [CrossRef] [PubMed]
  28. Subiza-Pérez, M.; Hauru, K.; Korpela, K.; Haapala, A.; Lehvävirta, S. Perceived Environmental Aesthetic Qualities Scale (PEAQS)—A self-report tool for the evaluation of green-blue spaces. Urban For. Urban Green. 2019, 43, 126383. [Google Scholar] [CrossRef]
  29. Zhang, J.; Li, D.; Ning, S.; Furuya, K. Sustainable Urban Green Blue Space (UGBS) and Public Participation: Integrating Multisensory Landscape Perception from Online Reviews. Land 2023, 12, 1360. [Google Scholar] [CrossRef]
  30. Chen, C.; Luo, W.; Li, H.; Zhang, D.; Xia, Y.; Health, P. Impact of Perception of Green Space for Health Promotion on Willingness to Use Parks and Actual Use among Young Urban Residents. Int. J. Environ. Res. Public Heal. 2020, 17, 5560. [Google Scholar] [CrossRef]
  31. Kaltenborn, B.R.P.; Bjerke, T.J.L.; Planning, U. Associations between environmental value orientations and landscape preferences. Landsc. Urban Plan. 2002, 59, 1–11. [Google Scholar] [CrossRef]
  32. Arriaza, M.; Caas-Ortega, J.F.; Caas-Madueo, J.A.; Ruiz-Aviles, P.J.L.; Planning, U. Assessing the visual quality of rural landscapes. Landsc. Urban Plan. 2004, 69, 115–125. [Google Scholar] [CrossRef]
  33. Bishop, I.D.; Rohrmann, B. Subjective responses to simulated and real environments: A comparison. Landsc. Urban Plan. 2003, 65, 261–277. [Google Scholar] [CrossRef]
  34. Zhang, L.-M.; Zhang, R.-X.; Jeng, T.-S.; Zeng, Z.-Y. Cityscape protection using VR and eye tracking technology. J. Vis. Commun. Image Represent. 2019, 64, 102639. [Google Scholar] [CrossRef]
  35. Nagata, S.; Nakaya, T.; Hanibuchi, T.; Amagasa, S.; Kikuchi, H.; Inoue, S. Objective scoring of streetscape walkability related to leisure walking: Statistical modeling approach with semantic segmentation of Google Street View images. Health Place 2020, 66, 102428. [Google Scholar] [CrossRef]
  36. Wang, J.; Liu, W.; Gou, A. Numerical characteristics and spatial distribution of panoramic Street Green View index based on SegNet semantic segmentation in Savannah. Urban For. Urban Green. 2022, 69, 127488. [Google Scholar] [CrossRef]
  37. Aikoh, T.; Homma, R.; Abe, Y. Comparing conventional manual measurement of the green view index with modern automatic methods using google street view and semantic segmentation. Urban For. Urban Green. 2023, 80, 127845. [Google Scholar] [CrossRef]
  38. Lee, S.; Son, Y. Mapping of user-perceived landscape types and spatial distribution using crowdsourced photo data and machine learning: Focusing on Taeanhaean National Park. J. Outdoor Recreat. Tour. 2023, 44, 100616. [Google Scholar] [CrossRef]
  39. Zhang, F.; Zhou, B.; Liu, L.; Liu, Y.; Fung, H.H.; Lin, H.; Ratti, C. Measuring human perceptions of a large-scale urban region using machine learning. Landsc. Urban Plan. 2018, 180, 148–160. [Google Scholar] [CrossRef]
  40. Luo, J.; Zhao, T.; Cao, L.; Biljecki, F. Semantic Riverscapes: Perception and evaluation of linear landscapes from oblique imagery using computer vision. Landsc. Urban Plan. 2022, 228, 104569. [Google Scholar] [CrossRef]
  41. Chesnokova, O.; Purves, R.S. From image descriptions to perceived sounds and sources in landscape: Analyzing aural experience through text. Appl. Geogr. 2018, 93, 103–111. [Google Scholar] [CrossRef]
  42. Sun, Y.; Hao, Z.; Chang, H.; Yang, J.; Ding, G.; Guo, Z.; He, X.; Huang, J. Accurate mapping of rapeseed fields in the initial flowering stage using Sentinel-2 satellite images and convolutional neural networks. Ecol. Indic. 2024, 162, 112027. [Google Scholar] [CrossRef]
  43. Yang, J.; Matsushita, B.; Zhang, H. Improving building rooftop segmentation accuracy through the optimization of UNet basic elements and image foreground-background balance. ISPRS J. Photogramm. Remote Sens. 2023, 201, 123–137. [Google Scholar] [CrossRef]
  44. Xie, E.; Wang, W.; Yu, Z.; Anandkumar, A.; Alvarez, J.M.; Luo, P. SegFormer: Simple and Efficient Design for Semantic Segmentation with Transformers. Adv. Neural Inf. Process. Syst. 2021, 34, 12077–12090. [Google Scholar]
  45. Navarrete-Hernandez, P.; Laffan, K. A greener urban environment: Designing green infrastructure interventions to promote citizens’ subjective wellbeing. Landsc. Urban Plan. 2019, 191, 103618. [Google Scholar] [CrossRef]
  46. Li, Y.W.; Qiu, B. Using Deep Learning Approaches to Quantify Landscape Preference of the Chinese Grand Canal: An Empirical Case Study of the Yangzhou Ancient Canal. Sustainability 2024, 16, 3602. [Google Scholar] [CrossRef]
  47. Wang, X.; Han, F. Reconnect the City of Yangzhou with World Heritage Grand Canal Landscape. In Proceedings of the Proceedings of the 51st Isocarp Congress, Rotterdam, The Netherlands, 19–23 October 2015. [Google Scholar]
  48. Gungor, S.; Polat, A.T. Relationship between visual quality and landscape characteristics in urban parks. J. Environ. Prot. Ecol. 2018, 19, 939–948. [Google Scholar]
  49. Li, J.; Huang, Z.; Zheng, D.; Zhao, Y.; Huang, P.; Huang, S.; Fang, W.; Fu, W.; Zhu, Z. Effect of Landscape Elements on Public Psychology in Urban Park Waterfront Green Space: A Quantitative Study by Semantic Segmentation. Forests 2023, 14, 244. [Google Scholar] [CrossRef]
  50. Jahani, A.; Allahverdi, S.; Saffariha, M.; Alitavoli, A.; Ghiyasi, S. Environmental modeling of landscape aesthetic value in natural urban parks using artificial neural network technique. Model. Earth Syst. Environ. 2022, 8, 163–172. [Google Scholar] [CrossRef]
  51. Xu, D.; Li, Y.J.C.L.A. Experts and public aesthetic differences based on SD-SBE method. Chin. Landsc. Archit. 2014, 30, 52–56. [Google Scholar]
  52. Li, J.; Huang, Z.; Zhu, Z.; Ding, G. Coexistence Perspectives: Exploring the impact of landscape features on aesthetic and recreational values in urban parks. Ecol. Indic. 2024, 162, 112043. [Google Scholar] [CrossRef]
  53. Zhang, W.; Zeng, H. Spatial differentiation characteristics and influencing factors of the green view index in urban areas based on street view images: A case study of Futian District, Shenzhen, China. Urban For. Urban Green. 2024, 93, 128219. [Google Scholar] [CrossRef]
  54. Xia, Y.; Yabuki, N.; Fukuda, T. Development of a system for assessing the quality of urban street-level greenery using street view images and deep learning. Urban For. Urban Green. 2021, 59, 126995. [Google Scholar] [CrossRef]
  55. Yu, X.; Qi, W. Measuring vegetation greenery in park using iPhone panoramic image and a new green vegetation extraction index. Urban For. Urban Green. 2021, 65, 127310. [Google Scholar] [CrossRef]
  56. Kaplan, R.; Herbert, E.J. Cultural and sub-cultural comparisons in preferences for natural settings. Landsc. Urban Plan. 1987, 14, 281–293. [Google Scholar] [CrossRef]
  57. Petrova, E.G.; Mironov, Y.V.; Aoki, Y.; Matsushima, H.; Ebine, S.; Furuya, K.; Petrova, A.; Takayama, N.; Ueda, H.; Science, P. Comparing the visual perception and aesthetic evaluation of natural landscapes in Russia and Japan: Cultural and environmental factors. Prog. Earth Planet. Sci. 2015, 2, 6. [Google Scholar] [CrossRef]
  58. Santosa, H.; Ernawati, J.; Wulandari, L.D. Visual quality evaluation of urban commercial streetscape for the development of landscape visual planning system in provincial street corridors in Malang, Indonesia. IOP Conf. Series: Earth Environ. Sci. 2018, 126, 01220. [Google Scholar] [CrossRef]
  59. Fumagalli, N.; Maccarini, M.; Rovelli, R.; Berto, R.; Senes, G. An Exploratory Study of Users’ Preference for Different Planting Combinations along Rural Greenways. Sustainability 2020, 12, 2120. [Google Scholar] [CrossRef]
  60. Li, X.; Zhang, C.; Li, W.; Ricard, R.; Meng, Q.; Zhang, W. Assessing street-level urban greenery using Google Street View and a modified green view index. Urban For. Urban Green. 2015, 14, 675–685. [Google Scholar] [CrossRef]
  61. Al-Kodmany, K. Chapter 2—Reviving aging cities’ infrastructure: The case of riverfronts. In Progress in Sustainable Development; Ting, D., O’Brien, P., Eds.; Elsevier: Amsterdam, The Netherlands, 2023; pp. 55–72. [Google Scholar] [CrossRef]
  62. Woo, H. Trends in ecological river engineering in Korea. J. Hydro-Environ. Res. 2010, 4, 269–278. [Google Scholar] [CrossRef]
  63. Zhou, L.; Zhao, Y.; Yang, X.; He, J.; Wang, H. Identification of important terraced visual landscapes based on a sensitivity-subjectivity preference matrix for agricultural cultural heritage in the southwestern china. Ecol. Indic. 2023, 154, 110573. [Google Scholar] [CrossRef]
  64. Song, Y.; Yang, R.; Lu, H.; Fernandez, J.; Wang, T. Why do we love the high line? A case study of understanding long-term user experiences of urban greenways. Comput. Urban Sci. 2023, 3, 18. [Google Scholar] [CrossRef]
  65. Polat, A.T.; Akay, A. Relationships between the visual preferences of urban recreation area users and various landscape design elements. Urban For. Urban Green. 2015, 14, 573–582. [Google Scholar] [CrossRef]
  66. Sharafatmandrad, M.; Mashizi, A.K.J.E.e. Visual value of rangeland landscapes: A study based on structural equation modeling. Ecol. Eng. 2020, 146, 105742. [Google Scholar] [CrossRef]
  67. Fan, R.; Yocom, K.P.; Guo, Y. Utilizing Fractal Dimensions as Indicators to Detect Elements of Visual Attraction: A Case Study of the Greenway along Lake Taihu, China. Land 2023, 12, 883. [Google Scholar] [CrossRef]
  68. Meng, C.; Chen, Y.; Yang, J.; Su, X.; Guo, W.; Zhang, K. Association between multilevel landscape characteristics and rural sustainability: A case study of the water-net region in the Yangtze River Delta, China. Ecol. Inform. 2024, 82, 102677. [Google Scholar] [CrossRef]
  69. Zhang, W.; Su, Y. Perception study of urban green spaces in Singapore urban parks: Spatio-temporal evaluation and the relationship with land cover. Urban For. Urban Green. 2024, 99, 128455. [Google Scholar] [CrossRef]
Figure 1. Research framework.
Land 14 00220 g001
Figure 2. Location map and representative panoramic photos.
Land 14 00220 g002
Figure 3. Segmentation flow diagram. Comparison of original photos and segmented images.
Land 14 00220 g003
Figure 4. Average ratios of segmented elements in photos.
Land 14 00220 g004
Figure 5. Summary of three photos with high and low landscape visual preference scores.
Land 14 00220 g005
Figure 6. Correlation heatmap of landscape visual preferences and environmental characteristic indicators.
Land 14 00220 g006
Figure 7. Box plot of landscape visual preference results across three sections (*** p < 0.001, ns means no significance).
Land 14 00220 g007aLand 14 00220 g007b
Figure 8. Heatmap of landscape visual preference perception.
Land 14 00220 g008
Table 1. Image segmentation elements.
No.CategoryCode
1treeAt,n
2grassAg,n
3bare landAbl,n
4waterAw,n
5skyAs,n
6hard pavementAhp,n
7personAp,n
8fenceAf,n
9modern constructionAmc,n
10historic buildingAhb,n
11bridgeAbr,n
12carAc,n
13boatAbo,n
14landscape facilityAlf,n
15disruptorsAd,n
16othersAo,n
Table 2. Environmental feature indicators.
TypeNo.Index ItemIndicator Selection BasisIndex Calculation
Blue-green: nature- and water-related indicators1Green visibility ratio (GVR)The proportion of green plants in people’s view emphasises the three-dimensional visual effect of greening.At,n + Ag,n
2Sky visibility ratio (SVR)The proportion of sky in what people see with their eyes emphasises the visual effect of sky visibility.As,n
3River visibility ratio (RVR)The proportion of waterbodies in what people see with their eyes emphasises the visual effect of water visibility.Aw,n
4Water quality (WQ)Water quality has an impact on people’s perception of hydrophilicity and aesthetics.5-level rating
5Bare land ratio (BLR)The proportion of bare ground in the picture reflects the degree of bare ground.Abl,n
Grey: artificial construction indicators6Street openness (SO)The proportion of hard paved streets and roads in the images people see reflects the degree of openness of urban streets.Ahp,n
7Pavement quality (PQ)The quality of hard pavement affects people’s evaluation of landscape quality.5-level rating
8Modern construction density (MCD)The proportion of modern architecture that people see with their eyes emphasises the degree of engineering construction.Amc,n
9Cultural facility density (CFD)The proportion of cultural buildings and related constructions (such as historic buildings, boats, streetlights, etc.) has an impact on cultural perception.Ahb,n + Abo,n + Alf,n
10Bridge visibility (BV)The existence of bridges affects the linear spatial pattern of canals, and the proportion of bridges in people’s view affects the visual effect of the landscape.Abr,n
11Waterfront enclosure degree (WED)The proportion of riverbank enclosures in the picture affects people’s perception of security and hydrophilicity.Af,n
12Interference degree (ID)This is the overall visual proportion of obstacles, piled-up debris, garbage, pipelines, cars, etc.Ad,n + Ac,n
Table 3. Landscape preference evaluation questions.
FactorsSurvey Questionslevel
Aesthetic preference (AP)Do you think the scenery here is beautiful?1–5
Cultural preference (CP)Do you think this place reflects the historical and cultural heritage of the canal?1–5
Natural preference (NP)Do you think this place is natural?1–5
Hydrophilic preference (HP)Do you think it’s easy to access water here?1–5
Note: 1 = strongly unwilling; 2 = unwilling; 3 = neutral; 4 = agree; 5 = strongly agree.
Table 4. The basic information statistics of the participants.
InformationProportion
genderMale (47.5%), female (52.5%)
age20–25 (35%), 26–30 (51.25%), 31–35 (13.75%)
occupationundergraduates (22.5%), graduate students (30%), doctoral students (18.75%), university teachers (15%), professionals (13.75%)
familiarity with the canalfamiliar with or visited the canal (61.25%),
not familiar with or visited the canal (38.75%)
Table 5. Correlations among the four landscape visual preferences.
CorrelationAesthetic Preference (AP)Cultural Preference (CP)Natural Preference (NP)Hydrophilic Preference (HP)
Aesthetic Preference (AP)1---
Cultural Preference (CP)0.474 **1--
Natural Preference (NP)0.455 **−0.193 *1-
Hydrophilic Preference (HP)0.465 **0.584 **−0.0901
Note: * p < 0.05; ** p < 0.01.
Table 6. Correlations between landscape visual preferences and environmental characteristic indicators.
CorrelationAesthetic Preference (AP)Cultural
Preference (CP)
Natural Preference (NP)Hydrophilic Preference (HP)
Green visibility ratio (GVR)0.207 *−0.297 **0.715 **−0.309 **
Sky visibility ratio (SVR)−0.1480.072−0.384 **0.139
River visibility ratio (RVR)0.402 **0.442 **−0.0660.767 **
Water quality (WQ)0.344 **0.412 **−0.1160.706 **
Bare land ratio (BLR)−0.352 **−0.419 **0.222 **−0.358 **
Street openness (SO)−0.245 **−0.054−0.309 **−0.105
Pavement quality (PQ)0.414 **0.495 **−0.1460.509 **
Modern construction density (MCD)−0.252 **−0.070−0.255 **−0.117
Cultural facility density (CFD)0.324 **0.653 **−0.208*0.400 **
Bridge visibility (BV)0.0120.184 *−0.1170.111
Waterfront enclosure degree (WED)−0.152−0.343 **0.157−0.577 **
Interference degree (ID)−0.443**−0.404 **−0.036−0.451 **
Note: * p < 0.05; ** p < 0.01.
Table 7. Stepwise multiple regression results.
Dependent VariableIndependent VariableUnstandardized
Coefficients
Standardised CoefficientstpCollinearity
Statistics
BStd. ErrorBetaToleranceVIF
Aesthetic Preference (R2 = 0.541, Adj R2 = 0.525)Constant1.5030.187 8.023<0.001
Interference degree (ID)−0.0820.024−0.229−3.433<0.0010.7171.394
River visibility ratio (RVR)0.0270.0050.3585.616<0.0010.7841.276
Green visibility ratio (GVR)0.0250.0040.4236.496<0.0010.7501.333
Cultural facility density (CFD)0.0320.0080.2554.018<0.0010.7911.264
Paving quality (PQ)0.1410.0370.2663.787<0.0010.6441.553
Cultural Preference (R2 = 0.663, Adj R2 = 0.651)Constant2.2060.127 17.369<0.001
Cultural facility density (CFD)0.0900.0070.66113.244<0.0010.9401.064
River visibility ratio (RVR)0.0150.0050.1802.9450.0040.6291.589
Interference degree (ID)−0.0650.020−0.167−3.2150.0020.8681.152
Waterfront enclosure degree (WED)−0.0230.010−0.132−2.2990.0230.7111.407
Bare land ratio (BLR)−0.0190.009−0.118−2.1490.0330.7761.288
Natural Preference (R2 = 0.544, Adj R2 = 0.535)Constant2.4890.174 14.290<0.001
Green visibility ratio (GVR)0.0440.0040.61210.433<0.0010.9071.103
Modern construction density (MCD)−0.0810.023−0.199−3.4650.0010.9491.053
Street openness (SO)−0.0220.007−0.189−3.2750.0010.9411.062
Hydrophilic Preference (R2 = 0.842, Adj R2 = 0.835)Constant2.9100.300 9.692<0.001
River visibility ratio (RVR)0.0580.0070.4648.348<0.0010.3572.799
Waterfront enclosure degree (WED)−0.0900.011−0.335−7.964<0.0010.6241.602
Green visibility ratio (GVR)−0.0230.004−0.239−5.697<0.0010.6281.593
Paving quality (PQ)0.0910.0320.1052.8030.0060.7941.26
Sky visibility ratio (SVR)−0.0140.005−0.119−2.7720.0060.5991.668
Water quality (WQ)0.1190.0460.1372.6020.0100.3982.510
Table 8. Non-parametric one-way ANOVA multiple comparison results.
Multiple ComparisonSample 1-Sample 2Test StatisticsStd. ErrorStd. Statistical TestpAdj. p a
Aesthetic Preference (AP)1-3−7.58211.707−0.6480.5171.000
1-2−49.6129.333−5.315<0.0010.000
3-242.039.4664.44<0.0010.000
Cultural Preference (CP)1-3−17.5111.705−1.4960.1350.404
1-2−57.7589.331−6.19<0.0010.000
3-240.2499.4644.253<0.0010.000
Hydrophilic Preference (HP)1-3−4.79411.712−0.4090.6821.000
1-2−50.8569.337−5.447<0.0010.000
3-246.0629.474.864<0.0010.000
Note: due to the fact that for natural preference (NP), we did not detect significant differences between samples in the overall test, multiple comparisons were not performed. Asymptotic significance (two-sided test): p = 0.050. a The significance values were adjusted using Bonferroni’s correction method for multiple tests.
Disclaimer/Publisher’s Note: The statements, opinions and data contained in all publications are solely those of the individual author(s) and contributor(s) and not of MDPI and/or the editor(s). MDPI and/or the editor(s) disclaim responsibility for any injury to people or property resulting from any ideas, methods, instructions or products referred to in the content.

