Article

Monitoring of Soil Salinity in the Weiku Oasis Based on Feature Space Models with Typical Parameters Derived from Sentinel-2 MSI Images

by
Nigara Tashpolat
1,2,* and
Abuduwaili Reheman
1
1
College of Geography and Remote Sensing Sciences, Xinjiang University, Urumqi 830046, China
2
Xinjiang Key Laboratory of Oasis Ecology, Xinjiang University, Urumqi 830046, China
*
Author to whom correspondence should be addressed.
Land 2025, 14(2), 251; https://doi.org/10.3390/land14020251
Submission received: 31 December 2024 / Revised: 17 January 2025 / Accepted: 21 January 2025 / Published: 25 January 2025

Abstract

:
Soil salinization, as one of the types of land degradation, is a global threat. It not only poses serious ecological problems, but also poses great challenges for the sustainable utilization of land resources, especially in arid and semi-arid areas. The Weiku Oasis is undoubtedly one of the typical areas under severe salinization. The wide spread of saline soil brings numerous negative impacts to the local region. To prevent the escalation of soil salinization, timely monitoring of soil salinization is urgently needed for informed decision-making. Remote sensing technology can obtain large-scale datasets in a short period, allowing researchers to carry out the rapid and accurate investigation of soil salinization. Sentinel-2 images have a relatively high spatial resolution and provide red-edge bands data, referring to bands 5, 6, and 7, and the use of red-edge bands is a new approach to estimate soil salinization in the Weiku Oasis. In this study, we selected five typical indices (NDre1, RNDSI, MSAVI, NDWI, SI3, with the first two being red-edge indices) from twenty potential indices to construct multiple two-dimensional feature space models. Consequently, an optimal and novel monitoring index for soil salinization in the Weiku Oasis was developed. The result showed that: (1) The monitoring index MSAVI-RNDSI, which includes red-edge indices, had the highest inversion accuracy of R2 = 0.7998 and MAE = 3.3444; (2) The red-edge salinity indices effectively captured the conditions of salinization, with the feature space model composed of red-edge indices achieving an average inversion accuracy of R2 = 0.7902; (3) Land-use type was identified as the primary factor affecting the degree of soil salinization in the study area. The proposed approach provides a highly accurate and high-resolution soil salinity mapping strategy.

1. Introduction

Soil salinization is a critical global environmental challenge, degrading land and impacting agricultural productivity. Over the years, soil salinization has become a major cause of global land degradation, not only threatening the ecological environment, but also damaging the limited soil resources worldwide [1,2]. Soil salinization refers to the ecological issues caused by the movement of soluble salts into the surface soil. This process is usually affected by natural conditions such as climate, terrain, soil, hydrology, and geology [3,4]. Human activities, such as cultivation, excessive irrigation, inadequate drainage, and the use of low-quality irrigation water, can also significantly influence soil salinization, potentially leading to secondary salinization [5]. Currently, the area affected by soil salinization worldwide is slightly larger than that of the continental United States, and is expected to grow rapidly due to climate change [6]. Soil salinization primarily occurs in arid and semi-arid regions [7], which is consistent with the observation that in China, soil salinization is predominantly found in northwestern provinces such as Xinjiang, Gansu, and Ningxia, where there is high evaporation and low precipitation [8]. This type of land degradation reduces soil fertility, accelerates the decomposition of organic matter, hinders the growth of vegetation, and affects the net primary productivity of plants, which in turn threatens local crop yields and land sustainability, undermines regional carbon sequestration, and ultimately has a major impact on the societies and economies of arid and semi-arid regions [9,10]. Therefore, there is a great necessity to monitor the conditions and changing process of soil salinization, and to support the sustainable development of the local area through the collection and analysis of this information [11].
The traditional method of measuring the salt salinity of soil is to collect natural soil samples and analyze them in a laboratory to determine the conductivity and concentration of solutes. However, this method requires dense sampling (which means that it is time- and money-consuming) to fully characterize the spatial variability of the research area, making it difficult to dynamically monitor the soil salinization on a large scale [12]. To overcome these obstacles, since the 1960s, researchers have increasingly used remote sensing technology, which has the advantages of fast data acquisition, low cost, and large scale [13,14,15]. Though remote sensing technology shows significant advantages in the timely monitoring and inversion of salinization, it does not mean that the traditional method is out of date; the combination of these two methods (using the traditional method to validate and remote sensing technology to obtain large-scale datasets) can help in obtaining the information about soil salinization precisely and efficiently, and this combination has become a common means for domestic and foreign scholars to study soil salinization [16]. At present, with the continuous progress that has been made in remote sensing techniques, remote sensing tools have become a very common and effective way to quantitatively obtain information about soil salinization [17].
Remote sensing images have many features, such as spectral, texture, and spatial features. Among them, the most used one is the spectral feature, which is the foundation of interpreting the ground target. Thus, it can be said that studies of soil salinization are a potential application of spectral indices [18]. In general, soils affected by salinization tend to show higher spectral reflectance than normal soils, which becomes higher and higher with an increase in soil salinity [19]. Based on this rule, researchers have found that using salinity indices can help in monitoring the conditions of soil salinization more effectively on a large scale [20]. Also, the conditions of soil salinization can be obtained through an indirect method, like using vegetation indices. With an increase in soil salinity, the vegetation that grows above is inevitably influenced, and cannot survive long-term, causing a decrease in vegetation indices [21,22]. A reliable theoretical basis for changes in soil salinity can be observed from these indices [23].
To further improve the accuracy of monitoring, researchers have made significant progress through combining various spectral indices [24,25,26]. Regarding these combined strategies, many researchers, both domestic and international, have used salinity, vegetation, and other characteristic parameters to develop feature space models for quantitative research on soil salinization [27]. Frontier studies have confirmed that feature space models constructed with characteristic parameters are significantly correlated with soil salinity, making these models a mainstream tool for monitoring soil salinization [28]. However, a limitation in previous studies is that only a few have used Sentinel-2 images as their data source, while others have used Landsat images. Landsat images, though widely used, have lower spatial resolutions (15 m for B8 and 30 m for B1-7, B9) and fewer spectral bands compared to Sentinel-2 images. For example, Sentinel-2 images include three additional red-edge bands which are valuable for addressing environmental issues. These red-edge bands, located between the near-infrared and red light bands, are highly sensitive to vegetation growth, due to their ability to detect slight changes in canopy structure and chlorophyll content. The red-edge indices derived from these bands are more effective in assessing the chemical and physical conditions of vegetation, providing a reliable method for evaluating vegetation status. Thus, red-edge indices hold great potential for monitoring soil salinization. Integrating these indices into feature space models for monitoring soil salinization in the Weiku Oasis offers significant practical value, and can serve as a reference for other researchers in the field.
The focus of this study is to monitor soil salinization in land distributed in the Weiku Oasis, which includes a wide range of land-use types, including desert and cropland. To improve the monitoring of soil salinization and explore the potential and capabilities of red-edge indices for this purpose in the Weiku Oasis, we utilized Sentinel-2 images. These images offer a better spatial resolution and more extensive spectral information, particularly through the use of red-edge bands. We used the red-edge indices calculated from these bands, along with conventional indices, as characteristic parameters to develop feature space models. The specific objectives of this study are as follows: (1) to calculate and evaluate typical indices based on Sentinel-2 images, with a focus on verifying the applicability of red-edge indices; (2) to propose an optimal and novel monitoring index for soil salinization in the Weiku Oasis based on the feature space model; (3) to explore the spatial distribution of soil salinization in the study area and analyze its causes; and (4) to compare the effectiveness of red-edge indices with conventional indices and assess the discrepancies in their respective feature space models.

2. Materials and Methods
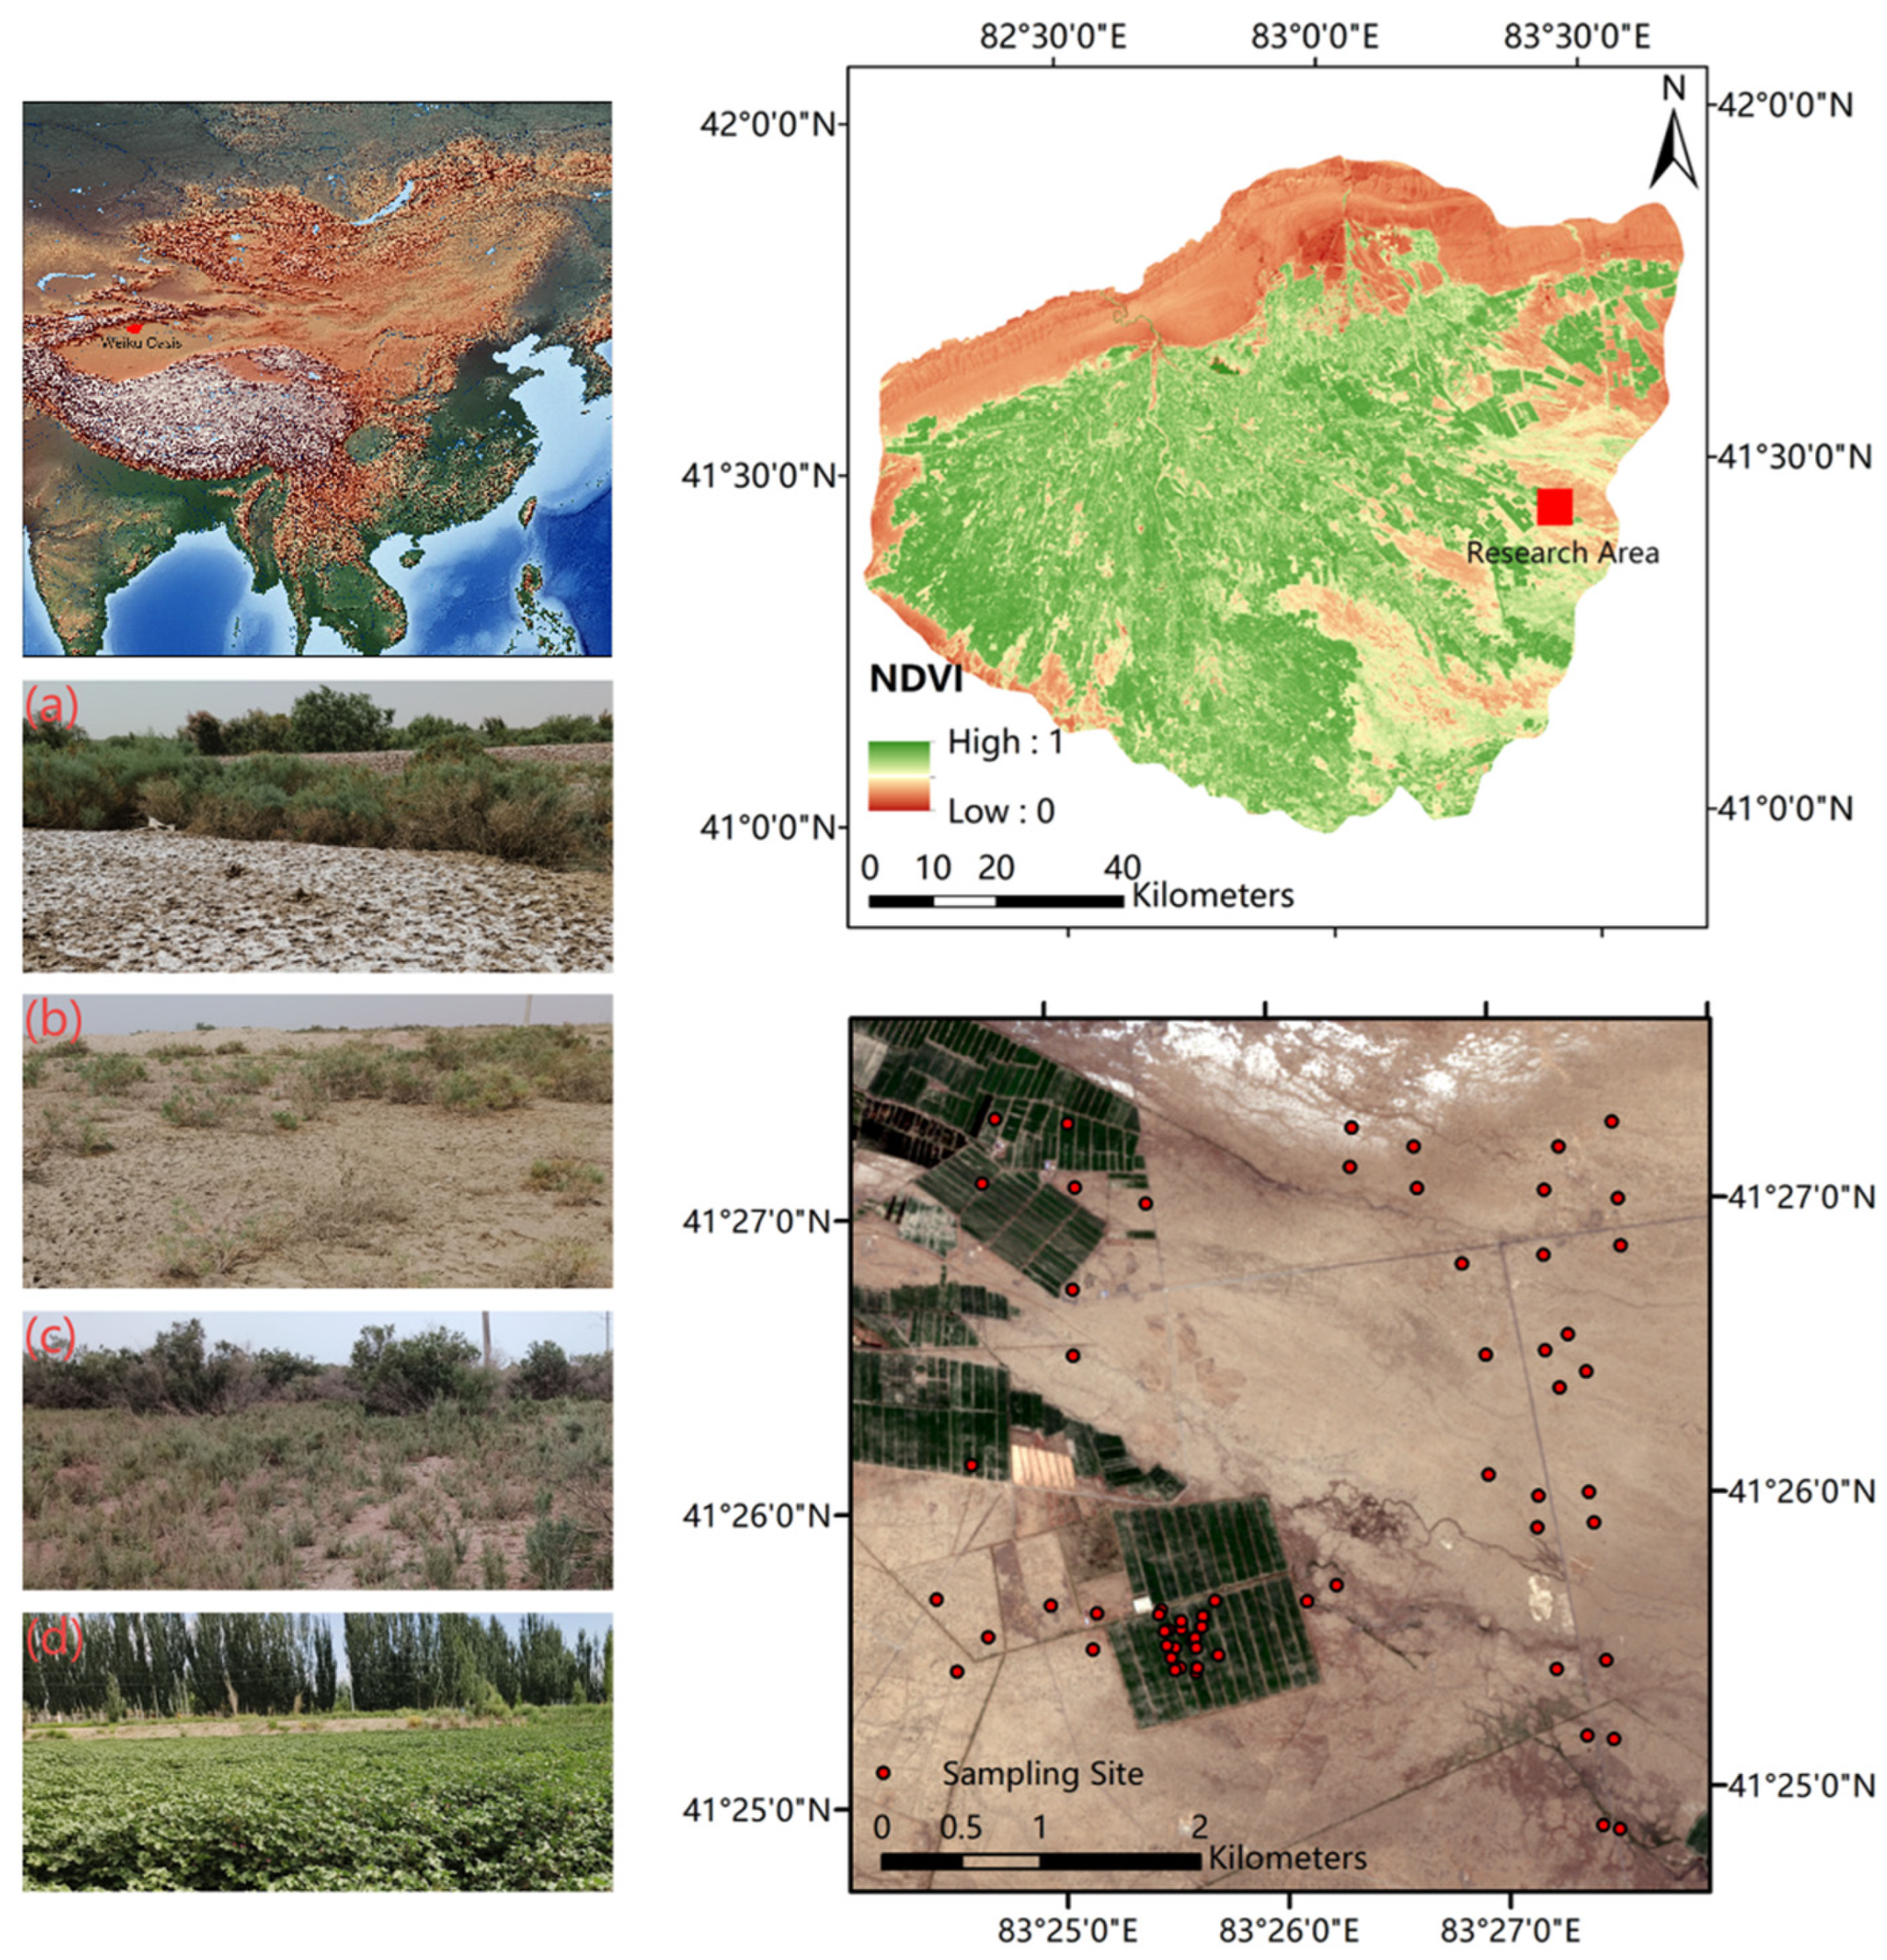
2.1. Study Area

This study focuses on the Ogan–Kucha River Oasis (often referred to as the Weiku Oasis, see Figure 1), located in the central part of Xinjiang. The oasis is situated between the Tarim River to the south and the Tianshan Mountains to the north. It encompasses Kuche, Shaya, and Xinhe counties, with coordinates ranging from 41°06′ to 41°38′ latitude and 81°26′ to 83°17′ longitude. The oasis receives water from the mountains, which brings significant alluvium and flood deposits to the plain, making it a typical and complete premountain alluvial fan. Due to its distance from the ocean, the area experiences a temperate continental climate, which is characterized by cold winters and hot summers. Annual precipitation is 43.1 mm, while the annual temperature ranges from 10.5 °C to 14.4 °C, sunshine hours vary from 2789 to 3000 h, and annual evaporation totals 2420.23 mm [29]. The oasis features three main land types: cultivated land, grassland, and Gobi. The primary natural vegetation includes Populus euphratica, Alhagi sparsifolia, Tamarix chinensis, Phragmites australis, and Suaeda glauca [30]. The major crops are cotton, wheat, and maize. The significant difference between precipitation and evaporation, coupled with shallow groundwater levels, makes salinization a common issue, particularly in the periphery of the oasis where there are no irrigation or drainage systems.

2.2. Data Collection and Preprocessing

The images used in this study were acquired from the Sentinel-2 mission, launched by the European Space Agency (ESA). Sentinel-2 is a multispectral high-resolution imaging satellite designed for land monitoring, providing images of vegetation, soil, water bodies, inland waterways, and coastal areas for emergency rescue services [31]. Sentinel-2 has a revisit period of 5 days, which is relatively short, due to the mission’s two satellites, Sentinel-2A and Sentinel-2B, operating in the same orbit. Sentinel-2 images are available in three spatial resolutions (10, 20, and 60 m) and include 13 spectral bands with wavelengths ranging from 0.4 μM to 2.4 μM [32]. Four images from 30 July 2021 were downloaded from the Copernicus Open Access Hub, accessed on 10 May 2023 [33]. These images are Level-2A, meaning that they have already undergone geometric and atmospheric corrections. Therefore, only mosaicking and clipping were performed using ENVI 5.6 [34]. Before mosaicking and clipping, the bands B 5 , B 6 , B 8 a , B 11 , B 12 are resampled to 10 m resolution through SNAP 9.0 [35].
Between 20 July and 27 July 2021, there was a field soil information investigation in the research area. Based on previous research, sampling experience, and visual observations of land cover conditions and soil salinity, as well as accessibility considerations, 66 field soil samples (22 samples for model building and the remaining for validation) were collected from a depth of 0 to 10 cm. Most samples were evenly distributed along roads due to the difficulty of accessing the inner parts of the Gobi. To ensure coverage of different land use types and soil conditions, some samples were also collected from cultivated lands. A five-point composite sampling method (one point at the center and four points at the corners) was used to collect 500 g of mixed soil per sample, which helped to minimize the impact of extreme values. During sampling, a global positioning system (GPS) was employed to precisely locate each central sampling point. The mixed soil samples were stored in sealed, numbered bags and sent to the laboratory for chemical analysis once all samples were collected. In the laboratory, the samples were dried, ground, homogenized, and sieved through a 2 mm mesh. A 20 g soil sample was mixed with 100 g of distilled water and allowed to stand for half an hour, and then a leachate was extracted from the clear solution. The electrical conductivity (EC) of the leachate was measured using a digital multiparameter measuring device [36]. The real salt content (expressed in g/kg) of each field soil sample was determined by applying the regression equation relating EC to the total soluble salts, using an average value of five soil samples.

2.3. Selection of Typical Indices

Considering the unique ecology and environmental conditions of the Weiku Oasis, some commonly used indices may not perform well in this area. Therefore, 20 typical indices (calculated using the Band Math Tool in ENVI 5.6) were selected as indirect measures of soil salinization. These indices are categorized into five groups: vegetation indices, salinity indices, red-edge vegetation indices, red-edge salinity indices, and other indices. Vegetation indices, such as the ENDVI (enhanced normalized difference vegetation index) and the MSAVI (modified soil-adjusted vegetation index), are included in this study. These indices are effective for monitoring salinization because salinization negatively impacts vegetation and restricts its growth, resulting in decreased vegetation coverage with increasing salinization severity [37]. The MSAVI is commonly used due to its superior ability to indicate soil conditions in areas with sparse vegetation, while the ENDVI has been proven effective for detecting vegetation in the Gobi desert [38]. Soil salinization affects not only vegetation, but also the chemical composition of the soil. Thus, indices such as the IFe2O3 (iron oxide index) and the NDWI (normalized difference water index) are useful for monitoring soil salinization in the study area [39]. Salinity indices like the NDSI (normalized difference salinity index), the SI (salinity index), the SI2 (salinity index 2), and the SI3 (salinity index 3), along with biophysical parameters, reflect salinization conditions [40]. Red-edge indices, including the NDre1 (normalized difference red-edge 1), the NDre2 (normalized difference red-edge 2), the TCARI (transformed chlorophyll absorption in reflectance index), and the IRECI (novel inverted red-edge chlorophyll index), as well as the RNDSI (normalized difference salinity index), the RSI (red-edge salinity index), the RS6 (red-edge salinity index 6), and the RS5 (red-edge salinity Index 5), are calculated using red edges and other spectral bands. Red-edge vegetation indices excel at detecting the chemical and physical conditions of vegetation, while red-edge salinity indices have shown greater potential for detecting salinization compared to traditional salinity indices [30,41]. Consequently, these eight red-edge indices can serve as new indirect parameters for monitoring salinization. The calculation formulas for the 20 typical indices are presented in Table 1.

2.4. Index Standardization

Owing to different dimensions among the 8 typical indices, it is necessary to remove these differences to achieve a better result of salinization assessment [44]. The calculation formula is shown as follows:
V i = ( F i F i , m i n ) / ( F i , m a x F i , m i n )
where V i represents the normalized index i ; F i represents the index value of i ; F i , m i n represents the minimum index value of i ; F i , m a x represents the maximum index value of i .

2.5. Statistical Analysis

Before constructing the monitoring models for the research area, it was necessary to reduce the number of typical parameters involved in model development. This step aimed to only retain the most valuable parameters to enhance the efficiency and accuracy of the modeling process. In this study, the Pearson correlation coefficient was calculated to filter the typical parameters through anaconda3 [30,45]. The equation of the correlation coefficient r is presented below:
r = ( x i x ¯ ) ( y i y ¯ ) ( x i x ¯ ) 2 ( y i y ¯ ) 2
where r represents the correlation coefficient; x i represents the x variables value; y i represents the y variables value; x ¯ represents the average value of x variables; y ¯ represents the average value of y variables.
There are several methods to assess inversion accuracy, with the most commonly used methods being the coefficient of determination ( R 2 ) and the mean absolute error (MAE). In this study, these metrics were employed to evaluate the performance of various feature space models in the Weiku Oasis. A total of 66 field soil samples, collected using the five-point sampling method, were used. Out of these, 44 samples were employed to build linear regression models comparing field-observed values with monitoring indices derived from different feature space models. The inversion accuracy of these models was validated at a confidence level of ρ < 0.01 .
R 2 = 1 ( y i y ^ i ) 2 ( y i y ¯ ) 2
M A E = 1 n i = 1 n y i y ^ i
where R 2 represents the determinant coefficient; M A E represents the mean absolute error; n represents the number of samples; y i represents the value of y variable; y ¯ represents the average value of y variable; y ^ i represents the predicted value of y variable.

2.6. Feature Space Overview

The feature space model is essentially a spatial system composed of two or more typical indices used to detect the spectral characteristics of targets in remote sensing images. Points within different feature spaces exhibit various geometric shapes, while in the same feature space, points representing similar targets tend to cluster together. Conversely, points representing diverse targets are typically separated and distributed across different clusters. This characteristic enables an effective distinction to be made between diverse targets using the feature space model. Due to its simplicity and interpretability, the feature space model has been widely applied in research areas such as soil moisture, surface evapotranspiration, soil salinity monitoring, and other fields [46].
In this study, 2D feature space models were developed using pairs of typical indices to construct each feature space. To create a 2D feature space model, all typical indices were first calculated and then filtered through correlation analysis. The indices that passed the selection process were grouped into pairs, with each pair used to construct a 2D feature space. Finally, based on the geometric shapes of the feature spaces and the clustering of points representing different ground targets, a reference point was determined. The distance of any point in the feature space from this reference point was used to estimate the degree of soil salinization for the ground target.

3. Results

3.1. Sifting the Typical Parameters

Pearson correlation analysis was performed between the field soil sample data and the 20 typical parameters, with the results shown in Table 2. Among the 20 indices, RNDSI exhibited the highest correlation with field-measured soil salinity (correlation coefficient of 0.8213). Within different categories of parameters, MSAVI, SI3, NDre1, RNDSI, and NDWI exhibited the highest correlation coefficients of −0.8210, 0.8201, −0.8144, 0.8213, and 0.8210, respectively. To streamline the parameter selection process for monitoring model development, only the parameters with the highest correlation coefficients in each category were retained. These parameters are MSAVI, SI3, NDre1, RNDSI, and NDWI.

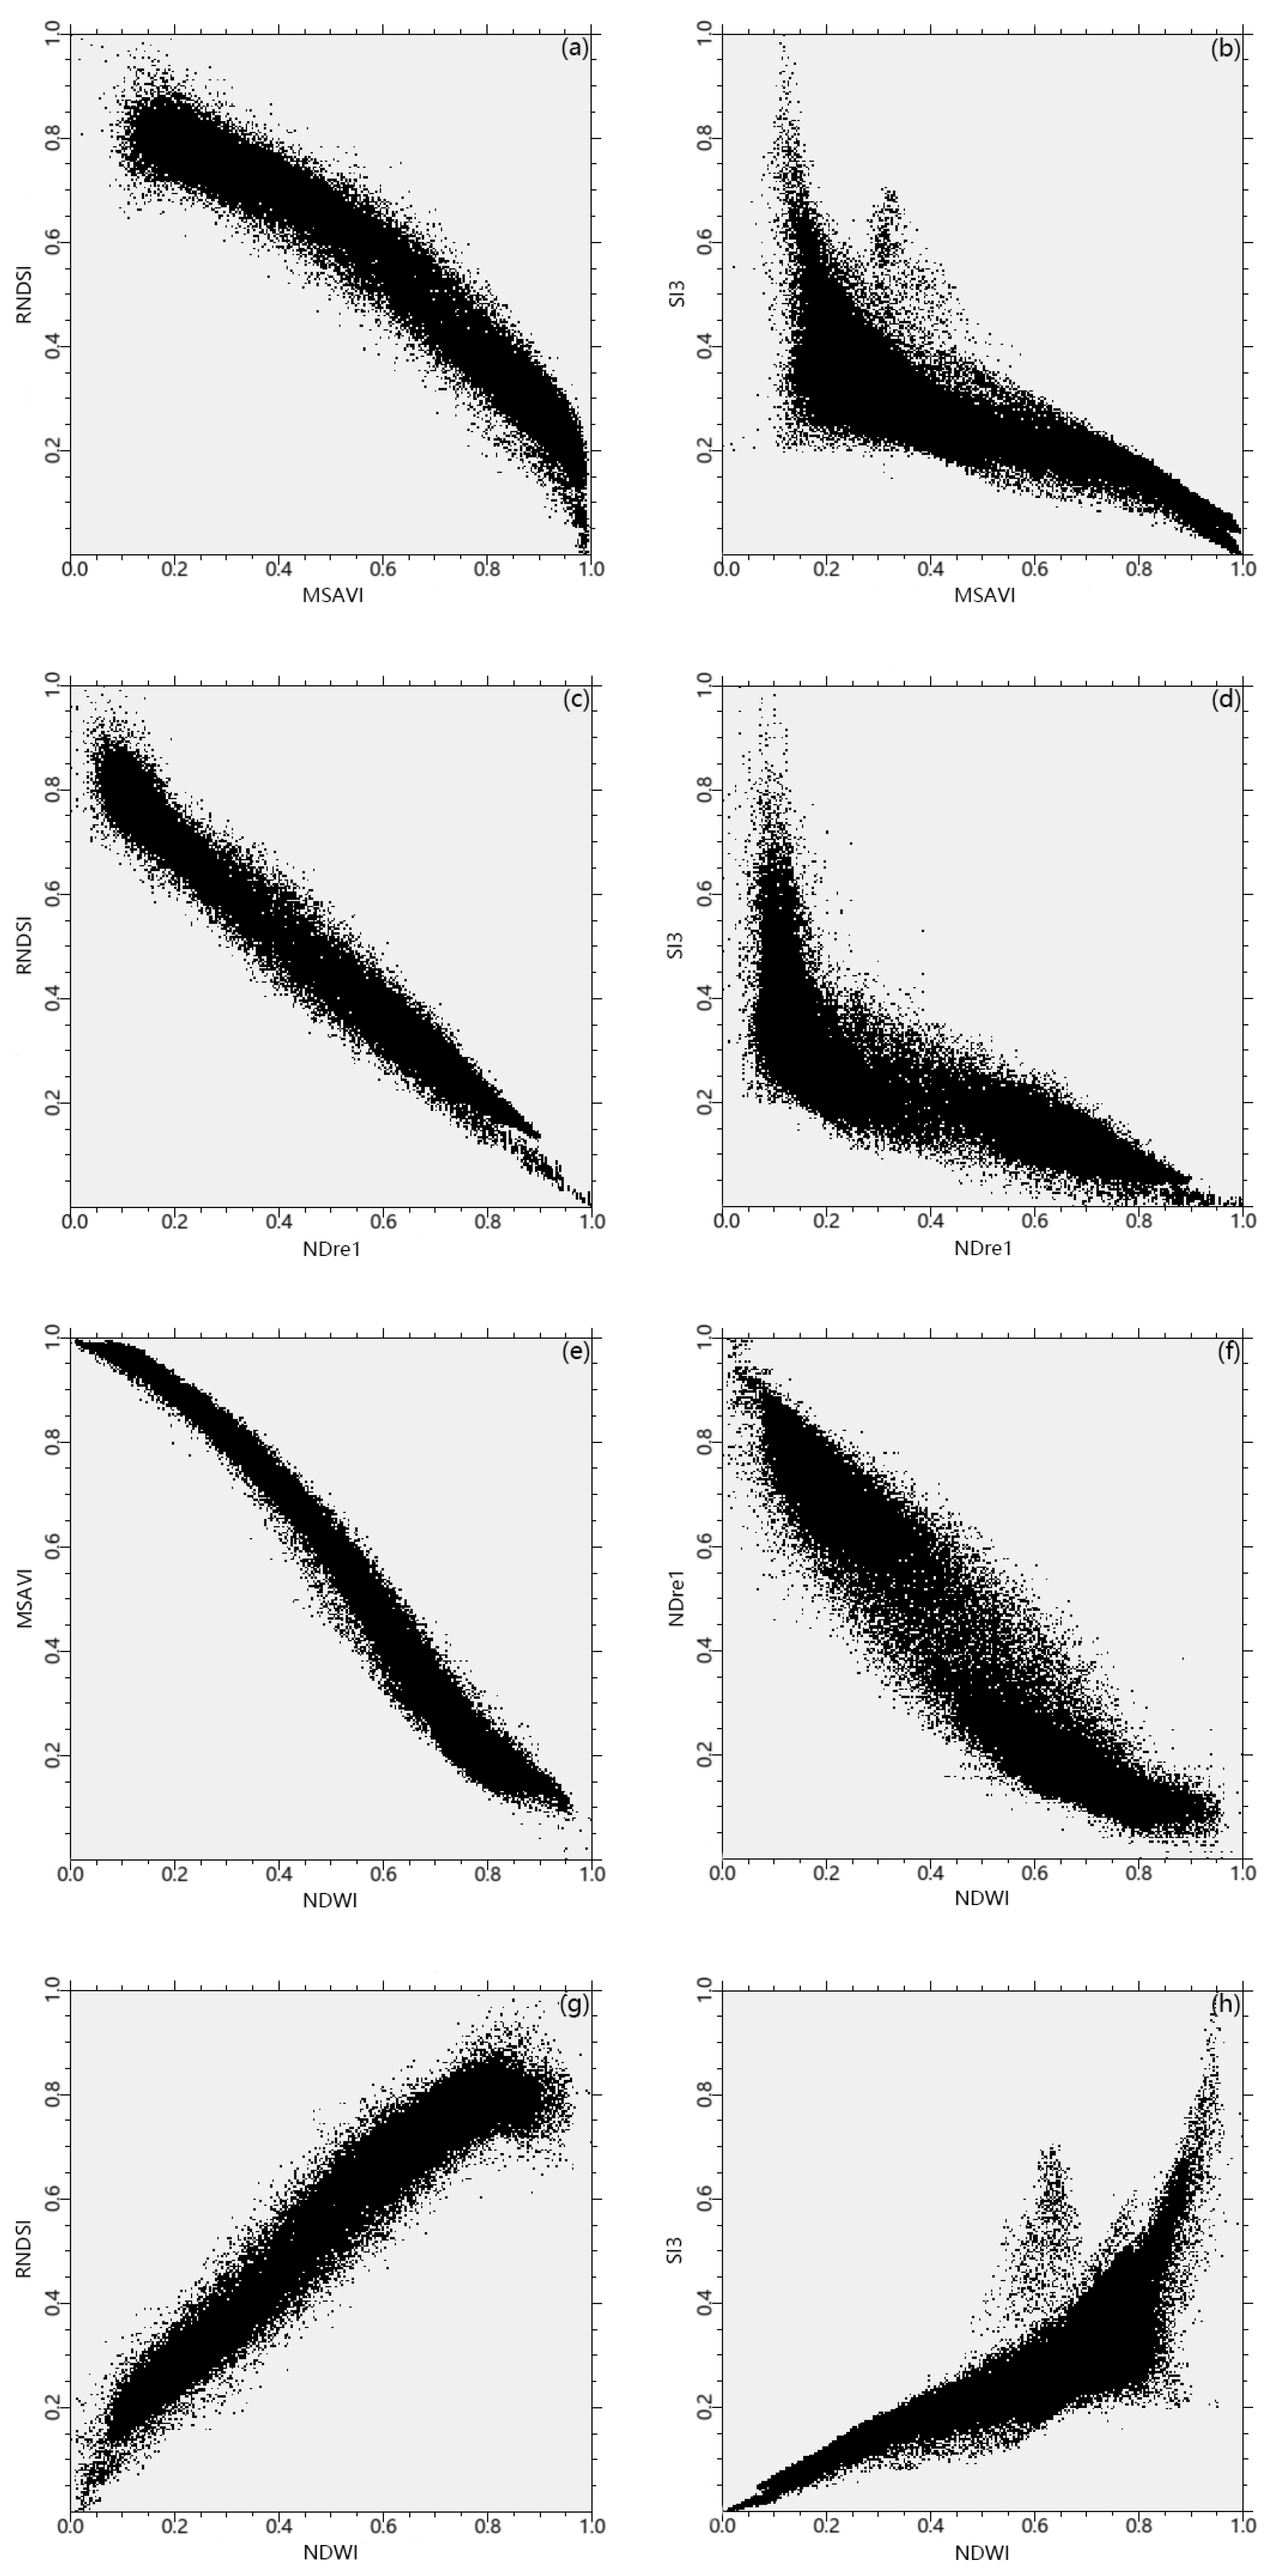
3.2. Construction of Feature Spaces

In this study, we used the 2D scatterplot tool in ENVI 5.6 to construct eight feature spaces based on five selected indices: MSAVI, SI3, NDre1, RNDSI, and NDWI. As illustrated in Figure 2, the feature spaces exhibit different geometric shapes and can be categorized into two groups based on their scatter patterns and geometric forms. The first group (starting from point (1, 0) and ending at point (0, 1)) includes Figure 2a–f. Among these, the MSAVI_SI3 and NDre1_SI3 feature spaces are similar in that they tend to cluster around the point (0, 0), with more dispersed point clouds. The remaining feature spaces in this group are relatively linear with more condensed point clouds, except for NDWI_NDre1, which shows a diffuse point cloud in the middle. The second group (starting from point (0, 0) and ending at point (1, 1)) includes Figure 2g,h. Both feature spaces in this group exhibit some diffusion. NDWI_RNDSI appears more linear, while NDWI_SI3 shows a tendency to cluster towards the point (0, 1).

3.3. Establishing the Monitoring Indices of Salinization

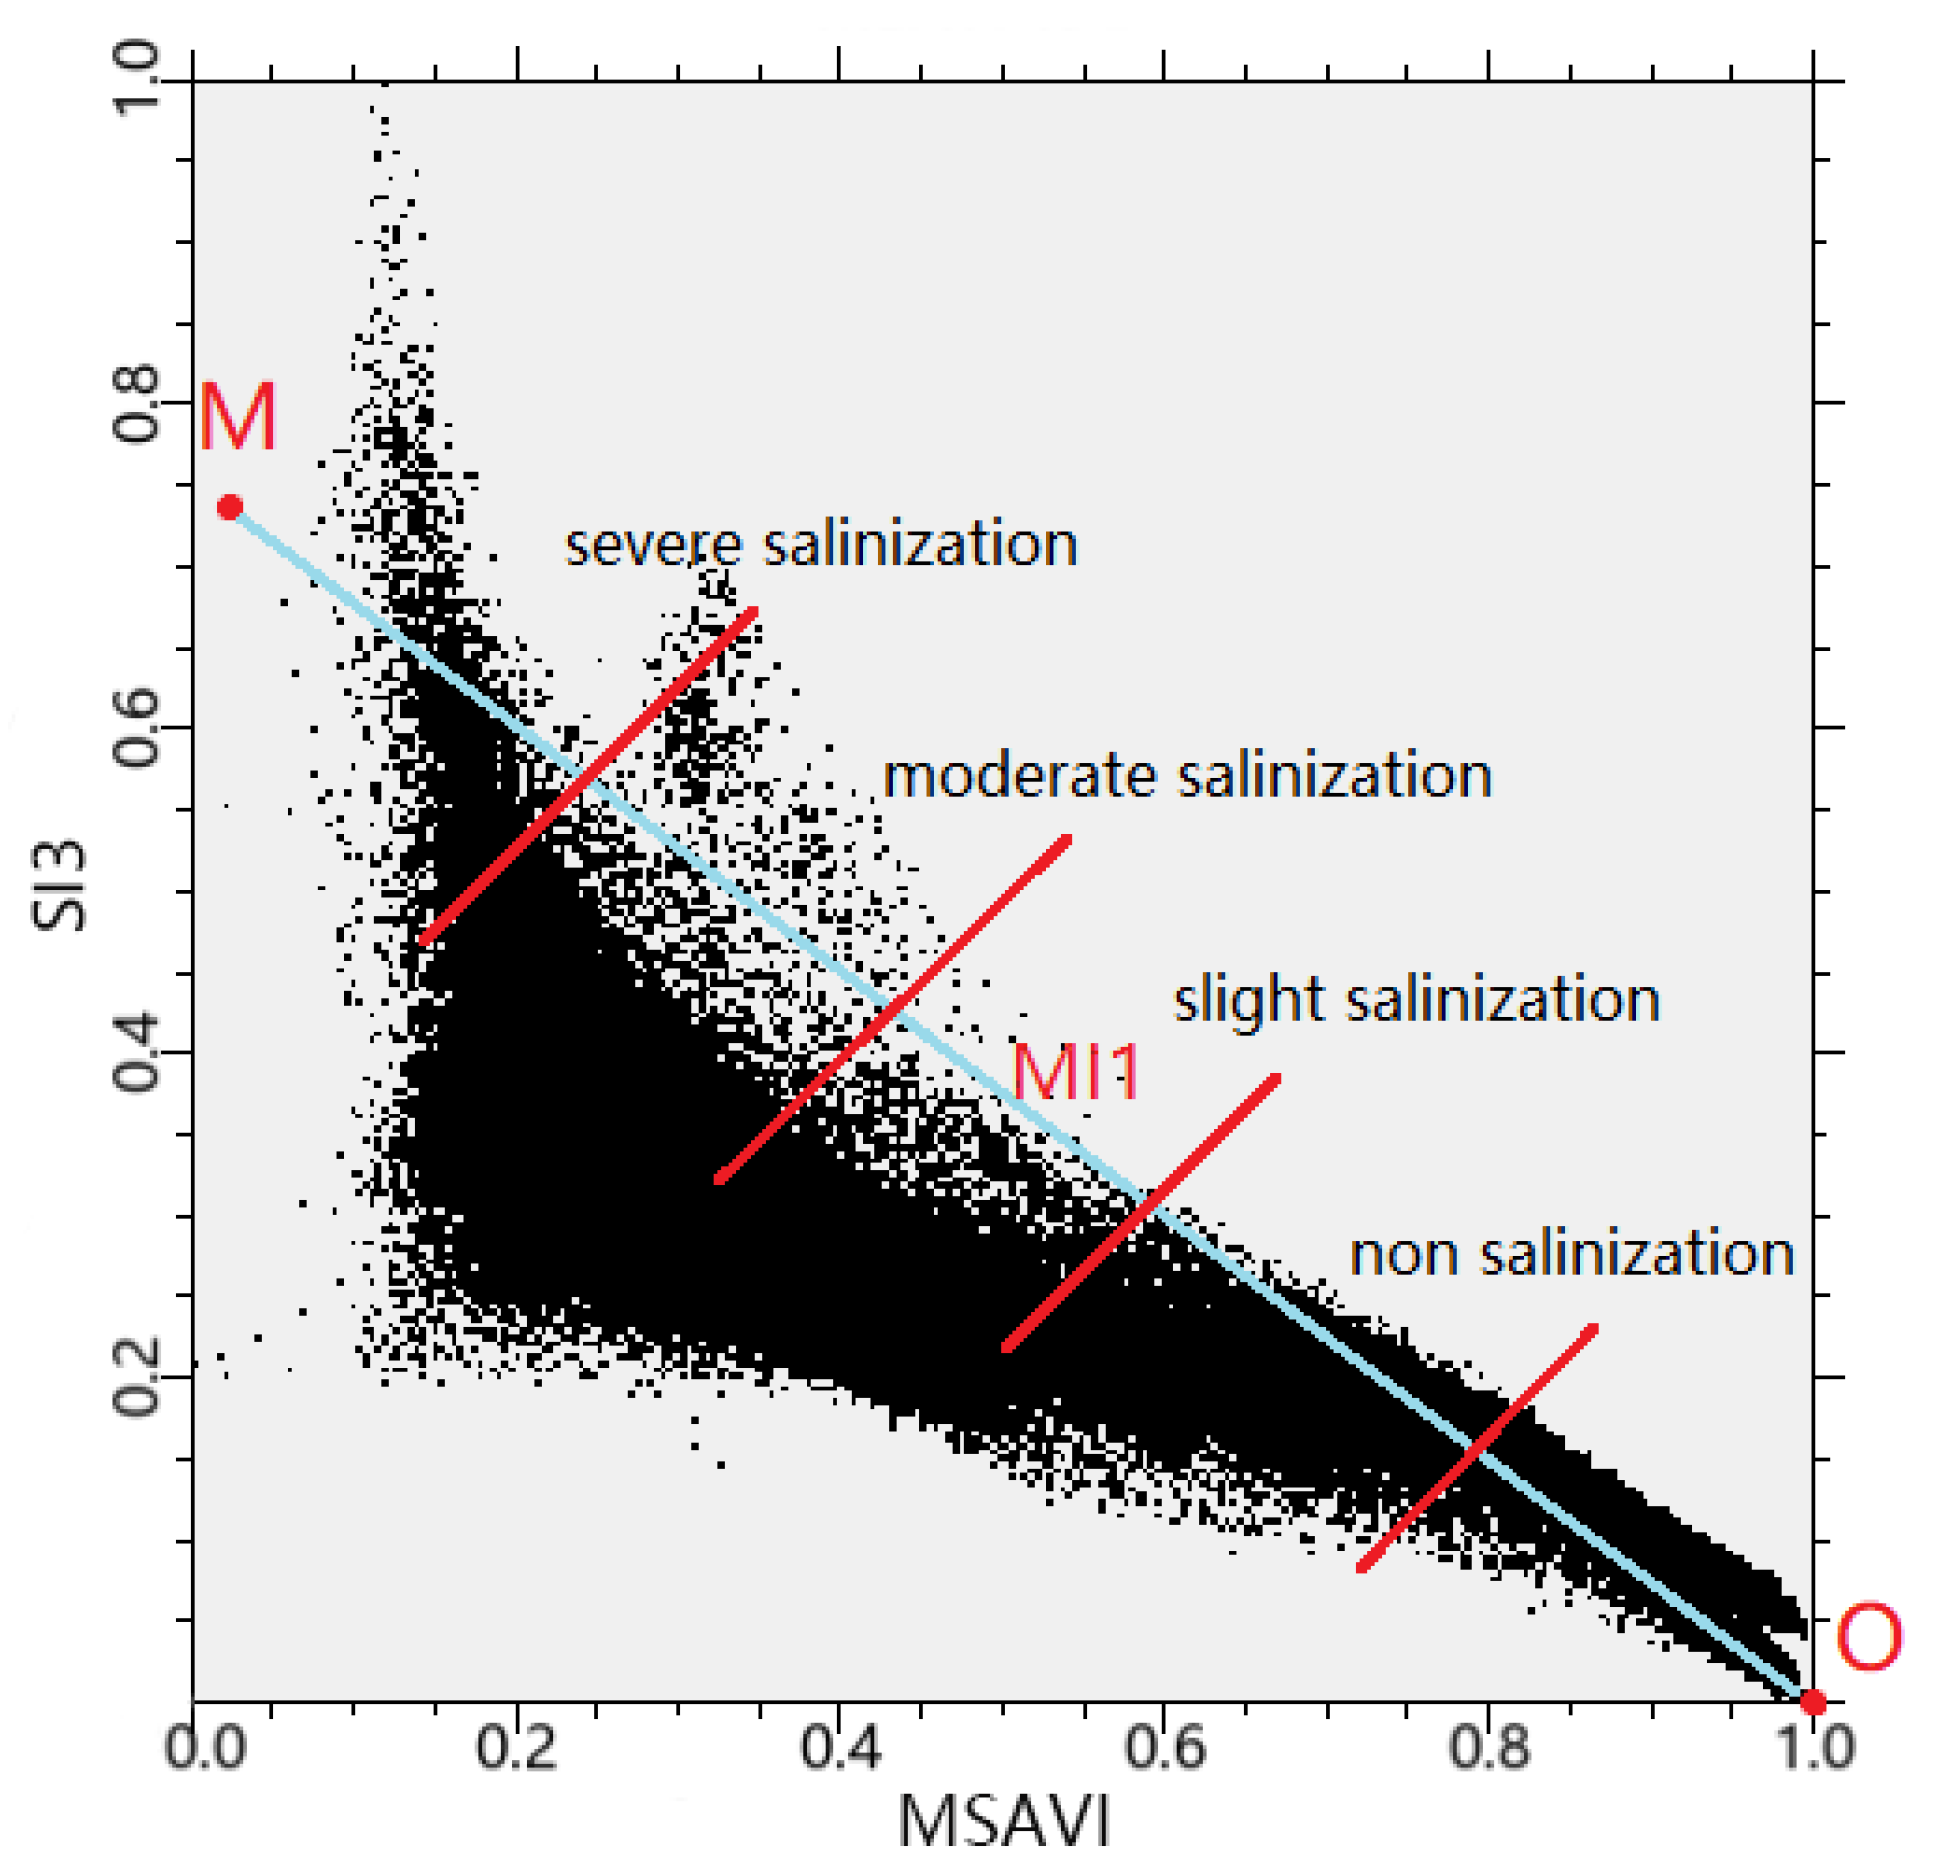
3.3.1. Spatial Distribution Rules of Different Levels of Salinization in Feature Space

Using the MSAVI-SI3 feature space as an example (Figure 3), its geometric shape resembles an obtuse triangle. The point cloud tends to cluster around (0, 0) and is more dispersed, with varying locations of salinization levels within this feature space. The main process is to complete a preliminary interpretation of the remote sensing image based on some of the measured points (22 samples) used for modeling in combination with visual interpretation. Using this preliminary interpretation of the remote sensing image and the 2D Scatter Plot tool in the ENVI 5.6, the degree of salinization represented by different areas of the scatter plot in the feature space can be obtained. We divided the feature space into four point groups representing different salinization levels based on their distance from the point (1, 0) and determined the relationship between the point groups and their corresponding salinization levels. This relationship is highly consistent with our research findings. Specifically, the green point group was predominantly found in non-salinized areas, the brown point group was mainly located in slight-salinization areas, while the yellow and red point groups were associated with moderate- and severe-salinization areas, respectively.

3.3.2. The Establishment of Monitoring Indices

Using the MSAVI-SI3 feature space as an example, the principle for constructing the monitoring index is illustrated in Figure 4. The figure shows that as the vegetation index (MSAVI) increases, the salinity index (SI3) decreases, indicating a nonlinear relationship between the vegetation indices and salinity indices that corresponds to the salinization levels. The further point M is from point O in the feature space, the more severe the corresponding salinization level is. This distance can be used to distinguish between different salinization levels [27]. Therefore, the calculation formula for the monitoring index (MI1), based on the MSAVI-SI3 feature space, is derived as follows:
M I 1 = ( M S A V I 1 ) 2 + S I 3 2

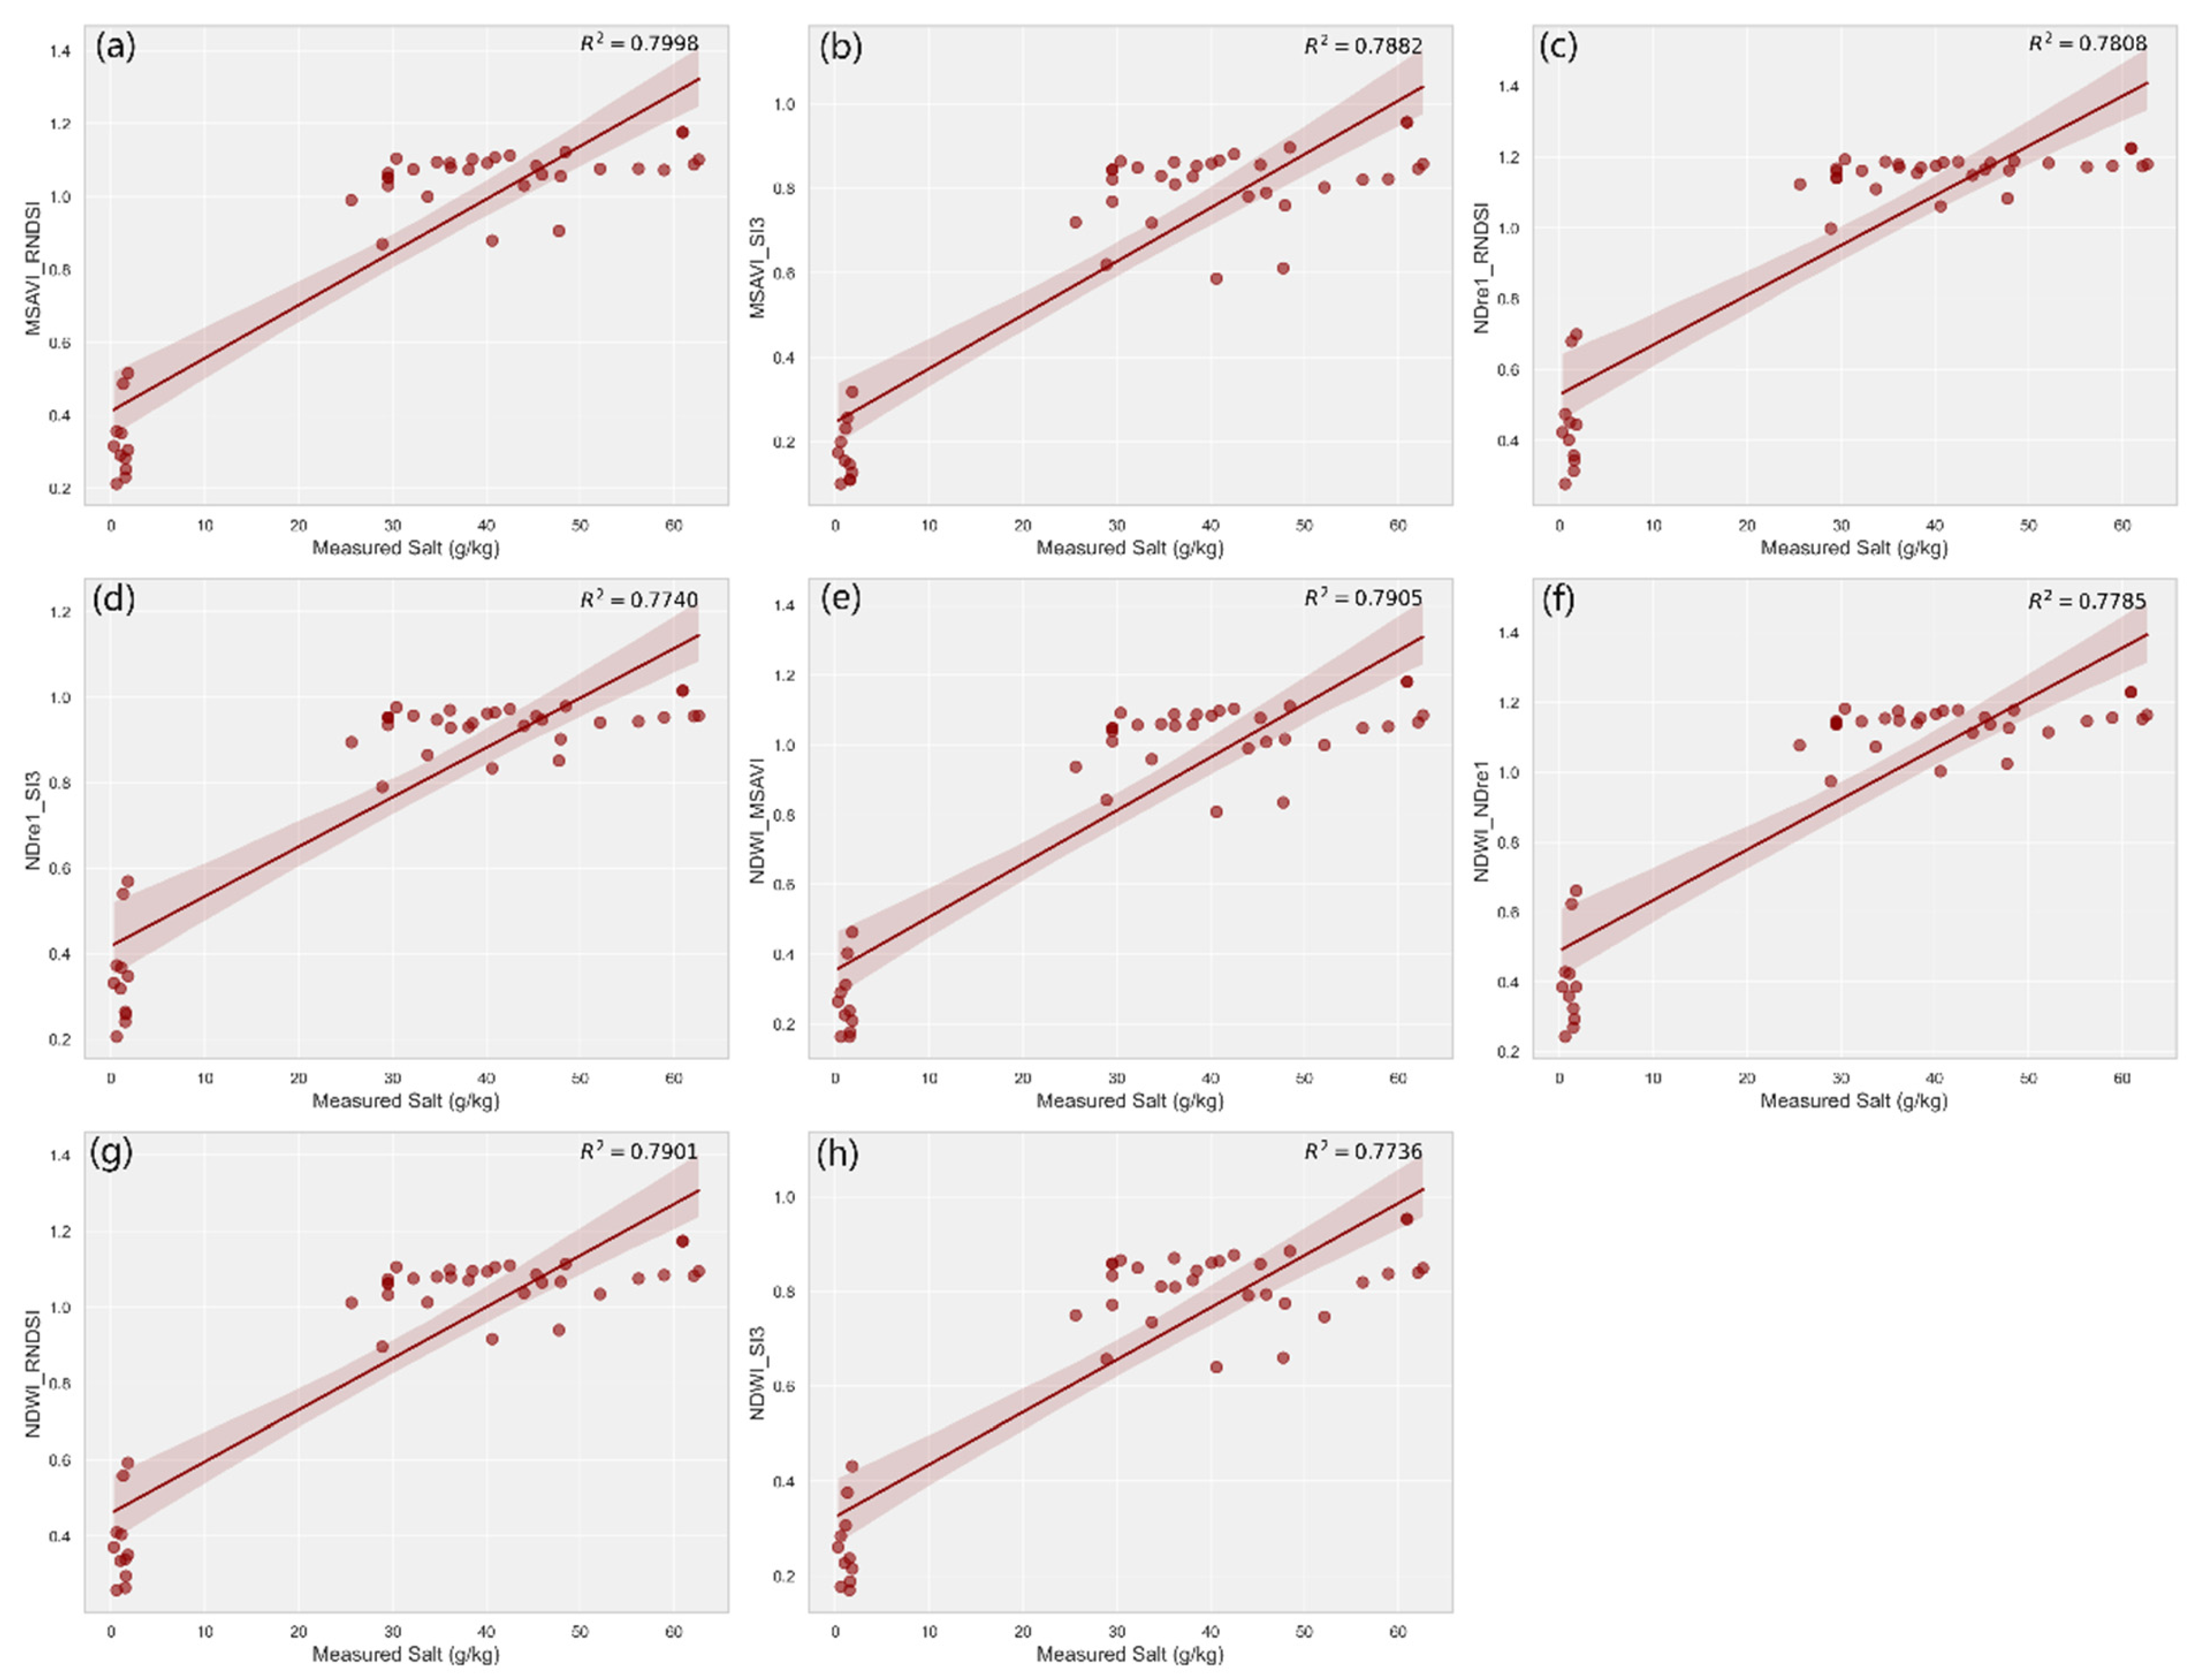
3.4. Optimal Monitoring Index of Salinization

3.4.1. Calculating the Monitoring Indices

Using the aforementioned method, eight salinization monitoring indices were calculated with the Band Math Tool in ENVI 5.6. The results of these indices are shown in Figure 5. While the indices are largely similar, there are minor differences among them. In the figure, the different salinity monitoring indices represent the salinity status of the study area as predicted by the different feature space models, and these salinity indices have a minimum value of 0 and a maximum value of 1, with 0 to 1 representing a gradual increase in salinity level. To assess the inversion accuracy of these eight monitoring indices, linear regression analysis was performed.

3.4.2. Selecting the Optimal Monitoring Index

The results of linear regression analysis are presented in Table 3 and Figure 6. As shown, the feature space that had the highest accuracy of monitoring index was MSAVI_RNDSI with R 2 = 0.7998 and M A E = 3.3444 , followed by the monitoring index of NDWI_MSAVI with R 2 = 0.7905 and M A E = 3.5002 . Conversely, the feature space that had the lowest accuracy of monitoring index was NDWI_SI3 with R 2 = 0.7736 and M A E = 3.7813 . Feature spaces that included RNDSI (a red-edge salinity index) generally showed higher average inversion accuracy ( R 2 = 0.7902 , M A E = 3.5042 ) compared to those with SI3 ( R 2 = 0.7786 , M A E = 3.6981 ). Therefore, feature spaces incorporating RNDSI are better suited for predicting salinization conditions in the Weiku Oasis.

3.5. Spatial Distribution of Salinization in Research Area

To analyze the spatial distribution patterns of salinization in the research area, we used ArcGIS 10.5 to map the salinization distribution based on the MSAVI-RNDSI feature space monitoring index [47]. Subsequently, we developed a scheme for extracting salinized land information from remote sensing images. This scheme was informed by the “Work Outline for Saline Land Improvement and Utilization Planning at County Level in Xinjiang” provided by the Department of Water Resources of Xinjiang Uygur Autonomous Region [48]. It incorporated the principles of multispectral remote sensing image classification, the actual conditions of salinized soil in the study area, the study’s objectives, and the characteristics of the ground landscape [49]. In this scheme, the monitoring index was categorized into four levels, as detailed in Table 4.
The spatial distribution of salinization in the research area is shown in Figure 7. The image on the left represents the monitoring index of MSAVI_RNDSI (which has the highest inversion accuracy), while the image on the right displays the classified results based on MSAVI_RNDSI. There is a notable difference in the spatial distribution patterns among the different levels of salinization. The distribution of salinization shows a worsening trend from farmland to Gobi. Among the four salinization levels, moderate salinization covers the largest area, followed by non-salinized, slightly salinized, and severely salinized areas, which account for 81.4%, 13.1%, 3.6%, and 1.9% of the total research area, respectively. Most of the farmland is non-salinized and is surrounded by moderate-salinization areas. Slightly salinized areas act as a transition zone between non-salinized and moderate-salinization areas. Severe salinization is predominantly found in the northern part of the research area between two cultivated fields in the west, with some scattered areas in the central part of the research area.

4. Discussion

Salinization in the Weiku Oasis is influenced by the local climate, hydrology, vegetation, soil, and human activities, making it a typical example of salinization [50]. To accurately monitor and map changes in salinization, it is essential to use satellite images with a high spatial and temporal resolution. However, many studies published before 2022 relied on Landsat images, which have limited resolution (30 m, 16 day) and are insufficient for our research needs [51]. In contrast, Sentinel-2 images offer superior spatial and temporal resolutions (10 m and 20 m, 5 day) and more spectral bands (13 in total), making them a significantly better data source.

4.1. Advantages of Proposed Model Based on SENTINEL-2 Images and Its Red-Edge Bands

The newly proposed feature space models and their monitoring indices effectively consider the interactions among various salinization factors, providing more detailed information. Linear regression and comparative analysis (see Figure 6 and Figure 7, Table 3) reveal that the MSAVI-RNDSI feature space monitoring index achieved the highest inversion accuracy, with an R 2 value of 0.7998. Red-edge bands in the electromagnetic spectrum, ranging from 670 to 760 nm, which is the inflection point of the first derivative spectrum, can exhibit rapid changes in vegetation reflectance [52]. They can detect the leaf area index through measuring the slope of the red edge, allowing for the better detection of various physiochemical parameters of vegetation, showing the leaf structure, chlorophyll content, and the health status [53]. Consequently, red-edge vegetation indices can offer improved indirect monitoring of salinization compared to conventional indices [54]. Additionally, recent advancements in salinity indices have introduced new red-edge salinity indices, which directly detect salinization using the red-edge bands [30].
A study conducted in the Yellow River Delta demonstrated that incorporating red-edge vegetation indices into the feature space model improved the inversion accuracy of soil salinization [41]. However, in this research, the addition of the red-edge vegetation index NDre1 did not enhance inversion accuracy and was even less effective compared to MSAVI and NDWI. This discrepancy may be attributed to the relatively low vegetation coverage in the Weiku Oasis, which is predominantly in the Gobi desert, in contrast to the Yellow River Delta, where higher precipitation and a major river contribute to denser vegetation cover, thereby making red-edge vegetation indices more effective. On the other hand, the red-edge salinity index RNDSI showed higher inversion accuracy compared to the salinity index SI3, with the R 2 value improving by 0.0116. This improvement can be attributed to the sensitivity of Sentinel-2’s red-edge bands to salinization, as the primary sensitive bands for detecting salinization are the visible (VIS), near-infrared (NIR), and shortwave infrared (SWIR) bands [55]. Then, through the comparative analysis of two salinity indices, we can notice that combining the visible bands with red-edge bands did not lead to an improvement, and that only the combination of red-edge bands and NIR bands made improvement in inversion accuracy. The combination of red-edge and NIR bands may be the reason that inversion accuracy was improved. In summary, the red-edge bands in Sentinel-2 work better in the high-precision mapping of salinization.

4.2. Spatial Distribution Rule of Salinization in Research Area

Salinization is widespread in the research area, and there are significant differences in the spatial distribution among various levels of salinization. Nearly all the non-salinization and slight-salinization areas distributed in cultivated land or the edge of the cultivated land, moderate-salinization areas occupied most part of the research area. At the same time, on the north side of research area, in the middle of two cultivated fields located in the western part of research area, some sporadic areas in the middle of the research area were severe-salinization areas surrounded by moderate-salinization areas. This pattern is due to the direct influence of surface and groundwater on soil salinity. Strong evaporation, combined with low precipitation, causes salts to gradually rise to the surface and accumulate [56]. In cultivated lands, human activities such as irrigation facilitate the leaching of salts to deeper soil layers, leading to non-salinization areas within these lands [57]. Conversely, in areas with moderate-to-severe salinization, the absence of human intervention allows natural factors to dominate, similar to the Yellow River Delta, where moderate-to-severe salinization primarily spreads around coastal areas due to natural factors like seawater intrusion [41]. This law can also be reflected in the effect of land-use changes on salinization in the study area, because water is the most important factor affecting land use in the study area as an oasis, and the presence or absence of irrigation water determines whether the land is wasteland or arable land, so the effect of land use on salinization can be equated with the effect of water on salinization. In the case of groundwater, when the water table is too high (usually close to within 2 m of the surface), groundwater rises to the soil surface by capillary action. As water evaporates, which is particularly strong in the study area, the salts dissolved in the groundwater remain in the soil surface and gradually accumulate, leading to soil salinization. This pattern is also reflected in the Yellow River Delta, which shows a high degree of salinization alongside the river [51]. In practice, the two effects on salinization occur simultaneously, making the salinization situation more complex. Some salinized areas within the research area may result from ineffective salt circulation due to a lack of drainage facilities [58]. Additionally, intense evaporation can lead to salt accumulation in surface waters, contributing to soil salinization, as observed in the Ebinur Lake basin, where severe salinization is concentrated around the lakeside [36].

4.3. Research Limitations and Future Work

There are inherent uncertainties in the accuracy of Sentinel-2-based soil salinization monitoring. This research effectively demonstrated how feature space models can integrate red-edge bands with common bands to estimate and map salinization in arid regions. However, the calculated indices were based solely on spectral information, utilizing only one type of information from Sentinel-2 images. To enhance monitoring accuracy, future studies should incorporate additional environmental variables, such as topography [59], vegetation coverage [60], soil texture [61], and soil moisture [18]. Integrating more variables into the feature space model could significantly improve the accuracy of salinization assessments. Moreover, as soil salinization monitoring methods advance, the traditional two-dimensional feature space model may become insufficient. With the growing numbers of other methods that can simultaneously incorporate multiple factors, developing three-dimensional feature space models would be a promising approach. While further expanding the feature space model, we are also considering a comparative analysis of feature space methods with different machine learning algorithms to analyze the advantages and disadvantages of these two types of methods. Due to the constraints of this study, which focused on a relatively small-scale research area, the high homogeneity might have limited the variation in R 2 and MAE among different monitoring indices, requiring the selection of a larger study area for future studies. In addition, no time series analysis was performed in this study. Future research should combine Sentinel-2 long-series imagery with field observations to assess soil salinization over time, explore patterns of seasonal and inter-annual variability, and combine this result with long time-series meteorological datasets to analyze the linkages that exist between meteorology and salinization. This approach provides a more comprehensive understanding of temporal dynamics and improves the robustness of salinization monitoring.
The net primary productivity (NPP) of vegetation refers to the total primary productivity accumulated through photosynthesis minus the residual consumed during respiration. It serves as the fundamental basis for the survival and reproduction of other organisms in the ecosystem, reflects the carbon fixation capacity of terrestrial vegetation, and accurately indicates the productivity status of vegetation. Additionally, NPP is a critical factor in measuring the productivity of arable land [62,63]. Cropland soil salinization impacts regional net productivity values by inhibiting crop growth, reducing crop productivity, and impairing the region’s carbon sequestration capacity. The salinization of the Weiku Oasis is more prevalent, and Xinjiang’s arable land resources are very valuable, so the region is a key area for the future transformation of medium- and low-yield fields and the improvement of arable land production potential. Investigating the effects of soil salinization on cropland productivity is essential for the efficient use of cropland resources and for achieving national food security and carbon neutrality goals. Future research should link salinization with net productivity to elucidate how different degrees of soil salinization affect cropland productivity. This will aid in comprehensively understanding the effectiveness of the integrated management of salinized cropland, and provide insights into the characteristics and trends of salinized cropland changes, which are critical for improving and managing local salinized cropland.

5. Conclusions

In this study, field sampling data and Sentinel-2 remote sensing images were integrated to address the issue of soil salinization monitoring in the Weiku Oasis, using a feature space method to build the inversion model. After considering various dominant factors influencing salinization in the research area, 20 typical indices, representing both direct and indirect measures of salinization, were selected, and narrowed down to 5 key indices (MSAVI, SI3, NDre1, RNDSI and NDWI; their correlation coefficients were −0.821, 0.8201, −0.8144, 0.8213 and 0.821, respectively) through correlation analysis. Based on these five selected indices, eight feature space monitoring models were constructed, and the inversion accuracy of each monitoring index was assessed. The results indicated that the MSAVI-RNDSI monitoring index, which incorporates red-edge indices, achieved the highest inversion accuracy, with R 2 = 0.7998 and M A E = 3.3444 . Compared to other indices, the feature space model incorporating red-edge salinity indices demonstrated a higher average inversion accuracy of R 2 = 0.7902 , which was higher than that of the feature space model containing the common salinity index with an average inversion accuracy of R 2 = 0.7786 , highlighting the effectiveness of red-edge salinity indices in accurately reflecting salinization conditions.
Using the feature space model with the highest inversion accuracy (which incorporates red-edge salinity indices), the spatial distribution and characteristics of soil salinization in the research area were analyzed. Spatial distribution analysis revealed that soil salinization intensifies with increasing distance from cultivated land, indicating that human activities are the primary factor influencing soil salinization. This finding is consistent with conclusions from other research conducted in the Weiku Oasis [30,40]. These insights can aid in predicting soil salinization trends, guiding the management of cultivated land, and providing a reference for researchers studying soil salinization globally.
Sentinel-2 remote sensing images primarily provide spectral information. However, soil salinization is influenced by multiple factors, including vegetation, terrain, climate, and land use/land cover (LULC). Solely relying on spectral information may not capture all these influencing factors. Therefore, it is essential to incorporate additional variables that represent these diverse factors into the feature space model for more comprehensive soil salinization monitoring in the future. As soil salinization monitoring methods advance, a two-dimensional feature space model may become insufficient, as newer methods can accommodate multiple factors simultaneously. Constructing a three-dimensional feature space model would be highly beneficial for a more comprehensive understanding of soil salinization, aiding in the sustainable maintenance of soil productivity and carbon fixation capacity, and supporting the sustainable development of agriculture in the region.

Author Contributions

Conceptualization, N.T.; data curation, A.R.; formal analysis, N.T. and A.R.; funding acquisition, N.T.; investigation, A.R.; methodology, N.T. and A.R.; project administration, N.T.; writing—original draft, N.T.; writing—review and editing, N.T. and A.R. All authors have read and agreed to the published version of the manuscript.

Funding

This work was funded by the National Natural Science Foundation of China, grant number 41761077.

Data Availability Statement

The datasets used in the study are available from the corresponding author on reasonable request.

Acknowledgments

The authors would like to express their sincere thanks for the financial support in the process of accomplishing this study.

Conflicts of Interest

The authors declare no conflicts of interest.

References

  1. Bian, L.; Wang, J.; Guo, B.; Cheng, K.; Wei, H. Remote Sensing Extraction of Soil Salinity in Yellow River Delta Kenli County based on Feature Space. Remote Sens. Technol. Appl. 2020, 35, 211–218. [Google Scholar]
  2. Gorji, T.; Sertel, E.; Tanik, A. Monitoring soil salinity via remote sensing technology under data scarce conditions: A case study from Turkey. Ecol. Indic. 2017, 74, 384–391. [Google Scholar] [CrossRef]
  3. Guo, J.; Wang, M.; Geng, R.; Li, X.; Yin, X.; Wei, G. Salinity Characteristics Analysis of Saline Alkali Soil in Yinbei Irrigation District of Ningxia. Chin. Agric. Sci. Bull. 2021, 37, 38–42. [Google Scholar]
  4. Guo, S.; Ruan, B.; Chen, H.; Guan, X.; Wang, S.; Xu, N.; Li, Y. Characterizing the spatiotemporal evolution of soil salinization in Hetao Irrigation District (China) using a remote sensing approach. Int. J. Remote Sens. 2018, 39, 6805–6825. [Google Scholar] [CrossRef]
  5. Yang, J.; Yao, R.; Wang, X.; Xie, W.; Zhang, X.; Zhu, W.; Zhang, L.; Sun, R. Research on Salt-affected Soils in China: History, Status Quo and Prospect. Acta Pedol. Sin. 2022, 59, 10–27. [Google Scholar]
  6. Perri, S.; Molini, A.; Hedin, L.O.; Porporato, A. Contrasting effects of aridity and seasonality on global salinization. Nat. Geosci. 2022, 15, 375–381. [Google Scholar] [CrossRef]
  7. Litalien, A.; Zeeb, B. Curing the earth: A review of anthropogenic soil salinization and plant-based strategies for sustainable mitigation. Sci. Total Environ. 2020, 698, 134235. [Google Scholar] [CrossRef]
  8. Liu, S.; Ding, X.; Zheng, D.; Shi, N.; Liu, G.; Sun, Z. Effect of Different Plants Plantation on Amelioration of Uncultivated Saline Wasteland, Soils Phosphorus Fraction and Availability in the Yellow River Delta. J. Soil Water Conserv. 2021, 35, 278–284, 293. [Google Scholar]
  9. Zhang, H.; Gao, S.Y.; Zheng, Q.H. Responses of NPP of salinized meadows to global change in hyperarid regions. J. Arid Environ. 2002, 50, 489–498. [Google Scholar] [CrossRef]
  10. Gou, Q.; Han, Z.; Wang, G. Research Progress on Soil Salinization in Arid Irrigated Area of Northwestern China. Chin. Agric. Sci. Bull. 2011, 27, 246–250. [Google Scholar]
  11. Wang, J.; Ding, J.; Yu, D.; Teng, D.; He, B.; Chen, X.; Ge, X.; Zhang, Z.; Wang, Y.; Yang, X.; et al. Machine learning-based detection of soil salinity in an arid desert region, Northwest China: A comparison between Landsat-8 OLI and Sentinel-2 MSI. Sci. Total Environ. 2020, 707, 136092. [Google Scholar] [CrossRef] [PubMed]
  12. Allbed, A.; Kumar, L. Soil salinity mapping and monitoring in arid and semi-arid regions using remote sensing technology: A review. Adv. Remote Sens. 2013, 2, 373–385. [Google Scholar] [CrossRef]
  13. Focardi, S.; Loiselle, S.A.; Mazzuoli, S.; Bracchini, L.; Dattilo, A.M.; Rossi, C. Satellite-based indices in the analysis of land cover for municipalities in the province of Siena, Italy. J. Environ. Manag. 2008, 86, 383–389. [Google Scholar] [CrossRef] [PubMed]
  14. Shamsi, S.R.F.; Zare, S.; Abtahi, S.A. Soil salinity characteristics using moderate resolution imaging spectroradiometer (MODIS) images and statistical analysis. Arch. Agron. Soil Sci. 2013, 59, 471–489. [Google Scholar] [CrossRef]
  15. Wang, F.; Ding, J.; Wu, M. Remote sensing model of soil salinization based on NDVI-SI characteristic space. Trans. CSAE 2010, 26, 168–173. [Google Scholar]
  16. Metternicht, G.I.; Zinck, J.A. Remote sensing of soil salinity: Potentials and constraints. Remote Sens. Environ. 2003, 85, 1–20. [Google Scholar] [CrossRef]
  17. Zhou, x. Study on Soil Salt Inversion Based on Multisource Data and Machine Learning Algorithm in the Ebinur Lake Wetland National Nature Reserve. Master’s Thesis, Xinjiang University, Urumqi, China, 2020. [Google Scholar]
  18. Peng, J.; Biswas, A.; Jiang, Q.; Zhao, R.; Hu, J.; Hu, B.; Shi, Z. Estimating soil salinity from remote sensing and terrain data in southern Xinjiang Province, China. Geoderma 2019, 337, 1309–1319. [Google Scholar] [CrossRef]
  19. Howari, F.M.; Goodell, P.C.; Miyamoto, S. Spectral properties of salt crusts formed on saline soils. J. Environ. Qual. 2002, 31, 1453–1461. [Google Scholar] [CrossRef]
  20. Fourati, H.T.; Bouaziz, M.; Benzina, M.; Bouaziz, S. Modeling of soil salinity within a semi-arid region using spectral analysis. Arab. J. Geosci. 2015, 8, 11175–11182. [Google Scholar] [CrossRef]
  21. Azabdaftari, A.; Sunar, F. Soil salinity mapping using multitemporal Landsat data. Int. Arch. Photogramm. Remote Sens. Spat. Inf. Sci. 2016, 41, 3–9. [Google Scholar] [CrossRef]
  22. Song, C.; Ren, H.; Huang, C. Estimating Soil Salinity in the Yellow River Delta, Eastern China-An Integrated Approach Using Spectral and Terrain Indices with the Generalized Additive Model. Pedosphere 2016, 26, 626–635. [Google Scholar] [CrossRef]
  23. Douaoui, A.E.K.; Nicolas, H.; Walter, C. Detecting salinity hazards within a semiarid context by means of combining soil and remote-sensing data. Geoderma 2006, 134, 217–230. [Google Scholar] [CrossRef]
  24. Wang, D.; Wilson, C.; Shannon, M.C. Interpretation of salinity and irrigation effects on soybean canopy reflectance in visible and near-infrared spectrum domain. Int. J. Remote Sens. 2002, 23, 811–824. [Google Scholar] [CrossRef]
  25. Yahiaoui, I.; Douaoui, A.; Zhang, Q.; Ziane, A. Soil salinity prediction in the Lower Cheliff plain (Algeria) based on remote sensing and topographic feature analysis. J. Arid Land 2015, 7, 794–805. [Google Scholar] [CrossRef]
  26. Zhang, P.; Zhang, Z.; Li, X.; Wang, Y.; Yu, J.; Huang, Y. Desertification remote sensing information extraction from Qinghai-Tibet Plateau and evolution analysis. Arid Land Geogr. 2006, 29, 710–717. [Google Scholar]
  27. Ding, J.; Yao, Y.; Wang, F. Detecting soil salinization in arid regions using spectral feature space derived from remote sensing data. Acta Ecol. Sin. 2014, 34, 4620–4631. [Google Scholar]
  28. Liu, Y.; Qian, J.; Yue, H. Comparison and evaluation of different dryness indices based on vegetation indices-land surface temperature/albedo feature space. Adv. Space Res. 2021, 68, 2791–2803. [Google Scholar] [CrossRef]
  29. Han, L.; Ding, J.; Ge, X.; He, B.; Wang, J.; Xie, B.; Zhang, Z. Using spatiotemporal fusion algorithms to fill in potentially absent satellite images for calculating soil salinity: A feasibility study. Int. J. Appl. Earth Obs. Geoinf. 2022, 111, 102839. [Google Scholar] [CrossRef]
  30. Tan, J.; Ding, J.; Han, L.; Ge, X.; Wang, X.; Wang, J.; Wang, R.; Qin, S.; Zhang, Z.; Li, Y. Exploring PlanetScope Satellite Capabilities for Soil Salinity Estimation and Mapping in Arid Regions Oases. Remote Sens. 2023, 15, 1066. [Google Scholar] [CrossRef]
  31. SentiWiki. Sentinel-2. Available online: https://sentiwiki.copernicus.eu/web/sentinel-2 (accessed on 13 January 2025).
  32. SentiWiki. S2 Mission. Available online: https://sentiwiki.copernicus.eu/web/s2-mission#S2-Mission-Acquisition-Resolutions (accessed on 13 January 2025).
  33. European Space Agency. Copernicus Open Access Hub. Available online: https://scihub.copernicus.eu/ (accessed on 10 May 2023).
  34. Team of ENVI development. ENVI, version 5.6; Harris Geospatial Solutions: Boulder, CO, USA, 2020.
  35. European Space Agency. SNAP, version 9.0; ESA: Paris, France, 2022.
  36. Ge, X.; Ding, J.; Teng, D.; Wang, J.; Huo, T.; Jin, X.; Wang, J.; He, B.; Han, L. Updated soil salinity with fine spatial resolution and high accuracy: The synergy of Sentinel-2 MSI, environmental covariates and hybrid machine learning approaches. Catena 2022, 212, 106054. [Google Scholar] [CrossRef]
  37. Wang, F.; Ding, J.; Wei, Y.; Zhou, Q.; Yang, X.; Wang, Q. Sensitivity analysis of soil salinity and vegetation indices to detect soil salinity variation by using Landsat series images:applications in different oases in Xinjiang, China. Acta Ecol. Sin. 2017, 37, 5007–5022. [Google Scholar]
  38. Guo, B.; Zang, W.; Yang, F.; Han, B.; Chen, S.; Liu, Y.; Yang, X.; He, T.; Chen, X.; Liu, C.; et al. Spatial and temporal change patterns of net primary productivity and its response to climate change in the Qinghai-Tibet Plateau of China from 2000 to 2015. J. Arid Land 2020, 12, 1–17. [Google Scholar] [CrossRef]
  39. Guo, B.; Lu, M.; Fan, Y.; Wu, H.; Yang, Y.; Wang, C. A novel remote sensing monitoring index of salinization based on three-dimensional feature space model and its application in the Yellow River Delta of China. Geomat. Nat. Hazards Risk 2023, 14, 95–116. [Google Scholar] [CrossRef]
  40. Ma, Y.; Tashpolat, N. Remote Sensing Monitoring of Soil Salinity in Weigan River-Kuqa River Delta Oasis Based on Two-Dimensional Feature Space. Water 2023, 15, 1694. [Google Scholar] [CrossRef]
  41. Guo, B.; Yang, F. A novel feature space monitoring index of salinisation in the Yellow River Delta based on SENTINEL-2B MSI images. Land Degrad. Dev. 2022, 33, 2303–2316. [Google Scholar] [CrossRef]
  42. Guo, B.; Zang, W.; Luo, W.; Wen, Y.; Yang, F.; Han, B.; Fan, Y.; Chen, X.; Qi, Z.; Wang, Z.; et al. Detection model of soil salinization information in the Yellow River Delta based on feature space models with typical surface parameters derived from Landsat8 OLI image. Geomat. Nat. Hazards Risk 2020, 11, 288–300. [Google Scholar] [CrossRef]
  43. Fang, C.; Wang, L.; Xu, H. A Comparative Study of Different Red Edge Indices for Remote Sensing Detection of Urban Grassland Health Status. J. Geo-Inf. Sci. 2017, 19, 1382–1392. [Google Scholar]
  44. Zhou, P. Remote sensing monitoring of desertification in Naiman Banner based on Albedo-MSAVI feature space. Sci. Technol. Innov. Inf. 2021, 32, 78–81. [Google Scholar]
  45. Team of Anaconda development. Anaconda, Version 3.0; Anaconda Incorporated: Austin, TX, USA, 2014.
  46. Sandholt, I.; Rasmussen, K.; Andersen, J. A simple interpretation of the surface temperature/vegetation index space for assessment of surface moisture status. Remote Sens. Environ. 2002, 79, 213–224. [Google Scholar] [CrossRef]
  47. Team of ArcGIS development. ArcGIS, version 10.8; Environmental Systems Research Institute: Redlands, CA, USA, 2016.
  48. Agricultural and Animal Husbandry Water Resources Division, Water Resources Department of Xinjiang Uygur Autonomous Region. Available online: https://slt.xinjiang.gov.cn/xjslt/c114459/zwgk.shtml (accessed on 15 May 2024).
  49. Yao, Y. Evaluation and Scale Effect Analysis of Soil Salinity in Dry and Wet Seasons of the Oasia Using Remote Sensing and Electromagnetic Induction Instruments. Master’s Thesis, Xinjiang University, Urumqi, China, 2013. [Google Scholar]
  50. Feng, J.; Ding, J.; Wei, W. Soil salinization monitoring based on Radar data. Remote Sens. Land Resour. 2019, 31, 195–203. [Google Scholar]
  51. Guo, B.; Yang, F.; Fan, Y.; Han, B.; Chen, S.; Yang, W. Dynamic monitoring of soil salinization in Yellow River Delta utilizing MSAVI-SI feature space models with Landsat images. Environ. Earth Sci. 2019, 78, 308. [Google Scholar] [CrossRef]
  52. Lu, J.; Zhang, X.; Ye, P.; Wu, H.; Wang, T. Remote sensing monitoring of salinization in Hetao irrigation district based on SI-MSAVI feature space. Remote Sens. Land Resour 2020, 1, 169–175. [Google Scholar]
  53. Yu, X.; Xin, P.; Hong, L. Effect of evaporation on soil salinization caused by ocean surge inundation. J. Hydrol. 2021, 597, 126200. [Google Scholar] [CrossRef]
  54. Huang, S.; Ding, J.; Li, X.; Yang, A. Hyperspectral Characteristics Analysis and Modeling of Soil Salinization. Chin. J. Soil Sci. 2016, 47, 1042–1048. [Google Scholar]
  55. Zovko, M.; Romic, D.; Colombo, C.; Di Iorio, E.; Romic, M.; Buttafuoco, G.; Castrignano, A. A geostatistical Vis-NIR spectroscopy index to assess the incipient soil salinization in the Neretva River valley, Croatia. Geoderma 2018, 332, 60–72. [Google Scholar] [CrossRef]
  56. Sahbeni, G.; Ngabire, M.; Musyimi, P.K.; Szekely, B. Challenges and Opportunities in Remote Sensing for Soil Salinization Mapping and Monitoring: A Review. Remote Sens. 2023, 15, 2540. [Google Scholar] [CrossRef]
  57. Gomez Flores, J.L.; Ramos Rodriguez, M.; Gonzalez Jimenez, A.; Farzamian, M.; Herencia Galan, J.F.; Salvatierra Bellido, B.; Cermeno Sacristan, P.; Vanderlinden, K. Depth-Specific Soil Electrical Conductivity and NDVI Elucidate Salinity Effects on Crop Development in Reclaimed Marsh Soils. Remote Sens. 2022, 14, 3389. [Google Scholar] [CrossRef]
  58. Zhang, Y.; Hou, K.; Qian, H.; Gao, Y.; Fang, Y.; Xiao, S.; Tang, S.; Zhang, Q.; Qu, W.; Ren, W. Characterization of soil salinization and its driving factors in a typical irrigation area of Northwest China. Sci. Total Environ. 2022, 837, 155808. [Google Scholar] [CrossRef]
  59. Naimi, S.; Ayoubi, S.; Zeraatpisheh, M.; Dematte, J.A.M. Ground Observations and Environmental Covariates Integration for Mapping of Soil Salinity: A Machine Learning-Based Approach. Remote Sens. 2021, 13, 4825. [Google Scholar] [CrossRef]
  60. Zhang, J.; Zhang, Z.; Chen, J.; Chen, H.; Jin, J.; Han, J.; Wang, X.; Song, Z.; Wei, G. Estimating soil salinity with different fractional vegetation cover using remote sensing. Land Degrad. Dev. 2021, 32, 597–612. [Google Scholar] [CrossRef]
  61. Abbas, A.; Khan, S.; Hussain, N.; Hanjra, M.A.; Akbar, S. Characterizing soil salinity in irrigated agriculture using a remote sensing approach. Phys. Chem. Earth 2013, 55–57, 43–52. [Google Scholar] [CrossRef]
  62. Wang, J.; Xue, Z.; Zhang, C.; Chang, Y. Spatio-temporal Evolution of Saline-alkali Cultivated Land and Its Impact on Productivity in Hetao Plain of Inner Mongolia. Sci. Geogr. Sin. 2019, 39, 827–835. [Google Scholar]
  63. Song, Y.; Gao, M.; Xu, Z.; Wang, J.; Bi, M. Temporal and Spatial Characteristics of Soil Salinization and Its Impact on Cultivated Land Productivity in the BOHAI Rim Region. Water 2023, 15, 2368. [Google Scholar] [CrossRef]
Figure 1. Location of study area. (ad) represents the main surface type of study area, which are salt crust, Gobi, Gobi vegetation, and cotton, respectively.
Land 14 00251 g001
Figure 2. Feature spaces composed of different indices: (a) MSAVI-RNDSI; (b) MSAVI-SI3; (c) NDre1-RNDSI; (d) NDre1-SI3; (e) NDWI-MSAVI; (f) NDWI-NDre1; (g) NDWI-RNDSI; (h) NDWI-SI3.
Land 14 00251 g002
Figure 3. Spatial differentiation laws of different levels of salinization in the MSAVI-SI3 feature space: (a) non-salinization; (b) slight salinization; (c) moderate salinization; (d) severe salinization.
Land 14 00251 g003
Figure 4. Construction of the monitoring index of the MSAVI-SI3 feature space.
Land 14 00251 g004
Figure 5. Eight monitoring indices of salinization in the research area: (a) MSAVI-RNDSI; (b) MSAVI-SI3; (c) NDre1-RNDSI; (d) NDre1-SI3; (e) NDWI-MSAVI; (f) NDWI-NDre1; (g) NDWI-RNDSI; (h) NDWI-SI3.
Land 14 00251 g005
Figure 6. Accuracy verifications of different monitoring index of salinization: (a) MSAVI-RNDSI; (b) MSAVI-SI3; (c) NDre1-RNDSI; (d) NDre1-SI3; (e) NDWI-MSAVI; (f) NDWI-NDre1; (g) NDWI-RNDSI; (h) NDWI-SI3.
Land 14 00251 g006
Figure 7. Spatial distribution of soil salinization in the research area.
Land 14 00251 g007
Table 1. Typical indices.
CategoriesTypical IndicesCalculations FormulasReferences
Vegetation indicesENDVI B 8 B 4 + B 12 B 8 + B 4 + B 12 [38]
MSAVI 2 B 8 + 1 2 B 8 + 1 2 8 B 8 B 4 2 [38]
NDVI B 8 B 4 B 8 + B 4 [39]
GARI B 8 B 3 + 0.9 ( B 2 B 4 ) B 8 + B 3 + 0.9 ( B 2 B 4 ) [40]
Other indicesIFe2O3 B 4 B 8 [39]
Albedo 0.356 B 2 + 0.13 B 4 + 0.373 B 8 + 0.085 B 11 + 0.072 B 12 0.0018 [39]
WI 0.1446 B 2 + 0.1761 B 3 + 0.3322 B 4 + 0.3396 B 8 0.621 B 11 0.4186 B 12 [42]
NDWI B 3 B 8 B 3 + B 8 [40]
Salinity indicesSI B 2 × B 4 [40]
SI2 B 3 2 + B 4 2 + B 8 2 [40]
SI3 B 3 2 + B 4 2 [40]
NDSI B 4 B 8 B 4 + B 8 [40]
Red-edge vegetation indicesNDre1 B 6 B 5 B 6 + B 5 [41]
NDre2 B 8 a B 6 B 8 a + B 6 [41]
IRECI B 7 B 4 B 5 / B 6 [43]
TCARI 3 B 5 B 4 0.2 ( B 5 B 3 ) × B 5 B 4 [30]
Red-edge salinity indicesRNDSI B 5 B 8 B 5 + B 8 [30]
RSI B 2 + B 5 [30]
RS6 B 5 × B 8 B 3 [30]
RS5 B 2 × B 8 B 3 [30]
Note: B 2 , B 3 , B 4 are visible bands of blue, green, and red. B 5 , B 6 , B 7 are three red-edge bands. B 8 , B 8 a are near-infrared bands, B 8 a is the narrow near-infrared band. B 11 , B 12 are short-wave infrared bands.
Table 2. Results of correlation analysis.
Typical ParameterCorrelation CoefficientTypical ParameterCorrelation Coefficient
ENDVI−0.8092SI30.8201
MSAVI−0.8210NDSI0.7724
NDVI−0.8201NDre1−0.8144
GARI−0.7878NDre2−0.8019
IFe2O30.8206IRECI−0.7793
Albedo−0.0568TCARI−0.7868
WI−0.8079RNDSI0.8213
NDWI0.8210RSI0.7719
SI0.7739RS6−0.8019
SI2−0.6523RS50.7718
Table 3. Results of linear regression.
Feature SpaceFormula R 2 M A E
MSAVI_SI3 M I 1 = ( M S A V I 1 ) 2 + S I 3 2 0.78823.5386
MSAVI_RNDSI M I 2 = ( M S A V I 1 ) 2 + R N D S I 2 0.79983.3444
NDWI_MSAVI M I 3 = ( N D W I 1 ) 2 + M S A V I 2 0.79053.5002
NDre1_SI3 M I 4 = ( N D r e 1 1 ) 2 + S I 3 2 0.77403.7745
NDre1_RNDSI M I 5 = ( N D r e 1 1 ) 2 + S I 3 2 0.78083.6614
NDWI_NDre1 M I 6 = ( N D W I 1 ) 2 + N D r e 1 2 0.77853.7000
NDWI_SI3 M I 7 = N D W I 2 + S I 3 2 0.77363.7813
NDWI_RNDSI M I 8 = N D W I 2 + R N D S I 2 0.79013.5067
Table 4. Modified classification standard.
Salinization LevelFeaturesSoil Salt Content (g/kg)
Non-salinizationFarmland, woodland, high-coverage grassland, river≪5
Slight salinizationParts of farmland, grassland, bushwood5~25
Moderate salinizationSparse bushwood and grassland, Gobi25~50
Severe salinizationSurface salt crust≫50
Disclaimer/Publisher’s Note: The statements, opinions and data contained in all publications are solely those of the individual author(s) and contributor(s) and not of MDPI and/or the editor(s). MDPI and/or the editor(s) disclaim responsibility for any injury to people or property resulting from any ideas, methods, instructions or products referred to in the content.

