Article

Quantitative Simulation and Planning for the Heat Island Mitigation Effect in Sponge City Planning: A Case Study of Chengdu, China

1
School of Architecture, Southwest Jiaotong University, Chengdu 611756, China
2
Deyang City Garden Administration Bureau, Deyang 618099, China
*
Authors to whom correspondence should be addressed.
Land 2025, 14(2), 264; https://doi.org/10.3390/land14020264
Submission received: 9 December 2024 / Revised: 22 January 2025 / Accepted: 24 January 2025 / Published: 26 January 2025
(This article belongs to the Special Issue Land Use Planning, Sustainability and Disaster Risk Reduction)

Abstract

:
The implementation of sponge cities in China modifies the hydrological conditions of the underlying surface, effectively alleviating the urban heat island effect. However, in planning and construction, heat island mitigation targets are difficult to quantify and lack quantitative design and evaluation methods. To address this issue, two planning schemes were proposed based on sponge city management and control indicators. The WRF-UCM model was used to conduct numerical simulations of the current conditions (case 1) and the sponge city planning schemes (cases 2 and 3), analyzing the impact of sponge city initiatives on the mitigation of the heat island effect. The results indicated that by changing the structure of the underlying surface and increasing the water content of the underlying surface, the sponge city affects the urban energy distribution process and regional horizontal advection pattern. This not only reduces heat accumulation within the urban area but also suppresses regional convection during high-temperature periods, thereby mitigating the urban heat island effect. Moreover, different schemes following the same sponge city design requirements have varying impacts on urban microclimate elements and heat island distributions. Notably, a higher subsurface water content yields a more pronounced inhibition of the heat island effect. Finally, a sponge city planning method with the consideration of heat island mitigation was proposed, facilitating pre-simulation optimization and decision-making in sponge city planning.

1. Introduction

Changes in the urban underlying surface can affect the urban radiation balance and energy balance, which is the root cause of the urban heat island effect (Rizwan et al., 2008; OKE 1995; OKE et al., 1987; Taha et al., 1992) [1,2,3,4]. As a new concept in urban construction with Chinese characteristics, the sponge city concept aims to realize sustainable stormwater management in urban areas to achieve multiple objectives, such as local flood prevention, reduction in stormwater disasters, the control of non-point-source pollution, and the utilization of rainwater. The original intention of the sponge city design was to restore urban water ecology, mainly through reducing the hard proportion of the urban underlying surface, increasing the permeability of the urban underlying surface, and restoring the natural state of the urban underlying surface to reduce the damage to the natural water cycle caused by urban construction. Spongy initiatives affect the urban underlying surface and increase the moisture content of the urban underlying surface and the urban greening rate and reduce the imperviousness of the urban underlying surface, thereby effectively reducing the urban heat island effect (Buchholz 2013; Onmura et al., 2001; Qin et al., 2012; Zhou et al., 2004) [5,6,7,8]. With the development of the sponge city, scholars have noticed that sponge city initiatives can improve urban climate and alleviate the urban heat island effect. At present, many studies have focused on sponge cities and the urban heat island effect, but there is not sufficient research on the heat island mitigation effect of sponge city planning and design. In actual sponge city planning and construction, the heat island mitigation target is often neglected in the early stage of planning due to the difficulty of quantification and the lack of quantitative design and evaluation methods, resulting in the limitation of sponge city heat island mitigation effects.
The current quantitative analysis methods for the heat island effect mainly include (Shou et al., 2012) [9] (1) the traditional observation data method; (2) the meteorological satellite data method (Hand et al., 2009; Streutker 2002; Xue et al., 2005; Yang et al., 2018) [10,11,12,13]; and (3) the numerical computer simulation method (Kustas et al., 2003; Trusilova et al., 2008) [14,15]. The numerical computer simulation method, exemplified by the Weather Research and Forecasting (WRF) mesoscale meteorological model, uses thermodynamics to calculate the energy balance and generate a three-dimensional urban element field. This approach compensates for the horizontal and vertical limitations of meteorological satellite data, making it a powerful tool for studying urban thermal environments. Traditional WRF reflects the influence of urban land use by adjusting reflectivity, roughness, and other parameters. Its description of the underlying surface of the city is too simplistic. The inhomogeneity of the urban underlying surface structure and the impact of urban architecture on the dynamic and thermal characteristics of the urban lower atmosphere and the surface energy balance are not considered in detail (Li X L et al., 2003) [16]. Due to the limitations of the description of the urban underlying surface in WRF, WRF is often coupled with the urban canopy model to improve the accuracy of the simulation. Kusak first used WRF-UCM to replace the description of the urban underlying surface in the Noah land process module (SLAB) of WRF by coupling it with UCM. The model considers the effects of solar radiation on the city from a three-dimensional perspective, including the shielding and reflection of radiation by buildings, the directions of streets, and the energy budget of different surfaces (roofing, walls, and pavements), and it directly includes anthropogenic heat in the form of sensible heat. This model provides a more accurate simulation of the urban heat island effect compared to WRF-SLAB, as evidenced by comparisons with observational data (Kusaka H et al., 2004; Kusaka H et al., 2012) [17,18]. Studies have shown that the WRF-UCM model can effectively simulate meteorological parameters such as urban temperature, humidity, and wind speed (Chen et al., 2014; Lin et al., 2008; Meng et al., 2011) [19,20,21]. In China, WRF-UCM is widely used for predicting urban expansion and in urban thermal environment studies (Cheng et al., 2016; Sun 2013; Sun 2016) [22,23,24]. However, research on the heat island mitigation effects of sponge city initiatives primarily relies on meteorological satellite data methods, using remote sensing images to estimate surface temperatures before and after construction, and assessing the heat island intensity and its trends (Huang et al., 2020; Liu et al., 2018; Song et al., 2018; Zhu et al., 2018) [25,26,27,28]. The application of the WRF-UCM model in evaluating the heat island mitigation effects of sponge city construction remains underexplored. Sponge city construction significantly affects the urban thermal environment by altering urban surfaces. It is essential to employ more precise numerical computer simulation methods to quantitatively evaluate the impact of sponge city planning and construction on urban heat islands and identify new ways to suppress the urban heat island effect from the perspective of early-stage sponge city planning. Through optimizing sponge city planning indicators and planning methods, a new quantitative evaluation method for the heat island mitigation target can be established, maximizing the benefits of the sponge city initiative.
Currently, China’s sponge city management and control indicators are categorized into two categories: control indicators and assessment indicators. The two types of indicators differ in purpose, focus, and implementation. The control indicators focus more on regulating and guiding the construction of sponge cities. They are implemented through the establishment of standards, norms, and guidelines, such as specific requirements for the rate of rainwater collection and utilization, rainwater infiltration rates, and green space ratios. On the other hand, assessment indicators are used to evaluate and provide feedback on the actual outcomes of sponge city projects. In practice, the total annual runoff control rate has become the core indicator for sponge cities in various regions in China, as it addresses both runoff pollution and peak flow control. This study selected the central urban area of Chengdu, a pilot city for China’s sponge city construction, as the study area. Based on the core control indicator of the “Chengdu City Sponge City Special Plan (2016–2030)” (hereinafter referred to as the “Plan”), the annual total runoff control rate, this study proposed two different sponge city planning schemes. The coupled WRF-UCM model was employed to numerically simulate the construction status of sponge cities under different planning schemes, exploring the impact of sponge city construction on the local microclimate and heat island effect and analyzing the underlying mechanisms. Furthermore, this work put forward a quantitative simulation and planning method of sponge city planning with the consideration of the heat island mitigation effect based on management and control indicators.

2. Methods

2.1. Study Area

The study area is located in Chengdu City, Sichuan Province (30°24′ N, 104°2′24′′ E), a pilot city for sponge city construction in China. Chengdu is located in the western part of the Sichuan Basin in China, which belongs to the subtropical humid monsoon climate zone, with low wind speed, high frequency of static winds, many inversions, and an obvious heat island effect throughout the year. The study selected the central city of Chengdu as the specific study area. This area is the key enhancement area in the sponge city planning of Chengdu, with a high population density, a large proportion of built-up area, and an obvious heat island effect, which can better reflect the impact of sponge city planning and construction on the urban heat island effect. When selecting the nested domains for WRF simulation, considering the small scale of Chengdu’s city center, in order to ensure the accuracy of simulation while saving computational resources and improving the simulation efficiency, a 2-layer nested domain (Figure 1) was selected based on the reference of existing studies (Sun Y 2016) [24]. The center point of the model was located in the central urban area of Chengdu (30.65° N, 114.07° E). Domain 1 had an east–west range of 103.5 km and a north–south range of 103.5 km. The east–west and north–south directions were both divided into 69 equal parts, with a resolution of 1.5 km × 1.5 km. Domain 2 had an east–west range of 24.5 km and a north–south range of 24.5 km. The area within the third ring road of Chengdu was divided into 49 equal parts in both the east–west and north–south directions, with a resolution of 500 m × 500 m (see Table 1 for details).

2.2. Simulation Background Parameter Settings

The WRF version 3.9.1 was used for this study. Boundary conditions to be input for the simulation included meteorological data, land use data, and DEM data. For meteorological data, the NECP 6 h 1° × 1° reanalyzed weather data were used to drive the WRF simulation runs. For land use data, the land use data in the WRF database have problems such as low resolution and data lag, which is a problem in terms of meeting the research needs at the micro level. Therefore, the 2015 China 30 m high-precision land use status land use type remote sensing monitoring data (LUCC), developed by the Chinese Academy of Sciences (CAS), were selected and processed to replace the default land use data. However, the accuracy of the DEM data in the WRF database was adequate for this study, so they remained unchanged.
This study selected 06:00 UTC on 4 July 2015 to 18:00 UTC on 5 July 2015 as the simulation period. The 11 h starting at 06:00 UTC on July 4, 2015, were used as the warm-up period, and the following 24 h corresponding to Beijing Standard Time from 00:00 on 5 July 2015 to 24:00 on 5 July 2015 were used as the study period.
For the parameterization schemes of different physical processes, (Li’s 2013) [29] settings for WRF simulation of the heat island effect under heat-wave weather were used as a reference. The specific physical parameterization schemes are shown in Table 2. In the Noah land surface process model, the UCM was adopted for urban areas. The UCM in WRF version 3.9.1 replaced the single-layer homogeneous material of the previous version with a multilayer composite heat conduction solution, which could better describe the effect of green roofs on the urban climate. In this study, a multilayer UCM was used for simulation.

2.3. Classification and Parameter Setting of Urban Underlying Surface Based on Sponge City Control Zoning

In the urban canopy model (UCM), urban surfaces are classified into three categories based on the intensity of construction land, as indicated by the imperviousness ratio: low-density residential area, high-density residential area, and industrial and commercial area (Hou et al., 2013) [30], as detailed in Table 3. The Chengdu City Sponge City Special Plan (2016–2030) considers four major factors when establishing sponge city control zones in the central urban area: geological and hydrological conditions, green space rate, building density, and the degree of surface source pollution. Based on the total annual runoff control rate (see Equation (1)), the central urban area of Chengdu is divided into three main control zones, as shown in Table 3. Equation (1) calculates the total annual runoff control rate using six indicators: green space rate ( G S P ), sunken green space rate ( D S P ), green roof rate ( R S P ), permeable pavement rate ( P P R ), building density ( B D ), and composite runoff coefficient ( C R C ). These indicators primarily reflect the infiltration performance of the urban subsurface and the intensity of construction. This approach is similar to the UCM’s method of dividing urban surfaces based on construction land intensity. Consequently, this study categorized Chengdu’s urban center into three management and control zones: Class I (65% total annual runoff control rate), Class II (70% control rate), and Class III (75% control rate), corresponding to industrial and commercial areas, high-density residential areas, and low-density residential areas in the UCM, respectively, as illustrated in Figure 2a. The calculation for Equation (1) is as follows:
1 G S P B D × P P R × 0.2 + 1 G S P B D × 1 P P R × 0.85 + G S P × 1 D S P × 0.15 + R S P × 0.3 + ( 1 R S P ) × 0.85 = C R C
Equation (1) is quoted from the “Chengdu Sponge City Special Plan (2016–2030)”. In the above, G S P is the green space proportion, D S P is the proportion of sunken green space, R S P is the green roof proportion, P P R is the permeable pavement rate, B D is the building density, and C R C is the comprehensive runoff coefficient. The plan specifies that in developed areas, the comprehensive runoff coefficient should be ≤0.45 when the annual total runoff control rate is between 75% and 80%, and it should be ≤0.5 when the rate is between 65% and 70%. In the study area, the total annual runoff control rates for the Class I, II, and III zones are set at 65%, 70%, and 75%, respectively, with corresponding upper limits for the comprehensive runoff coefficient of 0.5, 0.5, and 0.45.
In order to obtain geometrical information on the characteristics of the underlying surface in the Chengdu area, this study collected data on ground-level buildings in downtown Chengdu (including building distribution, number, height, number of floors, etc.) through satellite remote sensing imagery and Google Maps Building Information Data Crawl, and it corrected the accuracy of the data on ground-level buildings in downtown Chengdu by conducting field inspections in a number of representative areas of the underlying surface of the three types of cities within the study area (Figure 2). The geometric information (the average building height Z R , the standard deviation of the building height σ Z R , the roof width w R , and the street width w c ) required for the UCM was calculated using Equations (2)–(5). Finally, the geometric parameters of the urban underlying surfaces are shown in Table 3. Other relevant parameters for the urban underlying surface in the UCM were selected with reference to established studies (Sun T 2013; Xiao D et al., 2011) [23,31] and are shown in Table 4.
Z R = i = 1 N h i N
σ Z R = i = 1 N   ( h i Z R )   N 1
w R = i = 1 N A i A T d
w c = d w R
where z R is the average building height, h i is the height of the i building, σ Z R is the standard deviation of the building height, w R is the roof width, A i is the roof area of the i th building, w C is the street width, A T is the total area occupied by the building, d is the grid cell size, and N is the sample size.

2.4. Parameter Setting of Underlying Surface Composition Properties in the Simulation Scheme

According to the requirements of the total annual runoff control rate of each control zone of Chengdu sponge city planning (Equation (1)) and the current situation of Chengdu, based on the characteristics of the WRF-UCM model, this research chose the green roof rate, greening rate, and permeable pavement rate as the main research factors. At the same time, these factors can also be directly associated with the urban subsurface structure and heat island effect, which facilitates quantitative analysis through the WRF-UCM model. Three groups of schemes were established by adjusting the attribute parameters of the three types of urban underlying surface components in the model. Among them, scheme 1 (case 1) was the base case, or the current situation of land use in Chengdu. Scheme 2 (case 2) and scheme 3 (case 3) were sponge city planning and design schemes with different green roofs, greening rates, and permeable paving rates. Case 2 added green roofs and permeable paving to case 1. Case 3 added urban green space to case 2 and increased the green roof rate by 20% and decreased the permeable paving rate accordingly. The parameter settings for the urban underlying surface component attributes for the specific different schemes are shown in Table 5. Equation (1) was used to calculate and evaluate the comprehensive runoff coefficients of the different city types. The results showed that the different city types of case 2 and case 3 all met the control objectives of the management and control zone. The specific results are shown in Table 6. The study period for all 3 sets of simulation schemes was from 00:00 on 5 July 2015 to 24:00 on 5 July 2015, Beijing Standard Time.

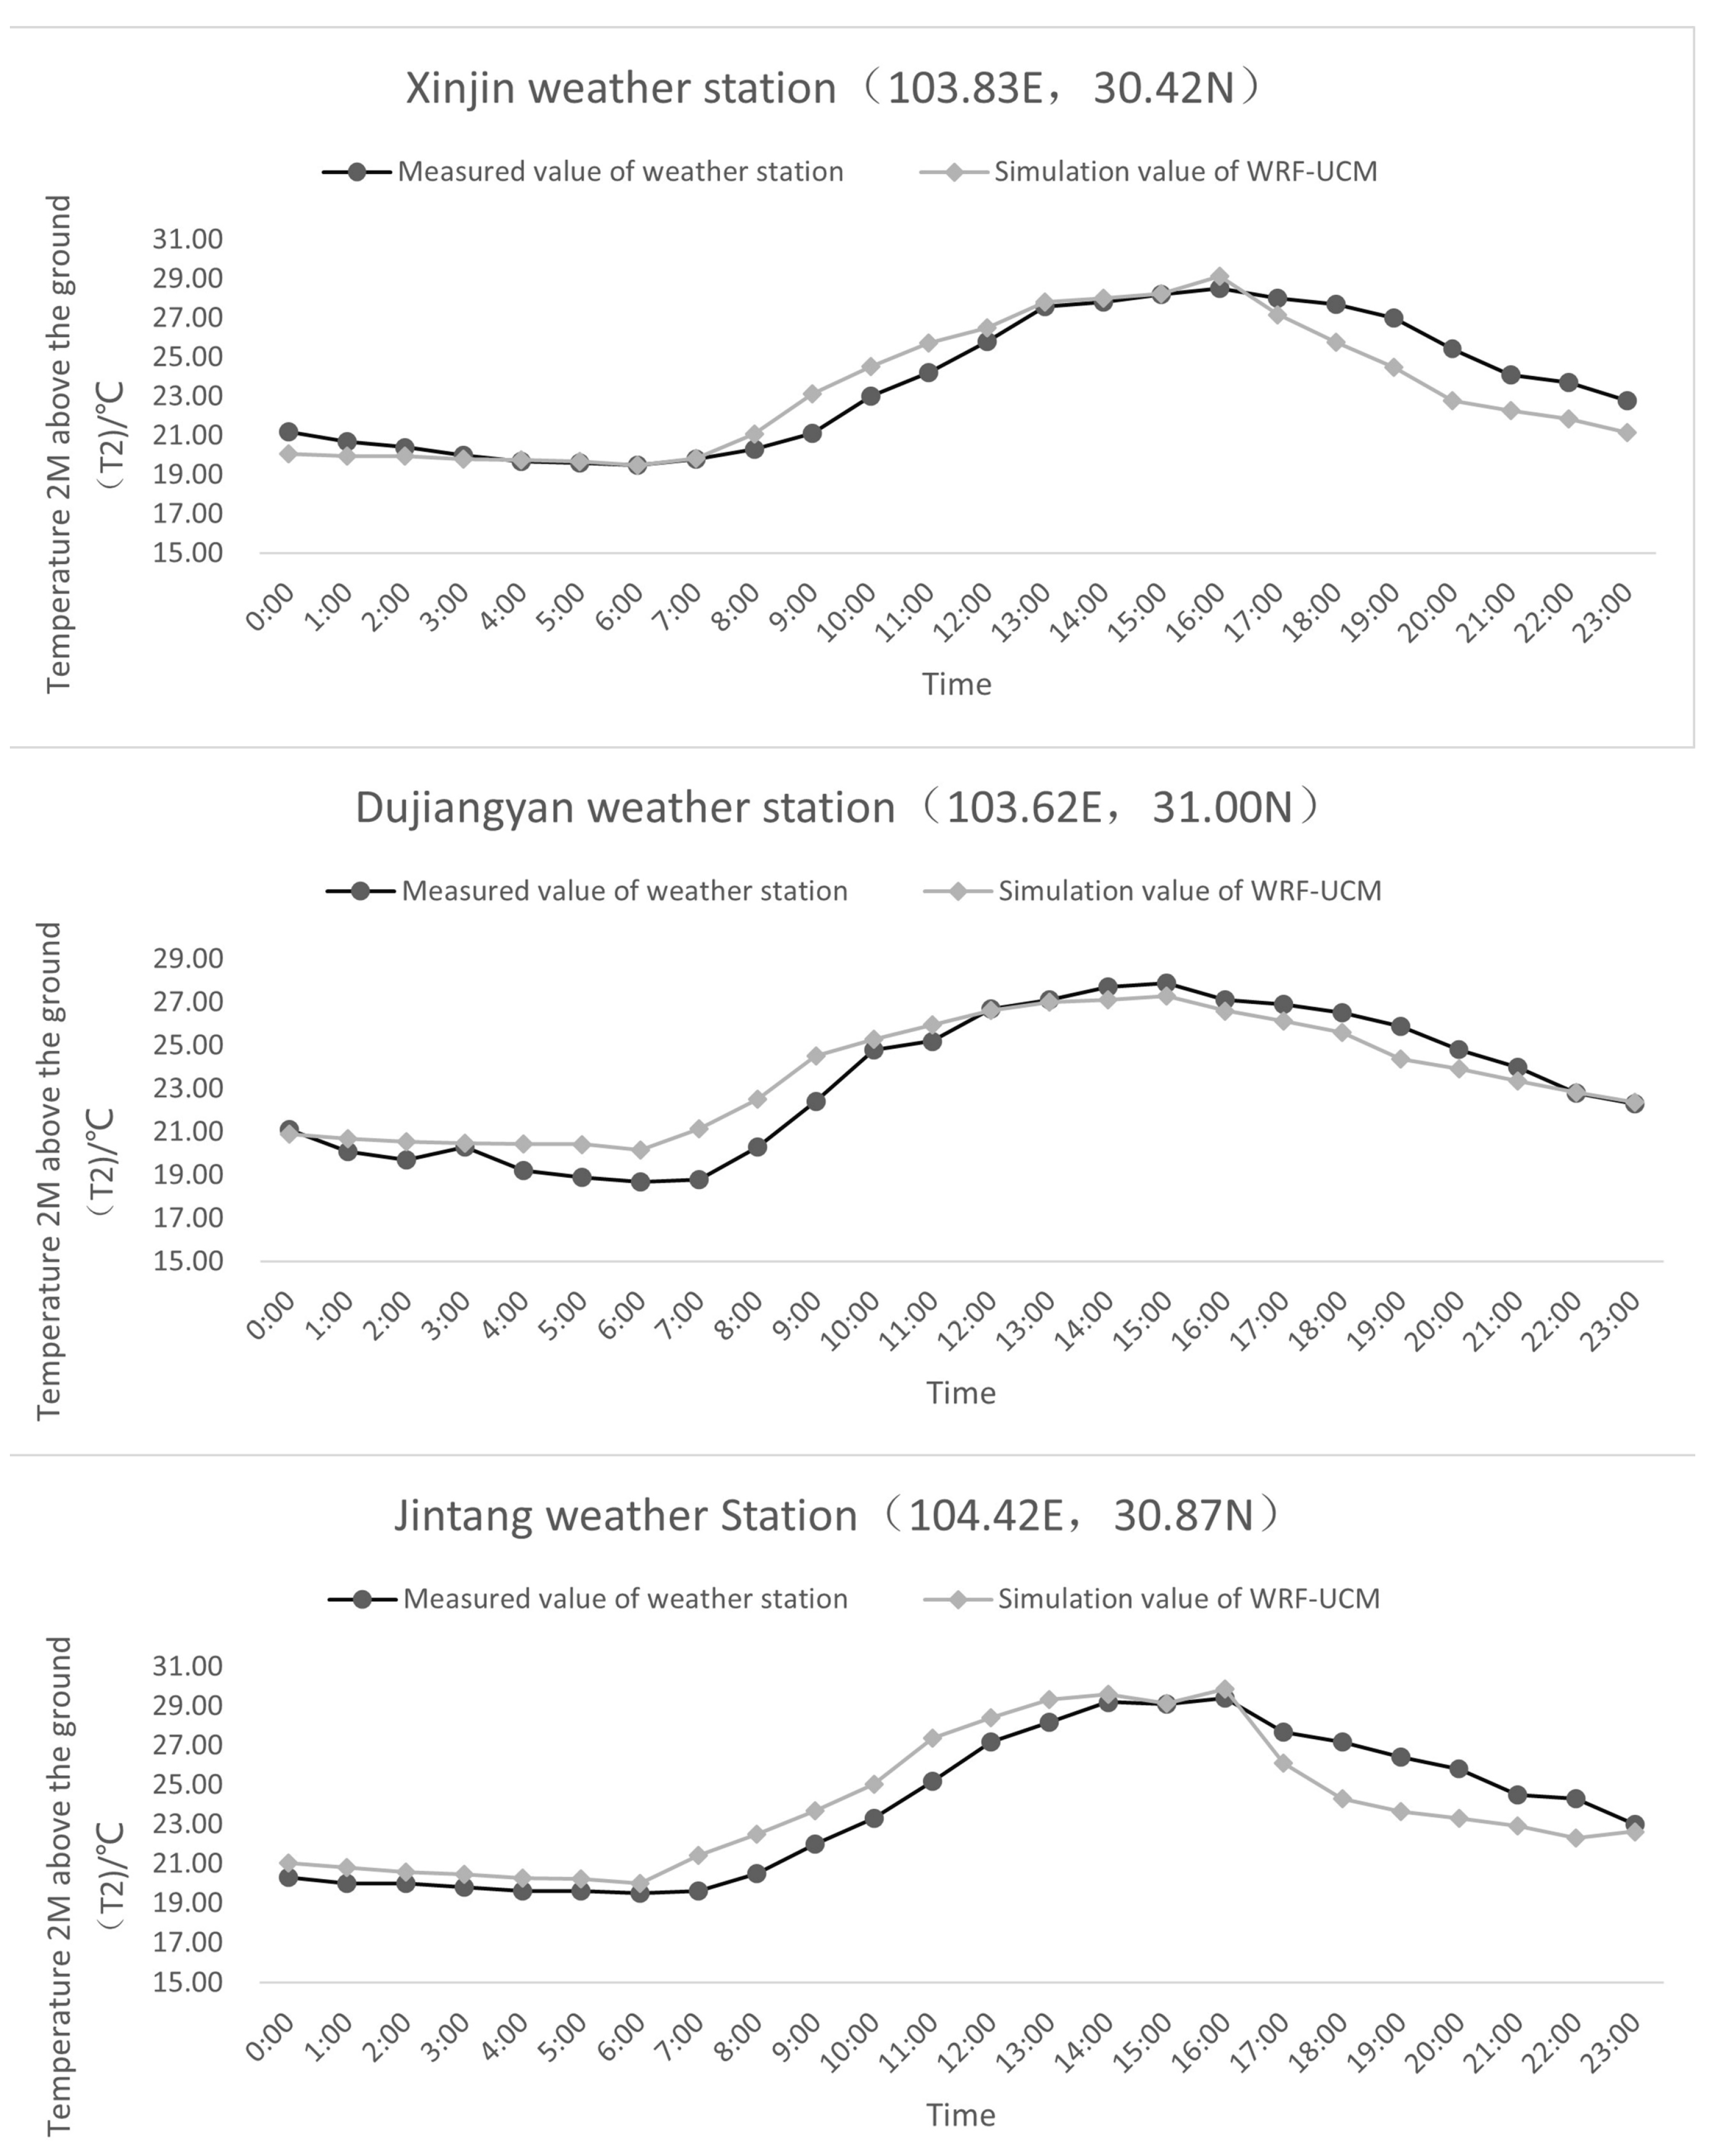
2.5. Simulation Verification

Considering that this study was based on the background of heat-wave weather, the focus was on the simulation of the air temperature. In order to verify the accuracy of the model simulation, air temperature data at 2 m above ground level during the study period at three meteorological stations in the study area (data from the China Meteorological Data Service Center, China Meteorological Administration) were selected for comparison with the T2 variables at the corresponding stations in the model simulation results of case 1 (base case). Figure 3 shows the simulation effect of WRF-UCM on the air temperature at 2 m near the ground during the study period. Overall, the change trends between the two were basically consistent, showing that the WRF-UCM had a better simulation effect on the air temperature, which can more accurately simulate the maximum temperature during the daytime, and it also had a better simulation effect on the temporal development of the air temperature. However, the simulation accuracy at different moments was slightly different.
To further validate the simulation’s reliability, three statistical coefficients were employed: the coefficient of determination (R2) (Equation (6)), the Nash–Sutcliffe efficiency coefficient (NSE) (Equation (7)), and the percentage bias (PBIAS) (Equation (8)). The results of the three validation coefficients are shown in Table 7, which indicate that R2 exceeded 0.6, NSE was above 0.5, and |PBIAS| was below 15. These values suggest that the simulation results were satisfactory. A comprehensive comparison confirmed that the WRF-UCM model developed by our institute accurately simulated the urban thermal environment in the study area, meeting the simulation requirements for this research.
R 2 = i = 1 n O i O a v g S i S a v g i = 1 n O i O a v g 2 0.5 i = 1 n S i S a v g 2 0.5 2
N S E = 1 i = 1 n O i S i 2 i = 1 n O i O a v 2
P B I A S = i = 1 n O i S i 100 i = 1 n O i
where O i and S i are the measured and model-simulated values, respectively; O a v g and S a v g are the average values of the measured and model-simulated values, respectively; and n is the number of measured data.

3. Results

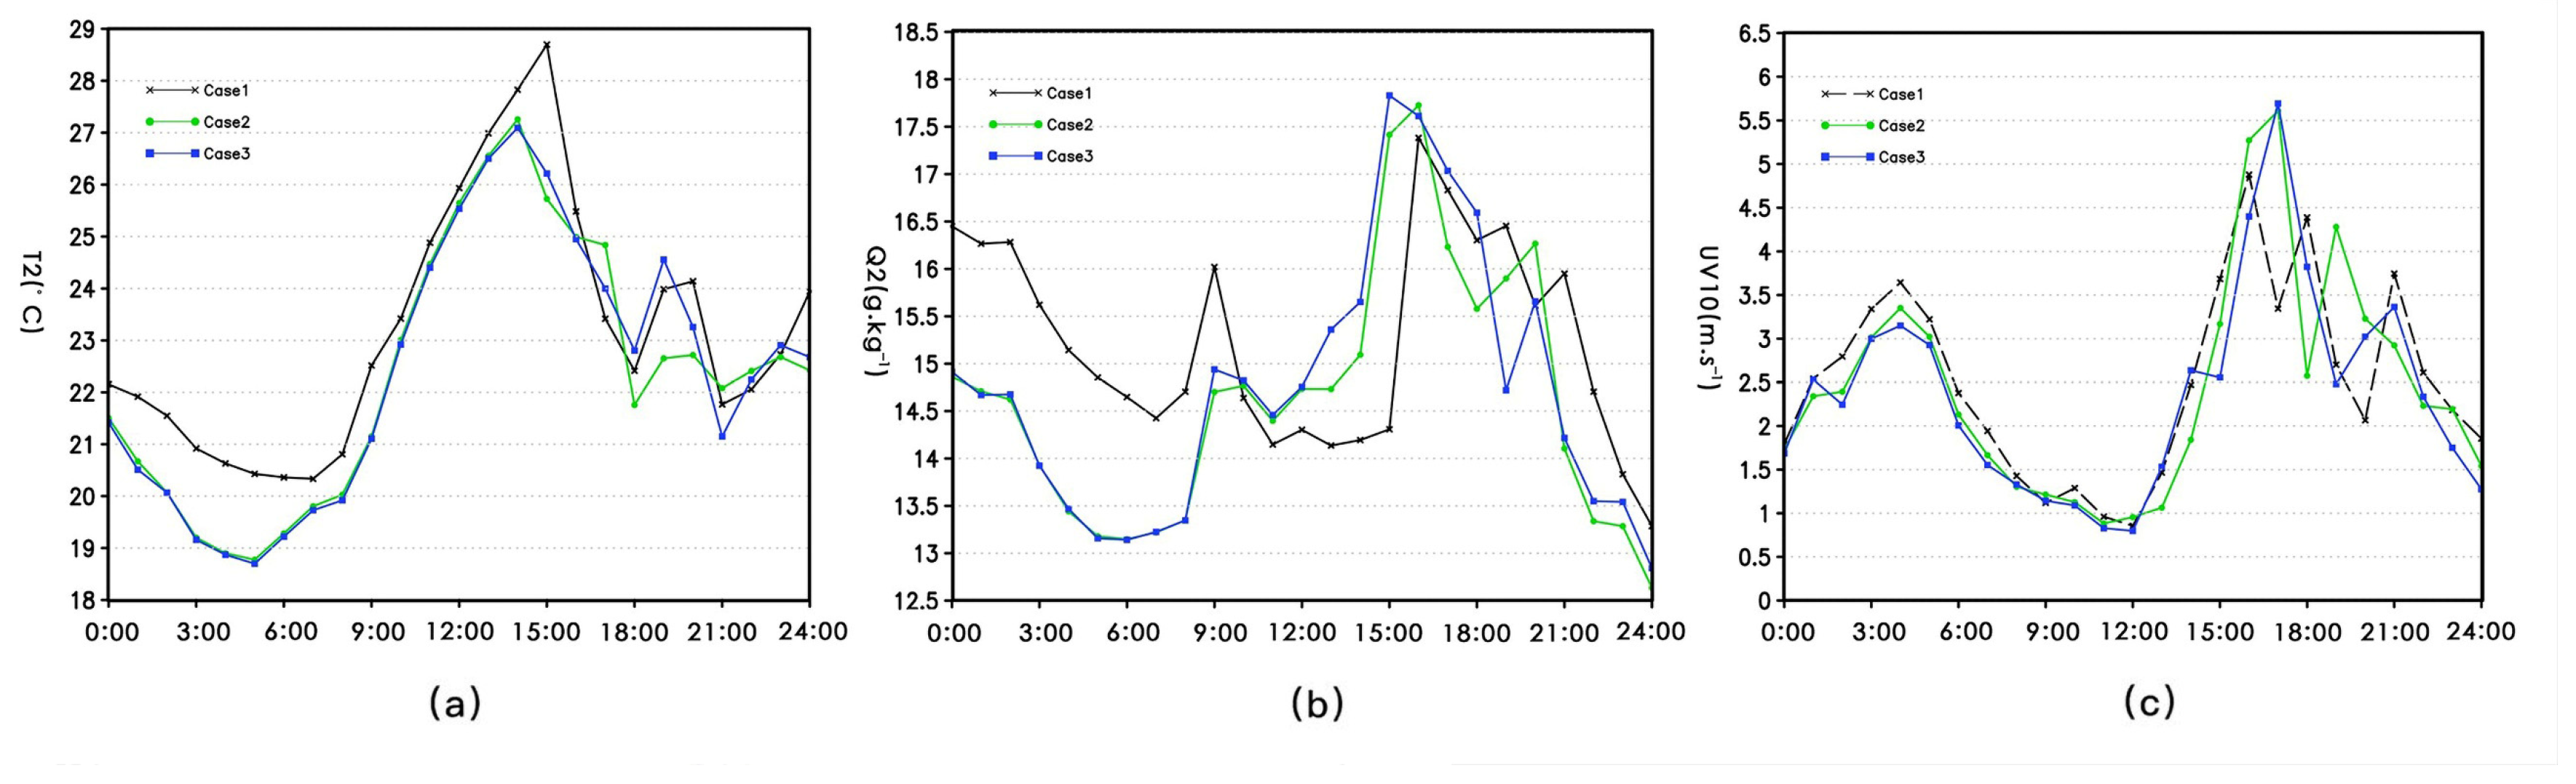
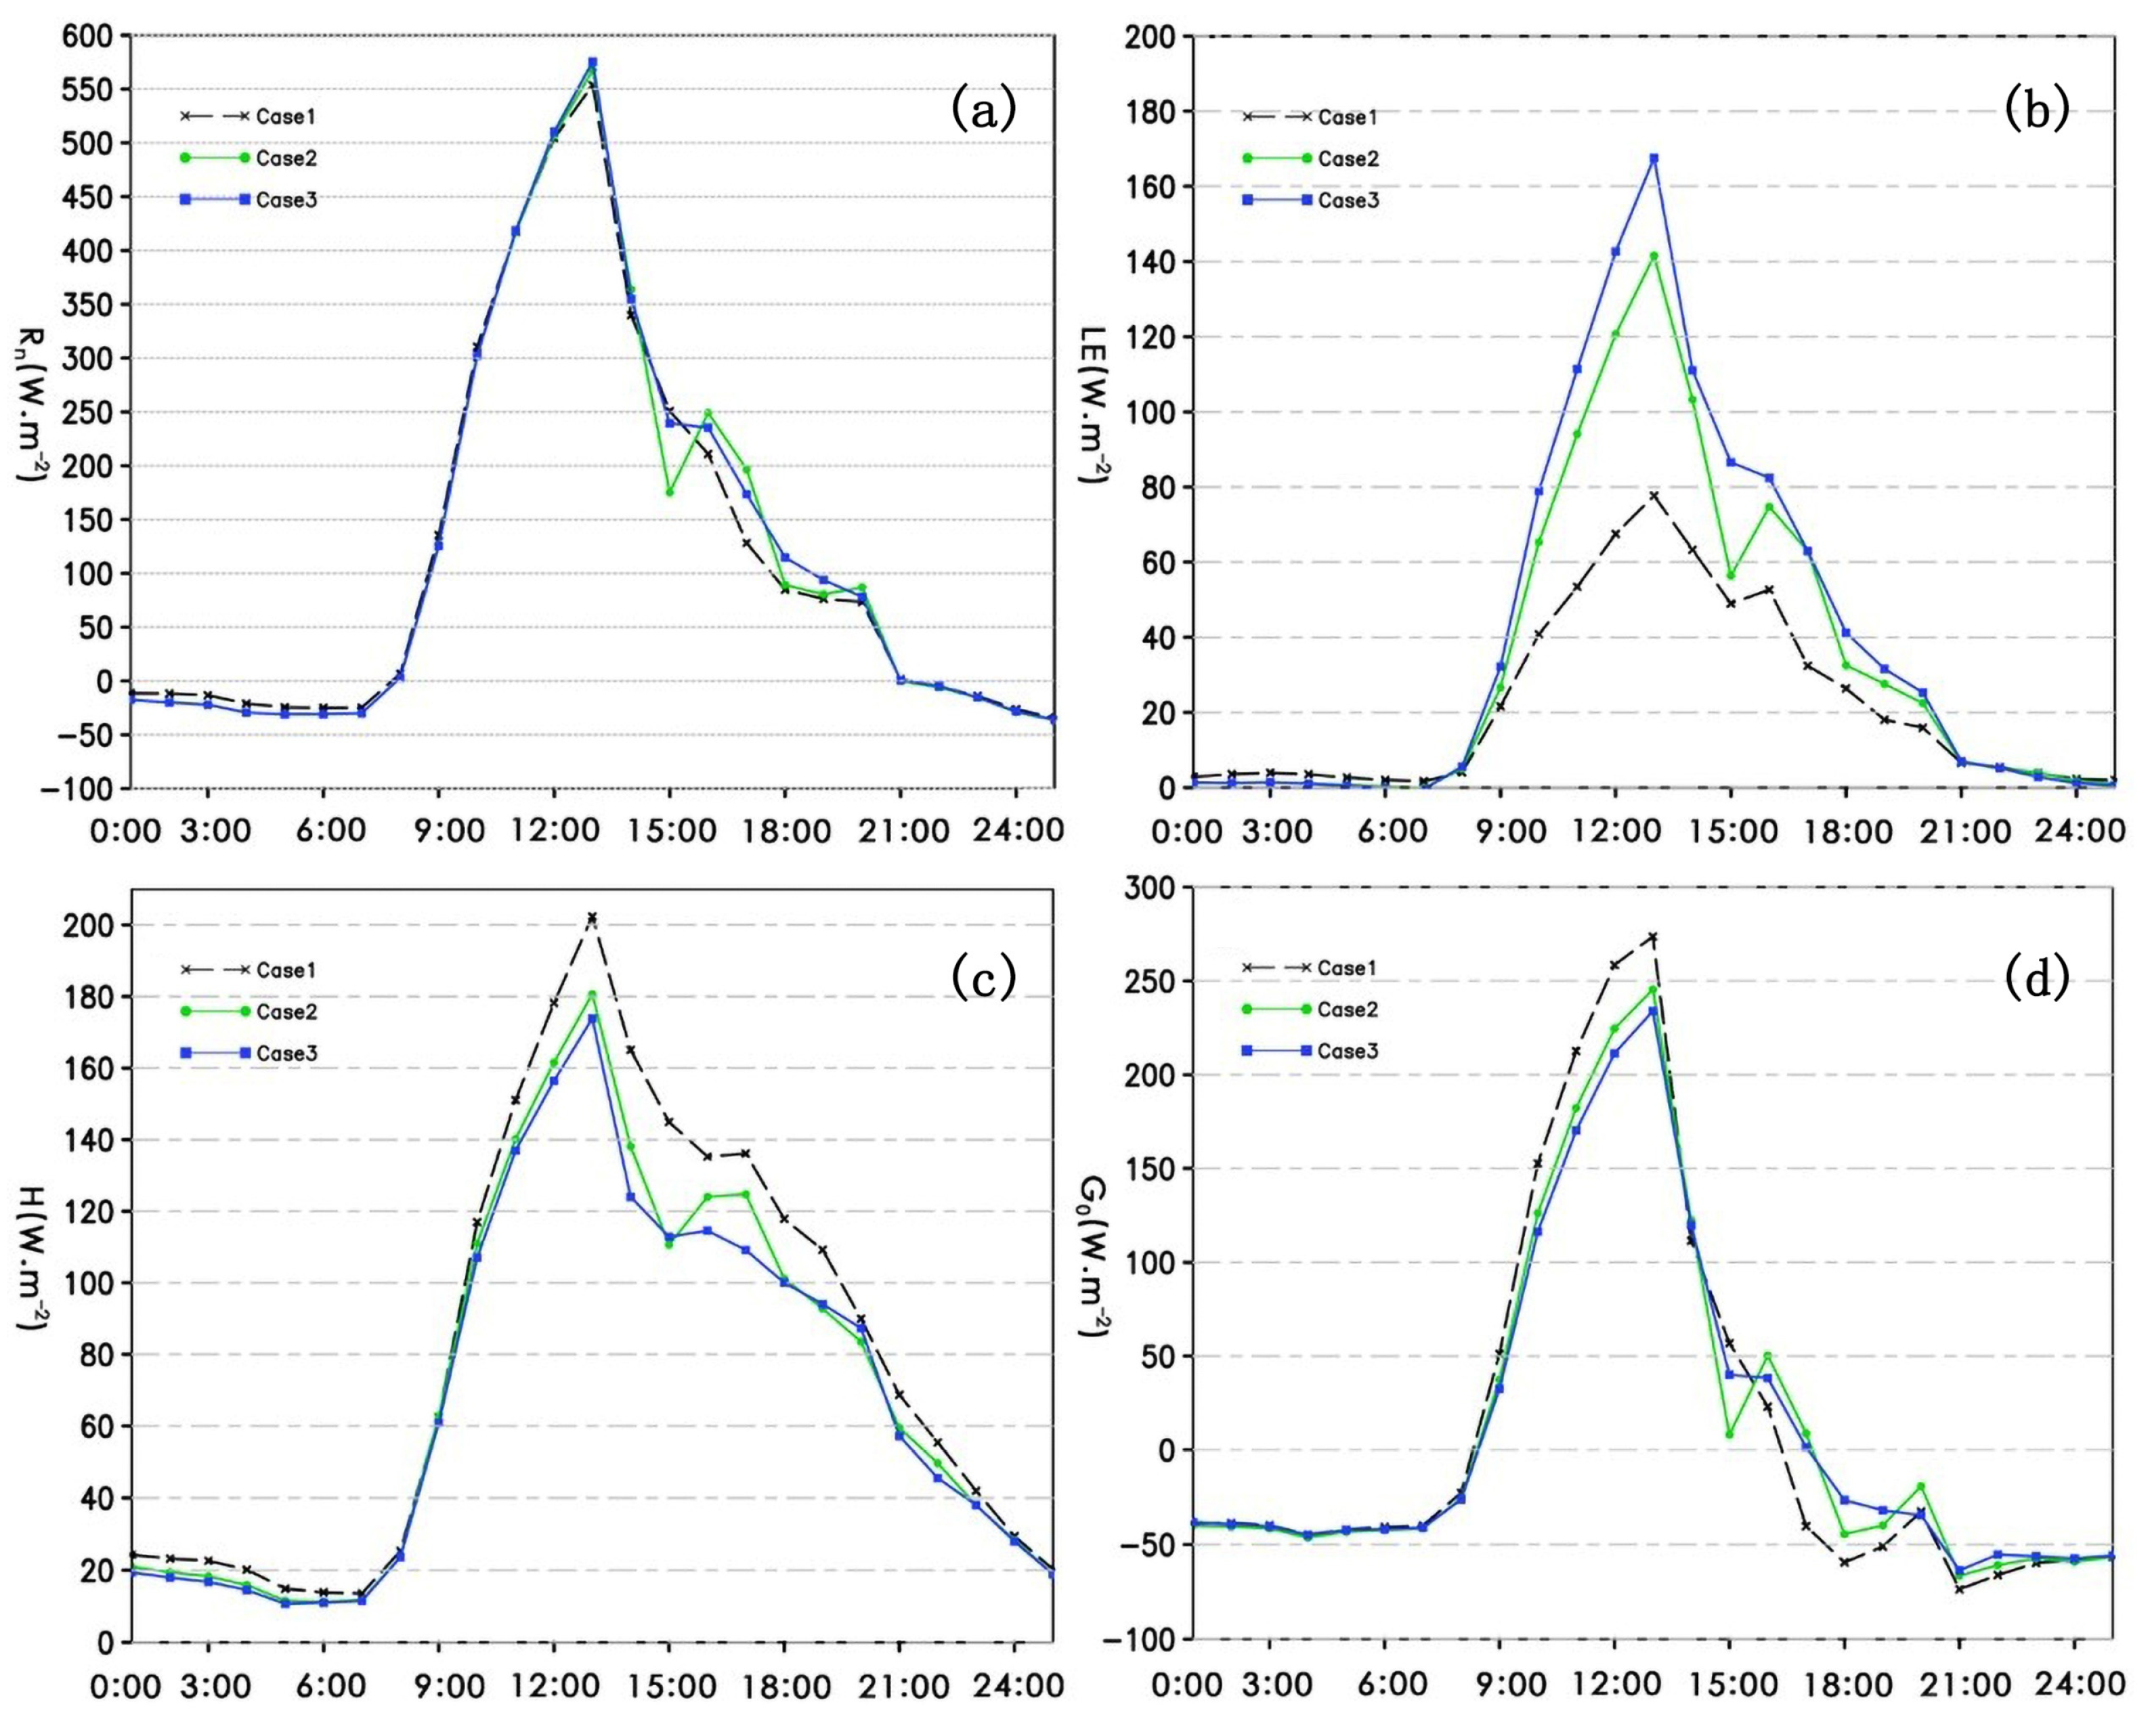
3.1. Comparison of Microclimate Elements in Each Case

Figure 4 illustrates the differences in air temperature 2 m above the ground (T2), the air specific humidity at 2 m above the ground (Q2), and the synthetic wind speed at 10 m above the ground (UV10) for the three schemes during the study period. Figure 4a shows that sponge city planning can effectively reduce the air temperature 2 m from the ground. At the highest temperature, case 3 reduced the air temperature by 1.8 °C, and case 2 reduced the air temperature by 1.6 °C. The higher temperatures observed in case 2 and case 3 compared to case 1 during certain afternoon hours were attributed to the different rates of temperature change among the scenarios. The sponge city plan had a higher rate of temperature rise and fall than the status quo due to the increase in the rate of green roofs, green space, and permeable paving in the city, which enhanced the moisture content of the urban underlying surface. Figure 4b shows that sponge city planning was expected to increase the air humidity above the urban surface. Compared to the current status, the peak air specific humidity in case 2 (case 3) was projected to increase by 0.3 g·kg−1 (0.5 g·kg−1). Figure 4c shows that sponge city planning was expected to increase wind speeds in the afternoon while reducing them in the morning and evening. Before 16:00, the wind speeds for the sponge city scenarios were lower than the current wind speeds, with the maximum decrease reaching 0.6 m/s in case 2 and 1.2 m/s in case 3. After 16:00, the wind speeds for both sponge city design cases exceeded those of the current scenario. During high-temperature periods, an increased wind speed is beneficial for enhancing air convection. After 21:00, the wind speeds of case 2 and case 3 were weaker than in case 1. During this period, the urban heat island effect was most pronounced due to the release of stored heat from the urban surface. The decrease in wind speed may have been caused by the reduced sensible heat flux (H) in case 2 and case 3, which, in turn, diminished the wind speed driven by turbulent heat transfer. The simulation results demonstrate that sponge city planning reduced the air temperature at 2 m above the ground, increased the specific humidity at 2 m above the ground starting in the late afternoon, and generally reduced the wind speed at 10 m above the ground. By altering the proportions of green spaces, green roofs, and permeable paving, the sponge city plan significantly increased the water content of the urban surface, thereby impacting the local microclimate of the city.
At the same time, different sponge city planning and design schemes have similar effects on microclimate elements such as temperature, humidity, and wind speed, but they differ in the extent of their influence. Established studies (Xue J S et al., 2023) [32] have shown that the urban heat island effect is characterized by daily variations. It decreases sharply after sunrise, sometimes even resulting in an urban cold island effect, and then begins to rise slowly in the afternoon. Case 2 and case 3 followed the same trend until midday but fluctuated significantly in the afternoon. The reason may be due to the difference between case 2 and case 3 in the setting of the scheme, leading to a difference in the water content of the underlying surface between the two. In the morning, the urban heat island effect was weak, resulting in minimal differences between case 2 and case 3. In the afternoon, as the urban heat island effect intensified, the impact of case 2 and case 3 on the city’s energy allocation process was primarily in the afternoon. At this time, the difference between two cases became more pronounced, and their effects on the microclimate varied due to the differing water content of their respective underlying surfaces, leading to differences in the simulation results.

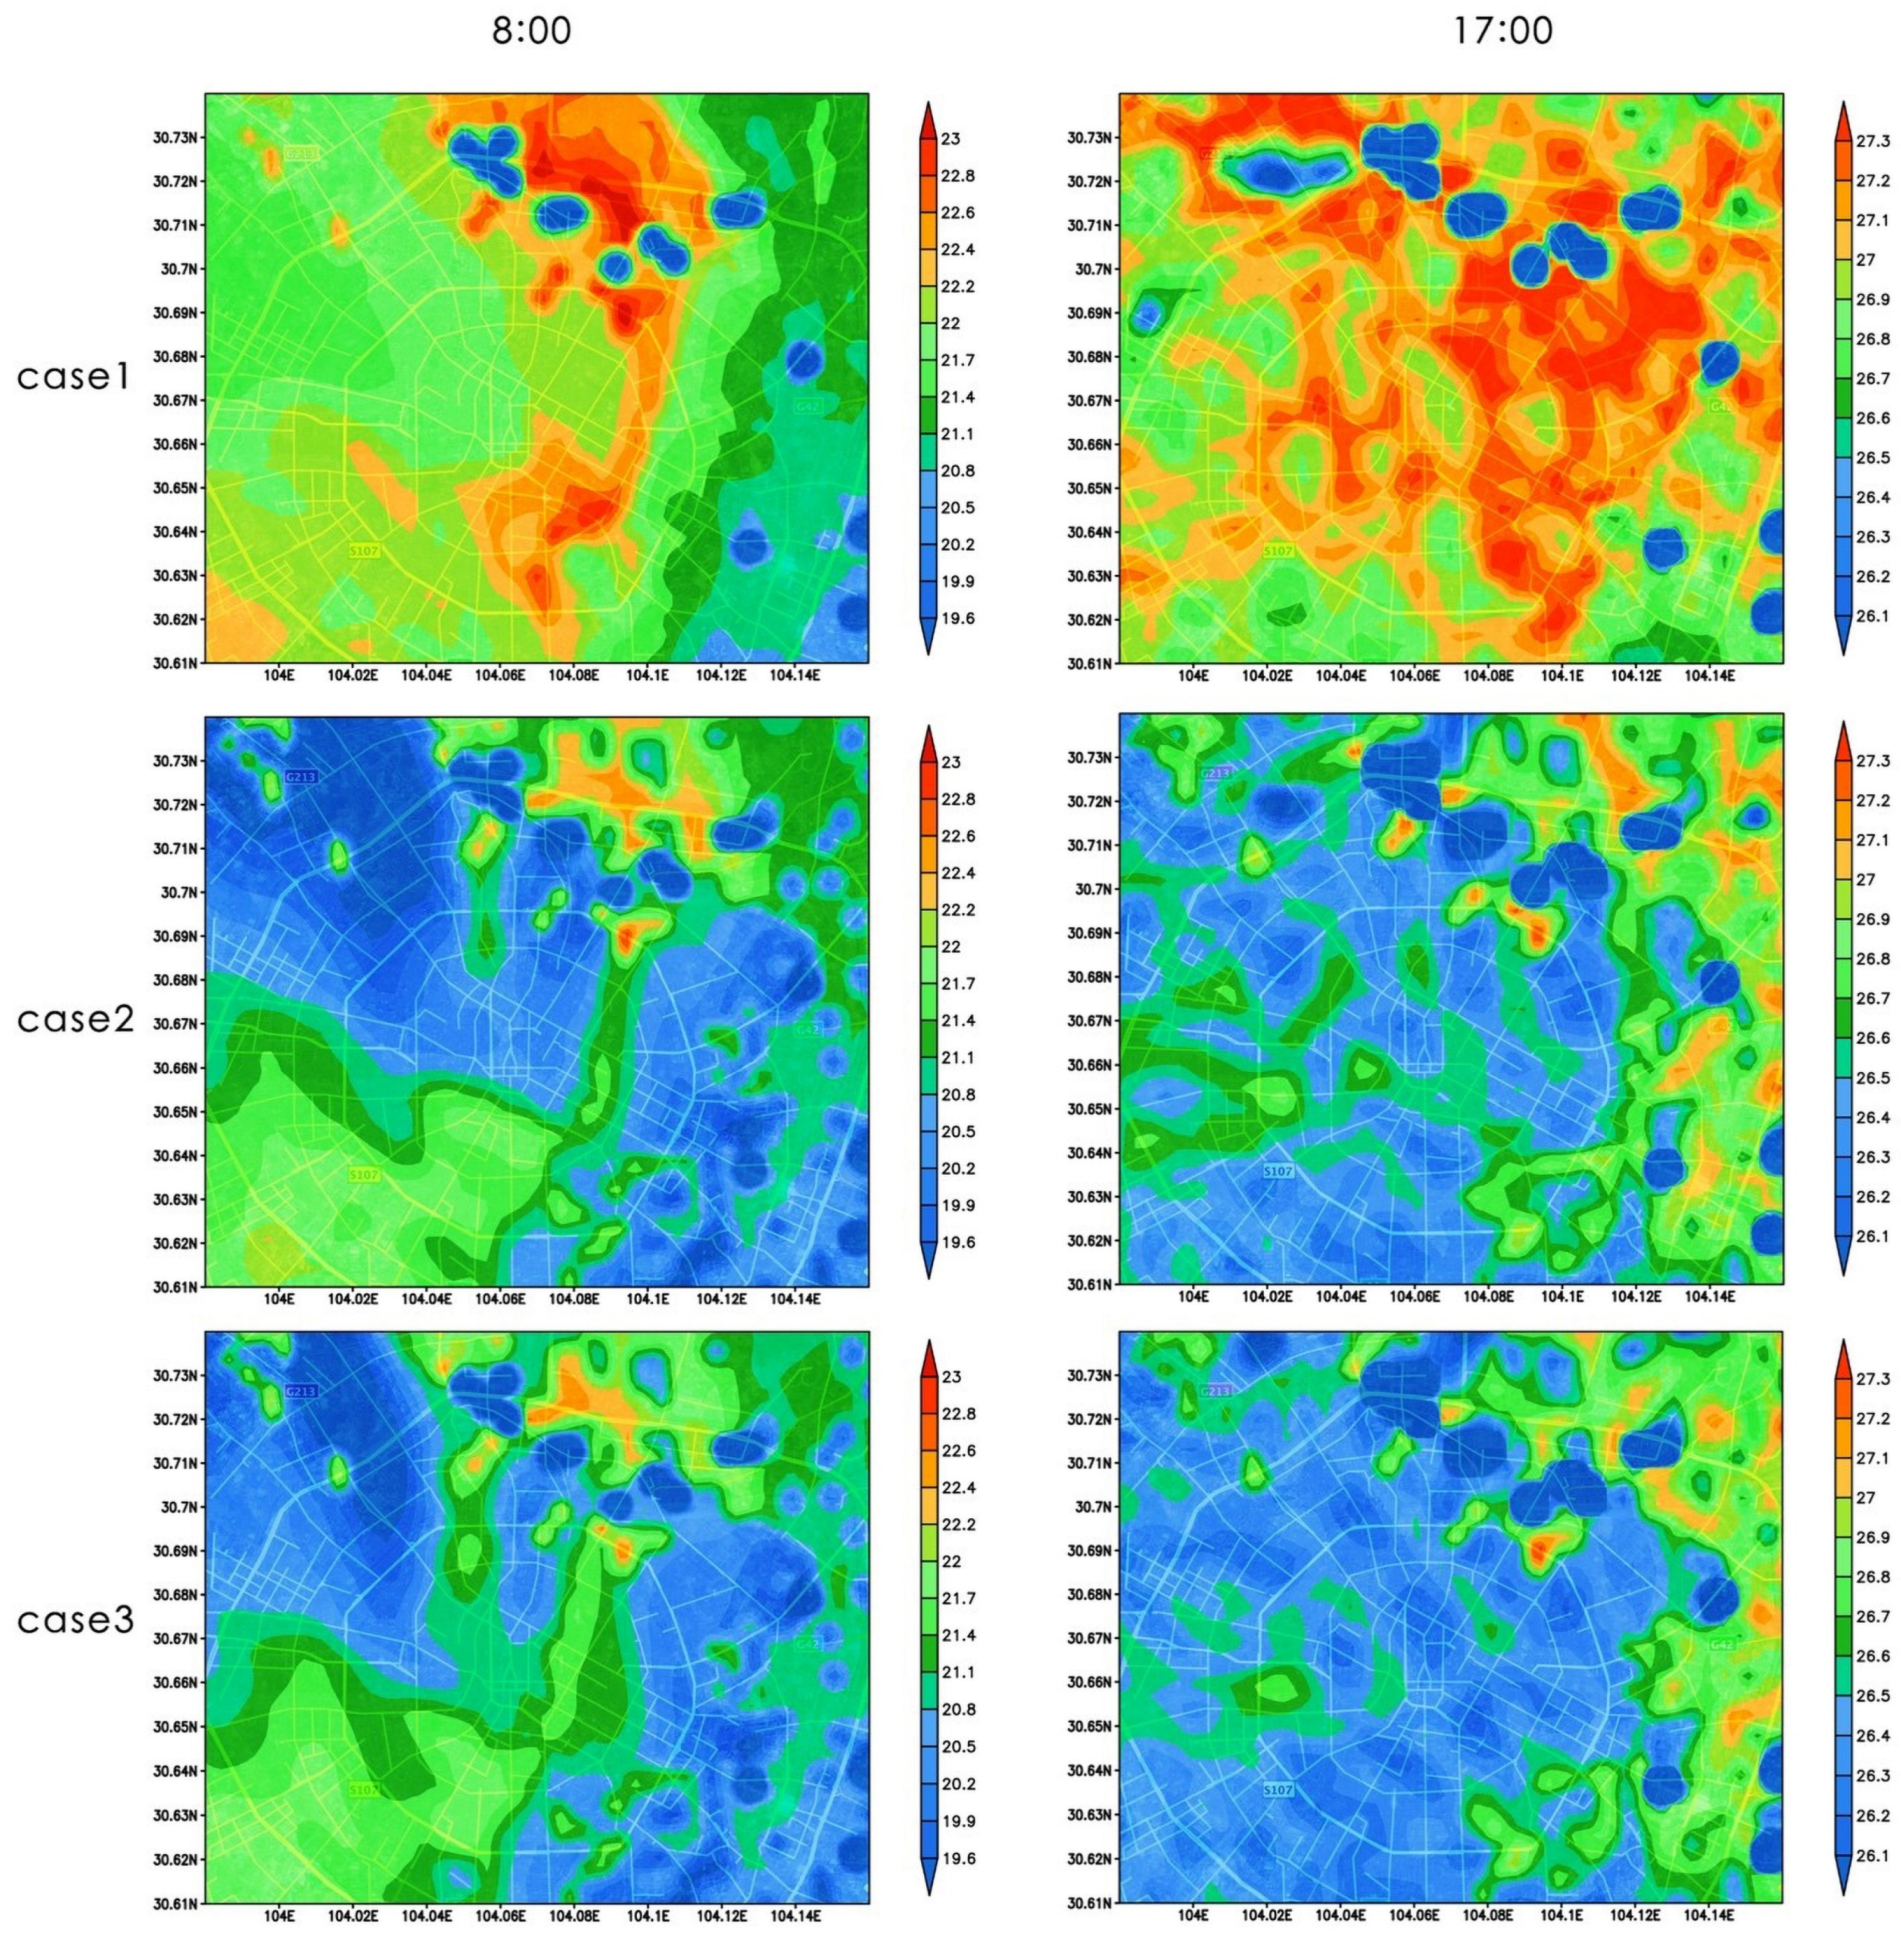
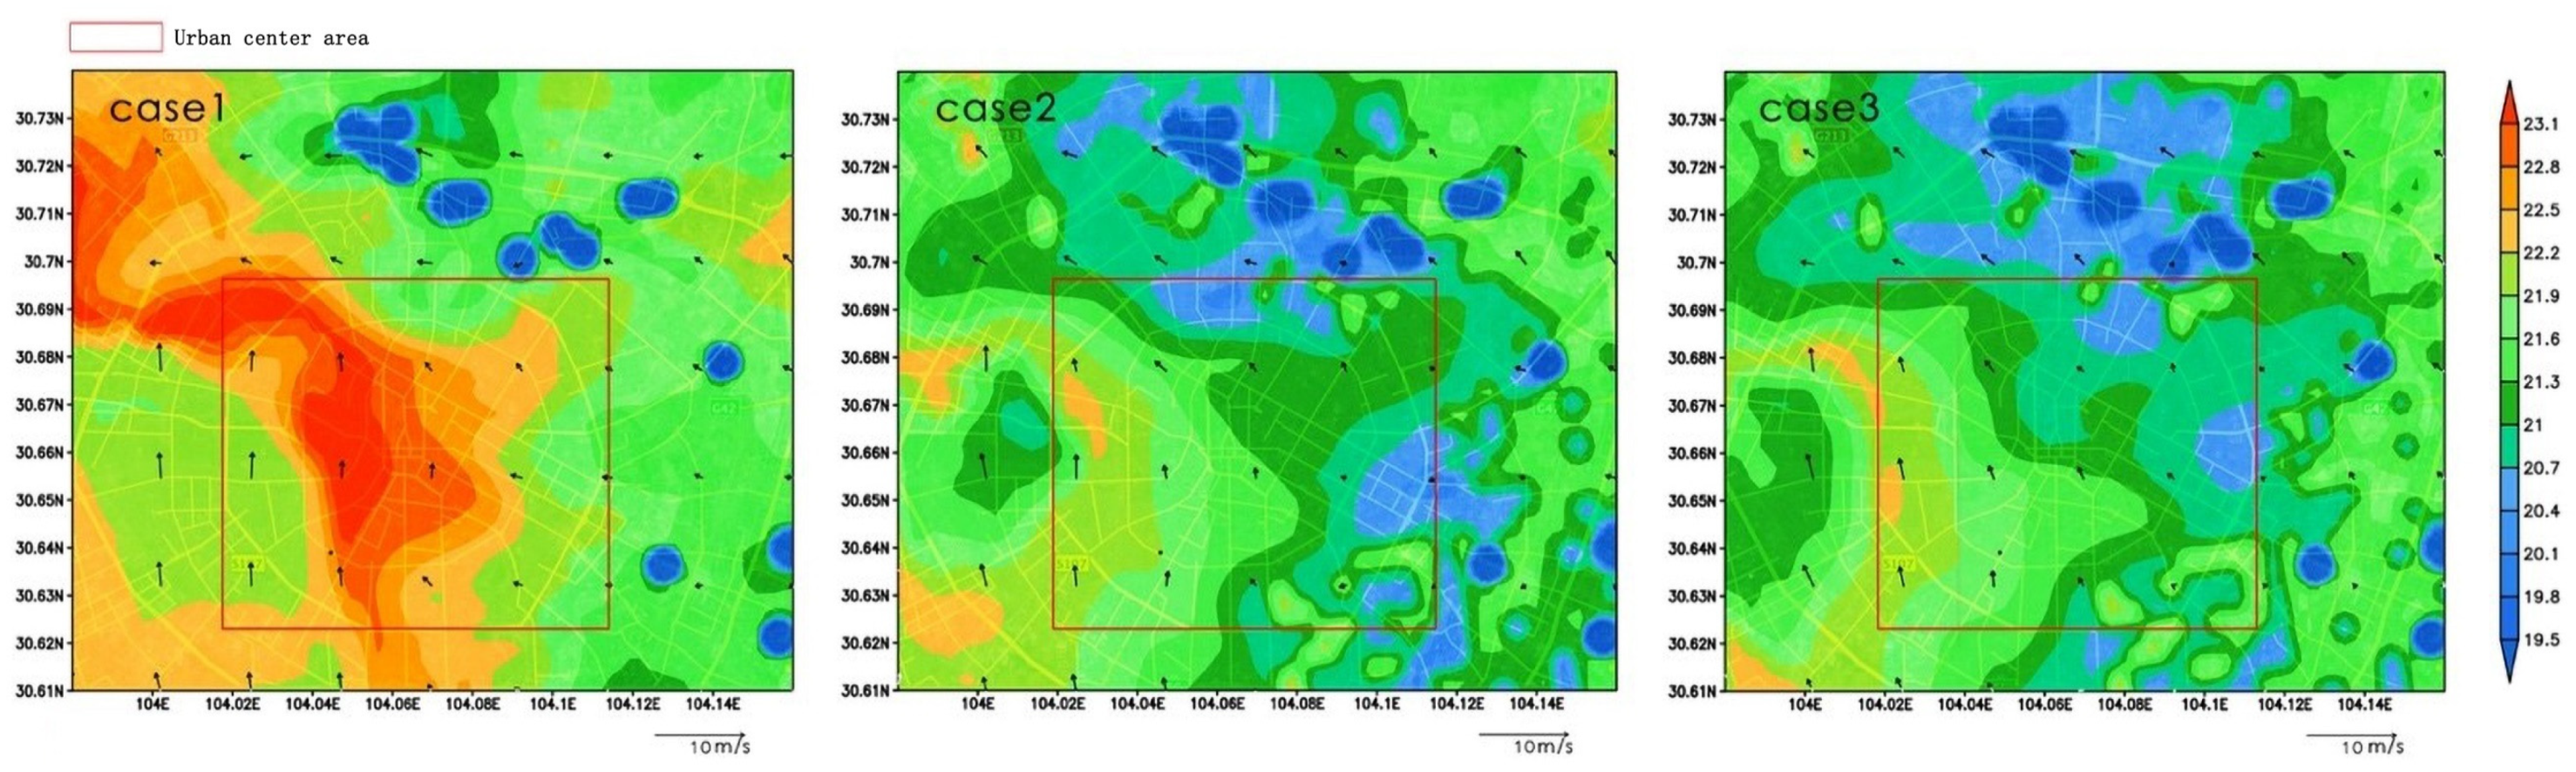
3.2. Comparison of Air Temperature Field in Each Case

This study compared the regional air temperature fields of Chengdu’s current urban construction status (case 1), sponge city planning scheme 1 (case 2), and sponge city planning scheme 2 (case 3) at 08:00 and 17:00 to investigate the impact of sponge city planning on the heat island effect (Figure 5). At 08:00, the average temperatures of case 2 and case 3 were approximately 2 °C below that of case 1. From sunrise to 08:00, the temperature rise in the city center was slower due to the obstruction of solar radiation by buildings and other artificial surfaces. However, the urban suburbs, with more natural surfaces, warmed up faster due to less shelter. Consequently, the city did not warm as much as the countryside, and the urban heat island effect was not pronounced at this time. At 17:00, as Chengdu entered the cooling phase, the natural surfaces cooled down significantly faster than the artificial ones, resulting in a strong urban heat island effect. As shown in Figure 5, case 1 showed a clear urban heat island phenomenon, which was most pronounced in the city center. Additionally, the heat island effect was stronger in the northeast than in the northwest of the simulation area. Notably, the heat island phenomenon was evident in the riverside area within the simulation range, primarily due to extensive development in the city center’s riverside area in the past, consistent with the findings of (Li et al., 2008) [33]. In the northern part of the simulation area, the presence of numerous park green spaces increased the natural surface area, leading to significantly lower temperatures compared to the surrounding areas. Compared to case 1, the addition of green roofs and permeable surfaces in case 2 and case 3 significantly reduced their temperatures. During the urban cooling process, the increased natural surface area in the sponge city planning cases allowed for rapid cooling compared to the base case, effectively mitigating the urban heat island effect. The number of heat islands in case 2 and case 3 was significantly reduced compared to case 1. Furthermore, case 3, with a higher rate of green roofs and green areas, had more moisture content in the urban surface, resulting in a greater inhibitory effect on the urban heat island effect compared to case 2.

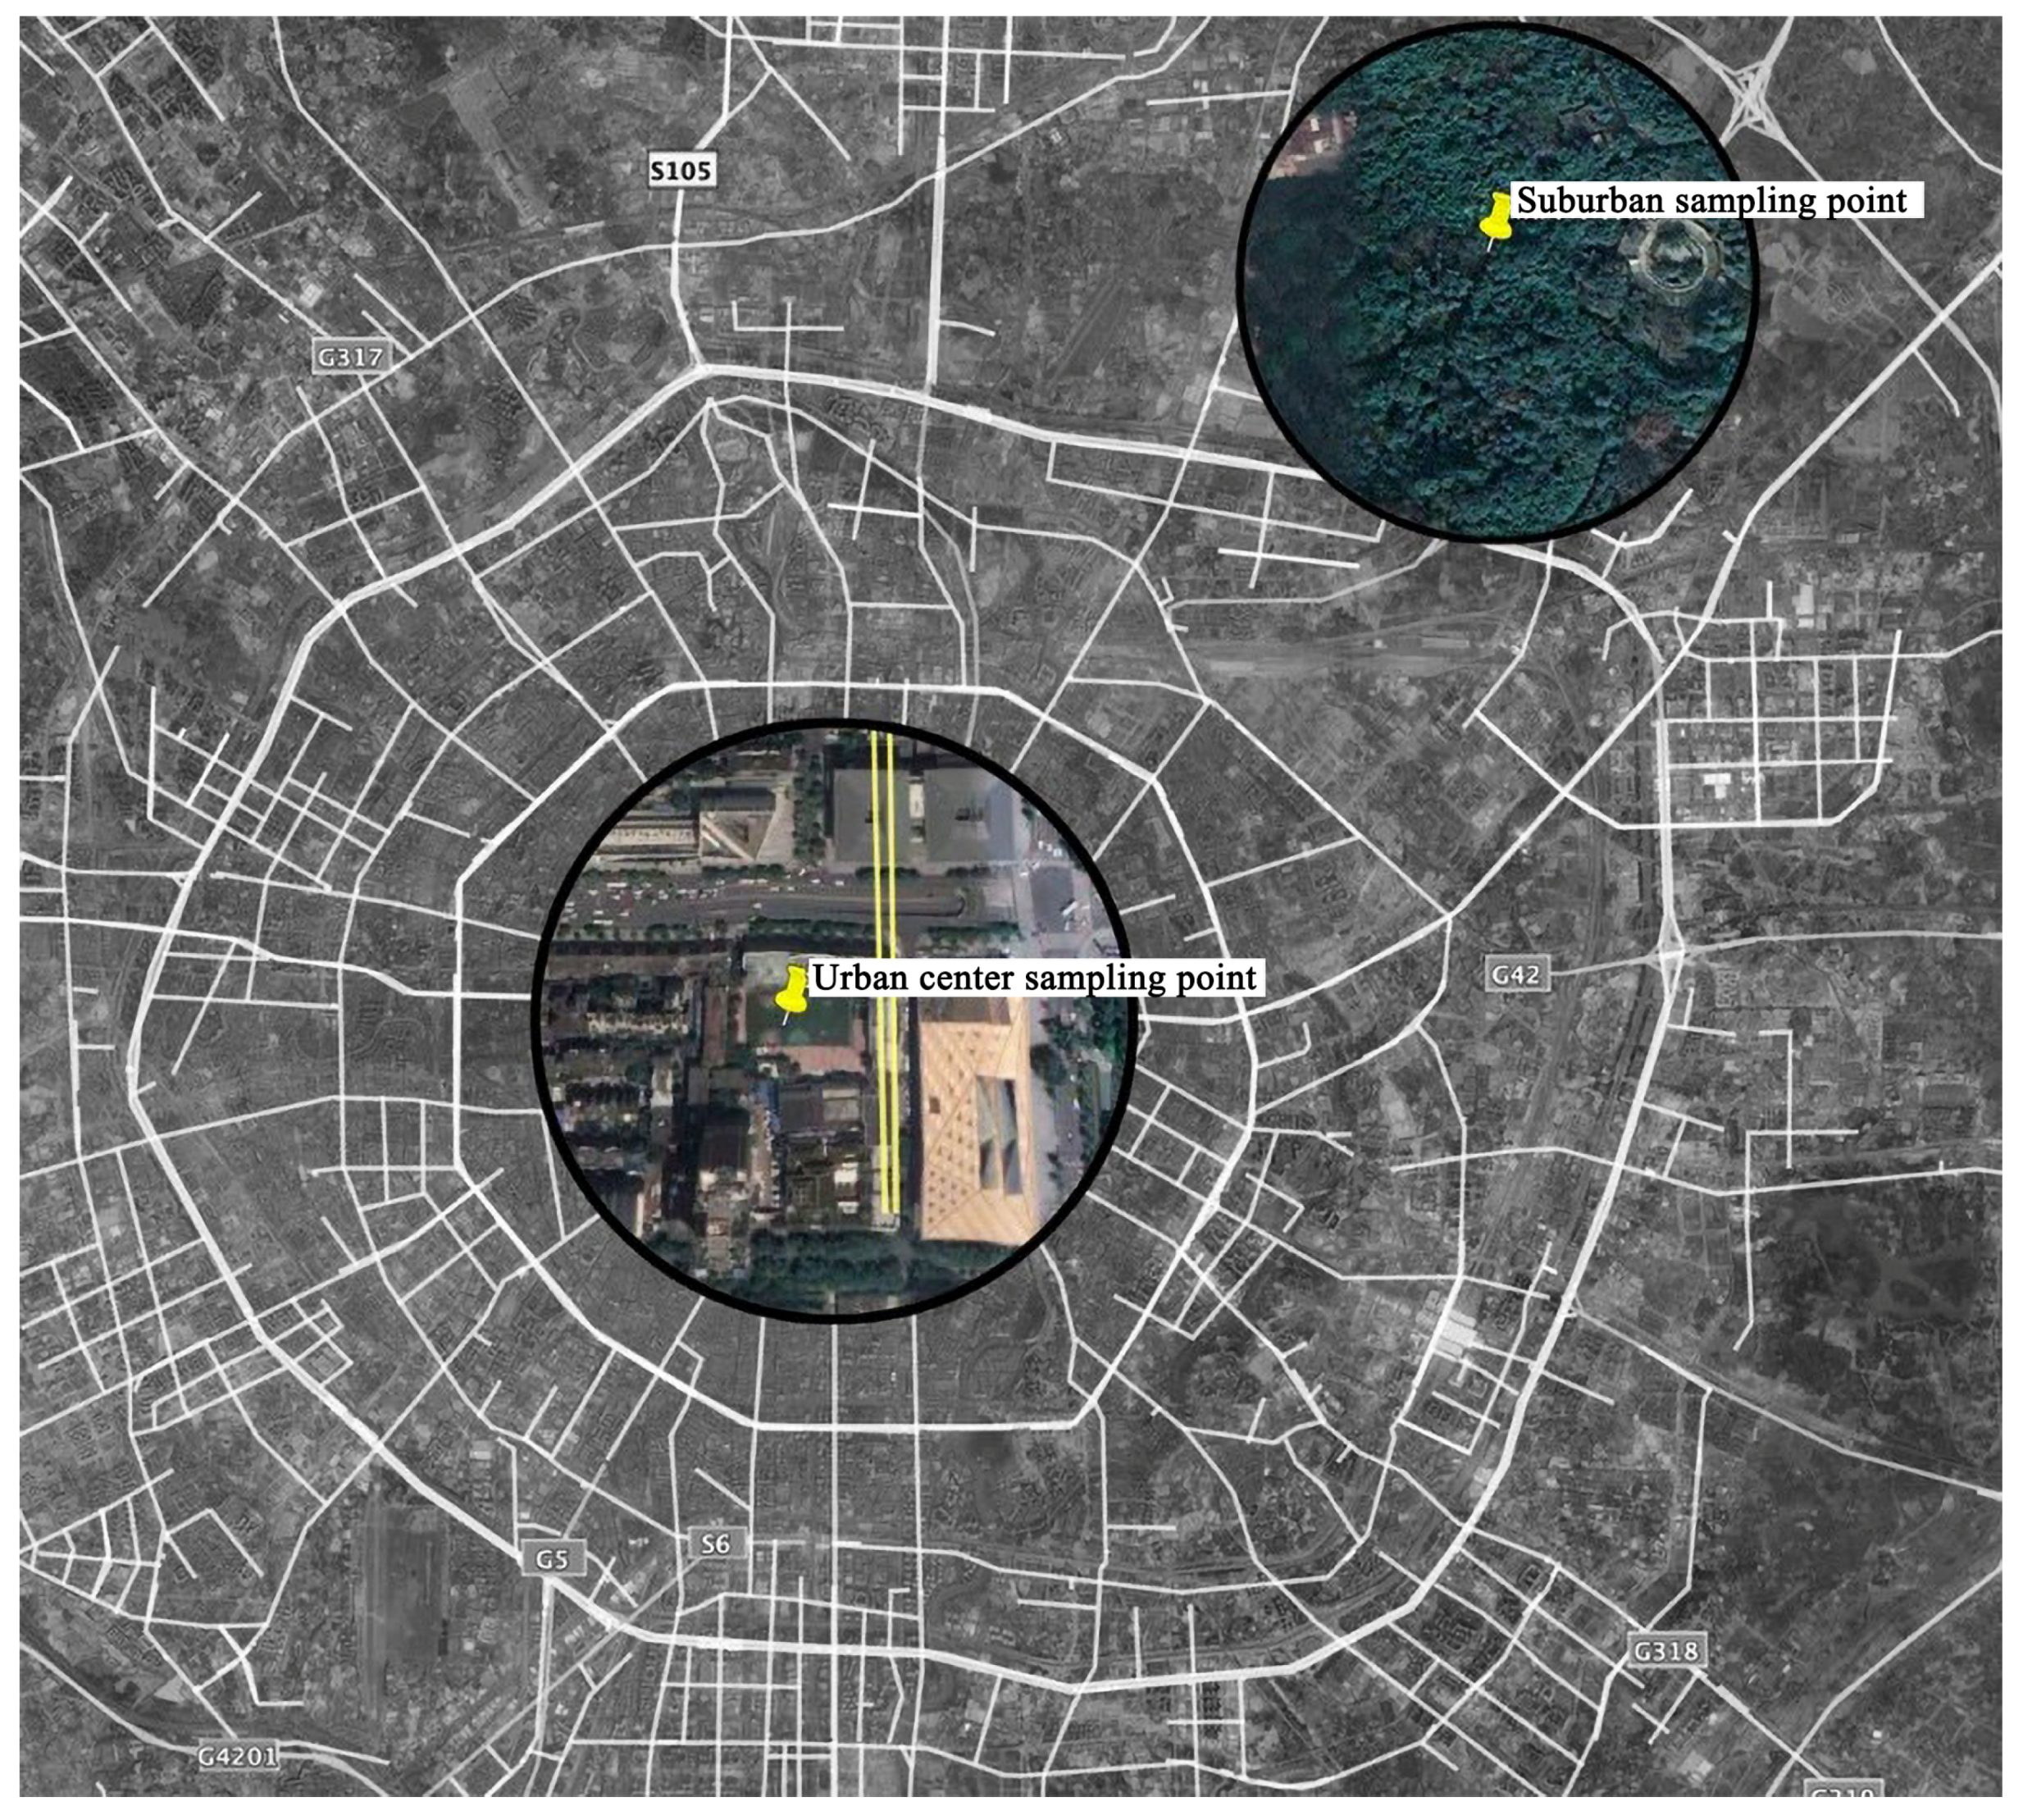
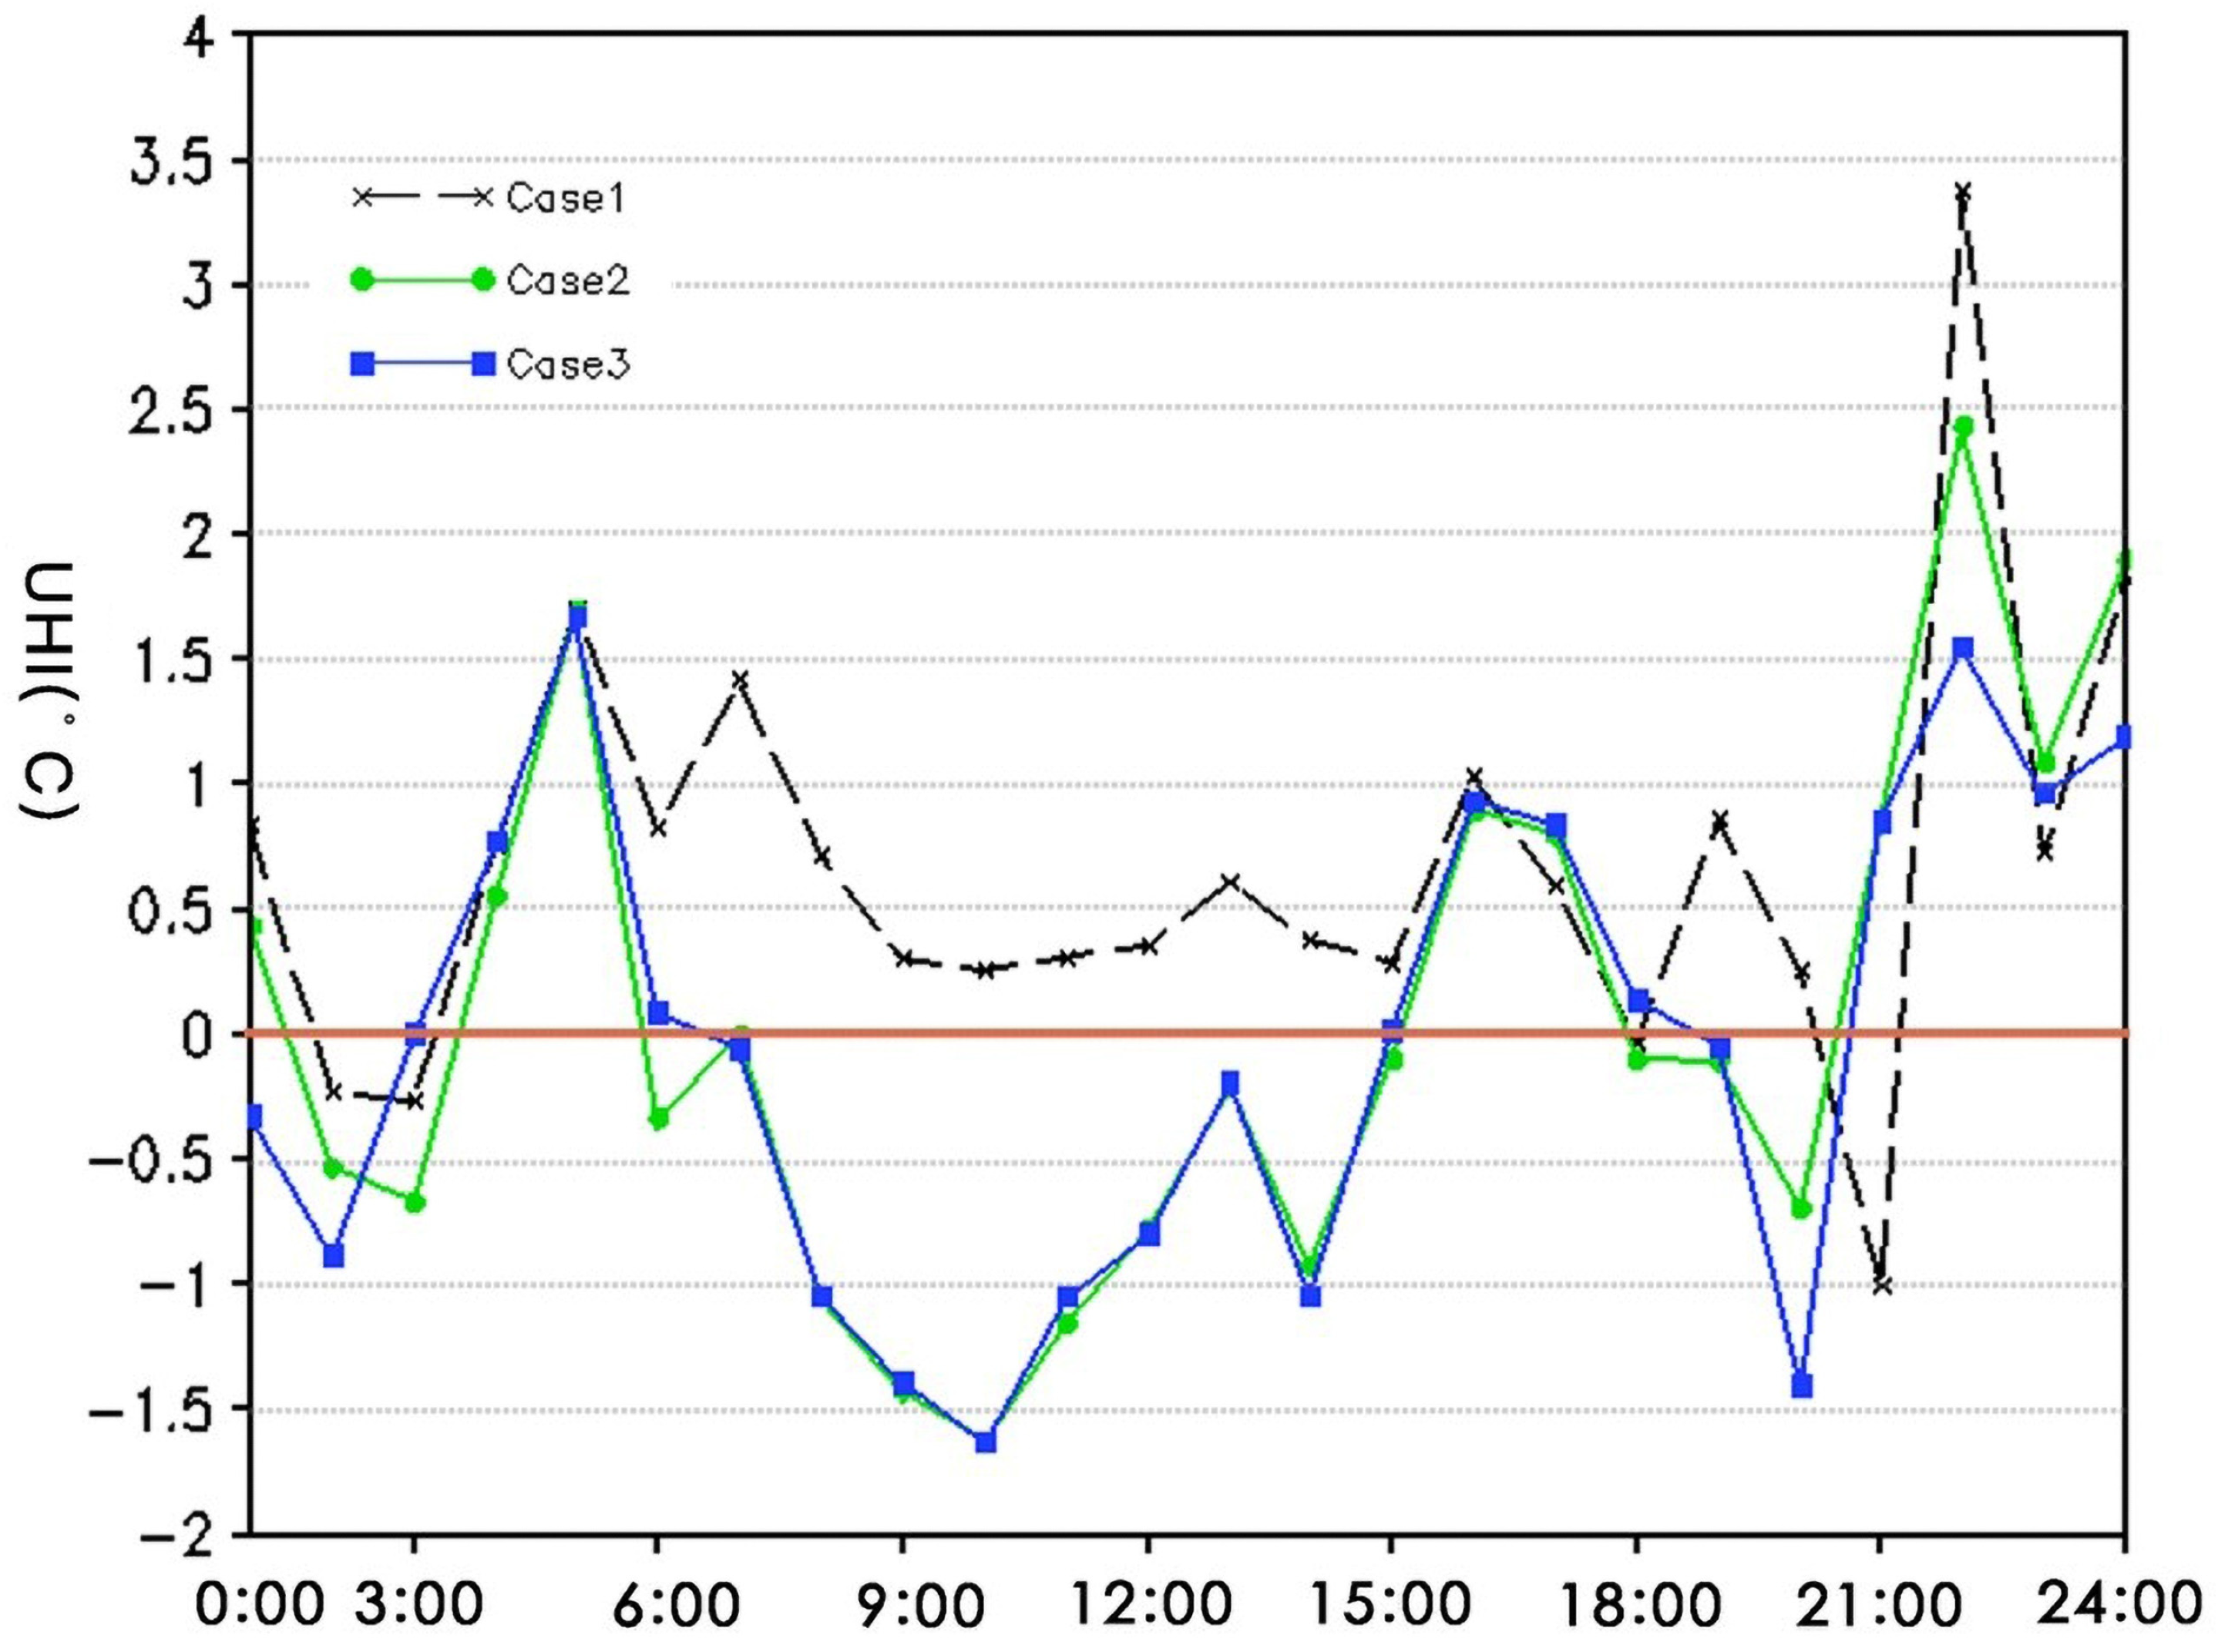
3.3. Comparison of All-Day Heat Island Intensity Between Urban Center Sampling Points and Suburban Sampling Points in Each Case

This study selected the 24 h temperature difference between the urban center sampling point (30.66° N, 104.06° E) and the suburban sampling point (30.74° N, 104.14° E) to specifically analyze the impact of sponge city planning on the urban heat island effect. As shown in Figure 6, the urban center sampling point was located in Tianfu Square, which is in the first ring of Chengdu. This area has a high coverage of artificial surfaces due to its central location. The suburban sampling point was located in Wangjiayan, in the fourth ring of Chengdu, surrounded by rural land with high natural surface coverage. The heat island intensity was defined as the difference between the air temperature at the urban center sampling point, 2 m above the ground, and the air temperature at the suburban sampling point. The formula for heat island intensity is as follows:
U H I = T u r b a n T s u b u r b
Figure 7 displays a comparison map of the three cases of heat island intensity throughout the day. In each case, the urban heat island intensity of the two sampling points peaked at midnight and began to weaken in the early morning. The sponge city planning cases significantly mitigated the urban heat island effect. Notably, case 3, which had the highest greening rate, the highest green roof rate, and the highest water content in the urban underlying surface, showed the most pronounced inhibitory effect on the urban heat island effect. The peak temperature differences in heat island intensity for case 1, case 2, and case 3 were 3.4 °C, 2.4 °C, and 1.5 °C, respectively. Compared with case 1, the heat island intensities of case 2 and case 3 dropped by 1 °C and 1.9 °C, respectively. After 05:00, the heat island intensity of each case showed a downward trend.
Both case 2 and case 3 exhibited a negative temperature difference, with the urban center being cooler than the suburbs, leading to an urban cold island effect. This phenomenon occurred because the buildings in the city center were taller and more densely packed compared to those in the suburbs. After sunrise, the solar radiation angle was small, causing the temperature to rise more slowly in the city center due to the obstruction of solar radiation by buildings and other artificial surfaces. In contrast, the urban suburbs, with more natural surfaces, warmed up faster due to less shelter.

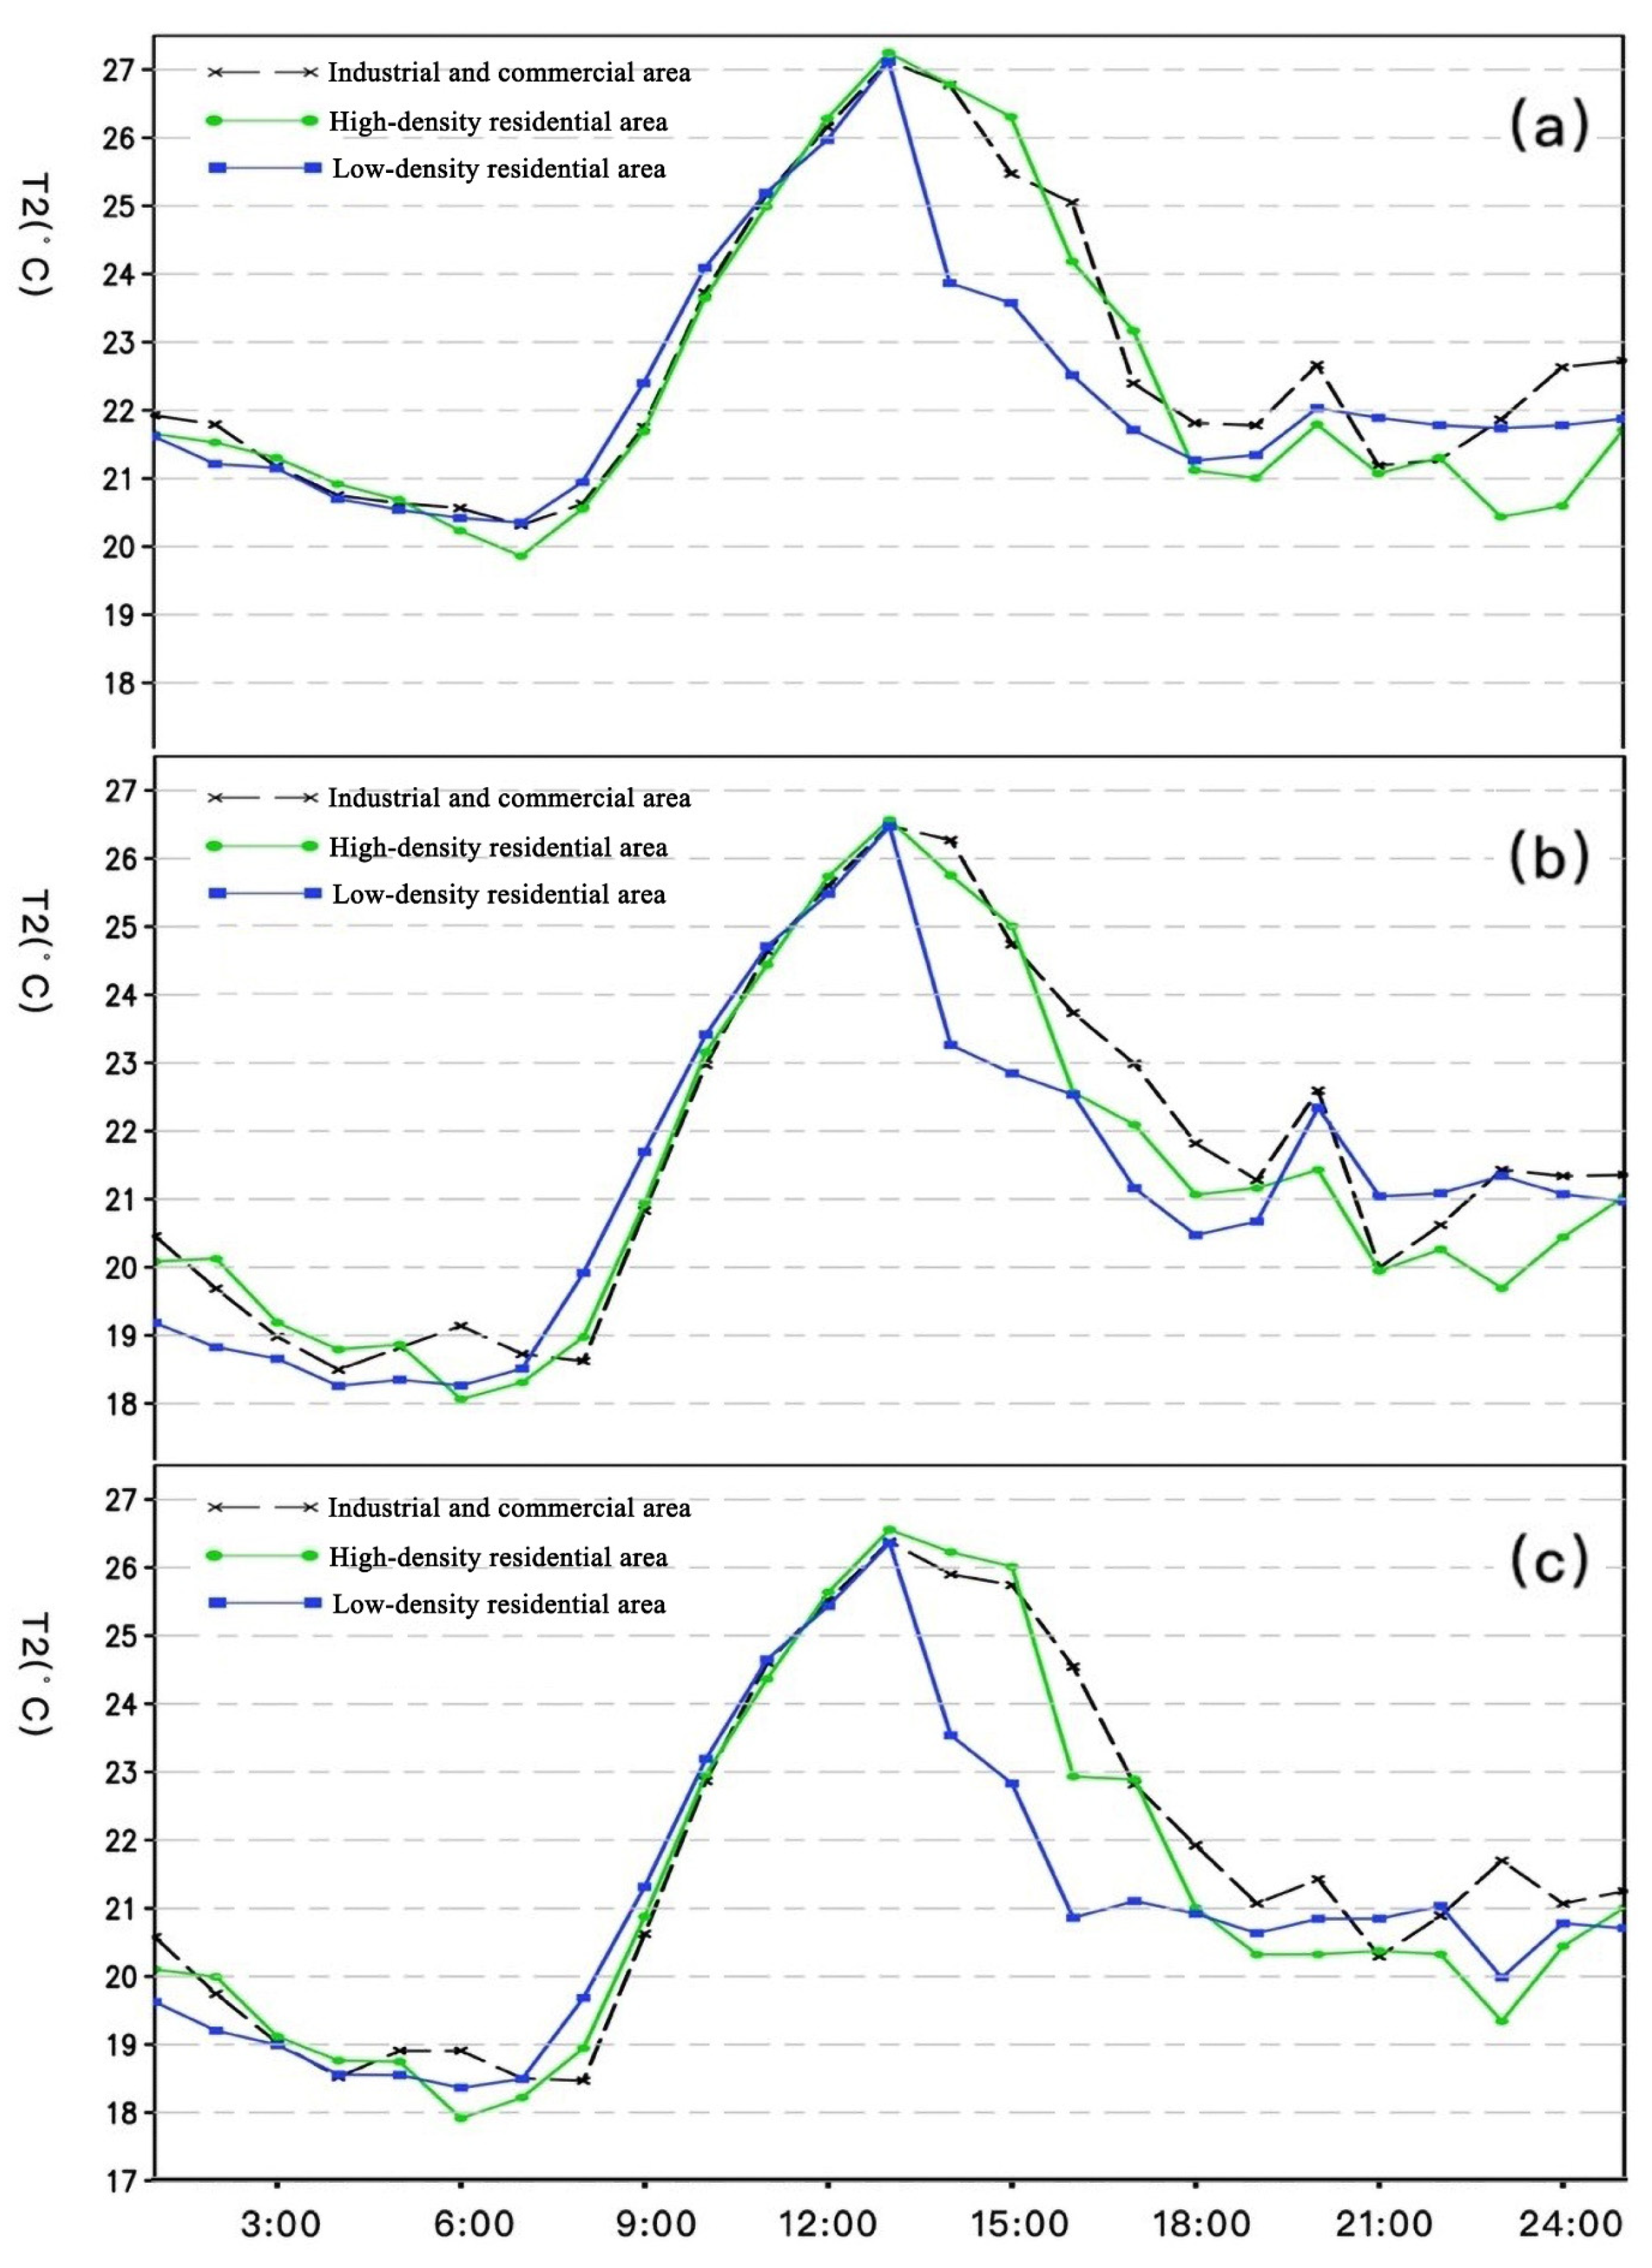
3.4. Comparison of 24 h Temperature in Different Management and Control Zones in Each Case

To further analyze the impacts of different management and control zones on the urban heat island effect, this study compared the average temperatures of these zones across each case. Figure 8 shows a comparison of T2 for the different management and control zones of each case. Due to the different sponge city planning targets in those zones, the greening rate, permeable pavement rate, and green roof rate of the different management and control zones that achieved the sponge city construction targets were different, and their comprehensive runoff coefficients varied. Among them, the runoff coefficient of the low-density residential areas was the lowest, while that of the industrial and commercial areas was the highest. Consequently, the inhibitory effects of the different management and control zones on the heat island effect were significantly different, with the cooling degree and rate following this order: low-density residential areas > high-density residential areas > industrial and commercial areas. The primary reason for this was that the third type of management and control zone, corresponding to low-density residential areas, had the smallest comprehensive runoff coefficient and building density. When the green roof rate was the same, the low-density residential area, with the highest greening rate and permeable pavement rate, exhibited the highest cooling rate and the most pronounced heat island mitigation effect.

4. Discussion

4.1. Impact Mechanism

4.1.1. Vertical Direction: Affecting Urban Energy Distribution Process

Figure 9 shows the daily variations in net radiation (Rn), latent heat flux (LE), sensible heat flux (H), and surface heat flux (G0) in the vertical surface energy balance of all urban underlying surface grid points in each case during the study period. The simulation results indicate that sponge city planning influenced the city’s energy distribution process, shifting the energy distribution from predominantly sensible heat to a combination of sensible and latent heat. Figure 9d shows that sponge city construction, by increasing permeable pavement and additional green spaces, led to minor changes in surface heat flux (G0). However, compared to the changes in latent heat flux (LE) and sensible heat flux (H), the impact of sponge city planning and construction on Rn and G0 was relatively small. Figure 9b demonstrates that sponge city construction could significantly increase LE, with an increase of approximately 60 W/m2 (90 W/m2) at peak times in case 2 (case 3). In Figure 9c, it is evident that sponge city construction had a notable impact on H, indicating that these planning and construction methods reduced H. Among the cases, case 3, which had the highest moisture content in the underlying surface, experienced the largest decrease in H, reaching up to 30 W/m2.
The impact of H on the climate is mainly manifested by the heating of the air above the surface through turbulent transfer. The simulation results showed a significant reduction in H in the sponge city case, indicating that the intensity of turbulent heat transfer also decreased, leading to a reduction in air temperature. Furthermore, according to the results of Sun (Sun T 2013) [23], sensible heat turbulent transfer and convective mechanical shear jointly affect the wind speed above the surface, and reducing the sensible heat turbulent transfer will reduce the wind speed above the surface. Sun’s study showed that sponge city planning reduces the wind speed in the morning and at night (similar to Figure 4c). The impact of LE on the climate is reflected in the turbulent transfer of moisture. Sun’s study also indicated a significant improvement in LE due to sponge city planning. Sponge city planning and construction can reduce the heating effect on the air by increasing the moisture content of the urban surface, enhancing vegetation coverage, and allocating more energy to evapotranspiration. Additionally, Bateni’s research suggests that when the air temperature is high, the distribution efficiency of LE is higher than that of H (Bateni S M 2012) [34]. Therefore, sponge city planning and construction can increase the moisture content of the underlying surface by raising the green roof rate, permeable pavement rate, and green space rate. In summer, under higher temperatures, this promotes surface evapotranspiration, effectively reducing heat transfer from the surface to the air, thereby mitigating the urban heat island effect.

4.1.2. Horizontal Direction: Changing Regional Horizontal Advection Patterns

At 24:00, the overall temperature in the simulation area was relatively high, and the heat island effect was pronounced. The predominant wind direction of the wind field was southerly, and the wind speed gradually increased from east to west. Compared to the current situation, the wind direction in the sponge city planning case shifted towards the west. The higher wind speeds observed in the western part of the simulation area were primarily due to the heat from the city being dispersed westward along with the air currents. This caused an increase in the kinetic energy of the air in the west, thereby enhancing the wind speed.
Figure 10 reflects the values of T2 and UV10 on the ground in the three cases at 24:00. The comparison showed that the sponge city planning case not only effectively reduced the temperature in the city center but also changed the regional horizontal advection pattern. The urban heat island effect in the city center area was significantly mitigated in case 2 and case 3, which, in turn, reduced the kinetic energy of the air and decreased the wind speed in the city center. This inhibited regional horizontal advection caused by bringing high temperatures in the suburbs to the city center, further alleviating the urban heat island effect. This suggests that modifying the pattern of regional horizontal advection can help reduce the negative impact of urban–rural circulation on the urban heat island effect at night.

4.2. Sponge City Planning Method Based on the Heat Island Mitigation Target

The WRF-UCM model simulation in this work confirmed that different planning schemes to achieve the same sponge city planning target had different effects on the urban microclimate and heat island effect. Therefore, this study proposed a sponge city planning method with heat island mitigation objectives (Figure 11). Based on the current distribution of urban heat islands, this study formulated a sponge city planning strategy that also targets heat island mitigation. It introduced several different sponge city planning indicators and utilized the coupled WRF-UCM model to numerically simulate and analyze differences in heat island distribution across various planning schemes, thereby optimizing the planning indicators. This approach assisted in making the final decision on the sponge city planning scheme. Compared to traditional sponge city planning, which primarily focuses on the control target of total annual runoff, this method also considers the multifunctional effects of the sponge city from the perspective of heat island mitigation. This holistic approach helps to maximize the multifunctional benefits of sponge city initiatives.

4.3. Limitations of Simulation

This research explored a quantitative analysis method for applying WRF-UCM to the heat island mitigation effect in sponge cities. However, to date, the field of numerical computer simulations for predicting the urban climate environment is still in the developmental stage. Therefore, some oversights and deficiencies are inevitable in the simulation process of this study, which need to be improved and perfected by further research work in the future. (1) Limited scope of weather conditions: This study exclusively examined the impact of sponge city construction on heat island mitigation during heat-wave conditions, representing a limited scope of analysis. However, established studies have shown that in the complex context of land–atmosphere–human coupling, in addition to human activities and land use and land cover (LULC), geophysical environmental elements such as air circulation, meteorological patterns, and precipitation play an important role in the formation and development of CUHII (Yang Y J et al., 2022; Chen S H et al., 2022; Yang Y J et al., 2023) [35,36,37]. The influence of geophysical environmental factors on the heat island mitigation effect of sponge cities should be further explored in future studies. It should be ensured that the effectiveness of sponge city planning is more robustly evaluated through a broader range of weather patterns. (2) Oversimplification of urban morphology: Most of the current urban canopy models are built under vertical one-dimensional conditions, which only have the ability to interact with the upper atmosphere but lack the consideration of horizontal advection, interactions between urban units, and urban ventilation. Since the urban underlying surface has spatial three-dimensional properties, the simulation of urban water and heat fluxes is incomplete when considering only vertical one-dimensional scales. The UCM model, while improved, might still oversimplify the complex three-dimensional structure of urban areas. The model’s single-layer approach may not accurately capture the heterogeneity of surface materials and the intricate interactions between buildings, vegetation, and open spaces, which are crucial factors influencing UHI (Yang Y J et al., 2023) [37]. Therefore, in the future, on the basis of maintaining the advantages of UCM’s clear physical concepts and convenient and fast computation, it is necessary to further expand its simulation capability in the horizontal direction (Zheng Z F et al., 2022) [38] so as to make it have the ability to simulate the water–heat fluxes in the urban subsurface in a more comprehensive way. (3) Limited spatial resolution: The WRF-UCM model constructed in this research showed a good level in the validation of the simulation results. However, the subjectivity of the actual survey data, the appropriateness of the selection of local empirical parameters, and the limitations of the current technological conditions affected the accuracy of the model simulation to a certain extent. For example, while this study used a 500 m resolution in the nested domain, finer-resolution data might be necessary to capture more detailed spatial variations in temperature within the urban area and improve the accuracy of UHI assessment. Microclimatic conditions can vary significantly over short distances. With continuous data observation and improvements in simulation technology in the future, more accurate and scientific model boundary condition setting and model parameter setting should be further explored in future studies, including the influence of model nesting domain selection (Rachel Honnert et al., 2020) [39], the accuracy of anthropogenic heat emission parameter setting (Xue J S et al., 2023) [32], and the modelling expression of ecological effects of urban green infrastructure (including trees) (Wang C H et al., 2018) [40], in order to enhance the simulation accuracy of the model. (4) Limitations of research variables: Owing to the necessity to calculate the sponge city’s annual runoff control rate (see Equation (1)), this study selected the green roof rate, greening rate, and permeable pavement rate as the primary research variables. These variables were then investigated in order to ascertain their impact on the urban microclimate and the heat island effect. This selection was grounded in the quantifiability of the variables and their direct impact on the urban ground surface structure, while also considering the economic costs of planning guidance and the feasibility of planning management operations. However, this study did not incorporate urban blue spaces such as rivers and wetlands, which also play a crucial role in sponge city construction, particularly in regulating urban hydrological cycles and improving the urban ecological environment. Future research will explore methods to integrate these blue spaces into the sponge city planning evaluation system, thereby providing a more comprehensive assessment of the impact of sponge city construction on the urban microclimate and ecological environment.

5. Conclusions

This study’s results are as follows: (1) By altering the structure of the urban underlying surface through measures such as increasing the greening rate, green roof rate, and permeable pavement rate, sponge city planning and construction can effectively reduce the air temperature at 2 m above the ground (T2), increase the specific humidity at 2 m above the ground (Q2), and change the wind speed at 10 m above the ground (UV10). This helps in effectively mitigating the urban heat island effect. (2) Sponge city planning can modify the urban energy distribution and regional convection patterns. In the vertical direction, it reduces the sensible heat flux (H), which weakens the degree of air heating and the wind speed caused by turbulent heat transfer. In the horizontal direction, the decrease in urban area temperature can alter the convection of the entire area. The combined effects of these changes can reduce the heating of the urban area and prevent regional convection during high-temperature periods by moving heat from surrounding areas into the city, thereby comprehensively inhibiting the urban heat island effect. (3) Different sponge city planning and design schemes contain different regional divisions and different management and control indicators. Although these schemes can all achieve the objectives of sponge city construction, they differ in their impacts on urban microclimate elements and the urban heat island effect. Generally, the higher the moisture content of the urban underlying surface, the more significant the reduction in the heat island effect. Moreover, due to varying construction targets, different management and control zones exhibit different mitigation effects on the heat island effect. In this study, low-density residential areas showed the most pronounced inhibitory effect on the heat island effect, primarily due to their higher rates of greening and permeable paving. (4) A sponge city planning method with the consideration of heat island mitigation goal was proposed. This study confirmed that the WRF-UCM model can serve as a quantitative tool for analyzing the heat island effect in sponge city planning. This method can be used to conduct pre-quantitative simulations of sponge city planning schemes to support construction decision-making.

Author Contributions

Q.Y.: Conceptualization, methodology, software, supervision, writing—review and editing. Z.L.: Software, validation, visualization, writing—original draft, writing—review and editing. Q.L.: Data curation, investigation, visualization, writing—review and editing. All authors have read and agreed to the published version of the manuscript.

Funding

This research was supported by the National Natural Science Foundation of China (grant no. 51408499); Sichuan Science and Technology Programme Projects (Key R&D Projects) (grant no. 2024YFFK0441).

Data Availability Statement

The data presented in this study are available on request from the corresponding author, the data are not publicly available due to privacy.

Conflicts of Interest

The authors declare no conflict of interest.

References

  1. Rizwan, A.M.; Dennis YC, L.; Chunho, L. A review on the generation, determination and mitigation of urban heat island. J. Environ. Sci. 2008, 20, 120–128. [Google Scholar] [CrossRef] [PubMed]
  2. OKET, R. The heat island of the urban boundary layer: Characteristics, causes and effects. Wind Clim. Cities 1995, 277, 81–107. [Google Scholar]
  3. OKET, R.; Cleugh, H.A. Urban heat storage derived as energy balance residuals. Bound.-Layer Meteorol. 1987, 39, 233–245. [Google Scholar] [CrossRef]
  4. Taha, H.; Sailor, D.J.; Akbari, H. High-Albedo Materials for Reducing Building Cooling Energy Use; Lawrence Berkeley National Laboratory Report; U.S. Department of Energy: Washington, DC, USA, 1992. [Google Scholar]
  5. Buchholz, N. Low-Impact Development and Green Infrastructure Implementation: Creating a Replicable GIS Suitability Model for Stormwater Management and the Urban Heat Island Effect in Dallas, Texas. Master’s Thesis, Columbia University, New York, NY, USA, 2013. [Google Scholar] [CrossRef]
  6. Onmura, S.; Matsumoto, M.; Hokoi, S. Study on evaporative cooling effect of roof lawn gardens. Energy Build. 2001, 33, 653–666. [Google Scholar] [CrossRef]
  7. Qin, X.; Wu, X.; Chiew, Y.M.; Li, Y. A Green Roof Test Bed for Stormwater Management And Reduction Of Urban Heat Island Effect in Singapore. Int. J. Environ. Clim. Change 2012, 2, 410–420. [Google Scholar] [CrossRef]
  8. Zhou, Z.; Hao, T.; Tang, W.; Wang, P.; Liu, X.; Xu, Y. The different urban green-land spatial patterns and their environmental effects: A case of the central district of Yichang city, Hubei Province. Acta Ecol. Sin. 2004, 24, 186–192. [Google Scholar]
  9. Shou, Y.; Zhang, D. Recent advances in understanding urban heat island effects with some future prospects. Acta Meteorol. Sin. 2012, 70, 338–353. [Google Scholar]
  10. Hand, L.M.; Shepherd, J.M. An Investigation of Warm-Season Spatial Rainfall Variability in Oklahoma City: Possible Linkages to Urbanization and Prevailing Wind. J. Appl. Meteorol. Climatol. 2009, 48, 251–269. [Google Scholar] [CrossRef]
  11. Streutker, D.R. A remote sensing study of the urban heat island of Houston, Texas. Int. J. Remote Sens. 2002, 23, 2595–2608. [Google Scholar] [CrossRef]
  12. Xue, Y.; Cai, G.; Guan, Y.N.; Cracknell, A.P.; Tang, J. Iterative self-consistent approach for Earth surface temperature determination. Int. J. Remote Sens. 2005, 26, 185–192. [Google Scholar] [CrossRef]
  13. Yang, M.; Yang, G.; Wang, Y.; Zhang, Y.; Zhang, Z.; Sun, C. Remote sensing analysis of temporal—Spatial variations of urban heat island effect over Beijing. Remote Sens. Land Resour. 2018, 30, 213–223. [Google Scholar]
  14. Kustas, W.P.; Norman, J.M.; Anderson, M.C.; French, A.N. Estimating subpixel surface temperatures and energy fluxes from the vegetation index–radiometric temperature relationship. Remote Sens. Environ. 2003, 85, 429–440. [Google Scholar] [CrossRef]
  15. Trusilova, K.; Jung, M.; Churkina, G.; Karstens, U.; Heimann, M.; Claussen, M. Urbanization Impacts on the Climate in Europe: Numerical Experiments by the PSU–NCAR Mesoscale Model (MM5). J. Appl. Meteorol. Climatol. 2008, 47, 1442–1455. [Google Scholar] [CrossRef]
  16. Li, X.L.; He, J.H.; Bi, B.G. The desin of urban canopy parameteriaztion of MM5 and its’ numerical simulations. J. Meteorol. 2003, 61, 526–539. [Google Scholar]
  17. Kusaka, H.; Kimura, F. Thermal effects of urban canyonstructure on the nocturnal heat island:Numerical experimentusing a mesoscale model coupled with an urban canopy model. J. Appl. Meteorol. 2004, 43, 1899–1910. [Google Scholar] [CrossRef]
  18. Kusaka, H.; Chen, F.; Tewari, M.; Dudhia, J.; Gill, D.O.; Duda, M.G.; Wang, W.; Miya, Y. Numerical Simulation of Urban Heat Island Effect by the WRF Model with 4-km GridIncrement: An Inter-Comparison Study between the Urban Canopy Model and Slab Model (Special Issue on DownscalingStudies for the Impact Assessments of Climate Change). J. Meteorol. Soc. Jpn. 2012, 90, 33–45. [Google Scholar] [CrossRef]
  19. Chen, F.; Yang, X.; Zhu, W. WRF simulations of urban heat island under hot-weather synoptic conditions: The case study of Hangzhou City, China. Atmos. Res. 2014, 138, 364–377. [Google Scholar] [CrossRef]
  20. Lin, C.; Chen, F.; Huang, J.C.; Chen, W.C.; Liou, Y.A.; Chen, W.N.; Liu, S.C. Urban heat island effect and its impact on boundary layer development and land–sea circulation over northern Taiwan. Atmos. Environ. 2008, 42, 5635–5649. [Google Scholar] [CrossRef]
  21. Meng, W.; Zhang, Y.; Li, J.; Lin, W.; Dai, G.; Li, H. Application of WRF/UCM in the simulation of a heat wave event and urban heat island around Guangzhou. J. Trop. Meteorol. 2011, 17, 257–267. [Google Scholar] [CrossRef]
  22. Cheng, Z.; Sun, C.; Mao, X.; Yang, X. Numerical simulation of the influence of urbanization on summer climate change in Chengdu. J. Chengdu Univ. Inf. Technol. 2016, 31, 386–393. [Google Scholar] [CrossRef]
  23. Sun, T. On the Sensible and Latent Heat Fluxes from Complex Urban Surfaces. Ph.D. Thesis, Tsinghua University, Beijing, China, 2013. [Google Scholar]
  24. Sun, Y. Research on the Impace of Urban Expansion on Urban Climate-Taking Wuhan as an Example. Master’s Thesis, Hubei University of Technology, Wuhan, China, 2016. [Google Scholar]
  25. Huang, C.; Li, D.; Chen, Q.; Wang, X. The effect and mechanism of sponge city construction on heat island mitigation: A case study of Jiaxing. Chin. J. Ecol. 2020, 39, 625–634. [Google Scholar] [CrossRef]
  26. Liu, Z.; Li, J.; Jiang, D. Evaluation method construction and application of sponge city heat island effect based on URI index. J. Water Resour. Water Eng. 2018, 29, 53–58. [Google Scholar]
  27. Song, W.; Chen, J.; Liu, X.; Guo, J.; Pu, J. Impact of Sponge city construction on heat island effect of Suining City. Plateau Mt. Meteorol. Res. 2018, 38, 70–76. [Google Scholar]
  28. Zhu, L.; You, Y.; Cheng, P.; Liu, Y. Study on the effect of sponge construction mode on thealleviation of urban heat island. Water Supply Drain. 2018, 54, 65–69. [Google Scholar] [CrossRef]
  29. Li, D.; Bou-Zeid, E.; Baeck, M.L.; Jessup, S.; Smith, J.A. Modeling Land Surface Processes and Heavy Rainfall in Urban Environments: Sensitivity to Urban Surface Representations. J. Hydrometeorol. 2013, 14, 1098–1118. [Google Scholar] [CrossRef]
  30. Hou, A.; Ni, G.; Cong, Z.; Lei, Z. Impacts of coupling urban canopy model on storm simulation. J. Hydroelectr. Eng. 2013, 32, 31–35,42. [Google Scholar]
  31. Xiao, D.; Chen, J.; Chen, Z.; Zhang, B. Effect Simulation of Chengdu Fine Underlying Surface Information on Urban Meteorology. Meteorol. Mon. 2011, 37, 298–308. [Google Scholar]
  32. Xue, J.S.; Zong, L.; Yang, Y.J.; Bi, X.Y.; Zhang, Y.H.; Zhao, M.H. Diurnal and interannual variations of canopy urban heat island (CUHI) effects over a mountain–valley city with a semi-arid climate. Urban Clim. 2023, 48, 101425. [Google Scholar] [CrossRef]
  33. Li, K.; Yu, Z. Relationship between city layout and heat environment based on remote sensing technology: A case study of Wuhan city. City Plan. Rev. 2008, 32, 75–82. [Google Scholar]
  34. Bateni, S.M.; Entekhabi, D. Relative efficiency of land surface energy balance components. Water Resour. Res. 2012, 48, 11357. [Google Scholar] [CrossRef]
  35. Yang, Y.J.; Guo, M.; Ren, G.Y.; Liu, S.H.; Zong, L.; Zhang, Y.H.; Zheng, Z.F.; Miao, Y.C.; Zhang, Y. Modulation of Wintertime Canopy Urban Heat Island (CUHI) Intensity in Beijing by Synoptic Weather Pattern in Planetary Boundary Layer. J. Geophys. Res. Atmos. 2022, 127, 35988. [Google Scholar] [CrossRef]
  36. Chen, S.H.; Yang, Y.J.; Deng, F.; Zhang, Y.H.; Liu, D.Y.; Liu, C.; Gao, Z.Q. A high-resolution monitoring approach of canopy urban heat island using a random forest model and multi-platform observations. Atmos. Meas. Tech. 2022, 15, 735–756. [Google Scholar] [CrossRef]
  37. Yang, Y.J.; Guo, M.; Wang, L.L.; Zong, L.; Liu, D.Y.; Zhang, W.J.; Wang, M.Y.; Wan, B.C.; Guo, Y.D. Unevenly spatiotemporal distribution of urban excess warming in coastal Shanghai megacity, China: Roles of geophysical environment, ventilation and sea breezes. Build. Environ. 2023, 235, 110180. [Google Scholar] [CrossRef]
  38. Zheng, Z.F.; Ren, G.Y.; Gao, H.; Yang, Y.J. Urban ventilation planning and its associated benefits based on numerical experiments: A case study in Beijing, China. Build. Environ. 2022, 222, 109383. [Google Scholar] [CrossRef]
  39. Honnert, R.; Efstathiou, G.A.; Beare, R.J.; Ito, J.; Lock, A.; Neggers, R.; Plant, R.S.; Shin, H.H.; Tomassini, L.; Zhou, B. The Atmospheric Boundary Layer and the “Gray Zone” of Turbulence: A Critical Review. J. Geophys. Res. Atmos. 2020, 125, 30317. [Google Scholar] [CrossRef]
  40. Wang, C.H.; Wang, Z.H.; Yang, J.C. Cooling Effect of Urban Trees on the Built Environment of Contiguous United States. Earth’s Future 2018, 6, 1066–1081. [Google Scholar] [CrossRef]
Figure 1. Simulation nested domain setup and study area location map.
Land 14 00264 g001
Figure 2. Classification of urban underlying surface and building information in the study area based on sponge city control zoning.
Land 14 00264 g002
Figure 3. Comparison validation of air temperature 2 m above ground level between on-site measurements and WRF-UCM simulation results.
Land 14 00264 g003
Figure 4. Comparison of microclimate factors in each case: (a) air temperature at 2 m above the ground (T2); (b) air specific humidity at 2 m above the ground (Q2); (c) wind speed at 10 m above the ground (UV10).
Land 14 00264 g004
Figure 5. Comparison of air temperature 2 m above the ground for case 1, case 2, and case 3 at 08:00 and 17:00 local time on 5 July 2015. Case 1 was the base case, or the current situation of land use in Chengdu; case 2 was a sponge city planning and design scheme with a green roof rate of 0.6; case 3 was a sponge city planning and design scheme with a green roof ratio of 0.8.
Land 14 00264 g005
Figure 6. Location of urban center sampling points and suburban sampling points.
Land 14 00264 g006
Figure 7. Comparison of heat island intensity in each case.
Land 14 00264 g007
Figure 8. Comparison of air temperature 2 m above the ground (T2) in different management and control zones for (a) case 1; (b) case 2; and (c) case 3.
Land 14 00264 g008
Figure 9. Comparison of average energy elements of case 1, case 2, and case 3 in different regions on 5 July 2015: (a) net radiation (Rn); (b) latent heat flux (LE); (c) sensible heat flux (H); (d) surface heat flux (G0).
Land 14 00264 g009
Figure 10. Comparison of the air temperature 2 m above the ground and the wind direction 10 m above the ground for case 1, case 2, and case 3 at 24:00.
Land 14 00264 g010
Figure 11. Sponge city planning method based on the heat island mitigation target.
Land 14 00264 g011
Table 1. Nested domain settings of the study area.
Domain size (X [km] × Y [km] × Z [km]) Number of CellsGrid Cell Size (km)
Domain 1103.5 × 103.5 × 2769 × 69 × 401.5
Domain 224.5 × 24.5 × 2749 × 49 × 400.5
Table 2. Parameterization schemes and codes of different physical processes of WRF selected for simulation.
Physical ProcessParametric SchemeWRF Scheme Code
Atmospheric longwave radiationRRTM1
Shortwave radiationDudhia1
Planetary boundary layerEsta Similarity2
Near-surface layerMYJ2
General land surface processNoah2
Urban land processUCM1
Cloud microphysicsWSM33
Note: All acronyms for the parametric scheme come from the WRF model.
Table 3. Comparison of UCM urban underlying surface classification and sponge city control zoning classification.
The Imperviousness RateUCM Urban Underlying Surface ClassificationSponge City Control Zoning ClassificationThe Total Annual Runoff Control RateThe Comprehensive Runoff Coefficient
<50%Low-density residential areaClass III management and control zone75%≤0.45
50%~80%High-density residential areaClass II management and control zone70%≤0.5
>80%Industrial and commercial areaClass I management and control zone65%≤0.5
Table 4. UCM urban underlying surface base attribute parameters.
ParametersLow-Density Residential Area
(Class III Management and Control Zone)
High-Density Residential Area (Class II Management and Control Zone) Industrial and Commercial Area (Class I Management and Control Zone)
Average   building   height   z R (m) 32.122.927.9
Standard   deviation   of   the   building   height   σ Z R (m) 25.610.523.8
Roof   width   w R (m) 17.09.010.8
Street   width   w c (m) 14.019.015.9
Sky visibility factor (-) 0.620.560.48
Building drag coefficient (-) 0.10.10.1
Anthropogenic heat (Wm−2) 406080
Table 5. Attribute parameters of the three types of urban underlying surfaces in the WRF-UCM in the simulation setting.
City TypeLow-Density Residential Area
(Class III Management and Control Zone)
High-Density Residential Area (Class II Management and Control Zone) Industrial and Commercial Area (Class I Management and Control Zone)
Simulation CodeCase 1Case 2Case 3Case 1Case 2Case 3Case 1Case 2Case 3
Green roof rate00.60.800.60.800.60.8
Greening rate0.150.150.20.10.10.150.050.050.05
Permeable pavement rate00.60.500.50.300.550.4
Note: case 1 was the base case, or the current situation of land use in Chengdu; case 2 was a sponge city planning and design scheme with a green roof rate of 0.6; case 3 was a sponge city planning and design scheme with a green roof ratio of 0.8.
Table 6. Evaluation of comprehensive runoff coefficients of different city types in case 2 and case 3.
City TypeCase 2Case 3Comprehensive Runoff Coefficient Control Target
Low-density residential area (Class III management and control zone) 0.4380.404≤0.45
High-density residential area (Class II management and control zone) 0.4860.490≤0.50
Industrial and commercial area (Class I management and control zone) 0.4880.487≤0.50
Table 7. Model validation results.
Meteorological StationR2NSEPBIAS
Dujiangyan Weather Station
(103.62° E, 31.00° N)
0.9220.883−1.264
Jintang Weather Station
(104.42° E, 30.87° N)
0.8190.817−0.627
Xinjin Weather Station
(103.83° E, 30.42° N)
0.8590.8451.386
Disclaimer/Publisher’s Note: The statements, opinions and data contained in all publications are solely those of the individual author(s) and contributor(s) and not of MDPI and/or the editor(s). MDPI and/or the editor(s) disclaim responsibility for any injury to people or property resulting from any ideas, methods, instructions or products referred to in the content.

