
Forecasting of Wildfire Probability Occurrence: Case Study of a Mediterranean Island of Italy


Abstract
:1. Introduction
2. Materials and Methods
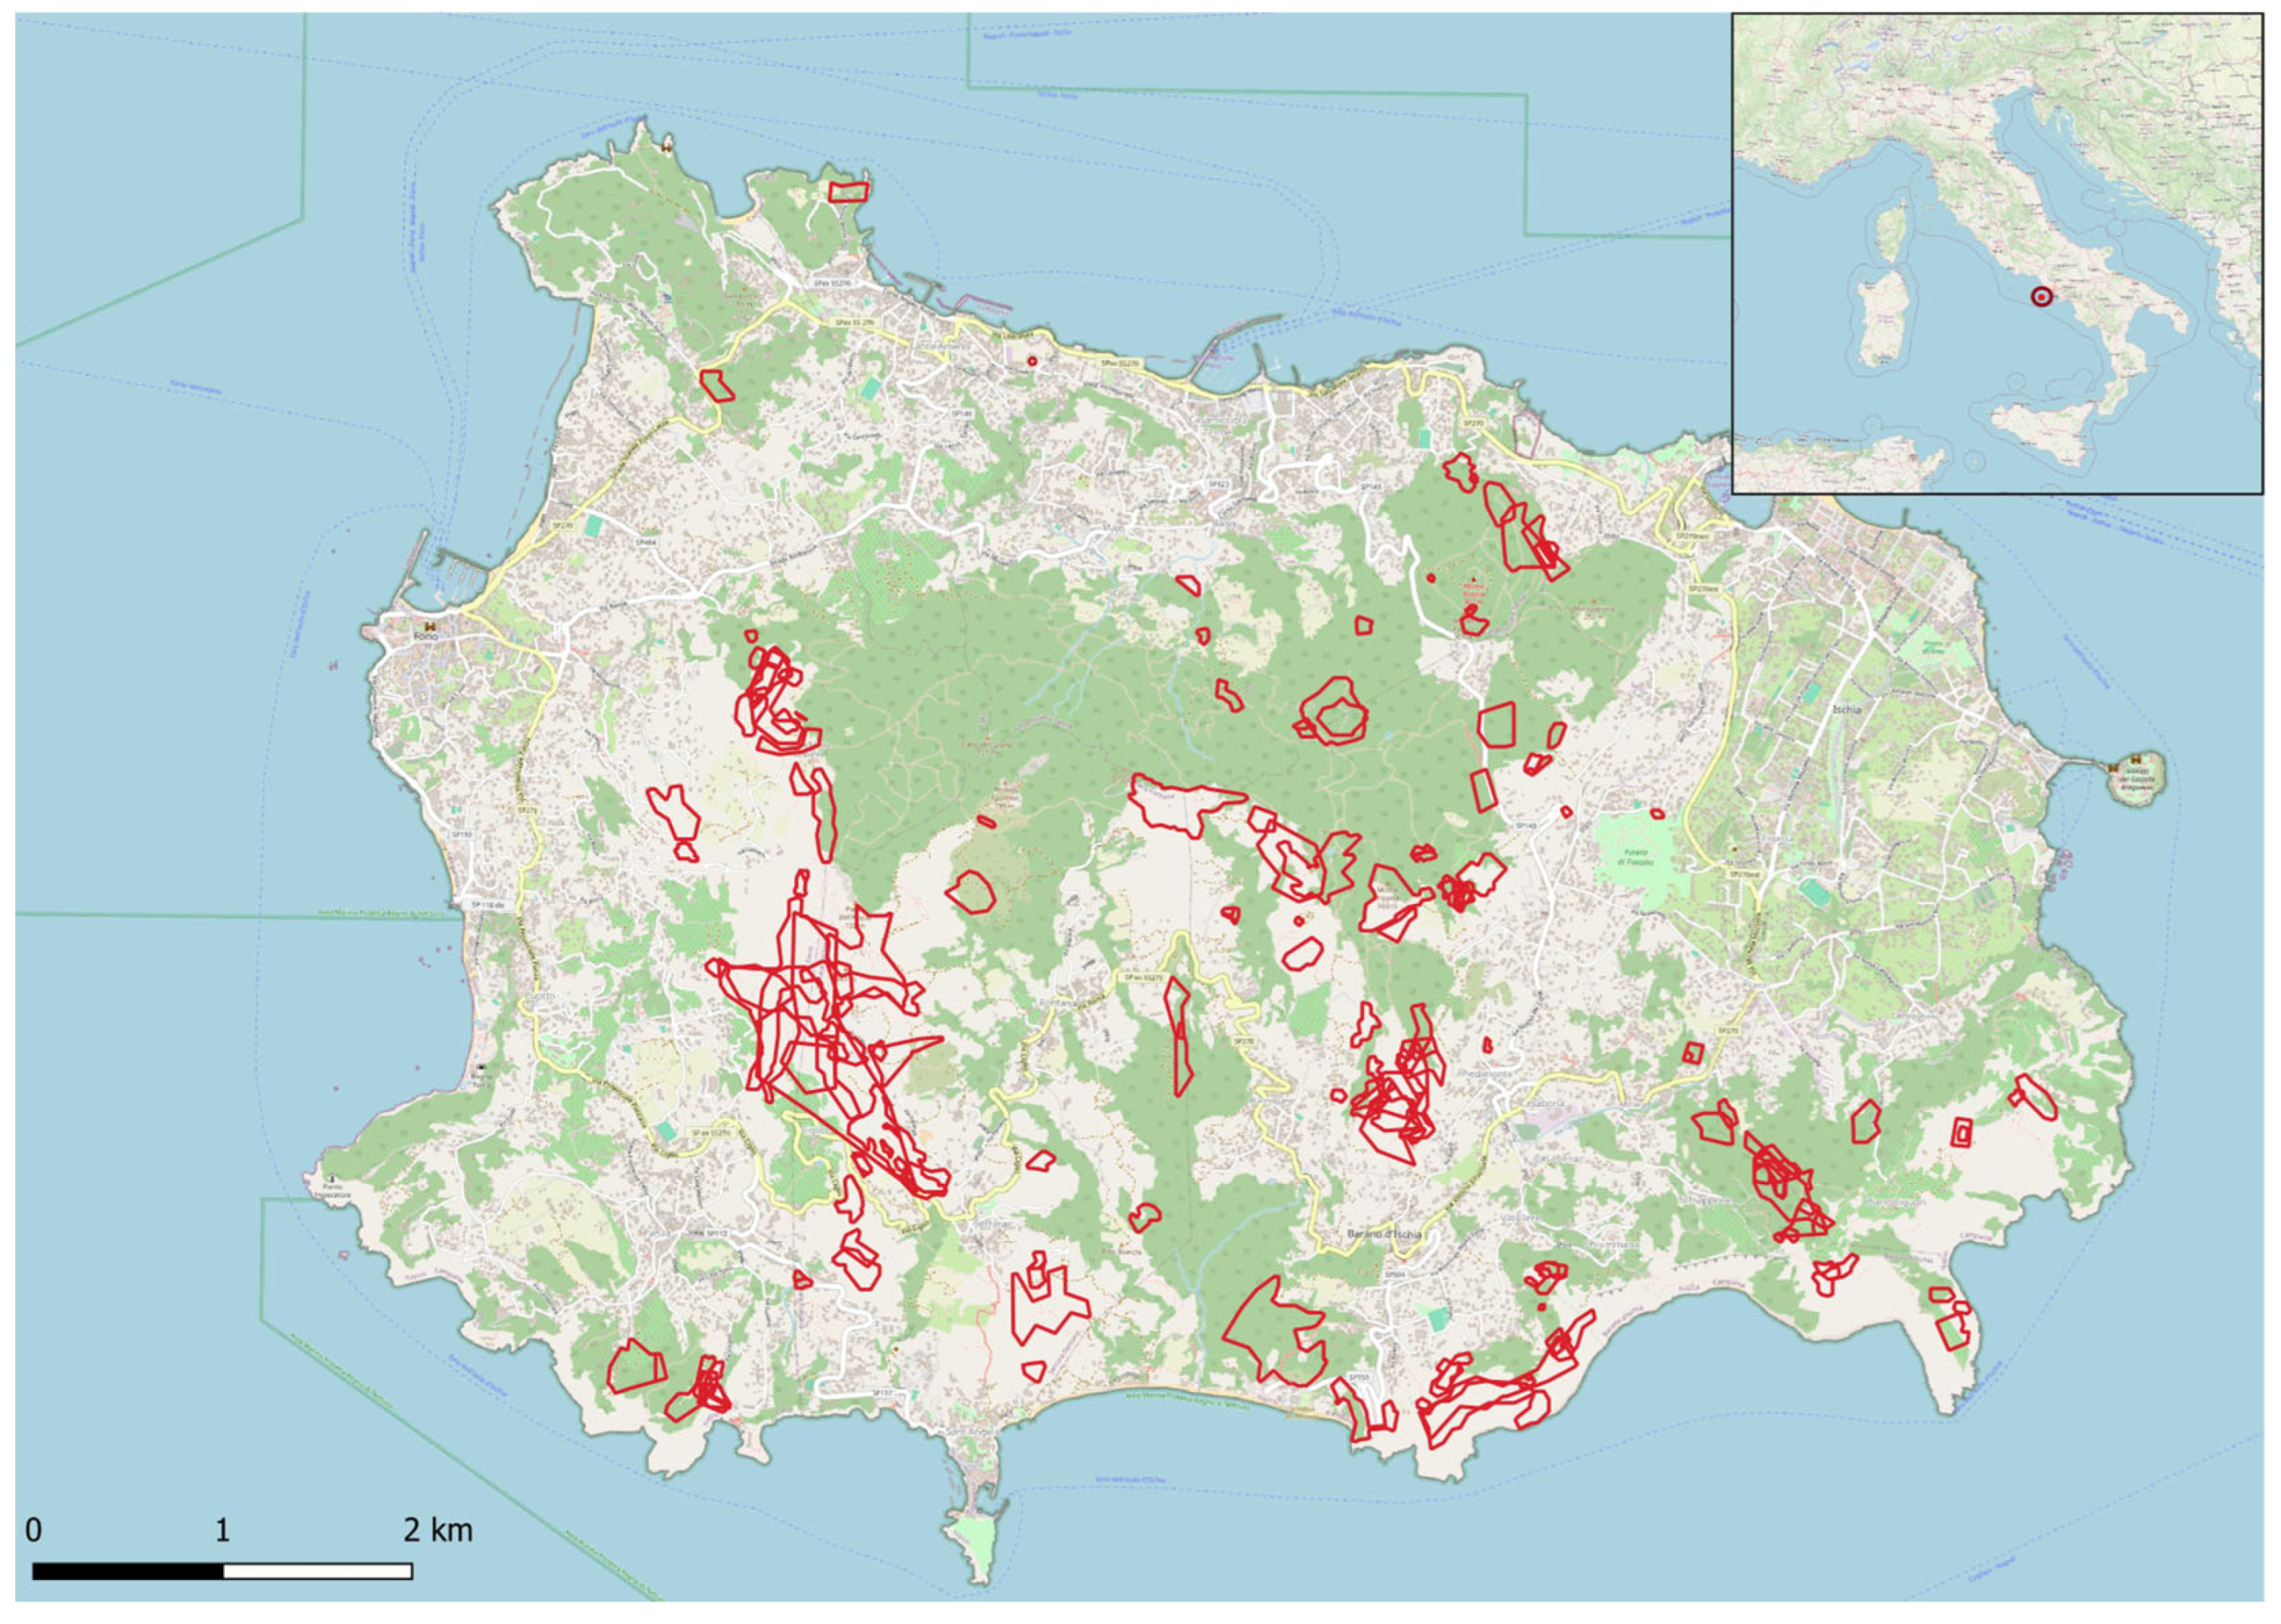
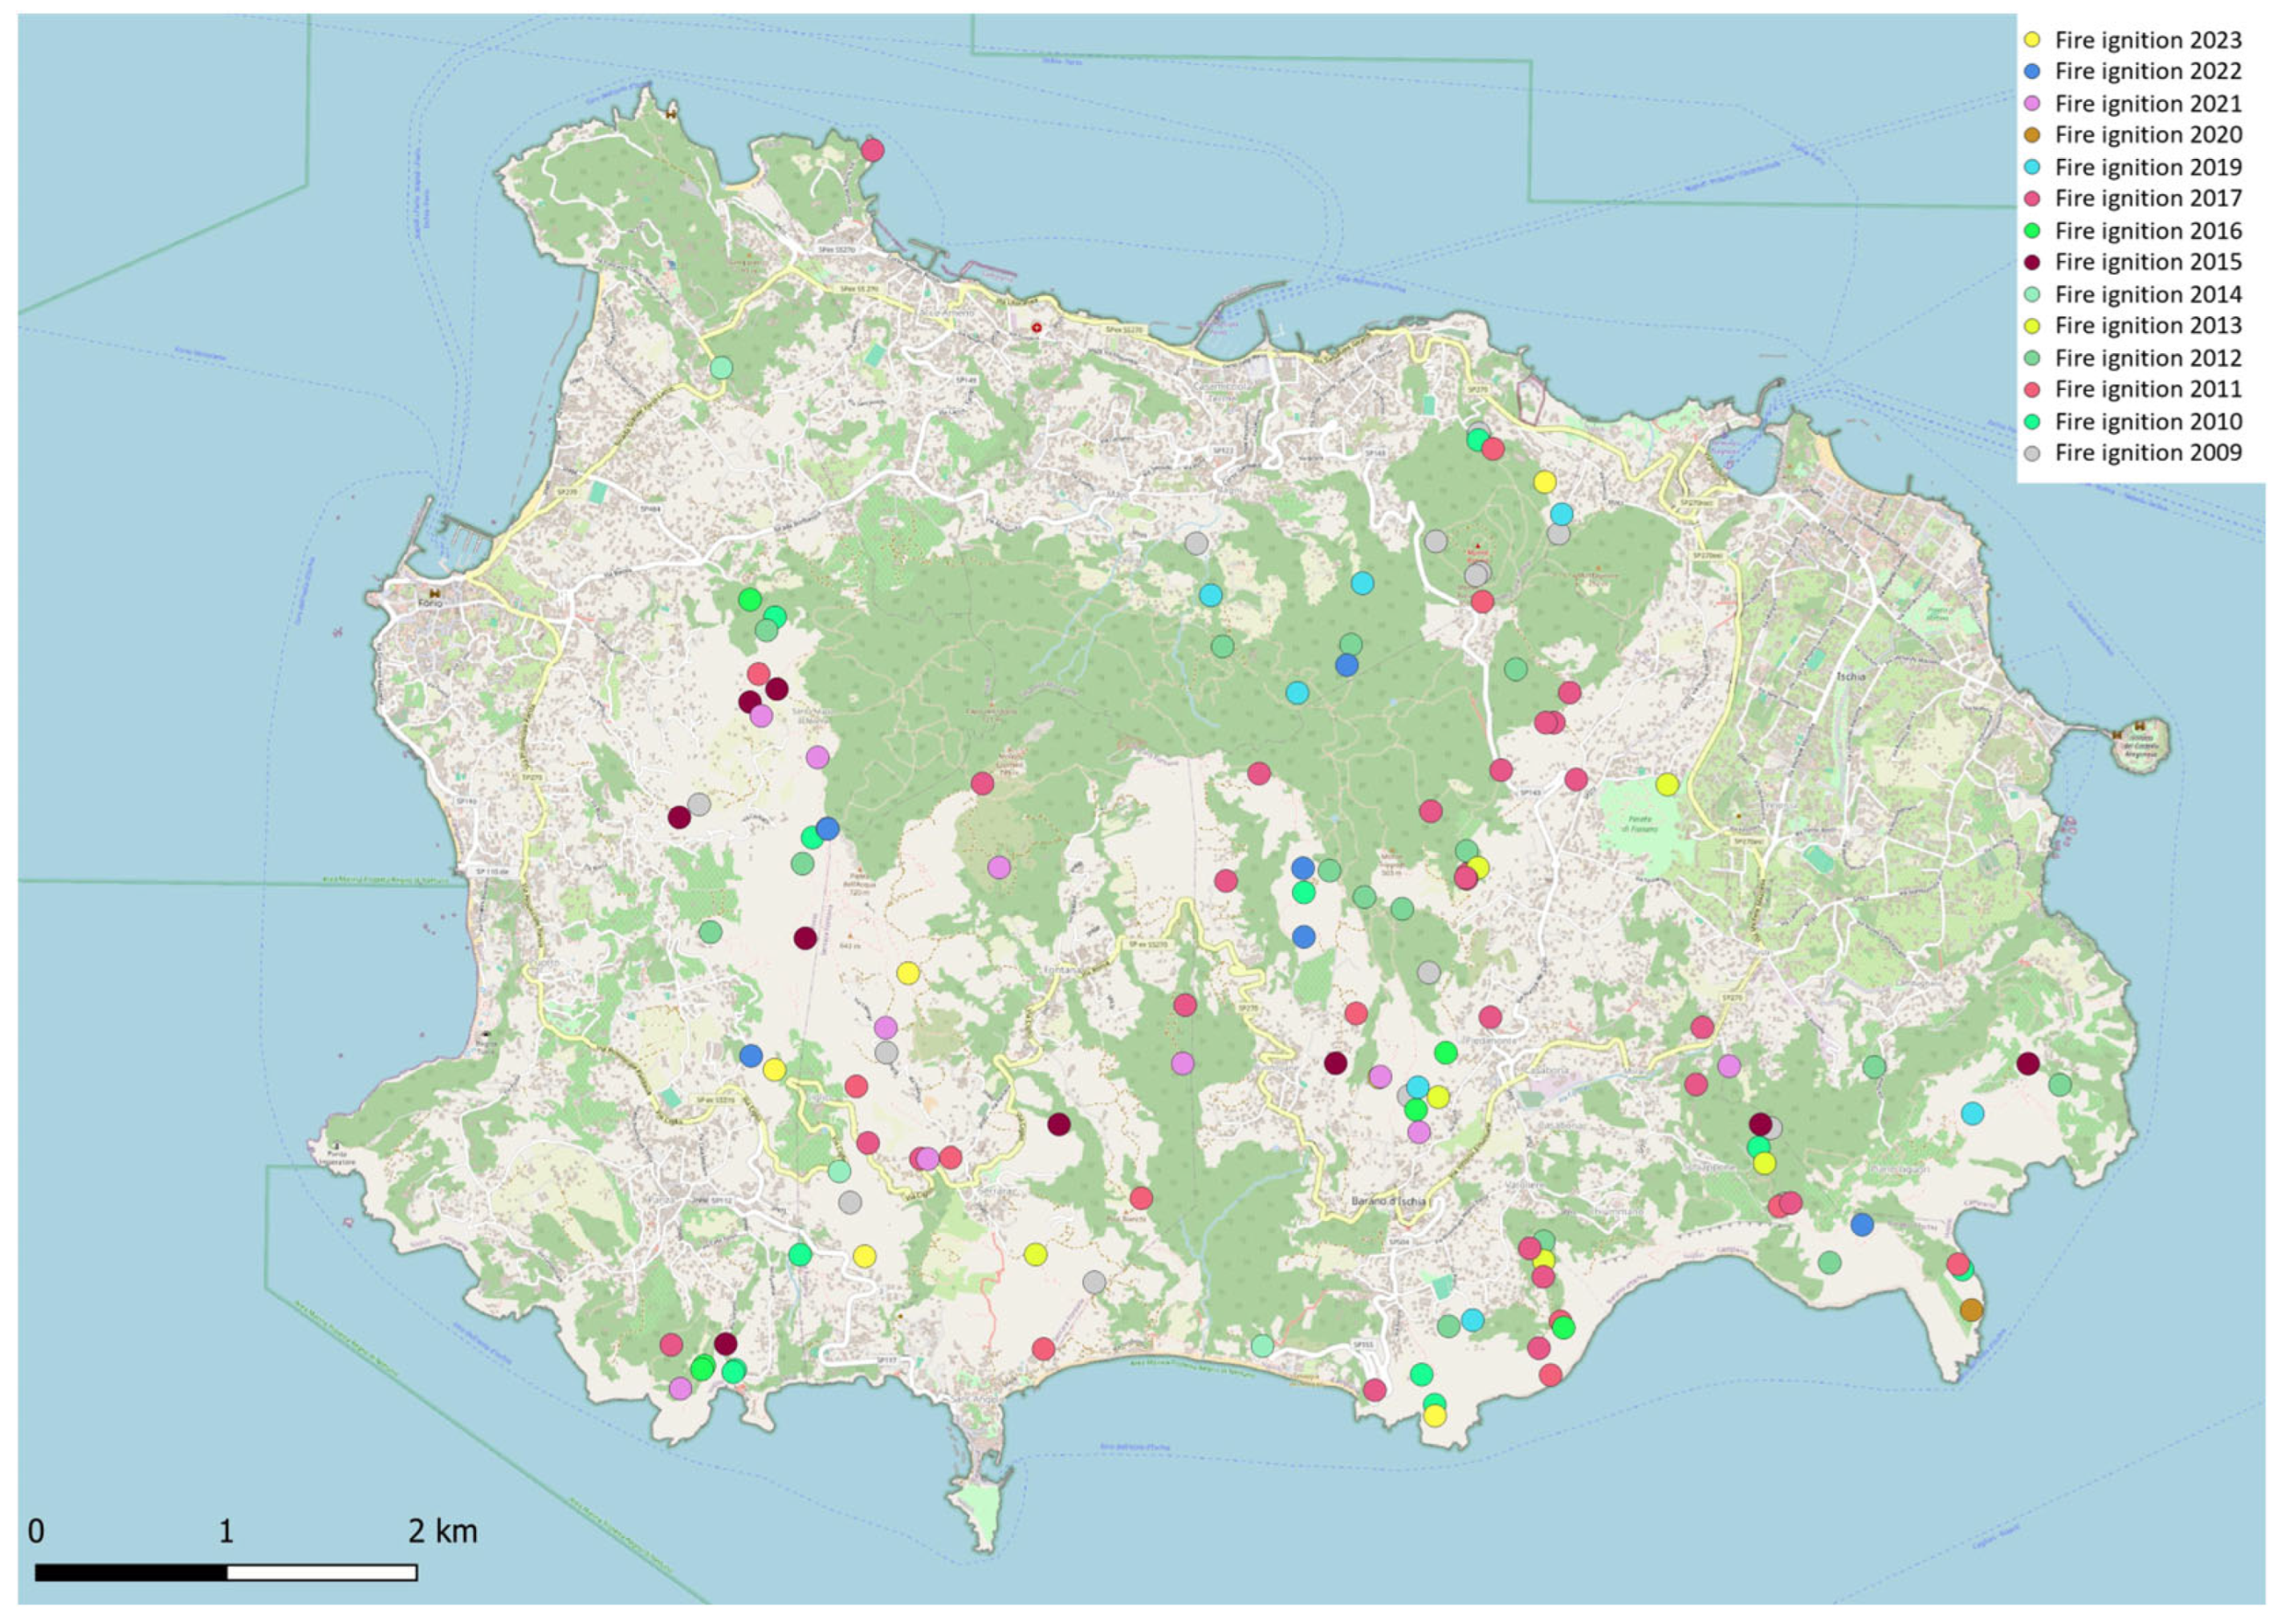
2.1. Preliminary Investigation of the Location of Ignition Points
- -
- year of occurrence: enabling an understanding of annual variations and potential trends over the observation period;
- -
- fire identifier: a unique reference code for each incident, ensuring precise tracking and reference in datasets;
- -
- fire date: capturing the exact timing of each incident to help identify seasonal or weather-related patterns;
- -
- location and area burned: specifying the geographic location and the size of each affected area to allow for spatial analysis in relation to land cover types, vegetation, and proximity to urban zones.
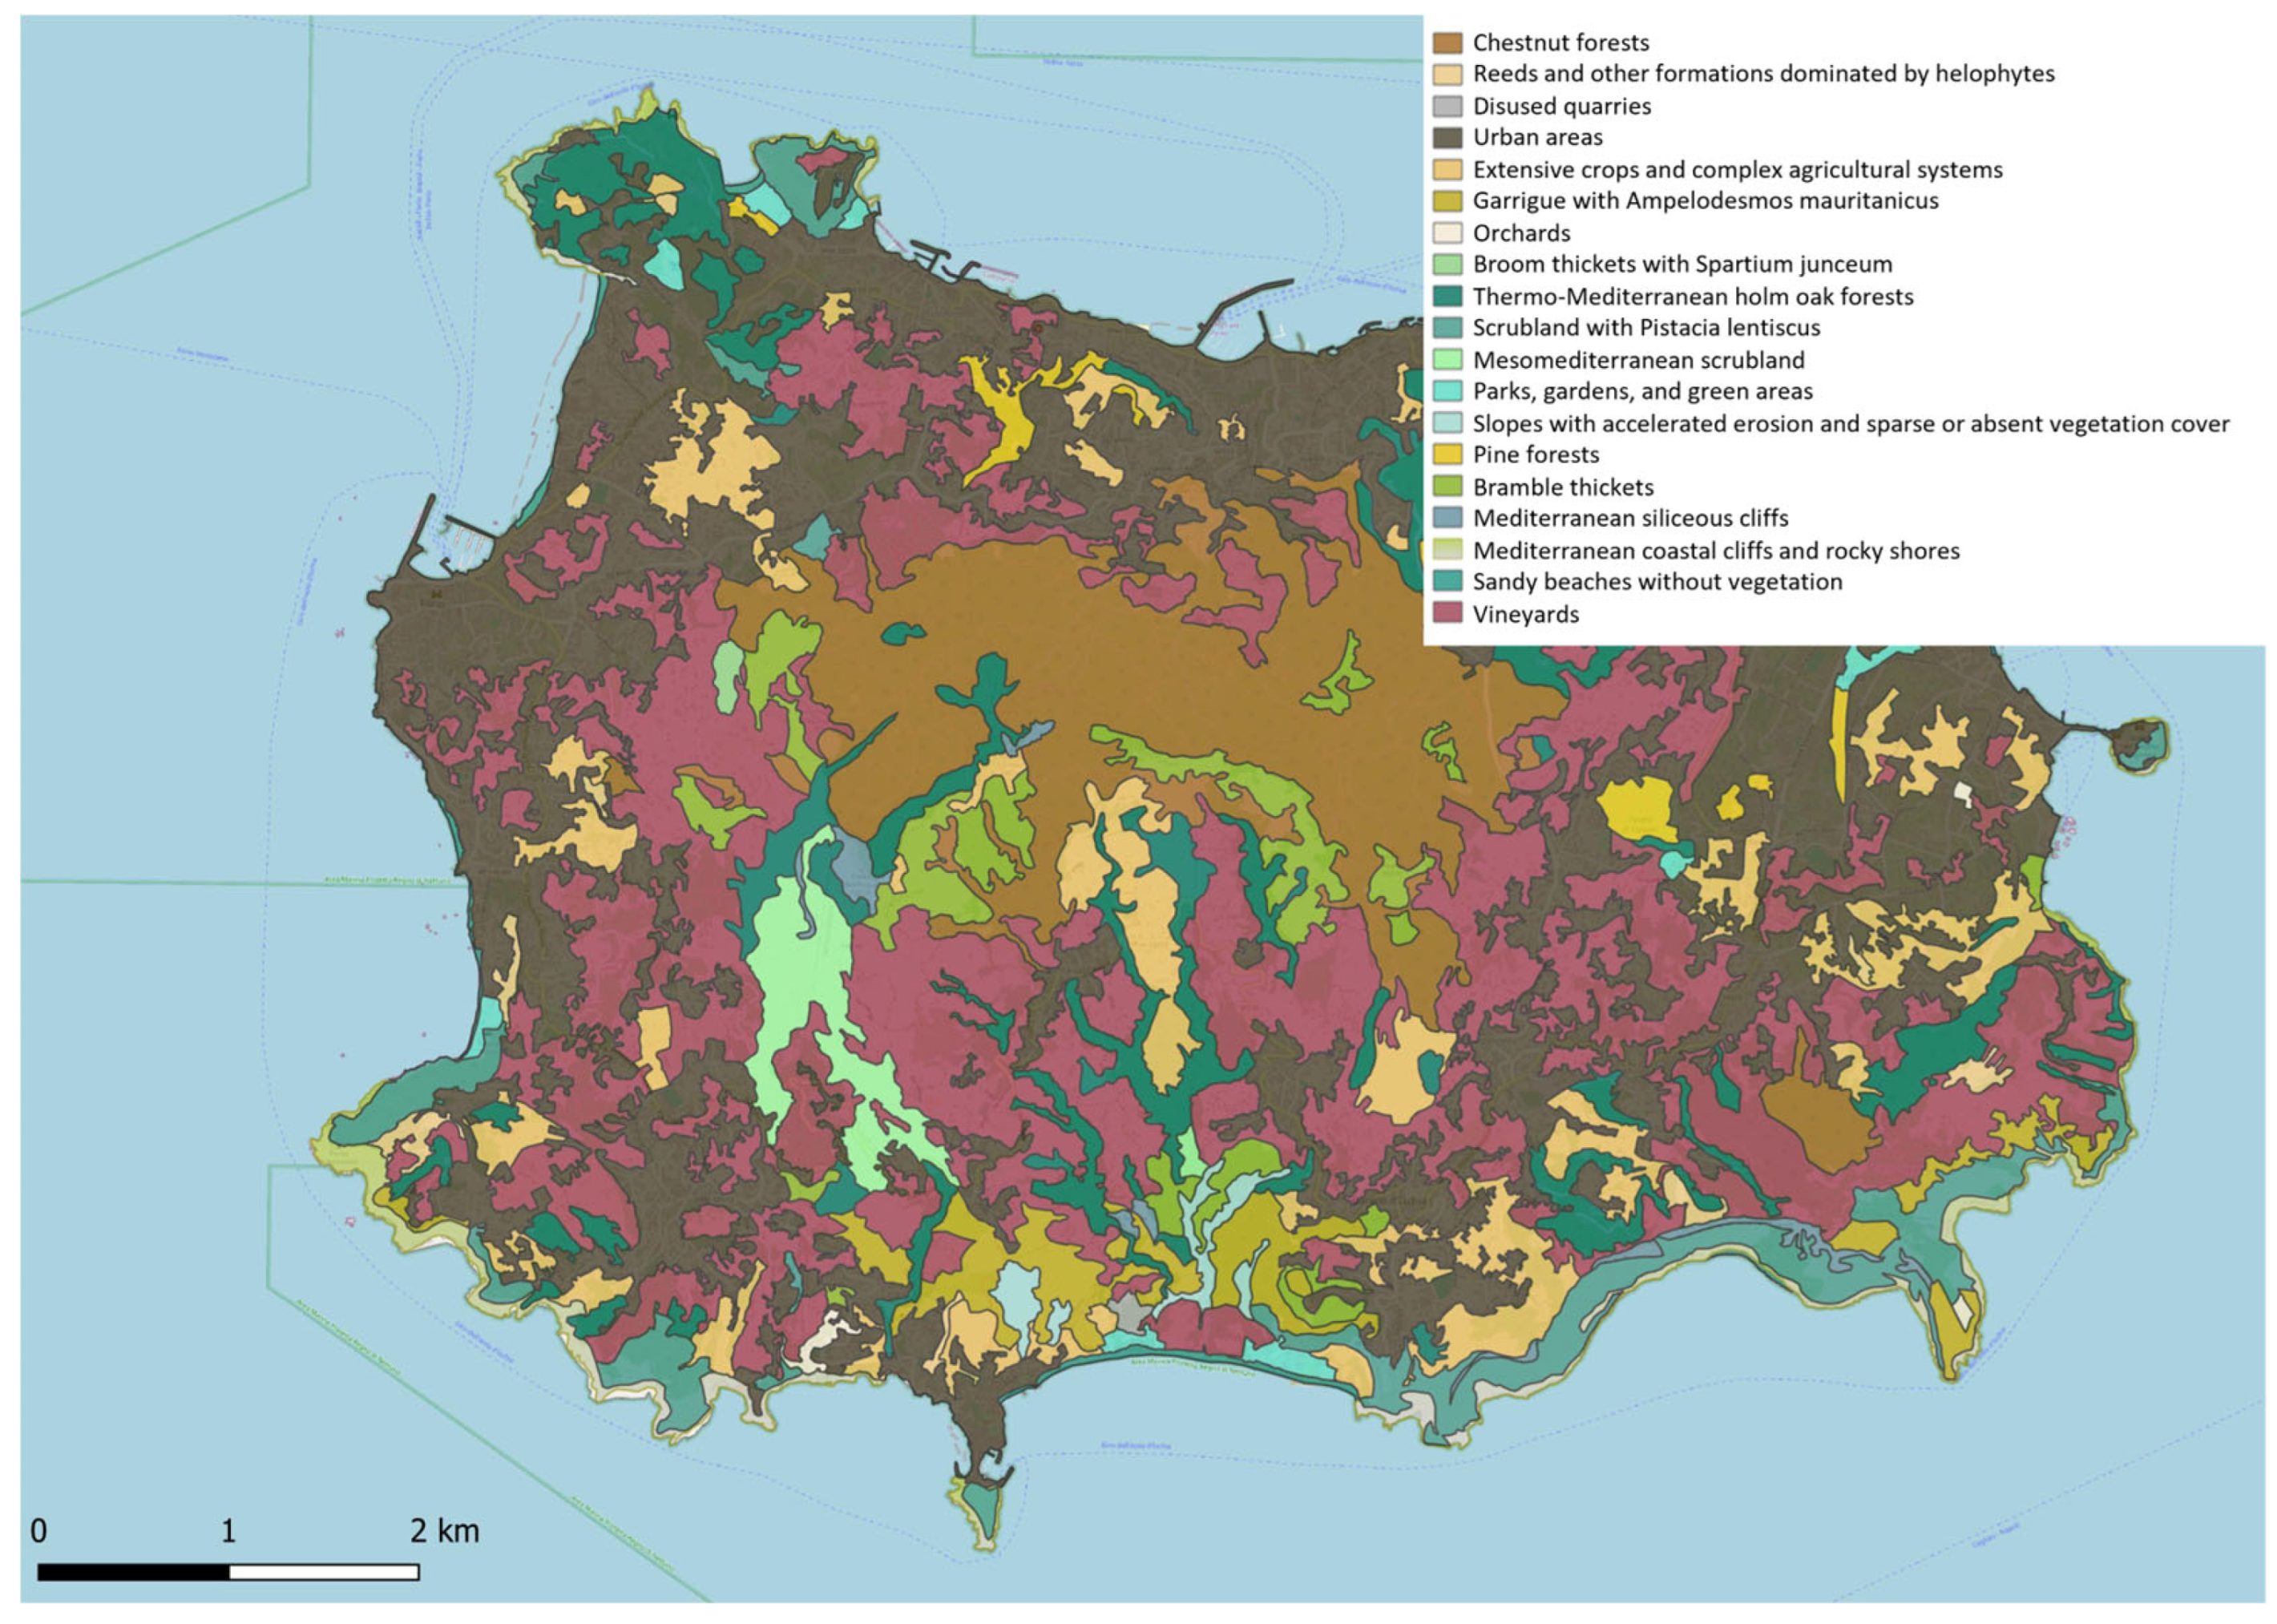
- Vegetation, land use, and land cover: it provided insight into the type and distribution of vegetation, which is critical for assessing fire risk based on fuel availability.
- Perimeters and urban areas: it offered a spatial reference for fire perimeters and proximity to urban areas, important for understanding potential risks to human infrastructure.
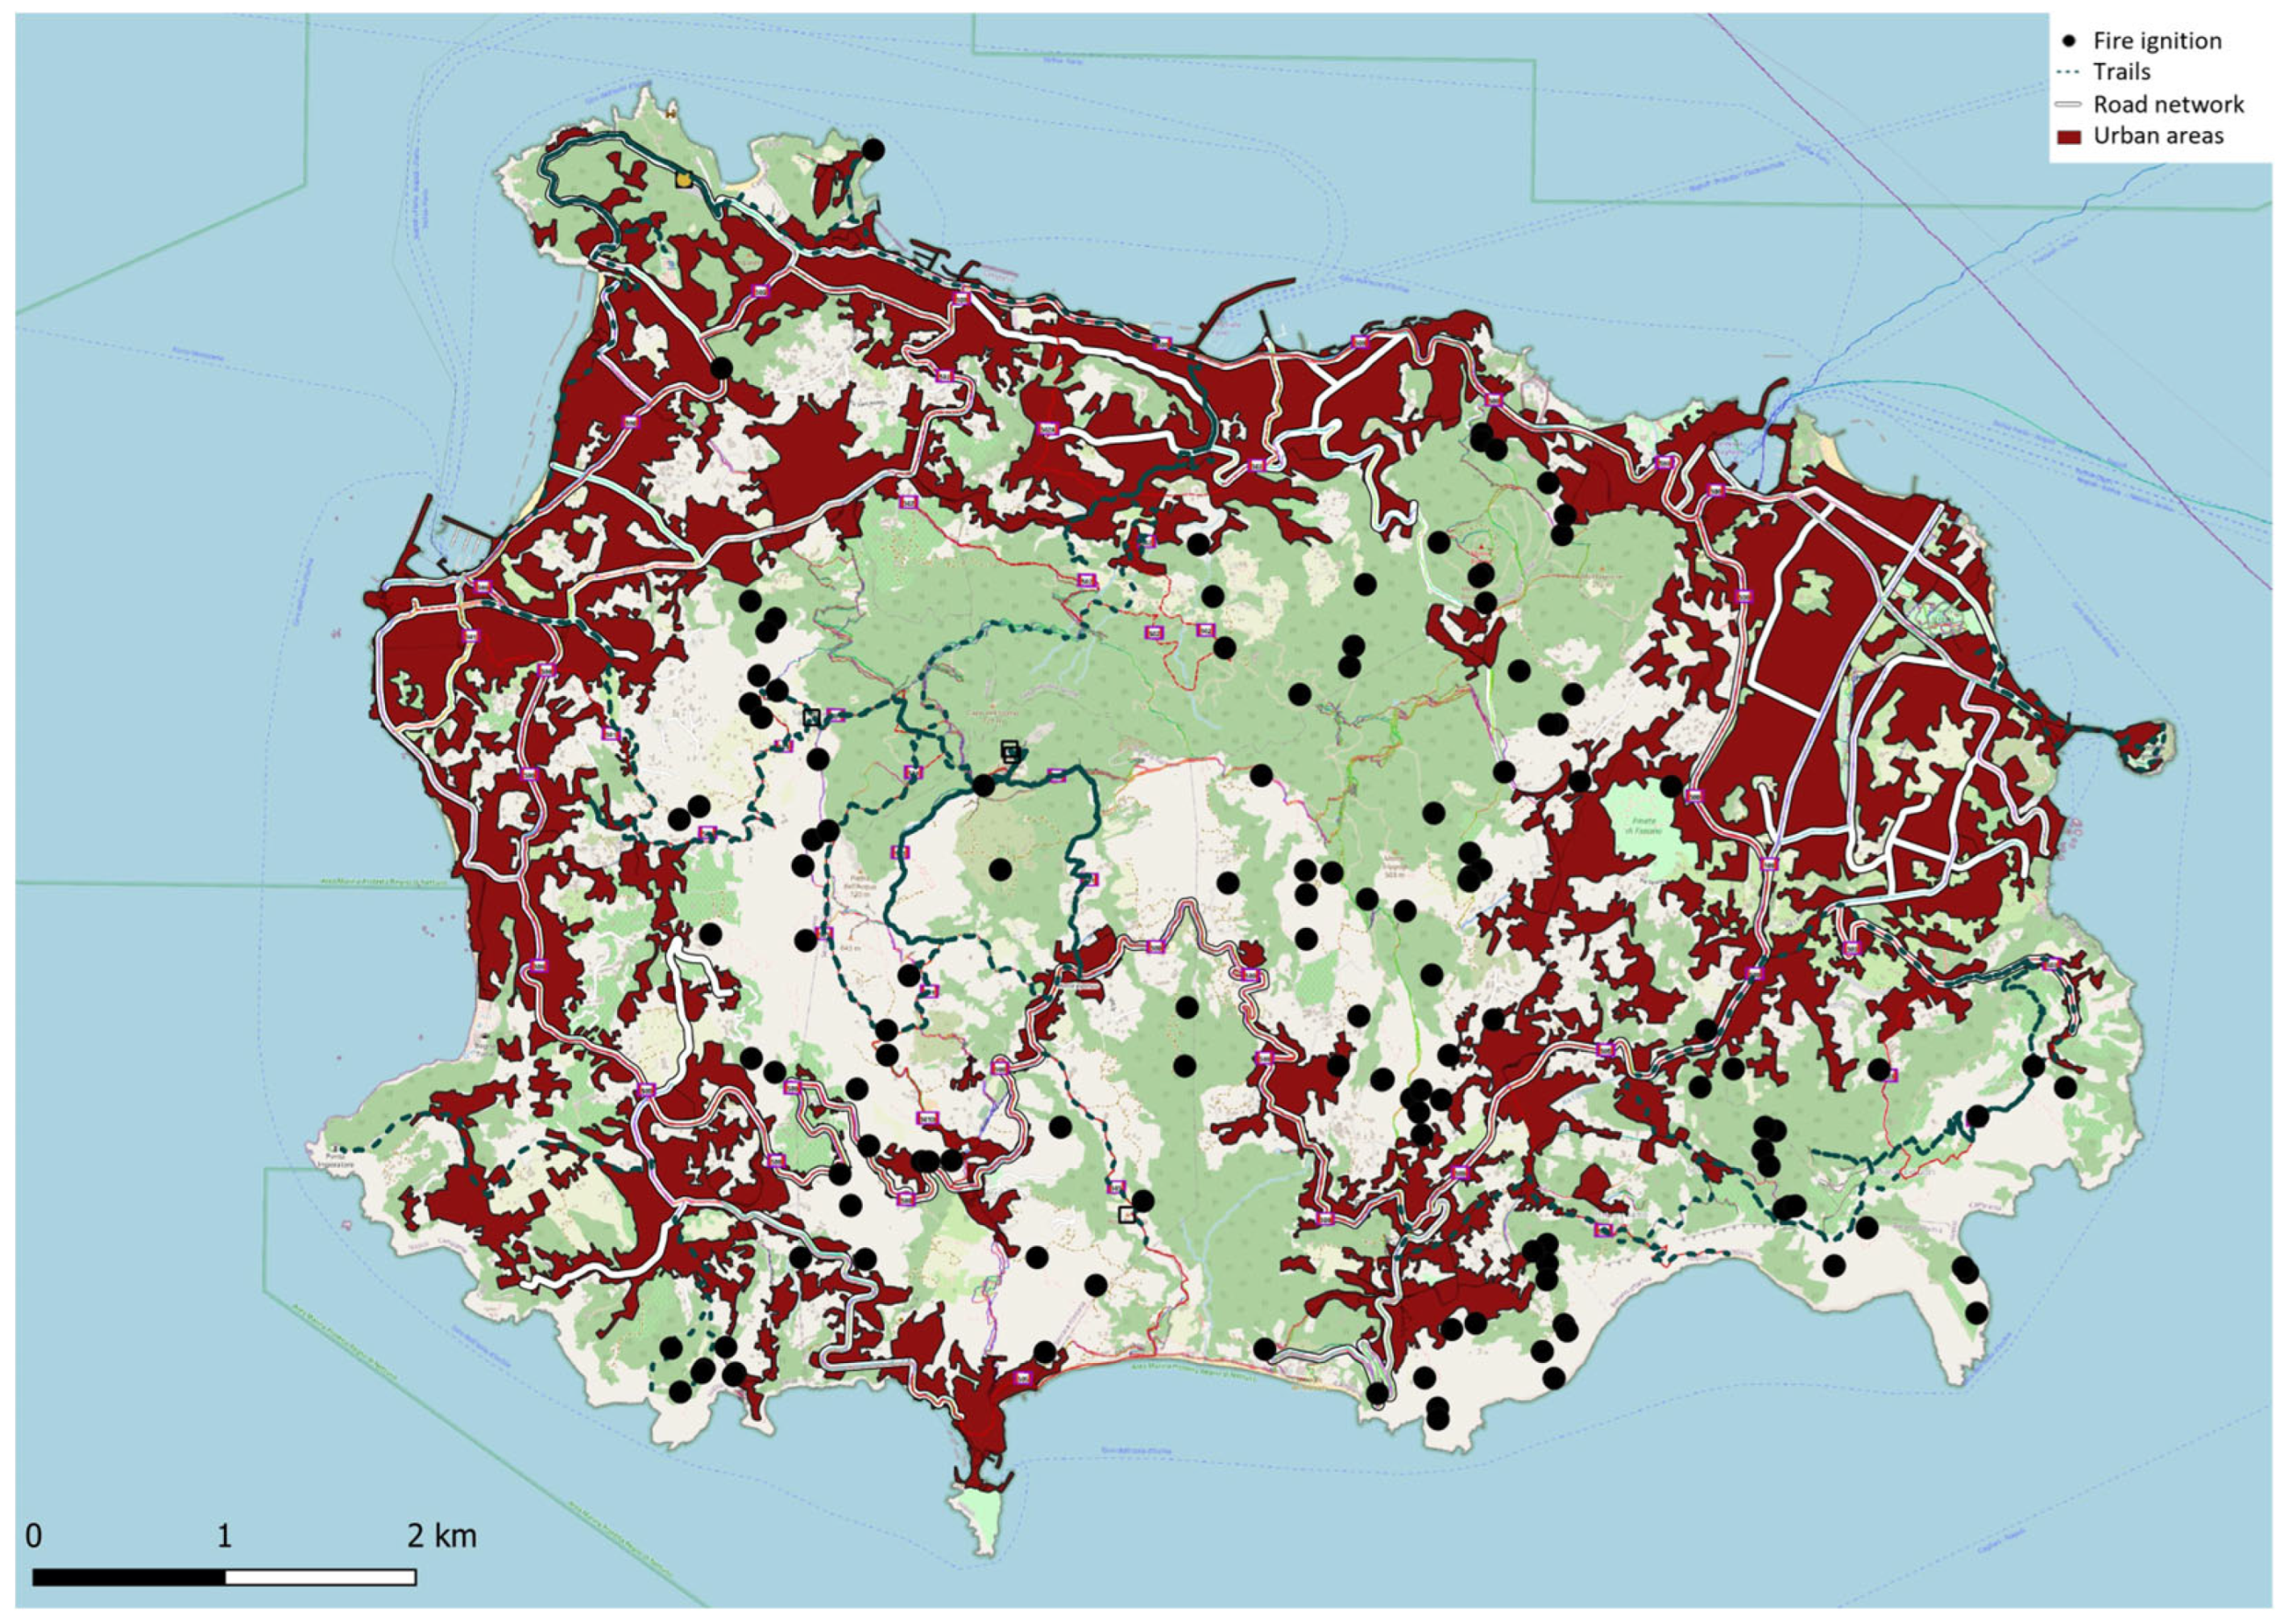
- Road and trail networks: these layers helped identify access routes, essential for evaluating potential fire spread and planning for suppression logistics.
- Local meteorological data: climate factors, such as temperature, humidity, and wind patterns, were incorporated to reflect their influence on fire behavior and ignition likelihood.
- Digital elevation model (DEM) [35]: this layer was used to analyze the topography of the study area, considering slope and elevation, which significantly impact fire spread dynamics.
2.2. Analysis of Wildfire Ignition Causes (2009–2023)
- closeness to the road and/or trail network
- presence of an urban–rural interface zone.
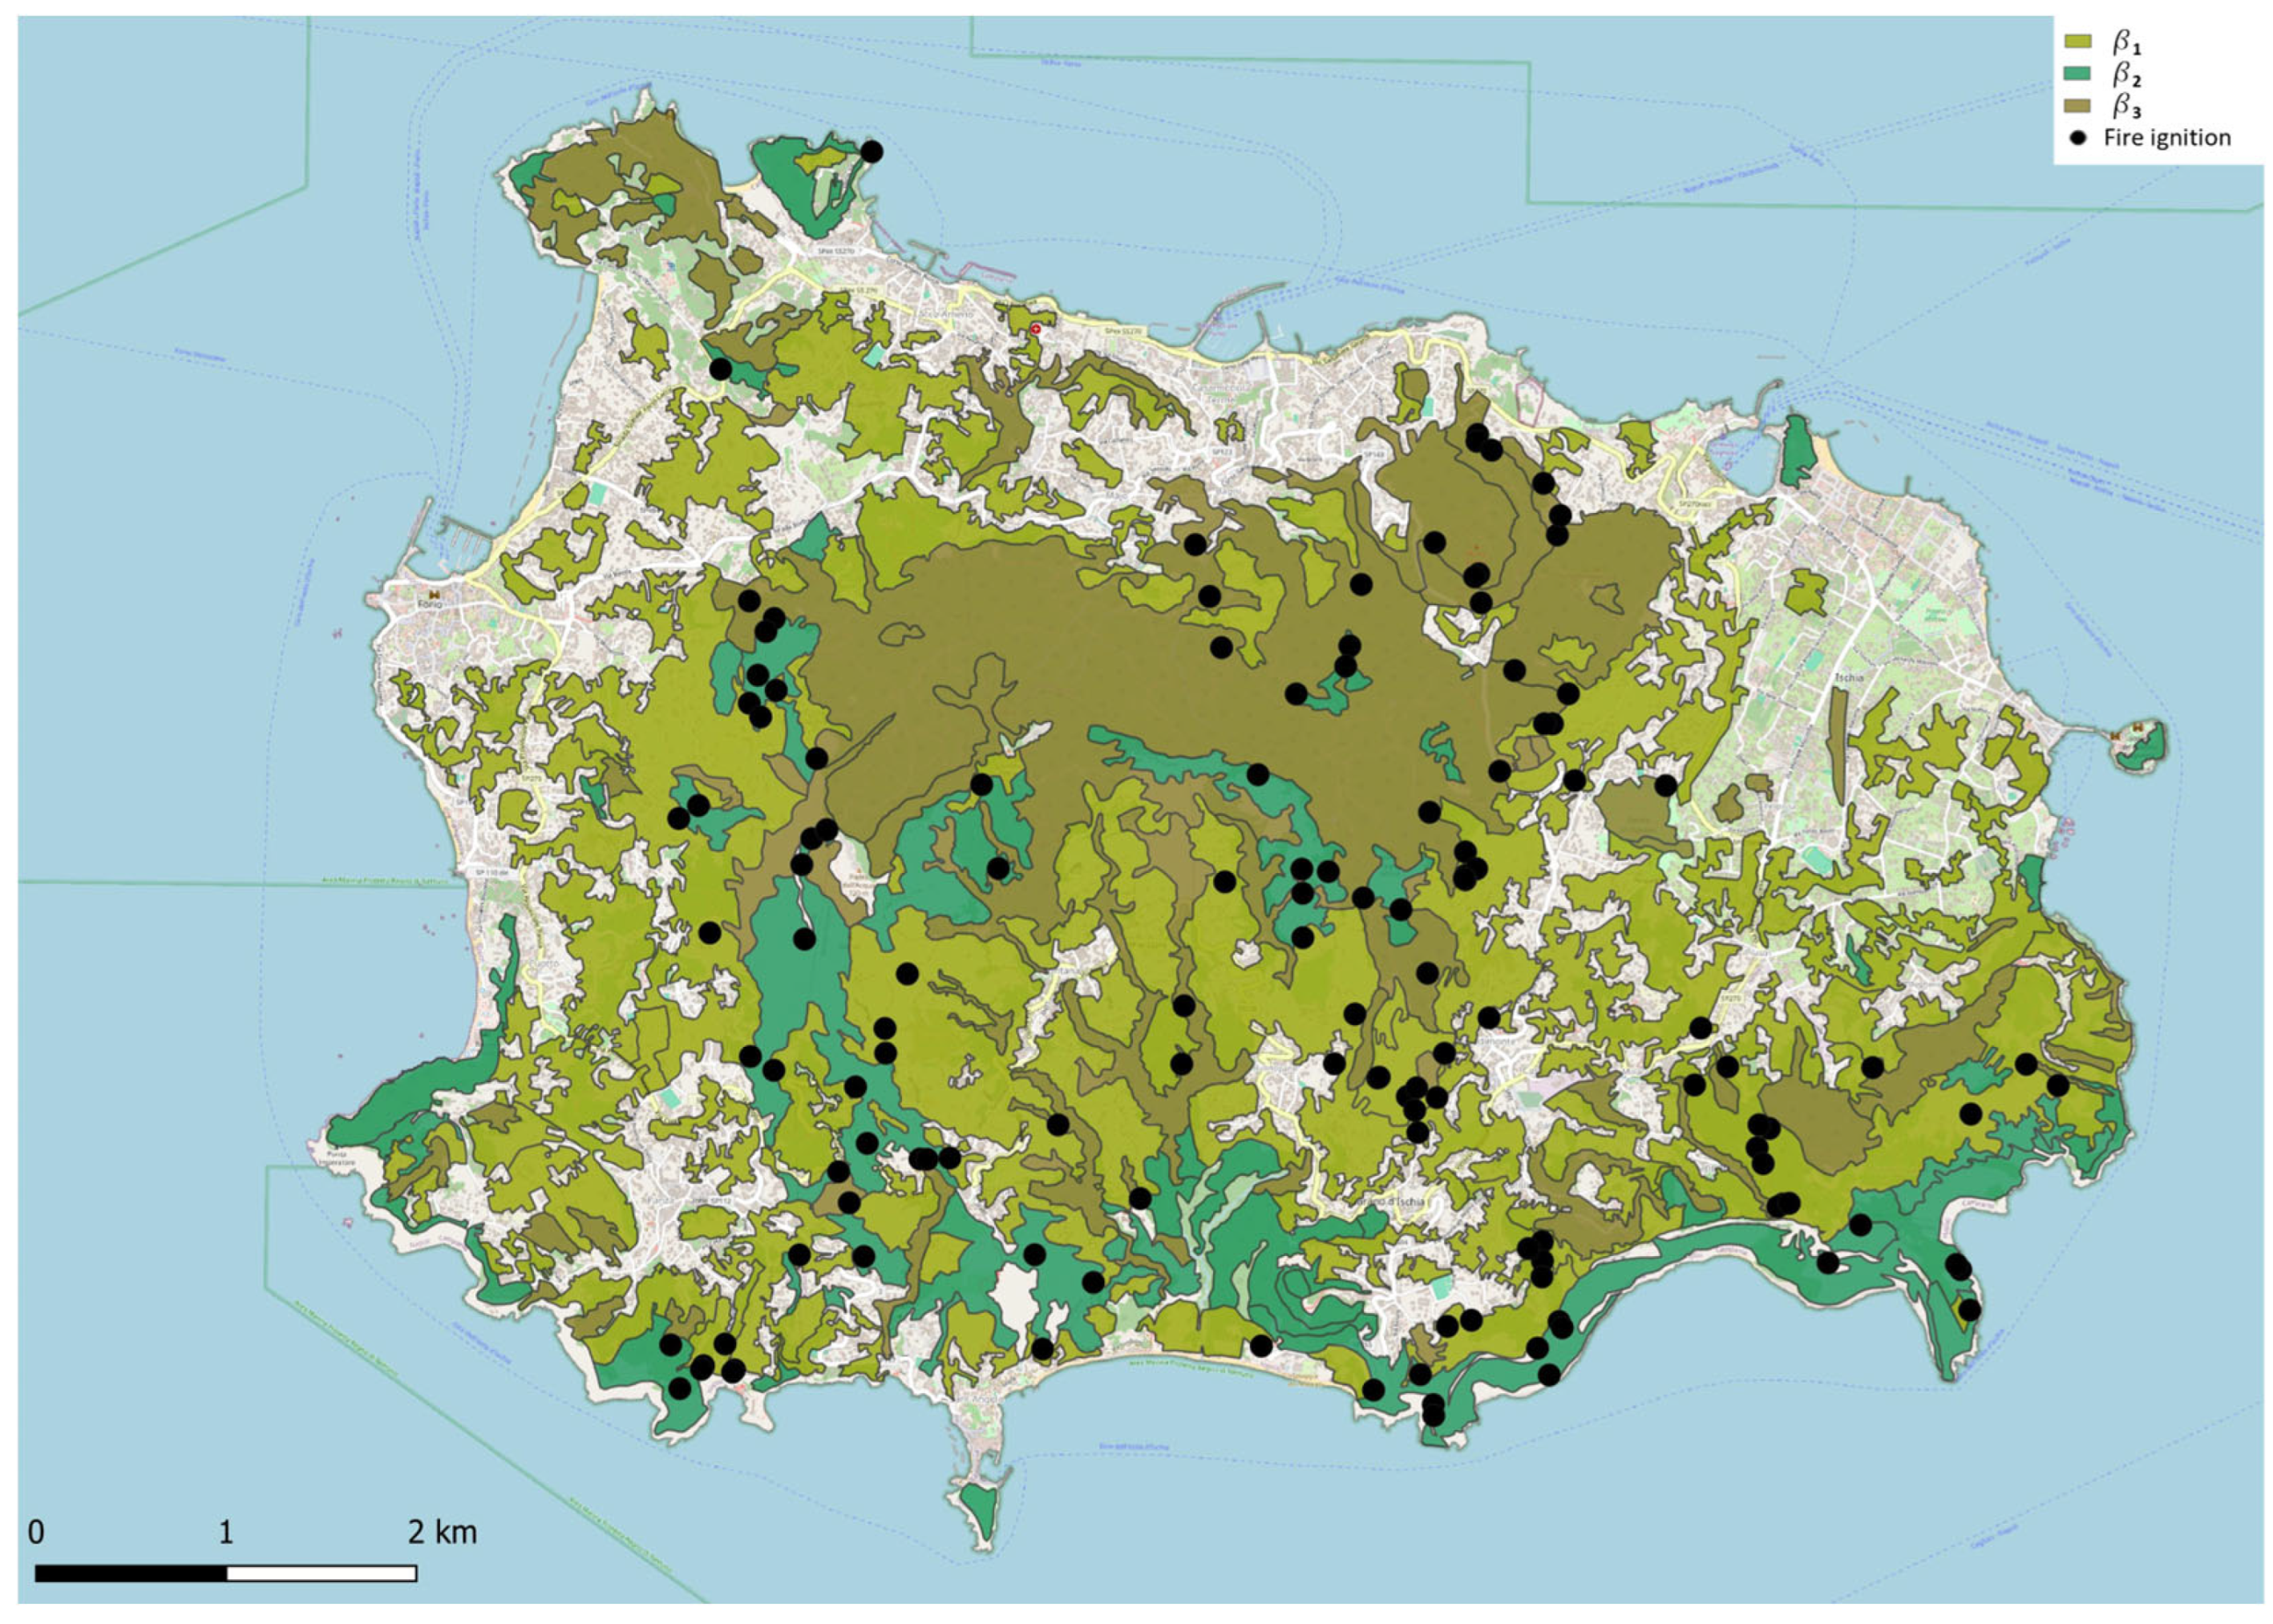
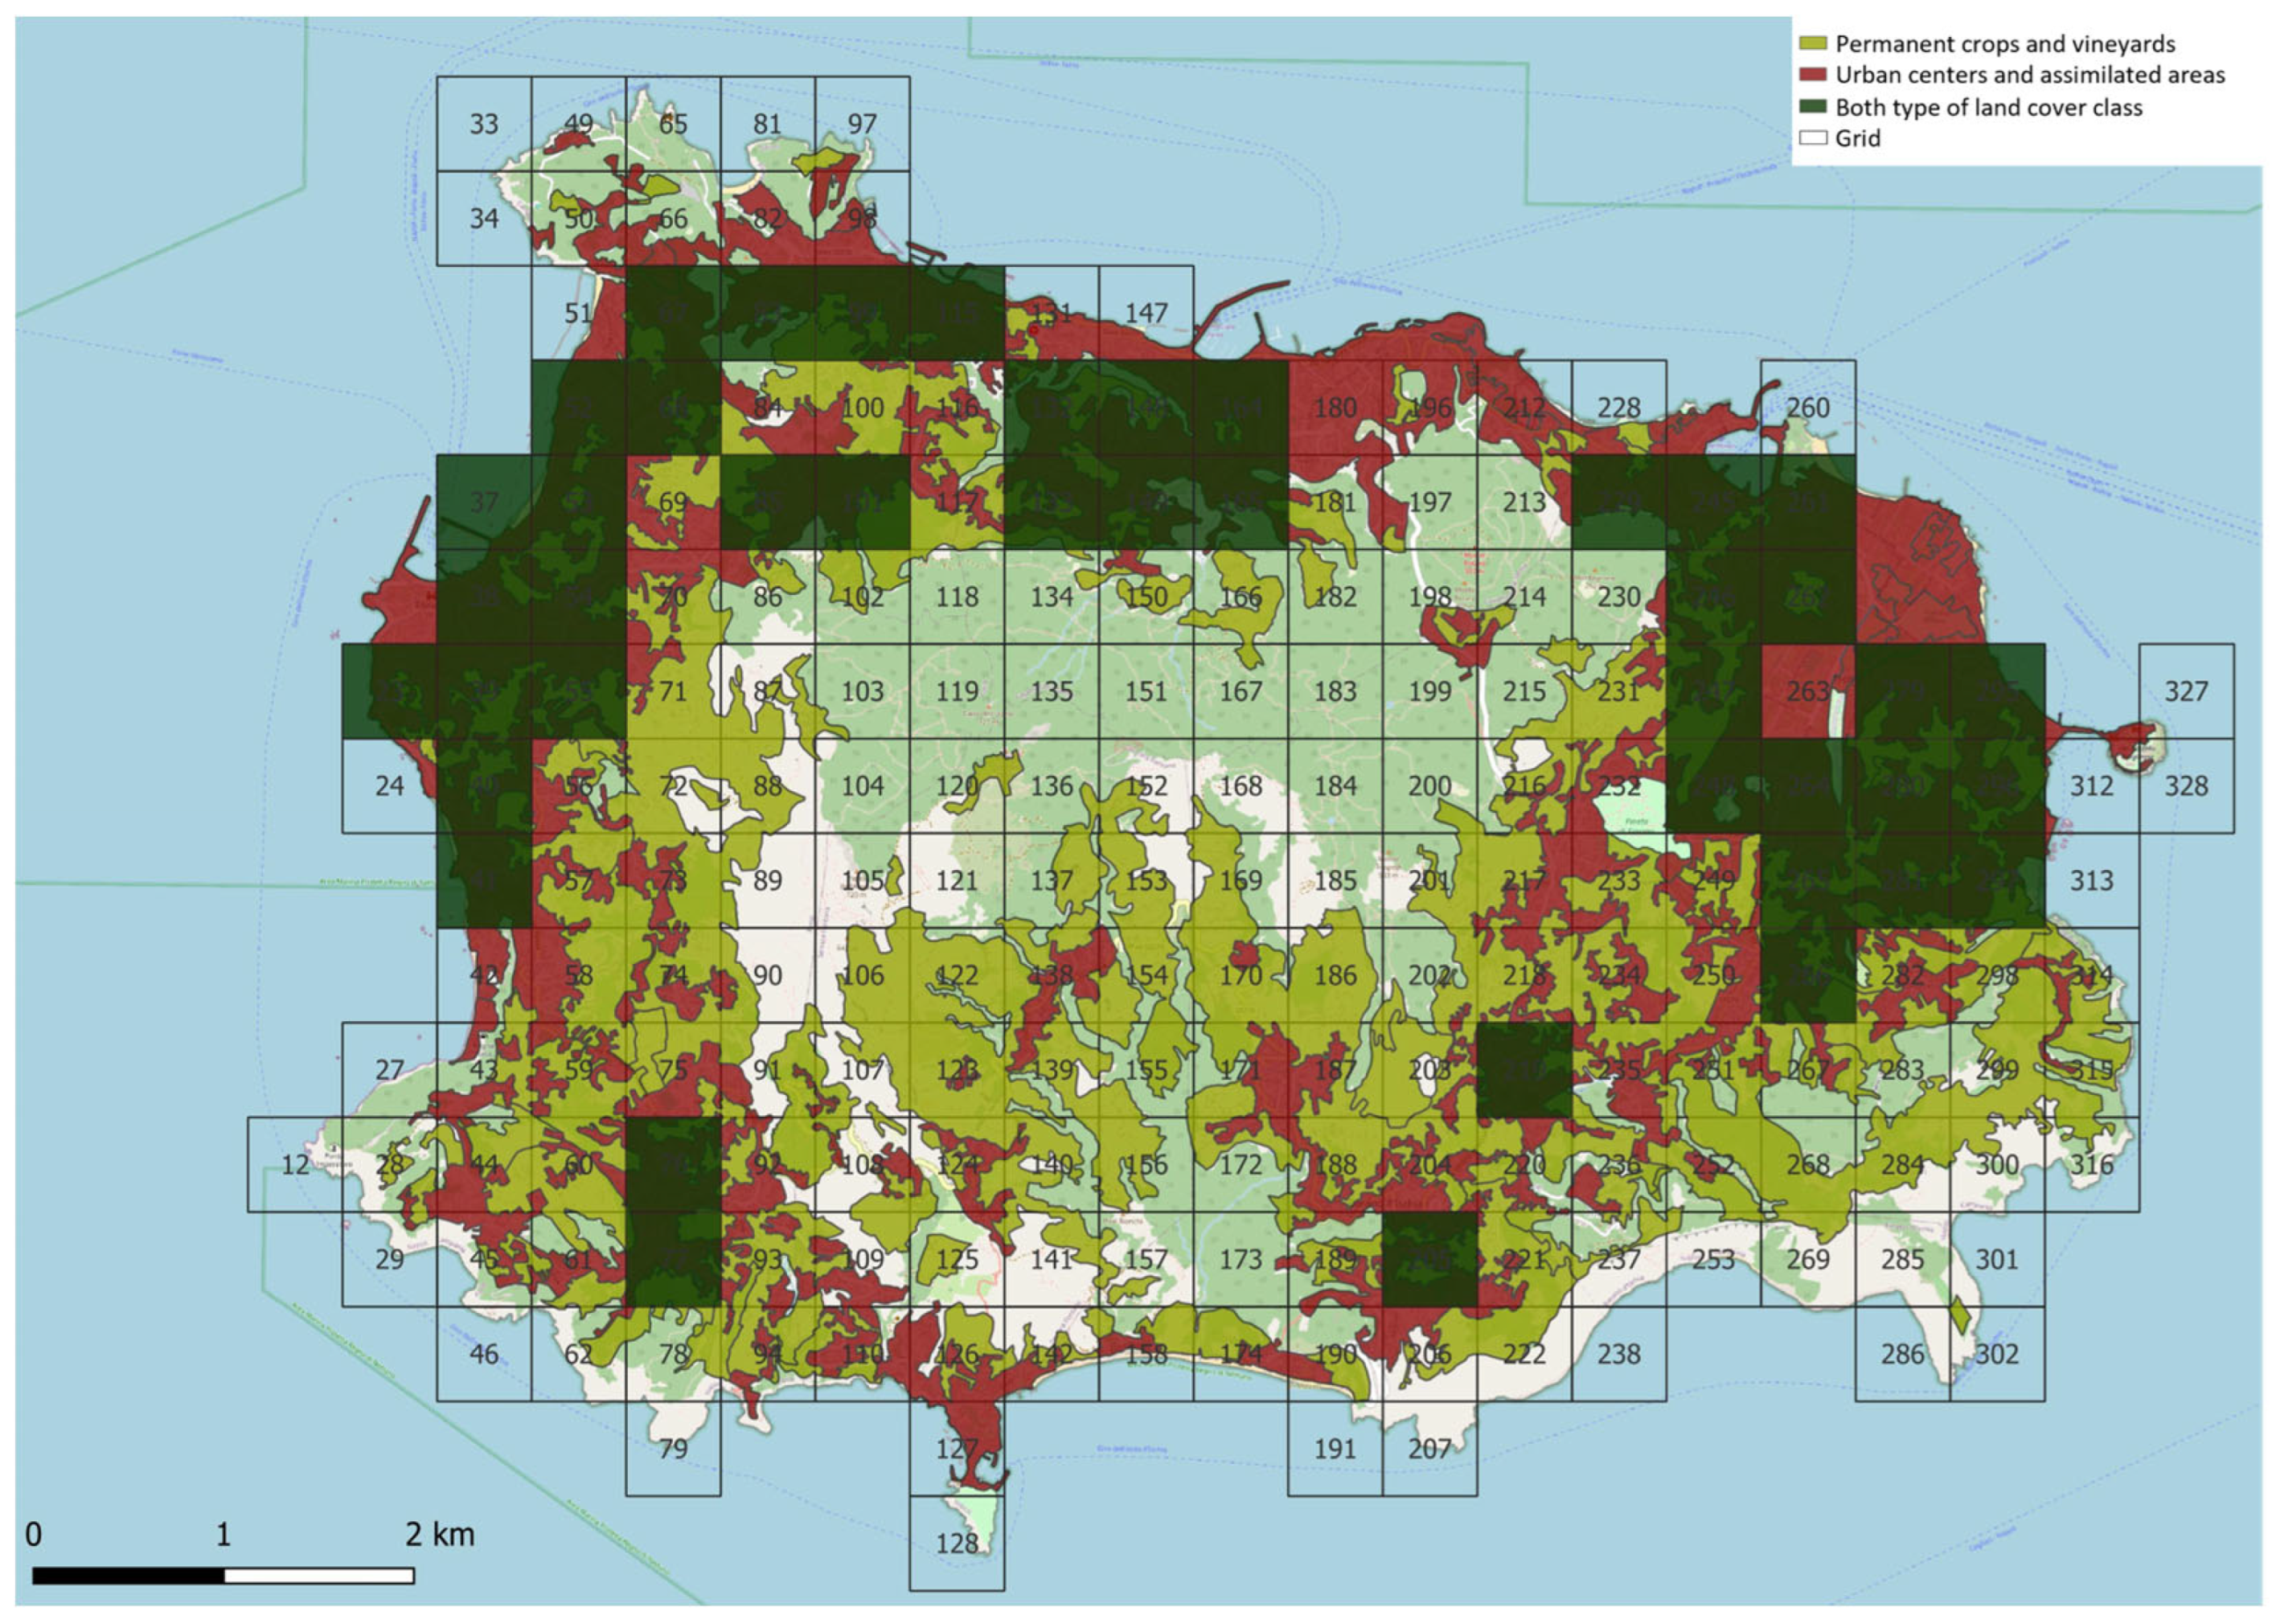
2.3. Grouping of Land Cover into Homogeneous Classes
- Permanent crops and vineyards (β1): 56 ignition points—percentage of 42.42%
- Shrublands, thickets, and scrub (β2): 46 ignition points—percentage of 34.85%
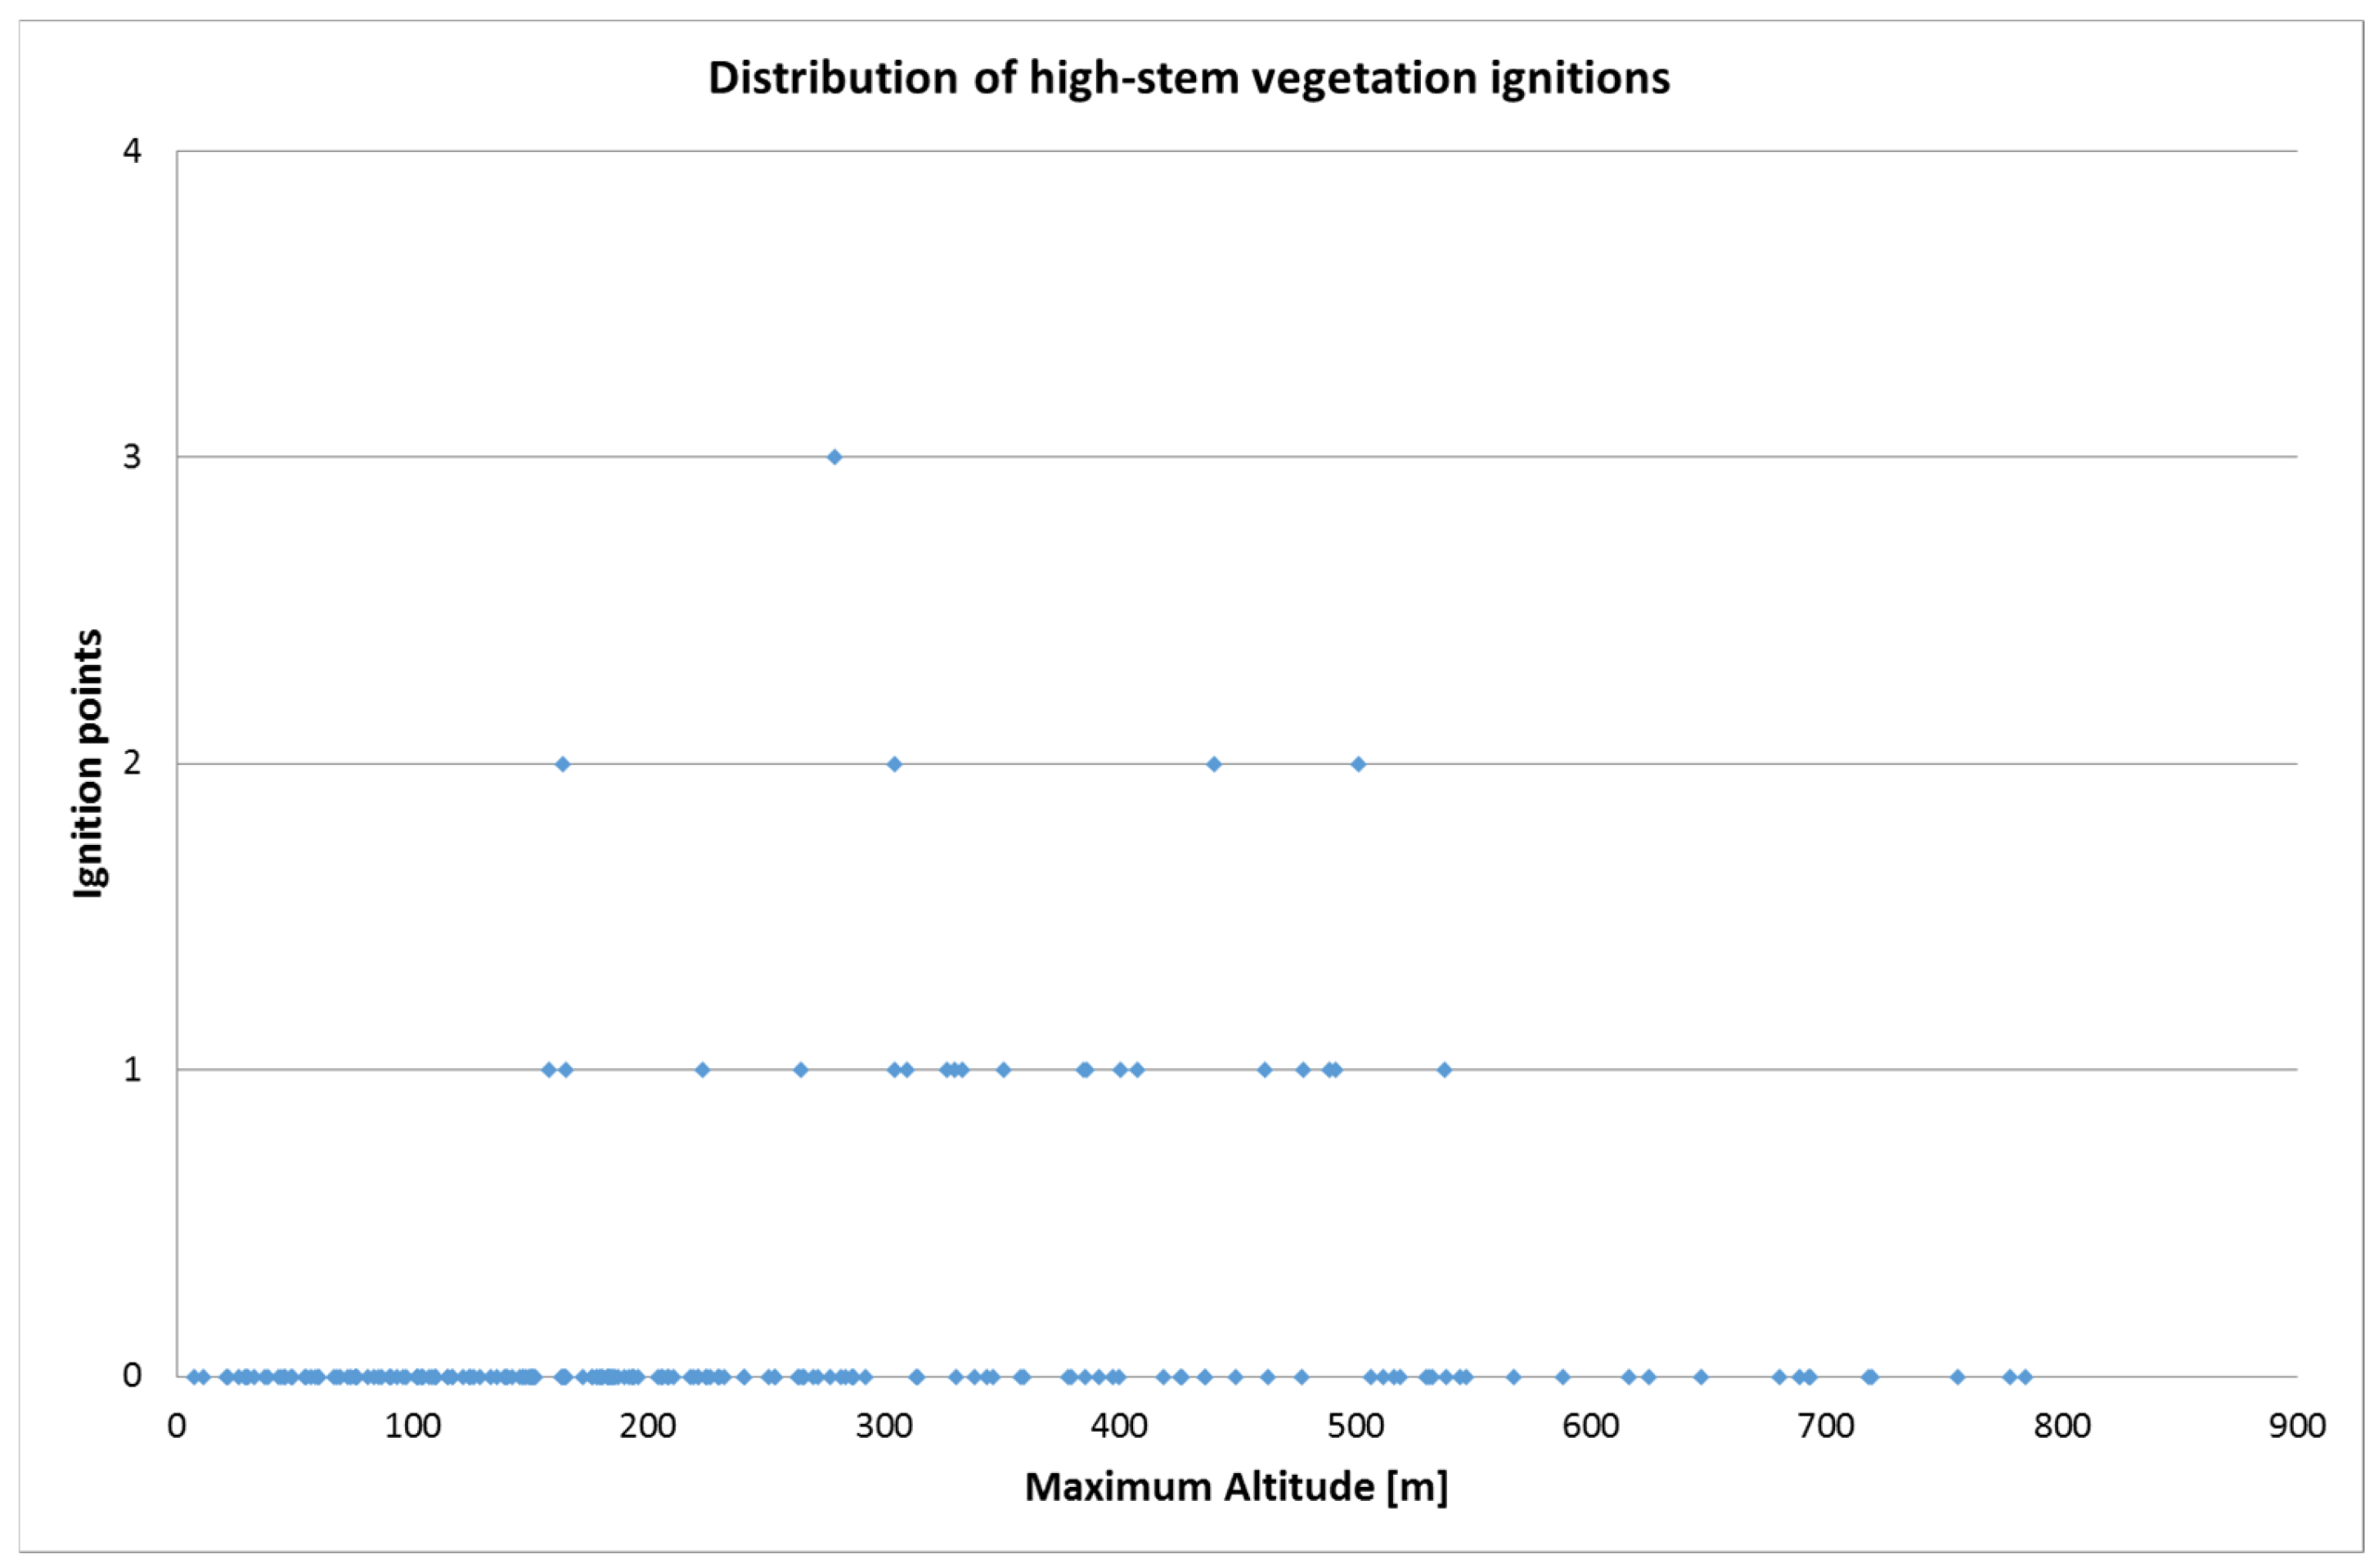
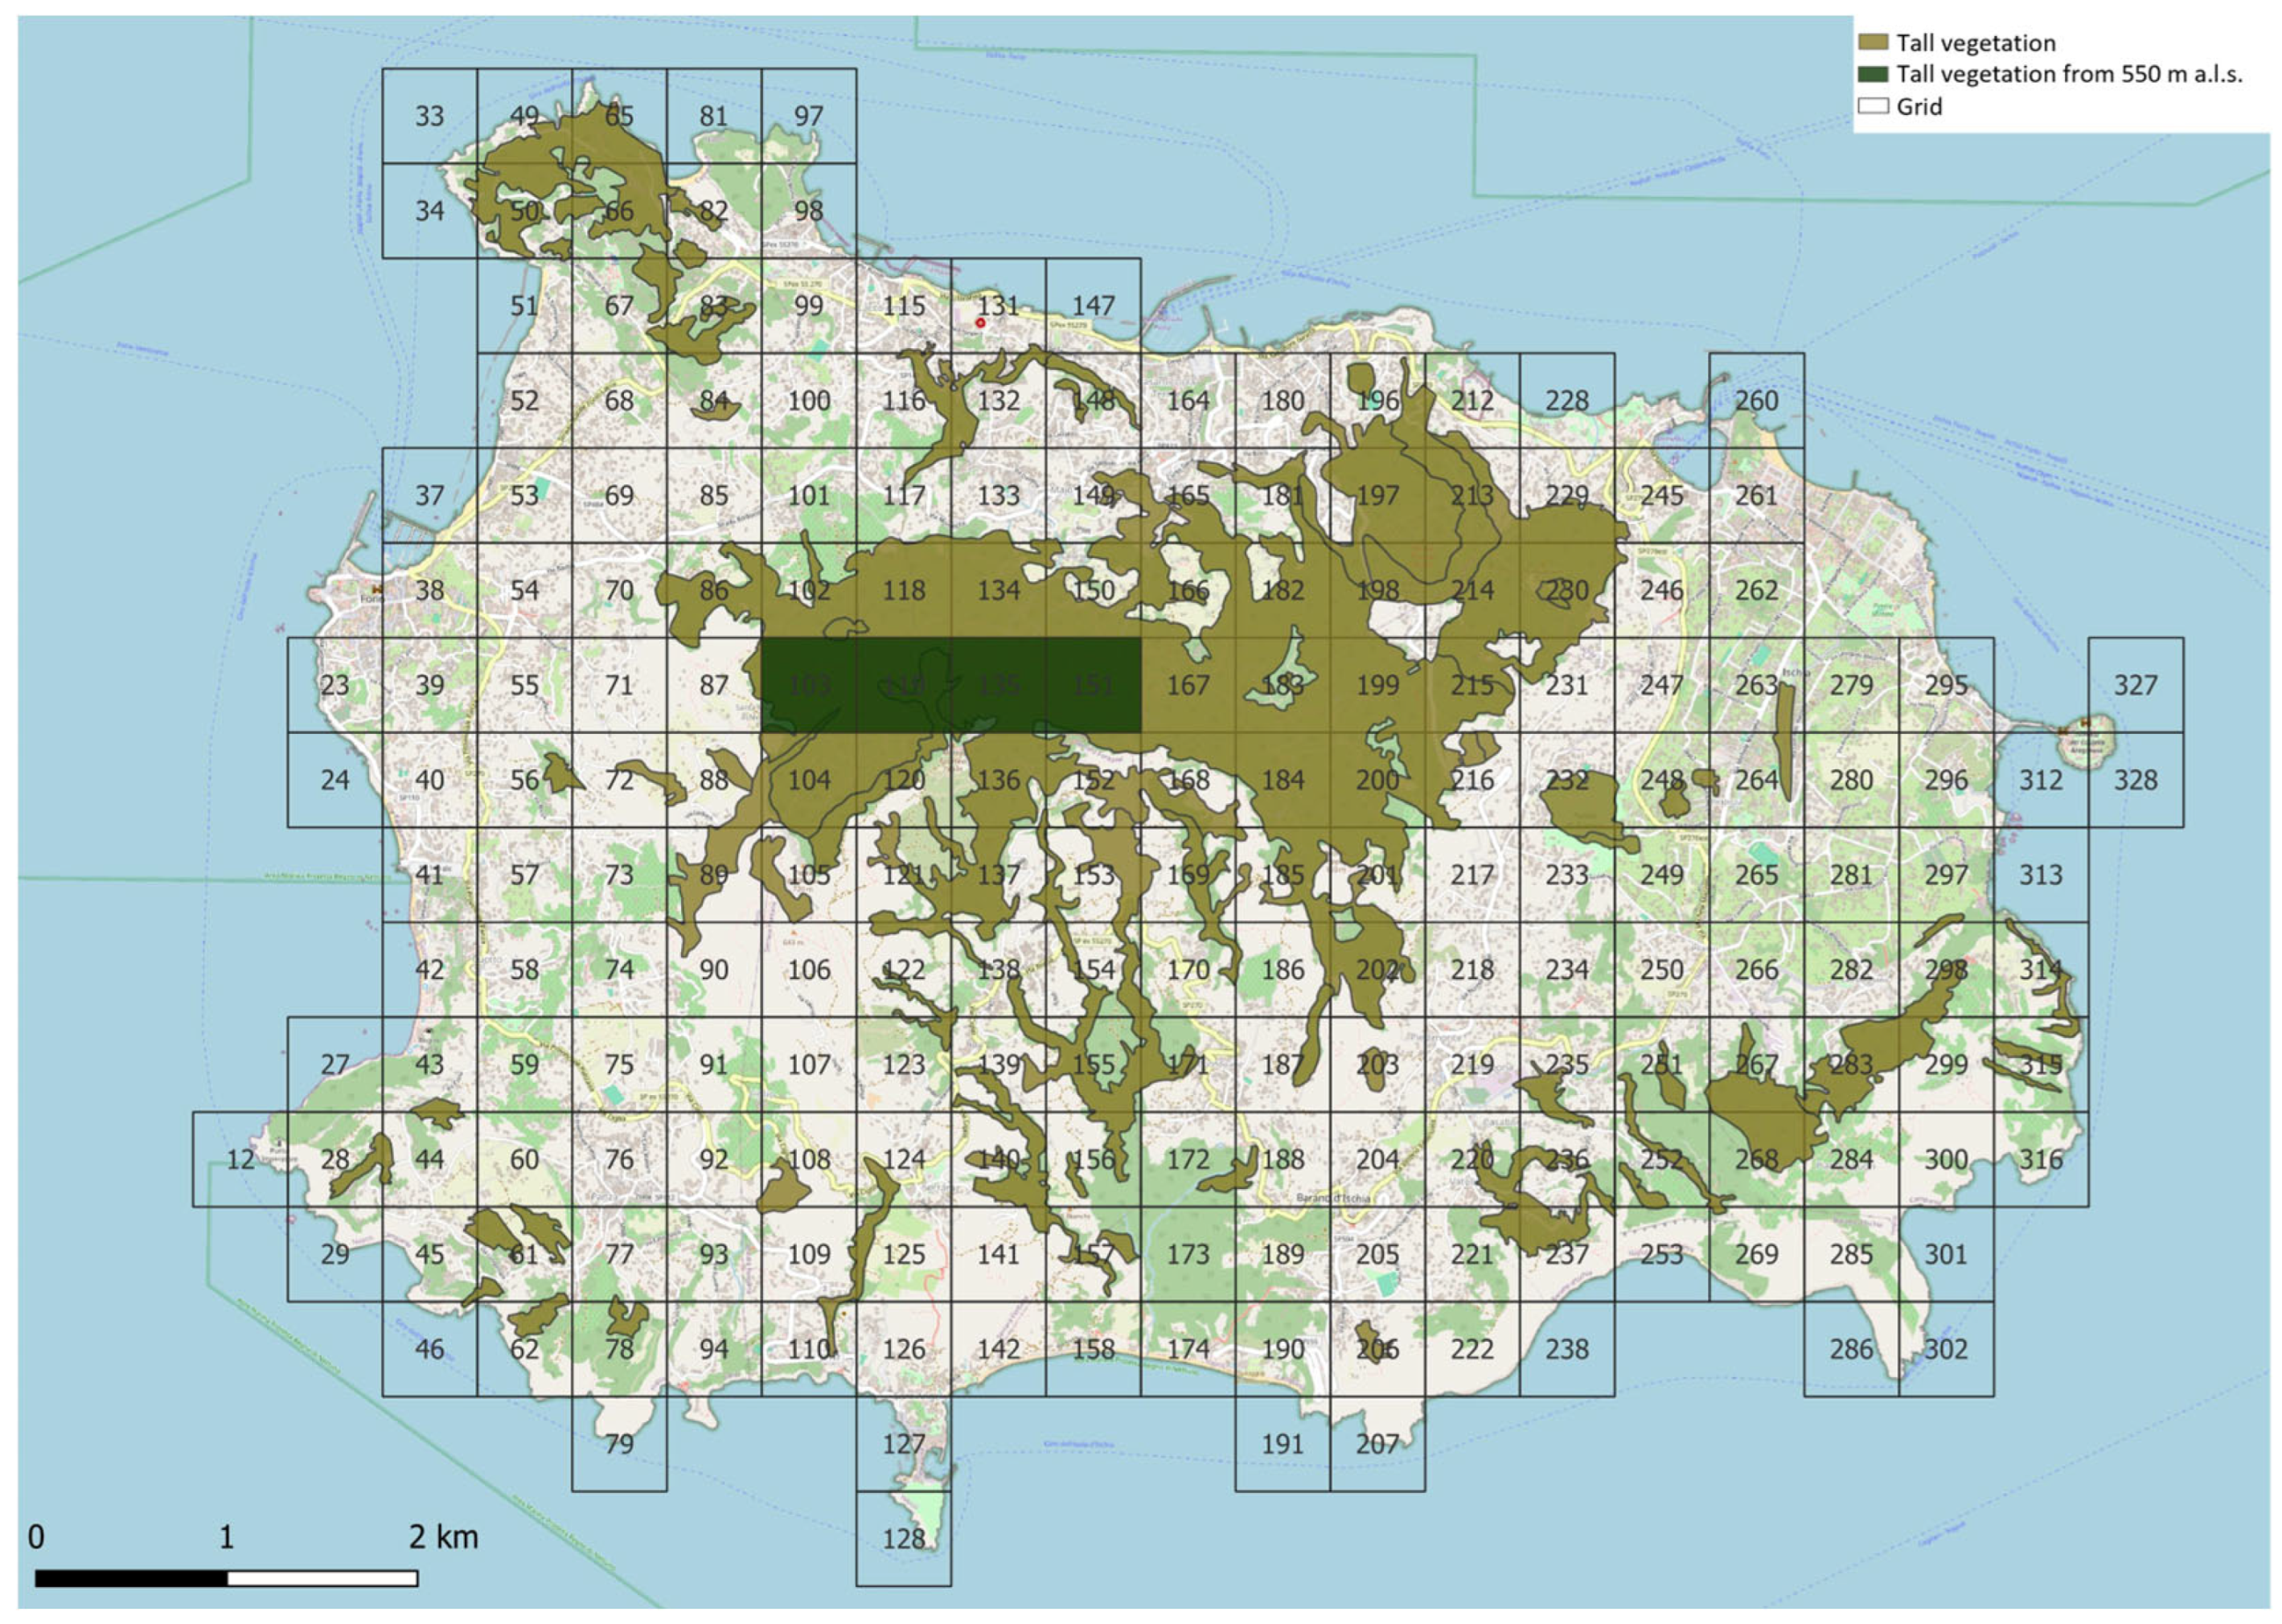
- Tall vegetation (β3): 30 ignition points—percentage of 22.73%
- Urban centers and assimilated areas (β4): 0 ignition points—percentage of 0.00%
- Cliffs, slopes, rock formations, quarries, and beaches (β5): 0 ignition points—percentage of 0.00%.
- permanent crops and vineyards (β(1) account for 3.72% of the ignition points.
- shrubs, bushy areas, and maquis (β2) show a higher percentage at 8.85%.
- high-stem vegetation (β3) is associated with 2.99% of the ignition points.
2.4. Poisson Distribution: Spacial–Temporal Analysis and Chi-Square Test
- vegetation type at the ignition point;
- closeness to road networks and/or trails, which may facilitate human access and thus potential ignition sources;
- urban–rural interface zones, where the close proximity of human infrastructure and natural areas increases the likelihood of fire ignition.
- n ∈ N represents the number of ignition points considered;
- represents the Poisson Hazard Rate, i.e., the average rate of events related to a specific area and a given time horizon
- represents the average waiting time expressed in years for an event, commonly referred to as the return period.
- K(0) = 0: counting of events starts from the initial moment;
- K(t) has independent increments;
- the number of events in any interval of length t > 0 has Poisson (λt) distribution (stationarity of increments);
- : in a very small time interval [0, h], the probability of a single event approaches in the limit;
- : in a small time interval [0, h], the probability of more than one single event approaches zero faster than h in the limit.
- : average specific rate of ignition points occurred in ;
- : number of times ignition points which occur in ;
- : number of years within the observation period during which ignition events were recorded across the homogeneous land cover class .
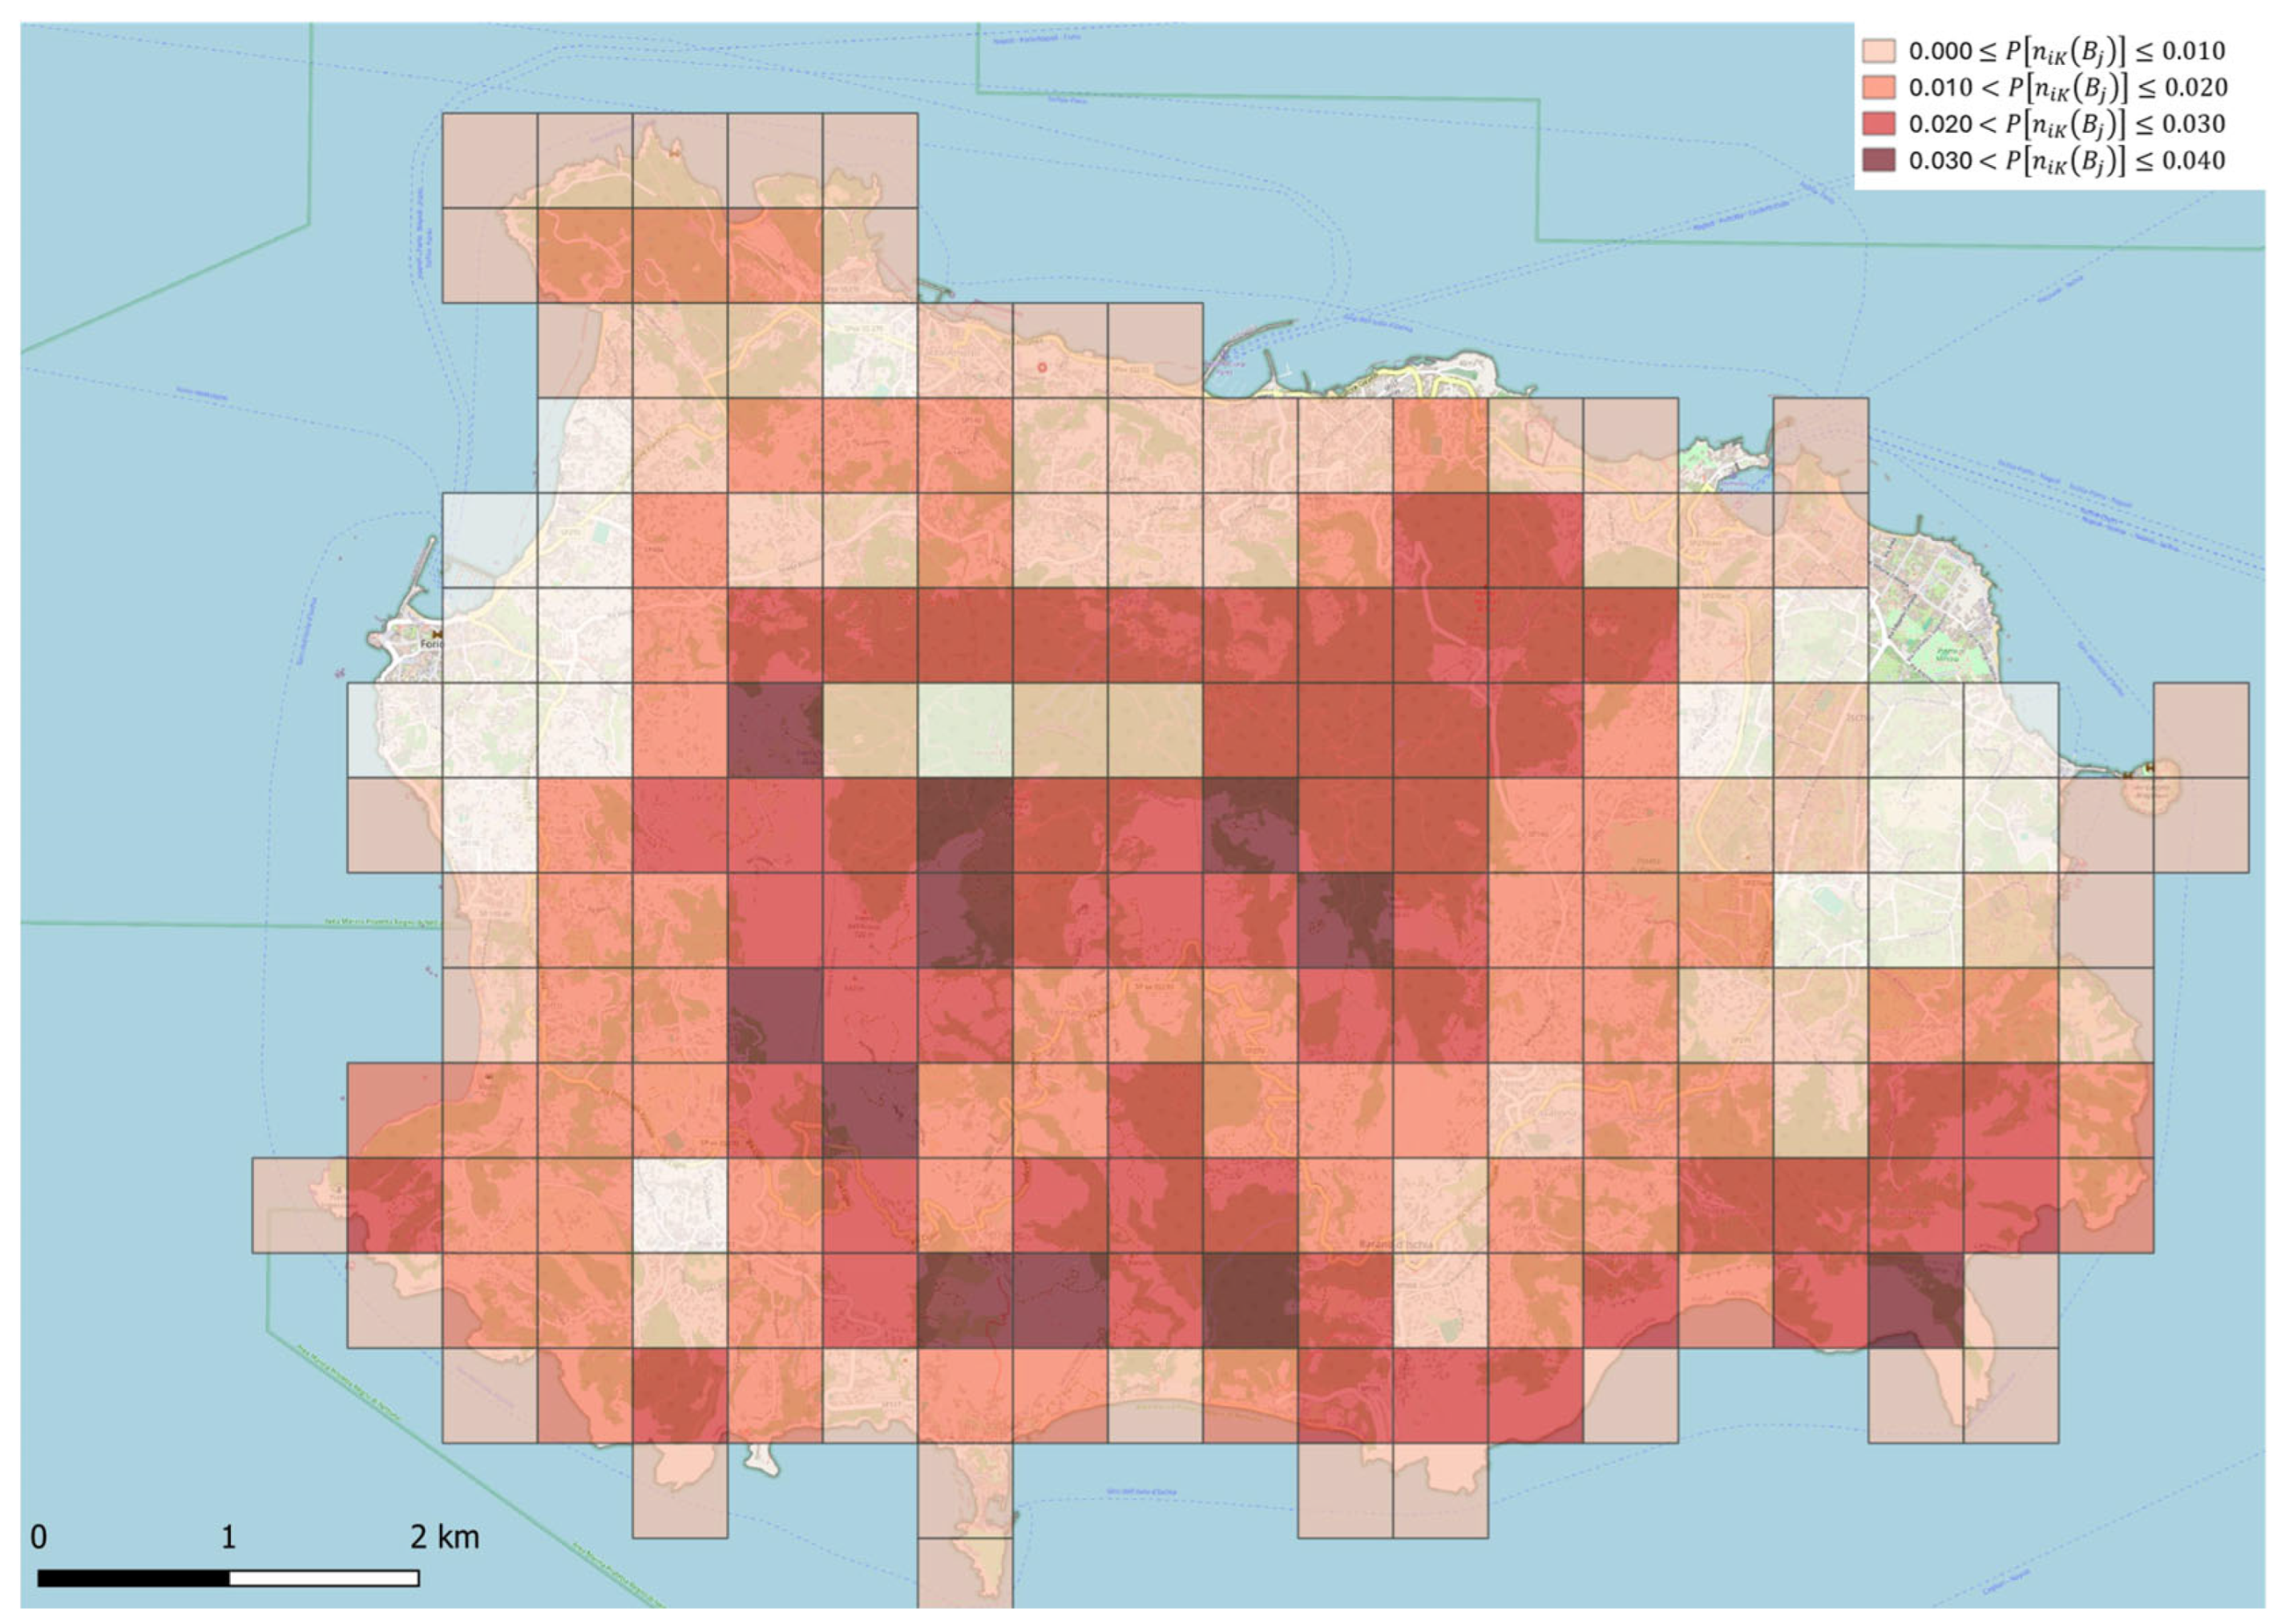
- : represents the sum of ignition points K for the homogeneous land cover class in the j-th cell;
- : represents the area occupied by the homogeneous land cover class within the j-th cell, that is, the total area of the considered homogeneous land cover class.
Application to the Case Study
- : for the homogeneous land cover class designated as “permanent crops and vineyards” encompassing a total area of 1500.01 ha
- : for the homogeneous land cover class designated as “Shrublands, bushes, and scrublands” encompassing a total area of 518.69 ha
- : for the homogeneous land cover class designated as “Tall vegetation” encompassing a total area of 988.08 ha.
- “permanent crops and vineyards” : 56
- “Shrublands, bushes, and scrublands” : 46
- “Tall vegetation” : 30.
- spatial validation of parameter ;
- temporal validation of parameter .
3. Results
4. Discussion
5. Conclusions
Author Contributions
Funding
Data Availability Statement
Acknowledgments
Conflicts of Interest
References
- Ager, A. Improving the evaluation of spatial optimization models for prioritizing landscape restoration and wildfire risk reduction investments. J. Environ. Manag. 2024, 360, 121001. [Google Scholar] [CrossRef] [PubMed]
- Russell, A.; Fontana, N.; Hoecker, T.; Kamanu, A.; Majumder, R.; Stephens, J.; Young, A.M.; Cravens, A.E.; Giardina, C.; Hiers, K.; et al. A fire-use decision model to improve the United States’ wildfire management and support climate change adaptation. Cell Rep. Sustain. 2024, 1, 100125. [Google Scholar] [CrossRef]
- Balik, J.A.; Coop, J.D.; Krawchuk, M.A.; Naficy, C.E.; Parisien, M.A.; Parks, S.A.; Stevens-Rumann, C.S.; Whitman, E. Biogeographic patterns of daily wildfire spread and extremes across North America. Front. For. Glob. Change 2024, 7, 1355361. [Google Scholar] [CrossRef]
- Thompson, J.R.; Thomas, A. Spies, Vegetation and weather explain variation in crown damage within a large mixed-severity wildfire. For. Ecol. Manag. 2009, 258, 1684–1694. [Google Scholar] [CrossRef]
- Bakhshaii, A.; Johnson, E.A. A review of a new generation of wildfire–atmosphere modeling. Can. J. For. Res. 2019, 49, 565–574. [Google Scholar] [CrossRef]
- Tang, W.; He, C.; Emmons, L.; Zhang, J. Global expansion of wildland-urban interface (WUI) and WUI fires: Insights from a multiyear worldwide unified database (WUWUI). Environ. Res. Lett. 2024, 19, 044028. [Google Scholar] [CrossRef]
- Ager, A.A.; Preisler, H.K.; Arca, B.; Spano, D.; Salis, M. Wildfire risk estimation in the Mediterranean area. Environmetrics 2014, 25, 384–396. [Google Scholar] [CrossRef]
- Shive, K.L.; Sieg, C.H.; Fulé, P.Z. Pre-wildfire management treatments interact with fire severity to have lasting effects on post-wildfire vegetation response. For. Ecol. Manag. 2013, 297, 75–83. [Google Scholar] [CrossRef]
- Valle Seijo, M.F.; Micheletti, M.I.; Otero, L.A.; Piacentini, R.D. Atmospheric pollutants in Rosario, Argentina analysed through remote sensing: Wildfires and COVID-19 lockdown effects. Remote Sens. Appl. Soc. Environ. 2024, 36, 101326. [Google Scholar] [CrossRef]
- Bento-Gonçalves, A.; Vieira, A.; Santos, S.M.d. Research on Wildfires, Soil Erosion and Land Degradation in the XXI Century. Fire 2024, 7, 327. [Google Scholar] [CrossRef]
- Borja, M.E.L.; Plaza-Álvarez, P.A.; Carmona Yáñez, M.D.; Miralles, I.; Ortega, R.; Soria, R.; Candel-Pérez, D.; Zema, D.A. Long-term evaluation of soil functionality in Mediterranean forests after a wildfire and post-fire hillslope stabilization. For. Ecol. Manag. 2024, 555, 121715. [Google Scholar] [CrossRef]
- Abdollahi, M.; Vahedifard, F.; Leshchinsky, B.A. Hydromechanical modeling of evolving post-wildfire regional-scale landslide susceptibility. Eng. Geol. 2024, 335, 107538. [Google Scholar] [CrossRef]
- Guiomar, N.; Godinho, S.; Fernandes, P.M.; Machado, R.; Neves, N.; Fernandes, J.P. Wildfire patterns and landscape changes in Mediterranean oak woodlands. Sci. Total Environ. 2015, 536, 338–352. [Google Scholar] [CrossRef] [PubMed]
- Vogiatzoglou, K.; Papadimitriou, C.; Ampountolas, K.; Chatzimanolakis, M.; Koumoutsakos, P.; Bontozoglou, V. An interpretable wildfire spreading model for real-time predictions. J. Comput. Sci. 2024, 83, 102435. [Google Scholar] [CrossRef]
- Liu, N. Wildland surface fire spread: Mechanism transformation and behavior transition. Fire Saf. J. 2023, 141, 103974. [Google Scholar] [CrossRef]
- Bhatt, S.; Chouhan, U. An enhanced method for predicting and analysing forest fires using an attention-based CNN model. J. For. Res. 2024, 35, 67. [Google Scholar] [CrossRef]
- Jain, P.; Coogan, S.C.P.; Subramanian, S.G.; Crowley, M.; Taylor, S.; Flannigan., M.D. A review of machine learning applications in wildfire science and management. Environ. Rev. 2020, 28, 478–505. [Google Scholar] [CrossRef]
- Gonzalo, S.; Fuentes, A.; Valdivia, A.; Auat-Cheein, F.; Reszka, P. Assessing wildfire risk to critical infrastructure in central Chile: Application to an electrical substation. International J. Wildland Fire 2024, 33, WF22113. [Google Scholar] [CrossRef]
- Arango, E.; Jiménez, P.; Nogal, M.; Sousa, H.S.; Steward, M.G.; Matos, J.C. Enhancing infrastructure resilience in wildfire management to face extreme events: Insights from the Iberian Peninsula. Clim. Risk Manag. 2024, 44, 100595. [Google Scholar] [CrossRef]
- Ndalila, M.N.; Lala, F.; Makindi, S.M. Community perceptions on wildfires in Mount Kenya forest: Implications for fire preparedness and community wildfire management. Fire Ecol. 2024, 20, 92. [Google Scholar] [CrossRef]
- Sun, Y.; Forrister, A.; Kuligowski, E.D.; Lovreglio, R.; Cova, T.J.; Zhao, X. Social vulnerabilities and wildfire evacuations: A case study of the 2019 Kincade fire. Saf. Sci. 2024, 176, 106557. [Google Scholar] [CrossRef]
- Galiana-Martín, L. Spatial Planning Experiences for Vulnerability Reduction in the Wildland-Urban Interface in Mediterranean European Countries. Eur. Countrys. 2017, 9, 577–593. [Google Scholar] [CrossRef]
- Elhami-Khorasani, N.; Ebrahimian, H.; Buja, L.; Cutter, S.L.; Kosovic, B.; Lareau, N.; Meacham, B.J.; Rowell, E.; Taciroglu, E.; Thompson, M.P.; et al. Conceptualizing a probabilistic risk and loss assessment framework for wildfires. Nat. Hazards 2022, 114, 1153–1169. [Google Scholar] [CrossRef]
- Borisova, B.; Todorova, E.; Ihtimanski, I.; Glushkova, M.; Zhiyanski, M.; Georgieva, M.; Dimitrov, S. Wildfire risk assessment and mapping–an approach for Natura 2000 forest sites. Trees. For. People 2024, 16, 100532. [Google Scholar] [CrossRef]
- Caron, N.; Guyeux, C.; Aynes, B. Predicting wildfire events with calibrated probabilities. In Proceedings of the 2024 16th International Conference on Machine Learning and Computing (ICMLC ‘24), Shenzhen, China, 2–5 February 2024; Association for Computing Machinery: New York, NY, USA, 2024; pp. 168–175. [Google Scholar] [CrossRef]
- Liz-López, H.; Huertas-Tato, J.; Pérez-Aracil, J.; Casanova-Mateo, C.; Sanz-Justo, J.; Camacho, D. Spain on Fire: A novel wildfire risk assessment model based on image satellite processing and atmospheric information. Knowl. Based Syst. 2024, 283, 111198. [Google Scholar] [CrossRef]
- Arima, S.; Calculli, C.; Pollice, A. A Zero-inflated Poisson spatial model with misreporting for wildfire occurrences in southern Italian municipalities. Environmetrics 2025, 36, e2853. [Google Scholar] [CrossRef]
- Keeping, T.; Harrison, S.P.; Prentice, I.C. Modelling the daily probability of wildfire occurrence in the contiguous United States. Environ. Res. Lett. 2024, 19, 024036. [Google Scholar] [CrossRef]
- Gonzalez-Mathiesen, C. Challenges in Developing Wildfire Understanding from Wildfire Information through Spatial Planning Processes. Sustainability 2024, 16, 420. [Google Scholar] [CrossRef]
- Wei, G.; Qiu, F.; Liu, X. Convolutional Non-Homogeneous Poisson Process and its Application to Wildfire Ignition Risk Quantification for Power Delivery Networks. Technometrics 2024, 1–19. [Google Scholar] [CrossRef]
- Papakosta, P.; Straub, D. Probabilistic prediction of daily fire occurrence in the Mediterranean with readily available spatio-temporal data. Iforest Biogeosci. For. 2016, 10, 32. [Google Scholar] [CrossRef]
- Services Dedicated to Municipalities: Fire Register. Geoportal of the Campania Region: Territorial Information System of the Campania Region. Available online: https://sit2.regione.campania.it/servizio/catasto-incendi (accessed on 10 July 2024).
- AUTOCAD Software. Available online: https://www.autodesk.com/it/products/autocad/overview?term=1-YEAR&tab=subscription (accessed on 10 July 2024).
- QGIS Software. Available online: http://qgis.osgeo.org (accessed on 10 July 2024).
- Tarquini, S.; Isola, I.; Favalli, M.; Battistini, A.; Dotta, G. TINITALY, a Digital Elevation Model of Italy with a 10 Meters Cell Size (Version 1.1) National Institute of Geophysics and Volcanology (INGV) 2023. Available online: https://tinitaly.pi.ingv.it/ (accessed on 10 July 2024).
- Bagnaia, R.; Viglietti, S.; Laureti, L.; Giacanelli, V.; Ceralli, D.; Bianco, P.M.; Loreto, A.; Luce, E.; Fusco, L. Nature Map of the Campania Region: Habitat Map at a 1:25,000 Scale; ISPRA: Campania, Italy, 2017. [Google Scholar]
- Seitz, J.; Zhong, S.; Charney, J.J.; Heilman, W.E.; Clark, K.E.; Bian, X.; Skowronski, N.S.; Gallagher, M.R.; Patterson, M.; Cole, J.; et al. Atmospheric turbulence observed during a fuel-bed-scale low-intensity surface fire. Atmos. Chem. Phys. 2024, 24, 1119–1142. [Google Scholar] [CrossRef]
- Finney, M.A.; Cohen, J.D.; McAllister, S.S.; Jolly, W.M. On the need for a theory of wildland fire spread. Int. J. Wildland Fire 2013, 22, 25–36. [Google Scholar] [CrossRef]
- Bradley, D.R.; Bradley, T.D.; McGrath, S.G.; Cutcomb, S.D. Type I error rate of the chi-square test in independence in R × C tables that have small expected frequencies. Psychol. Bull. 1979, 86, 1290–1297. [Google Scholar] [CrossRef]
- Berardi, D.; Galuppi, M.; Libertà, A.; Lombardi, M. Geostatistical Modeling of Wildfire Occurrence Probability: The Case Study of Monte Catillo Natural Reserve in Italy. Fire 2023, 6, 427. [Google Scholar] [CrossRef]
- Lewis, D.; Burke, C.J. The use and misuse of the chi-square test. Psychol. Bull. 1949, 46, 433–489. [Google Scholar] [CrossRef]
- Coogan Sean, C.P.; Xinli, C.; Piyush, J.; Flannigan, M.D. Seasonality and trends in human- and lightning-caused wildfires ≥ 2 ha in Canada, 1959–2018. Int. J. Wildland Fire 2020, 29, 473–485. [Google Scholar] [CrossRef]


| Vegetation Type | Area (ha) |
|---|---|
| Bramble | 138.56 |
| Mesomediterranean scrub | 70.21 |
| Vineyards | 1157.92 |
| Thermomediterranean oak forests | 400.19 |
| Garrigue | 110.79 |
| Chestnut woods | 538.68 |
| Pine forests | 64.54 |
| Scrub | 172.66 |
| Extensive crops and complex agricultural systems | 339.41 |
| Broom fields | 4.63 |
| Reed beds and other formations dominated by helophytes | 22.96 |
| Orchards | 6.48 |
| () | Vegetation Type | Area (ha) |
|---|---|---|
| Permanent crops and vineyards ( |
| 1500.01 |
| Shrublands, thickets, and scrub ( |
| 518.69 |
| Tall vegetation ( |
| 988.08 |
| Urban areas and others ( |
| 1458.45 |
| Cliffs, slopes, rock formations, quarries, and beaches ( | 143.94 |
| () | Degree of Freedom | Threshold Value | Value | Test Result | |
|---|---|---|---|---|---|
| Permanent crops and vineyards ( | 4 | positive | |||
| Shrublands, thickets, and scrub ( | 3 | positive | |||
| Tall vegetation ( | 2 | positive |
| 2009 | 2010 | 2011 | 2012 | 2013 | 2014 | 2015 | 2016 | 2017 | 2018 | 2019 | 2020 | 2021 | 2022 | 2023 | |
|---|---|---|---|---|---|---|---|---|---|---|---|---|---|---|---|
| 3 | 4 | 4 | 6 | 5 | 1 | 6 | 2 | 15 | / | 3 | / | 6 | / | 1 | |
| 3 | 6 | 6 | 5 | 1 | 1 | 2 | 3 | 6 | / | / | 1 | 4 | 5 | 3 | |
| 8 | 1 | 3 | 5 | 1 | 1 | 1 | 1 | 3 | / | 4 | / | / | 1 | 1 |
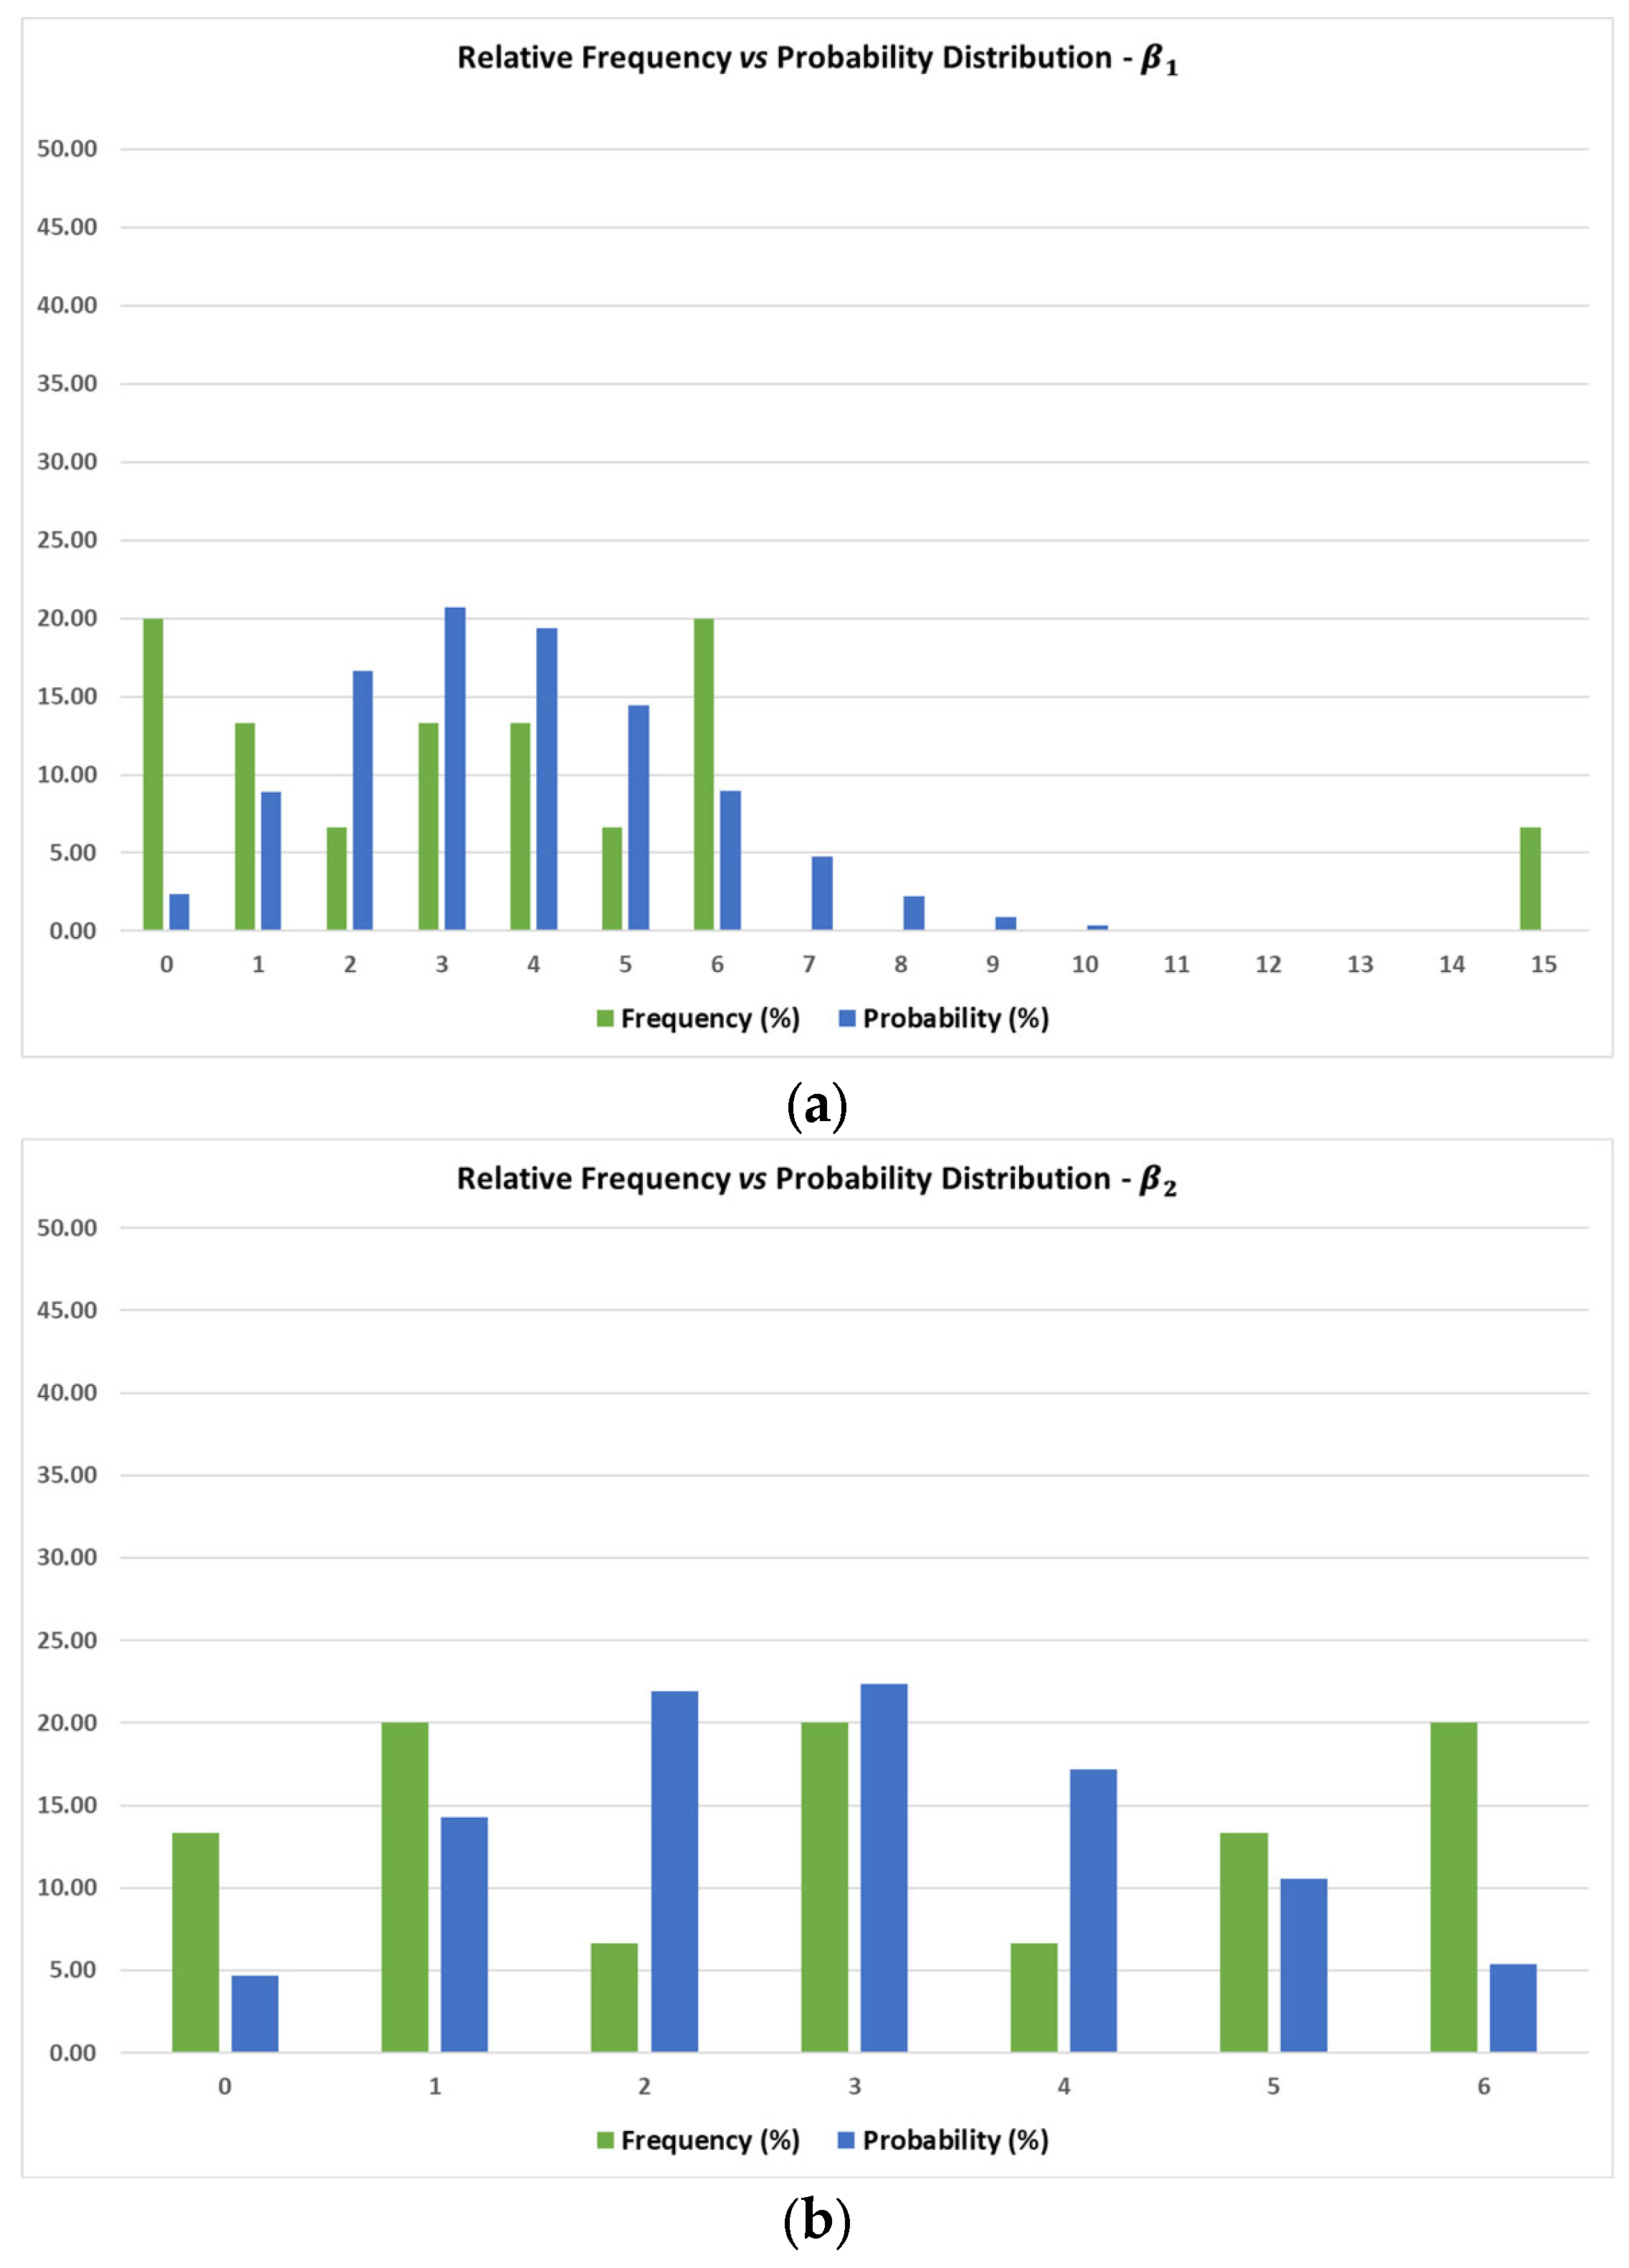
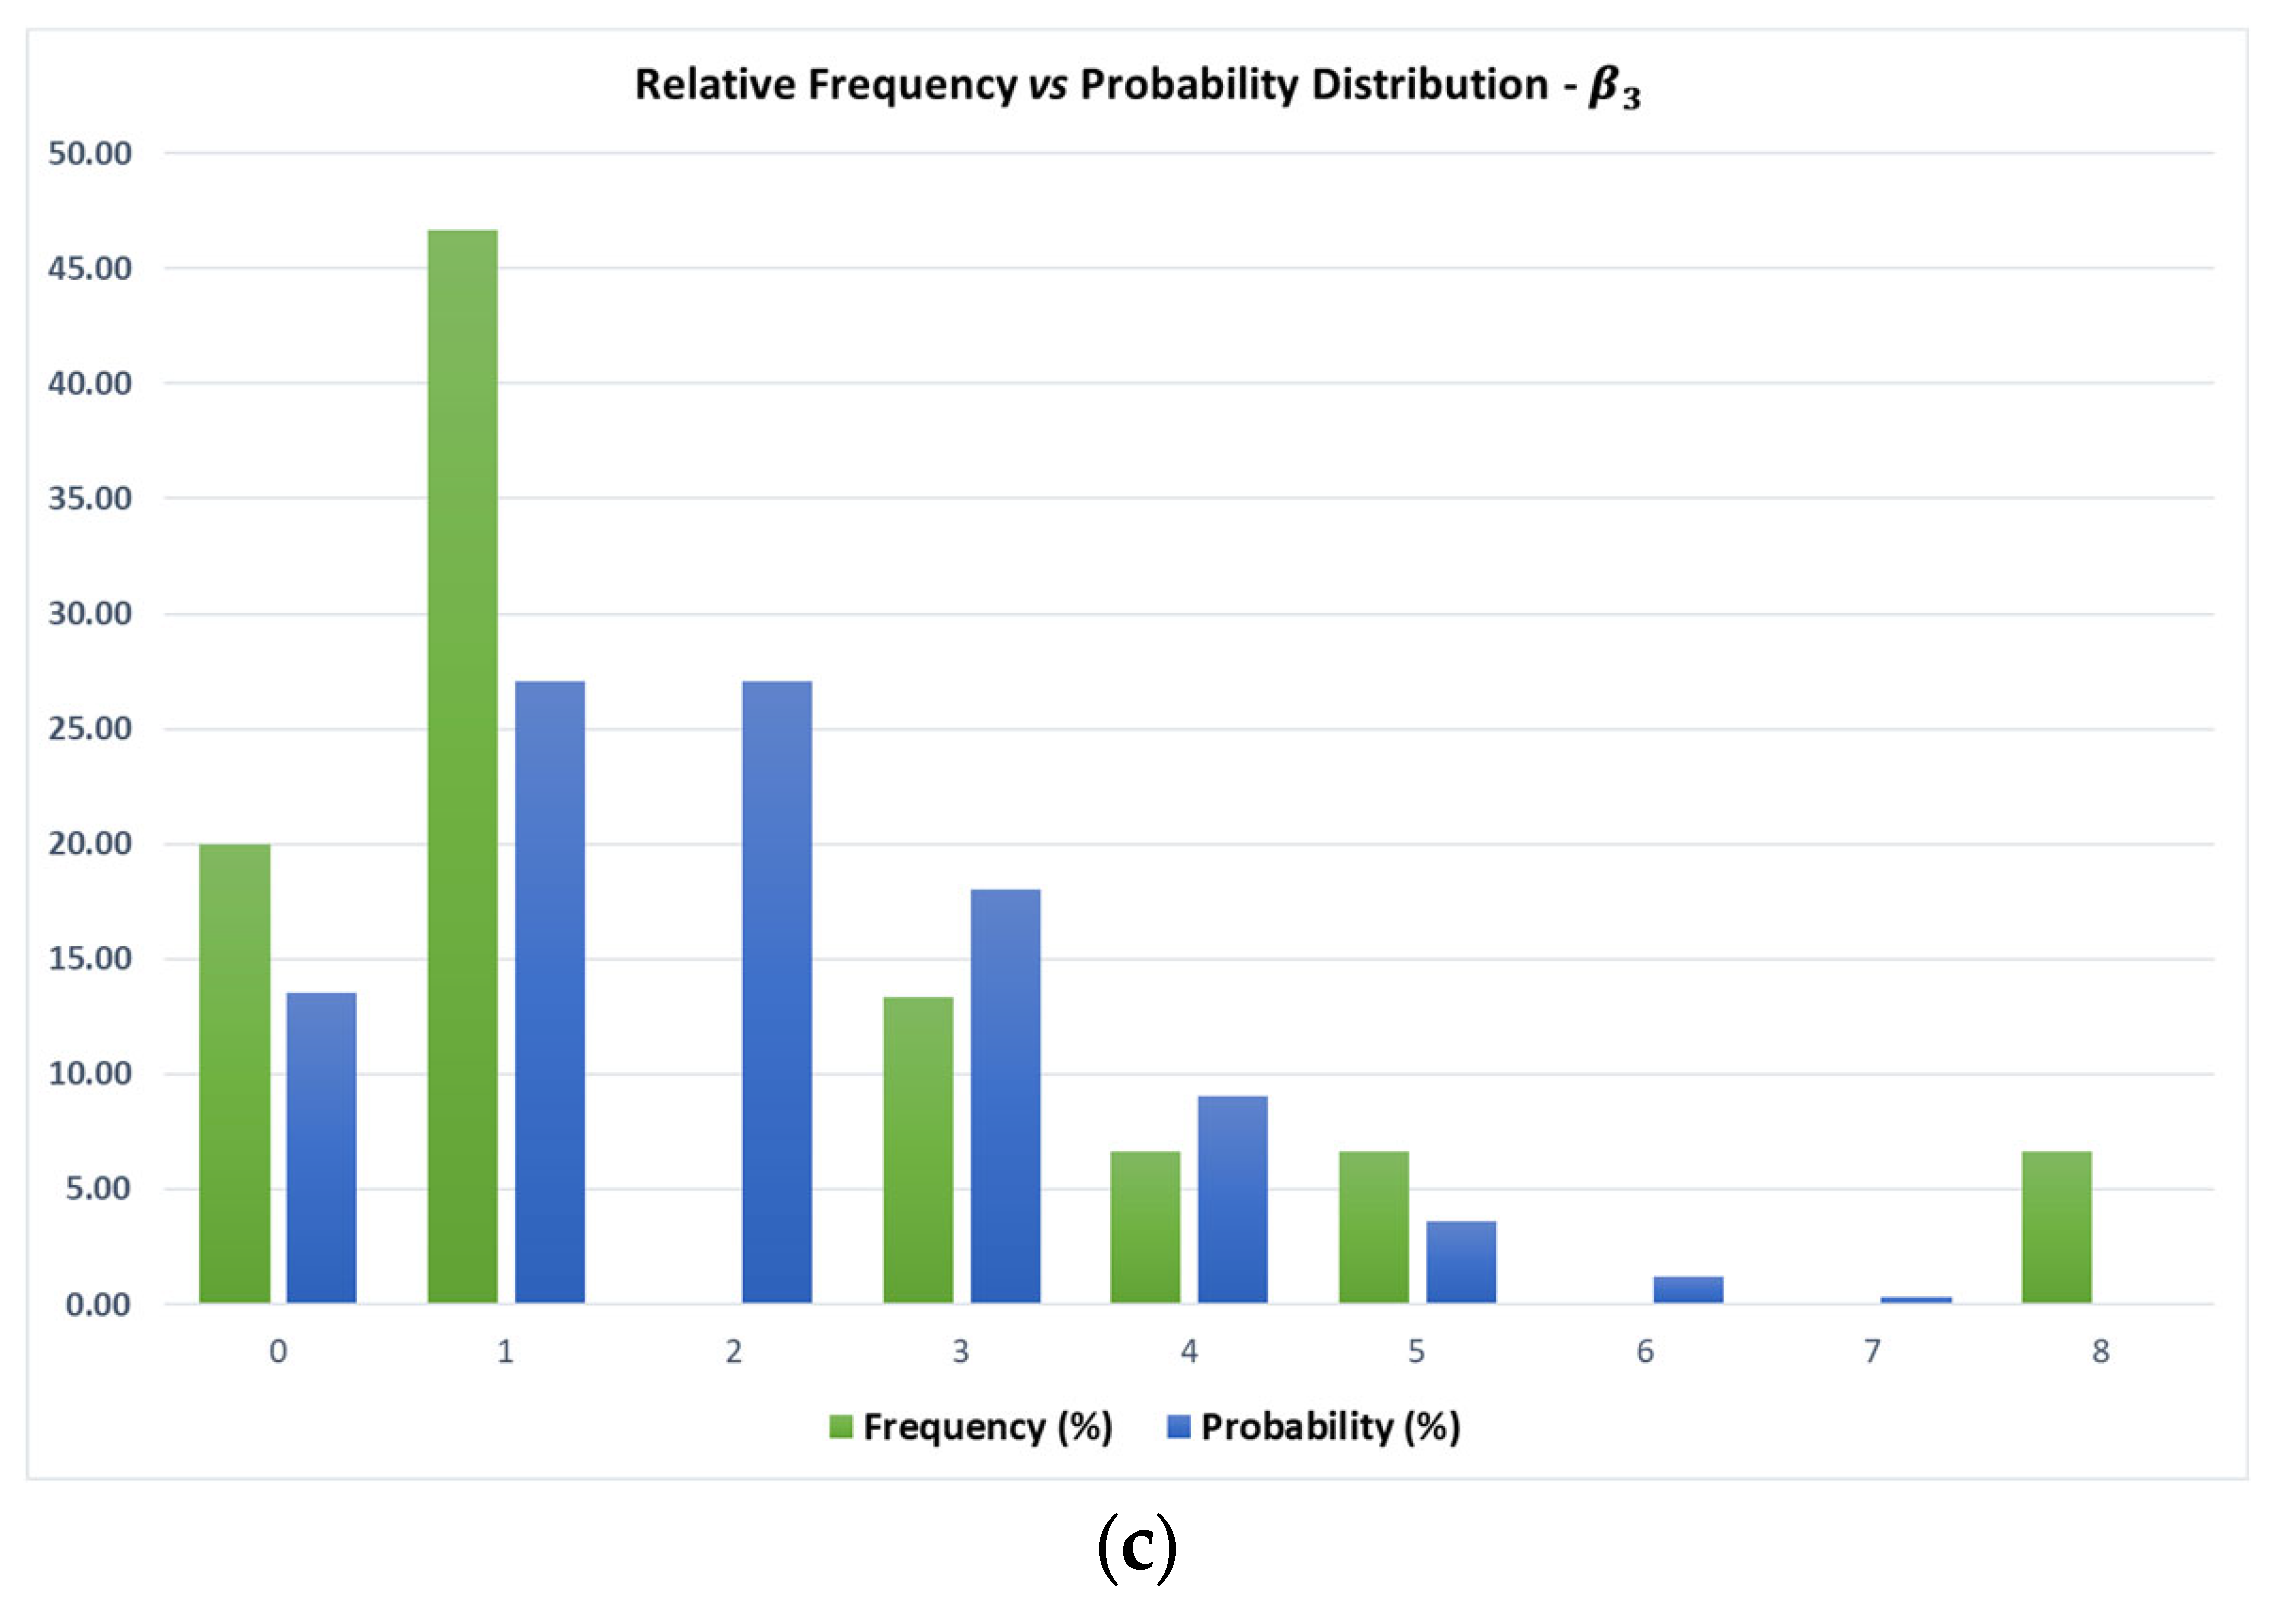
| () | Degree of Freedom | Threshold Value | Value | Test Result | |
|---|---|---|---|---|---|
| Permanent crops and vineyards ( | 6 | 12.592 | 1.903 | positive | |
| Shrublands, thickets, and scrub ( | 3.0667 | 5 | 11.071 | 3.046 | positive |
| Tall vegetation ( | 2.0000 | 4 | 9.488 | 6.929 | positive |
| () | |||
|---|---|---|---|
| Permanent crops and vineyards ( | 1.02 | ||
| Shrublands, thickets, and scrub ( | 1.05 | ||
| Tall vegetation ( | 1.16 |
Disclaimer/Publisher’s Note: The statements, opinions and data contained in all publications are solely those of the individual author(s) and contributor(s) and not of MDPI and/or the editor(s). MDPI and/or the editor(s) disclaim responsibility for any injury to people or property resulting from any ideas, methods, instructions or products referred to in the content. |
© 2025 by the authors. Licensee MDPI, Basel, Switzerland. This article is an open access article distributed under the terms and conditions of the Creative Commons Attribution (CC BY) license (https://creativecommons.org/licenses/by/4.0/).
Share and Cite
Berardi, D.; Galuppi, M.; Libertà, A.; Lombardi, M. Forecasting of Wildfire Probability Occurrence: Case Study of a Mediterranean Island of Italy. Land 2025, 14, 277. https://doi.org/10.3390/land14020277
Berardi D, Galuppi M, Libertà A, Lombardi M. Forecasting of Wildfire Probability Occurrence: Case Study of a Mediterranean Island of Italy. Land. 2025; 14(2):277. https://doi.org/10.3390/land14020277
Chicago/Turabian StyleBerardi, Davide, Marta Galuppi, Angelo Libertà, and Mara Lombardi. 2025. "Forecasting of Wildfire Probability Occurrence: Case Study of a Mediterranean Island of Italy" Land 14, no. 2: 277. https://doi.org/10.3390/land14020277
APA StyleBerardi, D., Galuppi, M., Libertà, A., & Lombardi, M. (2025). Forecasting of Wildfire Probability Occurrence: Case Study of a Mediterranean Island of Italy. Land, 14(2), 277. https://doi.org/10.3390/land14020277