Abstract
Abundant and diverse urban bird communities promote ecosystem and human health in cities. However, the estimation of bird community structure requires large amounts of resources. On the other hand, calculating remotely sensed spectral indices is cheap and easy. Such indices are directly related to vegetation cover, built-up cover, and temperature, factors that also affect the presence and abundance of bird species in urban areas. Therefore, spectral indices can be used as proxies of the structure of urban bird communities. We estimated the abundance, taxonomic, functional, and phylogenetic diversity of the bird community at each of 18 50 m radius survey stations in the urban core area of Kavala, Greece. We also calculated eight spectral indices (means and standard deviations, SDs) around survey stations at 50 m, 200 m, and 500 m spatial scales. The land surface temperature SD (LST) was the most important proxy, positively related to bird abundance at the 50 m and 200 m spatial scales. At the same time, the mean green normalized difference vegetation index (GNDVI) was the most important proxy, negatively related to abundance at the 500 m spatial scale. Means and SDs of vegetation indices, such as the normalized difference vegetation index (NDVI), enhanced vegetation index (EVI2), soil-adjusted vegetation index (SAVI), and atmospherically resistant vegetation index (ARVI), were the most important proxies, positively related to taxonomic and functional diversity at all the spatial scales. The mean and SDs of LST, normalized difference moisture index (NDMI), and normalized difference built-up index (NDBI) variously affected taxonomic and functional diversity. The mean and SDs of LST were the best proxies of phylogenetic diversity at the 50 m and 500 m spatial scales, while the SDs of NDBI and NDMI were the best proxies at the 200 m spatial scale. The results suggest that several spectral indices can be used as reliable proxies of various facets of urban bird diversity. Using such proxies is an easy and efficient way of informing successful urban planning and management.
1. Introduction
Urban areas have occupied formerly natural areas, resulting in the loss of local species populations [1]. On the other hand, urban areas host important diversity, especially of birds, including endemic and threatened species [1]. In urban areas, the replacement of native, urban-avoider bird species by sometimes non-native, dweller species; the exclusion of migrants; and the constant provision of resources, such as food and habitat, often lead to spatial and temporal homogenization in bird composition [2]. Also, high bird diversity and richness in urban green spaces have been connected with increased happiness and decreased stress and anxiety [3]. Therefore, bird diversity is important for both ecosystem stability and human health. The study of bird community structure is necessary to provide urban planners and wildlife managers with critical information for designing, creating, and maintaining bird-diverse urban green spaces [4,5,6].
Diversity has several facets, including taxonomic, functional, and phylogenetic diversity [7]. Taxonomic diversity refers to the abundance and richness of different taxonomic groups and the distribution and relationships among taxa, such as species, genera, families, and higher-level classifications within an area [8,9,10]. Higher taxonomic diversity implies richer, resilient ecosystems and has been widely used for protecting threatened species and areas with many species [4,5,6]. Functional diversity refers to the variety of biological traits and functions of species in a community [11,12,13]. It focuses on species’ roles in ecosystems and ecosystem processes and not on the number of species or their genetic relationships. Phylogenetic diversity measures how closely or distantly related species are on the tree of life, thus providing an understanding of the evolutionary relationships among these species [14,15,16,17]. This biotic homogenization affects all aspects of diversity. Urbanization has caused an overall decrease in taxonomic, functional, and phylogenetic diversity [1,18,19,20] in bird communities. Therefore, all facets of bird diversity should be examined to identify species and areas that face threats or hold important taxon richness, functional traits, and phylogenetic history for establishing conservation priorities.
The amount of vegetation cover and built-up areas are among the most important factors affecting bird abundance, richness, and diversity in urban green spaces [1,4,5,6,21]. However, the monitoring of bird communities and the measurement of environmental variables require time and trained personnel, hence large and constant funding, which is not always available. In contrast, acquiring satellite images is cheap, and calculating remotely sensed spectral indices is easy. Such indices have proven important for predicting various facets of the structure of urban bird communities [22,23,24]. The normalized difference vegetation index (NDVI) is the most used spectral index to evaluate vegetation attributes, such as canopy phenology, leaf area, and primary production [25,26]. Many studies have found that NDVI is positively associated with urban bird communities’ abundance, richness, and diversity [22,24,26,27,28,29,30]. The enhanced vegetation index (EVI) is another spectral index used to evaluate vegetation. NDVI and EVI are very similar, but the latter is more effective in low and high vegetation cover and less effective in hilly topography [31,32]. EVI has been used much less often than NDVI as proxies of bird community structure, both in natural areas [33,34,35,36] and urban areas [23]. Variants to NDVI and EVI include the green normalized difference vegetation index (GNDVI) [37], soil-adjusted vegetation index (SAVI) [38,39], atmospherically resistant vegetation index (ARVI) [40,41], and normalized difference moisture index (NDMI) [42]. Among these indices, only SAVI has been used for inferring bird richness and distribution during migration [43,44]. The normalized difference built-up index (NDBI) is an index used to identify urban and built-up areas from satellite imagery [45]. Gray infrastructure cover has been reported as a good predictor of bird diversity in urban areas [4,6,46,47,48]. However, NDBI has not been used as a proxy for bird community structure. Land surface temperature (LST) can change significantly inside a relatively small heterogeneous urban area and is measured by satellites that use thermal infrared sensors [49]. Differences in LST are closely connected to differences in vegetation density. They can be especially useful in the heterogeneous urban landscape with the great difference in temperature between green and gray infrastructure [50]. However, this index has not been used very often to infer bird diversity [33,43,51,52]. Means and standard deviations (SDs) of spectral indices are mainly used as proxies of bird community structure. SD values are surrogates of habitat heterogeneity, and previous studies have found a positive association between vegetation heterogeneity in a given space and bird diversity [23,53].
The aim of this study was to examine if several spectral indices measuring vegetation cover, built-up cover, and temperature can be used as proxies of the taxonomic, functional, and phylogenetic diversity of the urban bird community in Kavala, Greece. Inferring various facets of bird community structure in urban areas through cheap and easily retrieved and measured methods is critical for their effective conservation management.
2. Materials and Methods
2.1. Study Area
The study was carried out in Kavala, Northern Greece (Figure 1). The urban area of the municipality of Kavala occupies about 8.0 km2 and has about 56,300 inhabitants [54]. It is delineated by a Turkish pine (Pinus brutia) forest to the north and the Aegean Sea to the south. Most green spaces of Kavala are smaller than 3 ha, except for the 17 ha Panagiouda pine woodland, including square gardens, playgrounds, hedgerows, and median road strips [6].
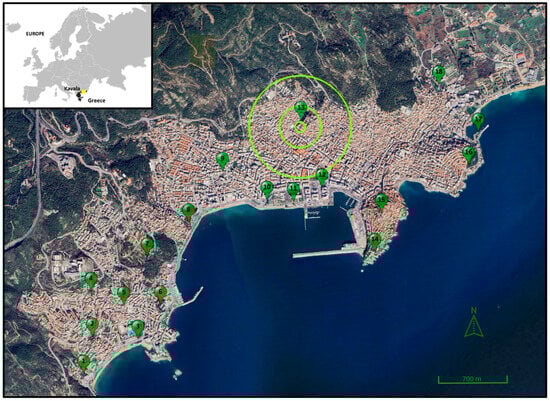
Figure 1.
Map of Kavala, Greece. Numbered pins indicate the survey stations (n = 18). Circles around station 13 show the 50 m, 200 m, and 500 m buffer zones (Google Earth: Data SIO, NOAA, U.S. Navy, NGA, GEBCO, Image © 2024 TerraMetrics, Image © 2024 Airbus; inset: GinkgoMaps).
2.2. Fieldwork
Birds were counted in 18 green spaces, including woodlands (5; survey stations 2, 5, 7, 8, and 16), square gardens (5; 1, 9, 11, 12, and 15), playgrounds (3; 3, 6, and 10), and median road strips (5; 4, 13, 14, 17, and 18) [6]. One survey station was located at the center of each green space and at least 250 m away from other stations to avoid counting a bird twice. Birds were counted within a 50 m radius from the survey station center [55]. We visited the survey stations in 2016—once in April, once in May, and once in June to cover the whole breeding season and avoid missing early or late nesters. Counts were carried out within four hours from dawn when birds were more active. When the observer (E.V.) arrived at the center of the station, he remained silent for 5 min and then counted birds for another 5 min [55]. Only one researcher carried out counts to avoid observer effects. Every bird seen within the 50 m radius was recorded. Birds flying overhead were counted only if connected to the green space (e.g., feeding, courting).
2.3. Bird Community Indices
Bird abundance, taxonomic, functional, and phylogenetic diversity indices were used to assess whether spectral indices can be used as proxies in the urban green spaces of Kavala. Abundance was estimated as the maximum number of individuals counted in each survey station during the three visits (Table S1).
Rarefied indices were used to measure taxonomic diversity because they account for the non-detectability of rare species: the Chao1 richness estimator, the probability of interspecific encounter index (PIE), and Shannon entropy (Shannon–Wiener index) (see Table 1 for definitions and Table S1 for data). The Chao1 estimator was calculated with the function ChaoSpecies and Shannon entropy with the function Diversity of the SpadeR R package [56], while the PIE index was calculated with the function calc_PIE of the mobr package in R [57].

Table 1.
Taxonomic, functional, and phylogenetic diversity indices used in this study.
Functional diversity was measured with the functional richness (FRic), functional evenness (FEve), functional divergence (FDiv), functional dispersion (FDis), and Rao’s quadratic entropy (Rao’s Q) indices (see Table 1 for definitions and Table S1 for data). Body mass, food type (seeds, fruits, vegetation, invertebrates, fish, mammals, birds, carrion), feeding substrate (water surface, water, ground, canopy, shrub, vegetation, air) (16 traits taken from the avian niche database of Pearman et al. [58]), and resident or migrant status (2 traits; see Table S2), totaling 18 traits, were used to measure functional diversity indices. All functional diversity indices were calculated with the function dbFD of the FD package in R 4.2.2 [13,59].
The community evolutionary distinctiveness (CED) and the maximum community evolutionary distinctiveness (maxCED) were used as measures of phylogenetic diversity (see Table 1 for definitions and Table S1 for data). The median ED score for each species was taken from the database in Jetz et al. [14], and the CED of each survey station was calculated as the mean ED for all species observed in the survey station [18]. The maxCED was the maximum value of ED in each survey station [20].
2.4. Remotely Sensed Spectral Indices
Eight remotely sensed spectral indices (mean values and standard deviations, SDs) were assessed as proxies of the structure of the urban bird community of Kavala: NDVI, GNDVI, EVI2, SAVI, ARVI, NDMI, NDBI, and LST (see Table 2 for definitions and Table S3 for data).
Table 2.
Remotely sensed spectral indices (means and standard deviations, SDs) used to assess their relationship with the abundance and diversity of the bird community of Kavala.
The spectral indices, except LST, were calculated on a Sentinel-2 image sensed on 7 October 2016. We did not use multiple images because of the very small changes in the urban landscape during the short period of the study. The Sentinel-2 mission consists of two polar-orbiting satellites operated by the European Space Agency [60]. They carry a multispectral instrument sensor that can produce data at spatial resolutions from 10 m to 60 m. The image was retrieved from the Copernicus Scientific Hub and processed at Level 2. The spectral bands in the visual, near-infrared (NIR), and short-wave infrared (SWIR) parts of the electromagnetic spectrum, at spatial resolutions of 10 and 20 m, were employed to calculate the spectral indices. The land surface temperature was retrieved using Band 10 of a Landsat 8 image Level 1C image, sensed on 25 June 2016. The original B10 Digital Numbers were converted to Top-of-Atmosphere (ToA) radiance using the rescaling coefficients provided in the Landsat 8 metadata file. The ToA radiance was then converted to Brightness Temperature (BT) in degrees Celsius using the band-specific thermal conversion constants, provided in the Landsat 8 metadata file. The BT was then corrected using the surface emissivity estimated based on the NDVI value, calculated using Bands 5 and 4 of the Landsat 8 image [61].
The mean and SD values of the 8 spectral indices were calculated in three spatial scales at each survey station. These buffer zones were circles with radius 50 m, 200 m, and 500 m, centered at each station. The size of the buffer zones was selected based on the bird species’ territory and colony, and the size and configuration of Kavala’s gray and green infrastructure [22]. When a buffer extended into the sea, its surface was truncated for measurement accuracy.
2.5. Data Analysis
Generalized Linear Models (GLMs) were used to examine the relationships between bird abundance; taxonomic, functional, and phylogenetic diversity (response variables); and the 8 spectral indices (predictors). Predictors were modeled separately, and there was a model for each predictor (mean and SD) and each response variable, resulting in 16 models for each spatial scale. This analysis design was selected because we aimed to assess the single capacity of each spectral index as a proxy of each diversity index.
Abundance was a count variable modeled with Poisson distribution and log link function. All other response variables were continuous and modeled with Gaussian distributions and identity link functions. Models were fitted using the function glm of the stats package in R 4.2.2 [62]. Rate ratios, equivalent to odds ratios in logistic regression, were calculated to assess the rate of change in the response variable for a one-unit change in the predictor variable [63,64]. Model selection was performed using the Akaike information criterion (AICc) with the function model.sel of the MuMIn package in R [63]. Models differing less than 2 AICc units from the best model (ΔAICc ≤ 2) were selected as the most parsimonious, while the model with the lowest AICc was considered the best model [64]. Plots of the best models were produced with the visreg package in R [65].
3. Results
3.1. Spectral Indices as Proxies of Bird Community Structure at the 50 m Spatial Scale
The most parsimonious models for the 50 m buffer zone are shown in Table 3, while the full list of models is shown in Table S4. Rate ratios ranged from 0.89 to 87.62, showing a considerable effect of spectral indices on bird abundance and diversity (Table 3). LST SD was the best predictor of abundance, FDiv, and maxCED (Table 3). Mean GNDVI and mean LST were also parsimonious predictors of FDiv. Abundance and maxCED increased, while FDiv decreased, with increasing LST SD (Figure 2).
Table 3.
The most parsimonious GLM models (ΔAICc ≤ 2) selected to assess the relationship of remotely sensed spectral indices, at a 50 m buffer around survey stations, on the abundance and taxonomic, functional, and phylogenetic diversity of the bird community in Kavala.
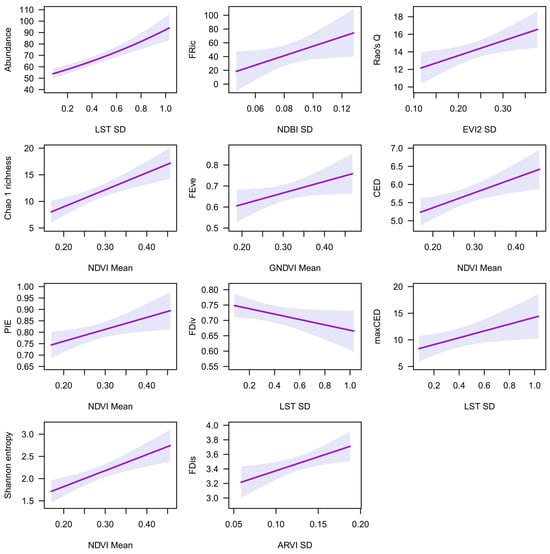
Figure 2.
The relationships of remotely sensed spectral indices with abundance and diversity indices, at a 50 m buffer zone, based on the best model (see Table 3). Shadowed areas represent 95% confidence intervals.
Mean NDVI was the best predictor of Chao 1 richness, PIE evenness, Shannon entropy, and CED (Table 3). Mean SAVI and EVI2 were also parsimonious predictors of these diversity indices, while mean GNDVI was a parsimonious predictor of PIE evenness and CED, and ARVI was a parsimonious predictor of Shannon entropy. Chao 1 richness, PIE evenness, Shannon entropy, and CED increased with increasing mean NDVI (Figure 2).
Mean NDBI was the best predictor of FRic (Table 3). Mean ARVI, ARVI SD, and EVI2 SD were also parsimonious predictors of FRic. FRic increased with increasing mean NDBI values (Figure 2).
Mean GNDVI was the best predictor of FEve (Table 3). LST SD and mean SAVI, NDVI, and EVI2 were also parsimonious predictors of FEve. FEve increased with increasing mean GNBVI values (Figure 2).
3.2. Spectral Indices as Proxies of Bird Community Structure at the 200 m Spatial Scale
The most parsimonious models for the 200 m buffer zone are shown in Table 4, while the full list of models is shown in Table S5. Rate ratios ranged from 0.41 to 129.45, showing a considerable effect of spectral indices on bird abundance and diversity (Table 4). LST SD was the best predictor of abundance, while mean LST was the best predictor of FDis (Table 4). Mean GNDVI, EVI2, NDVI, and SAVI were also parsimonious predictors of FDis. Abundance and FDis increased with increasing LST SD and mean LST, respectively (Figure 3).
Table 4.
The most parsimonious GLM models (ΔAICc ≤ 2) selected to assess the relationship of remotely sensed spectral indices, at a 200 m buffer around survey stations, on the abundance and taxonomic, functional, and phylogenetic diversity of the bird community in Kavala.
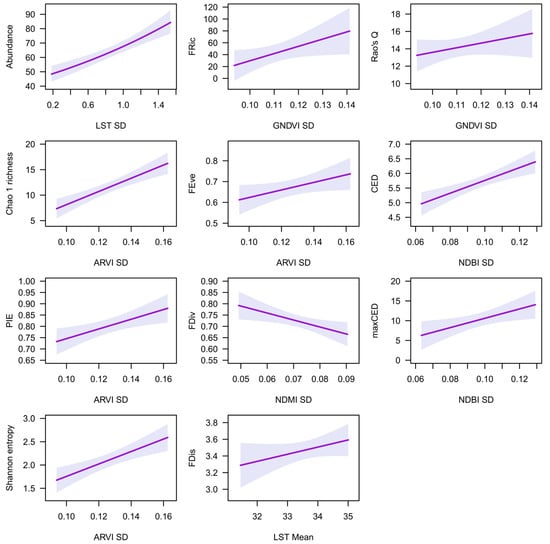
Figure 3.
The relationships of remotely sensed spectral indices with abundance and diversity indices at a 200 m buffer zone, based on the best model (see Table 4). Shadowed areas represent 95% confidence intervals.
ARVI SD was the best predictor of Chao 1 richness, PIE evenness, Shannon entropy, and FEve (Table 4). EVI2 SD was a parsimonious predictor of these diversity indices, while SAVI SD and NDVI SD were parsimonious predictors of PIE evenness, and mean GNDVI was a parsimonious predictor of FEve. Chao 1 richness, PIE evenness, Shannon entropy, and FEve increased with increasing ARVI SD (Figure 3).
GNDVI SD was the best predictor of FRic and Rao’s Q (Table 4). SAVI SD, NDVI SD, and ARVI SD were also parsimonious predictors of FRic, while mean GNDVI and LST SD were parsimonious predictors of Rao’s Q. FRic and Rao’s Q increased with increasing GNDVI SD (Figure 3).
3.3. Spectral Indices as Proxies of Bird Community Structure at the 500 m Spatial Scale
The most parsimonious models for the 500 m buffer zone are shown in Table 5, while the full list of models is shown in Table S6. Rate ratios ranged from 0.00 to 384.44, showing a considerable effect of spectral indices on bird abundance and diversity (Table 5). Mean GNDVI was the best predictor of abundance and FEve (Table 5). GNDVI SD and mean EVI2, SAVI, NDVI, and ARVI were also parsimonious predictors of FEve. Abundance decreased and FEve increased with increasing mean GNDVI values (Figure 4).
Table 5.
The most parsimonious GLM models (ΔAICc ≤ 2) selected to assess the relationship of remotely sensed spectral indices, at a 500 m buffer around survey stations, on the abundance and taxonomic, functional, and phylogenetic diversity of the bird community in Kavala.
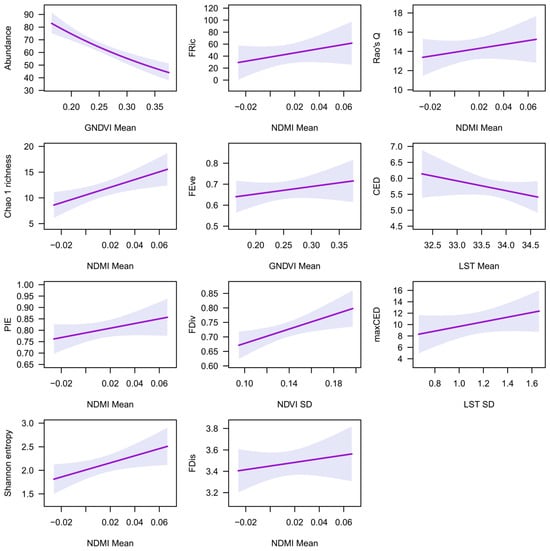
Figure 4.
The relationships of remotely sensed spectral indices with abundance and diversity indices, at a 500 m buffer zone, based on the best model (see Table 5). Shadowed areas represent 95% confidence intervals.
Mean NDMI was the best predictor of Chao 1 richness, PIE evenness, Shannon entropy, FRic, FDis, and Rao’s Q (Table 5). Mean LST was a parsimonious predictor of PIE evenness and FRic, while LST SD was a parsimonious predictor of FDis. Mean NDVI and SAVI were parsimonious predictors of Chao 1 richness, PIE evenness, Shannon entropy, FRic, and Rao’s Q. Mean NDBI was a parsimonious predictor of Chao 1 richness, PIE evenness, FRic, FDis, and Rao’s Q. Mean NDBI was a parsimonious predictor of Chao 1 richness, Shannon entropy, FRic, and Rao’s Q. Mean EVI2 was a parsimonious predictor of Shannon entropy, while NDMI SD was a parsimonious predictor of FDis. Chao 1 richness, PIE evenness, Shannon entropy, FRic, FDis, and Rao’s Q increased with increasing mean NDMI values (Figure 4).
NDVI SD was the best predictor of FDiv (Table 5). SAVI SD, EVI2 SD, and ARVI SD were also parsimonious predictors of NDVI SD. FDiv increased with increasing mean NDMI values (Figure 4).
Mean LST was the best predictor of CED, while LST SD was the best predictor of maxCED. Mean GNDVI, SAVI, and NDVI were also parsimonious predictors of CED. Mean LST was also a parsimonious predictor of maxCED (Table 5). SAVI SD, EVI2 SD, and ARVI SD were also parsimonious predictors of NDVI SD. CED decreased with increasing mean LST values, while maxCED increased with increasing LST SD (Figure 4).
4. Discussion
4.1. Spectral Indices and Bird Abundance
The LST SD was the most important spectral index, positively associated with abundance at the 50 m and 200 m spatial scales. On the other hand, the GNDVI mean was the most important at the 500 m scale, negatively affecting abundance. The urban heat island refers to the higher air and surface temperature in cities compared to adjacent rural areas [66]. This thermal heterogeneity is also observed within cities and between green spaces and built-up areas [67]. Surface temperature differences are higher in built-up areas than in green spaces due to higher heat gains during the day and higher heat losses during the night in the latter. This heterogeneity has been captured by the variation in standard deviations of LST at the 50 m and 200 m spatial scales. Bird abundance increased with increasing temperature heterogeneity, suggesting a higher bird abundance in built-up areas. Previous studies have associated bird abundance with gray infrastructure. Urban dwellers, such as the feral pigeon (Columba livia), collared dove (Streptopelia decaocto), house sparrow (Passer domesticus), and northern house martin (Delichon urbicum) abound in heavily built-up city centers, while forest specialist species, such as the common chaffinch (Fringilla coelebs), European greenfinch (Chloris chloris), Eurasian jay (Garrulus glandarius), great tit (Parus major), and Eurasian blue tit (Cyanistes caeruleus) are found in lower numbers or become practically extinct as impervious cover increases [68,69]. The numerous urban dwellers have been responsible for the increasing abundance with increasing impervious cover in Kavala [4,5,6] and elsewhere [1,21,69]. A vegetation index, the mean GNDVI, was the most important negative predictor of bird abundance at the 500 m scale. Vegetated areas favor forest specialists, which occur in low numbers compared to urban dwellers, resulting in lower abundance with increasing green vegetation cover in Kavala’s green spaces [4,5,6].
4.2. Spectral Indices and Bird Diversity
All spectral vegetation indices were important predictors of taxonomic and functional diversity with their importance varying between indices and spatial scales. Diversity indices increased, with increasing mean vegetation cover and habitat heterogeneity (SDs) at all the spatial scales. NDBI and LST were less important as predictors of taxonomic and functional diversity. On the other hand, NDBI and LST were the most important predictors of phylogenetic diversity, although several vegetation indices were also equally important. Heterogeneity in built-up cover and surface temperature positively influenced phylogenetic diversity, while mean surface temperature had a negative effect. Bird taxonomic, functional, and phylogenetic diversity indices have been commonly associated with high vegetation cover in urban areas, either tree, shrub, or grass [1,4,5,6,21,69,70,71,72,73]. Among spectral indices used to quantify vegetation, NDVI has been the most commonly used proxy of the taxonomic, functional, and phylogenetic diversity of bird communities in urban areas [22,23,24,26,27,28,29,30]. These studies reported a positive relationship between NDVI and all the facets of bird diversity. Other spectral indices, such as EVI and SAVI, have also been used, although in few studies, as proxies of bird diversity in urban areas. [23,74]. These indices were positive predictors of bird diversity. When mean and SD NDVI and EVI values calculated in a 50 m buffer zone around the survey stations were compared, the mean NDVI was the most important predictor of the taxonomic, functional, and phylogenetic diversity of the bird communities in 15 European cities [23].
Our study revealed that different vegetation and urbanization indices were important for predicting bird abundance and diversity in Kavala’s green spaces. Vegetation indices measure primary productivity and are closely related, but they use different spectral bands, algorithms, and corrections. NDVI yields information about vegetation density and health [25]. GNDVI is an index of the plant’s “greenness” or photosynthetic movement, uses the green instead of the red band used in NDVI, and is related to plant vigor [37]. EVI2 is similar to NDVI but corrects for the influence of atmospheric conditions and is more sensitive in densely vegetated areas [31,32]. SAVI incorporates a soil adjustment factor to minimize soil brightness and is particularly useful in areas with sparse vegetation [38,39]. ARVI is an enhanced vegetation index, resistant to atmospheric effects, and useful in areas with high atmospheric variability [40,41]. NDMI measures vegetation water content in plants and is useful in assessing drought conditions and plant stress [42]. NDBI is used to identify urban and built-up areas from satellite imagery [45]. LST measures surface temperature and is useful in climate studies and urban heat island effect analysis and monitoring [49]. Although similar, different spectral indices have differing sensitivity in measuring the different aspects, quality, and configuration of the vegetated and non-vegetated areas in cities. Urban areas are very heterogeneous both at the local and landscape scales, and this heterogeneity can be differently captured by different spectral indices [1,2].
Kavala’s green spaces consist of woodlands, square gardens, playgrounds, and median road strips [4,5,6]. Besides one 18 ha woodland (survey station 7), all other green spaces were smaller than 3 ha, irregular in size, and irregularly dispersed among built-up areas [4]. The woodlands have a Turkish pine (Pinus brutia)-dominated tree storey and a shrub understorey mainly consisting of lentisk (Pistacia lentiscus), kermes oak (Quercus coccifera), the green olive tree (Phillyrea latifolia), and flowering ash (Fraxinus ornus). The other green spaces consisted of both native (e.g., silver lime (Tilia tomentosa), bay laurel (Laurus nobilis), box (Buxus sempervirens), and tamarisk (Tamarix sp.)) and non-native plants (e.g., Chinaberry (Melia azedarach), oriental arborvitae (Platycladus orientalis), paper mulberry (Brussonetia papyrifera), and Canary Island date palm (Phoenix canariensis)). Most green spaces include paved walks, cafés, and restaurants. Also, all the buffer zones used included buildings surrounding the green spaces.
The degree of habitat fragmentation at various landscape levels and the size of habitat patches are important determinants of bird species abundance, richness, and diversity [75]. The green spaces of Kavala were small fragments of vegetation, irregularly spaced among built-up areas [4,5,6]. This variable mix of green and gray infrastructure, in combination with the differences among spectral indices, might explain the varying importance of these indices in predicting bird abundance, richness, and diversity, both within and between different spatial scales. EVI2 would perform better in areas with denser vegetation, while SAVI would more reliably measure areas with sparser vegetation. ARVI would perform better in areas with high atmospheric variability, NDBI would better separate green from built-up areas, and LST would better capture big differences in temperature among areas, especially in city centers.
Mean values of spectral indices and habitat heterogeneity, implied by SDs, were important predictors of diversity indices in Kavala. Areas with higher plant biomass and habitat heterogeneity supported more species were more diverse, both taxonomically and functionally, and hosted more evolutionarily distinct species. Benedetti et al. [23] reported that means were more important predictors of bird diversity than SDs of NDVI and EVI in 15 European cities. SD values can capture habitat heterogeneity [76]. SDs of spectral indices were important predictors of most facets of bird diversity in Kavala because heterogeneous habitats contain a higher variety of microhabitats and resources potentially suitable for many bird species [77,78]. In agreement with Benedetti et al. [44], NDVI was a better predictor of bird diversity in Kavala than EVI2 in most cases. However, we also used other spectral indices that were more important than NDVI and EVI2 in predicting several facets of bird diversity. Also, we used EVI2, which is an improvement on EVI used in Benedetti et al. [23], as it better assesses dense vegetation [31,32].
5. Conclusions
We investigated the ability of eight vegetation and urbanization spectral indices to predict the abundance, species richness, and taxonomic, functional, and phylogenetic diversity of the bird community of Kavala. Our results showed that most indices could be used as proxies of the bird community structure. However, different indices performed better for different facets of bird diversity and at different spatial scales. This trend could be attributed to the differences among spectral indices, each of them being sensitive to different spectra and vegetation structures, the different vegetation types, health, and density among green spaces, and the different mixes of green and gray infrastructure among spatial scales. The performance of these spectral indices should also be investigated in other urban areas of various sizes and spatial configurations of green and built-up areas. The main outcome of our study was that researchers should use several easy- and cheap-to-measure spectral indices to determine the most suitable for predicting urban bird community structure. The use of easy- and cheap-to-measure spectral indices will provide a valuable tool to conservationists and urban planners. They will be able to readily infer the status of urban bird communities and design and implement successful management plans to maintain and enhance urban biodiversity, a key element for ecosystem stability and human health [11,18,19,20].
Supplementary Materials
The following supporting information can be downloaded at https://www.mdpi.com/article/10.3390/land14020308/s1: Table S1: Abundance, taxonomic, functional, and phylogenetic diversity indices of birds in the survey stations (ST) of Kavala. See Table 1 for index codes. ST numbering follows the map of Figure 1; Table S2: Migration status traits of 30 bird species used for the calculation of functional diversity indices. 0 = No, 1 = Yes; Table S3: Remotely sensed spectral indices at three buffer zones around each survey station (ST) in Kavala. See Table 2 for index codes. ST numbering follows the map of Figure 1; Table S4: Full list of GLM models selected to assess the relationship of remotely sensed, at a 50 m buffer around survey stations, spectral indices on the abundance and taxonomic, functional, and phylogenetic diversity of the bird community in Kavala; Table S5: Full list of GLM models selected to assess the relationship of remotely sensed, at a 200 m buffer around survey stations, spectral indices on the abundance and taxonomic, functional, and phylogenetic diversity of the bird community in Kavala; Table S6: Full list of GLM models selected to assess the relationship of remotely sensed, at a 500 m buffer around survey stations, spectral indices on the abundance and taxonomic, functional, and phylogenetic diversity of the bird community in Kavala.
Author Contributions
Conceptualization, V.J.K., E.V., and V.L.; investigation, E.V.; methodology, V.J.K., S.C., P.X., E.N., and V.L.; software, S.C., P.X., and V.L.; validation, V.J.K., S.C., and V.L.; formal analysis, V.L.; resources, V.J.K., S.C., E.V., E.N., P.X., and V.L.; data curation, S.C. and V.L.; writing—original draft preparation.; V.J.K., S.C., and V.L.; writing—reviewing and editing, E.V., E.N., and P.X.; visualization, S.C. and V.L.; supervision, V.J.K., P.X., and V.L.; project administration, V.J.K. All authors have read and agreed to the published version of the manuscript.
Funding
This research received no external funding.
Data Availability Statement
Data are contained within Supplementary Materials.
Acknowledgments
This project was part of the “Planning and managing urban green spaces” postgraduate program of the Department of Forest and Natural Environment Sciences. We are also grateful to three anonymous reviewers whose comments and suggestions helped greatly improve the manuscript.
Conflicts of Interest
The authors declare no conflicts of interest.
References
- Chace, J.F.; Walsh, J.J. Urban Effects on Native Avifauna: A Review. Landsc. Urban Plan. 2006, 74, 46–69. [Google Scholar] [CrossRef]
- Clergeau, P.; Croci, S.; Jokimäki, J.; Kaisanlahti-Jokimäki, M.L.; Dinetti, M. Avifauna Homogenization by Urbanization: Analysis at Different European Latitudes. Biol. Conserv. 2006, 3, 336–344. [Google Scholar] [CrossRef]
- Cameron, R.W.F.; Brindley, P.; Mears, M.; McEwan, K.; Ferguson, F.; Sheffield, D.; Jorgensen, A.; Riley, J.; Goodrick, J.; Ballard, L.; et al. Where the Wild Things Are! Do Urban Green Spaces with Greater Avian Biodiversity Promote More Positive Emotions in Humans? Urban Ecosyst. 2020, 23, 301–317. [Google Scholar] [CrossRef]
- Kontsiotis, V.J.; Valsamidis, E.; Liordos, V. Organization and Differentiation of Breeding Bird Communities Across a Forested to Urban Landscape. Urban For. Urban Green. 2019, 38, 242–250. [Google Scholar] [CrossRef]
- Liordos, V.; Jokimäki, J.; Kaisanlahti-Jokimäki, M.-L.; Valsamidis, E.; Kontsiotis, V.J. Niche Analysis and Conservation of Bird Species Using Urban Core Areas. Sustainability 2021, 13, 6327. [Google Scholar] [CrossRef]
- Liordos, V.; Jokimäki, J.; Kaisanlahti-Jokimäki, M.-L.; Valsamidis, E.; Kontsiotis, V.J. Patch, matrix and disturbance variables negatively influence bird community structure in small-sized managed green spaces located in urban core areas. Sci. Total Environ. 2021, 801, 149617. [Google Scholar] [CrossRef] [PubMed]
- Devictor, V.; Mouillot, D.; Meynard, C.; Jiguet, F.; Thuiller, W.; Mouquet, N. Spatial Mismatch and Congruence Between Taxonomic, Phylogenetic and Functional Diversity: The Need for Integrative Conservation Strategies in a Changing World. Ecol. Lett. 2010, 13, 1030–1040. [Google Scholar] [CrossRef] [PubMed]
- Chao, A. Nonparametric Estimation of the Number of Classes in a Population. Scand. J. St. 1984, 11, 265–270. [Google Scholar]
- Hurlbert, S. The Nonconcept of Species Diversity: A Critique and Alternative Parameters. Ecology 1971, 52, 577–585. [Google Scholar] [CrossRef] [PubMed]
- Chao, A.; Jost, L. Estimating Diversity and Entropy Profiles Via Discovery Rates of New Species. Methods Ecol. Evol. 2015, 6, 873–882. [Google Scholar] [CrossRef]
- Villéger, S.; Mason, N.W.H.; Mouillot, D. New Multidimensional Functional Diversity Indices for a Multifaceted Framework in Functional Ecology. Ecology 2008, 89, 2290–2301. [Google Scholar] [CrossRef] [PubMed]
- Mason, N.W.H.; Mouillot, D.; Lee, W.G.; Wilson, J.B. Functional Richness, Functional Evenness and Functional Divergence: The Primary Components of Functional Diversity. Oikos 2005, 111, 112–118. [Google Scholar] [CrossRef]
- Laliberté, E.; Legendre, P. A Distance-Based Framework for Measuring Functional Diversity from Multiple Traits. Ecology 2010, 91, 299–305. [Google Scholar] [CrossRef] [PubMed]
- Jetz, W.; Thomas, G.H.; Joy, J.B.; Redding, D.W.; Hartmann, K.; Mooers, A.O. Global Distribution and Conservation of Evolutionary Distinctness in Birds. Curr. Biol. 2014, 24, 919–930. [Google Scholar] [CrossRef] [PubMed]
- Botta-Dukát, Z. Rao’s Quadratic Entropy as a Measure of Functional Diversity Based on Multiple Traits. J. Veg. Sci. 2005, 16, 533–540. [Google Scholar] [CrossRef]
- Frishkoff, L.O.; Karp, D.S.; Mendenhall, C.D.; Zook, J.; Kremen, C.; Hadly, E.A.; Daily, G.C. Loss of Avian Phylogenetic Diversity in Neotropical Agricultural Systems. Science 2014, 345, 1343–1346. [Google Scholar] [CrossRef] [PubMed]
- Isaac, N.J.B.; Turvey, S.T.; Collen, B.; Waterman, C.; Baillie, J.E.M. Mammals on the EDGE: Conservation Priorities Based on Threat and Phylogeny. PLoS ONE 2007, 2, e296. [Google Scholar] [CrossRef] [PubMed]
- Morelli, F.; Benedetti, Y.; Ibáñez-Álamo, J.D.; Jokimäki, J.; Mänd, R.; Tryjanowski, P.; Møller, A.P. Evidence of evolutionary homogenization of bird communities in urban environments across Europe. Glob. Ecol. Biogeogr. 2016, 25, 1284–1293. [Google Scholar] [CrossRef]
- Guimarães Santos, E.; Correa Wiederhecker, H.; Tirelli Pompermaier, V.; Gainsbury, A.M.; Coradini Schirmer, S.; Feitosa Morais, C.V.; Lima Fontenele, J.; Conceição de Morais Santana, M.; Marini, M.Â. Urbanization Reduces Diversity, Simplifies Community and Filter Bird Species Based on their Functional Traits in a Tropical City. Sci. Total Environ. 2024, 935, 173379. [Google Scholar] [CrossRef]
- Ibáñez-Álamo, J.D.; Rubio, E.; Benedetti, Y.; Morelli, F. Global Loss of Avian Evolutionary Uniqueness in Urban Areas. Glob. Change Biol. 2017, 23, 2990–2998. [Google Scholar] [CrossRef]
- Carbó-Ramírez, P.; Zuria, I. The Value of Small Urban Green Spaces for Birds in a Mexican City. Landsc. Urban Plan. 2011, 100, 213–222. [Google Scholar] [CrossRef]
- Kontsiotis, V.J.; Chatzigiovanakis, S.; Valsamidis, E.; Xofis, P.; Liordos, V. Normalized Difference Vegetation Index as a Proxy of Urban Bird Species Presence and Distribution at Different Spatial Scales. Diversity 2023, 15, 1139. [Google Scholar] [CrossRef]
- Benedetti, Y.; Callaghan, C.T.; Ulbrichová, I.; Galanaki, A.; Kominos, T.; Abou Zeid, F.; Ibáñez-Álamo, J.D.; Suhonen, J.; Díaz, M.; Markó, G.; et al. EVI and NDVI as Proxies for Multifaceted Avian Diversity in Urban Areas. Ecol. Appl. 2023, 33, e2808. [Google Scholar] [CrossRef] [PubMed]
- Leveau, L.M.; Isla, F.I.; Bellocq, M.I. From Town to Town: Predicting the Taxonomic, Functional and Phylogenetic Diversity of Birds Using NDVI. Ecol. Indic. 2020, 119, 106703. [Google Scholar] [CrossRef]
- Christidis, N.; Jones, G.S.; Stott, P.A. Dramatically Increasing Chance of Extremely Hot Summers Since the 2003 European Heatwave. Nat. Clim. Chang. 2015, 5, 46–50. [Google Scholar] [CrossRef]
- Bino, G.; Levin, N.; Darawshi, S.; Van Der Hal, N.; Reich-Solomon, A.; Kark, S. Accurate Prediction of Bird Species Richness Patterns in an Urban Environment Using Landsat-Derived NDVI and Spectral Unmixing. Int. J. Remote Sens. 2008, 29, 3675–3700. [Google Scholar] [CrossRef]
- Bae, S.; Müller, J.; Lee, D.; Vierling, K.T.; Vogeler, J.C.; Vierling, L.A.; Hudak, A.T.; Latifi, H.; Thorn, S. Taxonomic, Functional, and Phylogenetic Diversity of Bird Assemblages Are Oppositely Associated to Productivity and Heterogeneity in Temperate Forests. Remote Sens. Environ. 2018, 215, 145–156. [Google Scholar] [CrossRef]
- Callaghan, C.T.; Major, R.E.; Lyons, M.B.; Martin, J.M.; Kingsford, R.T. The Effects of Local and Landscape Habitat Attributes on Bird Diversity in Urban Greenspaces. Ecosphere 2018, 9, e02347. [Google Scholar] [CrossRef]
- Katoh, K.; Matsuba, M. Effectiveness of Nature Reserves for Bird Conservation in Urban Parks in Tokyo. J. For. Res. 2021, 32, 2011–2022. [Google Scholar] [CrossRef]
- Leveau, L.M. Primary Productivity and Habitat Diversity Predict Bird Species Richness and Composition Along Urban-rural Gradients of Central Argentina. Urban For. Urban Green. 2019, 43, 126349. [Google Scholar] [CrossRef]
- Jiang, Z.; Huete, A.; Didan, K.; Miura, T. Development of a two-band enhanced vegetation index without a blue band. Remote Sens. Environ. 2008, 112, 3833–3845. [Google Scholar] [CrossRef]
- Zhen, Z.; Chen, S.; Yin, T.; Gastellu-Etchegorry, J.-P. Globally Quantitative Analysis of the Impact of Atmosphere and Spectral Response Function on 2-band Enhanced Vegetation Index (EVI2) Over Sentinel-2 and Landsat-8. ISPRS J. Photogramm. Remote Sens. 2023, 205, 206–226. [Google Scholar] [CrossRef]
- Moreira, F.S.; Regos, A.; Gonçalves, J.F.; Rodrigues, T.M.; Verde, A.; Pagès, M.; Pérez, J.A.; Meunier, B.; Lepetit, J.-P.; Honrado, J.P.; et al. Combining Citizen Science Data and Satellite Descriptors of Ecosystem Functioning to Monitor the Abundance of a Migratory Bird during the Non-Breeding Season. Remote Sens. 2022, 14, 463. [Google Scholar] [CrossRef]
- Cooper, W.J.; McShea, W.J.; Forrester, T.; Luther, D.A. The Value of Local Habitat Heterogeneity and Productivity When Estimating Avian Species Richness and Species of Concern. Ecosphere 2020, 11, e03107. [Google Scholar] [CrossRef]
- Hobi, M.L.; Dubinin, M.C.; Graham, H.; Coops, N.C.; Clayton, M.K.; Pidgeon, A.M.; Radeloff, V.C. A Comparison of Dynamic Habitat Indices Derived from Different MODIS Products as Predictors of Avian Species Richness. Remote Sens. Environ. 2017, 195, 142–152. [Google Scholar] [CrossRef]
- Echeverría-Caro, A.; Feldman, R.E.; Bahn, V. Geographic Context is a Key Driver of Spatial Variation of Bird Species Richness During Migration. Global Ecol. Biogeogr. 2022, 31, 1303–1312. [Google Scholar] [CrossRef]
- Taddeo, S.; Dronova, I.; Depsky, N. Spectral Vegetation Indices of Wetland Greenness: Responses to Vegetation Structure, Composition, and Spatial Distribution. Remote Sens. Environ. 2019, 234, 111467. [Google Scholar] [CrossRef]
- Qi, J.; Chehbouni, A.; Huete, A.R.; Kerr, Y.H.; Sorooshian, S. A Modified Soil Adjusted Vegetation Index. Remote Sens. Environ. 1994, 48, 119–126. [Google Scholar] [CrossRef]
- Rondeaux, G.; Steven, M.; Baret, F. Optimization of Soil-Adjusted Vegetation Indices. Remote Sens. Environ. 1996, 55, 95–107. [Google Scholar] [CrossRef]
- Kaufman, Y.J.; Tanre, D. Atmospherically Resistant Vegetation Index (ARVI) for EOS-MODIS. IEEE Trans. Geosci. Remote Sens. 1992, 30, 261–270. [Google Scholar] [CrossRef]
- Somvanshi, S.S.; Kumari, M. Comparative Analysis of Different Vegetation Indices with Respect to Atmospheric Particulate Pollution Using Sentinel Data. Appl. Comput. Geosci. 2020, 7, 100032. [Google Scholar] [CrossRef]
- Viswambharan, S.; Kumaramkandath, I.T.; Tali, J.A. A Geospatial Approach in Monitoring the Variations on Surface Soil Moisture and Vegetation Water Content: A Case Study of Palakkad District, Kerala, India. Environ. Earth Sci. 2022, 81, 494. [Google Scholar] [CrossRef]
- Abdi, A.M. Integrating Open Access Geospatial Data to Map the Habitat Suitability of the Declining Corn Bunting (Miliaria calandra). ISPRS Int. J. Geo-Inf. 2013, 2, 935–954. [Google Scholar] [CrossRef]
- Abril-Colón, I.; Alonso, J.C.; Palacín, C.; Álvarez-Martínez, J.M.; Ucero, A. Short-Distance Nocturnal Migration in an Island Endemic Bustard. IBIS 2022, 164, 1145–1159. [Google Scholar] [CrossRef]
- Malik, M.; Jai, S.; Satanand, M. Relationship of LST, NDBI and NDVI Using Landsat-8 data in Kandaihimmat Watershed, Hoshangabad, India. Indian J. Mar. Sci. 2019, 48, 25–31. [Google Scholar]
- MacGregor-Fors, I.; Schondube, J.E. Gray vs. Green Urbanization: Relative Importance of Urban Features for Urban Bird Communities. Basic Appl. Ecol. 2011, 12, 372–381. [Google Scholar] [CrossRef]
- Amaya-Espinel, J.D.; Hostetler, M.; Henríquez, C.; Bonacic, C. The Influence of Building Density on Neotropical Bird Communities Found in Small Urban Parks. Landsc. Urban Plan. 2019, 190, 103578. [Google Scholar] [CrossRef]
- Ortega-Álvarez, R.; MacGregor-Fors, I. Living in the Big City: Effects of Urban Land Use on Bird Community Structure, Diversity, and Composition. Landsc. Urban Plan. 2009, 90, 189–195. [Google Scholar] [CrossRef]
- Zhang, A.; Li, W.; Xia, C.; Guo, H. The Impact of Urban Landscape Patterns on Land Surface Temperature at the Street Block Level: Evidence from 38 Big Chinese Cities. Environ. Impact Assess. Rev. 2025, 110, 107673. [Google Scholar] [CrossRef]
- van Oorschot, J.; Slootweg, M.; Remme, R.P.; Sprecher, B.; van der Voet, E. Optimizing Green and Gray Infrastructure Planning for Sustainable Urban Development. npj Urban Sustain. 2024, 4, 41. [Google Scholar] [CrossRef]
- Şahin Körmeçli, P.; Seçkin Gündoğan, G. Assessment of Vegetation Change Uing NDVI, LST, and Carbon Analyses in Çankırı Karatekin University, Turkey. Environ. Monit. Assess. 2024, 196, 331. [Google Scholar] [CrossRef] [PubMed]
- Yu, H.; Xiao, H.; Gu, X. Integrating Species Distribution and Piecewise Linear Regression Model to Identify Functional Connectivity Thresholds to Delimit Urban Ecological Corridors. Comput. Environ. Urban. Syst. 2024, 113, 102177. [Google Scholar] [CrossRef]
- Bacaro, G.; Santi, E.; Rocchini, D.; Pezzo, F.; Puglisi, L.; Chiarucci, A. Geostatistical Modelling of Regional Bird Species Richness: Exploring Environmental Proxies for Conservation Purpose. Biodivers. Conserv. 2011, 20, 1677–1694. [Google Scholar] [CrossRef]
- ELSTAT (Hellenic Statistical Authority). Population Census. 2021. Available online: https://www.statistics.gr/2021-census-pop-hous-results (accessed on 20 November 2024).
- Bibby, C.; Burgess, N.; Hill, D.; Mustoe, S. Bird Census Techniques, 3rd ed.; Academic: London, UK, 2000. [Google Scholar]
- Chao, A.; Ma, K.H.; Hsieh, T.C.; Chiu, C.-H. SpadeR: Species-Richness Prediction and Diversity Estimation with R. R Package Version 0.1.1.2016. Available online: https://CRAN.R-project.org/package=SpadeR (accessed on 20 November 2024).
- McGlinn, D.; Xiao, X.; McGill, B.; May, F.; Engel, T.; Oliver, C.; Blowes, S.; Knight, T.; Purschke, O.; Gotelli, N.; et al. Mobr: Measurement of Biodiversity. 2020. R Package Version 2.0.0. Available online: https://CRAN.R-project.org/package=mobr (accessed on 20 November 2024).
- Pearman, P.B.; Lavergne, S.; Roquet, C.; Wüest, R.; Zimmermann, W.; Thuiller, N.E. Phylogenetic Patterns of Climatic, Habitat and Trophic Niches in a European Avian Assemblage. Global Ecol. Biogeogr. 2014, 23, 414–424. [Google Scholar] [CrossRef]
- Laliberté, E.; Legendre, P.; Shipley, B. Measuring Functional Diversity (FD) from Multiple Traits, and Other Tools for Functional Ecology: R Package Version 1.0-12. 2015. Available online: https://cran.r-project.org/web//packages/FD/FD.pdf (accessed on 20 November 2024).
- Drusch, M.; Del Bello, U.; Carlier, S.; Colin, O.; Fernandez, V.; Gascon, F.; Hoersch, B.; Isola, C.; Laberinti, P.; Martimort, P.; et al. Sentinel-2: ESA’s Optical High-Resolution Mission for GMES Operational Services. Remote Sens. Environ. 2012, 120, 25–36. [Google Scholar] [CrossRef]
- Xofis, P.; Feloni, E.; Emmanouloudis, D.; Chatzigiovanakis, S.; Kravari, K.; Samourkasidou, E.; Kefalas, G.; Nastos, P. Long-term Monitoring of Trends in Xerothermality and Vegetation Condition of a Northeast Mediterranean Island, Using Meteorological and Remote Sensing Data. Land 2024, 13, 2129. [Google Scholar] [CrossRef]
- R Core Team. R: A Language and Environment for Statistical Computing; R Foundation for Statistical Computing: Vienna, Austria, 2020; Available online: https://www.R-project.org/ (accessed on 20 November 2024).
- Barton, K. MuMIn: Multi-Model Inference. R Package Version 1.43.17. 2020. Available online: https://CRAN.R-project.org/package=MuMIn (accessed on 20 November 2024).
- Burnham, K.P.; Anderson, D.R. Model Selection and Multimodel Inference: A Practical Information-Theoretic Approach, 2nd ed.; Springer: New York, NY, USA, 2002. [Google Scholar]
- Breheny, P.; Burchett, W. Visualization of Regression Models Using visreg. R J. 2017, 9, 56–71. [Google Scholar] [CrossRef]
- Capari, L.; Wilfing, H.; Exner, A.; Höflehner, T.; Haluza, D. Cooling the City? A Scientometric Study on Urban Green and Blue Infrastructure and Climate Change-Induced Public Health Effects. Sustainability 2022, 14, 4929. [Google Scholar] [CrossRef]
- Cai, Z.; La Sorte, F.A.; Chen, Y.; Wu, J. The Surface Urban Heat Island Effect Decreases Bird Diversity in Chinese Cities. Sci. Total Environ. 2023, 902, 166200. [Google Scholar] [CrossRef] [PubMed]
- Fischer, J.D.; Schneider, S.C.; Ahlers, A.A.; Miller, J.R. Categorizing Wildlife Responses to Urbanization and Conservation Implications of Terminology. Conserv. Biol. 2015, 29, 1246–1248. [Google Scholar] [CrossRef] [PubMed]
- Schneider, S.C.; Fischer, J.D.; Miller, J.R. Two-Sided Edge Responses of Avian Communities in an Urban Landscape. Urban Ecosyst. 2015, 18, 539–551. [Google Scholar] [CrossRef]
- Awoyemi, A.G.; Barshep, Y.; Manu, S.; Ibáñez-Álamo, J.D. Associations between urbanization and avian communities in the Afrotropics: Evidence from taxonomic, functional and phylogenetic diversity. Global Ecol. Conserv. 2024, 54, e03108. [Google Scholar] [CrossRef]
- Mao, Q.; Sun, J.; Deng, Y.; Wu, Z.; Bai, H. Assessing Effects of Multi-Scale Landscape Pattern and Habitats Attributes on Taxonomic and Functional Diversity of Urban River Birds. Diversity 2023, 15, 486. [Google Scholar] [CrossRef]
- Melo, M.A.; Piratelli, A.J. Increase in Size and Shrub Cover Improves Bird Functional Diversity in Neotropical Urban Green Spaces. Austral Ecol. 2023, 48, 440–460. [Google Scholar] [CrossRef]
- Morelli, F.; Benedetti, Y.; Ibáñez-Álamo, J.D.; Tryjanowski, P.; Jokimäki, J.; Kaisanlahti-Jokimäki, M.-L.; Suhonen, J.; Díaz, M.; Møller, A.P.; Moravec, D.; et al. Effects of Urbanization on Taxonomic, Functional and Phylogenetic Avian Diversity in Europe. Sci. Total Environ. 2021, 795, 148874. [Google Scholar] [CrossRef]
- Kavana, D.J.; Mbije, N.; Mayeji, T.S.; Yu, B. Functional Diversity of Avian Communities in Response to Habitat Fragmentation in Human-Dominated Landscapes of Tanzania Miombo Woodlands. Afr. J. Ecol. 2024, 62, e13293. [Google Scholar] [CrossRef]
- Undin, M.; Atrena, A.; Carlsson, F.; Edman, M.; Gunnar Jonsson, B.; Sandström, J. To What Extent Does Surrounding Landscape Explain Stand-Level Occurrence of Conservation-Relevant Species in Fragmented Boreal and Hemi-Boreal Forest?—A Systematic Review. Environ. Evid. 2024, 13, 19. [Google Scholar] [CrossRef] [PubMed]
- Seto, K.C.; Fleishman, E.; Fay, J.P.; Betrus, C.J. Linking Spatial Patterns of Bird and Butterfly Species Richness with Landsat TM Derived NDVI. Int. J. Remote Sens. 2004, 25, 4309–4324. [Google Scholar] [CrossRef]
- Keppel, G.; Van Niel, K.; Wardell-Johnson, G.; Yates, C.; Byrne, M.; Mucina, L.; Schut, A.; Hopper, S.; Franklin, S. Refugia: Identifying and Understanding Safe Havens for Biodiversity under Climate Change. Glob. Ecol. Biogeogr. 2011, 21, 393–404. [Google Scholar] [CrossRef]
- Stein, A.; Gerstner, K.; Kreft, H. Environmental Heterogeneity as a Universal Driver of Species Richness across Taxa, Biomes and Spatial Scales. Ecol. Lett. 2014, 17, 866–880. [Google Scholar] [CrossRef]
Disclaimer/Publisher’s Note: The statements, opinions and data contained in all publications are solely those of the individual author(s) and contributor(s) and not of MDPI and/or the editor(s). MDPI and/or the editor(s) disclaim responsibility for any injury to people or property resulting from any ideas, methods, instructions or products referred to in the content. |
© 2025 by the authors. Licensee MDPI, Basel, Switzerland. This article is an open access article distributed under the terms and conditions of the Creative Commons Attribution (CC BY) license (https://creativecommons.org/licenses/by/4.0/).