Article

Navigating Flooding Challenges in Historical Urban Contexts: Integrating Nature-Based Solutions with Spatial Multi-Criteria Assessments in Quanzhou

1
College of Architecture and Urban Planning, Guangzhou University, Guangzhou 510006, China
2
Faculty of Civil Engineering and Built Environment, Universiti Tun Hussein Onn Malaysia, Parit Raja 86400, Malaysia
3
Art School, Hunan University of Information Technology, Changsha 410151, China
*
Authors to whom correspondence should be addressed.
Land 2025, 14(3), 452; https://doi.org/10.3390/land14030452
Submission received: 20 January 2025 / Revised: 20 February 2025 / Accepted: 20 February 2025 / Published: 21 February 2025

Abstract

:
Urban flooding presents acute challenges in heritage cities, where dense populations and valuable cultural assets coexist. While Nature-Based Solutions (NbSs) have been widely studied, their implementation in heritage cities remains underexplored due to spatial constraints and cultural sensitivities. This study develops a quantitative evaluative framework integrating the Spatial Multi-Criteria Evaluation (SMCE) and NbSs to address urban flooding in Quanzhou, a UNESCO World Heritage site. In GIS-based spatial analysis, the framework prioritizes high-risk zones by synthesizing hydrological and socio-economic factors. The analysis reveals that the Surface Runoff Coefficient (SRC) contributes 30% to urban flooding exposure, with high building congestion and elevated PM2.5 levels exacerbating risks by 17% and 16.8%, respectively. Vulnerability mapping underscores the critical role of cultural heritage, accounting for 71.1% of the vulnerability index, and highlights priority townships such as Linjiang, Kaiyuan, and Lizhong, with integrated exposure and vulnerability rates of 11.8%, 10.3%, and 9.5%, respectively. This study proposes four NbS models tailored to heritage urban landscapes, with Solution I—direct surface infiltration—identified as the most applicable, covering 170.9 ha, followed by Solution II—subterranean stormwater infiltration—at 52.3 ha. Despite limited spatial feasibility (1.3–33.5% of township areas), the framework demonstrates significant potential for integrating NbSs with existing grey infrastructure, contributing to flood risk mitigation and broader sustainability goals. The findings provide actionable insights for urban planners and policymakers, offering a replicable methodology for the deployment of NbSs in heritage-rich urban contexts worldwide. By bridging flood risk management with cultural preservation, this work advances the discourse on resilient and sustainable urban planning.

1. Introduction

In the rapidly evolving urban milieu, hydrological risks have intensified under the dual pressures of urbanization and climatic variability, presenting formidable challenges globally [1,2]. These challenges manifest in significant economic losses, infrastructural damage, and human fatalities [3]. Conventional stormwater management systems, predominantly comprising grey infrastructure, often prove inadequate in mitigating the complex impacts of urban flooding, owing to their limited adaptability and potential ecological detriments [4]. Against this backdrop, the exploration of adaptive, integrative, and environmentally harmonious strategies, such as Nature-Based Solutions (NbSs), is imperative for urban flooding risk mitigation [5,6].
NbSs have emerged as a paradigm in environmental management, harnessing natural processes to mitigate flood risks, enhancing water quality, and strengthening coastal defenses [7]. Integrating NbSs within urban ecosystems addresses societal challenges while promoting human well-being and biodiversity [8]. The International Union for Conservation of Nature (IUCN) encapsulates NbSs as strategies that utilize natural ecosystems for effective and adaptive societal challenge mitigation [9]. NbSs offer a multitude of benefits, including biodiversity enhancement, habitat creation, urban flooding risk reduction, and surface runoff quality improvement [10], and have historically provided vital ecosystem services in response to climatic changes [11]. In addition, economic analyses further reveal NbSs as cost-effective alternatives to traditional engineering solutions in flood mitigation [12].
Despite these advantages of NbSs, investment in their implementation remains limited. They currently receive only a small portion of global aquatic resource management funds [13]. Several barriers hinder the integration of NbSs in urban areas, including conceptual ambiguities, budgetary limitations, and a lack of public awareness [14]. Additionally, integrating NbSs into densely populated urban environments, especially heritage cities, introduces further complexities. Studies have shown that the spatial, social, and cultural dynamics of heritage urban landscapes (HULs) often conflict with the requirements of NbSs, particularly regarding the preservation of cultural heritage [15,16]. These issues are exacerbated by the limited space available for green infrastructure and the presence of historical buildings and infrastructure that may hinder the deployment of NbSs [16]. For instance, constructing stormwater retention basins near ancient temples or historic districts may face opposition from local communities and heritage conservation agencies. This resistance stems from the perception that such modifications may undermine the cultural value and authenticity of the sites [17]. Additionally, the dense urban fabric and structural intricacies of HULs pose significant engineering and design challenges for NbSs [18]. These areas often have limited space for large-scale green infrastructure due to high building density and the presence of immovable historic structures. Additionally, the aging infrastructure common in such cities complicates the integration of modern hydrological systems. While extensive research exists on NbSs, there is a notable gap in strategies specifically designed for HULs, where socio-economic and cultural heritage variables that are integral to heritage cities require greater exploration.
To address these challenges, recent research has focused on the deployment of spatial planning tools and methodologies aimed at optimizing NbS integration with urban landscapes. Tools that combine Geographic Information System (GIS), multi-criteria decision analysis, and geospatial modeling have been proposed to identify the most suitable areas for NbSs within cities [19,20,21]. In addition, recent studies have highlighted the importance of socio-economic considerations in NbS planning. For example, studies on the ecological footprint, economic complexity, and resource rents in Latin America suggest that NbSs could contribute to more sustainable urban development by aligning with broader economic and environmental goals. Other research, such as that on agricultural productivity and rural poverty in China, emphasizes the importance of land reform and public–private partnerships in enhancing the effectiveness of NbSs in rural and urban settings alike. These studies underscore the necessity of integrating local socio-economic conditions and policies into NbS strategies to ensure their long-term sustainability and success.
While NbSs have been widely studied, their implementation in heritage cities remains under-explored due to spatial constraints and cultural sensitivities. This study bridges this gap by proposing a spatially optimized NbS framework tailored for heritage-rich urban environments. The objectives are twofold: (1) to assess the efficacy of an integrated methodology in improving urban flood risk governance and (2) to conduct an in-depth spatial analysis to pinpoint areas most conducive to NbS integration. By examining the complex interplay between spatial, socio-economic, and cultural heritage factors, this research seeks to bridge technical expertise with societal considerations in the planning of NbS strategies. In doing so, it contributes to advancing the achievement of key Sustainable Development Goals (SDGs), particularly those related to climate action (SDG13), sustainable cities and communities (SDG11), and life on land (SDG15) [22,23,24]. The novel contribution of this work lies in its application of a robust evaluative framework designed to optimize flood risk management within heritage urban environments, thereby fostering urban sustainability. This framework harmonizes spatial intelligence with socio-economic dynamics and urban design considerations, providing a foundation to create more resilient, sustainable urban spaces within heritage contexts.

2. Materials and Methods

In this investigation, a multifaceted approach is deployed, utilizing the Spatial Multi-Criteria Evaluation (SMCE) as the cornerstone to judiciously assess the impact of various hydrological and socio-economic factors on HULs. This methodological framework is designed to offer a comprehensive appraisal tailored specifically to address the nuances of HULs in the context of urban flooding susceptibility. Subsequent to the strategic identification of prior areas, customized NbSs are presented. These NbS interventions, conceived through collaborative engagements with local historiographers and urban planning experts, are meticulously aligned with the cultural and historical ethos of HULs.
The elucidated approach unfolds in two distinct yet interrelated phases, as illustrated in Figure 1. The initial phase utilizes a GIS-based multi-criteria assessment in ArcGIS 10.8 to integrate exposure and vulnerability metrics, enabling the identification of townships primed for the implementation of NbSs. Spatial interpolation and weighted overlay techniques are employed to synthesize these factors, generating composite flooding risk maps that delineate high-risk areas requiring targeted interventions. The subsequent phase is dedicated to identifying optimal locales for NbS integration, utilizing geospatial analytics through ArcGIS 10.8 while adhering rigorously to technical parameters. This method, with its rich tapestry of detailed considerations, has the potential to evolve into an indispensable instrument and mitigate the challenges of urban flooding risks inherent to historic environments.
This study not only offers a technical examination of NbSs for urban flood mitigation but also significantly advances societal resilience in heritage cities such as Quanzhou. The societal benefits of the proposed NbS framework are manifold: First, it aims to safeguard and preserve culturally significant HULs from the detrimental effects of urban flooding, thereby protecting the city’s cultural identity and invaluable heritage assets, which are vital to both local and global communities [25]. Second, the implementation of NbSs aims to enhance community resilience by reducing flood risks, particularly in vulnerable districts with high socio-economic and historical importance, thereby ensuring the safety and well-being of residents [26]. Finally, the prioritization of flood mitigation in high-risk areas, especially those with considerable cultural and historical value, can foster social equity by addressing the disproportionate vulnerability experienced by marginalized communities, whose existing social and economic challenges are often exacerbated by frequent flood events.

2.1. Study Area

Quanzhou, China’s new world heritage city, emerges as a beacon of cultural and historical significance in the southeastern region of China, positioned along the coastline of the Taiwan Strait. With a history that stretches back over a millennium, Quanzhou has been a crucial hub in regional dynamics, its core urban area sprawling near the estuary of the Jinjiang River. The city’s rich tapestry of history is evident in its architecture, cuisine, and cultural traditions, bearing witness to a glorious past. As a vital port in the Maritime Silk Road and a key player during various historical periods, Quanzhou’s diverse cultural heritage is vividly reflected in its ancient temples and historic buildings. Iconic landmarks such as the Kaiyuan Temple, the Quanzhou Maritime Museum, and the Qingjing Mosque underscore the city’s deep cultural and historical significance.
Geographically situated just north of the Tropic of Cancer, Quanzhou experiences a humid subtropical climate, with an annual rainfall of approximately 1000 mm. Rainfall patterns in Quanzhou are largely influenced by the East Asian monsoon. The focus of this study is the central urban areas of Quanzhou, as depicted in Figure 2. This encompasses the 17 townships in the districts of Licheng and Fengze, collectively housing a population of over 1.1 million. These districts, known for their varied urban structure and socio-economic diversity, have historically faced challenges related to urban water management, including periodic urban flooding. Quanzhou’s susceptibility to urban flooding is intensified by a combination of rapid urbanization, geological factors, and climatic changes. In response, local governance has recognized the urgent necessity to address the increasing risks of urban flooding, especially those HULs areas with outstanding historical value located in the central urban areas, leading to the exploration and implementation of innovative, sustainable solutions, including the adoption of NbSs.

2.2. Exposure Module

In the delineation of urban flooding exposure, the inherent characteristics of urban sub-catchments are paramount. These include the topography, vegetation, soil composition, and built environment structure [27,28,29]. Consequently, a sextet of spatial variables has been identified as pivotal in assessing the exposure of urban areas to inundation. These determinants are as follows: (i) the Normalized Difference Vegetation Index (NDVI), which serves as a proxy for vegetative density; (ii) the Building Congestion Degree (BCD), reflecting the extent of urban development; (iii) the Road Network Density (RND), indicative of potential water flow impediments; (iv) the Surface Runoff Coefficient (SRC), a measure of impervious surfaces; (v) the concentration of Particulate Matter with a diameter of less than 2.5 μm (PM2.5), as an index of urban emissions; and (vi) ambient temperature, which can influence evaporation rates and rainfall patterns. The specific indicators and their data sources are detailed in Table 1.

2.2.1. Normalized Difference Vegetation Index (NDVI)

The NDVI serves as a critical quantitative index representing the presence and biophysical properties of vegetation [30]. It is derived from remote sensing data by calculating the difference between near-infrared (which vegetation strongly reflects) and red light (which vegetation absorbs). This spectral metric is pivotal for assessing vegetation’s role in urban hydrology, as vegetative cover can mitigate surface runoff and influence urban microclimates, thereby impacting the hydrological response to precipitation events [31]. For this investigation, the NDVI was obtained from the MOD13Q1v061 dataset product, which emanates from NASA’s Surface Process Data Center [32]. Utilizing this dataset enables the characterization of vegetative cover with a high degree of precision. The NDVI data, structured in a 30 × 30 m raster format, provide a detailed representation of vegetation patterns across each township under study.

2.2.2. Building Congestion Degree (BCD)

The BCD is an integral metric that quantifies the volumetric dominion of architectural structures within a specified urban boundary. This parameter provides a sophisticated understanding of the consequences that urban form has on the mechanisms of stormwater management at a microscale level within the urban fabric [33]. By delineating the volumetric ratio of built structures against the total land volume within a given urban precinct, the BCD yields a scalar value indicative of structural densification. The current study hypothesizes that increased BCD values correlate with a proportional decrease in infiltration rates, leading to an exacerbated manifestation of the Surface Runoff Coefficient. Such a condition is inherently linked to the attenuation of available permeable substrates capable of facilitating the effective hydrological assimilation of precipitation events.

2.2.3. Road Network Density (RND)

The pervasiveness and complexity of a city’s road network are critical in influencing urban hydrology and the consequent risk of urban flooding [34]. In this study, the RND was determined by employing the thoroughfare connectivity metric, which quantified the total length of the roadways per township, expressed in kilometers per hectare (km/ha). While the hydrological responses in areas with a dense road network may be complex, it was hypothesized that a well-connected roadway system is indicative of efficient urban planning, potentially facilitating improved stormwater management and reducing urban flooding risk [34].

2.2.4. Surface Runoff Coefficient (SRC)

In the calculus of urban hydrodynamics, the SRC is an essential metric integral to the quantification of pluvial efflux predicated upon the absorptive and transmissive properties of urban surfaces. Operationalized through the rational method, the SRC offers a stratagem to delineate urban sectors with inherent exposure to inundation phenomena [35]. Initial granular land use analysis was arrayed over a 10 × 10 m geospatial grid, and the study proceeded to dissect the land use heterogeneity within each township. Following this, an exhaustive evaluation of the varied land use typologies and their respective geospatial distributions was conducted, enabling the computation of a nuanced, township-specific SRC [36]. This approach affords a refined lens through which the potential for urban flooding can be anticipated and mitigated.

2.2.5. Particulate Matter 2.5 (PM2.5)

PM2.5 is a critical determinant in assessing environmental quality, with significant repercussions for urban health and hydrology. Elevated levels of PM2.5 are associated with increased surface pollutants, which can affect the quality of stormwater runoff and exacerbate the environmental impact of urban flooding [37]. In this context, understanding the spatial distribution of PM2.5 is essential for identifying areas at risk of pollution-propelled waterlogging and for developing strategies to mitigate its adverse effects. In this study, the PM2.5 levels were characterized using a raster-based approach with a high-resolution dataset at 1 km spatial granularity, sourced from the Resource and Environment Science and Data Center of China (https://www.resdc.cn/ (accessed on 19 November 2023)).

2.2.6. Temperature

The average annual temperature is a salient factor in the assessment of urban flooding risk, with considerable implications for both hydrological cycles and urban resilience [38]. Higher average temperatures can lead to increased evaporation rates, potentially intensifying urban flooding scenarios through the amplification of the hydrological cycle. Elevated temperatures may also exacerbate the thermal expansion of water bodies and contribute to more frequent and severe precipitation events, which, in combination with impervious urban surfaces, can result in heightened risks of urban inundation [39]. This study employed a raster-based methodology to elucidate the spatial distribution of average annual temperatures across Quanzhou with a resolution of 1 km, utilizing data procured from the Resource and Environment Science and Data Center of China (https://www.resdc.cn/ (accessed on 19 November 2023)).

2.3. Vulnerability Module

Determining the vulnerability of HULs to urban flooding involves a complex interplay between tangible heritage assets and the socio-economic milieu that underpins them. Socio-economic vulnerability is characterized by a confluence of social, cultural, economic, political, and institutional forces that collectively calibrate the community’s threshold for disaster, as well as its proficiency in pre-disaster planning, crisis navigation, and post-event recovery [40]. Central to this inquiry is socio-economic resilience in relation to hazard exposure, which focuses on demographic density and economic vitality [41]. Additionally, the stewardship and integrity of the historic urban landscape—comprising cultural relics, heritage buildings, educational establishments, and healthcare institutions—constitute critical metrics for assessing social vulnerability [42]. These elements play a decisive role in shaping communal fortitude, adaptive capacity, and regenerative potential in the aftermath of natural perturbations. In this vein, the present study selected a suite of seven indices emblematic of vulnerability: the national cultural relic, provincial cultural relic, historic building, educational establishment, medical institution, Gross Domestic Product (GDP), and population density (Quanzhou Municipal People’s Government, 2024; retrieved from https://www.quanzhou.gov.cn/lyb/lswh/zdww/index_1.htm (accessed on 23 November 2023)). These indicators are pivotal in constructing a comprehensive index that illuminates the intricate tapestry of HULs and their susceptibility to hydrometeorological disturbances (Table 1).

2.3.1. Cultural Heritage Indicators

In the study of urban flooding vulnerability in heritage cities, HULs emerge as a paramount concern, encompassing National and Provincial Cultural Relics and Historic Edifices that are repositories of cultural heritage. These assets, quantified by the number of national cultural relics, provincial cultural relics, and historic buildings, are sourced from the Quanzhou Municipal People’s Government (2024) (Retrieved from https://www.quanzhou.gov.cn/lyb/lswh/zdww/index_1.htm (accessed on 23 November 2023)). They not only contribute to the socio-cultural fabric of this place but also to the socio-economic vitality of Quanzhou. Their susceptibility to damage is heightened during urban flooding events, which could lead to the irrevocable loss of heritage and cultural identity.

2.3.2. Educational and Health Infrastructure

The density of educational establishments and medical institutions, representing the educational and health infrastructure, respectively, are factored into the vulnerability calculus, with point-location data obtained from Amap [43]. The rationale for their inclusion in vulnerability assessments stems from the fact that higher concentrations of these institutions often correlate with larger economies and elevated population densities, which, in turn, can exacerbate the impact of waterlogging due to the sheer volume of individuals and assets affected. The integral role these facilities play in community resilience is paradoxically a source of vulnerability; their impairment during floods can severely disrupt societal function and recovery processes [44].

2.3.3. Gross Domestic Product (GDP) and Population Density

A higher GDP often aligns with denser infrastructure and populations, which can intensify the severity of flooding impacts through increased exposure [45]. Similarly, population density metrics are pivotal in understanding the potential scale of impact. Higher densities can lead to more significant challenges in evacuation, rescue operations, and post-flood recovery [46], necessitating more robust urban planning and disaster preparedness measures.

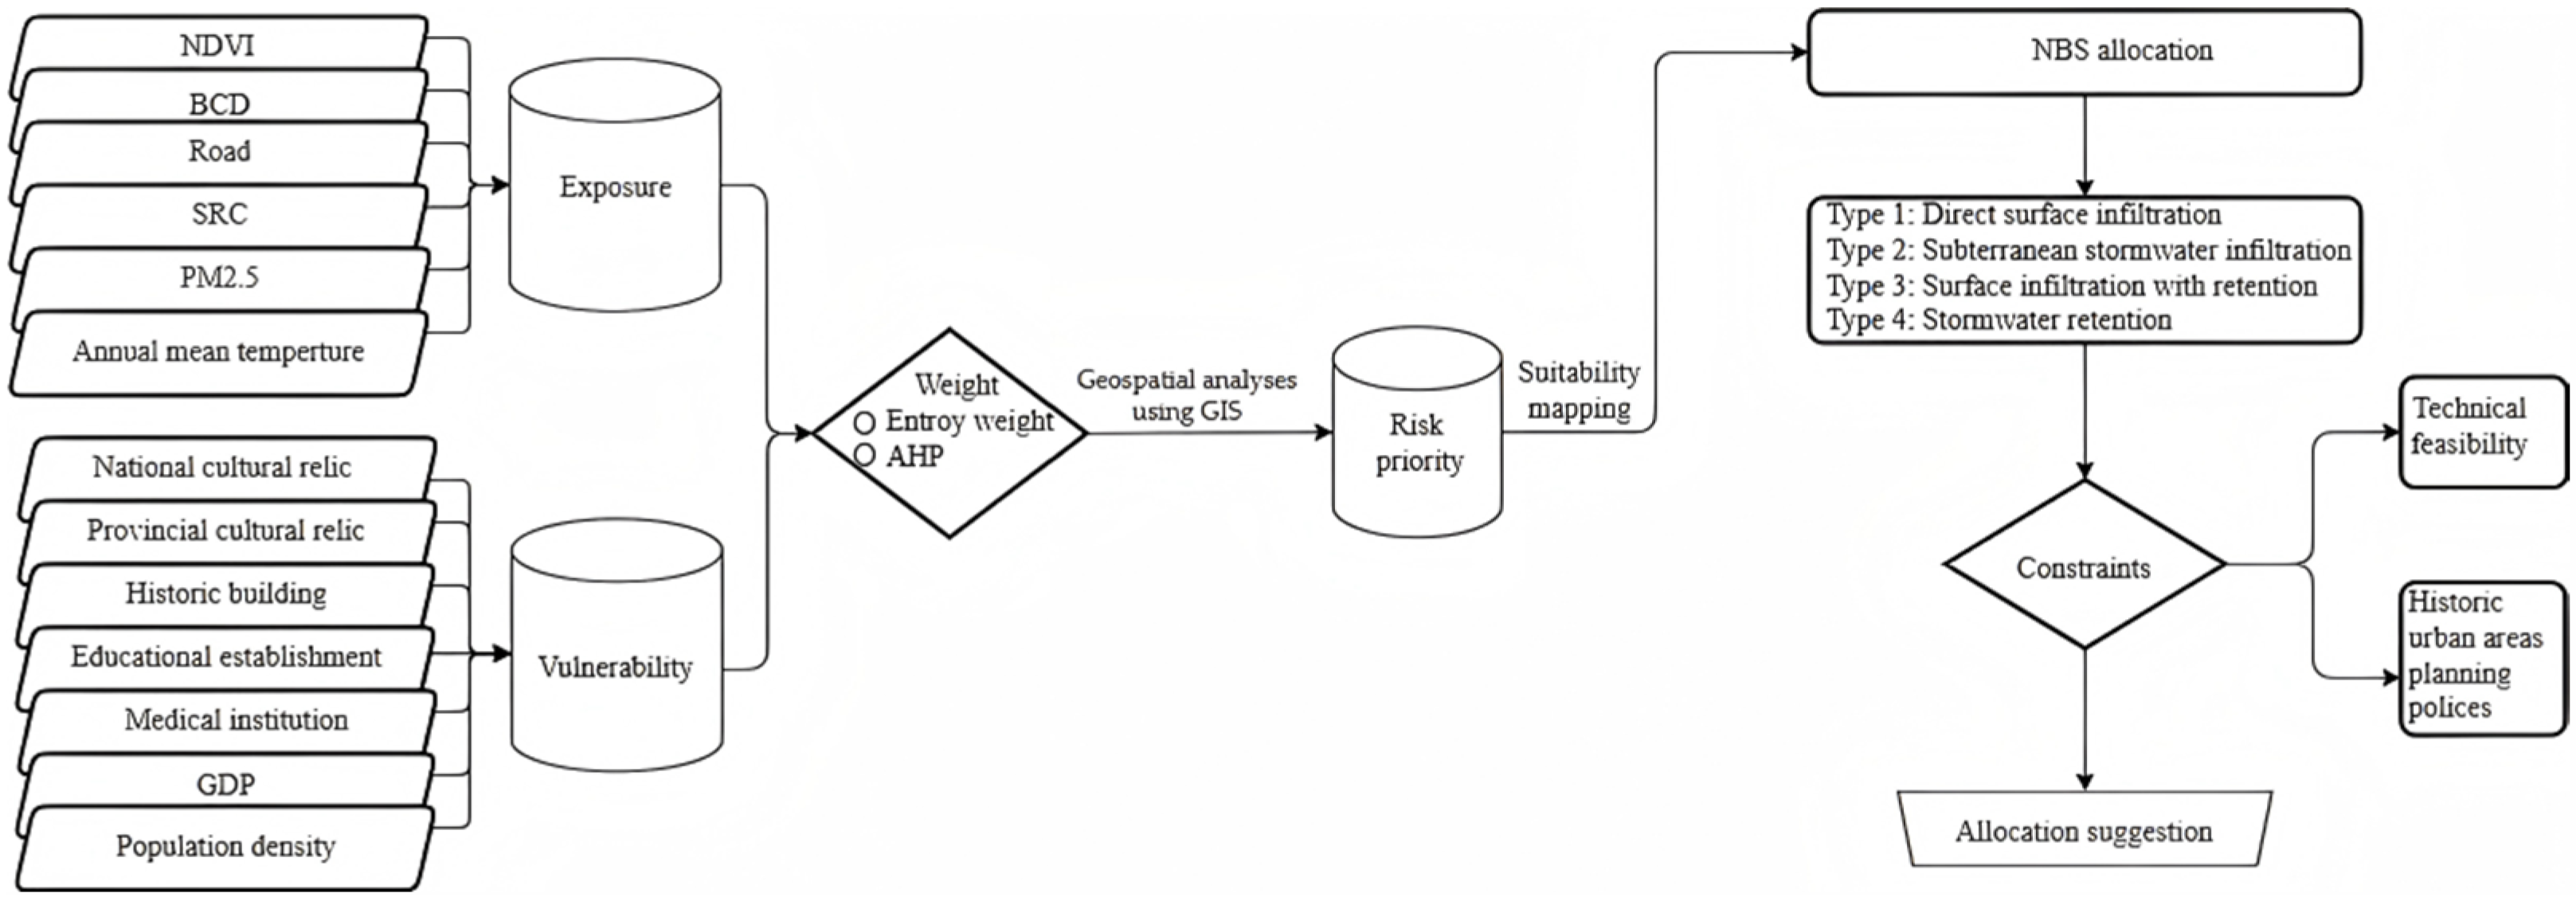
2.4. Spatial Multi-Criteria Evaluation (SMCE)

SMCE was pivotal in integrating various spatial and socio-economic indicators to identify optimal zones for the deployment of NbSs within Quanzhou’s HULs [47]. This method tackled the inherent complexity of prioritizing flood risk areas by employing a systematic step-by-step process, ensuring comprehensive and replicable outcomes.
The SMCE process unfolded in the following stages:
(1)
Criteria Selection: A literature review and expert consultations informed the selection of criteria relevant to flood exposure and vulnerability. Criteria included the NDVI, BCD, RND, SRC, PM2.5, temperature, cultural heritage indicators, educational and health infrastructure, GDP, and population density.
(2)
Data Standardization: Each dataset was normalized to a uniform scale (0–1), ensuring comparability. A suitability range was established for each indicator based on its role in flood risk and mitigation.
(3)
Weight Assignment: An integrated weighting scheme combining the Analytic Hierarchy Process (AHP) and Entropy Weighting (EW) was employed [48]. AHP accounted for expert judgment [49], while EW provided an objective basis derived from data variability [50]. The final weight for each criterion was computed using Equation (1):
W i = a H i + ( 1 a ) E i
where Wi, Hi, and Ei are the integrated, AHP, and EW weights for the i-th criterion, respectively, and =0.5 reflects the equal importance of subjective and objective weights.
(4)
Mapping and Aggregation: Weighted criteria were aggregated using a linear additive model to generate composite exposure and vulnerability maps. A combined flood risk map was developed by overlaying these layers.
(5)
Validation of Results: The SMCE results were cross-verified against recorded flood incidents over the past decade.
The fusion of AHP and EW within the SMCE framework engenders a multi-faceted evaluative mechanism. This synergistic approach not only encapsulates subjective expertise and preferences but also harnesses objective data-driven insights, culminating in a comprehensive and nuanced weighting scheme [48]. Such a methodological synthesis is pivotal in the spatial risk assessment of urban flooding, as it ensures a holistic consideration of both qualitative and quantitative factors, thereby enhancing the efficacy and precision of NbS site selection in HULs.

2.5. Spatial Allocation of Nature-Based Solutions Applied in Historical Urban Landscapes

Upon discerning zones of heightened susceptibility during pluvial inundation events, the strategic placement of NbSs warranted meticulous evaluation. This study was guided by technical feasibility stipulations governed by spatial prerequisites for deployment. Given the expansive scope of high-vulnerability zones, primacy was conferred to townships manifesting a pronounced risk within their township framework. The meticulous appraisal of these constraints is quintessential for crafting urban spatial blueprints, particularly in cities imbued with historical and cultural gravitas, such as Quanzhou.
Subsequently, based on the current state of knowledge on NbSs applied in HULs, possible models of NbSs were identified. The analysis enabled the distinction of four representative models of NbSs in HULs, which were considered in this research:
Solution I—Direct Surface Infiltration Model: This model employs surface infiltration solutions to facilitate the direct percolation of stormwater into the ground. It represents a simplistic yet effective method for surface runoff mitigation, harnessing the inherent permeability of specialized materials and infiltration surfaces to enhance urban hydrological cycles.
Solution II—Subterranean Stormwater Infiltration Modele This model epitomizes a sustainable approach where stormwater is systematically collected via drainage systems and subsequently channeled to underground facilities. Here, it undergoes infiltration into the subsoil strata, effectively reducing surface runoff and augmenting groundwater recharge.
Solution III—Surface Infiltration with Retention Model at Source: In this configuration, stormwater is amassed in either open or enclosed systems and then diverted to surface infiltration sites. These micro-facilities are uniquely designed to allow for the periodic retention of stormwater, thereby moderating the rate of infiltration and offering controlled release into the ground.
Solution IV—Stormwater Retention Model: This model is designed for the management of stormwater volumes and flow rates. It involves the collection of water runoff in urban drainage areas, leading to retention facilities. These larger structures are engineered to attenuate stormwater runoff hydrographs from the catchment area, thereby mitigating peak flow impacts on downstream water bodies.
In the context of NbS’s technical feasibility, optimal locales and boundary delineations for each proposed intervention underwent rigorous scrutiny guided by prevailing scholarly discourse, as exemplified in Table 2. An exhaustive cartographic representation of both urban planning and technical feasibility constraints was conducted via GIS methodologies. The synthesis of all constraint mappings culminated in the formulation of a suitability cartogram for each proposed NbS variant, delineating their prospective placement within the designated precinct.

3. Results

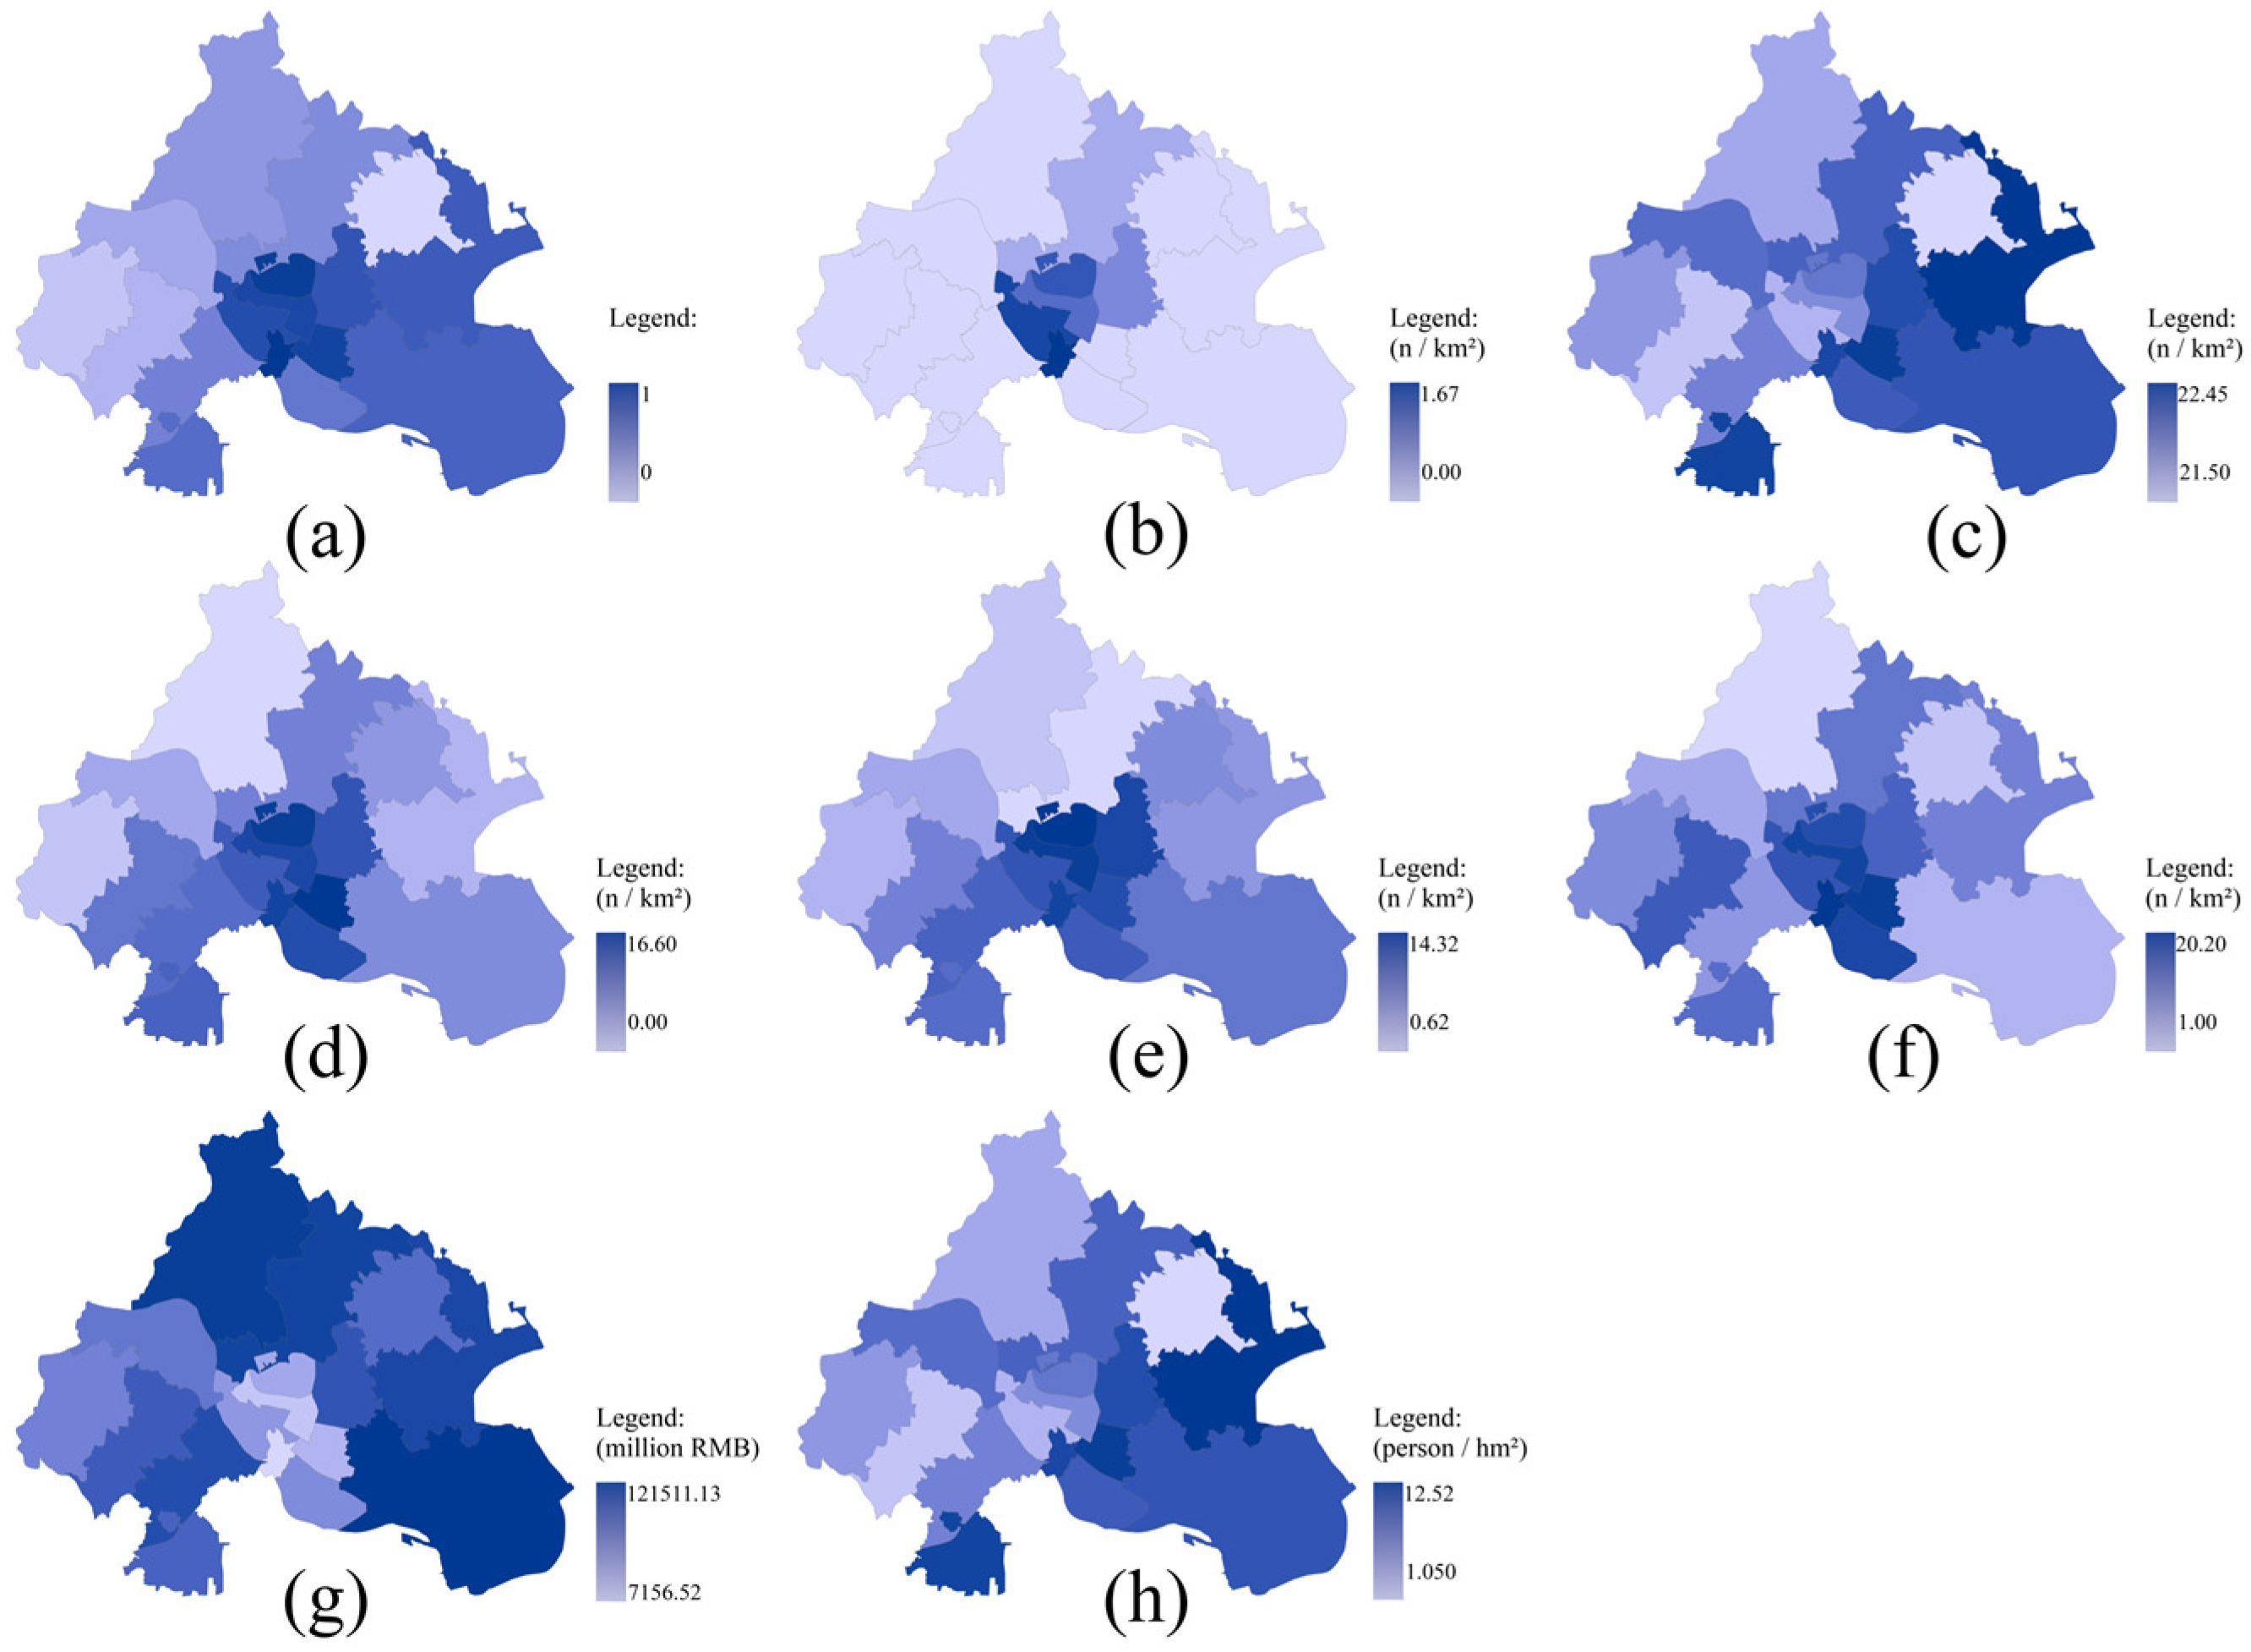
3.1. Exposure and Vulnerability Modeling

3.1.1. Exposure Mapping

The exposure mapping of the central urban areas in Quanzhou delineates zones with an inherent propensity for urban inundation (Figure 3a), as discerned through a comprehensive analysis utilizing a set of six pivotal indicators: NDVI (Figure 3b), BCD (Figure 3c), RND (Figure 3d), SRC (Figure 3e), PM2.5 (Figure 3f), and temperature (Figure 3g). Each indicator’s significance was meticulously quantified employing the AHP, EW, and linear-weighting approaches. The algorithmic weights assigned to these indicators, cataloged in Table 3, thus offer a nuanced understanding of their relative influence on urban flooding exposure. SRC was identified as the preeminent factor, accounting for 30.0% of the exposure risk, while the BCD, PM2.5, temperature, RND, and NDVI followed with respective weights of 17.0%, 16.8%, 14.5%, 11.8%, and 10.5%.
These data underscore the pivotal role of SRC in orchestrating the dynamics of urban flooding exposure. The primacy importance of SRC, accounting for a substantial 30.0% in the weighting schema, is unequivocal. It embodies the complex interplay between surface runoff and subterranean infiltration, both of which are instrumental in determining a local area’s exposure to pluvial inundation [52]. Concurrently, the architectural conformation’s influence on flooding, as encapsulated by the BCD, resonates profoundly with established academic postulations [53]. This is further corroborated by Zhen et al. [54], who examined the nuanced ways in which urban architectural configurations and orientations influence surface runoff, thus recalibrating urban flooding risks in terms of both intensity and spatial distribution.
The designated weights for PM2.5 and temperature, at 16.8% and 14.5%, respectively, reflect the burgeoning acknowledgment of atmospheric conditions as salient determinants of urban flood dynamics. The augmentation of PM2.5 concentrations is posited to modify precipitation patterns, whilst escalated temperatures are linked to intensified rainfall events. This paradigm is aligned with the insights of Yang et al. [55] and Wang et al. [56], who investigated the interplay between urban heat islands, air pollution, and localized meteorological phenomena. Complementing these factors are RND and NDVI, with assigned weights of 11.8% and 10.5%, respectively. RND is pivotal in dictating the efficacy of urban stormwater management systems, whereas NDVI serves as an indicator of vegetative cover, and is crucial for mitigating runoff. These aspects align with extant research that probes into the impact of urban green spaces and thoroughfare networks on stormwater regulation and urban flooding risk mitigation [57].
Exposure mapping thus emerges as an essential tool, equipping urban planners with the acumen to pinpoint flood-prone areas and devise tailored mitigation strategies [58]. This includes enhancing drainage infrastructure, adopting prudent land management practices, and implementing NbSs. Such interventions, seamlessly integrated within areas marked by elevated urban flooding exposure, are instrumental in attenuating potential inundation impacts. Moreover, this cartographic utility acts as a strategic guidepost for directing future urban expansion and infrastructure development, ensuring that their design is meticulously attuned to holistic resilience against looming urban flooding challenges.

3.1.2. Vulnerability Mapping

Vulnerability mapping for the districts Licheng and Fengze represents a critical analytical instrument, offering a refined and detailed perspective on the city’s vulnerability to hydrological disasters. This exercise probes the complex interrelation of factors, such as cultural heritage, educational, and health infrastructure, alongside GDP and population density, thus mapping out the potential socio-economic ramifications of urban flooding events (Figure 4).
The findings highlight the paramount importance of cultural heritage, which constitutes 71.1% of the vulnerability index in HULs (Table 3). This pronounced focus on cultural heritage underscores its indispensable role not only in terms of historical and esthetic valor but also as a cornerstone of the social and economic structure of Quanzhou. The safeguarding of these heritage sites is imperative, as their devastation would not only signify a loss of cultural patrimony but could also adversely affect the tourism sector and the broader economy. This observation is congruent with scholarly research emphasizing the susceptibility of cultural heritage locales to natural calamities, especially urban flooding [59].
This assessment ascribes relatively large weights to educational establishments and medical institutions, at 10.6% and 8.4%, respectively (Table 3). These figures reflect the roles of such infrastructure in fostering urban resilience. These institutions are vital not only for their primary services but also as sanctuaries and resource hubs in the event of floods [60]. The impairment of these facilities during floods can exert extensive repercussions on community welfare, a notion supported by Zhang et al. [61]. Moreover, the weights attributed to GDP and population density are 4.3% and 5.7%, respectively. The methodology adopted in this study resonates with the approach of Pacetti et al. [20], who utilized a multi-criteria decision analysis framework, integrating indicators like population density, GDP, and sensitive infrastructures to construct vulnerability maps.
Vulnerability mapping acts as a strategic instrument in augmenting disaster readiness and response capabilities. By pinpointing areas of acute vulnerability, this mapping enables focused interventions, allowing for the strategic allocation of resources, the refinement of emergency responses, and the enhancement of the overall resilience of HULs against urban flooding. This comprehensive method of vulnerability assessment is vital in formulating informed, proactive, and adaptable strategies for urban planning and disaster management, ensuring an effective and efficient response to natural hazards [58].

3.1.3. Priority Townships Located for Nature-Based Solutions Through Mapping

The strategic delineation of priority townships within the urban fabric of Quanzhou for flooding mitigation initiatives is founded upon an intricate synthesis of exposure and vulnerability factors. As explicated in Table 4, the top-tiered locales in terms of integrated exposure and vulnerability are the townships of Linjiang (11.8%), Kaiyuan (10.3%), and Lizhong (9.5%), prominently situated in the historical precinct of Licheng District. This discernment culminates in a comprehensive spatial schema, pinpointing the most favorable sites for the implementation of NbSs, as depicted in Figure 5.
This analytical study yields critical insights into the spatial stratification of Quanzhou’s townships, earmarking them as focal points for NbS interventions aimed at alleviating urban flooding challenges. The distribution of risk rates illuminates the paramount importance of stormwater runoff control juxtaposed with socio-cultural considerations, thereby underscoring the necessity of an integrative strategy that coalesces technical expertise with socio-cultural awareness in the formulation of NbS approaches [62]. Additionally, this analysis accentuates the urgency of reinforcing flood-prone cultural heritage sites, simultaneously advocating for the principle of environmental equity in the design and execution of NbS plans [63]. The fusion of these diverse criteria, adeptly facilitated through the application of the SMCE, establishes a robust spatial framework. This framework is instrumental in guiding urban planners and decision-makers, enabling them to allocate resources judiciously and ensure that NbS interventions are strategically positioned to enhance urban resilience in the face of escalating urban flooding risks.

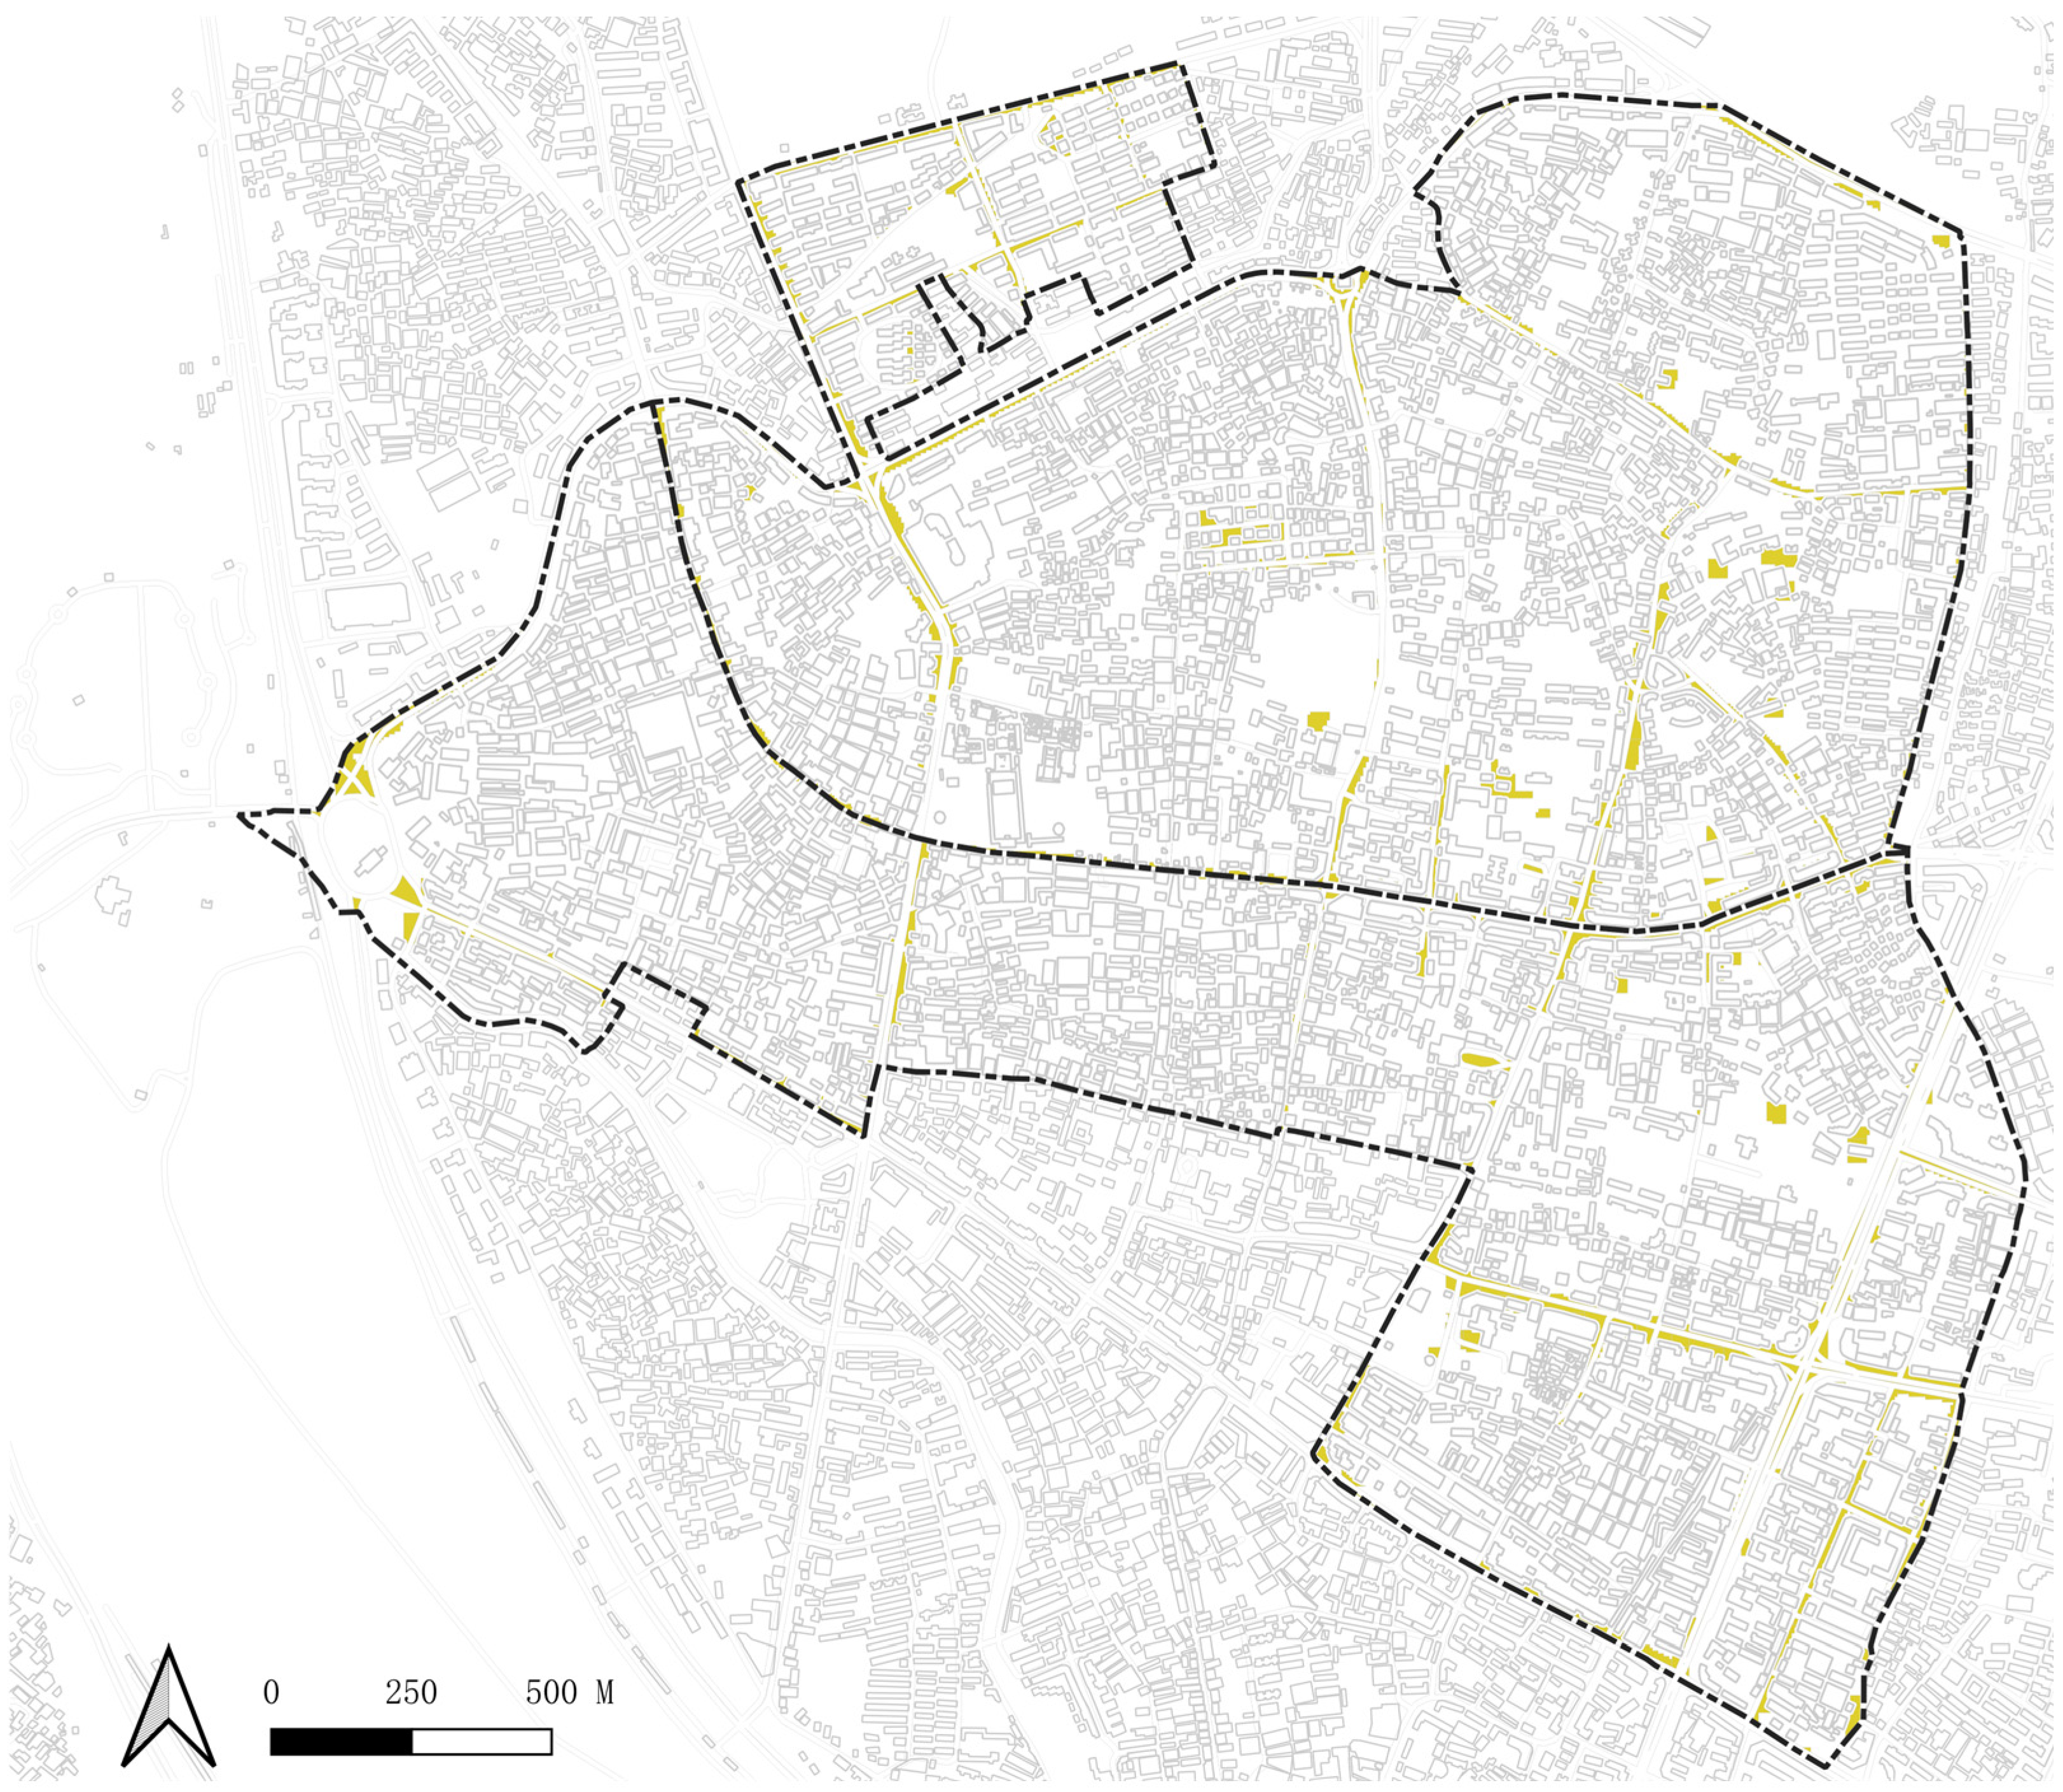
3.2. Spatial Planning of Nature-Based Solutions in Historical Urban Landscapes

The townships of Kaiyuan and Lizhong, distinguished by their complex aggregation of heritage units and heightened urban flooding risks, serve as study cases for the spatial delineation of NbSs. Their selection is grounded in the explicit necessity for NbS implementation, which is reflective of the inherent risk profile of these areas. The townships Kaiyuan and Lizhong, with their deep historical significance, represent an intricate interplay between HULs and modern urban planning, making them ideal for the application of this integrated strategic approach. The study reveals a differential distribution in the applicability of four distinct NbS strategies, with Solutions I and II showing broader applicability, while Solutions III and IV are constrained to more limited areas.
Technical feasibility assessments play a crucial role in determining the applicability of various NbSs within specified townships. Solution I (170.9 ha), comprising an underground infiltration module coupled with an underground sand filter, is particularly effective, offering adaptability even within spatially restricted environments (Figure 6). This solution’s viability stems from its compact design, enabling implementation in areas where surface space is vast. Solution II (52.3 ha), incorporating similar components to Solution I, also shows promising potential for neighborhood-wide application, particularly in heritage districts characterized by extensive hard paving (Figure 7). The diverse array of green source management measures, including bioretention cells, bioswales, and tree box filters, offers versatility and allows for tailored application to the unique spatial constraints of historical urban landscapes. Additionally, the integration of previous paving systems within existing infrastructure, such as parking areas, walkways, and cycling paths, further extends the applicability of Solution II in HULs.
Conversely, Solution III (6.8 ha), primarily consisting of rain gardens, appears to be suited for implementation in smaller, decentralized green spaces (Figure 8). However, the high-density nature of HULs, where open spaces are often dominated by hard-paved surfaces, poses a challenge to the widespread adoption of Solution III. The scarcity of flexible green spaces in such densely built areas limits the feasibility of this solution. Solution IV (8.5 ha), encompassing retention ponds and constructed wetlands (Figure 9), faces constraints due to its requirement for larger spatial allotments. Consequently, this approach is typically relegated to more peripheral areas of townships, where the urban fabric is less dense and more accommodating for expansive NbS installations.
The findings present a qualitative assessment of the spatial viability of the implementation of NbSs. These data indicate that only a fraction of the townships’ total area, ranging from 1.3% to 33.5%, is inherently suitable for extensive NbS application. This insight is particularly relevant for cities like Quanzhou, where the coexistence of dense populations and numerous historical sites presents unique challenges. In such urban contexts, the possibilities for widespread NbS deployment are intrinsically limited, highlighting the need for detailed, strategic planning.
This preliminary allocation of NbSs fosters the evaluation of alternative intervention scenarios, synergizing NbSs with existing grey infrastructure. However, this phase calls for more detailed analysis using advanced hydrological modeling, which is essential for a thorough assessment of the actual impact of NbSs on flood dynamics in townships. The intervention maps thus derived provide critical inputs for the design phase, and the efficacy of these measures in addressing urban flooding can be analyzed through specialized modeling techniques [64]. Advanced hydrological modeling, complemented by hydraulic simulations, is pivotal in this regard, enabling the quantification of the impacts of NbSs on reducing drainage network loads, as detailed by Kumar et al. [65].

4. Discussion

The findings of this study establish a robust and methodologically rigorous foundation for the integration of NbSs into urban flood risk management, particularly within HULs such as Quanzhou. By meticulously analyzing both exposure and vulnerability factors, this study successfully identified high-risk zones within the urban fabric, specifically the townships of Linjiang, Kaiyuan, and Lizhong, as critical priorities for NbS intervention. Situated within the historically significant Licheng District, these townships are characterized by their elevated vulnerability and exposure to flooding, underscoring the necessity of prioritizing these areas for mitigation efforts. The integration of these multifaceted factors into a spatial framework, as depicted in Figure 5, provides urban planners with a practical, data-driven tool for the systematic allocation of resources, enabling targeted, high-impact interventions.
The application of the SMCE-NbS framework, as demonstrated in this study, highlights its versatility and adaptability as a robust methodology for the identification of NbS zones and the assessment of flood risks across diverse urban contexts. The modular design of the framework facilitates its scalability to larger geographical regions, including coastal cities and expansive river basins, thus extending its applicability well beyond the boundaries of Quanzhou. By leveraging universally accessible datasets, such as land use, the NDVI, and hydrological parameters, this framework can seamlessly incorporate additional variables pertinent to specific regions. For example, coastal urban centers can integrate projections of rising sea levels [66], while arid regions may prioritize the consideration of water scarcity alongside flood risks [67]. This inherent flexibility ensures that the methodology remains relevant and adaptable across a wide spectrum of urban environments grappling with flood risks, all while embedding region-specific socio-economic, cultural, and environmental contexts into its application.
Moreover, the study emphasizes the critical importance of balancing technical flood risk mitigation strategies with socio-cultural considerations in heritage-rich urban areas. Given that the presence of cultural heritage assets often exacerbates urban flood risks, these findings advocate for a holistic, integrative approach to flood management that simultaneously addresses technical and cultural dimensions [68]. The vulnerability mapping conducted in this study reveals that cultural heritage assets account for over 70% of the vulnerability index, thereby underscoring the profound influence of heritage on shaping the city’s flood susceptibility. This reinforces the compelling argument for adopting an NbS framework that not only targets physical flood risks but also preserves and integrates cultural heritage in the process of urban flood management.
The dual application of subjective (AHP) and objective (EW) weighting schemes within the SMCE-NbS framework further enhances its adaptability and applicability to diverse urban contexts. This dual approach ensures that expert knowledge derived from local and regional contexts is harmonized with empirical, data-driven insights. Such an approach not only strengthens the framework’s relevance to a wide array of cities but also facilitates its transferability to other heritage-rich urban landscapes with distinct geographical, cultural, and environmental characteristics. For instance, cities such as Venice, Italy, Hoi An in Vietnam could adjust the framework to align with their unique contextual nuances, tailoring NbS interventions to the specific needs of their populations and built environments [44,69]. In this way, this study aligns with global sustainability frameworks, such as the United Nations’ SDG 11, which advocates for sustainable, resilient cities that balance flood risk mitigation with cultural preservation and socio-economic resilience [70].
Among the key insights of this research is the identification of direct surface infiltration as the most feasible NbS strategy for Quanzhou, particularly in areas where spatial constraints are less pronounced. However, this study also highlights the limitations in densely built environments, where alternative NbS strategies, such as subterranean stormwater infiltration or retention-based solutions, are constrained by the availability of land [71]. These spatial limitations point to the necessity of integrating NbSs within existing urban infrastructure and heritage conservation policies to ensure both the feasibility and effectiveness of the proposed interventions [72]. The findings underscore the need for a nuanced, adaptive approach to the deployment of NbSs, taking into consideration the complex dynamics of urban density, land availability, and the interplay between natural systems and built environments.
Furthermore, this study advocates for future research focused on the long-term performance of NbSs under diverse and evolving climate scenarios [73,74]. Although the research provides valuable decision-support tools for urban planners, further hydrological modeling is essential to evaluate the long-term efficacy of NbSs in flood risk management. Such investigations could offer a more comprehensive understanding of the performance of NbSs across varying environmental conditions, enabling the refinement of the strategies employed and fostering more robust, adaptive flood management approaches. In turn, this would enhance the precision and resilience of urban flood risk mitigation efforts, contributing to the broader goal of sustainable, heritage-conscious urban development.

5. Conclusions

The findings of this study offer a comprehensive spatial framework for the integration of NbSs into urban flood risk management within HULs. By combining exposure and vulnerability mapping, this research provides a nuanced understanding of urban flooding risks, highlighting both the spatial and socio-environmental dimensions of flood susceptibility. The results indicate that SRC is the most significant contributor to flooding exposure, accounting for 30.0% of the total risk. Furthermore, high-density built environments and inadequate air quality emerge as exacerbating factors, intensifying the overall vulnerability of urban areas to flooding. Vulnerability mapping further reveals the critical role of cultural heritage assets, which account for 71.1% of the vulnerability index, underscoring the importance of prioritizing heritage-rich areas such as Linjiang, Kaiyuan, and Lizhong for NbS interventions.
The spatial allocation of NbS interventions suggests that direct surface infiltration (170.9 ha) is the most viable strategy, particularly in areas with sufficient land availability. However, this study also identifies spatial constraints in densely built environments, where alternatives such as subterranean stormwater infiltration (52.3 ha) and retention-based solutions are constrained by the limited availability of land. These findings highlight the necessity of integrating NbS strategies with existing urban infrastructure and heritage conservation policies to ensure their feasibility and effectiveness. This research provides valuable decision-support tools for urban planners and policymakers, offering a replicable methodology for the deployment of NbSs in flood-prone cities containing heritage sites.
It is imperative that governments institutionalize NbSs within statutory urban planning frameworks, thereby ensuring their systematic implementation in high-risk heritage districts. Policies must foster collaborative engagement among key stakeholders, including local communities, heritage conservation agencies, and urban planning experts, to ensure that NbS strategies are both culturally sensitive and contextually appropriate. Furthermore, the establishment of robust monitoring frameworks is essential for assessing the long-term effectiveness of NbSs, enabling adaptive management that can respond to evolving environmental conditions.
Future research should focus on the refinement of hydrological models to evaluate the long-term performance of NbS interventions under diverse climate scenarios. A deeper understanding of the temporal dynamics of NbSs is critical to optimizing flood risk management strategies, ensuring their adaptability and resilience in the face of climate change. Additionally, exploring methods to scale NbS solutions within constrained urban environments is crucial for expanding their applicability, thus enhancing their potential to mitigate flood risks in a wide range of urban settings.

Author Contributions

Conceptualization, M.W. and J.S.; methodology, J.Z.; software, J.Z.; validation, M.W.; formal analysis, J.S.; investigation, J.Z.; resources, M.Y.; data curation, M.W.; writing—original draft preparation, R.M.A.I.; writing—review and editing, M.W.; visualization, J.Z.; supervision, M.W. and M.Y.; project administration, R.M.A.I.; funding acquisition, M.W. All authors have read and agreed to the published version of the manuscript.

Funding

This research was funded by the Guangdong Basic and Applied Basic Research Foundation, China, grant number 2023A1515030158, and the Guangzhou City School (Institute) Enterprise Joint Funding Project, China, grant number 2024A03J0317. The APC was funded by the Guangdong Basic and Applied Basic Research Foundation, China, and the Guangzhou City School (Institute) Enterprise Joint Funding Project, China.

Data Availability Statement

The study does not report any publicly archived datasets.

Conflicts of Interest

The authors declare no conflicts of interest.

References

  1. Chen, X.; Zhang, H.; Chen, W.; Huang, G. Urbanization and climate change impacts on future flood risk in the Pearl River Delta under shared socioeconomic pathways. Sci. Total Environ. 2021, 762, 143144. [Google Scholar] [CrossRef]
  2. Marzeion, B.; Levermann, A. Loss of cultural world heritage and currently inhabited places to sea-level rise. Environ. Res. Lett. 2014, 9, 034001. [Google Scholar] [CrossRef]
  3. Hammond, M.J.; Chen, A.S.; Djordjević, S.; Butler, D.; Mark, O. Urban flood impact assessment: A state-of-the-art review. Urban Water J. 2015, 12, 14–29. [Google Scholar] [CrossRef]
  4. Wang, M.; Liu, M.; Zhang, D.; Zhang, Y.; Su, J.; Zhou, S.; Bakhshipour, A.E.; Tan, S.K. Assessing hydrological performance for optimized integrated grey-green infrastructure in response to climate change based on shared socio-economic pathways. Sustain. Cities Soc. 2023, 91, 104436. [Google Scholar] [CrossRef]
  5. Su, J.; Wang, M.; Razi, M.A.M.; Dom, N.M.; Sulaiman, N.; Tan, L.W. A Bibliometric Review of Nature-Based Solutions on Urban Stormwater Management. Sustainability 2023, 15, 7281. [Google Scholar] [CrossRef]
  6. Ruangpan, L.; Vojinovic, Z.; Di Sabatino, S.; Leo, L.S.; Capobianco, V.; Oen, A.M.P.; McClain, M.E.; Lopez-Gunn, E. Nature-based solutions for hydro-meteorological risk reduction: A state-of-the-art review of the research area. Nat. Hazards Earth Syst. Sci. 2020, 20, 243–270. [Google Scholar] [CrossRef]
  7. Cohen-Shacham, E.; Walters, G.; Janzen, C.; Maginnis, S. Nature-Based Solutions to Address Global Societal Challenges; IUCN: Gland, Switzerland, 2016; Volume 97, pp. 2016–2036. [Google Scholar]
  8. Dick, J.; Miller, J.D.; Carruthers-Jones, J.; Dobel, A.J.; Carver, S.; Garbutt, A.; Hester, A.; Hails, R.; Magreehan, V.; Quinn, M. How are nature based solutions contributing to priority societal challenges surrounding human well-being in the United Kingdom: A systematic map protocol. Environ. Evid. 2019, 8, 37. [Google Scholar] [CrossRef]
  9. IUCN Global Standard for Nature-Based Solutions. A User-Friendly Framework for the Verification, Design and Scaling up of NbS. 2020. Available online: https://iucn.org/our-work/topic/iucn-global-standard-nature-based-solutions (accessed on 29 November 2023).
  10. Gregg, B.; Shiao, T.; Kammeyer, C.; Diringer, S.; Vigerstol, K.; Naabia, O.A.; Michael, M.; Carla, M.Z.; Wendy, L.; Dekker, T. Benefit Accounting of Nature-Based Solutions for Watersheds: Guide; United Nations CEO Water Mandate and Pacific Institute: Oakland, CA, USA, 2021. [Google Scholar]
  11. Almenar, J.B.; Elliot, T.; Rugani, B.; Philippe, B.; Gutierrez, T.N.; Sonnemann, G.; Geneletti, D. Nexus between nature-based solutions, ecosystem services and urban challenges. Land Use Policy 2021, 100, 104898. [Google Scholar] [CrossRef]
  12. Wang, M.; Zhang, Y.; Zhang, D.; Zheng, Y.; Li, S.; Tan, S.K. Life-cycle cost analysis and resilience consideration for coupled grey infrastructure and low-impact development practices. Sustain. Cities Soc. 2021, 75, 103358. [Google Scholar] [CrossRef]
  13. Toxopeus, H.; Polzin, F. Reviewing financing barriers and strategies for urban nature-based solutions. J. Environ. Manag. 2021, 289, 112371. [Google Scholar] [CrossRef]
  14. Ershad Sarabi, S.; Han, Q.; Romme, A.G.L.; de Vries, B.; Wendling, L. Key enablers of and barriers to the uptake and implementation of nature-based solutions in urban settings: A review. Resources 2019, 8, 121. [Google Scholar] [CrossRef]
  15. Miranda, F.N.; Ferreira, T.M. A simplified approach for flood vulnerability assessment of historic sites. Nat. Hazards 2019, 96, 713–730. [Google Scholar] [CrossRef]
  16. Su, J.; Wang, M.; Zhang, D.; Yuan, H.; Zhou, S.; Wang, Y.; Razi, M.A.M. Integrating technical and societal strategies in Nature-based Solutions for urban flood mitigation in Guangzhou, a heritage city. Ecol. Indic. 2024, 162, 112030. [Google Scholar] [CrossRef]
  17. Wang, J. Problems and solutions in the protection of historical urban areas. Front. Archit. Res. 2012, 1, 40–43. [Google Scholar] [CrossRef]
  18. Chokhachian, A.; Perini, K.; Giulini, S.; Auer, T. Urban performance and density: Generative study on interdependencies of urban form and environmental measures. Sustain. Cities Soc. 2020, 53, 101952. [Google Scholar] [CrossRef]
  19. Ortiz, R.; Ortiz, P.; Martín, J.M.; Vázquez, M.A. A new approach to the assessment of flooding and dampness hazards in cultural heritage, applied to the historic centre of Seville (Spain). Sci. Total Environ. 2016, 551, 546–555. [Google Scholar] [CrossRef] [PubMed]
  20. Pacetti, T.; Cioli, S.; Castelli, G.; Bresci, E.; Pampaloni, M.; Pileggi, T.; Caporali, E. Planning Nature Based Solutions against urban pluvial flooding in heritage cities: A spatial multi criteria approach for the city of Florence (Italy). J. Hydrol. Reg. Stud. 2022, 41, 101081. [Google Scholar] [CrossRef]
  21. Nguyen, T.L.; Asahi, C.; Tran, T.A.; Le, N.H. Indicator-based approach for flood vulnerability assessment in ancient heritage city of Hoi An, Central Region of Vietnam. Nat. Hazards 2022, 114, 2357–2385. [Google Scholar] [CrossRef]
  22. Berisha, E.; Caprioli, C.; Cotella, G. Unpacking SDG target 11.a: What is it about and how to measure its progress? City Environ. Interact. 2022, 14, 100080. [Google Scholar] [CrossRef]
  23. Filho, W.L.; Wall, T.; Salvia, A.L.; Dinis, M.A.P.; Mifsud, M. The central role of climate action in achieving the United Nations’ Sustainable Development Goals. Sci. Rep. 2023, 13, 20582. [Google Scholar] [CrossRef] [PubMed]
  24. Morgera, E. SDG 15: Protect, Restore and Promote Sustainable Use of Terrestrial Ecosystems, Sustainably Manage Forests, Combat Desertification, and Halt and Reverse Land Degradation and Halt Biodiversity Loss. In The Cambridge Handbook of the Sustainable Development Goals and International Law; Ebbesson, J., Hey, E., Eds.; Cambridge University Press: Cambridge, UK, 2022; pp. 376–398. [Google Scholar]
  25. Coombes, M.A.; Viles, H.A. Integrating nature-based solutions and the conservation of urban built heritage: Challenges, opportunities, and prospects. Urban For. Urban Green. 2021, 63, 127192. [Google Scholar] [CrossRef]
  26. Borah, A.; Bardhan, R.; Bhatia, U. Protecting heritage: Insights into effective flood management using green infrastructure in a highly urbanized environment. Int. J. Disaster Risk Reduct. 2023, 98, 104075. [Google Scholar] [CrossRef]
  27. Bansal, N.; Mukherjee, M.; Gairola, A. Evaluating urban flood hazard index (UFHI) of Dehradun city using GIS and multi-criteria decision analysis. Model. Earth Syst. Environ. 2022, 8, 4051–4064. [Google Scholar] [CrossRef]
  28. Hapciuc, O.E.; Romanescu, G.; Minea, I.; Iosub, M.; Enea, A.; Sandu, I. Flood susceptibility analysis of the cultural heritage in the Sucevita catchment (Romania). Int. J. Conserv. Sci. 2016, 7, 501–510. [Google Scholar]
  29. Ferreira, T.M.; Santos, P.P. An integrated approach for assessing flood risk in historic city centres. Water 2020, 12, 1648. [Google Scholar] [CrossRef]
  30. Jiang, Z.; Huete, A.R.; Chen, J.; Chen, Y.; Li, J.; Yan, G.; Zhang, X. Analysis of NDVI and scaled difference vegetation index retrievals of vegetation fraction. Remote Sens. Environ. 2006, 101, 366–378. [Google Scholar] [CrossRef]
  31. Ellis, J.B. Sustainable surface water management and green infrastructure in UK urban catchment planning. J. Environ. Plan. Manag. 2013, 56, 24–41. [Google Scholar] [CrossRef]
  32. Srivastava, A.; Shukla, S.; Singh, P.; Jha, P.K. Spatio-temporal dynamics of land use/cover and land surface temperature in Prayagraj city, India. Indoor Built Environ. 2023, 32, 1250–1268. [Google Scholar] [CrossRef]
  33. Zhou, S.; Liu, Z.; Wang, M.; Gan, W.; Zhao, Z.; Wu, Z. Impacts of building configurations on urban stormwater management at a block scale using XGBoost. Sustain. Cities Soc. 2022, 87, 104235. [Google Scholar] [CrossRef]
  34. Singh, P.; Sinha, V.S.P.; Vijhani, A.; Pahuja, N. Vulnerability assessment of urban road network from urban flood. Int. J. Disaster Risk Reduct. 2018, 28, 237–250. [Google Scholar] [CrossRef]
  35. Baheru, T.; Chowdhury, A.G.; Pinelli, J.P.; Bitsuamlak, G. Distribution of wind-driven rain deposition on low-rise buildings: Direct impinging raindrops versus surface runoff. J. Wind Eng. Ind. Aerodyn. 2014, 133, 27–38. [Google Scholar] [CrossRef]
  36. Costa, S.; Peters, R.; Martins, R.; Postmes, L.; Keizer, J.J.; Roebeling, P. Effectiveness of nature-based solutions on pluvial flood hazard mitigation: The case study of the city of eindhoven (the netherlands). Resources 2021, 10, 24. [Google Scholar] [CrossRef]
  37. Zhou, X.; Zhang, S.; Zhu, D. Impact of urban water networks on microclimate and PM2. 5 distribution in downtown areas: A case study of Wuhan. Build. Environ. 2021, 203, 108073. [Google Scholar] [CrossRef]
  38. Liu, W.; Feng, Q.; Engel, B.A.; Yu, T.; Zhang, X.; Qian, Y. A probabilistic assessment of urban flood risk and impacts of future climate change. J. Hydrol. 2023, 618, 129267. [Google Scholar] [CrossRef]
  39. Sperotto, A.; Torresan, S.; Gallina, V.; Coppola, E.; Critto, A.; Marcomini, A. A multi-disciplinary approach to evaluate pluvial floods risk under changing climate: The case study of the municipality of Venice (Italy). Sci. Total Environ. 2016, 562, 1031–1043. [Google Scholar] [CrossRef] [PubMed]
  40. Batica, J. Methodology for Flood Resilience Assessment in Urban Environments and Mitigation Strategy Development. Ph.D. Thesis, Université Nice Sophia Antipolis, Nice, France, 2015. [Google Scholar]
  41. Malakar, K.; Mishra, T. Assessing socio-economic vulnerability to climate change: A city-level index-based approach. Clim. Dev. 2017, 9, 348–363. [Google Scholar] [CrossRef]
  42. Taylor, K. Connecting Concepts of Cultural Landscape and Historic Urban Landscape: The Politics of Similarity. Built Herit. 2018, 2, 53–67. [Google Scholar] [CrossRef]
  43. Ma, M.; Zhong, Z.; Guo, N.; Jing, N.; Xiong, W. An efficient reverse geocoding method based on global subdivision model. In Proceedings of the 2016 24th International Conference on Geoinformatics, Galway, Ireland, 14–20 August 2016; pp. 1–9. [Google Scholar]
  44. Rahman, M.M.; Islam, I. Exposure of urban infrastructure because of climate change-induced flood: Lesson from municipal level planning in Bangladesh. Ecofeminism Clim. Change 2020, 1, 107–125. [Google Scholar] [CrossRef]
  45. De Moel, H.; Aerts, J.C.; Koomen, E. Development of flood exposure in the Netherlands during the 20th and 21st century. Glob. Environ. Change 2011, 21, 620–627. [Google Scholar] [CrossRef]
  46. Katada, T.; Kuwasawa, N.; Shida, S.; Kojima, M. Scenario analysis for evacuation strategies for residents in big cities during large-scale flooding. J. JSCE 2015, 3, 209–223. [Google Scholar] [CrossRef]
  47. Caporali, E.; Pacetti, T.; Lompi, M.; Tamagnone, P. Fostering Pluvial Flood Resilience in Heritage Cities: Insights from Practice in the City of Florence. In Proceedings of the International Conference “Sustainable Built Environment and Urban Transition”, Växjö, Sweden, 12–13 October 2023; pp. 1–5. [Google Scholar]
  48. Zhang, L.; Xu, X.; Guo, Y. Comprehensive Evaluation of the Implementation Effect of Commercial Street Quality Improvement Based on AHP-Entropy Weight Method—Taking Hefei Shuanggang Old Street as an Example. Land 2022, 11, 2091. [Google Scholar] [CrossRef]
  49. Sun, J.; Cheshmehzangi, A.; Wang, S. Green infrastructure practice and a sustainability key performance indicators framework for neighbourhood-level construction of sponge city programme. J. Environ. Prot. 2020, 11, 82–109. [Google Scholar] [CrossRef]
  50. Sepehri, M.; Malekinezhad, H.; Hosseini, S.Z.; Ildoromi, A.R. Assessment of flood hazard mapping in urban areas using entropy weighting method: A case study in Hamadan city, Iran. Acta Geophys. 2019, 67, 1435–1449. [Google Scholar] [CrossRef]
  51. Jia, H.; Yao, H.; Yu, S.L. Advances in LID BMPs research and practice for urban runoff control in China. Front. Environ. Sci. Eng. 2013, 7, 709–720. [Google Scholar] [CrossRef]
  52. Peña, F.; Nardi, F.; Melesse, A.; Obeysekera, J.; Castelli, F.; Price, R.M.; Crowl, T.; Gonzalez-Ramirez, N. Compound flood modeling framework for surface–subsurface water interactions. Nat. Hazards Earth Syst. Sci. 2022, 22, 775–793. [Google Scholar] [CrossRef]
  53. Zhou, S.; Jia, W.; Wang, M.; Liu, Z.; Wang, Y.; Wu, Z. Synergistic Assessment of Multi-Scenario Urban Flooding Vulnerability Through Data-Driven Decoupling Analysis: A Case Study in Shenzhen, China. J. Environ. Manag. 2024, 369, 122330. [Google Scholar] [CrossRef]
  54. Zhen, Y.; Fang, Q.; Liu, S.; Zhou, Z.; Zhong, G.; Zhuang, Q.; Liang, J. Exploring the effect of building openings and orientation on induced loads due to extreme flood events. J. Fluids Struct. 2023, 121, 103933. [Google Scholar] [CrossRef]
  55. Yang, G.; Ren, G.; Zhang, P.; Xue, X.; Tysa, S.K.; Jia, W.; Qin, Y.; Zheng, X.; Zhang, S. PM2.5 influence on urban heat island (UHI) effect in Beijing and the possible mechanisms. J. Geophys. Res. Atmos. 2021, 126, e2021JD035227. [Google Scholar] [CrossRef]
  56. Wang, J.; Wah Yu, C.; Cao, S.J. Urban development in the context of extreme flooding events. Indoor Built Environ. 2022, 31, 3–6. [Google Scholar] [CrossRef]
  57. Zölch, T.; Henze, L.; Keilholz, P.; Pauleit, S. Regulating urban surface runoff through nature-based solutions–an assessment at the micro-scale. Environ. Res. 2017, 157, 135–144. [Google Scholar] [CrossRef]
  58. Wang, J.J. Flood risk maps to cultural heritage: Measures and process. J. Cult. Herit. 2015, 16, 210–220. [Google Scholar] [CrossRef]
  59. Garrote, J.; Diez-Herrero, A.; Escudero, C.; García, I. A framework proposal for regional-scale flood-risk assessment of cultural heritage sites and application to the Castile and León Region (Central Spain). Water 2020, 12, 329. [Google Scholar] [CrossRef]
  60. Shi, H.; Zhou, M.; Kong, N.; Zhang, Y.; Li, X. A Study on the Accessibility of the Emergency Medical Services for Urban Kindergartens and Nursing Homes Based on Urban Pluvial Flooding Scenarios. Sustainability 2023, 15, 10443. [Google Scholar] [CrossRef]
  61. Zhang, Y.; Zhou, M.; Kong, N.; Li, X.; Zhou, X. Evaluation of Emergency Response Capacity of Urban Pluvial Flooding Public Service Based on Scenario Simulation. Int. J. Environ. Res. Public Health 2022, 19, 16542. [Google Scholar] [CrossRef]
  62. Spielman, S.E.; Tuccillo, J.; Folch, D.C.; Schweikert, A.; Davies, R.; Wood, N.; Tate, E. Evaluating social vulnerability indicators: Criteria and their application to the Social Vulnerability Index. Nat. Hazards 2020, 100, 417–436. [Google Scholar] [CrossRef]
  63. Tozer, L.; Hörschelmann, K.; Anguelovski, I.; Bulkeley, H.; Lazova, Y. Whose city? Whose nature? Towards inclusive nature-based solution governance. Cities 2020, 107, 102892. [Google Scholar] [CrossRef]
  64. Neugarten, R.A.; Langhammer, P.F.; Osipova, E.; Bagstad, K.J.; Bhagabati, N.; Butchart, S.H.; Dudley, N.; Elliott, V.; Gerber, L.R.; Arrellano, C.G.; et al. Tools for Measuring, Modelling, and Valuing Ecosystem Services; IUCN, International Union for Conservation of Nature: Gland, Switzerland, 2018; Volume 70. [Google Scholar] [CrossRef]
  65. Kumar, P.; Debele, S.E.; Sahani, J.; Rawat, N.; Marti-Cardona, B.; Alfieri, S.M.; Basu, B.; Basu, A.S.; Bowyer, P.; Charizopoulos, N.; et al. Nature-based solutions efficiency evaluation against natural hazards: Modelling methods, advantages and limitations. Sci. Total Environ. 2021, 784, 147058. [Google Scholar] [CrossRef]
  66. Zhou, S.; Diao, H.; Wang, J.; Jia, W.; Xu, H.; Xu, X.; Wang, M.; Sun, C.; Qiao, R.; Wu, Z. Multi-stage optimization framework for synergetic grey-green infrastructure in response to long-term climate variability based on shared socio-economic pathways. Water Res. 2025, 274, 123091. [Google Scholar] [CrossRef]
  67. Wang, M.; Li, Y.; Yuan, H.; Zhou, S.; Wang, Y.; Ikram, R.M.A.; Li, J. An XGBoost-SHAP approach to quantifying morphological impact on urban flooding susceptibility. Ecol. Indic. 2023, 156, 111137. [Google Scholar] [CrossRef]
  68. Erena, S.H.; Reddy, R.U.; Wodnimu, M.A.; Mohamed, A. Flood vulnerability mapping and local mitigation strategies: The case of Adama City, Ethiopia. Urban Clim. 2024, 55, 101906. [Google Scholar] [CrossRef]
  69. Longato, D. Susceptibility of Flood-Prone Areas to Remain Inundated for Shorter or Longer Periods During a Flooding Event: An Assessment Method Applied in the Friuli Venezia Giulia Region (Italy). In Climate Change Adaptation, Flood Risk, and Beyond: State of Play in the Science-Policy-Action Nexus; Granceri Bradaschia, M., Magni, F., Musco, F., Eds.; Springer Nature: Cham, Switzerland, 2024; pp. 35–54. [Google Scholar]
  70. Salazar, L.G.F.; Figueiredo, R.; Romão, X. Flood vulnerability assessment of built cultural heritage: Literature review and identification of indicators. Int. J. Disaster Risk Reduct. 2024, 111, 104666. [Google Scholar] [CrossRef]
  71. Alves, A.; van Opstal, C.; Keijzer, N.; Sutton, N.; Chen, W.-S. Planning the multifunctionality of nature-based solutions in urban spaces. Cities 2024, 146, 104751. [Google Scholar] [CrossRef]
  72. Lu, L.; Johnson, M.; Zhu, F.; Xu, Y.; Ruan, T.; Chan, F.K.S. Harnessing the runoff reduction potential of urban bioswales as an adaptation response to climate change. Sci. Rep. 2024, 14, 12207. [Google Scholar] [CrossRef] [PubMed]
  73. Ferrario, F.; Mourato, J.M.; Rodrigues, M.S.; Dias, L.F. Evaluating Nature-based Solutions as urban resilience and climate adaptation tools: A meta-analysis of their benefits on heatwaves and floods. Sci. Total Environ. 2024, 950, 175179. [Google Scholar] [CrossRef] [PubMed]
  74. Sun, J.; Wang, Y.; Lee, T.M.; Nie, X.; Wang, T.; Liang, E.; Wang, Y.; Zhang, L.; Wang, J.; Piao, S.; et al. Nature-based Solutions can help restore degraded grasslands and increase carbon sequestration in the Tibetan Plateau. Commun. Earth Environ. 2024, 5, 154. [Google Scholar] [CrossRef]
Figure 1. The proposed framework for prioritizing and allocating Nature-Based Solutions (NbSs) in historic urban landscapes. The framework comprises three main components: (1) exposure indicators, such as the Normalized Difference Vegetation Index (NDVI), Building Congestion Degree (BCD), Road Network Density, Surface Runoff Coefficient (SRC), Particulate Matter (PM2.5), and Annual Mean Temperature; (2) vulnerability indicators, including National and Provincial Cultural Relics, historic buildings, educational establishments, medical institutions, Gross Domestic Product (GDP), and population density; and (3) risk priority and NbS allocation, combining exposure and vulnerability metrics through an integrated weighting scheme (Entropy Weighting and Analytic Hierarchy Process). Geospatial analyses using GIS are applied in all stages, from data processing to suitability mapping.
Land 14 00452 g001
Figure 2. Geographic location and land use distribution of the study area, Quanzhou, China. The map illustrates the spatial distribution of key land use types, including cropland, forest, water bodies, impervious surfaces, and major roads.
Land 14 00452 g002
Figure 3. Spatial distribution of urban flooding exposure. The figure illustrates (a) urban flooding exposure, along with the following key contributing factors: (b) Normalized Difference Vegetation Index (NDVI), (c) Building Congestion Degree (BCD), (d) Road Network Density (RND), (e) Surface Runoff Coefficient (SRC), (f) Particulate Matter (PM2.5), and (g) Annual Mean Temperature.
Land 14 00452 g003
Figure 4. Spatial distribution of urban flooding vulnerability. The figure presents (a) urban flooding vulnerability and its contributing indicators: (b) national cultural relics, (c) provincial cultural relics, (d) historic buildings, (e) educational establishments, (f) medical institutions, (g) Gross Domestic Product (GDP), and (h) population density.
Land 14 00452 g004
Figure 5. Priority townships for NbS planning in Quanzhou. This map highlights township-level prioritization based on the integrated exposure and vulnerability indices for Nature-Based Solution (NbS) implementation. Dark red indicates the highest-priority areas with severe exposure and vulnerability, requiring urgent intervention; orange shades represent moderate-priority areas with significant exposure and vulnerability; and light beige depicts lower-priority areas with relatively minimal exposure and vulnerability.
Land 14 00452 g005
Figure 6. Spatial allocation of Solution I—direct surface infiltration (areas in red).
Land 14 00452 g006
Figure 7. Spatial allocation of Solution II—subterranean stormwater infiltration (areas in dark red).
Land 14 00452 g007
Figure 8. Spatial allocation of Solution III—surface infiltration with retention (areas in yellow).
Land 14 00452 g008
Figure 9. Spatial allocation of Solution IV—stormwater retention (areas in blue).
Land 14 00452 g009
Table 1. Overview of data used in this study.
ModuleFactorDataFormatDetailSource
ExposureNDVINormalized Difference Vegetation IndexRaster30 m resolutionMOD13Q1v061 dataset product from NASA’s Surface Process Data Center
BCDBuilding informationPolylinen.a. Amap
RNDRoad networkShapefileLineOpenStreetMap
SRCLand useRaster10 m resolutionPeng Cheng Laboratory
PM2.5Particulate Matter 2.5Raster1 km resolutionResource and Environment Science and Data Center, China
TemperatureAverage annual temperatureRaster1 km resolutionResource and Environment Science and Data Center, China
VulnerabilityNational cultural relic Number of national cultural relicsPointLocationQuanzhou Municipal People’s Government
Provincial cultural relic Number of provincial cultural relicsPointLocationQuanzhou Municipal People’s Government
Historic building Number of historic buildingsPointLocationQuanzhou Municipal People’s Government
Educational facilityNumber of educational facilities PointLocationAmap
Medical facilityNumber of medical facilitiesPointLocationAmap
GDPGross Domestic Product TableTownshipFujian Statistical Yearbook-2020
Population Density of population TableTownshipFujian Statistical Yearbook-2020
Table 2. Four models of Nature-Based Solutions suggested in HULs.
SolutionTypeConstraintRepresentative Structural FacilitiesSuitable Land for Configuration
AreaSlopeDistance from Building Boundary
IDirect Surface Infiltration Modeln.a.<15%>5 mPervious paving;
Infiltration trench;
Infiltration basin;
Bioretention cell;
Tree box filter;
Bioswale.
Hard paving;
Green space
IISubterranean Stormwater Infiltration Modeln.a.n.a.>10 mUnderground infiltration module;
Underground sand filter.
Hard paving
IIISurface Infiltration with Retention Model at Source<2000 m2<10%>5 mRain garden.Green space
IVStormwater Retention Model>2000 m2<5%>10 mRetention pond;
Constructed wetland.
Green space;
Water body
Note: Parameters adapted from Jia et al. [51].
Table 3. The weights for the six exposure and vulnerability indicators from the AHP, EW, and linear-weighting approaches.
TypeIndicatorAHPEWLinear Weighting
ExposureNDVI7.7%12.4%10.5%
BCD5.9%28.0%17.0%
RND9.2%14.3%11.8%
SRC40.7%19.3%30.0%
PM2.514.4%19.2%16.8%
Temperature22.1%6.8%14.5%
VulnerabilityNational cultural relic33.1%25.2%29.2%
Provincial cultural relic18.4%22.1%20.3%
Historic building13.4%29.9%21.7%
Educational establishment10.2%10.9%10.6%
Medical institution7.7%9.1%8.4%
GDP5.9%2.7%4.3%
Population density11.2%0.1%5.7%
Table 4. Risk ranking of townships in districts of Licheng and Fengze in Quanzhou.
IDNameArea (km2)Exposure Rate (%)Vulnerability Rate (%) Risk Rate (%)Ranking
1Beifeng25.92 5.4%0.8%3.1%15
2Huada9.98 3.5%0.3%1.9%16
3Changtai12.54 7.8%0.4%4.1%14
4Linjiang1.2111.7%11.9%11.8%1
5Haibin3.729.4%5.4%7.4%5
6Jinlong10.36 7.9%0.6%4.3%13
7Jiangnan8.92 8.0%1.6%4.8%10
8Donghu5.77 9.0%2.4%5.7%7
9Fuqiao10.11 9.0%0.6%4.8%10
10Donghai32.31 8.1%1.3%4.7%12
11Qingmeng Economic Development Zone6.23 8.6%1.1%4.9%9
12Xiuquan4.58 10.6%1.0%5.8%6
13Kaiyuan2.7212.5%8.1%10.3%2
14Qingyuan16.12 1.3%1.3%1.3%17
15Lizhong2.4613.0%6.0%9.5%3
16Chengdong17.06 8.9%1.4%5.2%8
17Fengze2.6312.8%3.3%8.1%4
Note: The bold sections in the table are the top five towns with urban flooding risks.
Disclaimer/Publisher’s Note: The statements, opinions and data contained in all publications are solely those of the individual author(s) and contributor(s) and not of MDPI and/or the editor(s). MDPI and/or the editor(s) disclaim responsibility for any injury to people or property resulting from any ideas, methods, instructions or products referred to in the content.

