Article

Decoding the Role of Urban Green Space Morphology in Shaping Visual Perception: A Park-Based Study

College of Landscape Architecture, Sichuan Agricultural University, Chengdu 611130, China
*
Authors to whom correspondence should be addressed.
Land 2025, 14(3), 495; https://doi.org/10.3390/land14030495
Submission received: 24 January 2025 / Revised: 19 February 2025 / Accepted: 25 February 2025 / Published: 27 February 2025
(This article belongs to the Section Land Planning and Landscape Architecture)

Abstract

:
Urban green spaces, vital public infrastructure, have received limited research on how their morphology affects visual perception preferences. Using data from ten parks, we generated green space maps from high-resolution satellite imagery and calculated indicators, such as quantity, fragmentation, connectivity, and shape complexity. By combining the Mask2Former image segmentation deep learning model with a multi-objective regression model and structural equation modeling, we analyzed the relationship between green space morphology and visual perception preferences, controlling for geographic and demographic factors. The results showed that green spaces with tighter connectivity, aggregation, continuity, and shape complexity led to more distinct visual perceptions. This relationship was mediated by the proportion of landscape elements. The distribution, shape, and connectivity of urban green spaces had an independent impact on individual visual perception, far exceeding the influence of quantity alone. The spatial morphology of urban green spaces should be incorporated into health-oriented urban space design, exploring the global interest in how green spaces impact urban human well-being, and providing valuable insights for urban green space planning and health-driven urban space design.

1. Introduction

Particularly in the post-pandemic period, certain populations continue to be affected by the long-term consequences of COVID-19 [1]. Although the World Health Organization (WHO) has initiated efforts to address and monitor the long-term effects of COVID-19 [2], such as establishing a global network of clinicians to better identify, diagnose, and treat long-term COVID-19 symptoms [3], the effectiveness of these measures remains limited. Approximately 10–20% of individuals with common long-term COVID-19 symptoms experience fatigue, shortness of breath, memory and attention issues, sleep disorders, and symptoms of depression or anxiety, significantly impacting their daily lives [1]. Urban green spaces, as public resources, benefit students and individuals with limited financial means who are dealing with persistent symptoms [4].
Exploring people’s visual perception preferences for urban green spaces can promote interactions among them. Higher-quality green spaces are associated with higher visitation rates [5], and by further enhancing the healing value of green spaces, people’s physical and psychological recovery from long-term COVID-19 symptoms can be supported [6]. It has been clinically proven that interactions with nature have a positive impact on people’s mental health. Urban green spaces provide residents with opportunities to connect with nature, promoting physical activity [7,8,9]. In contrast, the mismatch between the expectations of urban landscape users and the reality of urban conditions can lead to various negative outcomes [10]. Therefore, it is essential to understand people’s perceptual preferences for green spaces.
Perceptions and preferences regarding green spaces are closely linked to their restorative qualities. Individuals experience different sensory perceptions in various environments, eliciting corresponding emotional responses that shape their preferences and, in turn, influence their psychological and physiological well-being [11]. A study in Vietnam highlighted that urban green space visitors preferred pathway widths between two and three meters, though preferences were also dependent on the type of environment [12]. Research in Europe has shown that urban green spaces generate positive externalities related to environmental quality, public health, and urban appeal [13]. Urban residents can directly perceive the quality of their urban landscape through factors such as vegetation, structure, and overall living environment [14]. A survey in Lyon, France, revealed that 55.7% of respondents considered nature to be a vital need [15]. Preferences for lower-density vegetation are often linked to concerns about personal safety [16], with sparse vegetation and open tree canopies offering clear sightlines that contribute to restorative effects and reduce feelings of fear [17]. However, Van den Berg et al. noted that well-maintained forests and natural forests exhibit similar environmental restorative effects [18]. Studies in the U.S. and Turkey have explored how both the objective presence of green vegetation and its perceived qualities influence restorative perceptions [19]. In China, research has uncovered the potential mechanisms through which green spaces facilitate physical and mental healing, particularly during the pandemic [4].
Additionally, Natalia Rodriguez Castañeda et al. used the One Health framework to analyze the interface between human mental health, urban green spaces, and urban biodiversity [20]. They emphasized that the restorative capacity of urban green spaces is a critical aspect of overall human health. Community gardening, as a community-level remedy, plays a significant role in maintaining biodiversity while simultaneously enhancing human well-being [21,22].
Building on extensive prior research, Grahn and Stigsdotter developed the concept of perceived sensory dimensions (PSDs) [23], which was further refined by Stigsdotter et al. [24]. These dimensions encompass eight categories: serenity (undisturbed, quiet, and peaceful environments), nature (wild and untouched landscapes), species richness (abundance of flora and fauna), spaciousness (open, free spaces with a sense of connection), prospect (open views and flat areas), refuge (enclosed, safe spaces), social (areas equipped for social activities), and culture (spaces reflecting human cultural essence). Wang and Li conducted a similar study, using physiological indicators instead of subjective feelings to explore the relationship between the restorative benefits of urban green spaces and the sensory dimensions of perception [25].
Preference is a product of perception, and individuals’ latent perceptions of green spaces influence their priority outcomes [26]. Numerous studies have demonstrated that people derive greater restorative benefits from their preferred green spaces, with restoration and preference outcomes shown to mutually reinforce each other [18,27,28]. Visual perception is one of the most direct and effective ways for individuals to recognize their external environment [10,29], and it plays a critical role in environmental restoration [30].
The concept of entropy has been applied to quantify informational content [31]. Visual entropy, composed of texture and depth entropy, represents the complexity of visual information processed by the human brain. The optic nerve transmits transduced electrical signals to the brain, which has evolved to compute this information across the visual field in real time [32]. Images with high visual entropy are more likely to capture and sustain individuals’ attention [33].
As a key component of visual perception, visual appeal reflects an individual’s active recognition and selection of landscape spaces [34]. It also determines the objective scope and degree of a landscape element’s attractiveness to individuals [35,36]. A preference for a particular place indicates that the environment has a positive effect on the individual, such as a strong preference for landscapes capable of eliciting positive emotional changes [37]. This preference, in turn, suppresses or reduces negative thoughts, facilitating psychological restoration [38].
However, research on quantifying visual perception preferences to understand how green space morphology impacts human health remains in its early stages.
Numerous studies provide examples of how green spaces promote physical and mental healing. Green space morphology has been shown to improve mental health [39,40,41], evoke positive emotions [42], reduce cardiovascular and respiratory diseases [43], and further lower mortality risks, thereby enhancing overall health [44]. Urban green space coverage contributes to better human health through a wide range of ecosystem services [45,46]. Ha et al. explored the relationship between green space aggregation and psychological distress [47]. Additionally, the duration of exposure to green spaces is associated with improved health and vitality [46], and engaging in walking activities within these green areas is crucial for physical well-being [48]. Frühauf et al. argued that allowing green exercise to manage stress and physical health is a “fundamental human need” [49].
The evidence indicates that understanding preferences for green spaces has a positive impact on promoting physical and mental well-being. Studies have demonstrated that the environmental conditions of urban parks influence residents’ perceptions [30] and visual experiences [50], with changes in these conditions potentially affecting the overall environmental perception [51]. Recent technological advancements, particularly the widespread adoption of smartphones, have facilitated a growing body of research uncovering such preferences. Various methods have been employed, including GPS tracking [52], data scraping from social media [53], and the implementation of public participation geographic information systems (PPGIS) to examine the cumulative effects of individual environmental factors on overall perception [54]. However, few studies have evaluated the impact of overall environmental characteristics on visual perception preferences.
In this paper, we present groundbreaking findings from a study conducted in Chengdu, China. The research integrates high-resolution remote sensing data (10 m) with machine learning techniques in the field of visual analysis, aiming to (1) investigate whether and how green space morphology and its characteristics influence visual perception preferences, (2) determine whether these relationships provide additional explanatory value beyond green space quantity, and (3) explore the connections between visual entropy, richness, landscape element proportions, and visual perception preferences.

2. Materials and Methods

2.1. Site and Visual Perception

We conducted a cross-sectional study to avoid potential confounding factors, selecting green spaces with similar sizes and infrastructure as the units of analysis. These spaces are located in the eastern and western parts of Chengdu, a representative city in Southwest China, which plans to construct over 10,000 km of Tianfu Greenways and 1000 park communities by 2025 [55], with the goal of enhancing people’s quality of life and well-being. To ensure the quality of the spaces, we chose green spaces with NDVI values ranging from 0.3 to 0.6. To ensure the visual complexity of the spaces, we selected green spaces with fractal dimensions between 1.7 and 1.9. Ultimately, we identified 10 parks as the research subjects. To reveal the generalizable relationship between green space morphology and visual perception preferences, we integrated data from 10 parks with similar characteristics in terms of infrastructure, complexity, NDVI, and area for analysis. Through this integrated approach, we aimed to systematically identify the overall impact of different green space morphologies on visual preferences and further explore the universal mechanisms through which green space morphology features influence visual perception preferences. Table 1 provides the site information after filtering and integration.
Objective assessments of green plant characteristics over geographic areas, such as tree canopy cover [56] and overall vegetation coverage from satellite imagery, such as the normalized difference vegetation index (NDVI), are not sufficient for quantifying visual perception. Research has shown that overhead vegetation does not predict residents’ walking behavior [57]. In contrast, eye-level observations provide a better perception of green features, particularly in areas with dense vegetation [58,59]. Recent studies have found that eye-level green vegetation assessed using Google Street View (GSV) images has a stronger correlation with physical activity than traditional satellite-based metrics [60,61]. Generally, GSV images can capture various landscape elements, such as greenery and other infrastructures, which are difficult to accurately assess with satellite imagery [62].
To ensure that people’s visual perceptions in daily life are accurately described, we recruited 150 volunteers to conduct eye-level photography of the study subjects. To ensure statistical reliability, it was calculated that at least 139 samples were needed to obtain statistically reliable results. A post hoc power analysis using G Power confirmed that the actual statistical power (1-β err. probability) was approximately 0.85. The demographic characteristics of the 150 volunteers are presented in the Table 2. During the recruitment process, the diversity of the sample was considered to reduce the potential impact of individual differences on the results. Moreover, the focus of this study was on exploring the overall impact of green space morphology on visual perception preferences, rather than on differences between specific groups. Therefore, although different demographic characteristics may influence individual environmental preferences, this study primarily focused on general trends rather than the subjective perceptual differences of specific groups.
Compared to using GSV images for assessment, photographing the scenes ensures that the environments perceived by individuals are accurately recorded, while also capturing the updated state of the real-world scenes. During the photography process, the research focus followed all major paths in the public park, capturing images every 20 m at a 1.6 m viewing height to simulate the human eye’s perspective. A total of 772 photos were taken from 10 different parks. The number of photos from each park varied based on the park’s size and landscape characteristics, ensuring a comprehensive representation of various landscape elements and visual angles. All photos were taken during the same period in the fall, between 14:00 and 16:00, to avoid the impact of lighting conditions and seasonal plant changes on visual perception. The same equipment was used for all photos, and any out-of-focus, blurry, or poorly composed images were excluded.
To maintain the visual complexity of each public park, we chose scenes with a fractal dimension ranging from 1.7 to 1.9. The fractal dimension is a mathematical expression that reflects the efficiency with which an object fills space, and it is used to quantify the complexity or irregularity of an object’s shape, structure, or distribution [63]. The box-counting method was employed to divide the target area into grids of varying sizes, and the number of grids containing parts of the target object, N(ϵ), was counted. Formula (1) is as follows:
D = l i m ϵ 0 l o g N ( ϵ ) l o g ( 1 / ϵ ) .
Based on deep learning methods in the visual domain, Mask2Former, which utilizes the Transformer architecture, employs a self-attention mechanism that captures long-range dependencies in images from a global perspective. This enables it to more effectively train, validate, and test using the ADE20K dataset. The ADE20K dataset is a challenging semantic segmentation dataset that covers a rich variety of scenes and categories. Specifically, Mask2Former utilizes a self-attention mechanism to model the relationships between different regions in an image, which effectively enhances its segmentation accuracy for different categories in complex backgrounds. The trained model achieved an excellent pixel-level accuracy of 84.59. The model’s accuracy met the requirements for calculating the landscape element proportions (2), visual entropy (3), and richness (4). The formula is as follows:
P i = A i A t o t a l × 100 ,
H = i = 1 N P i l g P i ,
C R = i = 1 n M P i l g P i = i = 1 n σ r g y b + 0.3 μ r g y b × P i l g P i ,
where σ r g y b is the standard deviation of color distribution, which measures the range of color dispersion, μ r g y b is the mean value of color distribution, reflecting the overall intensity of the colors, P i is the proportion of the i-th color class, l g P i is the logarithmic value of color proportion, used to calculate information entropy, and σ r g y b + 0.3 μ r g y b is used to adjust the color characteristic parameters [64], enhancing the representation of the complexity of color distribution.

2.2. Green Space and Image Classification

The study utilized 10 m resolution remote sensing imagery from the Chengdu region, sourced from the Google Earth Engine (GEE) platform. The data consisted of Sentinel-2 multispectral satellite imagery from 2023. Sentinel-2 data, with its high spatial resolution, multispectral coverage, and short revisit cycle, provides reliable foundational data for large-scale vegetation monitoring.
To ensure data quality, the imagery was selected based on a cloud cover threshold of less than 5%, minimizing cloud interference in subsequent analyses. Advanced denoising algorithms were then applied for preprocessing, eliminating noise and artifacts. Additionally, to ensure the accuracy of normalized difference vegetation index (NDVI) calculations (Equation (5)), reflectance data from the near-infrared (NIR) and red (R) bands were extracted:
NDVI = (NIR − R)/(NIR + R).
The high reflectance characteristics of the near-infrared (NIR) band and the sensitivity of the red (R) band to vegetation absorption make NDVI a classic indicator for reflecting vegetation coverage and health. This processing workflow provides a solid data foundation for the calculation of high-quality vegetation indices.

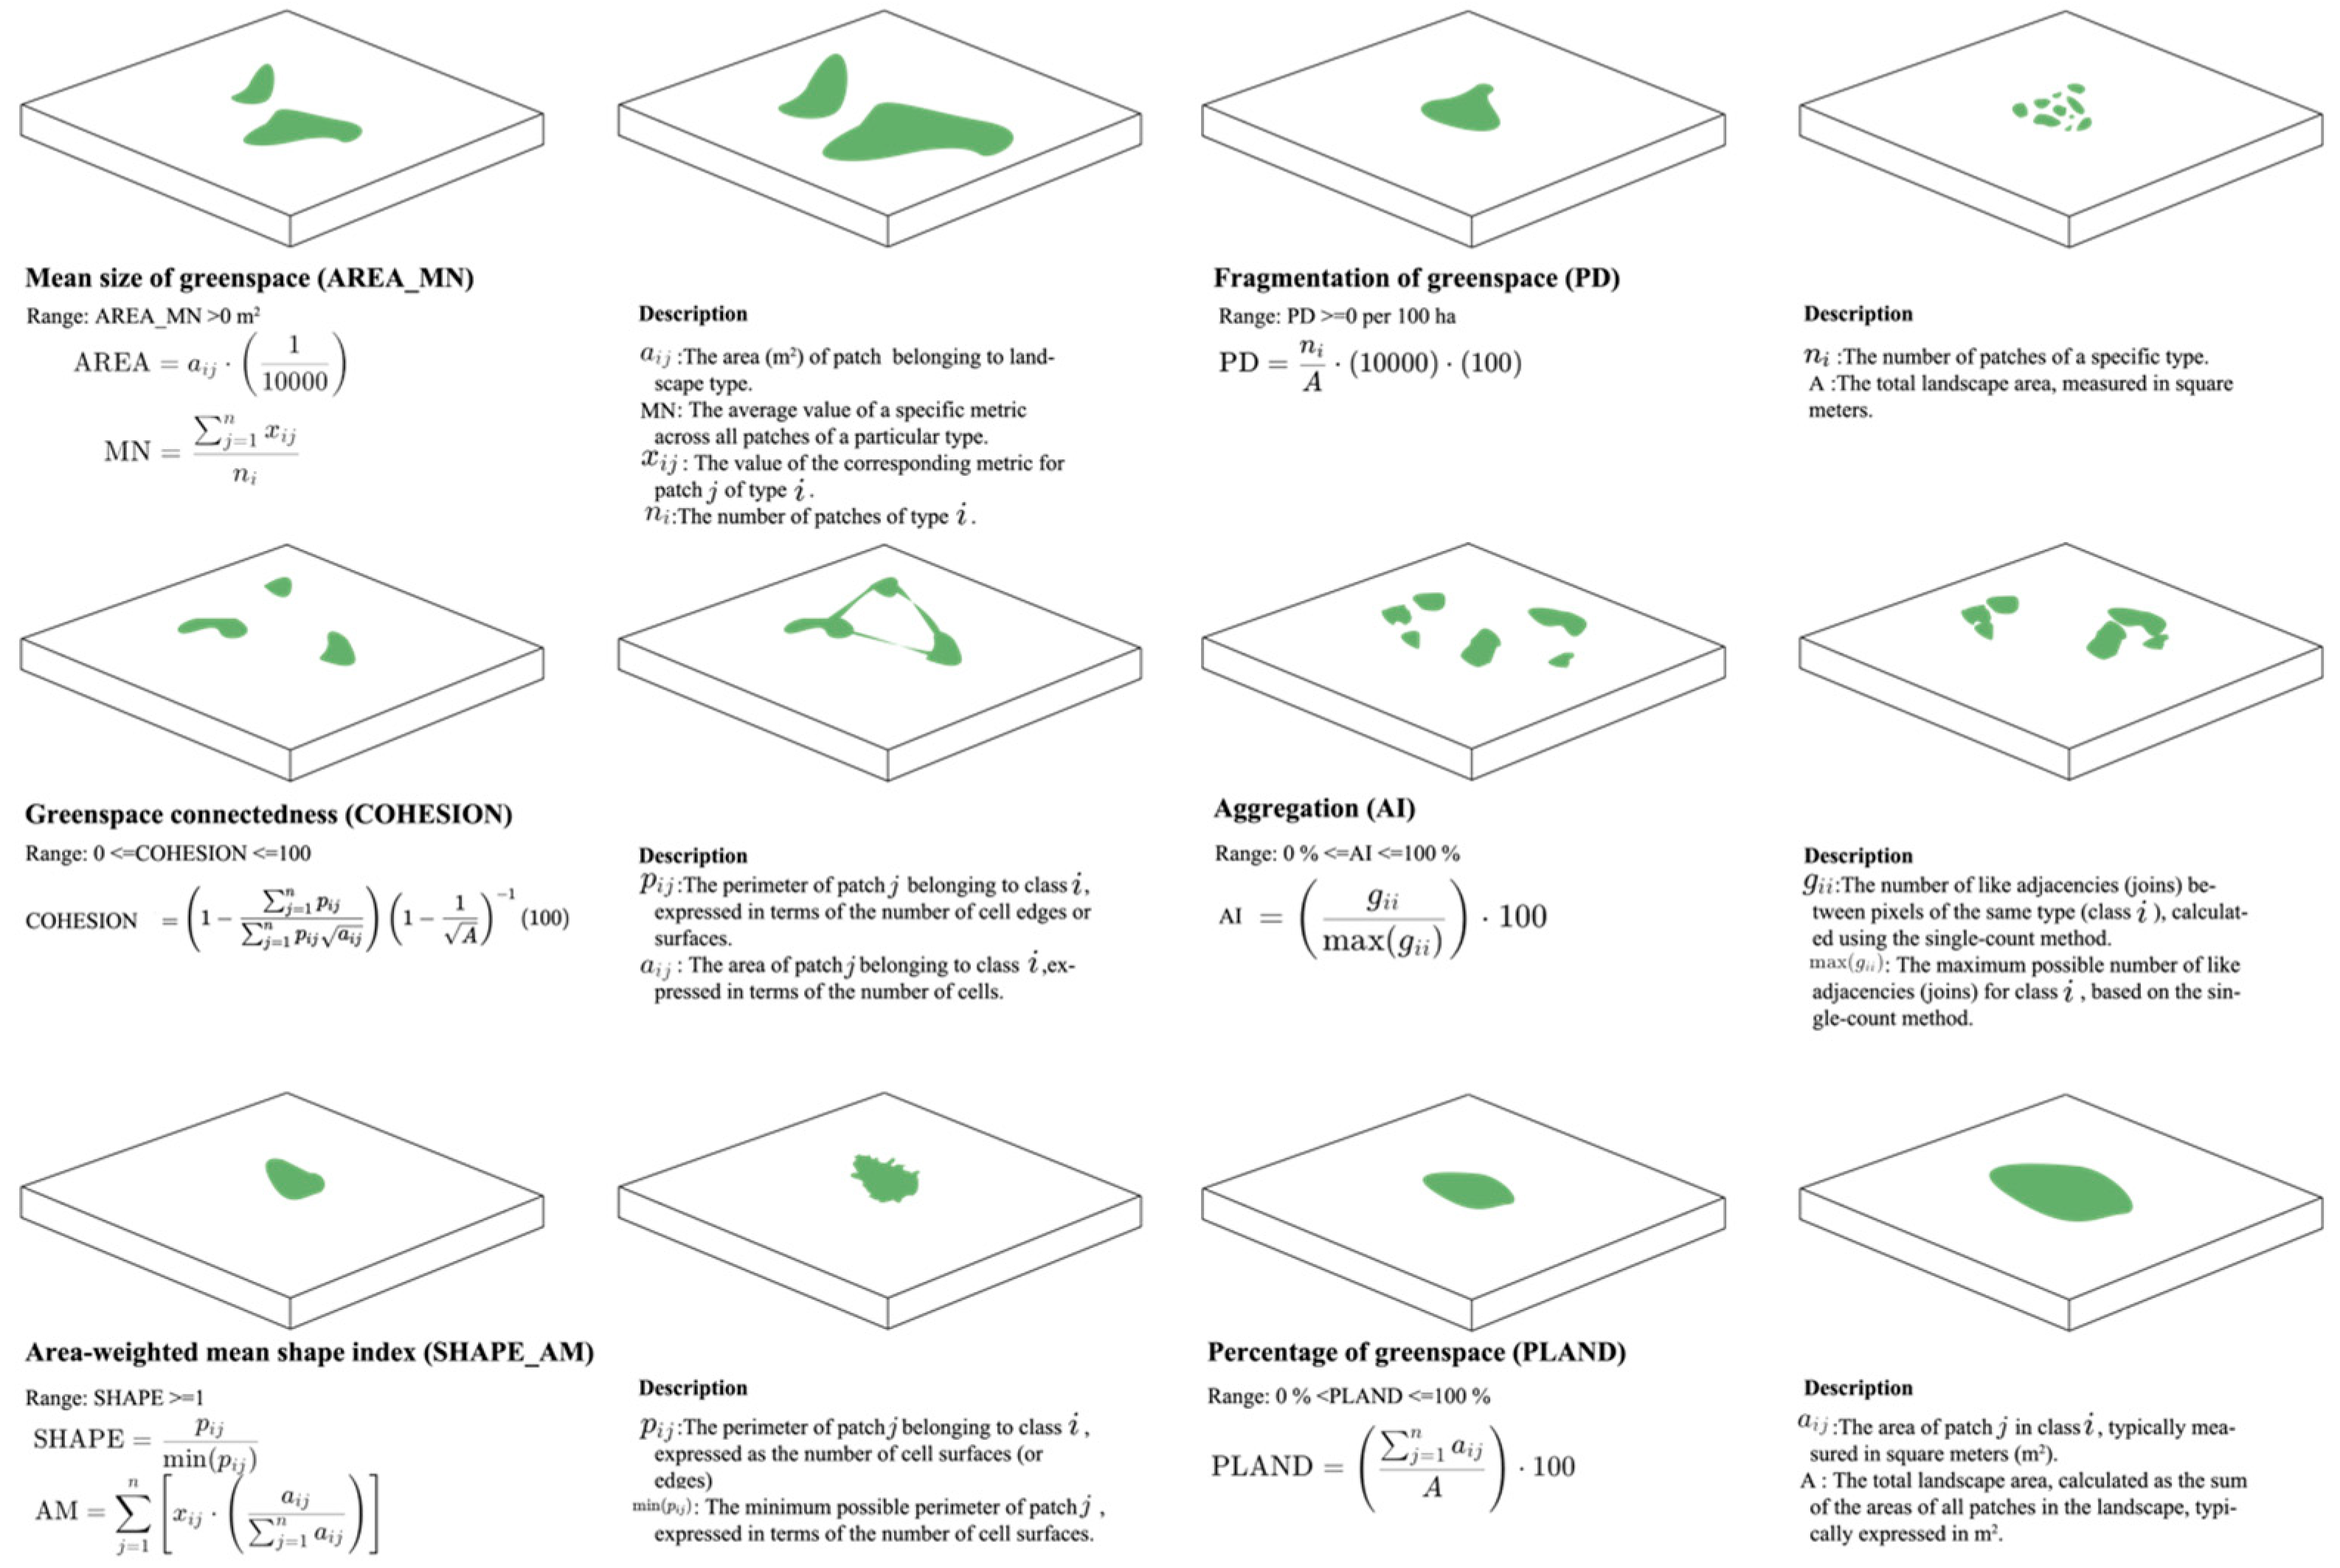
2.3. Quantifying Green Space Morphology

The study utilized Fragstats 4.2 to calculate five landscape metrics, which are both scientifically rigorous and practically valuable. On one hand, these metrics were used to assess the contribution of each green space feature to visual perception, revealing the relationship between green space morphology and visual experience. On the other hand, they reflect the core morphological attributes of green spaces, offering clear and interpretable guidance that can be easily understood and applied by urban decision-makers. By integrating quantitative analysis of visual perception with practical considerations for decision-making, the research bridges the gap between theory and practice, providing a scientifically grounded and feasible reference for green space planning and management. Figure 1 provides a description of the metrics.

2.4. Covariates and Mediators

Landscape preferences are related to factors such as the observer’s education level [65], gender [66,67], age [68], and expertise [66,69]. We developed a model that adjusted for potential confounders based on previous research. We controlled for geographic and sociodemographic factors. Studies have shown that perceptions of green spaces differ by gender, with women typically deriving greater benefits from green spaces [70,71,72] and being more active in green spaces compared to men [73]. There are differences in the preferences for restorative landscapes between men and women. Women tend to prefer natural landscapes as restorative places, while men are more likely to choose open or structured environments [74]. Particularly in landscape selection, women’s preference for natural landscapes is often more pronounced than that of men, which may be related to different physiological and psychological recovery needs [75].
Zhang and Zhao highlighted that educational attainment and gender significantly influence preference evaluations [76]. Therefore, we incorporated the percentage of women and individuals with a bachelor’s degree or higher into the model. Since the aim was to go beyond the influence of general green vegetation characteristics within the geographic scope and to examine the role and connection of green space morphology to visual perception, we controlled for the spatial area to mitigate major potential sources of variation. The area data were processed using ArcGIS 10.8.
We collected data on visual perception, landscape element proportions, visual entropy, and richness to explore their mediating roles in the relationship between green space morphology and visual perception preferences. Visual perception was calculated using the analytic hierarchy process (AHP), which assigns different weights to each indicator. Landscape element proportions, visual entropy, and richness were computed using the deep learning model Mask2Former. Specifically, landscape element proportions were derived based on SceneParse150, which forms the scene parsing benchmark for ADE20K. Among the 150 categories, 35 represent amorphous classes (e.g., trees, sky, and roads), while 115 represent discrete object classes (e.g., infrastructure and people). The annotated pixels for these 150 classes account for 92.75% of all pixels in the dataset, with amorphous background classes covering 60.92% and discrete object classes accounting for 31.83%.

2.5. Statistical Analysis
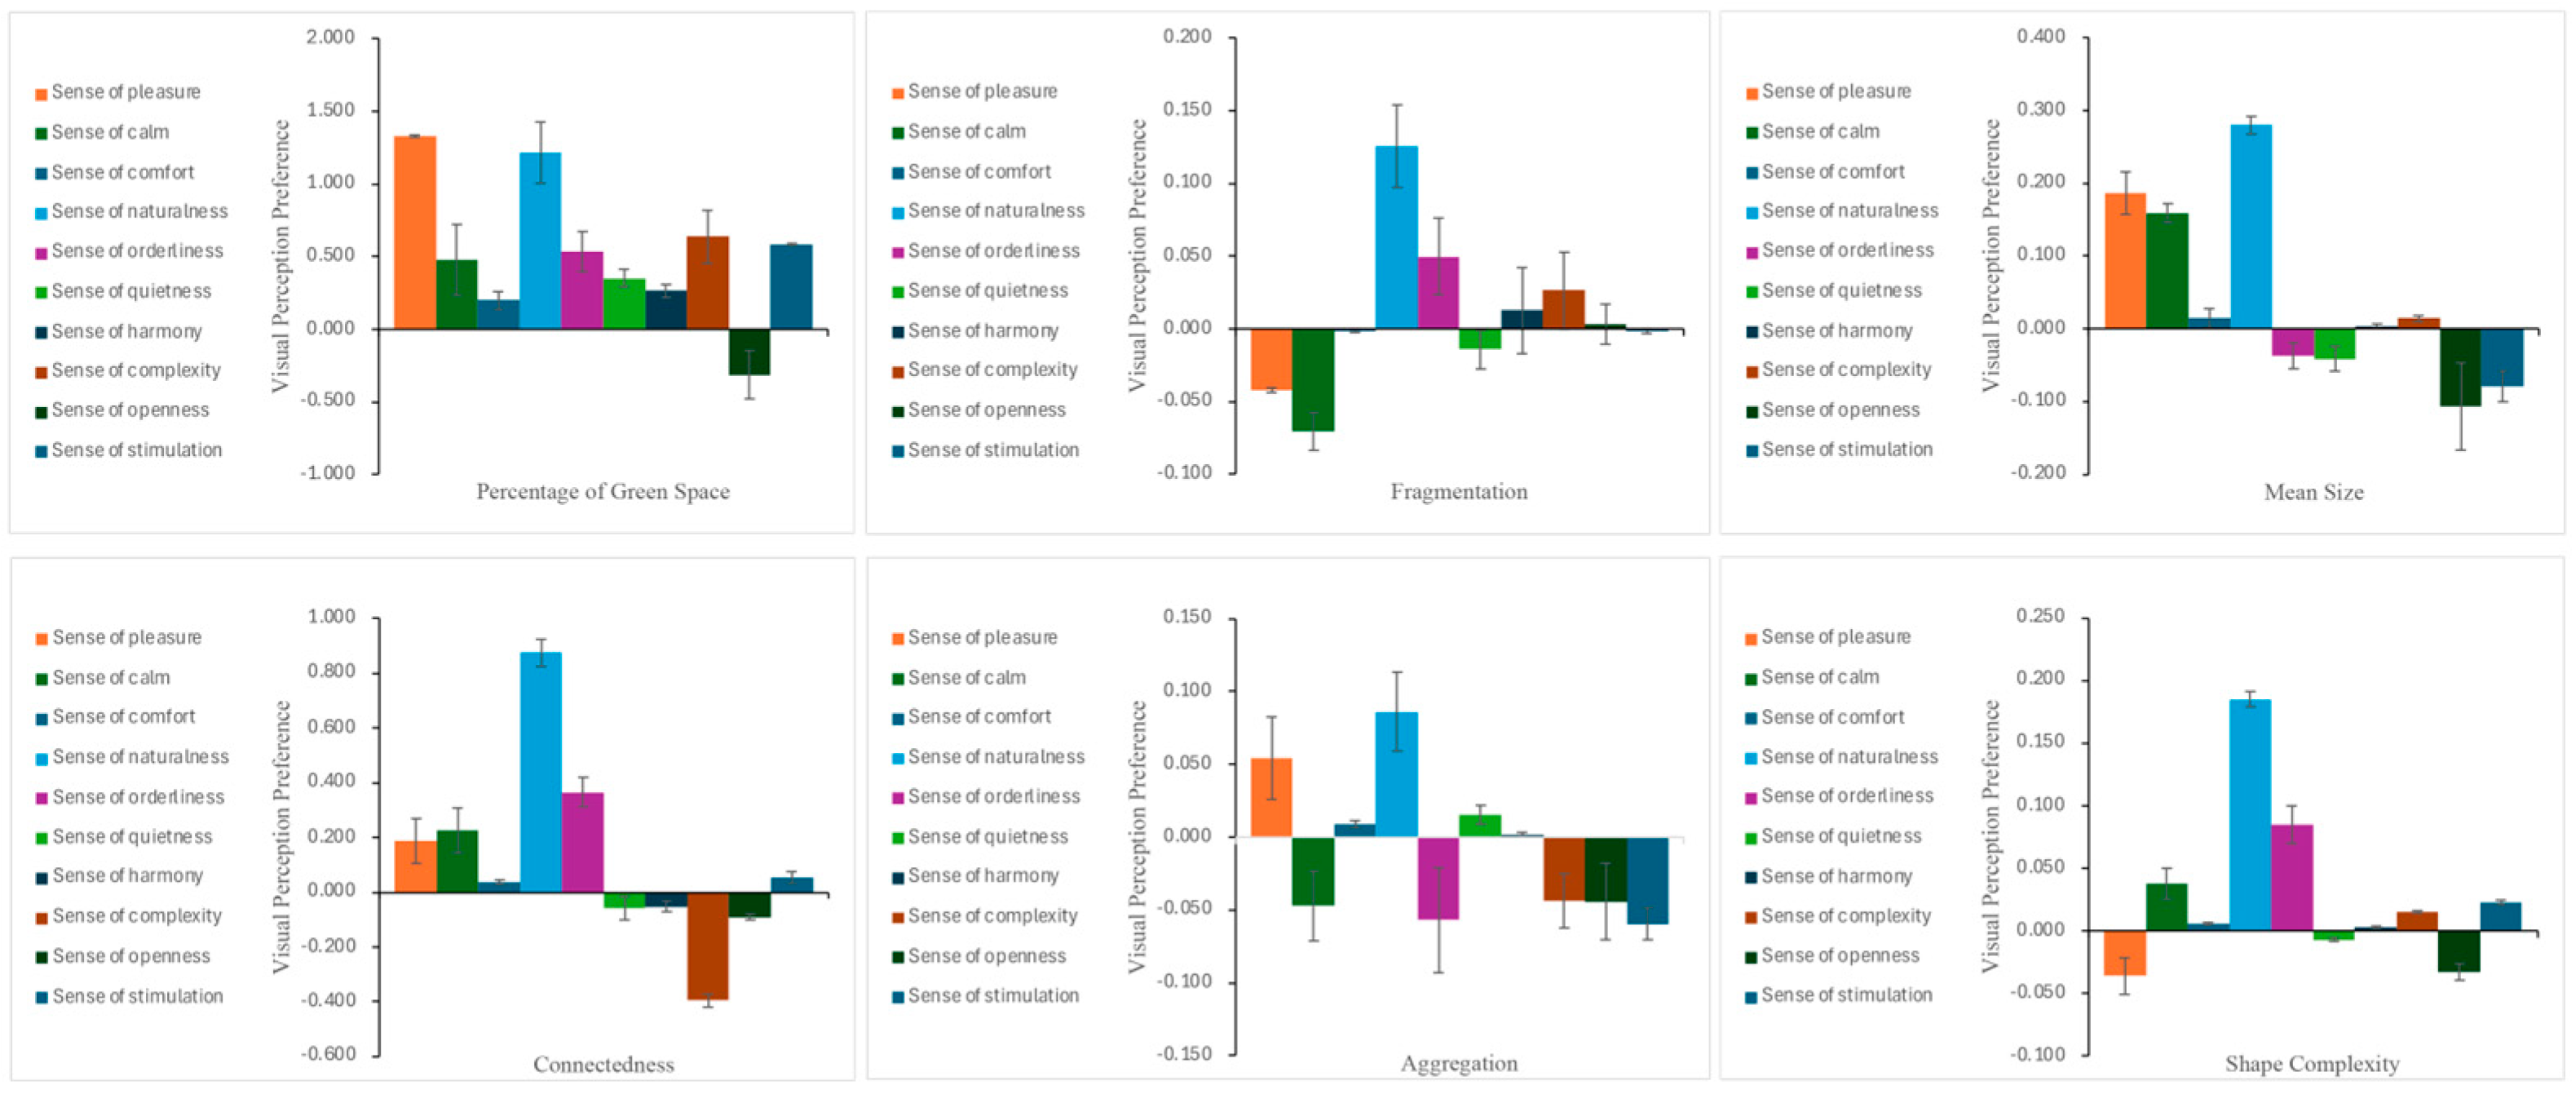
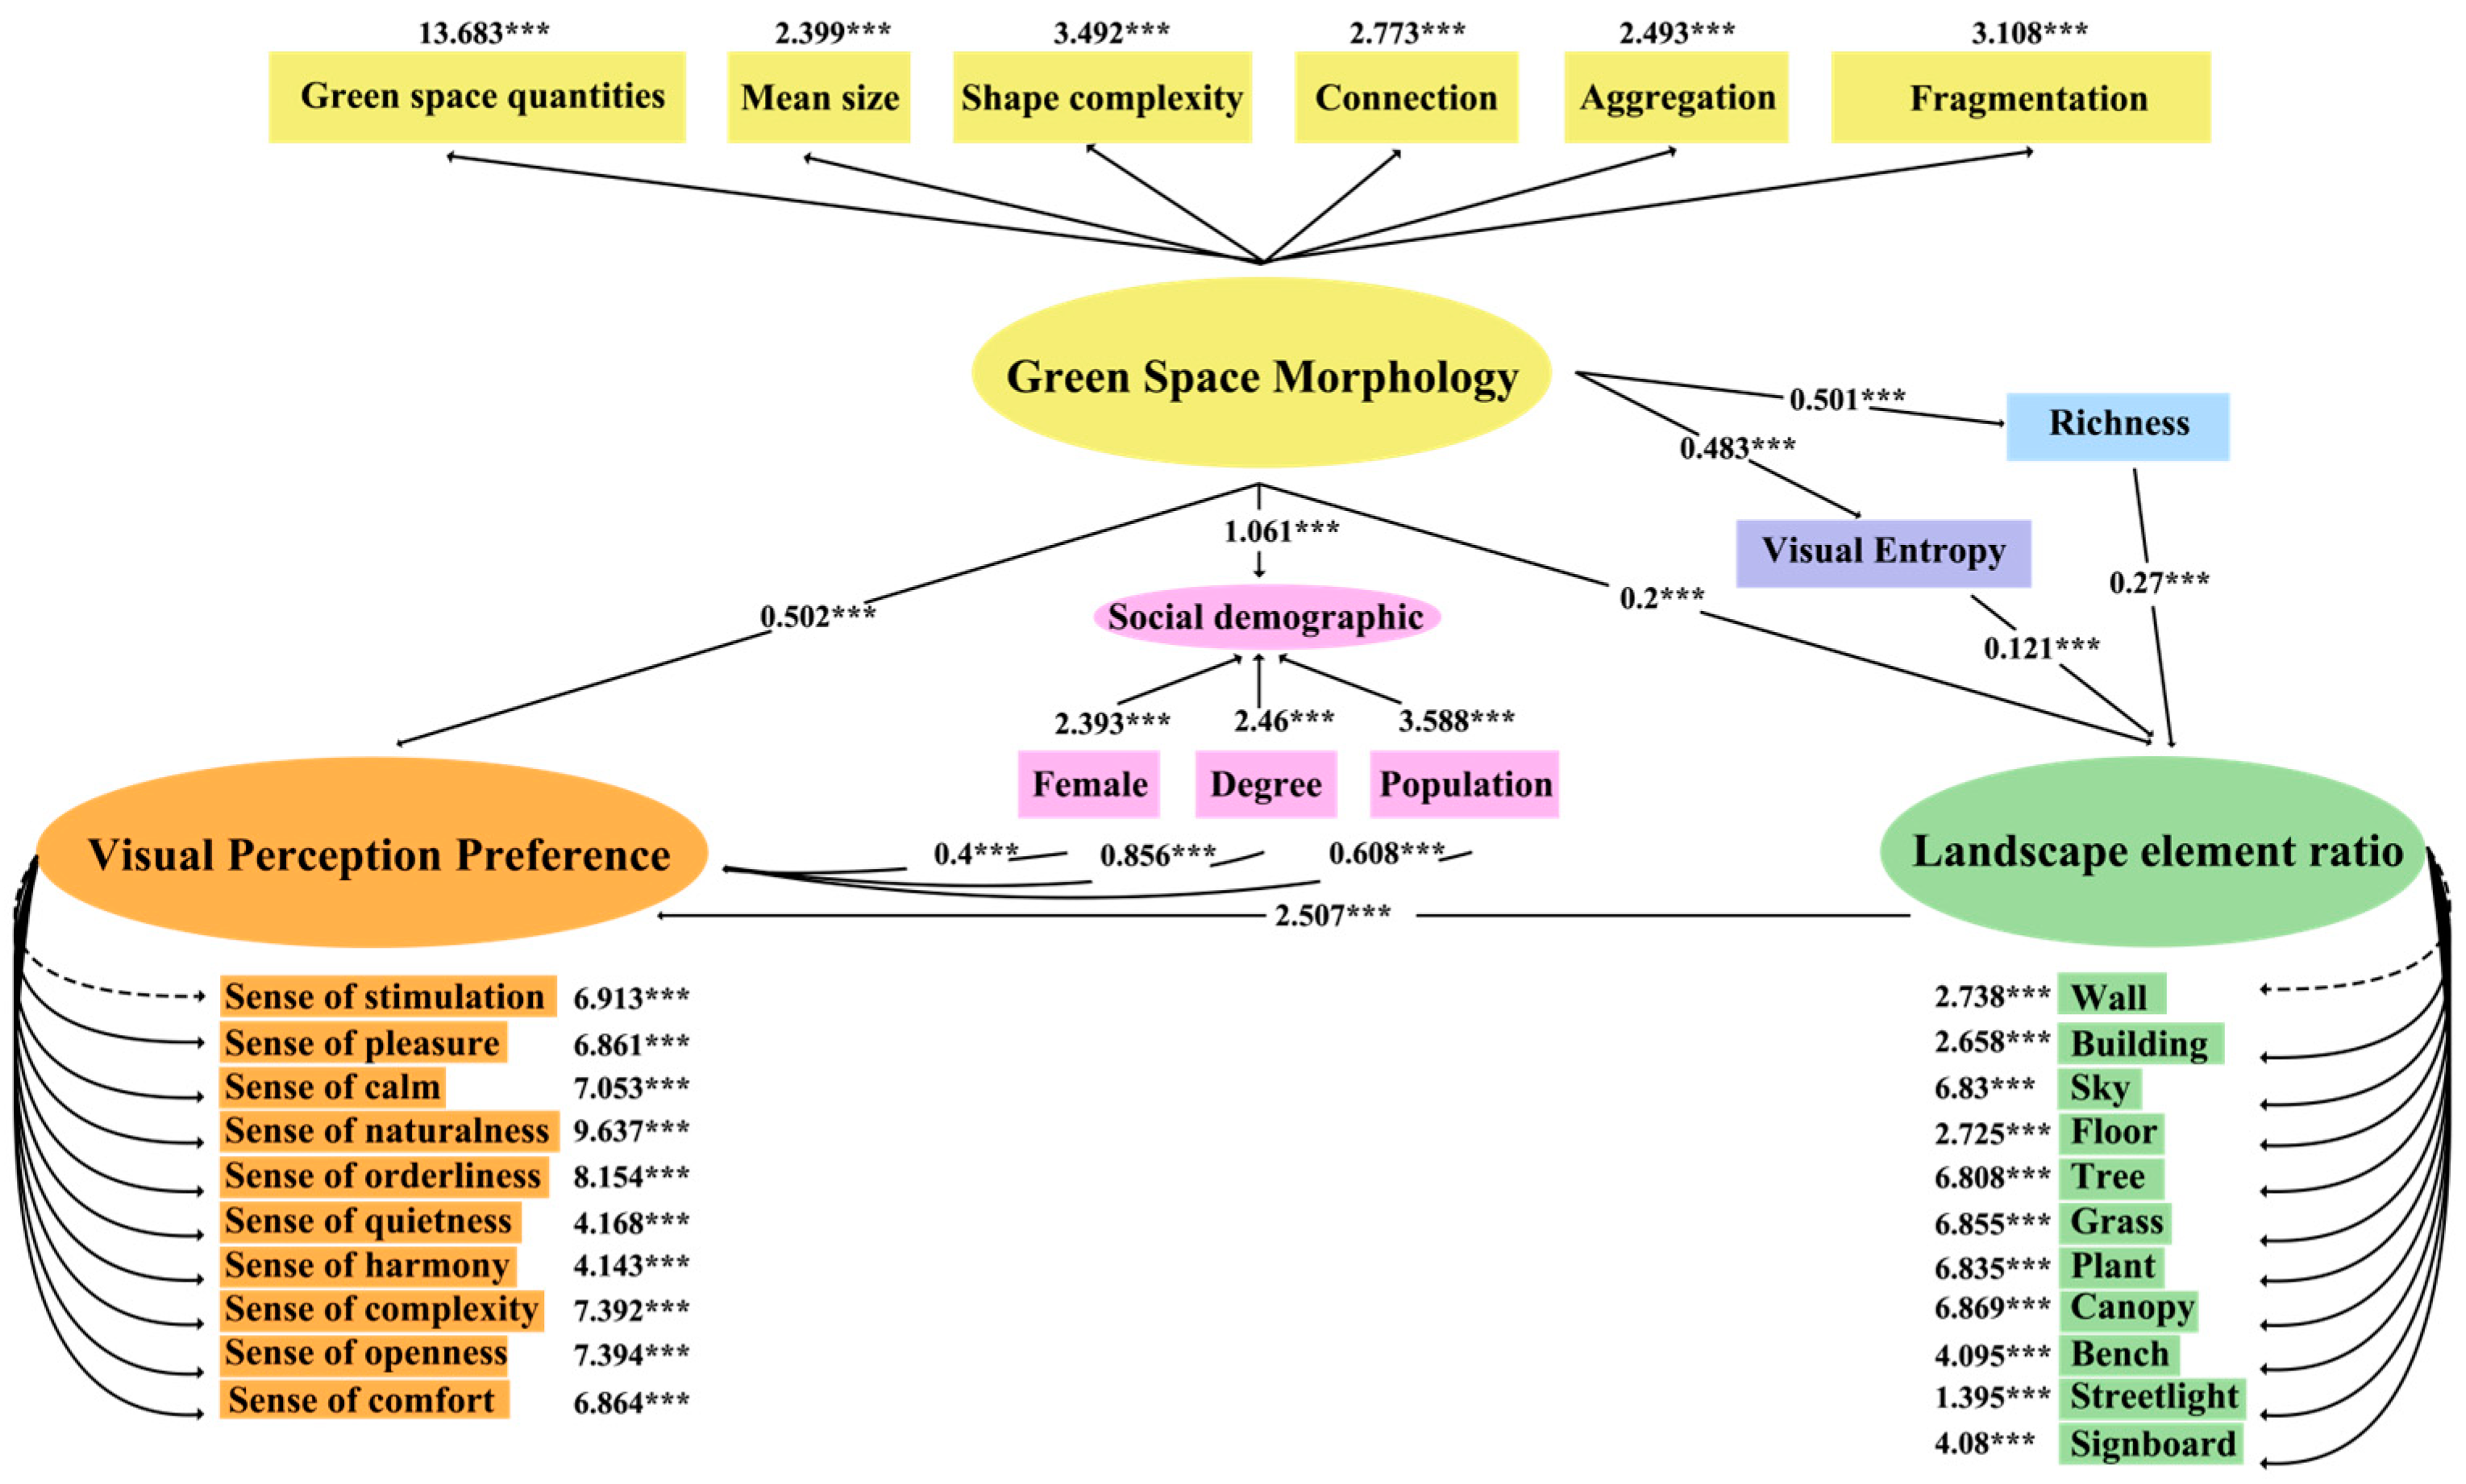
To explore the relationship between green space morphology and visual perception preferences, we employed a multi-objective regression model and structural equation modeling (SEM). Visual entropy, richness, and landscape element preferences were included as mediating variables, while controlling for the impact of green space quantity. However, significant differences existed among different green spaces in terms of infrastructure, which could confound the results of visual perception preferences. To address this, we prioritized selecting green spaces that were similar in key indicators, such as area, infrastructure, NDVI, and fractal dimension, ensuring the homogeneity of the data sources and minimizing the interference of confounding factors.
The multi-objective regression model is capable of simultaneously handling multiple correlated dependent variables, such as visual entropy, richness, and landscape element preferences. This model not only reduces the number of hypothesis tests, minimizing redundant errors and improving statistical robustness, but also captures potential nonlinear relationships and interaction effects. Additionally, covariance matrix analysis allows for the quantification of correlations between dependent variables, further deepening the understanding of visual perception mechanisms.
Building on this, we applied structural equation modeling (SEM) to integrate causal inference with data analysis. SEM allows for the simultaneous evaluation of direct and indirect effects between multiple independent variables, mediators, and dependent variables, and its effectiveness has been widely validated in environmental and health research [76]. We employed SEM to integrate causal inference with data analysis. Unlike traditional regression analysis that focuses on correlations, we focused more on the causal pathways between green space morphology, visual perception preferences, and the proportion of landscape elements. SEM enables the construction of latent variables and path analysis, which helps clarify the mechanisms through which green space morphology affects visual perception preferences, particularly through the mediating roles of visual richness and visual entropy. The SEM was constructed using R version 4.2.
The selection of the multi-objective regression model and SEM was strategically made to thoroughly investigate the intricate relationships between green space morphology, landscape elements, and visual perception preferences. The integration of these two methods enhanced the comprehensiveness and precision of our research approach, facilitating a deeper understanding of the mechanisms through which urban green spaces impact visual perception and human well-being. The methodological innovation and flexibility offer robust support for urban green space planning and design, ensuring both the scientific rigor and practical relevance of the study.

3. Results

Since the goal of this study was to explore the general relationship between green space morphology and visual perception preferences, rather than the localized effects of individual parks, we integrated data from 10 parks with similar infrastructure, complexity, NDVI, and area for analysis. This integrated analysis helped reveal the overall patterns of how different green space morphologies influence visual preferences and further explore the universal mechanisms through which green space morphological characteristics affect visual perception preferences. Figure 2 provides detailed information. Lawns, shrubs, and forests are all considered as green spaces, and the use of high-resolution imagery allowed us to capture every green patch within the study area.
In general, parks with larger average sizes, higher connectivity, aggregation, coherence, and more complex shapes exhibited significant differences in various visual perception preferences. Beyond green space quantity, the green space morphology indicators also captured substantial variations in local visual perception preferences. Figure 3 provides the regression coefficients for all the analyses.
The results indicated that the structural equation model (SEM) demonstrated an overall good fit. The comparative fit index (CFI) and Tucker–Lewis index (TLI) were 0.975 and 0.973, respectively, both exceeding the standard threshold of 0.95, indicating excellent model fit. The standardized root mean square residual (SRMR) was 0.018, well below the recommended value of 0.05, further supporting the low residual error of the model. The root mean square error of approximation (RMSEA) was 0.081, falling within the acceptable range.
We found that green space morphology mediated the relationship between visual entropy, richness, and the proportion of landscape elements with visual perception preferences. For example, based on the predictive model, in a green space with an additional 23,074.19 square meters of greenery, the visual perception levels of comfort, pleasure, calmness, naturalness, quietness, harmony, complexity, openness, and stimulation increased by 1.23%, 2.35%, 0.42%, 2.61%, 1.31%, 0.61%, and 0.1%, respectively. In contrast, the perception levels of orderliness, openness, and stimulation decreased by 1.46%, 3.95%, and 0.3%, respectively.
Figure 4 illustrates the analysis results of the structural equation model. The results indicated that sociodemographic variables (coef. = 1.080, p < 0.01), landscape richness (coef. = 0.381, p < 0.01), and visual entropy (coef. = 0.371, p < 0.01) mediated the relationship between green space morphology and the proportion of landscape elements. The proportion of landscape elements (coef. = 2.526, p < 0.01) independently predicted some aspects of visual perception preferences, surpassing the influence of green space morphology. Landscape richness (coef. = 0.673, p < 0.001), visual entropy (coef. = 0.314, p < 0.001), and the proportion of landscape elements (coef. = 2.526, p < 0.001) mediated the relationship between sociodemographic variables (coef. = 2.668, p < 0.001) and visual perception preferences. Additionally, we observed that green space morphology (coef. = 0.505, p < 0.001), proportion of women (coef. = 0.403, p < 0.01), education proportion (coef. = 0.862, p < 0.01), and population size (coef. = 0.613, p < 0.01) could predict visual perception preferences.

4. Discussion

4.1. Overview

To the best of our knowledge, this is the first study to investigate the relationship between medium-sized green space morphology and visual perception preferences in Chengdu. Our research utilized high-resolution green space data to explore associations across multiple urban areas. We observed significant differences in visual perception preferences associated with green spaces characterized by tighter aggregation, coherence, and complex shapes. Our findings indicated that the relationship between green space morphology and visual perception preferences was partially mediated by the proportion of visual landscape elements.
This effect is consistent with previous research findings. Semi-open green spaces (10–70% canopy cover of trees/shrubs) are associated with the richest perceptual dimensions in visual perception, followed by closed green spaces (>70% canopy cover of trees/shrubs) and open green spaces (<10% canopy cover of trees/shrubs) [50]. Semi-open and semi-closed green spaces tend to promote optimal restorative benefits when visual visibility is lower [77]. Green space morphology enhances visual perception preferences by increasing the visual richness and complexity of the landscape, thereby stimulating more perceptual engagement. Environmental health researchers have demonstrated that green environments improve human health by reducing stress-related mental disorders, enhancing stress relief, emotional health, self-esteem, and creativity [78]. Ha and Kim confirmed that high perceived plant species diversity in campus green spaces is associated with improvements in students’ emotional states [79,80].
We used high-resolution satellite imagery and the Mask2Former image segmentation deep learning model, combined with multi-objective regression and structural equation modeling, to precisely quantify the impact of green space morphology on visual perception. The study found that the relationship between green space morphology and visual perception preferences was partially mediated by the proportion of visible landscape elements. Additionally, the association between green space morphology and the proportion of landscape elements was mediated by visual richness and visual entropy. Furthermore, we observed significant associations between sociodemographic variables and visual perception preferences, with notable links between the proportion of women, individuals with a bachelor’s degree or higher, and the overall population with visual perception preferences.
Notably, to provide stronger statistical power in elucidating the relationship between green space morphology and visual perception preferences, we observed that all visual perception outcomes in urban green spaces were directly predicted by morphological metrics. Among the various morphological indicators, the quantity of green space exhibited the highest coefficients in most cases, whereas perceived openness showed the highest coefficient in relation to green space fragmentation.
This difference may be attributed to the fact that visual perception preferences are closely associated with the quantity of green space. A more abundant green space visual experience reduces the sense of a visual void, highlighting the statistical capacity of green space morphology in revealing its association with human visual perception.

4.2. Green Space Morphology and Visual Perception Preferences

Green space morphology is positively correlated with visual perception preferences. This indicates that, compared to green spaces with fewer numbers, smaller average areas, simpler shapes, greater fragmentation, more dispersion, and weaker connectivity, relatively complex green space morphologies offer greater potential for enhancing visual perception preferences.
Our findings align with a previous individual-level study, which reported that visual landscape features, such as plant species richness and color diversity, significantly influence public perception and preferences [81]. Additionally, another cross-sectional study found that the composition of landscape elements and the proportion of vegetation partially reflect green space diversity, which, in turn, is significantly associated with public visual perception preferences [82].
Among the morphological indicators examined, the quantity of green spaces emerged as a significant factor, demonstrating a positive correlation with urban green space visual perception preferences in our study—except for perceptions of openness. This finding aligns with previous research, which reported that an increase in green space quantity is associated with elevated perceptions of comfort and pleasure [83,84]. A greater green space area provides natural barriers that reduce noise, thereby enhancing perceptions of quietness [85,86] and reducing stimulation [87]. Conversely, an increase in green space quantity may lead to a decrease in perceived visual openness.
Similarly, green space quantity may indirectly influence perceptions of harmony and order by balancing spatial and natural relationships [88]. As a direct carrier of natural elements, the quantity of green spaces reflects the extent of natural components within urban areas [89]. Diverse green space layouts have also been found to enhance the perception of complexity [90].
A notable distinction in our study was that increasing the green space area may not always result in the expected improvements in visual perception preferences. For instance, adding simplistic types of green spaces might fail to influence visual preferences unless diversity and visual complexity are enhanced. Therefore, when planning the placement of new urban green spaces, it is crucial to consider the proportion of landscape elements and visual richness, avoiding overly monotonous visuals.
Green space fragmentation showed a positive correlation with visual perception preferences, excluding perceptions of comfort, pleasure, and quietness. The greater the degree of green space fragmentation, the lower the levels of urban visual aesthetic appeal, comfort, and quietness. This finding aligns with previous studies, which reported that increasing fragmentation enhances landscape heterogeneity and visual complexity [91,92]. Additionally, environments lacking continuous green spaces tend to be noisier [93], and the loss and dispersion of vegetation-rich green spaces contribute to an increased sense of openness [94].
In our study, we conducted an analysis of visual complexity to assess urban visual perception preferences, ensuring that the evaluation met the study’s requirements. A key distinction from prior findings was our observation that sufficiently rich visual complexity in fragmented green spaces can enhance perceptions of nature, order, harmony, complexity, stimulation, and openness. This suggested that isolated but visually rich green spaces may have unexpected impacts on visual perception preferences. For instance, the presence of numerous high-quality fragmented green spaces in urban areas could potentially enhance people’s cognitive perceptions, provided that green space diversity and visual richness are maintained.
This underscores the importance of considering the quality and distribution of green spaces when designing micro-green spaces or smaller green patches. Ensuring their diversity and visual richness can significantly influence urban residents’ visual preferences and experiences.
An increase in the average size of green spaces was positively associated with effective perceptions of comfort, pleasure, quietness, nature, harmony, and complexity. This finding aligns with a study conducted in highly urbanized areas of Germany, which also identified a correlation between larger green spaces and higher levels of perceived naturalness, pleasure, and comfort [95].
While we previously emphasized the critical role high-quality fragmented green spaces play in daily interactions and accessibility, their limitations in offering broader perceptual benefits may explain the observed reductions in perceptions of order, openness, and complexity.
To gain a more comprehensive understanding of this relationship, future research should explore how design interventions can incorporate green complexity, such as vertical greening, to enhance the balance between scale and perceptual benefits. Expanding the perceptual advantages of smaller green spaces through thoughtful design strategies could significantly enhance their contribution to urban well-being.
Green space connectivity was positively associated with perceived comfort, pleasure, quietness, naturalness, order, and stimulation. The link between connectivity and comfort or quietness stems from the ability of interconnected green spaces to create continuous, noise-buffering environments that shield users from urban stressors [96]. Similarly, the positive effects on perceptions of naturalness and order can be attributed to the integration of green patches, fostering an immersive and visually harmonious environment [97].
The association with stimulation likely reflects the diverse experiences facilitated by well-connected green spaces, which allow users to explore various landscapes and engage in dynamic activities [98]. Additionally, a UK-based study examining changes during the COVID-19 pandemic indirectly indicated that green space connectivity influences residents’ social and psychological well-being [99].
Green space aggregation was associated with visual perceptions, particularly in its positive correlation with perceived comfort, pleasure, naturalness, quietness, harmony, and complexity. This finding contributes to understanding how the spatial organization of green spaces potentially influences urban residents’ perceptual responses. A systematic literature review reported that diverse landscape elements and good visibility in public urban green spaces could indirectly affect visual perception and subsequently influence social behaviors [100].
However, green space aggregation did not exhibit consistent positive correlations with all visual perception preferences in this study. We hypothesized that this variation might be attributed to differences in green space structures and surrounding environments, particularly in terms of the proportion of landscape elements and visual complexity. Further research is needed to explore the underlying mechanisms behind these variations in more depth.
The complexity of green space shapes indicated a positive correlation with most visual perceptions, except for perceived pleasure and openness. This suggested that, between two parks of the same size, parks with more complex shapes are likely to evoke stronger visual perceptions. Compared to compact parks, complex-shaped parks offer larger boundary areas and multiple entry points, which facilitate and attract more people to engage with the green space. Previous studies have shown that the complexity of green space shapes plays a crucial role in shaping individuals’ perceptions of their environment. Increased complexity provides more dynamic visual stimuli, which can activate a broader range of sensory responses, thereby increasing interest and engagement with the environment [101]. Interestingly, the complexity of green space shapes does not necessarily diminish comfort; instead, it may enhance people’s perception of comfort by enriching the overall aesthetic experience [102]. In addition, environmental complexity may cause visual fatigue, leading to a reduced sense of pleasure [103]. To further clarify the mechanisms behind the relationship between green space shape and visual perception, we encourage further research at the individual level to predict real-world visual preferences for urban green spaces.

4.3. Mediating Effects and Potential Mechanisms

The visual richness provided by green spaces may be a potential pathway linking green space morphology and visual perception preferences. Our study indicated that the proportion of landscape elements mediated the relationship between green space morphology and visual perception preferences. The proportion of landscape elements influenced the visual richness of green spaces, which refers to the distribution and composition of different elements within the green space and its spatial structure. A diverse range of landscape elements can provide richer visual information, thereby enhancing the visual perception experience [104]. High-density, well-organized landscape elements can create more attractive visual structures, improving the cohesion and coherence of green spaces, making them more visually appealing [105]. Additionally, changes in the proportion of landscape elements may regulate people’s behavioral responses and perceptual experiences. Higher green coverage and the richness of landscape elements can encourage people to engage more actively with the space for leisure, social activities, and other interactions, while the opposite may occur in spaces with less diversity [106].
Furthermore, green space morphology is related to an increase in visual richness and visual entropy. Although research on the impact of green space morphology on visual perception is relatively limited, existing studies have shown that prolonged exposure to green spaces is associated with improved cognitive functions across age groups, including enhanced attention and executive functions [107].
It is well established that the visual attributes of urban green spaces are contributing factors to people’s behaviors and emotional responses [108]. Rich visual textures provoke stronger perceptual stimuli while enhancing cognitive and emotional responses to the environment [109]. In environmental psychology, moderate visual texture richness is often associated with positive perceptual experiences, such as comfort and pleasure [110]. In this study, we found a direct relationship between visual entropy, visual richness, and the proportion of landscape elements with green space morphology.
Several factors may explain this finding. First, the diversity and richness of a green space directly led to increased visual perception complexity, thereby enhancing visual entropy. Human perception of visual stimuli is multidimensional, and both visual richness and visual entropy are often linked to aesthetic preferences. A diverse range of landscape elements can stimulate higher perceptual interest. Second, the spatial organization of green space morphology directly influenced visual information processing. Higher element density results in an accumulation of visual information, while the rationality and coherence of spatial layout help guide attention, creating a dynamic visual experience. How exactly green space morphology enriches visual experiences requires further investigation, such as longitudinal studies, to provide additional evidence.
In addition, compared to fragmented green spaces, green spaces with high connectivity present significantly greater opportunities to enhance visual perception preferences, including biodiversity. As the number of plant species increases, the visual appeal of the landscape is enhanced, which better stimulates people’s emotional responses and improves their physical and mental well-being [111]. Connected, aggregated, cohesive, and complexly shaped green spaces have consistently been associated with higher levels of biodiversity, further suggesting that visual perception is linked to promoting health and well-being. These ecological factors may mediate the observed associations and warrant further investigation.
Sociodemographic factors played a significant role in shaping the relationship with visual perception preferences. Women generally have stronger visual perceptions of green spaces and more positive responses to these environments [77], and they are more likely to engage in outdoor activities [112], which may stimulate their visual perception systems. People with a higher education level (bachelor’s degree or above) tend to have a deeper awareness and appreciation of landscape aesthetics, and their understanding of the environment may be more systematic and comprehensive. This enables them to process more information during visual perception, forming more complex perceptual patterns. Natural environments that align with people’s preferences tend to attract more human activity, promoting physical and mental healing through interaction with the environment [4].
We suggest that urban green spaces with closer connectivity, aggregation, cohesion, and complexity in shape can encourage residents to engage with green spaces, extending the duration, frequency, and intensity of their interactions. Compared to dispersed green spaces, the distribution of connected and aggregated green spaces can enhance continuous natural experiences. This configuration helps people consistently receive visual stimuli from the environment, increasing their positive participation and gaining health benefits. Previous studies have shown that in the post-pandemic era, green spaces help alleviate the disruptions caused by COVID-19 sequelae in daily life and reduce the risk of chronic diseases [4]. Currently, there is no definitive medical solution for treating post-COVID-19 symptoms, but as a public resource, understanding people’s perception preferences of urban green spaces can facilitate their access to long-term, free “green therapy” in the post-pandemic period, promoting both physical and mental healing.

4.4. Practical Implications for Health and Urban Planning

Our study complements existing research by highlighting the additional protective role of green space morphology. From the perspective of landscape and urban designers, connecting existing parks through streetside green corridors appears to be a viable method for achieving the preferred distribution of green spaces. Adding isolated small lawn plots in front of buildings may not be as effective as expanding a relatively large park, which is already planned or exists within a community. In cases where fragmented lawns are present, planting trees in the gaps is a practical and cost-effective method, helping to spatially connect them by providing larger tree canopies. Finally, transforming large parks to create more entry points and border areas could increase the accessibility of these parks to a larger population, thus benefiting public health.
This study complements other research by demonstrating the additional role of green space morphology. From the perspective of landscape and urban designers, ensuring green space quality and increasing visual richness through diverse combinations of landscape elements is a feasible approach for preferred green space design. By planting vegetation in gap areas to connect fragmented green spaces, accessibility from the community to the green spaces can be achieved. Lastly, reshaping large urban green spaces to create more access points can increase foot traffic and encourage public engagement with these green areas. Cases from Spain demonstrated the potential of natural solutions in creating more sustainable and health-promoting urban environments, fostering physical and mental well-being [113].
Future research should focus on the relationship between urban green space morphology and visual perception preferences across different cultural and geographical contexts. European cities may favor large, accessible urban green spaces, while Asian cities might place more emphasis on the functionality of medium- and small-sized green spaces in their designs. These differences could influence residents’ frequency of green space usage and their perceptual preferences. Cross-cultural comparative studies assessing the applicability of green space morphology in different cultural and geographical settings will help better understand these variations and provide valuable insights for urban green space design on a global scale.

4.5. Limitations and Future Research Directions

Our study has several limitations. First, at the population level, we lacked data on the time and frequency of people’s interactions with green spaces. Individual-level research is necessary to determine how green space morphology affects real-world exposure to nature. Second, we focused on the visual perception preferences of people aged 18 to 40, and it remains unclear how these preferences might change for those over 40, which may influence the relationship between green space morphology and visual perception preferences. Future research could explore potential moderating effects of sociodemographic variables (such as age groups, socioeconomic status, and population density) through individual-level analysis. Finally, our assessment focused on green space coverage and overlooked accessibility, making it impossible to accurately determine how green spaces promote social cohesion.

5. Conclusions

Green space morphology, particularly larger, connected, aggregated, cohesive, and complexly shaped green spaces, was significantly associated with enhanced visual perception. This effect was consistent across urban green spaces with similar visual complexity and coverage. The research further revealed that investing in areas where the average size, connectivity, aggregation, cohesion, and shape complexity of green spaces can be increased will enhance the visual richness and diversity of landscape elements. This can fill gaps between green spaces, improving people’s visual perception and, in turn, enhancing the healing benefits of these spaces. We suggest that green space morphology may influence residents’ accessibility to, frequency of, and duration of exposure to green spaces, thereby affecting visual perception preferences and reducing therapeutic effects. Therefore, when planning urban green spaces, it is crucial to focus on their spatial design to ensure sufficient visual complexity and diversity, thus maximizing therapeutic benefits and promoting public health.
These findings hold significant practical implications for urban green space planning, particularly for urban and landscape planners, as they provide concrete design guidance. We recommend prioritizing the expansion of green space size, enhancing connectivity, and focusing on shape complexity to achieve better visual perception outcomes. For policymakers, supporting and promoting this morphology-based planning strategy will not only improve the visual perception of urban green spaces but also effectively enhance the mental health and well-being of citizens.
Moreover, these findings have strong international relevance. Although this study focused on Chengdu, our conclusions have broad applicability to urban planning worldwide. The impact of green space morphology on visual perception may show similarities across different cities and geographical contexts, particularly in the face of increasing urbanization pressures. Well-designed green space planning can enhance the health and well-being of residents globally. Therefore, we urge urban planners worldwide to pay more attention to the morphology of green spaces and the proportion of landscape elements in their design, ultimately improving the overall well-being of residents.

Author Contributions

Conceptualization, Y.P.; Software, Y.P., Z.L., A.M.S., B.L. and S.L.; Formal analysis, Y.P.; Investigation, Y.P., Z.L. and Y.L.; Resources, Z.L., A.M.S., B.L. and Y.L.; Writing—original draft, Y.P.; Writing—review & editing, Y.P.; Visualization, Y.P.; Supervision, X.L.; Project administration, H.S. and Q.C.; Funding acquisition, Q.C. All authors have read and agreed to the published version of the manuscript.

Funding

The authors declare that financial support was received for the research, authorship, and/or publication of this article. We would like to express our gratitude for the support provided by the projects “Ecological and Health Benefits of Bamboo Forest Landscapes: Evidence-Based Study on the Spatio-Temporal Coupling Mechanism” (Fund Number: 3227140499) and “The Hai-Ju Program for the Introduction of High-end Talents in Sichuan Provincial Science and Technology Programs” (2024JDHJ0017).

Data Availability Statement

The original contributions presented in the study are included in the article. Further inquiries can be directed to the corresponding author.

Acknowledgments

The authors acknowledge the cooperation of the study participants who were very kind with their time and assistance.

Conflicts of Interest

The authors declare no conflicts of interest.

References

  1. Stansfeld, S.; Haines, M.; Brown, B. Noise and Health in the Urban Environment. Rev. Environ. Health 2000, 15, 43–82. [Google Scholar] [CrossRef]
  2. WHO. Coronavirus Disease (COVID-19): Post COVID-19 Condition. 2021. Available online: https://www.who.int/news-room/questions-and-answers/item/coronavirus-disease-(covid-19)-post-covid-19-condition (accessed on 12 December 2024).
  3. WHO. (n.d.) Post COVID-19 Condition. Available online: https://www.who.int/teams/health-care-readiness/post-covid-19-condition (accessed on 12 December 2024).
  4. Peng, Y.; He, H.; Lv, B.; Wang, J.; Qin, Q.; Song, J.; Liu, Y.; Su, W.; Song, H.; Chen, Q. Chronic impacts of natural infrastructure on the physical and psychological health of university students during and after COVID-19: A case study of Chengdu, China. Front. Public Health 2024, 12, 1508539. [Google Scholar] [CrossRef] [PubMed]
  5. Kajosaari, A.; Hasanzadeh, K.; Fagerholm, N.; Nummi, P.; Kuusisto-Hjort, P.; Kyttä, M. Predicting context-sensitive urban green space quality to support urban green infrastructure planning. Landsc. Urban Plan. 2024, 242, 104952. [Google Scholar] [CrossRef]
  6. Goodenough, A.; Urquhart, J.; Morrison, K.; Black, J.E.; Courtney, P.; Potter, C. Using a socially-engaged arts approach to exploring how diverse socio-cultural groups accessed, valued, engaged with and benefited from an urban treescape during the COVID-19 Pandemic. Urban For. Urban Green. 2024, 98, 128398. [Google Scholar] [CrossRef]
  7. Feng, J.; Lau, P.W.C.; Shi, L.; Huang, W.Y. Movement behaviors and posttraumatic stress disorder during the COVID-19 pandemic. J. Exerc. Sci. Fit. 2022, 20, 263–268. [Google Scholar] [CrossRef] [PubMed]
  8. Marquet, O.; Hirsch, J.A.; Kerr, J.; Jankowska, M.M.; Mitchell, J.; Hart, J.E.; Laden, F.; Hipp, J.A.; James, P. GPS-based activity space exposure to greenness and walkability is associated with increased accelerometer-based physical activity. Environ. Int. 2022, 165, 107317. [Google Scholar] [CrossRef]
  9. Niu, J.; Xiong, J.; Qin, H.; Hu, J.; Deng, J.; Han, G.; Yan, J. Influence of thermal comfort of green spaces on physical activity: Empirical study in an urban park in Chongqing, China. Build. Environ. 2022, 219, 109168. [Google Scholar] [CrossRef]
  10. Daniel, T.C. Whither scenic beauty? Visual landscape quality assessment in the 21st century. Landsc. Urban Plan. 2001, 54, 267–281. [Google Scholar] [CrossRef]
  11. Kaplan, S. Meditation, Restoration, and the Management of Mental Fatigue. Environ. Behav. 2001, 33, 480–506. [Google Scholar] [CrossRef]
  12. Arnberger, A.; Eder, R.; Preiner, S.; Hein, T.; Nopp-Mayr, U. Landscape Preferences of Visitors to the Danube Floodplains National Park, Vienna. Water 2021, 13, 2178. [Google Scholar] [CrossRef]
  13. Coisnon, T.; Musson, A.; Pene, S.D.; Rousselière, D. Disentangling public urban green space satisfaction: Exploring individual and contextual factors across European cities. Cities 2024, 152, 105154. [Google Scholar] [CrossRef]
  14. Long, N.; Tonini, B. Les espaces verts urbains: Étude exploratoire des pratiques et du ressenti des usagers. VertigO 2012, 12. [Google Scholar] [CrossRef]
  15. Bourdeau-Lepage, L. La nature en question. Aménager en ménageant l’homme et son milieu. Géocarrefour 2015, 90, 191–192. [Google Scholar] [CrossRef]
  16. Fisher, B.S.; Nasar, J.L. Fear of Crime in Relation to Three Exterior Site Features: Prospect, Refuge, and Escape. Environ. Behav. 1992, 24, 35–65. [Google Scholar] [CrossRef]
  17. Potgieter, L.J.; Gaertner, M.; O’Farrell, P.J.; Richardson, D.M. Does vegetation structure influence criminal activity? Insights from Cape Town, South Africa. Front. Biogeogr. 2019, 11, e42035. [Google Scholar] [CrossRef]
  18. Van den Berg, A.E.; Jorgensen, A.; Wilson, E.R. Evaluating restoration in urban green spaces: Does setting type make a difference? Landsc. Urban Plan. 2014, 127, 173–181. [Google Scholar] [CrossRef]
  19. Gulwadi, G.B.; Mishchenko, E.D.; Hallowell, G.; Alves, S.; Kennedy, M. The restorative potential of a university campus: Objective greenness and student perceptions in Turkey and the United States. Landsc. Urban Plan. 2019, 187, 36–46. [Google Scholar] [CrossRef]
  20. Natalia Rodriguez Castañeda Pineda-Pinto, M.; Gulsrud, N.M.; Cooper, C.; Mairéad O’Donnell Collier, M. Exploring the restorative capacity of urban green spaces and their biodiversity through an adapted One Health approach: A scoping review. Urban For. Urban Green. 2024, 100, 128489. [Google Scholar] [CrossRef]
  21. Gray, T.; Tracey, D.; Pigott, F. Restorative and regenerative green spaces for vulnerable communities in social housing: The impact of a Community Greening program. J. Environ. Psychol. 2024, 99, 102448. [Google Scholar] [CrossRef]
  22. Fisher, J.C.; Irvine, K.N.; Bicknell, J.E.; Hayes, W.M.; Fernandes, D.; Mistry, J.; Davies, Z.G. Perceived biodiversity, sound, naturalness and safety enhance the restorative quality and wellbeing benefits of green and blue space in a neotropical city. Sci. Total Environ. 2020, 755, 143095. [Google Scholar] [CrossRef] [PubMed]
  23. Grahn, P.; Stigsdotter, U.K. The relation between perceived sensory dimensions of urban green space and stress restoration. Landsc. Urban Plan. 2010, 94, 264–275. [Google Scholar] [CrossRef]
  24. Stigsdotter, U.K.; Corazon, S.S.; Sidenius, U.; Refshauge, A.D.; Grahn, P. Forest design for mental health promotion—Using perceived sensory dimensions to elicit restorative responses. Landsc. Urban Plan. 2017, 160, 1–15. [Google Scholar] [CrossRef]
  25. Wang, S.; Li, A. Identify the significant landscape characteristics for the perceived restorativeness of 8 perceived sensory dimensions in urban green space. Heliyon 2024, 10, e27925. [Google Scholar] [CrossRef]
  26. Miller, P.; Liu, B.; Tang, Z. Visual preference research: An approach to understanding landscape perception. Chin. Landsc. Archit. 2013, 29, 22–26, (In Chinese with English Summary). [Google Scholar]
  27. Hartig, T.; Staats, H. The need for psychological restoration as a determinant of environmental preferences. J. Environ. Psychol. 2006, 26, 215–226. [Google Scholar] [CrossRef]
  28. Wang, R.; Zhao, J.; Meitner, M.J.; Hu, Y.; Xu, X. Characteristics of urban green spaces in relation to aesthetic preference and stress recovery. Urban For. Urban Green. 2019, 41, 6–13. [Google Scholar] [CrossRef]
  29. Hull, R.B.; Stewart, W.P. Validity of photo-based scenic beauty judgments. J. Environ. Psychol. 1992, 12, 101–114. [Google Scholar] [CrossRef]
  30. Wu, Y.; Wang, L.; Yu, J.; Chen, P.; Wang, A. Improving the Restorative Potential of Living Environments by Optimizing the Spatial Luminance Distribution. Buildings 2023, 13, 1708. [Google Scholar] [CrossRef]
  31. Ihara, S. Information Theory for Continuous Systems; World Scientific: Singapore; River Edge, NJ, USA, 1993. [Google Scholar]
  32. Seo, H.J.; Milanfar, P. Static and space-time visual saliency detection by self-resemblance. J. Vis. 2009, 9, 15. [Google Scholar] [CrossRef] [PubMed]
  33. Biliciler, G.; Raghunathan, R.; Ward, A.F. Consumers as Naive Physicists: How Visual Entropy Cues Shift Temporal Focus and Influence Product Evaluations. J. Consum. Res. 2021, 48, 1010–1031. [Google Scholar] [CrossRef]
  34. Zhou, X.; Cen, Q.; Qiu, H. Effects of urban waterfront park landscape elements on visual behavior and public preference: Evidence from eye-tracking experiments. Urban For. Urban Green. 2023, 82, 127889. [Google Scholar] [CrossRef]
  35. Yin, J.; Ramanpong, J.; Chang, J.; Wu, C.-D.; Chao, P.-H.; Yu, C.-P. Effects of blue space exposure in urban and natural environments on psychological and physiological responses: A within-subject experiment. Urban For. Urban Green. 2023, 87, 128066. [Google Scholar] [CrossRef]
  36. Liu, Y.; Hu, M.; Zhao, B. Audio-visual interactive evaluation of the forest landscape based on eye-tracking experiments. Urban For. Urban Green. 2019, 46, 126476. [Google Scholar] [CrossRef]
  37. Zhang, L.; Dempsey, N.; Cameron, R. ‘Blossom Buddies’—How do flower colour combinations affect emotional response and influence therapeutic landscape design? Landsc. Urban Plan. 2024, 248, 105099. [Google Scholar] [CrossRef]
  38. Kaplan, S. Aesthetics, Affect, and Cognition: Environmental Preference from an Evolutionary Perspective. Environ. Behav. 1987, 19, 3–32. [Google Scholar] [CrossRef]
  39. Chang, H.-T.; Wu, C.-D.; Wang, J.-D.; Chen, P.-S.; Wang, Y.-J.; Su, H.-J. Green space structures and schizophrenia incidence in Taiwan: Is there an association? Environ. Res. Lett. 2020, 15, 094058. [Google Scholar] [CrossRef]
  40. Chang, H.-T.; Wu, C.-D.; Wang, J.-D.; Chen, P.-S.; Su, H.-J. Residential green space structures are associated with a lower risk of bipolar disorder: A nationwide population-based study in Taiwan. Environ. Pollut. 2021, 283, 115864. [Google Scholar] [CrossRef]
  41. Tsai, W.-L.; Leung, Y.-F.; McHale, M.R.; Floyd, M.F.; Reich, B.J. Relationships between urban green land cover and human health at different spatial resolutions. Urban Ecosyst. 2018, 22, 315–324. [Google Scholar] [CrossRef]
  42. Tyrväinen, L.; Ojala, A.; Korpela, K.; Lanki, T.; Tsunetsugu, Y.; Kagawa, T. The influence of urban green environments on stress relief measures: A field experiment. J. Environ. Psychol. 2014, 38, 1–9. [Google Scholar] [CrossRef]
  43. Shen, Y.-S.; Lung, S.-C.C. Mediation pathways and effects of green structures on respiratory mortality via reducing air pollution. Sci. Rep. 2017, 7, 42854. [Google Scholar] [CrossRef]
  44. Wang, H.; Tassinary, L.G. Effects of greenspace morphology on mortality at the neighbourhood level: A cross-sectional ecological study. Lancet Planet. Health 2019, 3, e460–e468. [Google Scholar] [CrossRef]
  45. Jackson, L.E.; Daniel, J.; McCorkle, B.; Sears, A.; Bush, K.F. Linking ecosystem services and human health: The Eco-Health Relationship Browser. Int. J. Public Health 2013, 58, 747–755. [Google Scholar] [CrossRef]
  46. van den Bosch, M.; Ode Sang, Å. Urban Natural Environments as nature-based Solutions for Improved Public Health—A Systematic Review of Reviews. Environ. Res. 2017, 158, 373–384. [Google Scholar] [CrossRef]
  47. Ha, J.; Kim, H.J.; With, K.A. Urban green space alone is not enough: A landscape analysis linking the spatial distribution of urban green space to mental health in the city of Chicago. Landsc. Urban Plan. 2022, 218, 104309. [Google Scholar] [CrossRef]
  48. Tan, C.L.Y.; Chang, C.-C.; Nghiem, L.T.P.; Zhang, Y.; Oh, R.R.Y.; Shanahan, D.F.; Lin, B.B.; Gaston, K.J.; Fuller, R.A.; Carrasco, L.R. The right mix: Residential urban green-blue space combinations are correlated with physical exercise in a tropical city-state. Urban For. Urban Green. 2021, 57, 126947. [Google Scholar] [CrossRef]
  49. Frühauf, A.; Schnitzer, M.; Schobersberger, W.; Weiss, G.; Kopp, M. Jogging, nordic walking and going for a walk—Inter-disciplinary recommendations to keep people physically active in times of the COVID-19 lockdown in Tyrol, Austria. Curr. Issues Sport Sci. (CISS) 2020, 5, 100. [Google Scholar] [CrossRef]
  50. Xiang, Y.; Hedblom, M.; Wang, S.; Qiu, L.; Gao, T. Indicator selection combining audio and visual perception of urban green spaces. Ecol. Indic. 2022, 137, 108772. [Google Scholar] [CrossRef]
  51. Ta, N.; Li, H.; Zhu, Q.; Wu, J. Contributions of the quantity and quality of neighborhood green space to residential satisfaction in suburban Shanghai. Urban For. Urban Green. 2021, 64, 127293. [Google Scholar] [CrossRef]
  52. Korpilo, S.; Virtanen, T.; Lehvävirta, S. Smartphone GPS tracking—Inexpensive and efficient data collection on recreational movement. Landsc. Urban Plan. 2017, 157, 608–617. [Google Scholar] [CrossRef]
  53. Karasov, O.; Vieira, A.A.B.; Külvik, M.; Chervanyov, I. Landscape coherence revisited: GIS-based mapping in relation to scenic values and preferences estimated with geolocated social media data. Ecol. Indic. 2020, 111, 105973. [Google Scholar] [CrossRef]
  54. Alattar, M.A.; Cottrill, C.; Beecroft, M. Public participation geographic information system (PPGIS) as a method for active travel data acquisition. J. Transp. Geogr. 2021, 96, 103180. [Google Scholar] [CrossRef]
  55. China China Daily. ‘Park City’ Concept Leads Chengdu to Sustainable Development—Regional. 2021. Available online: http://www.chinadaily.com.cn/regional/2021-06/30/content_37545399.htm (accessed on 2 January 2025).
  56. Irvine, K.N.; Fuller, R.A.; Devine-Wright, P.; Tratalos, J.; Payne, S.R.; Warren, P.H.; Lomas, K.J.; Gaston, K.J. Ecological and psychological values of urban green space. In Dimensions of the Sustainable City; Springer: Dordrecht, The Netherlands, 2009. [Google Scholar]
  57. Tilt, J.H.; Unfried, T.M.; Roca, B. Using Objective and Subjective Measures of Neighborhood Greenness and Accessible Destinations for Understanding Walking Trips and BMI in Seattle, Washington. Am. J. Health Promot. 2007, 21 (Suppl. S4), 371–379. [Google Scholar] [CrossRef]
  58. Lu, Y. Using Google Street View to investigate the association between street greenery and physical activity. Landsc. Urban Plan. 2018, 191, 103435. [Google Scholar] [CrossRef]
  59. Lu, Y.; Yang, Y.; Sun, G.; Gou, Z. Associations between overhead-view and eye-level urban greenness and cycling behaviors. Cities 2019, 88, 10–18. [Google Scholar] [CrossRef]
  60. Yang, Y.; He, D.; Gou, Z.; Wang, R.; Liu, Y.; Lu, Y. Association between street greenery and walking behavior in older adults in Hong Kong. Sustain. Cities Soc. 2019, 51, 101747. [Google Scholar] [CrossRef]
  61. Anguelov, D.; Dulong, C.; Filip, D.; Frueh, C.; Lafon, S.; Lyon, R.; Ogale, A.; Vincent, L.; Weaver, J. Google Street View: Capturing the World at Street Level. Computer 2010, 43, 32–38. [Google Scholar] [CrossRef]
  62. Juliani, A.W.; Bies, A.J.; Boydston, C.R.; Taylor, R.P.; Sereno, M.E. Navigation performance in virtual environments varies with fractal dimension of landscape. J. Environ. Psychol. 2016, 47, 155–165. [Google Scholar] [CrossRef]
  63. Qin, X.; Yang, D.; Wangari, V.W. Quantitative characterization and evaluation of highway greening landscape spatial quality based on deep learning. Environ. Impact Assess. Rev. 2024, 107, 107559. [Google Scholar] [CrossRef]
  64. Molnarova, K.; Sklenicka, P.; Stiborek, J.; Svobodova, K.; Salek, M.; Brabec, E. Visual preferences for wind turbines: Location, numbers and respondent characteristics. Appl. Energy 2012, 92, 269–278. [Google Scholar] [CrossRef]
  65. Svobodova, K.; Sklenicka, P.; Molnarova, K.; Salek, M. Visual preferences for physical attributes of mining and post-mining landscapes with respect to the sociodemographic characteristics of respondents. Ecol. Eng. 2012, 43, 34–44. [Google Scholar] [CrossRef]
  66. Strumse, E. Demographic differences in the visual preferences for agrarian landscapes in western norway. J. Environ. Psychol. 1996, 16, 17–31. [Google Scholar] [CrossRef]
  67. Lindemann-Matthies, P.; Briegel, R.; Schüpbach, B.; Junge, X. Aesthetic preference for a Swiss alpine landscape: The impact of different agricultural land-use with different biodiversity. Landsc. Urban Plan. 2010, 98, 99–109. [Google Scholar] [CrossRef]
  68. Yamashita, S. Perception and evaluation of water in landscape: Use of Photo-Projective Method to compare child and adult residents’ perceptions of a Japanese river environment. Landsc. Urban Plan. 2002, 62, 3–17. [Google Scholar] [CrossRef]
  69. Vouligny, É.; Domon, G.; Ruiz, J. An assessment of ordinary landscapes by an expert and by its residents: Landscape values in areas of intensive agricultural use. Land Use Policy 2009, 26, 890–900. [Google Scholar] [CrossRef]
  70. Xiao, S.; Wei, T.; Ding, J.; Zhou, J.; Lu, X. Biological effects of negative air ions on human health and integrated multiomics to identify biomarkers: A literature review. Environ. Sci. Pollut. Res. 2023, 30, 69824–69836. [Google Scholar] [CrossRef] [PubMed]
  71. Yang, T.; Barnett, R.; Fan, Y.; Li, L. The effect of urban green space on uncertainty stress and life stress: A nationwide study of university students in China. Health Place 2019, 59, 102199. [Google Scholar] [CrossRef]
  72. Dzhambov, A.M. Residential green and blue space associated with better mental health: A pilot follow-up study in university students. Arch. Ind. Hyg. Toxicol. 2018, 69, 340–349. [Google Scholar] [CrossRef] [PubMed]
  73. Ode Sang, Å.; Knez, I.; Gunnarsson, B.; Hedblom, M. The effects of naturalness, gender, and age on how urban green space is perceived and used. Urban For. Urban Green. 2016, 18, 268–276. [Google Scholar] [CrossRef]
  74. Korpela, K.; Hartig, T. Restorative qualities of favorite places. J. Environ. Psychol. 1996, 16, 221–233. [Google Scholar] [CrossRef]
  75. Laumann, K.; Gärling, T.; Stormark, K.M. Selective attention and heart rate responses to natural and urban environments. J. Environ. Psychol. 2003, 23, 125–134. [Google Scholar] [CrossRef]
  76. Zhang, Z.; Zhao, Z. Women’s education and fertility in China. China Econ. Rev. 2023, 78, 101936. [Google Scholar] [CrossRef]
  77. Hou, J.; Wang, Y.; Zhang, X.; Qiu, L.; Gao, T. The effect of visibility on green space recovery, perception and preference. Trees For. People 2024, 16, 100538. [Google Scholar] [CrossRef]
  78. Masullo, M.; Maffei, L.; Pascale, A.; Senese, V.P.; De Stefano, S.; Chau, C.K. Effects of Evocative Audio-Visual Installations on the Restorativeness in Urban Parks. Sustainability 2021, 13, 8328. [Google Scholar] [CrossRef]
  79. Ha, J.; Kim, H.J. The restorative effects of campus landscape biodiversity: Assessing visual and auditory perceptions among university students. Urban For. Urban Green. 2021, 64, 127259. [Google Scholar] [CrossRef]
  80. Dzhambov, A.M.; Browning, M.H.E.M.; Markevych, I.; Hartig, T.; Lercher, P. Analytical approaches to testing pathways linking greenspace to health: A scoping review of the empirical literature. Environ. Res. 2020, 186, 109613. [Google Scholar] [CrossRef] [PubMed]
  81. Hao, J.; Gao, T.; Qiu, L. How do species richness and colour diversity of plants affect public perception, preference and sense of restoration in urban green spaces? Urban For. Urban Green. 2024, 100, 128487. [Google Scholar] [CrossRef]
  82. Huang, C.; Wei, F.; Qiu, S.; Cao, X.; Lu, C.; Xu, J.; Gao, J.; Lin, Q. Interpreting regenerated post-industrial lands as green spaces: Comparing public perceptions of post-industrial landscapes using human factor design framework. Ecol. Indic. 2023, 157, 111282. [Google Scholar] [CrossRef]
  83. Zhao, K.; Tan, R. Understanding the structure of public perceptions towards urban green spaces: A mixed-method investigation. Urban For. Urban Green. 2024, 101, 128496. [Google Scholar] [CrossRef]
  84. Xu, T.; Aini, A.M.; Nordin, N.A. Utilizing Regression Model to Characterize the Impact of Urban Green Space Features on the Subjective Well-being of Older Adults. Heliyon 2024, 10, e35567. [Google Scholar] [CrossRef] [PubMed]
  85. Zhang, Q.; Rui, J.; Wu, Y. Encouraging cycling through the improvement of streetscape perception: A bottom-up investigation into the relationship between street greening and bicycling volume. Appl. Geogr. 2024, 171, 103388. [Google Scholar] [CrossRef]
  86. Sakamoto, K.; Inoue, S.; Ishii, H.; Watanabe, S.; Nakamura, K.; Bolthouse, G.; Kawazoe, Y.; Yokohari, M. The treachery of green images? Using modular green system to analyse the gap between image perceptions and greenspace user behaviour. Urban For. Urban Green. 2024, 100, 128465. [Google Scholar] [CrossRef]
  87. Qu, S.; Ma, R. Exploring Multi-Sensory Approaches for Psychological Well-Being in Urban Green Spaces: Evidence from Edinburgh’s Diverse Urban Environments. Land 2024, 13, 1536. [Google Scholar] [CrossRef]
  88. Ghasaban, M.; Mirjalili, P.; Yeganeh, M. Integration of building envelope with open spaces and greenery to enhance thermal and visual comfort and energy efficiency in office buildings. Results Eng. 2025, 25, 103660. [Google Scholar] [CrossRef]
  89. Teeuwen, R.; Milias, V.; Bozzon, A.; Psyllidis, A. How well do NDVI and OpenStreetMap data capture people’s visual perceptions of urban greenspace? Landsc. Urban Plan. 2024, 245, 105009. [Google Scholar] [CrossRef]
  90. Ostoić, S.K.; Vuletić, D.; Kičić, M. Exploring the Negative Perceptions of Tree-based Urban Green Space. People’s Behaviour and Management are Crucial. Urban For. Urban Green. 2024, 370, 128539. [Google Scholar] [CrossRef]
  91. Namwinbown, T.; Imoro, Z.A.; Weobong, C.A.-A.; Tom-Dery, D.; Baatuuwie, B.N.; Aikins, T.K.; Poreku, G.; Lawer, E.A. Patterns of green space change and fragmentation in a rapidly expanding city of northern Ghana, West Africa. City Environ. Interact. 2024, 21, 100136. [Google Scholar] [CrossRef]
  92. Tian, Y.; Jim, C.Y.; Tao, Y.; Shi, T. Landscape ecological assessment of green space fragmentation in Hong Kong. Urban For. Urban Green. 2011, 10, 79–86. [Google Scholar] [CrossRef]
  93. Pimiento-Quiroga, N.A.; Prist, P.R.; Ibarra-Espinosa, S.; Barrozo, L.V.; Metzger, J.P. Air regulation service is affected by green areas cover and fragmentation: An analysis using demand, supply and flow during COVID-19 quarantine. Landsc. Urban Plan. 2024, 254, 105230. [Google Scholar] [CrossRef]
  94. Nazombe, K.; Nambazo, O. Monitoring and assessment of urban green space loss and fragmentation using remote sensing data in the four cities of Malawi from 1986 to 2021. Sci. Afr. 2023, 20, e01639. [Google Scholar] [CrossRef]
  95. Gozalo, G.R.; Morillas, J.M.B.; González, D.M. Perceptions and use of urban green spaces on the basis of size. Urban For. Urban Green. 2019, 46, 126470. [Google Scholar] [CrossRef]
  96. Chen, K.; Zhang, T.; Liu, F.; Zhang, Y.; Song, Y. How Does Urban Green Space Impact Residents’ Mental Health: A Literature Review of Mediators. Int. J. Environ. Res. Public Health 2021, 18, 11746. [Google Scholar] [CrossRef]
  97. Hu, T.; Wu, J. Shaping the general resilience of green infrastructure through integrating structures, functions, and connections. J. Environ. Manag. 2024, 369, 122294. [Google Scholar] [CrossRef] [PubMed]
  98. van Heezik, Y.; Freeman, C.; Falloon, A.; Buttery, Y.; Heyzer, A. Relationships between childhood experience of nature and green/blue space use, landscape preferences, connection with nature and pro-environmental behavior. Landsc. Urban Plan. 2021, 213, 104135. [Google Scholar] [CrossRef]
  99. Wilson, B.; Neale, C.; Roe, J. Urban green space access, social cohesion, and mental health outcomes before and during COVID-19. Cities 2024, 152, 105173. [Google Scholar] [CrossRef]
  100. Wan, C.; Shen, G.Q.; Choi, S. Underlying relationships between public urban green spaces and social cohesion: A systematic literature review. City Cult. Soc. 2021, 24, 100383. [Google Scholar] [CrossRef]
  101. Liu, Q.; Zhu, Z.; Zeng, X.; Zhuo, Z.; Ye, B.; Fang, L.; Huang, Q.; Lai, P. The impact of landscape complexity on preference ratings and eye fixation of various urban green space settings. Urban For. Urban Green. 2021, 66, 127411. [Google Scholar] [CrossRef]
  102. Yu, M.; Chen, J.; Qian, J.; Yuan, Q.; Fan, H.; Shan, G. Effects of color temperature and time gradients on visual fatigue recovery in closed cabin. Adv. Des. Res. 2024, 2, 45–54. [Google Scholar] [CrossRef]
  103. Hao, J.; Li, Y.; Hu, T.; Ma, Y.; Wang, X.; Liu, J.; Gao, T.; Qiu, L. Vegetation diversity in structure, species or colour: Coupling effects of the different characteristics of urban green spaces on preference and perceived restoration. Ecol. Indic. 2024, 169, 112897. [Google Scholar] [CrossRef]
  104. Jiao, M.; Zhou, W.; Zheng, Z.; Yan, J.; Wang, J. Optimizing the shade potential of trees by accounting for landscape context. Sustain. Cities Soc. 2021, 70, 102905. [Google Scholar] [CrossRef]
  105. Labib, S.M.; Lindley, S.; Huck, J.J. Spatial dimensions of the influence of urban green-blue spaces on human health: A systematic review. Environ. Res. 2020, 180, 108869. [Google Scholar] [CrossRef]
  106. Markevych, I.; Schoierer, J.; Hartig, T.; Chudnovsky, A.; Hystad, P.; Dzhambov, A.M.; de Vries, S.; Triguero-Mas, M.; Brauer, M.; Nieuwenhuijsen, M.J.; et al. Exploring pathways linking greenspace to health: Theoretical and methodological guidance. Environ. Res. 2017, 158, 301–317. [Google Scholar] [CrossRef]
  107. Ricciardi, E.; Spano, G.; Lopez, A.; Tinella, L.; Clemente, C.; Elia, G.; Dadvand, P.; Sanesi, G.; Bosco, A.; Caffò, A.O. Long-Term Exposure to Greenspace and Cognitive Function during the Lifespan: A Systematic Review. Int. J. Environ. Res. Public Health 2022, 19, 11700. [Google Scholar] [CrossRef]
  108. Yin, Y.; Shao, Y.; Meng, Y.; Hao, Y. The effects of the natural visual-aural attributes of urban green spaces on human behavior and emotional response. Front. Psychol. 2023, 14, 1186806. [Google Scholar] [CrossRef] [PubMed]
  109. Chen, T.; Wang, L.; Huang, B.; Yu, J.; Wu, Y. Pursued Spatial Perception benefit considering Attractiveness and Cognitive Load: Appropriate Visual Complexity of Indoor Commercial Space. J. Build. Eng. 2024, 98, 111144. [Google Scholar] [CrossRef]
  110. Lou, X.; Ito, K.; Li, L.M.W. Rethinking environmental values in psychology from the perspective of anthropocentrism. J. Environ. Psychol. 2025, 101, 102518. [Google Scholar] [CrossRef]
  111. Gong, C.; Yang, R.; Li, S. The role of urban green space in promoting health and well-being is related to nature connectedness and biodiversity: Evidence from a two-factor mixed-design experiment. Landsc. Urban Plan. 2024, 245, 105020. [Google Scholar] [CrossRef]
  112. Coon, J.T.; Boddy, K.; Stein, K.; Whear, R.; Barton, J.; Depledge, M. Does participating in physical activity in outdoor natural environments have a greater effect on physical and psychological wellbeing than physical activity indoors? A systematic review. J. Epidemiol. Community Health 2011, 65, A1–A40. [Google Scholar] [CrossRef]
  113. Iungman, T.; Caballe, S.V.; Segura-Barrero, R.; Cirach, M.; Mueller, N.; Daher, C.; Villalba, G.; Barboza, E.P.; Nieuwenhuijsen, M. Co-benefits of nature-based solutions: A health impact assessment of the Barcelona Green Corridor (Eixos Verds) plan. Environ. Int. 2025, 196, 109313. [Google Scholar] [CrossRef] [PubMed]
Figure 1. Description and calculation of green space morphology. (With additional images created and provided by the authors of the current study for the purpose of enhancing the comprehensiveness of the data presentation).
Land 14 00495 g001
Figure 2. Characteristics of green space morphology, visual perception preferences, and sociodemographic factors.
Land 14 00495 g002
Figure 3. Regression coefficients of each green space morphology metric predicting the visual perception preference.
Land 14 00495 g003
Figure 4. Analysis results of landscape element proportions, visual richness, visual entropy, and sociodemographic factors as mediating factors between green space morphology and visual perception preferences. A single asterisk (*) denotes a significance level of p < 0.05, while two asterisks (**) denote a significance level of p < 0.01. Additionally, three asterisks (***) denote a significance level of p < 0.001, indicating the highest level of statistical significance.
Land 14 00495 g004
Table 1. Filtered site information.
VariablesMeanSDMin.Max.
NDVI0.500.080.340.61
Fractal dimension1.870.071.631.97
Land area (m2)56,715.605719.9744,670.0062,891.00
Table 2. Sociodemographic information.
VariablesNumberPercentMeanSD
Age, 18–40150 27.8936.097
18–254127%
26–306946%
31–404027%
Gender
Women7449%
Men7651%
Social Background
Educational training1812%
Scientific research3322%
Life services2919%
Cultural recreation2416%
Government service1611%
Agroforestry3020%
Disclaimer/Publisher’s Note: The statements, opinions and data contained in all publications are solely those of the individual author(s) and contributor(s) and not of MDPI and/or the editor(s). MDPI and/or the editor(s) disclaim responsibility for any injury to people or property resulting from any ideas, methods, instructions or products referred to in the content.

