
The Influence of Urban Landscape Ecology on Emotional Well-Being: A Case Study of Downtown Beijing

Abstract
1. Introduction
- Emotional Distribution and Its Significance
- The Role of Landscape Ecology
- Gaps in the Existing Research
- Social Media Data for Emotional Distribution Studies
- Downtown Beijing as the Research Object
2. Materials and Methods
2.1. Materials
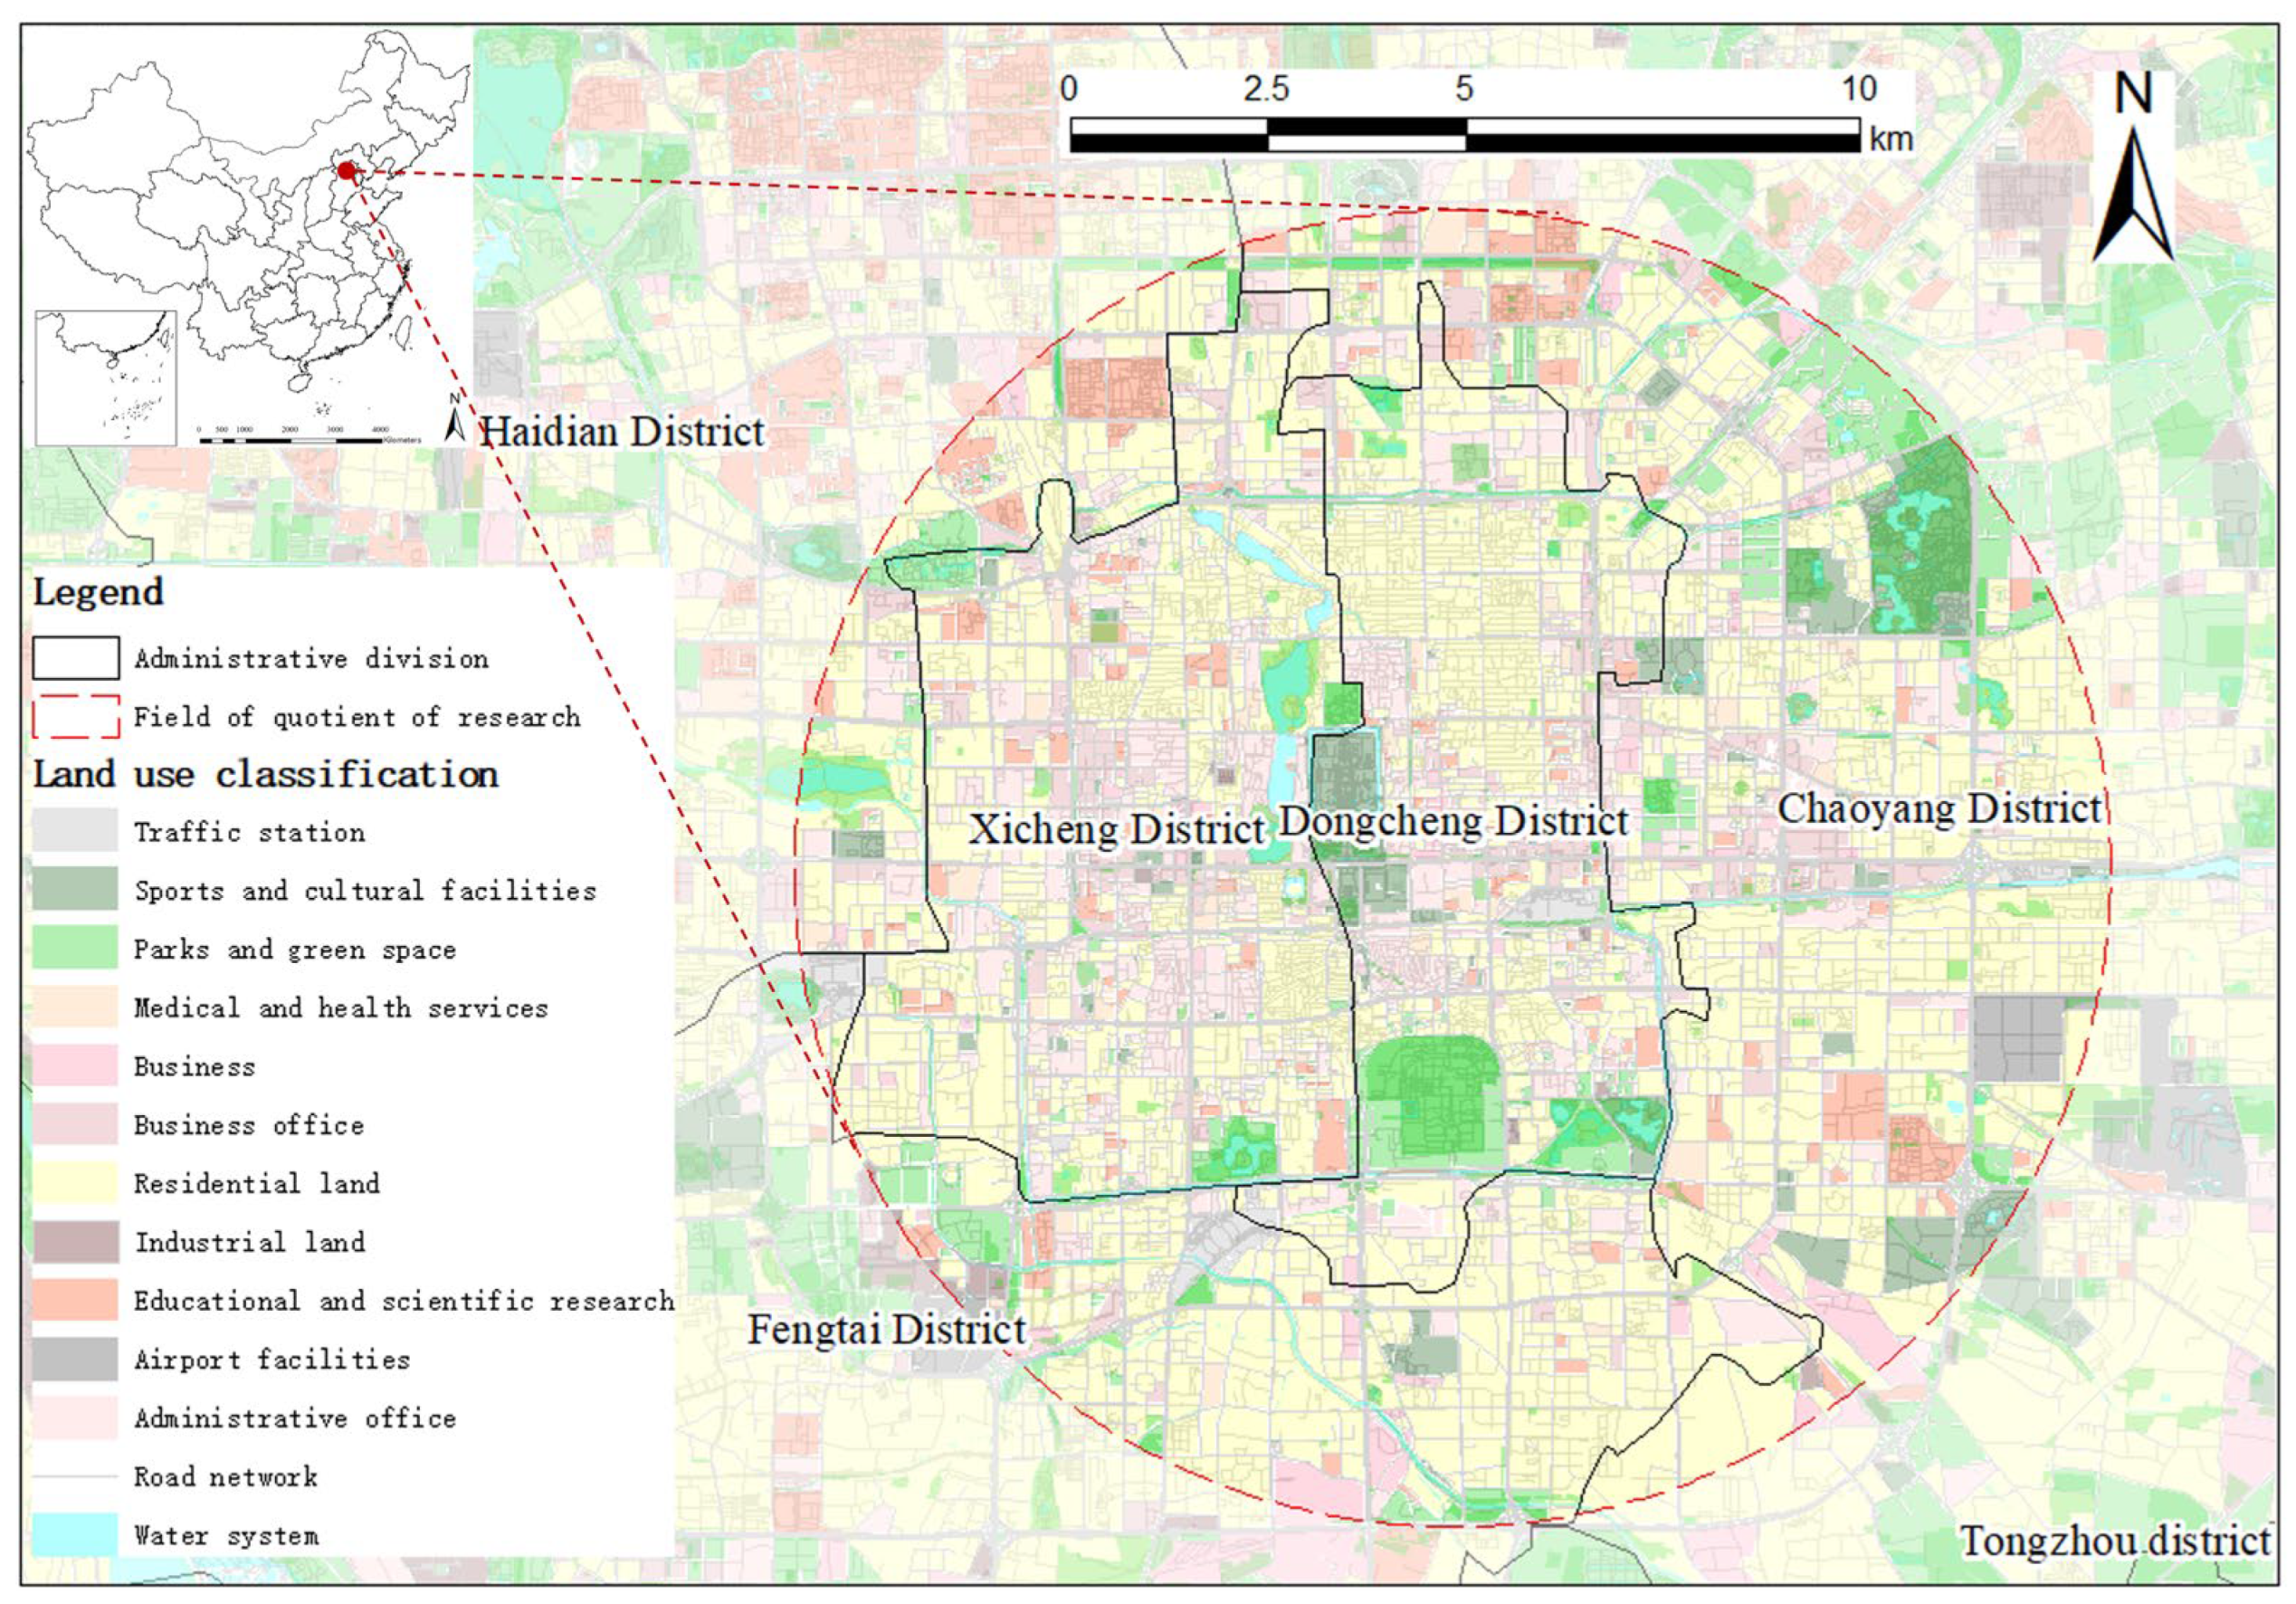
2.1.1. Study Area
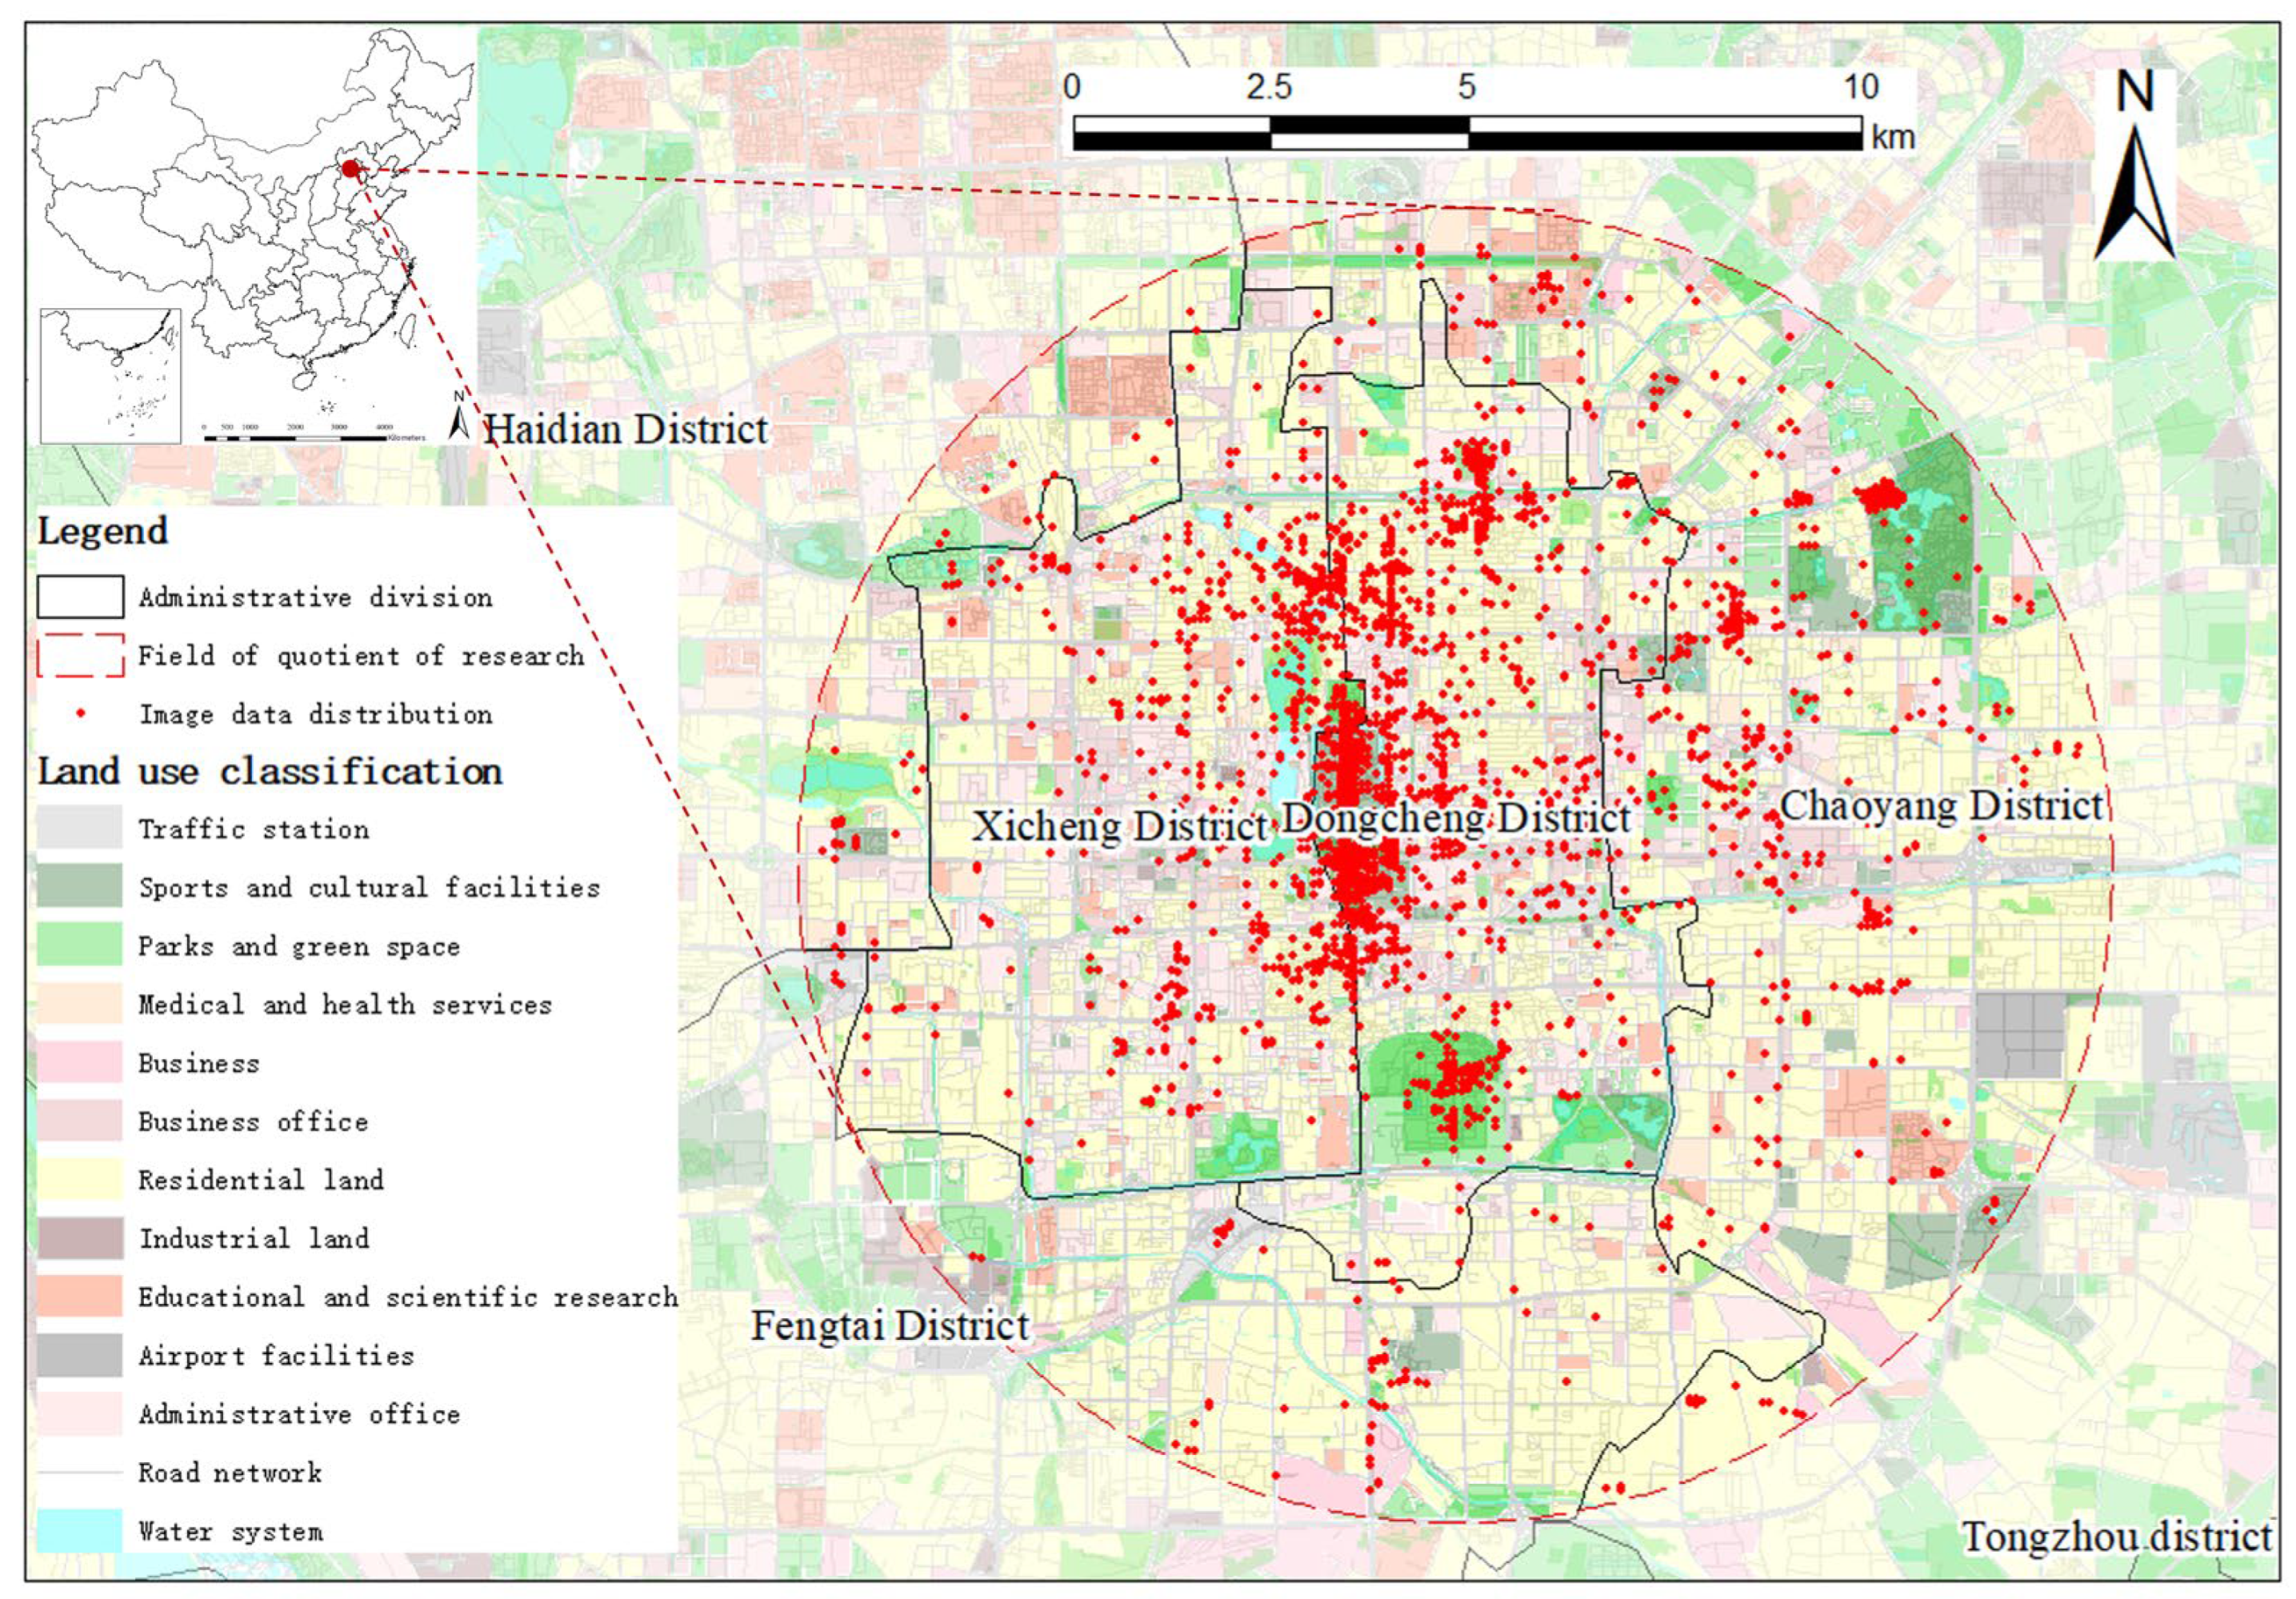
2.1.2. Data Sources and Preprocessing
2.2. Methods
2.2.1. Face++ Platform for Emotion Recognition
2.2.2. Landscape Pattern Indicators
2.2.3. Spatial Differentiation and Influencing Factors Analysis
3. Results
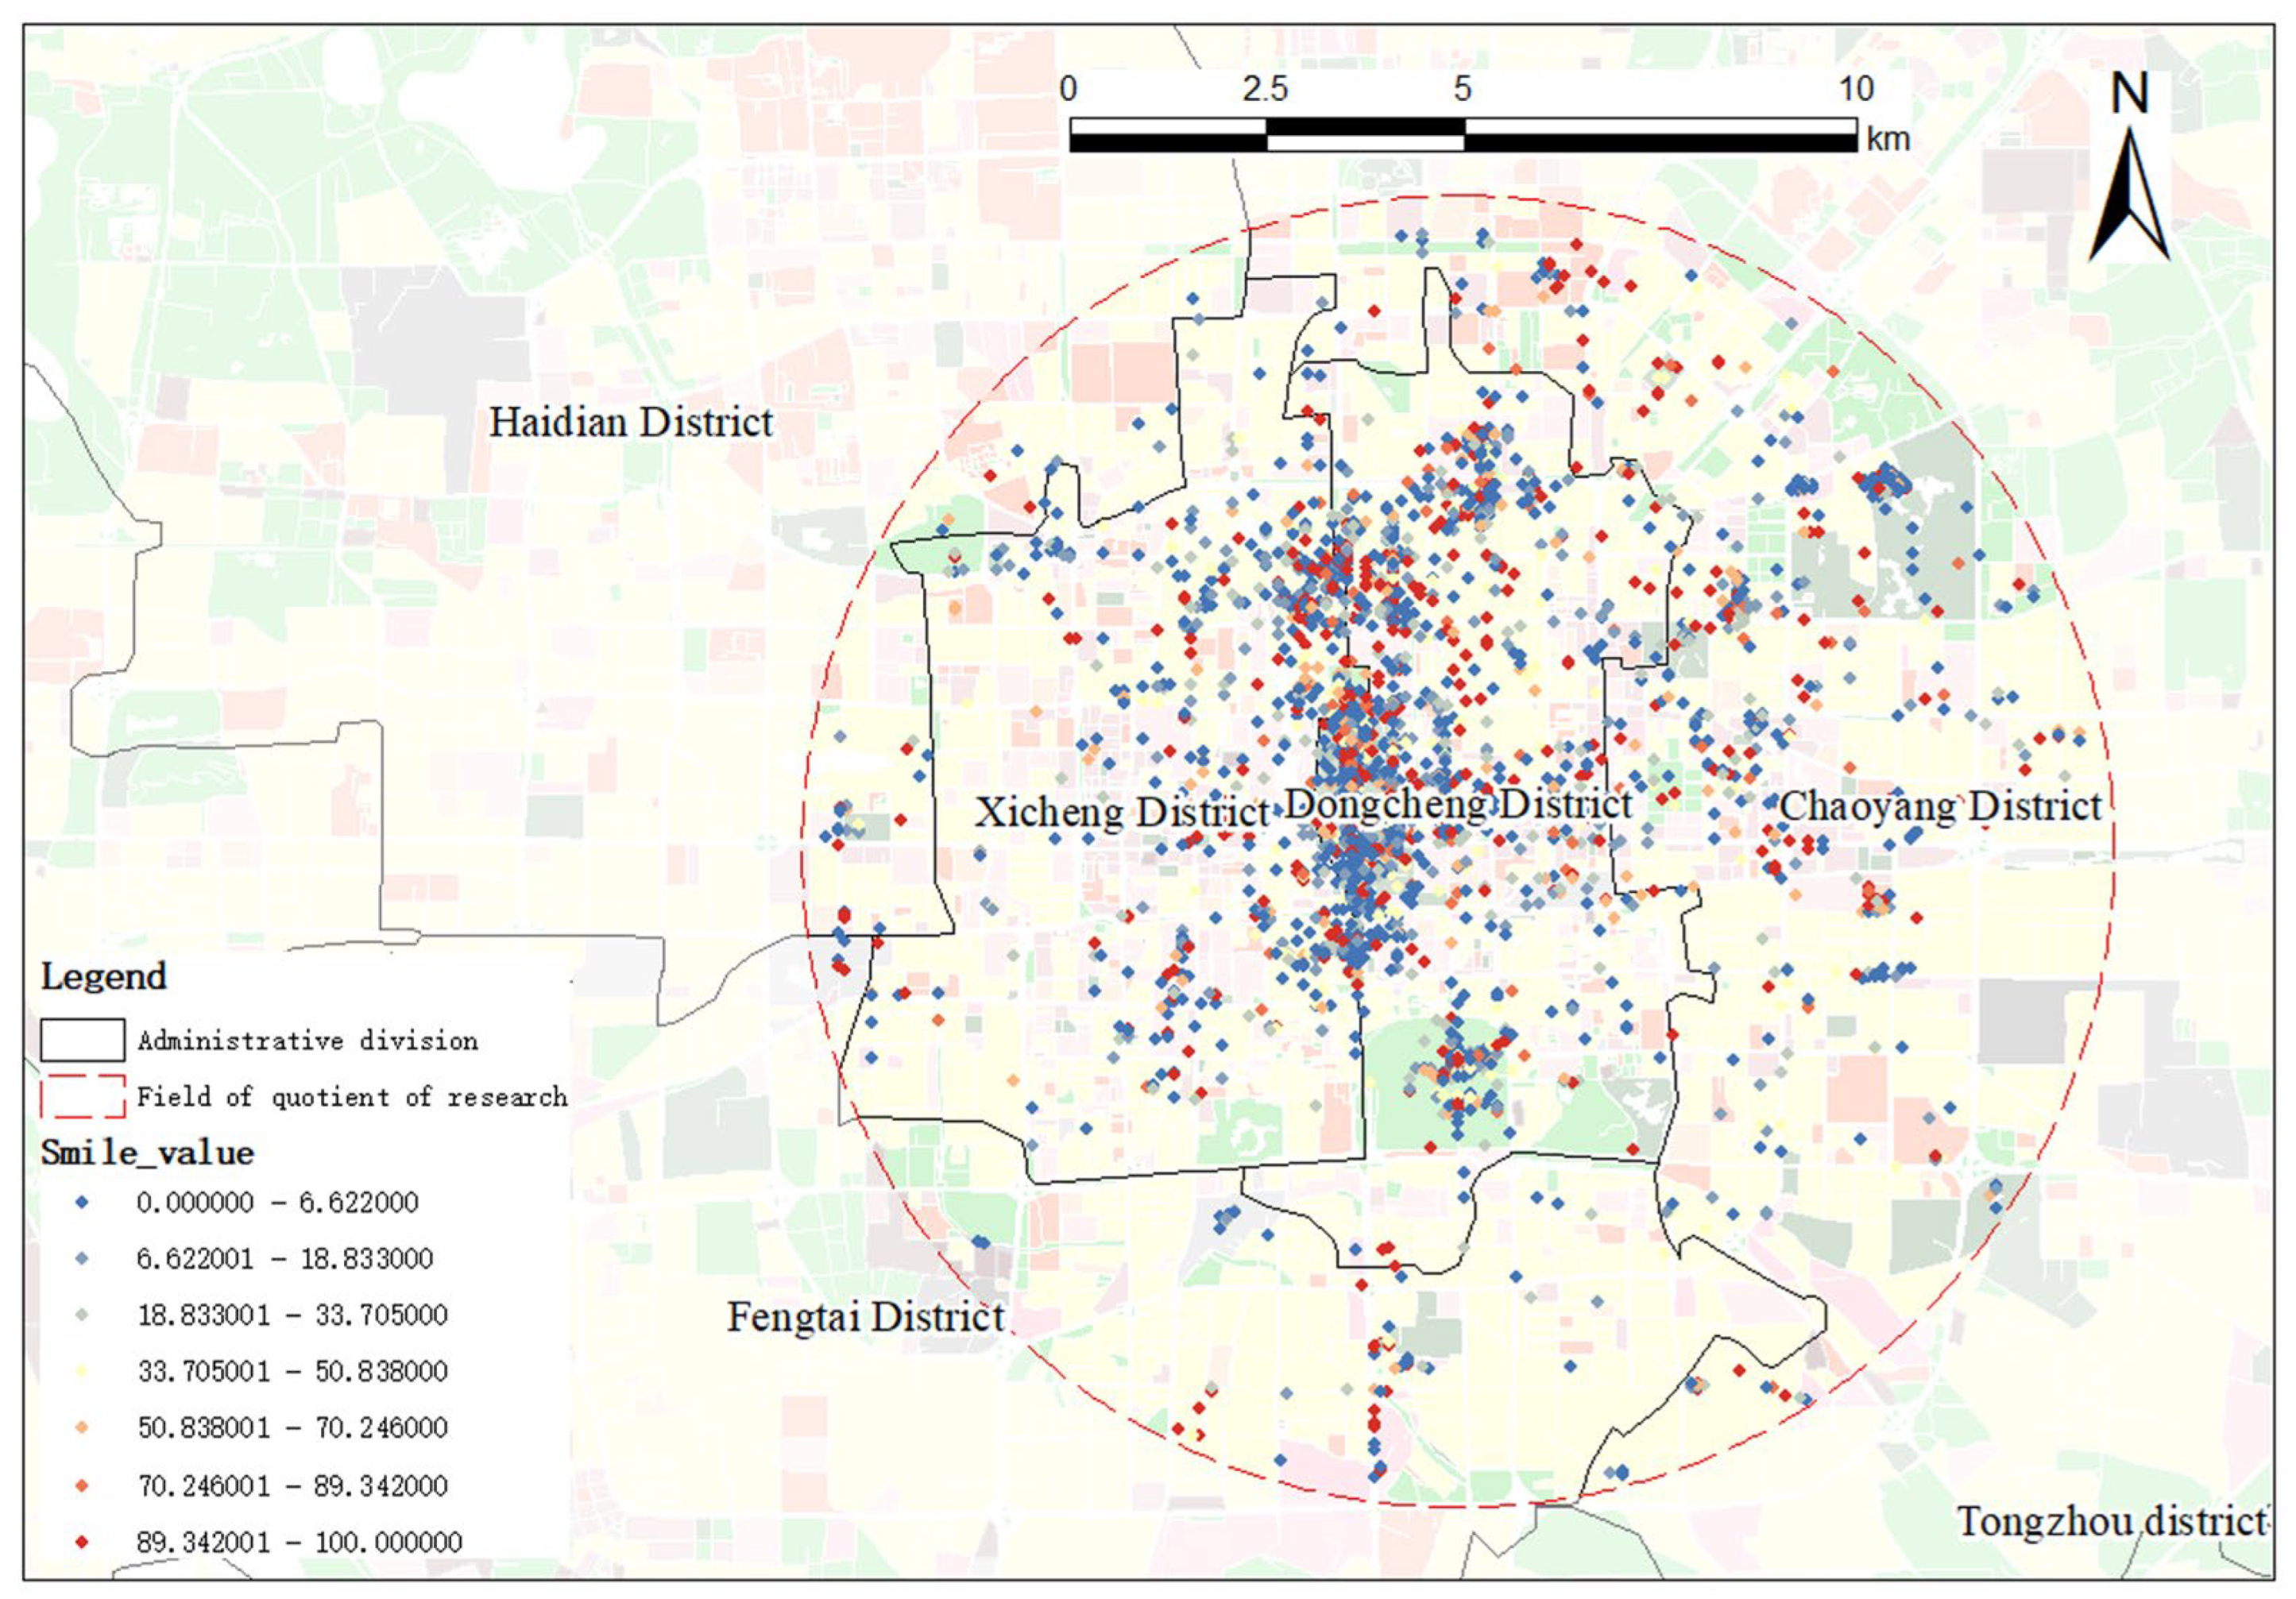
3.1. The Spatial Distribution and Differentiation Characteristics of Emotion
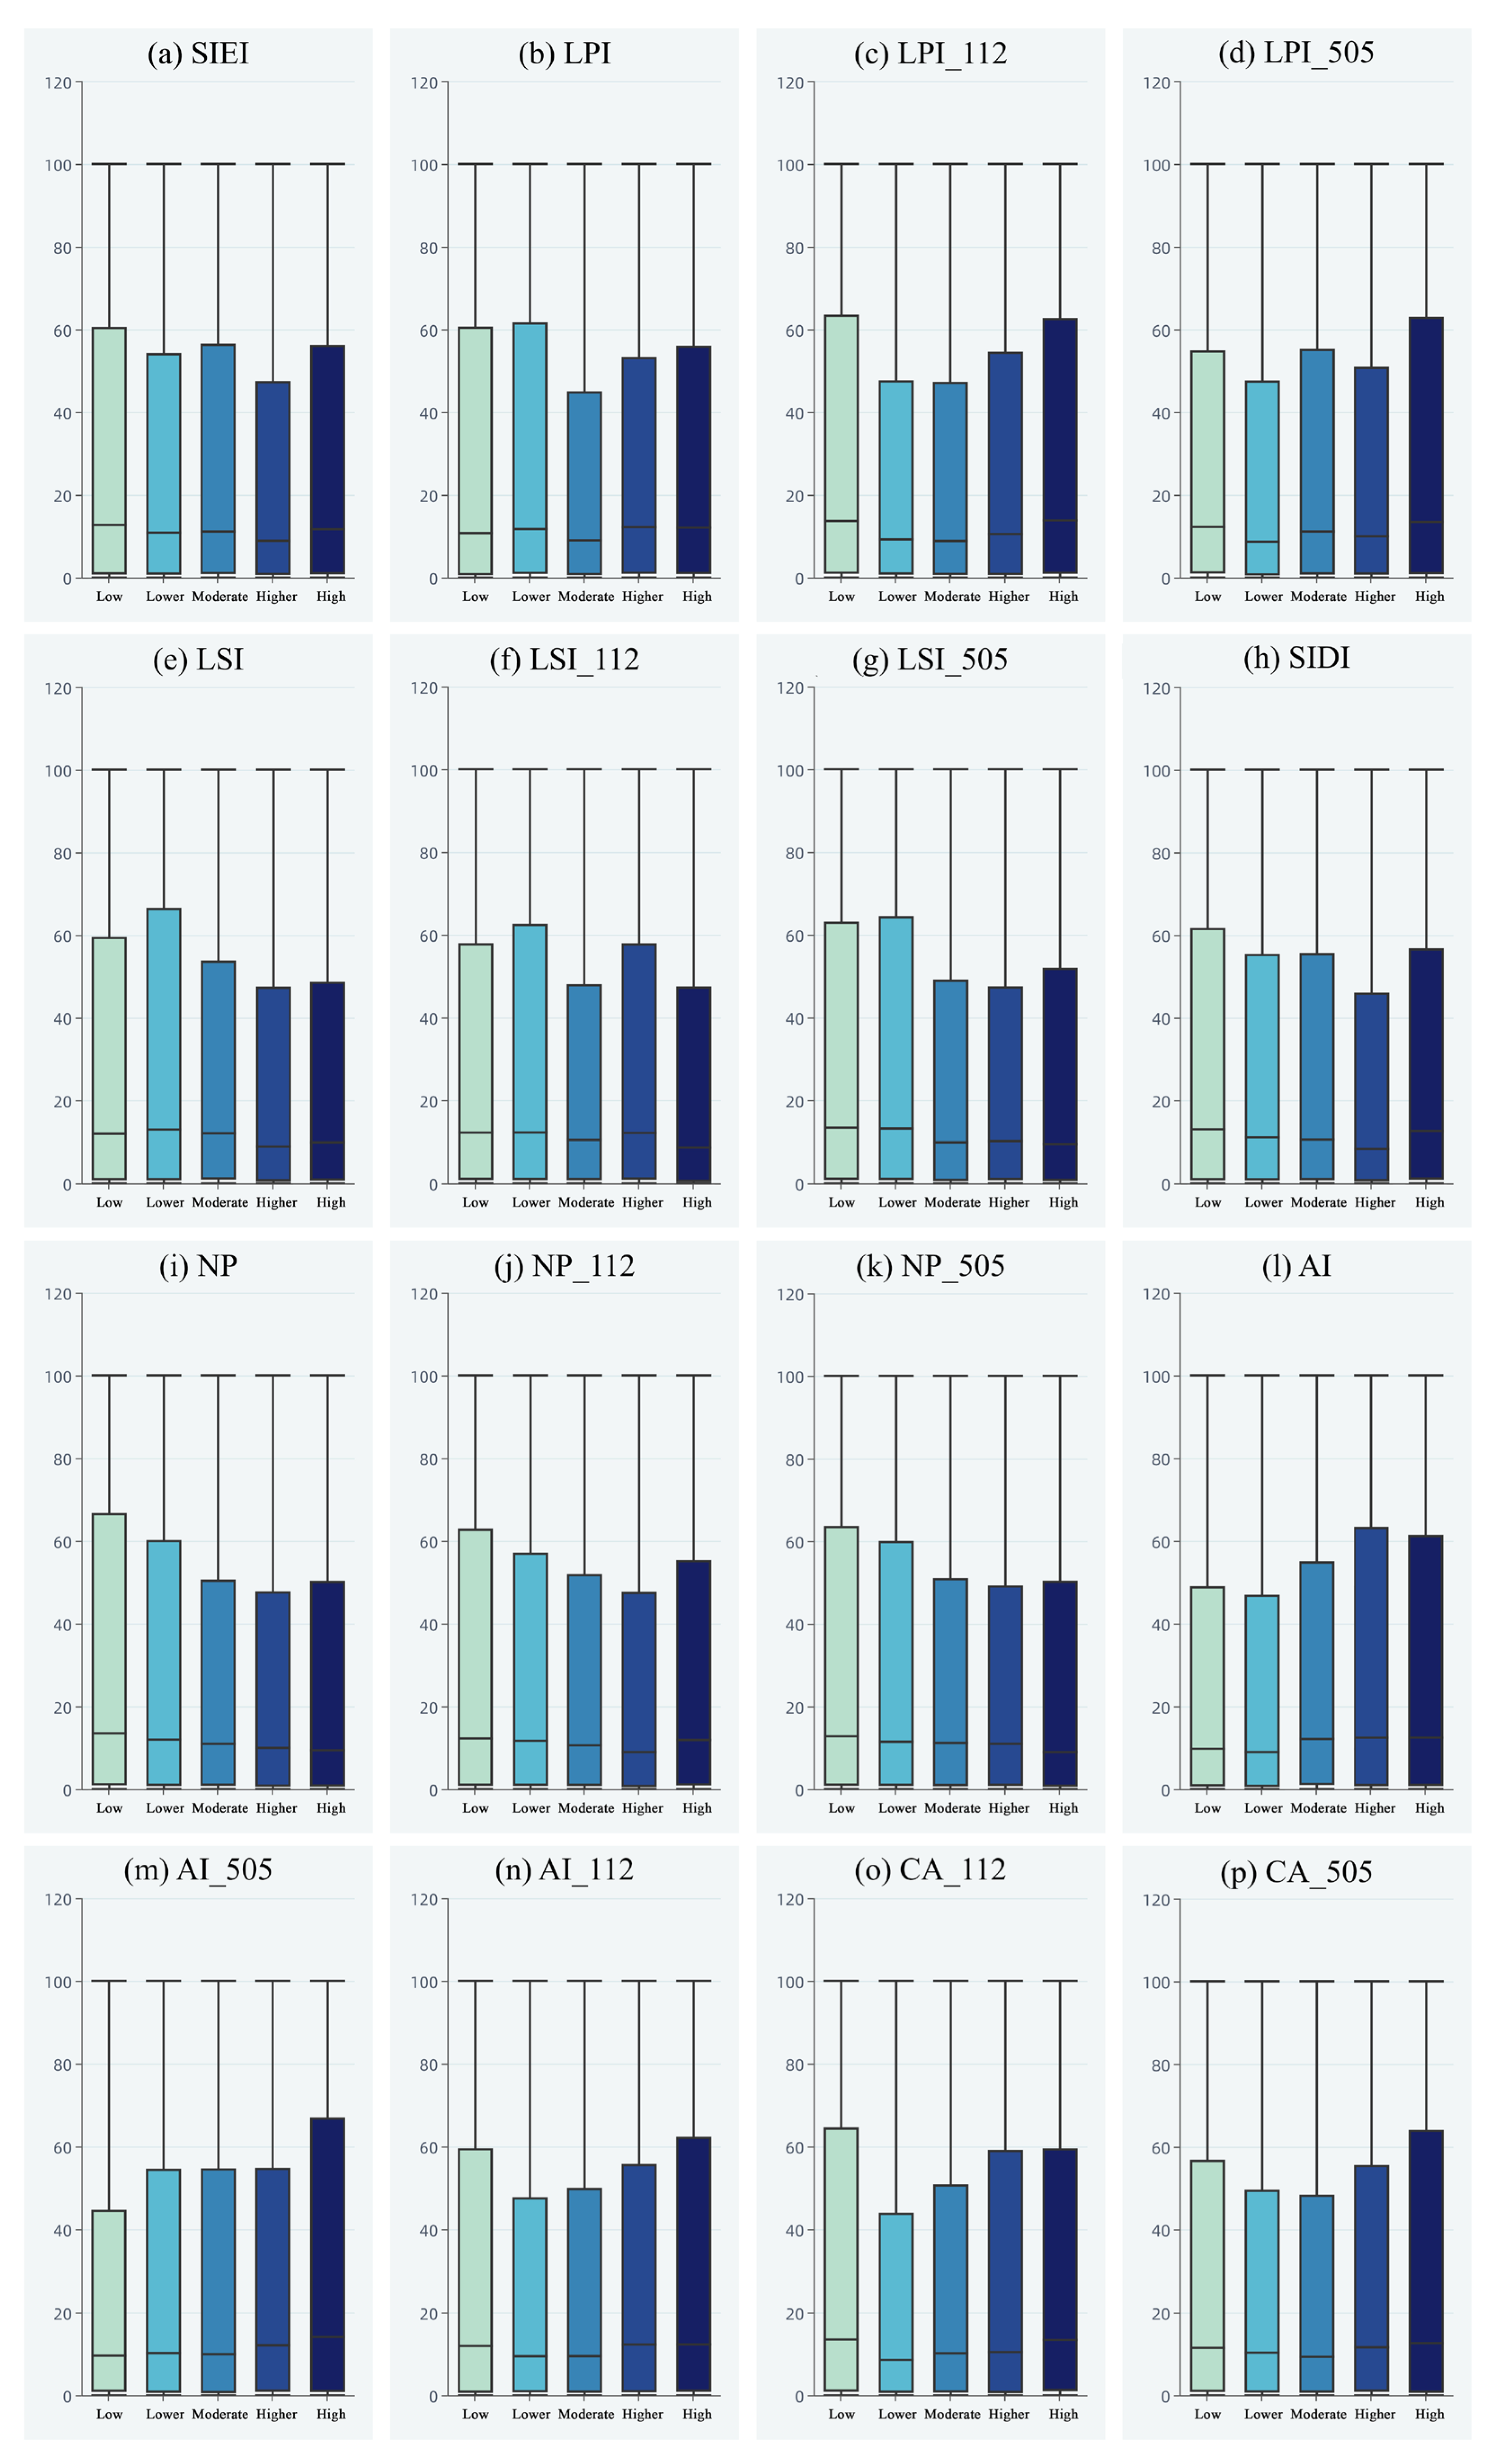
3.2. Emotional Differences Under Different Landscape Patterns
3.3. The Relationship Between Emotion and Landscape Pattern Indicators
4. Discussion
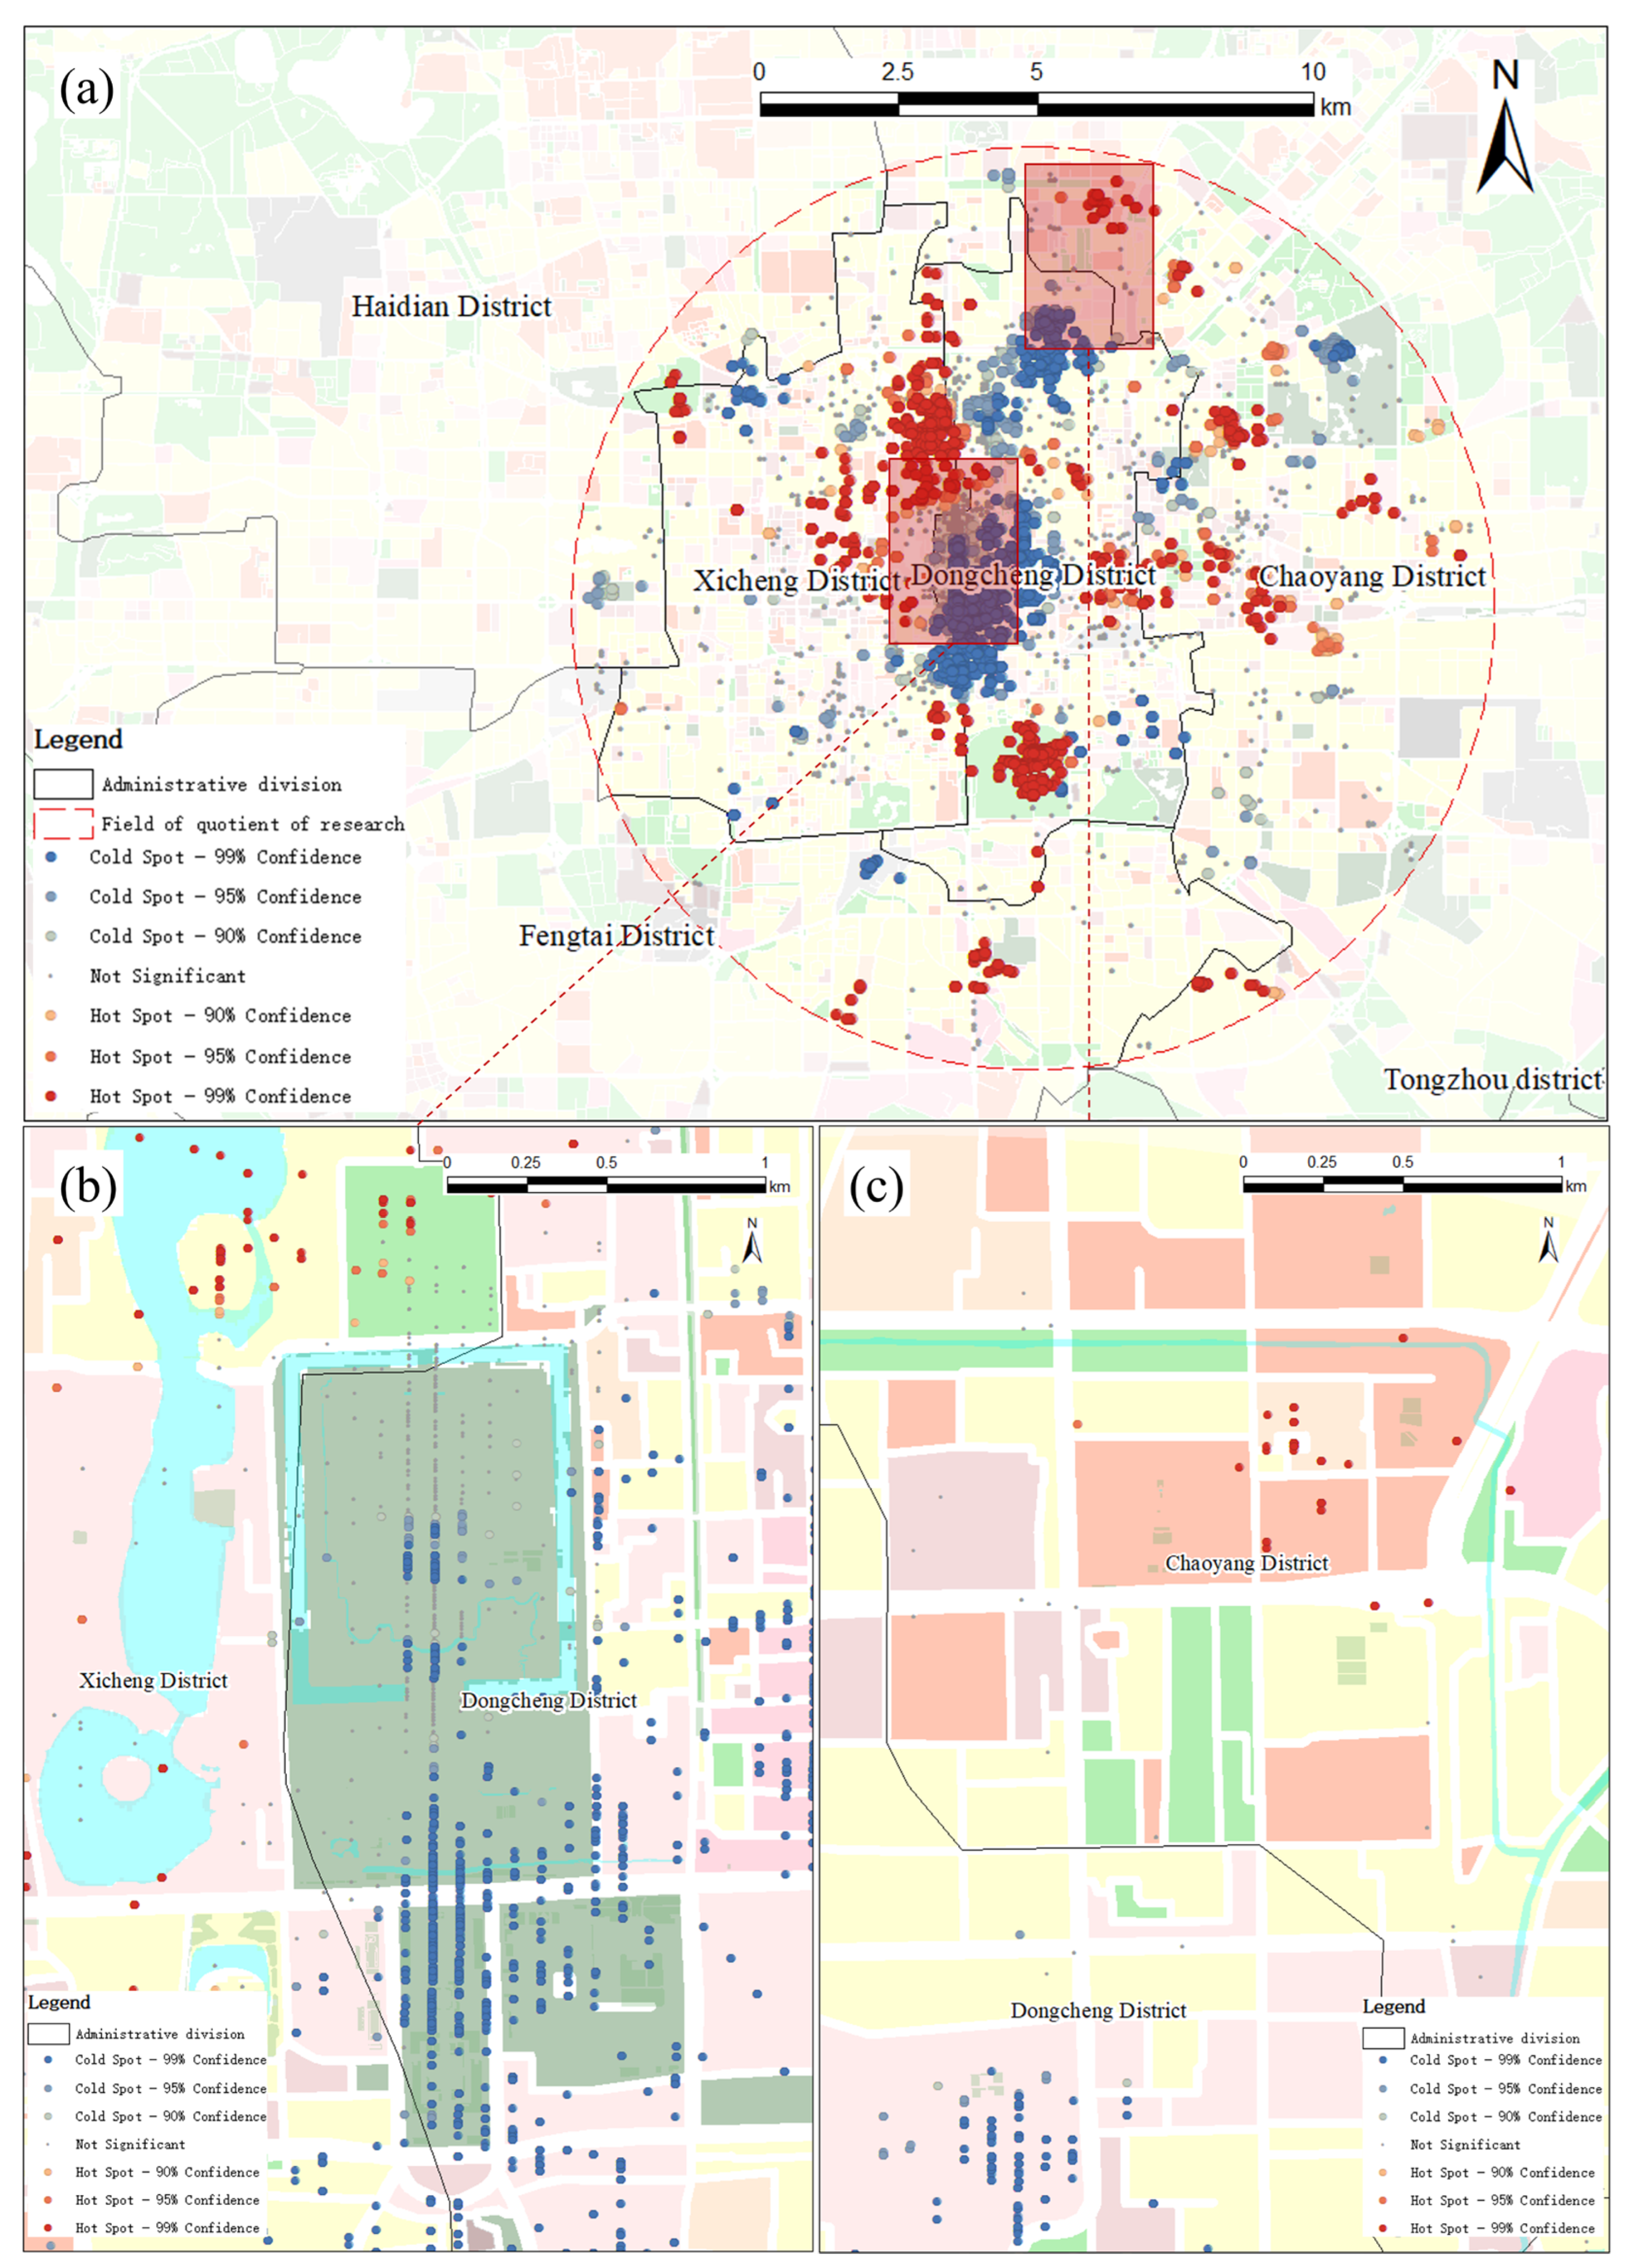
4.1. Spatial Clustering in Emotional Distribution
4.2. Influence of Landscape Indices on Emotional Expressions (ANOVA)
4.3. Landscape Patterns and Emotional Responses (GLMM)
4.4. Limits of the Current Study
5. Conclusions
Author Contributions
Funding
Data Availability Statement
Conflicts of Interest
References
- Liu, J.X.; Bi, H.; Wang, M.L. Using multi-source data to assess livability in Hong Kong at the community-based level: A combined subjective-objective approach. Geogr. Sustain. 2020, 1, 284–294. [Google Scholar] [CrossRef]
- Yim, D.H.; Kwon, Y. Does Young Adults’ Neighborhood Environment Affect Their Depressive Mood? Insights from the 2019 Korean Community Health Survey. Int. J. Environ. Res. Public Health 2021, 18, 1269. [Google Scholar] [CrossRef]
- Mao, Y.H.; Luo, X.Y.; Guo, S.Y.; Xie, M.; Zhou, J.; Huang, R.; Zhang, Z. Validation of the abbreviated indicators of perceived residential environment quality and neighborhood attachment in China. Front. Public Health 2022, 10, 925651. [Google Scholar] [CrossRef] [PubMed]
- Brosz, M.; Dymnicka, M.; Sagan, I.; Zalecki, J. The Environmental Dimension of City Dwellers’ Quality of Life and the City’s Social and Spatial Variability. Misc. Geogr. 2023, 27, 5–10. [Google Scholar] [CrossRef]
- Strengell, N.; Sigg, S. Local emotions—using social media to understand human-environment interaction in cities. In Proceedings of the 2018 IEEE International Conference on Pervasive Computing and Communications Workshops (PerCom Workshops), Athens, Greece, 19–23 March 2018. [Google Scholar]
- Wu, M.S.; Zhou, C.; Chen, H.; Cai, H.J.; Sundararajan, L. Cultural value mismatch in urbanizing China: A large-scale analysis of collectivism and happiness based on social media and nationwide survey. Int. J. Psychol. 2018, 53, 54–63. [Google Scholar] [CrossRef]
- Liu, W.; Li, D.; Meng, Y.; Guo, C.M. The Relationship between Emotional Perception and High-Density Built Environment Based on Social Media Data: Evidence from Spatial Analyses in Wuhan. Land 2024, 13, 294. [Google Scholar] [CrossRef]
- Li, X.; Hijazi, I.; Koenig, R.; Lv, Z.H.; Zhong, C.; Schmitt, G. Assessing Essential Qualities of Urban Space with Emotional and Visual Data Based on GIS Technique. ISPRS Int. J. Geo-Inf. 2016, 5, 218. [Google Scholar] [CrossRef]
- Zhang, J.; Zheng, Y.; Wen, T.; Yang, M.; Feng, Q.M. The impact of built environment on physical activity and subjective well-being of urban residents: A study of core cities in the Yangtze River Delta survey. Front. Psychol. 2022, 13, 1050486. [Google Scholar] [CrossRef]
- Li, X.M.; Liu, H. The Influence of Subjective and Objective Characteristics of Urban Human Settlements on Residents’ Life Satisfaction in China. Land 2021, 10, 1400. [Google Scholar] [CrossRef]
- Berman, M.G.; Jonides, J.; Kaplan, S. The cognitive benefits of interacting with nature. Psychol. Sci. 2008, 19, 1207–1212. [Google Scholar] [CrossRef]
- Bin, J.; Dongying, L.; Linda, L.; Sullivan, W.C. A Dose-Response Curve Describing the Relationship Between Urban Tree Cover Density and Self-Reported Stress Recovery. Environ. Behav. 2016, 48, 607–629. [Google Scholar]
- Sundling, C.; Jakobsson, M. How Do Urban Walking Environments Impact Pedestrians’ Experience and Psychological Health? A Systematic Review. Sustainability 2023, 15, 10817. [Google Scholar] [CrossRef]
- Ma, Y.Y.; Yang, Y.Z.; Jiao, H.Z. Exploring the Impact of Urban Built Environment on Public Emotions Based on Social Media Data: A Case Study of Wuhan. Land 2021, 10, 986. [Google Scholar] [CrossRef]
- Wu, J.S.; Sha, W.; Zhang, P.H.; Wang, Z.Y. The spatial non-stationary effect of urban landscape pattern on urban waterlogging: A case study of Shenzhen City. Sci. Rep. 2020, 10, 7369. [Google Scholar] [CrossRef] [PubMed]
- Ge, M.Y.; Fang, S.H.; Gong, Y.; Tao, P.J.; Yang, G.; Gong, W.B. Understanding the Correlation between Landscape Pattern and Vertical Urban Volume by Time-Series Remote Sensing Data: A Case Study of Melbourne. ISPRS Int. J. Geo-Inf. 2021, 10, 14. [Google Scholar] [CrossRef]
- Nyirarwasa, A.; Han, F.; Yang, Z.P.; Mperejekumana, P.; Umwali, E.D.; Nsengiyumva, J.N.; Habibulloev, S. Evaluating the Impact of Environmental Performance and Socioeconomic and Demographic Factors on Land Use and Land Cover Changes in Kibira National Park, Burundi. Sustainability 2024, 16, 473. [Google Scholar] [CrossRef]
- Yan, X.; Wang, Y.J.; Liao, N.; Xu, H.L.; Fan, Z.L. Assessment of Value Changes and Spatial Differences in Land Use Based on an Empirical Survey in the Manas River Basin. Land 2021, 10, 961. [Google Scholar] [CrossRef]
- Reis, J.P.; Silva, E.A.; Pinho, P. Spatial metrics to study urban patterns in growing and shrinking cities. Urban Geogr. 2016, 37, 246–271. [Google Scholar] [CrossRef]
- Zhu, Y.Y.; Ling, G. Spatio-Temporal Changes and Driving Forces Analysis of Urban Open Spaces in Shanghai between 1980 and 2020: An Integrated Geospatial Approach. Remote Sens. 2024, 16, 1184. [Google Scholar] [CrossRef]
- Ulrich, R.S. View Through a Window May Influence Recovery from Surgery. Science 1984, 224, 420–421. [Google Scholar] [CrossRef]
- Dadvand, P.; Bartoll, X.; Basagaña, X.; Dalmau-Bueno, A.; Martinez, D.; Ambros, A.; Cirach, M.; Triguero-Mas, M.; Gascon, M.; Borrell, C.; et al. Green spaces and General Health: Roles of mental health status, social support, and physical activity. Environ. Int. 2016, 91, 161–167. [Google Scholar] [CrossRef] [PubMed]
- Hartig, T.; Mitchell, R.; de Vries, S.; Frumkin, H. Nature and Health. Annu. Rev. Public Health 2014, 35, 207. [Google Scholar] [CrossRef] [PubMed]
- Sharma, S.; Joshi, P.K.; Fuerst, C. Exploring Multiscale Influence of Urban Growth on Landscape Patterns of Two Emerging Urban Centers in the Western Himalaya. Land 2022, 11, 2281. [Google Scholar] [CrossRef]
- Zhou, Y.R.; Feng, Z.; Xu, K.J.; Wu, K.N.; Gao, H.; Liu, P.J. Ecosystem Service Flow Perspective of Urban Green Land: Spatial Simulation and Driving Factors of Cooling Service Flow. Land 2023, 12, 1527. [Google Scholar] [CrossRef]
- Chirico, A.; Gaggioli, A. When Virtual Feels Real: Comparing Emotional Responses and Presence in Virtual and Natural Environments. Cyberpsychology Behav. Soc. Netw. 2019, 22, 220–226. [Google Scholar] [CrossRef]
- Guo, W.H.; Wen, H.Y.; Liu, X. Research on the psychologically restorative effects of campus common spaces from the perspective of health. Front. Public Health 2023, 11, 1131180. [Google Scholar] [CrossRef]
- Guo, X.; Tu, X.Y.; Huang, G.L.; Fang, X.N.; Kong, L.Q.; Wu, J.G. Urban greenspace helps ameliorate people’s negative sentiments during the COVID-19 pandemic: The case of Beijing. Build. Environ. 2022, 223, 109449. [Google Scholar] [CrossRef]
- Zhang, Y.; Van den Berg, A.E.; Van Dijk, T.; Weitkamp, G. Quality over Quantity: Contribution of Urban Green Space to Neighborhood Satisfaction. Int. J. Environ. Res. Public Health 2017, 14, 535. [Google Scholar] [CrossRef]
- Khaledi, H.J.; Faizi, M.; Khakzand, M. The effects of personal green spaces on human’s mental health and anxiety symptoms during COVID-19: The case of apartment residents in Tehran. Front. Built Environ. 2022, 8, 981582. [Google Scholar] [CrossRef]
- Wang, A.; Meng, Z.R.; Zhao, B.; Zhang, F. Using Social Media Data to Research the Impact of Campus Green Spaces on Students’ Emotions: A Case Study of Nanjing Campuses. Sustainability 2024, 16, 691. [Google Scholar] [CrossRef]
- Zhou, Y.H.; Dai, P.; Zhao, Z.; Hao, C.X.; Wen, Y.L. The Influence of Urban Green Space Soundscape on the Changes of Citizens’ Emotion: A Case Study of Beijing Urban Parks. Forests 2022, 13, 1928. [Google Scholar] [CrossRef]
- Sui, T.Y.; McDermott, S.; Harris, B.; Hsin, H.N. The impact of physical environments on outpatient mental health recovery: A design-oriented qualitative study of patient perspectives. PLoS ONE 2023, 18, 1928. [Google Scholar] [CrossRef]
- Mithun, S.; Sahana, M.; Chattopadhyay, S.; Johnson, B.A.; Khedher, K.M.; Avtar, R. Monitoring Metropolitan Growth Dynamics for Achieving Sustainable Urbanization (SDG 11.3) in Kolkata Metropolitan Area, India. Remote Sens. 2021, 13, 4423. [Google Scholar] [CrossRef]
- Li, K.K.; Zhai, Y.; Dou, L.; Liu, J.J. A Preliminary Exploration of Landscape Preferences Based on Naturalness and Visual Openness for College Students with Different Moods. Front. Psychol. 2021, 12, 629650. [Google Scholar] [CrossRef]
- Dai, D.H.; Dong, W.; Wang, Y.W.; Liu, S.N.; Zhang, J.Y. Exploring the relationship between urban residents’ emotional changes and built environment before and during the COVID-19 pandemic from the perspective of resilience. Cities 2023, 141, 104510. [Google Scholar] [CrossRef]
- Johnson, M.L.; Sachdeva, S.S. The Multifaceted Impact of COVID-19 on Social Media Users’ Wellbeing and Relationship with Urban Nature. Front. Sustain. Cities 2022, 4, 725870. [Google Scholar] [CrossRef]
- Xiao, X.; Fang, C.Y.; Lin, H.; Liu, L.; Tian, Y.; He, Q.H. Exploring spatiotemporal changes in the multi-granularity emotions of people in the city: A case study of Nanchang, China. Comput. Urban Sci. 2022, 2, 1. [Google Scholar] [CrossRef]
- Gao, Y.; Wang, M.; Zha, Z.J.; Shen, J.L.; Li, X.L.; Wu, X.D. Visual-Textual Joint Relevance Learning for Tag-Based Social Image Search. IEEE Trans. Image Process. 2013, 22, 363–376. [Google Scholar] [CrossRef]
- Saura, J.R.; Palacios-Marqués, D.; Ribeiro-Soriano, D. Exploring the boundaries of open innovation: Evidence from social media mining. Technovation 2023, 119, 102447. [Google Scholar] [CrossRef]
- Vandenbosch, L.; Fardouly, J.; Tiggemann, M. Social media and body image: Recent trends and future directions. Curr. Opin. Psychol. 2022, 45, 101289. [Google Scholar] [CrossRef]
- Zhang, M.N.; Huang, Q.S.; Liu, H. A Multimodal Data Analysis Approach to Social Media during Natural Disasters. Sustainability 2022, 14, 5536. [Google Scholar] [CrossRef]
- Kim, Y.; Nan, D.Y.; Kim, J.H. Exploration of the Relationships Among Narcissism, Life Satisfaction, and Loneliness of Instagram Users and the High- and Low-Level Features of Their Photographs. Front. Psychol. 2021, 12, 707074. [Google Scholar] [CrossRef]
- Bouchakwa, M.; Ayadi, Y.; Amous, I. A review on visual content-based and users’ tags-based image annotation: Methods and techniques. Multimed. Tools Appl. 2020, 79, 21679–21741. [Google Scholar] [CrossRef]
- Galuscáková, P.; Assoc, C.M. Segmentation Strategies for Passage Retrieval in Audio-Visual Documents. In Proceedings of the SIGIR’13: The Proceedings of the 36th International ACM SIGIR Conference on Research & Development in Information Retrieval, Dublin, Ireland, 28 July–1 August 2013; p. 1143. [Google Scholar]
- Gupta, T.; Kutty, L.; Gahir, R.; Ukwu, N.; Polley, S.; Thiel, M. IRTEX: Image Retrieval with Textual Explanations. In Proceedings of the 2021 IEEE International Conference on Human-Machine Systems (ICHMS), Magdeburg, Germany, 8–10 September 2021; pp. 13–16. [Google Scholar]
- Wu, Y.C. Integrating statistical and lexical information for recognizing textual entailments in text. Knowl.-Based Syst. 2013, 40, 27–35. [Google Scholar] [CrossRef]
- Yeghiazaryan, A.; Khechoyan, K.; Nalbandyan, G.; Muradyan, S. Tokengrid: Toward More Efficient Data Extraction From Unstructured Documents. IEEE Access 2022, 10, 39261–39268. [Google Scholar] [CrossRef]
- Zhang, Z.C.; Yao, D.R.; Chen, S.Y.; Ma, H.F. Chinese Textual Entailment Recognition Based on Syntactic Tree Clipping. In Proceedings of the Chinese Computational Linguistics and Natural Language Processing Based on Naturally Annotated Big Data, Wuhan, China, 18–19 October 2014; Volume 8801, pp. 83–94. [Google Scholar]
- Li, L.F.; Zhang, Q.P.; Wang, X.; Zhang, J.; Wang, T.; Gao, T.L.; Duan, W.; Tsoi, K.; Wang, F.Y. Characterizing the Propagation of Situational Information in Social Media During COVID-19 Epidemic: A Case Study on Weibo. IEEE Trans. Comput. Soc. Syst. 2020, 7, 556–562. [Google Scholar] [CrossRef]
- Middleton, S.E.; Middleton, L.; Modafferi, S. Real-Time Crisis Mapping of Natural Disasters Using Social Media. IEEE Intell. Syst. 2014, 29, 9–17. [Google Scholar] [CrossRef]
- Gu, Y.M.; Qian, Z.; Chen, F. From Twitter to detector: Real-time traffic incident detection using social media data. Transp. Res. Part C Emerg. Technol. 2016, 67, 321–342. [Google Scholar] [CrossRef]
- Feng, Y.; Sester, M. Extraction of Pluvial Flood Relevant Volunteered Geographic Information (VGI) by Deep Learning from User Generated Texts and Photos. ISPRS Int. J. Geo-Inf. 2018, 7, 39. [Google Scholar] [CrossRef]
- Kanchana, T.S.; Zoraida, B. Assessing Conscientiousness and Identify Leadership Quality Using Temporal Sequence Images. Intell. Autom. Soft Comput. 2023, 35, 2003–2013. [Google Scholar] [CrossRef]
- Mayne, D.J.; Morgan, G.G.; Jalaludin, B.B.; Bauman, A.E. Does Walkability Contribute to Geographic Variation in Psychosocial Distress? A Spatial Analysis of 91,142 Members of the 45 and Up Study in Sydney, Australia. Int. J. Environ. Res. Public Health 2018, 15, 275. [Google Scholar] [CrossRef]
- Kim, J.; Lee, J.; Park, E.; Han, J. A deep learning model for detecting mental illness from user content on social media. Sci. Rep. 2020, 10, 11846. [Google Scholar] [CrossRef] [PubMed]
- Garske, S.I.; Elayan, S.; Sykora, M.; Edry, T.; Grabenhenrich, L.B.; Galea, S.; Lowe, S.R.; Gruebner, O. Space-Time Dependence of Emotions on Twitter after a Natural Disaster. Int. J. Environ. Res. Public Health 2021, 18, 5292. [Google Scholar] [CrossRef]
- Lê-Scherban, F.; Brenner, A.B.; Hicken, M.T.; Needham, B.L.; Seeman, T.; Sloan, R.P.; Wang, X.; Diez Roux, A.V. Child and Adult Socioeconomic Status and the Cortisol Response to Acute Stress: Evidence From the Multi-Ethnic Study of Atherosclerosis. Biopsychosoc. Sci. Med. 2018, 80, 184–192. [Google Scholar] [CrossRef] [PubMed]
- Siriaraya, P.; Zhang, Y.H.; Kawai, Y.; Jeszenszky, P.; Jatowt, A. A city-wide examination of fine-grained human emotions through social media analysis. PLoS ONE 2023, 18, e0279749. [Google Scholar] [CrossRef] [PubMed]
- Chen, C.; Li, H.; Luo, W.; Xie, J.; Yao, J.; Wu, L.; Xia, Y. Predicting the effect of street environment on residents’ mood states in large urban areas using machine learning and street view images. Sci. Total Environ. 2022, 816, 151605. [Google Scholar] [CrossRef]
- Guo, F.H.; Ma, L.H.; Li, R.J.; Zhang, J.H.; Fu, X.Q. The Spatial Aggregation Pattern, Characteristic and Driving Mechanism of Recreational Region around Metropolises A case study in Beijing, China. In Proceedings of the 2010 18th International Conference on Geoinformatics, Beijing, China, 18–20 June 2010. [Google Scholar]
- He, X.D.; Mao, Q.Z.; Dang, A.R. Comparative study on urban spatial layout of Beijing with World metropolises based on RS & GIS. In Proceedings of the IGARSS 2005: IEEE International Geoscience and Remote Sensing Symposium (IGARSS 2005), Seoul, Republic of Korea, 29 July 2005; Volumes 1–8, pp. 241–244. [Google Scholar]
- Wei, S.; Jiao, W.; Liu, H.; Long, T.; Liu, Y.; Ji, P.; Hou, R.; Zhang, N.; Xiao, Y. Research on Comfort Evaluation Model of Urban Residents’ Public Space Lighting Integrating Public Perception and Nighttime Light Remote Sensing Data. Remote Sens. 2022, 14, 655. [Google Scholar] [CrossRef]
- Yao, R.H.; Wang, F.; Chen, S.H.; Zhao, S. GroupSeeker: An Applicable Framework for Travel Companion Discovery from Vast Trajectory Data. ISPRS Int. J. Geo-Inf. 2020, 9, 404. [Google Scholar] [CrossRef]
- Xia, X.; Lin, K.; Ding, Y.; Dong, X.; Sun, H.; Hu, B. Research on the Coupling Coordination Relationships between Urban Function Mixing Degree and Urbanization Development Level Based on Information Entropy. Int. J. Environ. Res. Public Health 2021, 18, 242. [Google Scholar] [CrossRef]
- Zhang, J.; Zhang, J.; Liu, Y. A spatial reference frame model of Beijing based on spatial cognitive experiment. In Proceedings of the Geoinformatics 2006: GNSS and Integrated Geospatial Applications, Wuhan, China, 28–29 October 2006; Volume 6418. [Google Scholar]
- World Happiness Report 2024|The World Happiness Report. 2024; Volume 2024. Available online: https://worldhappiness.report/ed/2024/ (accessed on 20 September 2023).
- Franek, M.; Petruzálek, J. Viewing Natural vs. Urban Images and Emotional Facial Expressions: An Exploratory Study. Int. J. Environ. Res. Public Health 2021, 18, 7651. [Google Scholar] [CrossRef]
- Guan, H.M.; Wei, H.X.; Hauer, R.J.; Liu, P. Facial expressions of Asian people exposed to constructed urban forests: Accuracy validation and variation assessment. PLoS ONE 2021, 16, e0253141. [Google Scholar] [CrossRef]
- Kang, Y.H.; Jia, Q.Y.; Gao, S.; Zeng, X.H.; Wang, Y.Y.; Angsuesser, S.; Liu, Y.; Ye, X.Y.; Fei, T. Extracting human emotions at different places based on facial expressions and spatial clustering analysis. Trans. GIS 2019, 23, 450–480. [Google Scholar] [CrossRef]
- Barrett, L.F.; Adolphs, R.; Marsella, S.; Martinez, A.M.; Pollak, S.D. Emotional Expressions Reconsidered: Challenges to Inferring Emotion From Human Facial Movements. Psychol. Sci. Public Interest 2019, 20, 1–68. [Google Scholar] [CrossRef]
- Russell, J.A. A circumplex model of affect. J. Personal. Soc. Psychol. 1980, 39, 1161–1178. [Google Scholar] [CrossRef]
- Coletto, M.; Lucchese, C.; Orlando, S. Do Violent People Smile: Social Media Analysis of their Profile Pictures. In Proceedings of the Companion Proceedings of the the Web Conference, Lyon, France, 23–27 April 2018. [Google Scholar]
- Bakhshi, S.; Shamma, D.A.; Gilbert, E. In Faces engage us: Photos with faces attract more likes and comments on instagram. In Proceedings of the SIGCHI Conference on Human Factors in Computing Systems, Toronto, OT, Canada, 26 April–1 May 2014; pp. 965–974. [Google Scholar]
- Küntzler, T.; Höfling, T.; Alpers, G.W. Automatic Facial Expression Recognition in Standardized and Non-standardized Emotional Expressions. Front. Psychol. 2021, 12, 627561. [Google Scholar] [CrossRef]
- Niculescu, I.; Hu, H.M.; Gee, C.; Chong, C.; Dubey, S.; Li, P.L. In Towards inclusive software engineering through a/b testing: A case-study at windows. In Proceedings of the 2021 IEEE/ACM 43rd International Conference on Software Engineering: Software Engineering in Practice (ICSE-SEIP), Madrid, Spain, 25–28 May 2021; pp. 180–187. [Google Scholar]
- Russakovsky, O.; Deng, J.; Su, H.; Krause, J.; Satheesh, S.; Ma, S.; Huang, Z.H.; Karpathy, A.; Khosla, A.; Bernstein, M.; et al. ImageNet Large Scale Visual Recognition Challenge. Int. J. Comput. Vis. 2015, 115, 211–252. [Google Scholar] [CrossRef]
- Korb, S.; With, S.; Niedenthal, P.; Kaiser, S.; Grandjean, D. The Perception and Mimicry of Facial Movements Predict Judgments of Smile Authenticity. PLoS ONE 2014, 9, e99194. [Google Scholar] [CrossRef]
- Durán, J.I.; Fernández-Dols, J. Basic emotions do not reliably co-occur with predicted facial expressions: Reply to Witkower et al. (2023). Emotion 2023, 23, 908–910. [Google Scholar] [CrossRef]
- Cranor, C.F. On respecting human beings as persons. J. Value Inq. 1983, 17, 103–117. [Google Scholar] [CrossRef]
- Jones, R. Landscape ecology: In theory and practice, pattern and process. Geography 2002, 87, 369–370. [Google Scholar]
- Forman, R.T.T. Some general principles of landscape and regional ecology. Landsc. Ecol. 1995, 10, 133–142. [Google Scholar] [CrossRef]
- Li, H.; Wu, J. Use and misuse of landscape indices. Landsc. Ecol. 2004, 19, 389–399. [Google Scholar] [CrossRef]
- Wang, J.S.; Liu, N.; Zou, J.Y.; Guo, Y.L.; Chen, H. The health perception of urban green spaces and its emotional impact on young adults: An empirical study from three cities in China. Front. Public Health 2023, 11, 1232216. [Google Scholar] [CrossRef]
- Wu, Y.; Liu, J.; Quevedo, J.; Cheng, H.S.; Yu, K.Y.; Kohsaka, R. Critical factors influencing visitor emotions: Analysis of "restorativeness" in urban park visits in Fuzhou, China. Front. Public Health 2023, 11, 1286518. [Google Scholar] [CrossRef]
- Svoray, T.; Dorman, M.; Shahar, G.; Kloog, I. Demonstrating the effect of exposure to nature on happy facial expressions via Flickr data: Advantages of non-intrusive social network data analyses and geoinformatics methodologies. J. Environ. Psychol. 2018, 58, 93–100. [Google Scholar] [CrossRef]
- McGarigal, K.; Cushman, S.A.; Neel, M.C.; Ene, E. FRAGSTATS v4: Spatial Pattern Analysis Program for Categorical Maps. 2023. Available online: https://www.fragstats.org/ (accessed on 20 September 2023).
- Shiliang, S.; Lin, L.; Min, W. Spatial Data Analysis, 1st ed.; Science Press: Beijing, China, 2019. (In Chinese) [Google Scholar]
- Tobler, W.R. Computer movie simulating urban growth in detroit region. Econ. Geogr. 1970, 46, 234–240. [Google Scholar] [CrossRef]
- Anselin, L. Local indicators of spatial association—LISA. Geogr. Anal. 1995, 27, 93–115. [Google Scholar] [CrossRef]
- Ord, J.K.; Getis, A. Local spatial autocorrelation statistics—Distributional issues and an application. Geogr. Anal. 1995, 27, 286–306. [Google Scholar] [CrossRef]
- Anselin, L. Spatial auto-correlation—ODLAND, J. J. Reg. Sci. 1988, 28, 589–592. [Google Scholar]
- Zhenfang, H.; Tingting, M.; Qingchun, G.; Tianquan, L.; Xinping, L.; Yifang, D. Study on the spatial and temporal evolution and differentiation of wetlands in Dawen River Basin from 1979 to 2019. Water Resour. Prot. 2024, 40, 134–140. (In Chinese) [Google Scholar]
- Li, X.; Meng, X.X.; Li, H.; Yang, J.M.; Yuan, J.J. The impact of mood on empathy for pain: Evidence from an EEG study. Psychophysiology 2017, 54, 1311–1322. [Google Scholar] [CrossRef] [PubMed]
- Gu, C. Introduction. In Smoothing Spline ANOVA Models; Gu, C., Ed.; Springer: New York, NY, USA, 2013; pp. 1–21. [Google Scholar]
- Katrien, A.; Jan, B. Applications of generalized linear mixed models in actuarial statistics. Insur. Math. Econ. 2005, 37, 374. [Google Scholar]
- Li, H.Y.; Peng, J.X.; Jiao, Y.; Ai, S.S. Experiencing Urban Green and Blue Spaces in Urban Wetlands as a Nature-Based Solution to Promote Positive Emotions. Forests 2022, 13, 473. [Google Scholar] [CrossRef]
- Zhu, X.; Gao, M.; Zhang, R.; Zhang, B. Quantifying emotional differences in urban green spaces extracted from photos on social networking sites: A study of 34 parks in three cities in northern China. Urban For. Urban Green. 2021, 62, 127133. [Google Scholar] [CrossRef]
- Rusli, N.; Yusran, G.R.; Nordin, N.Z.; Rosley, M. Investigating the impact of urban green space quality on subjective well-being via social media analytics. J. Urban Des. 2024. [Google Scholar] [CrossRef]
- Wang, V.H.; Foster, V.; Yi, S.S. Are recommended dietary patterns equitable? Public Health Nutr. 2022, 25, 464–470. [Google Scholar] [CrossRef] [PubMed]
- Boerma, T.; Leseman, P.; Timmermeister, M.; Wijnen, F.; Blom, E. Narrative abilities of monolingual and bilingual children with and without language impairment: Implications for clinical practice. Int. J. Lang. Commun. Disord. 2016, 51, 626–638. [Google Scholar] [CrossRef]
- Hurley, R.A.; Taber, K.H. Emotional disturbances following traumatic brain injury. Curr. Treat. Opt. Neurol. 2002, 4, 59–75. [Google Scholar] [CrossRef] [PubMed]
- Zhang, R.S.; Duan, W.Y.; Zheng, Z.K. Multimodal Quantitative Research on the Emotional Attachment Characteristics between People and the Built Environment Based on the Immersive VR Eye-Tracking Experiment. Land 2024, 13, 52. [Google Scholar] [CrossRef]
- Jennings, V.; Gaither, C.J. Approaching Environmental Health Disparities and Green Spaces: An Ecosystem Services Perspective. Int. J. Environ. Res. Public Health 2015, 12, 1952–1968. [Google Scholar] [CrossRef] [PubMed]
- Lin, Y.A.; Fu, H.P.; Zhong, Q.K.; Zuo, Z.T.; Chen, S.H.; He, Z.Q.; Zhang, H. The Influencing Mechanism of the Communities’ Built Environment on Residents’ Subjective Well-Being: A Case Study of Beijing. Land 2024, 13, 793. [Google Scholar] [CrossRef]
- Jennings, V.; Bamkole, O. The Relationship between Social Cohesion and Urban Green Space: An Avenue for Health Promotion. Int. J. Environ. Res. Public Health 2019, 16, 452. [Google Scholar] [CrossRef] [PubMed]
- Lin, X.F.; Fu, H. Optimization of tropical rainforest ecosystem management: Implications from the responses of ecosystem service values to landscape pattern changes in Hainan Tropical Rainforest National Park, China, over the past 40 years. Front. For. Glob. Change 2023, 6, 1242068. [Google Scholar] [CrossRef]
- Nejade, R.M.; Grace, D.; Bowman, L.R. What is the impact of nature on human health? A scoping review of the literature. J. Glob. Health 2022, 12, 04099. [Google Scholar] [CrossRef]
- Mansour, S.; Al Nasiri, N.; Abulibdeh, A.; Ramadan, E. Spatial disparity patterns of green spaces and buildings in arid urban areas. Build. Environ. 2022, 208, 108588. [Google Scholar] [CrossRef]
- Zhang, J.J.; Zhao, X.M.; Guo, J.X.; Zhao, Y.R.; Huang, X.Y.; Long, M. Spatio-Temporal Evolution and Driving Factors of Landscape Pattern in a Typical Hilly Area in Southern China: A Case Study of Yujiang District, Jiangxi Province. Forests 2023, 14, 609. [Google Scholar] [CrossRef]
- Wang, Z.J.; Liu, Y.; Li, Y.X.; Su, Y. Response of Ecosystem Health to Land Use Changes and Landscape Patterns in the Karst Mountainous Regions of Southwest China. Int. J. Environ. Res. Public Health 2022, 19, 3273. [Google Scholar] [CrossRef]
- Wang, E.D.; Kang, N.N.; Yu, Y. Valuing Urban Landscape Using Subjective Well-Being Data: Empirical Evidence from Dalian, China. Sustainability 2018, 10, 36. [Google Scholar] [CrossRef]
- Rui, J.; Othengrafen, F. Examining the Role of Innovative Streets in Enhancing Urban Mobility and Livability for Sustainable Urban Transition: A Review. Sustainability 2023, 15, 5709. [Google Scholar] [CrossRef]
- Shao, Y.H.; Yin, Y.T.; Xue, Z.Y.; Ma, D.B. Assessing and Comparing the Visual Comfort of Streets across Four Chinese Megacities Using AI-Based Image Analysis and the Perceptive Evaluation Method. Land 2023, 12, 834. [Google Scholar] [CrossRef]
- Qi, F.; Parra, A.O.; Block-Lerner, J.; Mcmanus, J. Psychological Impacts of Urban Environmental Settings: A Micro-Scale Study on a University Campus. Urban Sci. 2024, 8, 73. [Google Scholar] [CrossRef]
- Jin, T.F.; Lu, J.Y.; Shao, Y.H. Exploring the Impact of Visual and Aural Elements in Urban Parks on Human Behavior and Emotional Responses. Land 2024, 13, 1468. [Google Scholar] [CrossRef]
- Li, Y.R.; Li, Y.; Fan, P.C.; Sun, J.; Liu, Y.S. Land use and landscape change driven by gully land consolidation project: A case study of a typical watershed in the Loess Plateau. J. Geogr. Sci. 2019, 29, 719–729. [Google Scholar] [CrossRef]
- Li, Z.; Wu, S.L.; Zhang, S.W.; Nie, C.; Li, Y.; Huang, Y.F. Optimization of Land Reuse Structure in Coal Mining Subsided Areas Considering Regional Economic Development: A Case Study in Pei County, China. Sustainability 2020, 12, 3335. [Google Scholar] [CrossRef]
- Fan, X.N.; Cheng, Y.N.; Tan, F.Q.; Zhao, T.Y. Construction and Optimization of the Ecological Security Pattern in Liyang, China. Land 2022, 11, 1641. [Google Scholar] [CrossRef]
- Amani-Beni, M.; Zhang, B.; Xie, G.D.; Shi, Y.T. Impacts of Urban Green Landscape Patterns on Land Surface Temperature: Evidence from the Adjacent Area of Olympic Forest Park of Beijing, China. Sustainability 2019, 11, 513. [Google Scholar] [CrossRef]
- Wu, X.P.; Zhou, Z.F.; Zhu, M.; Wang, J.L.; Liu, R.P.; Zheng, J.J.; Wan, J.X. Quantifying Spatiotemporal Characteristics and Identifying Influential Factors of Ecosystem Fragmentation in Karst Landscapes: A Comprehensive Analytical Framework. Land 2024, 13, 278. [Google Scholar] [CrossRef]
- Kanglin, C.; Jianzhou, G.; Xiaoyue, C.; Tianxiang, L. Study on the pattern relationship between urban green space and surface temperature in Guangzhou. J. Ecol. Environ. 2016, 25, 8. (In Chinese) [Google Scholar]
- Yixin, G. The Present Situation and Prospect of the Research on the Regulation of Human Emotion by Urban Park Green Space. Chin. Foreign Archit. 2024, 51–55. (In Chinese) [Google Scholar]
- Cruz, J.; Li, G.Q.; Aragon, M.J.; Coventry, P.A.; Jacobs, R.; Prady, S.L.; White, P. Association of environmental and socioeconomic indicators with serious mental illness diagnoses identified from general practitioner practice data in England: A spatial Bayesian modelling study. PLoS Med. 2022, 19, e1004043. [Google Scholar] [CrossRef]


| Num | Photo_Id | Date_Taken | URL (Image) | Latitude | Longitude |
|---|---|---|---|---|---|
| 1 | 222121907 | 26 December 2005 16:43:36 | https://live.staticflickr.com/91/222121907_a151d4ede4_o.jpg (accessed on 6 June 2023) | 39.9055 | 116.391 |
| 2 | 1299692734 | 28 July 2005 14:54:57 | https://live.staticflickr.com/1146/1299692734_5f7a084906_o.jpg (accessed on 6 June 2023) | 39.9309 | 116.399 |
| 3 | 1965918626 | 2 June 2004 13:44:58 | https://live.staticflickr.com/2217/1965918626_69e65c1ef6_o.jpg (accessed on 6 June 2023) | 39.9247 | 116.377 |
| 4 | 2103289680 | 18 August 2007 4:05:53 | https://live.staticflickr.com/2418/2103289680_eb69bd6506_o.jpg (accessed on 6 June 2023) | 39.9282 | 116.408 |
| 5 | 8951507186 | 14 September 2012 10:51:50 | https://live.staticflickr.com/8549/8951507186_790f68f19a_o.jpg (accessed on 6 June 2023) | 39.8798 | 116.404 |
| 6 | 33227611744 | 25 July 2014 17:34:21 | https://live.staticflickr.com/2838/33227611744_ce9cd79375_o.jpg (accessed on 6 June 2023) | 39.8602 | 116.392 |
| 7 | 36415250020 | 9 May 20158:57:02 | https://live.staticflickr.com/4410/36415250020_bb5324c118_o.jpg (accessed on 6 June 2023) | 39.901 | 116.434 |
| 8 | 36415250640 | 9 May 20158:55:43 | https://live.staticflickr.com/4355/36415250640_21a6a3735b_o.jpg (accessed on 6 June 2023) | 39.901 | 116.434 |
| 9 | 50309051776 | 1 July 20170:05:47 | https://live.staticflickr.com/65535/50309051776_260bef31e8_o.jpg (accessed on 6 June 2023) | 39.9251 | 116.39 |
| 10 | 2779234684 | 9 April 20079:19:23 | https://live.staticflickr.com/3179/2779234684_e50ff08a7b_o.jpg (accessed on 6 June 2023) | 39.9287 | 116.381 |
| 11 | 4553258988 | 26 October 200615:10:34 | https://live.staticflickr.com/4068/4553258988_3b28ef40af_o.jpg (accessed on 6 June 2023) | 39.9289 | 116.388 |
| 12 | 2159020702 | 25 March 2004 8:38:20 | https://live.staticflickr.com/2075/2159020702_5d553dbac8_o.jpg (accessed on 6 June 2023) | 39.9222 | 116.393 |
| 13 | 2830500562 | 20 January 2005 12:41:42 | https://live.staticflickr.com/3087/2830500562_2a77c310d0_o.jpg (accessed on 6 June 2023) | 39.9449 | 116.408 |
| Landscape Index | Abbreviation | Formula | Ecological Meaning |
|---|---|---|---|
| Patch Type Area | CA | The sum of the area of a certain type of patch reflects the difference in information flow, such as species, energy, and nutrients in the patch, where aij is the area of patch ij. | |
| Patch Number | NP | The total number of patches of a certain type; the larger the value the more patches. | |
| Largest Patch Index | LPI | The degree of fragmentation of different types of patches, or the entire landscape and the size of their values determine the dominant species in the landscape. Changes in their values can alter the intensity and frequency of disturbances and reflect the strength of human activities, where an is the area of patch n; A is the total area of all landscapes. | |
| Landscape Shape Index | LSI | Reflects the intensity of human activities on landscape interference. In the formula: E is the total length of all patch boundaries in the landscape; A is the total area of all landscapes. | |
| Aggregation Index | AI | Reflects the non-randomness or aggregation degree of different patch types in the landscape, that is, the spatial configuration characteristics of landscape components, where gij is the number of similar adjacent patches of the corresponding landscape type. | |
| Shannon–Wiener Diversity Index | SIDI | Reflects the complexity and variability of the landscape, sensitive to the unbalanced distribution of various patch types in the landscape, and is closely related to species diversity. In the formula: pi is the ratio of landscape patch type i; m is the total number of patch types in the landscape. | |
| Spatially Explicit Index of Evenness | SIEI | Reflects the diversity characteristics of the distribution of each patch in the area, where pi is the ratio of the landscape patch type i; m is the total number of patch types in the landscape. |
| Df | Sum Sq | Mean Sq | F Value | Pr (>F) | ||
|---|---|---|---|---|---|---|
| SIEI | 4 | 44,487 | 11,122 | 8.440 | 8.44 × 10⁻⁷ | *** |
| LPI_112 | 4 | 87,929 | 21,982 | 16.681 | 1.16 × 10⁻¹³ | *** |
| LPI_505 | 4 | 38,302 | 9576 | 7.266 | 7.64 × 10⁻⁶ | *** |
| LSI | 4 | 53,734 | 13,433 | 10.194 | 3.04 × 10⁻⁸ | *** |
| LPI | 4 | 66,332 | 16,583 | 12.584 | 3.15 × 10⁻¹⁰ | *** |
| SIDI | 4 | 32,728 | 8182 | 6.209 | 5.46 × 10⁻⁵ | *** |
| CA_505 | 4 | 9816 | 2454 | 1.862 | 0.11403 | |
| NP_505 | 4 | 24,202 | 6051 | 4.591 | 0.00105 | ** |
| CA_112 | 4 | 6563 | 1641 | 1.245 | 0.28931 | |
| NP_112 | 4 | 77,899 | 19,475 | 14.779 | 4.61 × 10⁻¹² | *** |
| AI_505 | 4 | 57,965 | 14,491 | 10.997 | 6.58 × 10⁻⁹ | *** |
| NP | 4 | 113,869 | 28,467 | 21.603 | <2 × 10⁻¹⁶ | *** |
| AI_112 | 4 | 3657 | 914 | 0.694 | 0.59619 | |
| LSI_505 | 4 | 27,314 | 6829 | 5.182 | 0.00036 | *** |
| AI | 4 | 16,973 | 4243 | 3.220 | 0.01189 | * |
| LSI_112 | 4 | 40,807 | 10,202 | 7.742 | 3.14 × 10⁻⁶ | *** |
| Residuals | 23,612 | 31,115,175 | 1318 |
| Estimate | Std. Error | z Value | Pr (>|z|) | ||
|---|---|---|---|---|---|
| (Intercept) | −0.98560 | 0.24466 | −4.029 | 5.61 × 10⁻⁵ | *** |
| SIEI | −0.06388 | 0.15171 | −0.421 | 0.67371 | |
| LPI_112 | 85.94852 | 11.31457 | 7.596 | 3.05 × 10⁻¹⁴ | *** |
| LPI_505 | 3.04355 | 1.03243 | 2.948 | 0.00320 | ** |
| LPI | −0.05825 | 0.03720 | −1.566 | 0.11736 | |
| SIDI | 0.01612 | 0.15050 | 0.107 | 0.91472 | |
| NP_505 | 1.90619 | 0.67507 | 2.824 | 0.00475 | ** |
| NP_112 | −19.07170 | 12.71379 | −1.500 | 0.13359 | |
| AI_505 | 1.83704 | 2.01904 | 0.910 | 0.36290 | |
| NP | −0.21451 | 0.09104 | −2.356 | 0.01846 | * |
| AI_112 | 0.66205 | 0.60524 | 1.094 | 0.27401 | |
| LSI_505 | −6.76081 | 2.12892 | −3.176 | 0.00149 | ** |
| AI | −0.12264 | 0.05592 | −2.193 | 0.02829 | * |
| LSI_112 | −67.55195 | 17.27202 | −3.911 | 9.19 × 10⁻⁵ | *** |
Disclaimer/Publisher’s Note: The statements, opinions and data contained in all publications are solely those of the individual author(s) and contributor(s) and not of MDPI and/or the editor(s). MDPI and/or the editor(s) disclaim responsibility for any injury to people or property resulting from any ideas, methods, instructions or products referred to in the content. |
© 2025 by the authors. Licensee MDPI, Basel, Switzerland. This article is an open access article distributed under the terms and conditions of the Creative Commons Attribution (CC BY) license (https://creativecommons.org/licenses/by/4.0/).
Share and Cite
Li, Z.; Wu, X.; Wu, J.; Liu, H. The Influence of Urban Landscape Ecology on Emotional Well-Being: A Case Study of Downtown Beijing. Land 2025, 14, 519. https://doi.org/10.3390/land14030519
Li Z, Wu X, Wu J, Liu H. The Influence of Urban Landscape Ecology on Emotional Well-Being: A Case Study of Downtown Beijing. Land. 2025; 14(3):519. https://doi.org/10.3390/land14030519
Chicago/Turabian StyleLi, Ziyi, Xiaolu Wu, Jing Wu, and Huihui Liu. 2025. "The Influence of Urban Landscape Ecology on Emotional Well-Being: A Case Study of Downtown Beijing" Land 14, no. 3: 519. https://doi.org/10.3390/land14030519
APA StyleLi, Z., Wu, X., Wu, J., & Liu, H. (2025). The Influence of Urban Landscape Ecology on Emotional Well-Being: A Case Study of Downtown Beijing. Land, 14(3), 519. https://doi.org/10.3390/land14030519