
Practical Steps for Urban Flood Risk Mitigation Using Nature-Based Solutions—A Case Study in New Cairo, Egypt


Abstract
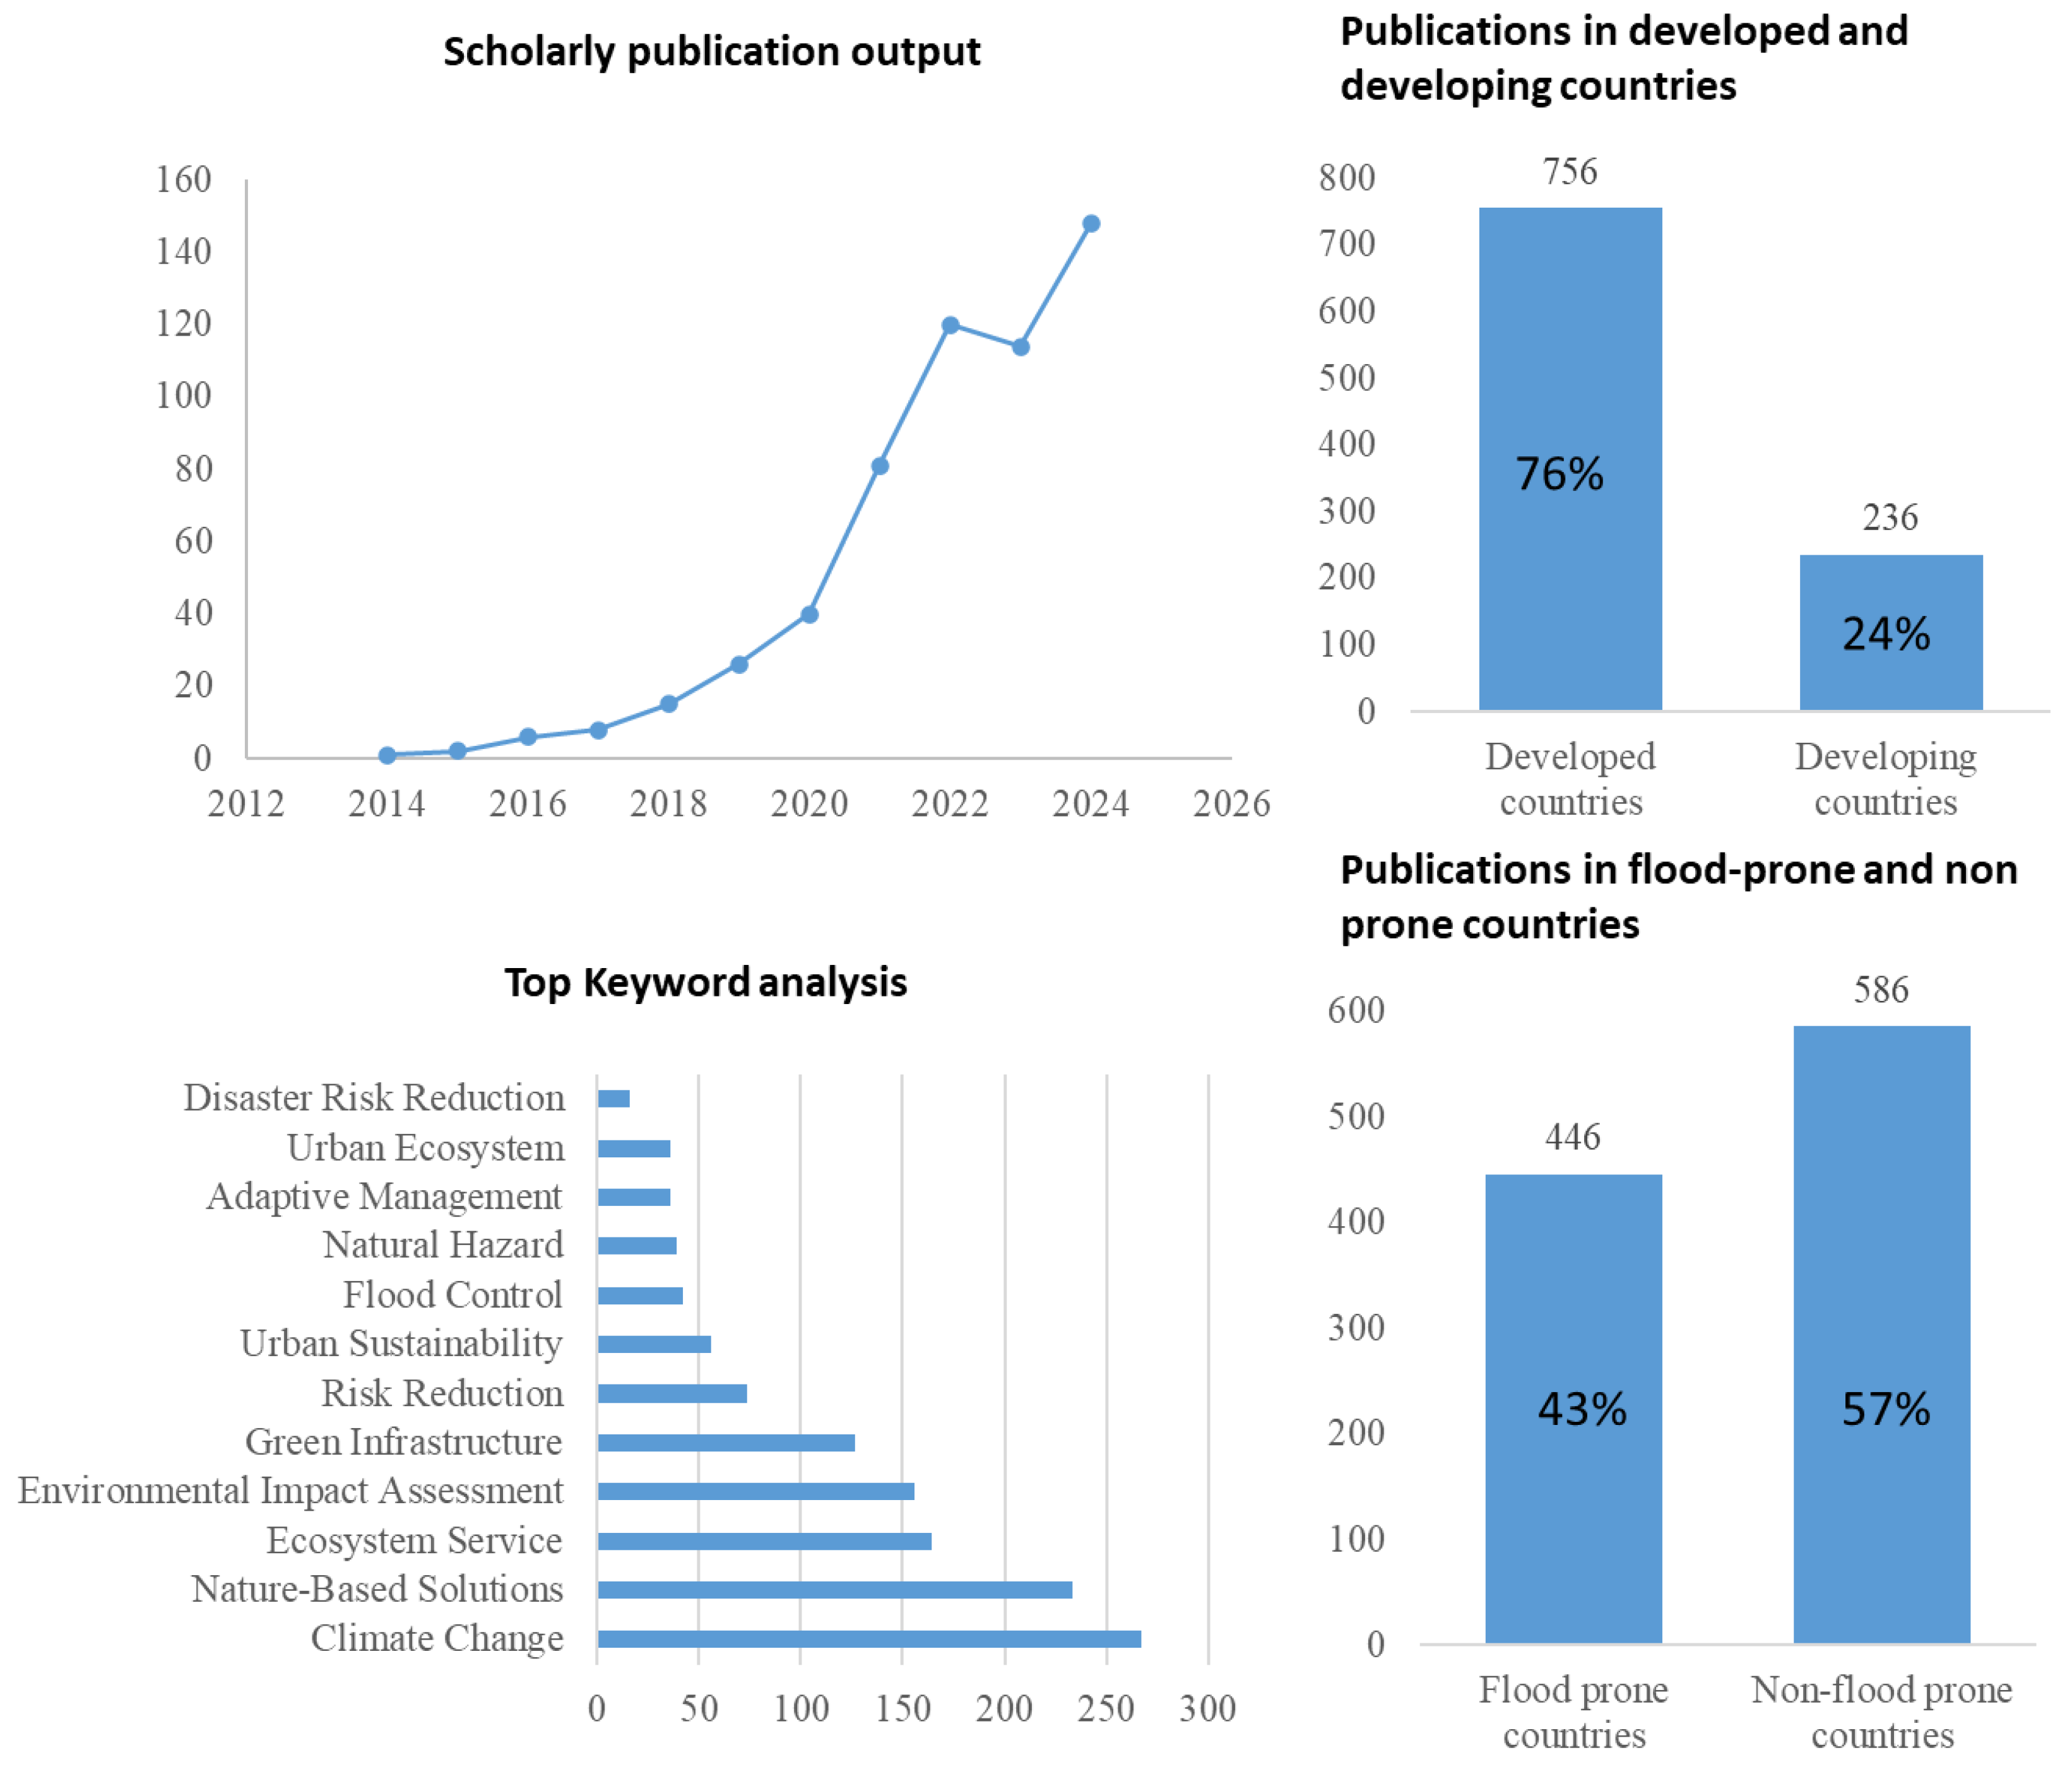
:1. Introduction
2. Research Problem, Aim, and Objectives
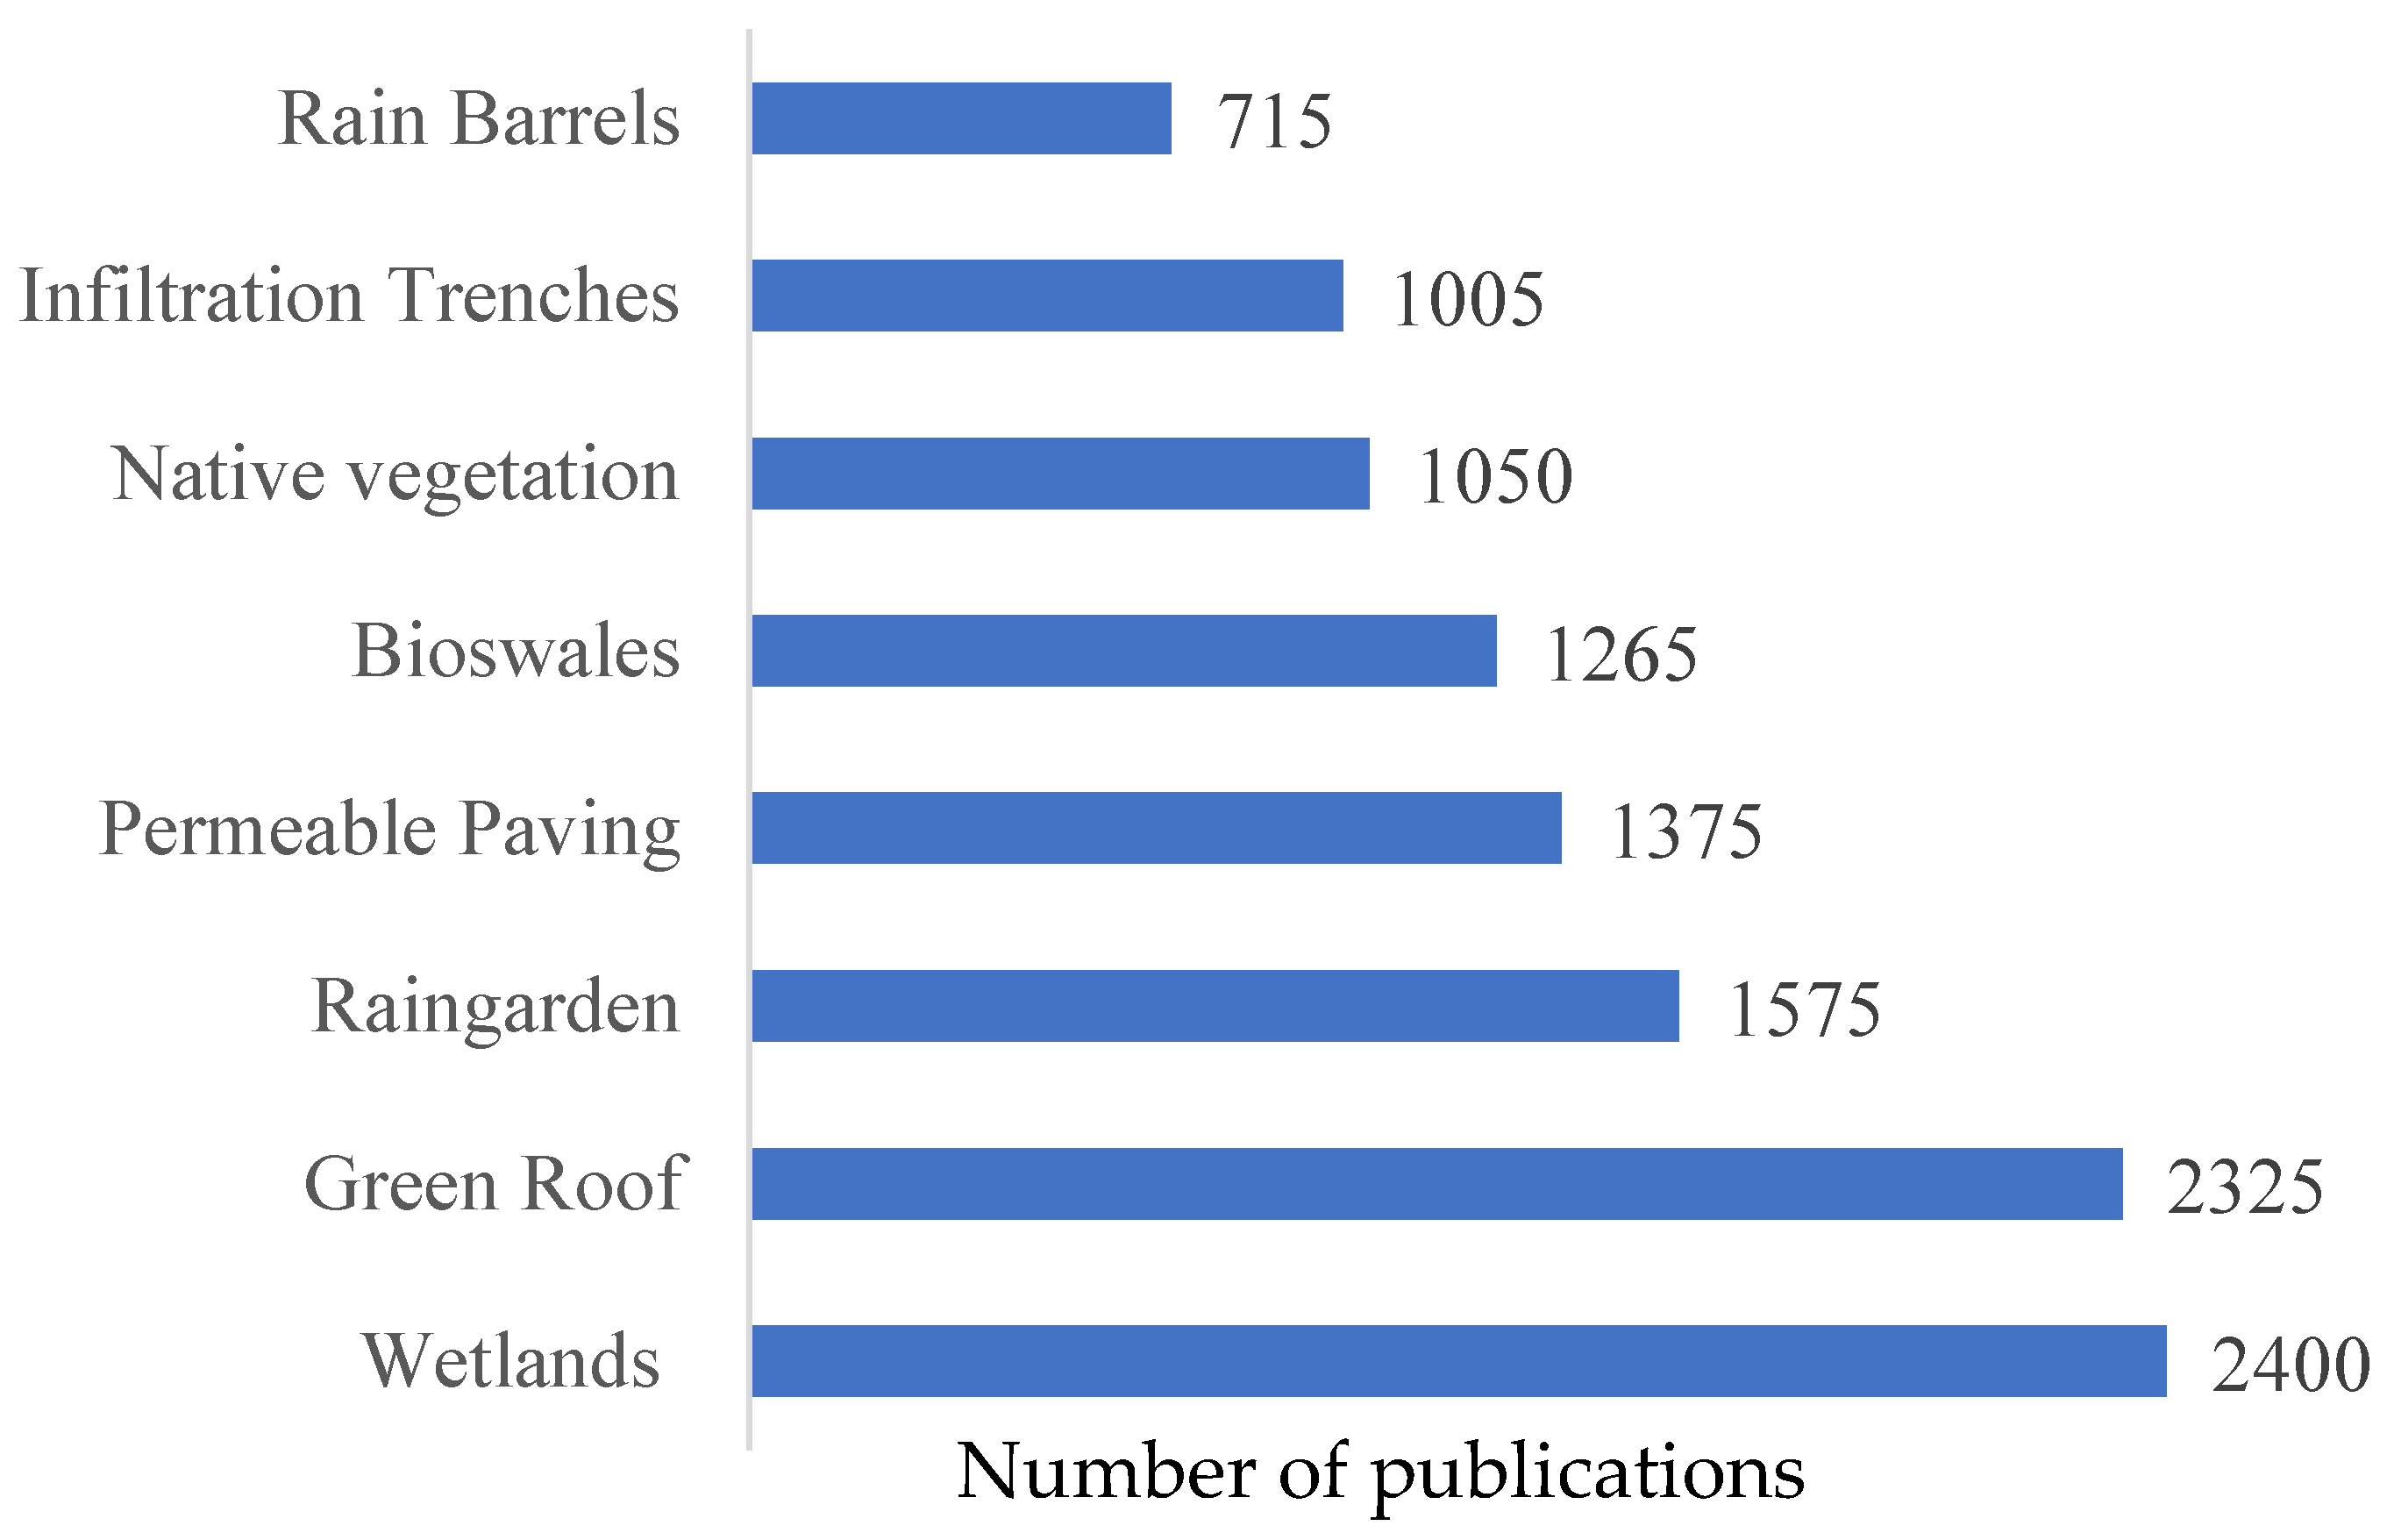
3. Literature Review
4. The State of the Art of Flood Risk Management in the MENA Region: The Case of Egypt
5. Research Method
- (1)
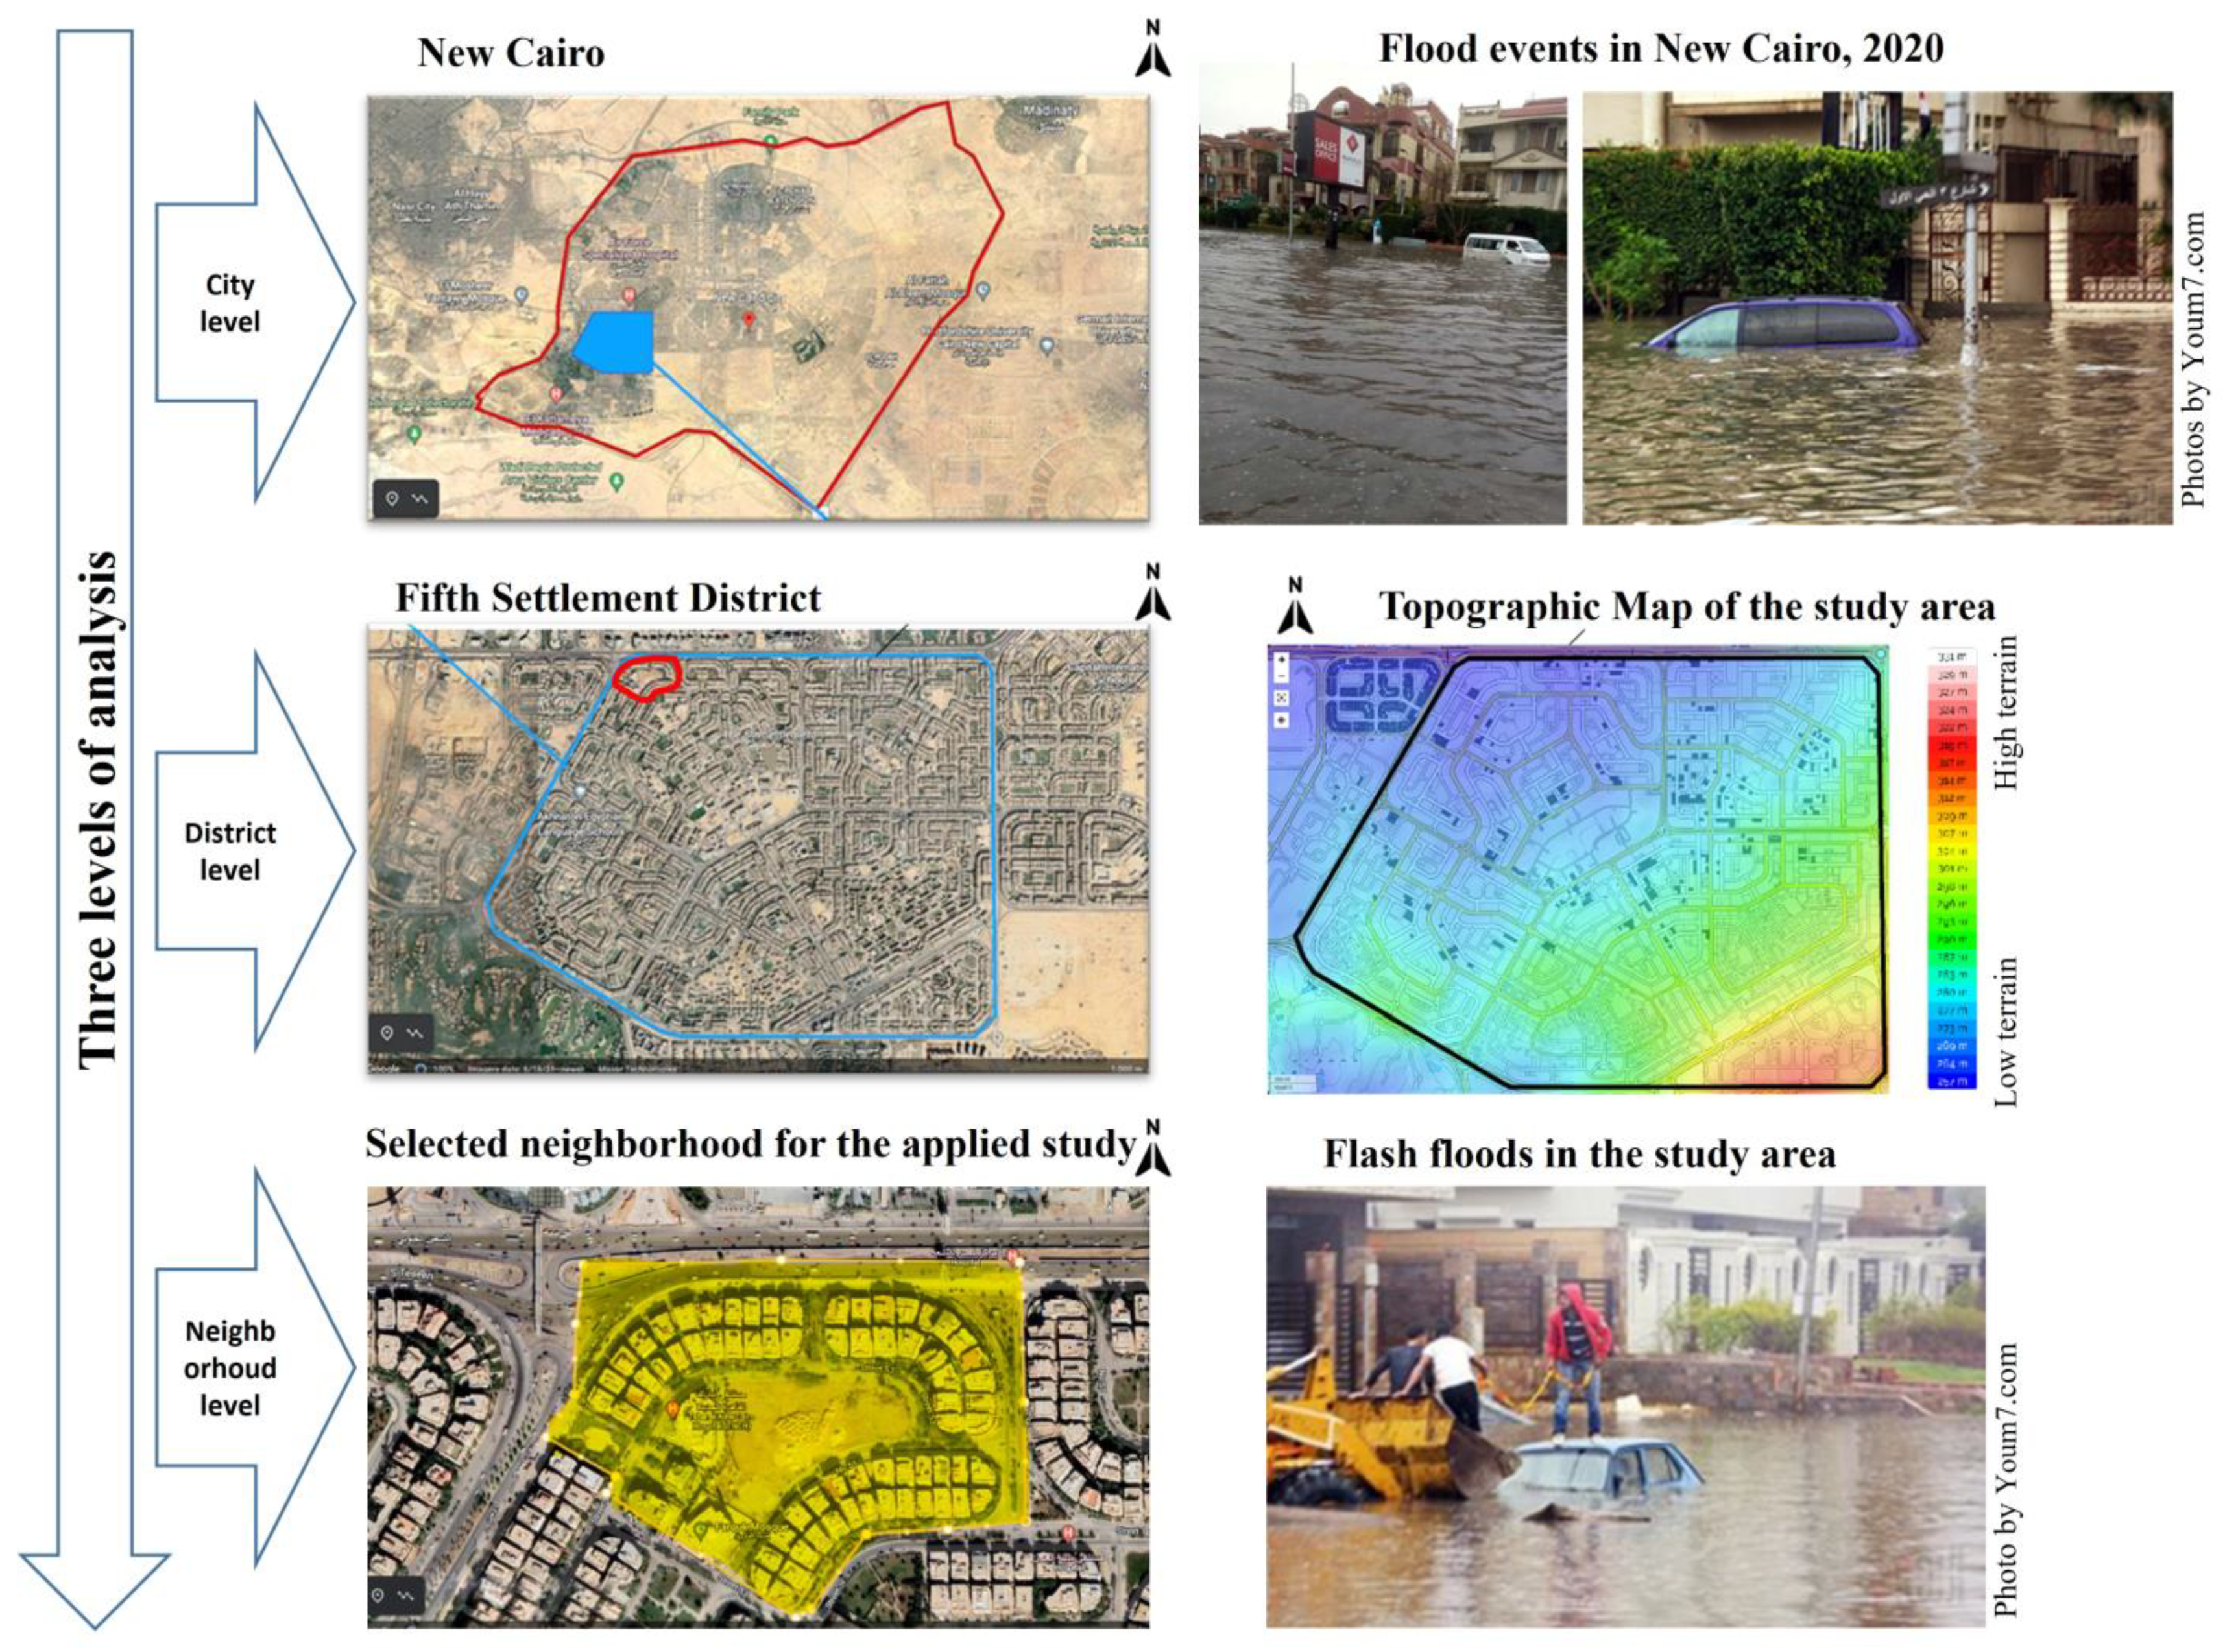
- Hazard risk assessment provided background and justification for the selected study area (South Teseen Street).
- (2)
- Select the best-fit NBSs based on a weighted-average sum matrix.
- (3)
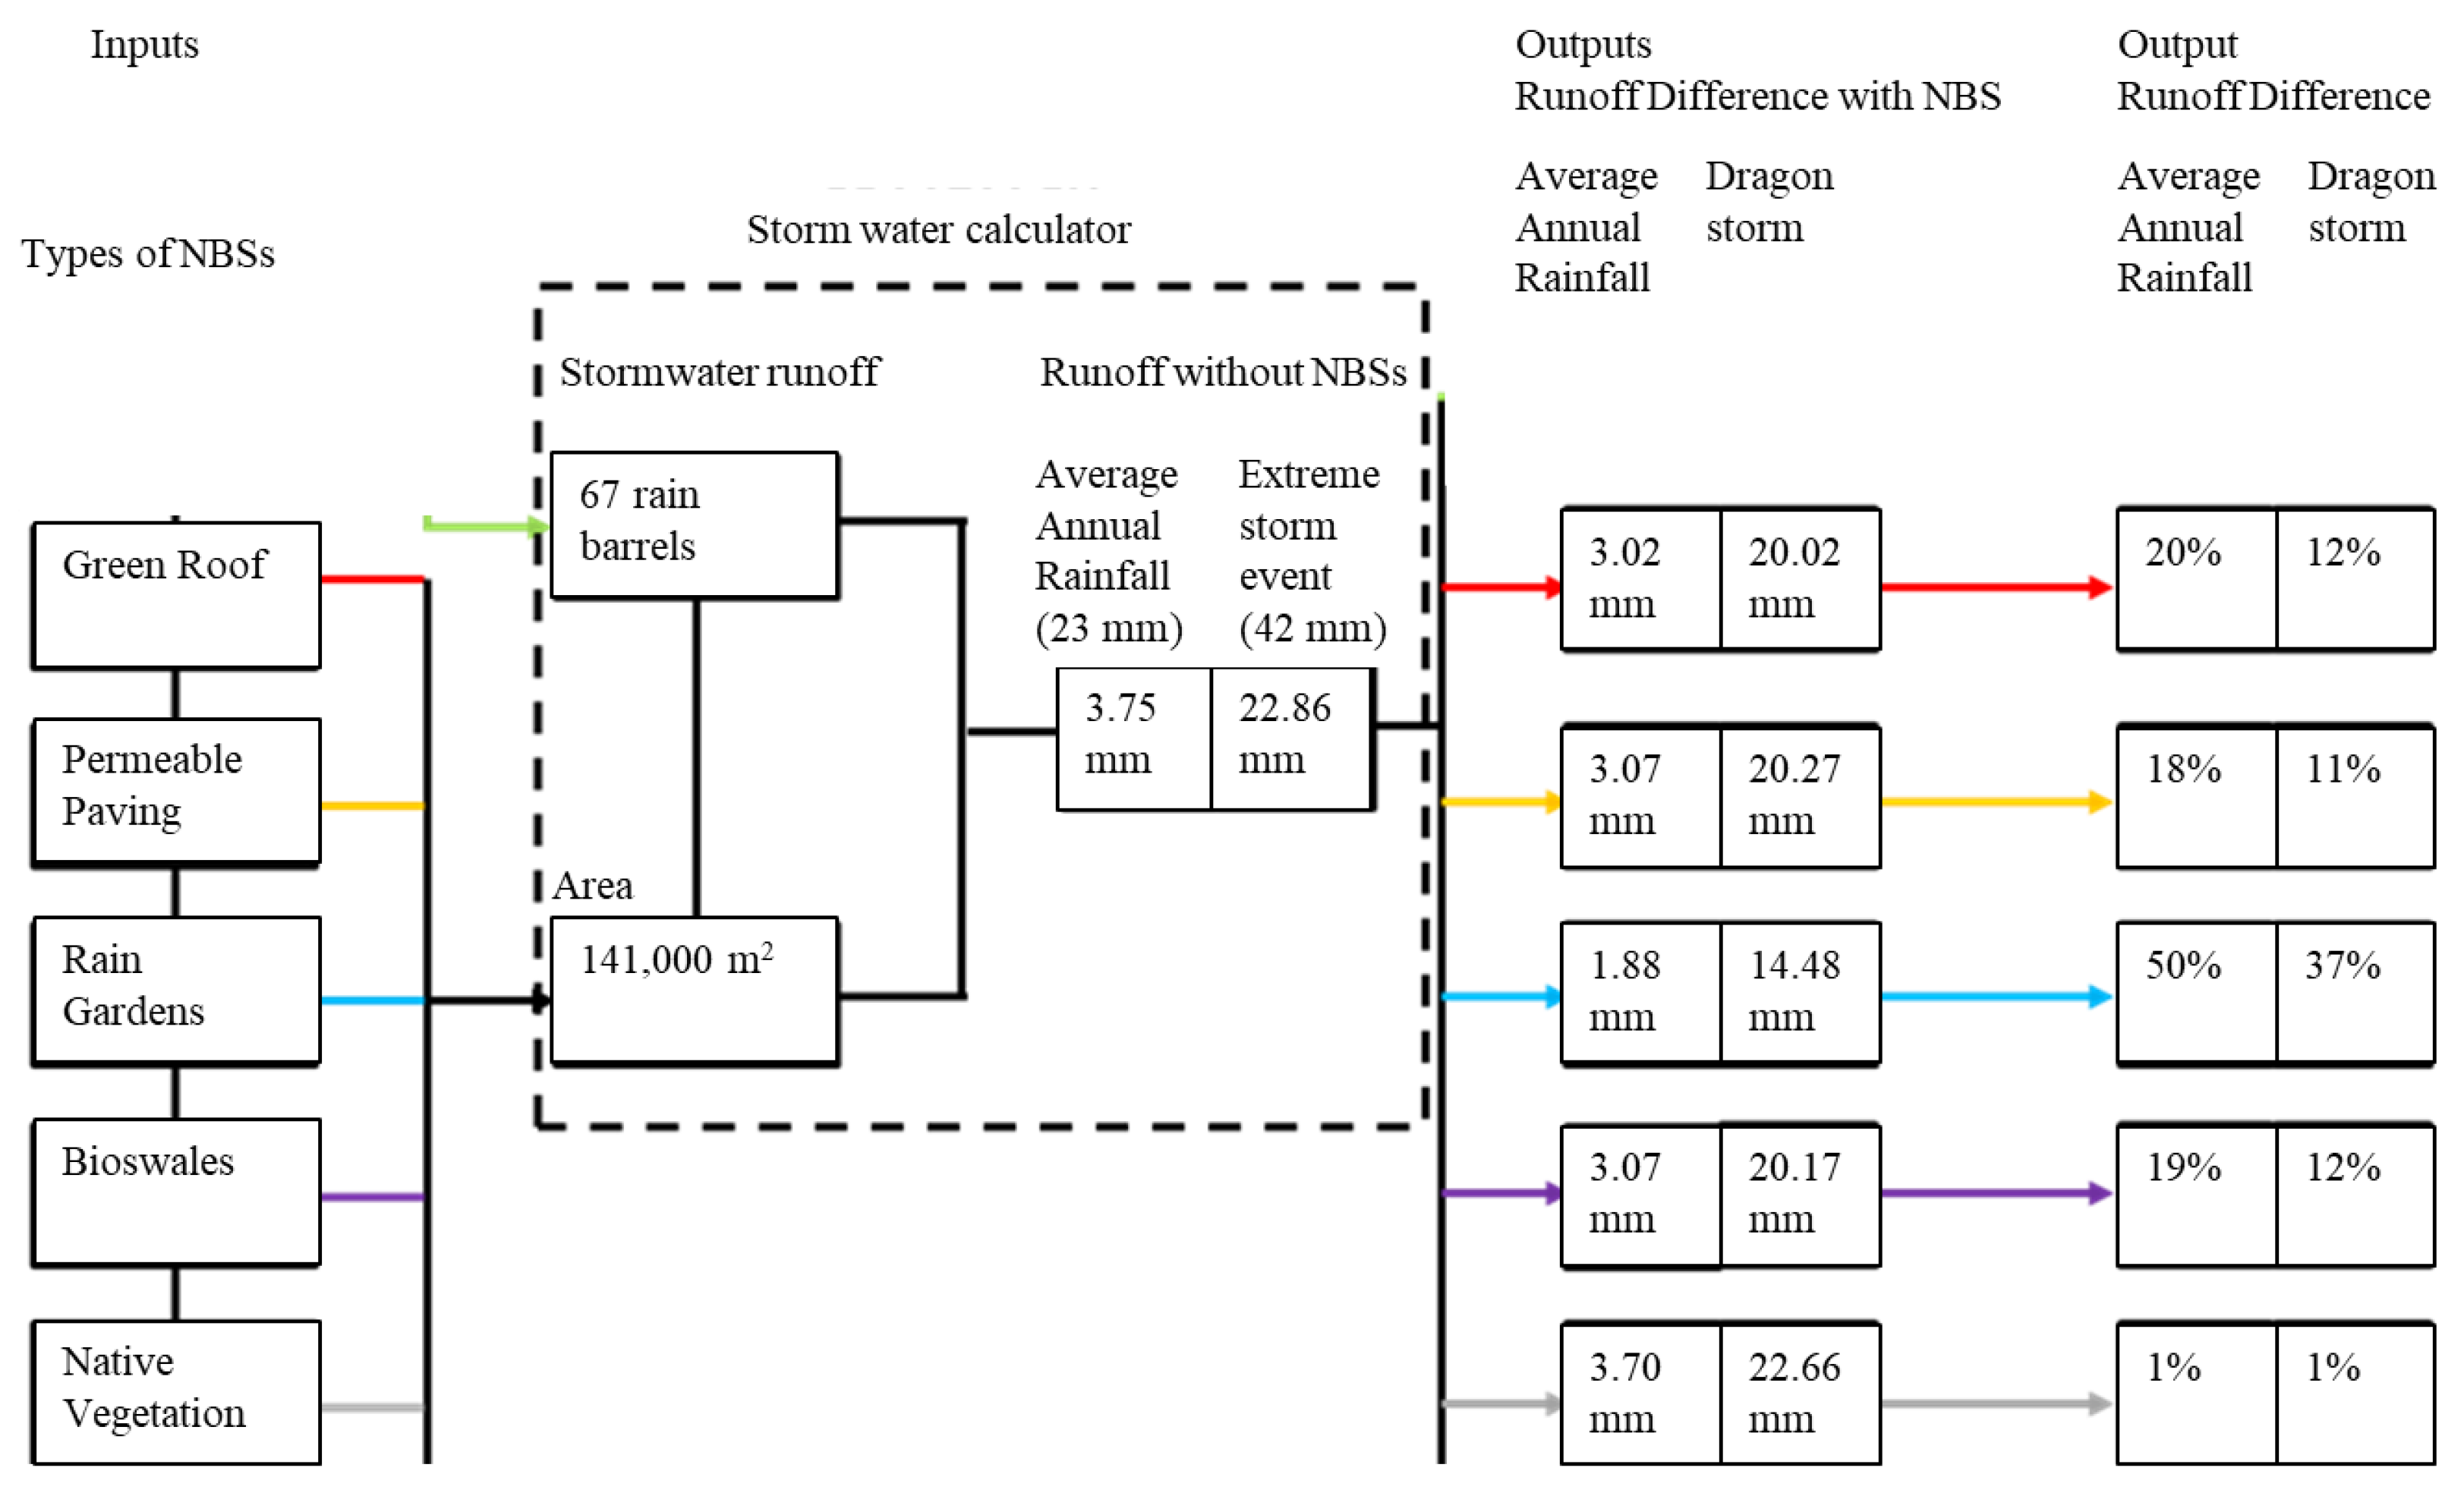
- Performance assessment was performed using an online stormwater calculator tool. This step tested and compared the performance of individual NBSs in the study area. Thus, five simulation models were developed, one for each type of selected NBS. Two more simulation models were carried out to compare the performance of the base case scenario (without implementing NBSs) to a proposed scenario (with all selected NBSs combined).

5.1. Hazard Risk Assessment
5.2. Selection of NBSs
5.3. Performance Assessment
6. Results
7. Discussion
7.1. Linking SDGs and National Development Strategies
7.2. Study Limitations
8. Conclusions
Author Contributions
Funding
Data Availability Statement
Conflicts of Interest
References
- Hebtezion, S. Overview of Linkages between Gender and Climate Change. In Gender and Climate Change; United Nations: New York, NY, USA, 2016; pp. 1–50. [Google Scholar]
- United Nations. World Economic Situation and Prospects 2018; United Nations: New York, NY, USA, 2018; ISBN 9789211091779. [Google Scholar]
- Pedro, J.; Silva, C.; Pinheiro, M.D. Scaling up LEED-ND Sustainability Assessment from the Neighborhood towards the City Scale with the Support of GIS Modeling: Lisbon Case Study. Sustain. Cities Soc. 2018, 41, 929–939. [Google Scholar] [CrossRef]
- Pachova, N. Regional Perspectives of Nature-Based Solutions for Water: Benefits and Challenges; Springer: Cham, Switzerland, 2022; Volume 1, ISBN 978-3-031-18411-6. [Google Scholar]
- Abdrabo, K.I.; Kantosh, S.A.; Saber, M.; Sumi, T.; Elleithy, D.; Habiba, O.M.; Alboshy, B. The Role of Urban Planning and Landscape Tools Concerning Flash Flood Risk Reduction Within Arid and Semiarid Regions; Springer: Singapore, 2022; ISBN 9789811629037. [Google Scholar]
- Stefanakis, A.; Oral, H.V.; Calheiros, C.; Carvalho, P. Nature-Based Solutions for Circular Management of Urban Water; Springer: Cham, Switzerland, 2024; ISBN 9783031507243. [Google Scholar]
- Buta, C.; Mihai, G.; Stănescu, M. Flood Risk Assessment Based on Flood Hazard and Vulnerability Indexes. Ovidius Univ. Ann. Constanta—Ser. Civ. Eng. 2020, 22, 127–137. [Google Scholar] [CrossRef]
- Abdrabo, K.I.; Kantoush, S.A.; Esmaiel, A.; Saber, M.; Sumi, T.; Almamari, M.; Elboshy, B.; Ghoniem, S. An Integrated Indicator-Based Approach for Constructing an Urban Flood Vulnerability Index as an Urban Decision-Making Tool Using the PCA and AHP Techniques: A Case Study of Alexandria, Egypt. Urban Clim. 2023, 48, 101426. [Google Scholar] [CrossRef]
- UNDP. Reducing Disaster Risk: A Challenge for Development—A Global Report; United Nations: New York, NY, USA, 2004; ISBN 9211261600. [Google Scholar]
- Balica, S.F.; Wright, N.G.; van der Meulen, F. A Flood Vulnerability Index for Coastal Cities and Its Use in Assessing Climate Change Impacts. Nat. Hazards 2012, 64, 73–105. [Google Scholar] [CrossRef]
- Ismaeel, W.S.E. Using SITES for Sustainable Rehabilitation of Cultural Heritage Landscape Areas; Case of Giza Zoo. In Advanced Technologies for Sustainable Systems; Springer: Cham, Switzerland, 2017; Volume 4, pp. 1–9. ISBN 978-3-319-48724-3. [Google Scholar]
- Abdelkareem, M.; Mansour, A.M. Risk Assessment and Management of Vulnerable Areas to Flash Flood Hazards in Arid Regions Using Remote Sensing and GIS-Based Knowledge-Driven Techniques. Nat. Hazards 2023, 117, 2269–2295. [Google Scholar] [CrossRef]
- Denjean, B.; Denjean, B.; Altamirano, M.A.; Graveline, N.; Giordano, R.; Van der Keur, P.; Moncoulon, D.; Weinberg, J.; Máñez Costa, M.; Kozinc, Z.; et al. Natural Assurance Scheme: A Level Playing Field Framework for Green-Grey Infrastructure Development. Environ. Res. 2017, 159, 24–38. [Google Scholar] [CrossRef]
- Wang, M.; Zhang, Y.; Zhang, D.; Zheng, Y.; Li, S.; Tan, S.K. Life-Cycle Cost Analysis and Resilience Consideration for Coupled Grey Infrastructure and Low-Impact Development Practices. Sustain. Cities Soc. 2021, 75, 103358. [Google Scholar] [CrossRef]
- Chen, W.; Wang, W.; Huang, G.; Wang, Z.; Lai, C.; Yang, Z. The Capacity of Grey Infrastructure in Urban Flood Management: A Comprehensive Analysis of Grey Infrastructure and the Green-Grey Approach. Int. J. Disaster Risk Reduct. 2021, 54, 102045. [Google Scholar] [CrossRef]
- Sowińska-Świerkosz, B.; García, J. What Are Nature-Based Solutions (NBS)? Setting Core Ideas for Concept Clarification. Nature-Based Solut. 2022, 2, 100009. [Google Scholar] [CrossRef]
- Liu, Y.; Engel, B.A.; Flanagan, D.C.; Gitau, M.W.; McMillan, S.K.; Chaubey, I. A Review on Effectiveness of Best Management Practices in Improving Hydrology and Water Quality: Needs and Opportunities. Sci. Total Environ. 2017, 601–602, 580–593. [Google Scholar] [CrossRef]
- Alves, A.; Vojinovic, Z.; Kapelan, Z.; Sanchez, A.; Gersonius, B. Exploring Trade-Offs among the Multiple Benefits of Green-Blue-Grey Infrastructure for Urban Flood Mitigation. Sci. Total Environ. 2020, 703, 134980. [Google Scholar] [CrossRef] [PubMed]
- Elmeligy, A.; Gaber, R.M.; Mostafa, H.; Mostafa, M. Assessment of Constructed Wetland Projects as a Multifunction Landscape: A Case Study in Egypt. Sustain. Environ. Res. 2023, 35, 1. [Google Scholar] [CrossRef]
- Mahmoud, S.; Ismaeel, W.S.E. Developing Sustainable Design Guidelines for Roof Design in a Hot Arid Climate. Archit. Sci. Rev. 2019, 62, 507–519. [Google Scholar] [CrossRef]
- Vineyard, D.; Ingwersen, W.W.; Hawkins, T.R.; Xue, X.; Demeke, B.; Shuster, W. Comparing Green and Grey Infrastructure Using Life Cycle Cost and Environmental Impact: A Rain Garden Case Study in Cincinnati, OH. J. Am. Water Resour. Assoc. 2015, 51, 1342–1360. [Google Scholar] [CrossRef]
- Dong, X.; Guo, H.; Zeng, S. Enhancing Future Resilience in Urban Drainage System: Green versus Grey Infrastructure. Water Res. 2017, 124, 280–289. [Google Scholar] [CrossRef]
- Muñoz, S.M.; Elliott, S.; Schoelynck, J.; Staes, J. Urban Stormwater Management Using Nature-Based Solutions: A Review and Conceptual Model of Floodable Parks. Land 2024, 13, 1858. [Google Scholar] [CrossRef]
- Seddon, N.; Smith, A.; Smith, P.; Key, I.; Chausson, A.; Girardin, C.; House, J.; Srivastava, S.; Turner, B. Getting the Message Right on Nature-Based Solutions to Climate Change. Glob. Chang. Biol. 2021, 27, 1518–1546. [Google Scholar] [CrossRef]
- Johnson, R.D.; Sample, D.J. A Semi-Distributed Model for Locating Stormwater Best Management Practices in Coastal Environments. Environ. Model. Softw. 2017, 91, 70–86. [Google Scholar] [CrossRef]
- Kumar, S. and Singh, K.K. Rain Garden Infiltration Rate Modeling Using Gradient Boosting Machine and Deep Learning Techniques. Water Sci. Technol. 2021, 84, 2366–2379. [Google Scholar] [CrossRef]
- Freni, G.; Liuzzo, L. Effectiveness of Rainwater Harvesting Systems for Flood Reduction in Residential Urban Areas. Water 2019, 11, 1389. [Google Scholar] [CrossRef]
- Kuruppu, U.; Rahman, A.; Rahman, M.A. Permeable Pavement as a Stormwater Best Management Practice: A Review and Discussion. Environ. Earth Sci. 2019, 78, 327. [Google Scholar] [CrossRef]
- Mendes, A.M.; Monteiro, C.M. and Santos, C. Green Roofs Hydrological Performance and Contribution to Urban Stormwater Management. Water Resour. Manag. 2025, 39, 1015–1031. [Google Scholar] [CrossRef]
- Kumar, S.; Guntu, R.K.; Agarwal, A.; Villuri, V.G.K.; Pasupuleti, S.; Kaushal, D.R.; Gosian, A.K. and Bronstert, A. Multi-Objective Optimization for Stormwater Management by Green-Roofs and Infiltration Trenches to Reduce Urban Flooding in Central Delhi. J. Hydrol. 2022, 606, 127455. [Google Scholar] [CrossRef]
- Deksissa, T. Urban Stormwater Runoff for Potable Use: Potential and Challenges. In Alternative Water Sources for Producing Potable Water; Springer: Cham, Switzerland, 2023; Volume 124. [Google Scholar]
- Shuster, W.D.; Darner, R.A.; Schifman, L.A.; Herrmann, D.L. Factors Contributing to the Hydrologic Effectiveness of a Rain Garden Network. Infrastructures 2017, 2, 11. [Google Scholar] [CrossRef]
- Lu, L.; Johnson, M.; Zhu, F.; Xu, Y.; Ruan, T.; Chan, F.K. Harnessing the Runoff Reduction Potential of Urban Bioswales as an Adaptation Response to Climate Change. Sci. Rep. 2024, 14, 12207. [Google Scholar] [CrossRef]
- Lin, J.; Uchiyama, S.; Bhattacharya, Y.; Nakamura, H. Efficacy of Rain Barrels and Rain Gardens to Reduce Urban Pluvial Flooding in Densely Built-up Residential Are-As. City Built Environ. 2023, 1, 19. [Google Scholar] [CrossRef]
- Kourtis, I.M.; Bellos, V.; Kopsiaftis, G.; Psiloglou, B.; Tsihrintzis, V.A. Methodology for Holistic Assessment of Grey-Green Flood Mitigation Measures for Climate Change Adaptation in Urban Basins. J. Hydrol. 2021, 603, 126885. [Google Scholar] [CrossRef]
- Monteiro, C.M.; Mendes, A.M. and Santos, C. Green Roofs as an Urban NbS Strategy for Rainwater Retention: Influencing Factors—A Review. Water 2023, 15, 2787. [Google Scholar] [CrossRef]
- Knapik, E.; Brandimarte, L.; Usher, M.D. Maintenance in Sustainable Stormwater Management: Issues, Barriers and Chal-Lenges. J. Environ. Plan. Manag. 2024, 1–27. [Google Scholar] [CrossRef]
- Tsai, H.Y.; Fan, C.; Liaw, C. Identifying the Layout of Retrofitted Rainwater Harvesting Systems with Passive Release for the Dual Purposes of Water Supply and Stormwater Management in Northern Taiwan. Water 2024, 16, 2894. [Google Scholar] [CrossRef]
- Gado, T.A.; El-Agha, D.E. Feasibility of Rainwater Harvesting for Sustainable Water Management in Urban Areas of Egypt. Environ. Sci. Pollut. Res. 2020, 27, 32304–32317. [Google Scholar] [CrossRef] [PubMed]
- Lee, E.; Seo, Y.; Woo, D.K. Enhanced Environmental and Economic Benefits of Green Roofs in a Humid Subtropical Region under Future Climate. Ecol. Eng. 2024, 201, 107221. [Google Scholar] [CrossRef]
- Zhang, X.; Liu, W.; Feng, Q.; Zeng, J. Multi-Objective Optimization of the Spatial Layout of Green Infrastructures with Cost-Effectiveness Analysis under Climate Change Scenarios. Sci. Total Environ. 2024, 948, 174851. [Google Scholar] [CrossRef] [PubMed]
- Mahmoud, S.H.; Gan, T.Y. Urbanization and Climate Change Implications in Flood Risk Management: Developing an Efficient Decision Support System for Flood Susceptibility Mapping. Sci. Total Environ. 2018, 636, 152–167. [Google Scholar] [CrossRef]
- Yazdi, J.; Salehi Neyshabouri, S.A.A. Identifying Low Impact Development Strategies for Flood Mitigation Using a Fuzzy-Probabilistic Approach. Environ. Model. Softw. 2014, 60, 31–44. [Google Scholar] [CrossRef]
- Ramadan, E.M.; Shahin, H.A.; Abd-Elhamid, H.F.; Zelenakova, M.; Eldeeb, H.M. Evaluation and Mitigation of Flash Flood Risks in Arid Regions: A Case Study of Wadi Sudr in Egypt. Water 2022, 14, 2945. [Google Scholar] [CrossRef]
- Elsayed, M.A.; Ismaeel, W.S.E. Environmental Assessment for Major Development Projects: A Case Study “Qattara Depression”. J. Clean. Prod. 2019, 215, 522–533. [Google Scholar] [CrossRef]
- Central Agency for Public Mobilization and Statistics (CAPMAS). Available online: https://www.capmas.gov.eg/# (accessed on 20 February 2025).
- The World Bank Group, 2021, CLIMATE RISK COUNTRY PROFILE. Available online: https://climateknowledgeportal.worldbank.org/sites/default/files/2021-04/15723-WB_Egypt%20Country%20Profile-WEB-2_0.pdf (accessed on 20 February 2025).
- Siksnelyte-Butkiene, I.; Streimikiene, D.; Balezentis, T.; Skulskis, V. A Systematic Literature Review of Multi-Criteria Decision-Making Methods for Sustainable Selection of Insulation Materials in Buildings. Sustainability 2021, 13, 737. [Google Scholar] [CrossRef]
- The Online Tool ‘Green Values Stormwater Management Calculator ‘ Developed in 2006 by the Center for Neighborhood Technology. Available online: https://cnt.org/tools/green-values-calculator (accessed on 20 February 2025).
- O’Hogain, S.; McCarton, L. A Technology Portfolio of Nature Based Solutions: Innovations in Water Management; Springer: Cham, Switzerland, 2018; ISBN 9783319732817. [Google Scholar]
- Schroll, E.; Lambrinos, J.; Righetti, T.; Sandrock, D. The Role of Vegetation in Regulating Stormwater Runoff from Green Roofs in a Winter Rainfall Climate. Ecol. Eng. 2011, 37, 595–600. [Google Scholar] [CrossRef]
- Nkwunonwo, U.C.; Whitworth, M.; Baily, B. A Review of the Current Status of Flood Modelling for Urban Flood Risk Management in the Developing Countries. Sci. Afr. 2020, 7, e00269. [Google Scholar] [CrossRef]
- Bohl, D.K.; Hanna, T.L.; Scott, A.C.; Moyer, J.D.; Hedden, S.G. Sustainble Development Goals Report Egypt 2030; Josef Korbel School of International Studies University of Denver: Denver, CO, USA, 2018. [Google Scholar]
- United Nations. The Sustainable Development Goals Report 2019; United Nations: New York, NY, USA, 2019. [Google Scholar]
- Abuzied, S.; Yuan, M.; Ibrahim, S.; Kaiser, M.; Saleem, T. Geospatial Risk Assessment of Flash Floods in Nuweiba Area, Egypt. J. Arid Environ. 2016, 133, 54–72. [Google Scholar] [CrossRef]
- Chandrappa, R.; Gupta, S.; Kulshrestha, U.C. Hazard and Risk Assessment. In Coping with Climate Change; Springer: Berlin/Heidelberg, Germany, 2011; pp. 201–212. [Google Scholar] [CrossRef]
- Ismaeel, W.S.E.; Lotfy, R.A.E.R. An Integrated Building Information Modelling-Based Environmental Impact Assessment Framework. Clean Technol. Environ. Policy 2022, 25, 1291–1307. [Google Scholar] [CrossRef]
- Ismaeel, W.S.E.; Elsayed, M.A. The Interplay of Environmental Assessment Methods; Characterising the Institutional Background in Egypt. J. Environ. Assess. Policy Manag. 2018, 20, 1850003. [Google Scholar] [CrossRef]


| Feature | Rain Garden | Rain Barrel | Permeable Pavement | Green Roof | Infiltration Trench | Bioswale |
|---|---|---|---|---|---|---|
| Infiltration | Moderate 1—limited by dry soil conditions and low rainfall [26] | None—water is stored, not infiltrated [27] | Moderate 1—effective if designed for local soil and climate [28] | Low—limited by shallow soil depth and high evaporation rates [29] | Moderate 1—depends on soil permeability and water availability [30] | Low 2—limited by low rainfall and high evaporation rate [31] |
| Retention | Low 2 to moderate—limited by high evaporation and infrequent rainfall [32] | High—ideal for storing scarce rainwater for reuse, e.g., for irrigation [27] | Low [28] | Moderate—can retain some water but is limited by evaporation [29] | Low [30] | Low—primarily for conveyance [33] |
| Detention | Low 2 to moderate—limited effectiveness due to infrequent storms [32] | None—does not detain water but stores it [27] | Moderate [28] | Low 2—limited by shallow soil and high evaporation rate [29] | Moderate1 [30] | Moderate 1 [33] |
| Primary Purpose | Manage Stormwater runoff, groundwater recharge, and pollutant removal [26] | Water storage for reuse [34] | Stormwater infiltration and reducing runoff [35] | Stormwater retention, insulation, and urban heat island mitigation [36] | Stormwater infiltration and groundwater recharge [30] | Stormwater conveyance, filtration, slowing runoff, and groundwater recharge [33] |
| Best Use Case | Rooftops, parking areas, driveways, and sidewalks [34] | Rooftops and parking lots [34] | Driveways, parking lots, and walkways [35] | Rooftops [36] | Areas with occasional heavy rainfall and permeable soils [30] | Roadside drainage in areas with occasional storms [33] |
| Maintenance | Moderate—requires irrigation during dry periods and soil maintenance [37] | Low—requires occasional cleaning and winterization [38] | Moderate—needs periodic cleaning to prevent clogging [35] | High—requires irrigation, weeding, and structural maintenance [37] | Moderate—needs sediment removal and inspection [37] | Moderate—requires vegetation management and sediment removal [33] |
| Cost | Low to moderate—depends on size and design [37] | Low [38] | Moderate to high—higher initial cost for materials and installation [35] | High—expensive due to structural and planting requirements [37] | Moderate—costs depend on depth and materials used [37] | Moderate—costs depend on size, vegetation, and engineering specifications [33] |
| Suitability in Hot Arid Regions | Moderate—limited by low rainfall and high evaporation, but useful for occasional storms [39] | Moderate1—useful for capturing and storing scarce rainwater but limited by low rainfall and high evaporation rate [39] | Moderate—useful for reducing runoff during rare storms but limited by high temperatures [35] | Low to moderate due to high maintenance and water requirements [30] | Low 2—useful for infiltrating occasional heavy rainfall but limited by dry soil conditions [30] | Low—limited by low rainfall and high evaporation but useful for managing occasional runoff [5,39] |
| Responding to Climate Change Projections | Moderate [39] | Low [39] | Moderate [35] | Moderate [40] | Moderate [41] | Moderate [41] |
| High flood depth zones (>1 m) | Medium flood depth zones (0.5–1 m) | Low flood depth zones (<0.5 m) | |
| Flood Hazard Analysis | 65% of the buildings face high flood risk | 25% of the buildings face medium flood risk | 10% of the buildings face low flood risk |
| Exposure Assessment | 40% of the buildings are highly exposed to flood risk | 40% of the buildings are moderately exposed to flood risk | 20% of the buildings are slightly exposed to flood risk |
| Vulnerability Assessment | 40% of buildings are highly vulnerable | 50% of buildings are moderately vulnerable | 10% of buildings are slightly vulnerable |
| Flood Risk Calculation: Risk = Hazard × Vulnerability × Exposure [9] | 2080 buildings | 1000 buildings | 40 buildings |
| Total buildings at risk = 2080 (high risk) +1000 (medium risk) +40 (low risk) = 3120 buildings | |||
| Interpretations |
| ||
| Suitability in Hot Arid Zones | Applicability in Dense Urban Areas | Infiltration Capacity | Retention Capacity | Detention Capacity | Cost Effectiveness | Ease of Implementation | Maintenance Requirements | Responding to Climate Change Projections | Average | |
|---|---|---|---|---|---|---|---|---|---|---|
| Green roofs | 2 | 3 | 1 | 2 | 1 | 1 | 1 | 1 | 2 | 2 |
| Rain gardens | 2 | 2 | 2 | 1 | 1 | 3 | 2 | 2 | 2 | 2 |
| Permeable paving | 2 | 2 | 2 | 1 | 2 | 2 | 2 | 2 | 1 | 2 |
| Bioswales | 1 | 1 | 1 | 1 | 2 | 2 | 2 | 2 | 2 | 2 |
| Native vegetation | 3 | 2 | 2 | 1 | 1 | 3 | 3 | 3 | 2 | 2 |
| Infiltration trenches | 1 | 1 | 2 | 1 | 2 | 2 | 1 | 2 | 2 | 2 |
| Rain barrels | 1 | 1 | 0 | 3 | 0 | 2 | 1 | 3 | 2 | 1 |
| Wetlands | 1 | 1 | 2 | 1 | 1 | 2 | 1 | 2 | 2 | 1 |
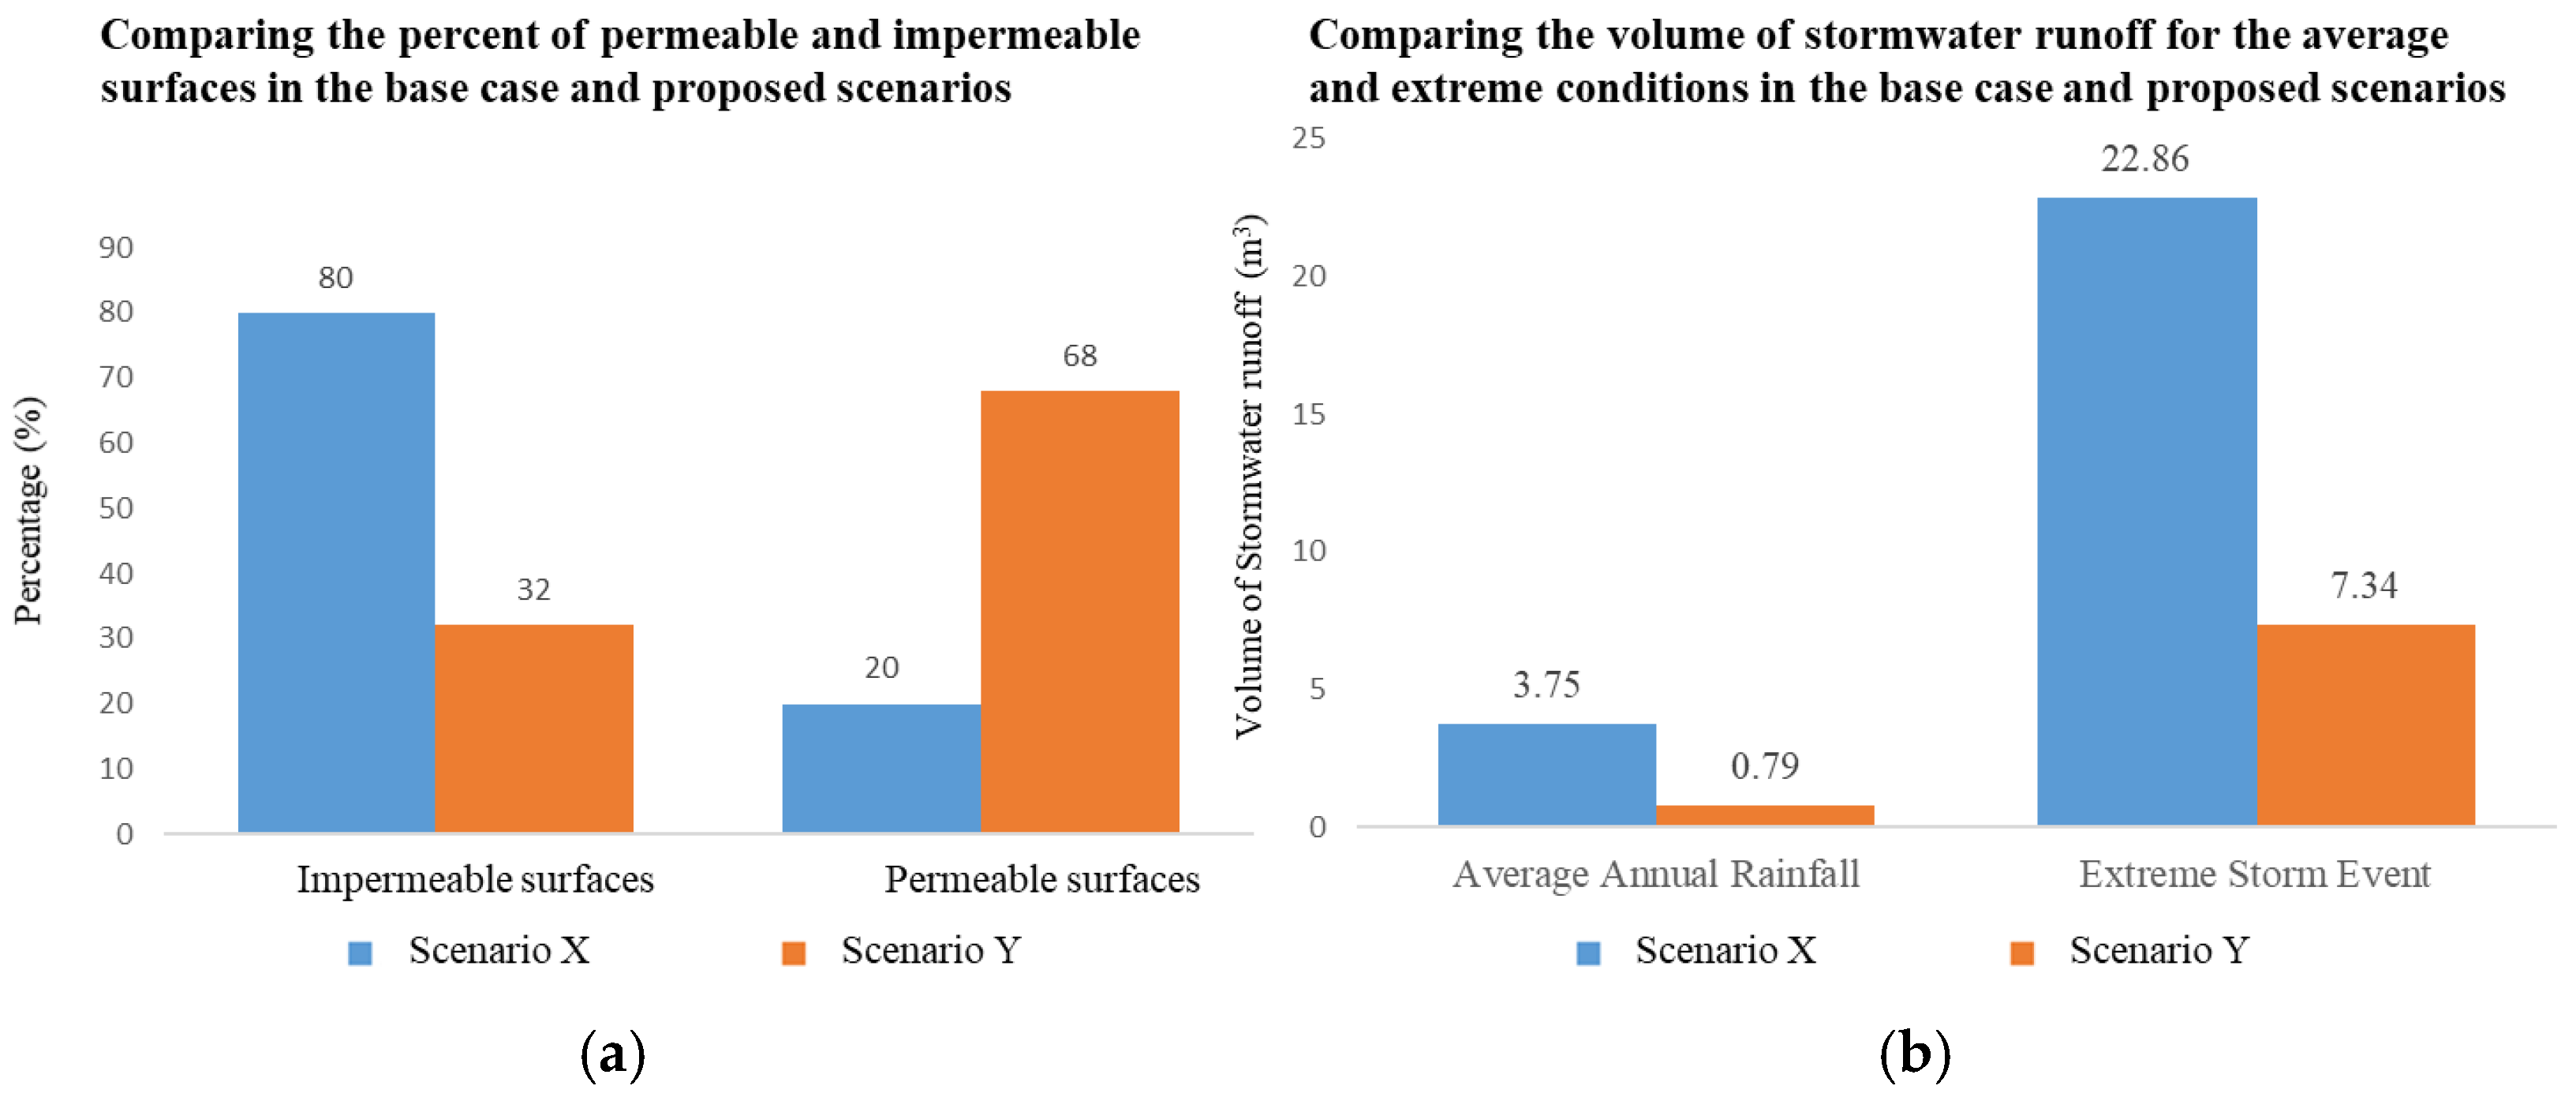
| Base Case Scenario (X): No NBSs | Proposed Scenario (Y): Combinations of NBSs Implemented | Volume Captured by NBSs | |||
|---|---|---|---|---|---|
| Land use area | m2 | % | m2 | % | m3 |
| Total lot area | 141,055 | 100 | |||
| Impermeable areas: | |||||
| Flat roofs | 25,354 | 18 | 12,677 | 9 | |
| Sidewalks | 24,088 | 17 | 16,380 | 12 | |
| Parking lots | 1902 | 1 | 1902 | 1 | |
| Driveways | 14,248 | 10 | 14,248 | 10 | |
| Streets | 41,451 | 29 | 0 | 0 | |
| Total impermeable surface areas | 107,043 | 76 | 45,207 | 32 | |
| Pervious areas: | |||||
| Lawn/turf | 1290 | 1 | 1290 | 1 | |
| Shrubs and bushes | 18,391 | 13 | 18,391 | 13 | |
| Undeveloped land | 14,331 | 10 | 0 | 0 | |
| Proposed NBSs: | |||||
| Native vegetation | 0 | 0 | 14,331 | 10 | 1019 |
| Green roof | 0 | 0 | 12,677 | 9 | 741 |
| Rain garden | 0 | 0 | 7708 | 6 | 1984 |
| Permeable paving | 0 | 0 | 41,244 | 29 | 2619 |
| Bioswales | 0 | 0 | 207 | 0.15 | 27 |
| Total permeable surface area | 34,012 | 24 | 95,848 | 68 | |
| Total NBS area | 0 | 0 | 76,167 | 54 | 6390 |
| Base Case Scenario (X) (mm) | Proposed Scenario (Y) (mm) | Difference | |
|---|---|---|---|
| Average annual rainfall | 23 mm | ||
| Runoff (mm) | 3.75 mm | 0.79 mm | 79% |
| Runoff volume (m3) | 530.65 | 111.62 | 419.04 |
| Storm event rainfall | 42 mm | ||
| Runoff (mm) | 22.86 | 7.34 | 68% |
| Runoff volume (m3) | 3224.26 | 1034.17 | 2190.09 |
Disclaimer/Publisher’s Note: The statements, opinions and data contained in all publications are solely those of the individual author(s) and contributor(s) and not of MDPI and/or the editor(s). MDPI and/or the editor(s) disclaim responsibility for any injury to people or property resulting from any ideas, methods, instructions or products referred to in the content. |
© 2025 by the authors. Licensee MDPI, Basel, Switzerland. This article is an open access article distributed under the terms and conditions of the Creative Commons Attribution (CC BY) license (https://creativecommons.org/licenses/by/4.0/).
Share and Cite
Ismaeel, W.S.E.; Mustafa, N.A. Practical Steps for Urban Flood Risk Mitigation Using Nature-Based Solutions—A Case Study in New Cairo, Egypt. Land 2025, 14, 586. https://doi.org/10.3390/land14030586
Ismaeel WSE, Mustafa NA. Practical Steps for Urban Flood Risk Mitigation Using Nature-Based Solutions—A Case Study in New Cairo, Egypt. Land. 2025; 14(3):586. https://doi.org/10.3390/land14030586
Chicago/Turabian StyleIsmaeel, Walaa S. E., and Nada Ali Mustafa. 2025. "Practical Steps for Urban Flood Risk Mitigation Using Nature-Based Solutions—A Case Study in New Cairo, Egypt" Land 14, no. 3: 586. https://doi.org/10.3390/land14030586
APA StyleIsmaeel, W. S. E., & Mustafa, N. A. (2025). Practical Steps for Urban Flood Risk Mitigation Using Nature-Based Solutions—A Case Study in New Cairo, Egypt. Land, 14(3), 586. https://doi.org/10.3390/land14030586