Article

Predicting Suitable Spatial Distribution Areas for Urban Trees Under Climate Change Scenarios Using Species Distribution Models: A Case Study of Michelia chapensis

School of Landscape Architecture and Architecture, Zhejiang Agriculture and Forestry University, Linan, Hangzhou 311300, China
*
Authors to whom correspondence should be addressed.
Land 2025, 14(3), 638; https://doi.org/10.3390/land14030638
Submission received: 31 January 2025 / Revised: 6 March 2025 / Accepted: 13 March 2025 / Published: 18 March 2025
(This article belongs to the Special Issue Urban Forestry Dynamics: Management and Mechanization)

Abstract

:
Climate change has presented considerable challenges in the management of urban forests and trees. Varieties of studies have predicted the potential changes in species distribution by employing single-algorithm species distribution models (SDMs) to investigate the impacts of climate change on plant species. However, there is still limited quantitative research on the impacts of climate change on the suitable distribution ranges of commonly used urban tree species. Therefore, our study aims to optimize traditional SDMs by integrating multiple machine learning algorithms and to propose a framework for identifying suitable distribution ranges of urban trees under climate change. We took Michelia chapensis, a tree species of particular significance in southern China, as a pilot tree species to investigate the evolution of its suitable distribution range in the context of two future climate scenarios (SSP126 and SSP585) across four periods (2030s, 2050s, 2070s, and 2090s). The findings indicated that the ensemble SDM showed strong predictive capacity, with an area under the curve (AUC) value of 0.95. The suitable area for Michelia chapensis is estimated at 15.9 × 10⁵ km2 currently and it will expand in most areas under future climate scenarios according to the projection. However, it will contract in southeastern Yunnan, central Guangdong, the Sichuan Basin, northern Hubei, and Jiangxi, etc. The central location of the current suitable distribution area is located in Hengyang, Hunan (27.36° N, 112.34° E), and is projected to shift westward with climate change in the future. The migration magnitude is positively correlated with the intensity of climate change. These findings provide a scientific basis for the future landscape planning and management of Michelia chapensis. Furthermore, the proposed framework can be seen as a valuable tool for predicting the suitable distribution ranges of urban trees in response to climate change, providing insights for proactive adaptation to climate change in urban planning and landscape management.

1. Introduction

Climate change stands as one of the most urgent and complex global challenges of the 21st century, with impacts across natural ecosystems, human health, and urban environments [1]. The Sixth Assessment Report (AR6) of the Intergovernmental Panel on Climate Change (IPCC) indicates that global warming is expected to continue [2], with studies further showing that global temperatures in 2020 were 1.7 ± 0.1 °C higher than pre-industrial levels [3]. The consequences of climate change, typified by shifts in temperature and precipitation, are anticipated to present more challenges than opportunities for urban vegetation [4]. Urban vegetation, a significant component of urban green infrastructure, supports urban ecosystem services significantly [4], including carbon sequestration and oxygen release [5], microclimate regulation [6], air pollution mitigation [7,8], and the enhancement of residents’ physical and mental well-being [9]. Furthermore, the provision of these services is contingent on the health and growth of urban trees [10,11]. Many factors influence the health and growth of plants, including climate, elevation, soil, and human impact. However, among them, climate is the most significant [12,13]. Climate change is one of the primary drivers altering the geographical distribution of plants, particularly as global warming and changes in precipitation patterns are expected to cause significant shifts in the growth, phenology, and distribution of many plant species [14,15,16,17].
Recent studies from various locations indicate that plant distribution ranges will change due to climate change. These changes include both positive and negative impacts, with the latter being more pronounced [18]. In southern Eurasia, research based on the single-model Maxent approach has found that the distributions of economically and ecologically valuable species such as Acer mazandaranicum, beech, oak, and maple are projected to undergo a substantial decline [19,20,21,22], while the invasive plant giant hogweed (Heracleum mantegazzianum) is expected to expand into Northern Europe [23]. In the eastern United States, habitat gains are predicted for over 100 tree species [24]. Maphanga et al. simulated bush encroachment species distribution across protected and communal Lowveld savannas in South Africa, revealing variations among individual predictive models. The ensemble approach effectively reduced spatial uncertainty in forecasting invasive species spread [25]. In East Asia, Kim et al. projected that some evergreen broadleaf trees will shift northward under climate change scenarios [26]. On contrary, a study in Tianjin demonstrated two endemic Chinese evergreen broadleaf oak species have not migrated to higher latitudes as most research expected [27,28]. Overall, research in Europe, the Americas, and Asia has extensively focused on invasive plant species and rare plants, with findings exhibiting strong regional dependencies. However, studies exploring the species distribution of urban trees remain relatively limited, and a consensus-driven framework to provide generalizable guidance for urban tree management and planning remains absent.
The results of the above-mentioned studies are based on the use of species distribution models (SDMs) to predict species distribution ranges. SDMs are widely used to predict species ranges, explore ecological hypotheses [29,30], assess invasive species trends [31,32], evaluate climate change impacts on species and communities [33,34,35], and identify conservation priorities [36,37]. SDMs provide a robust framework for addressing climate change challenges, supporting conservation efforts, and mitigating potential ecological and economic losses [38,39,40]. However, SDM predictions vary depending on modeling methods [41]. Ensemble models enhance prediction reliability by distinguishing “true signals” from “uncertainty noise” in individual models [41,42], and have demonstrated superior performance over single models in machine learning applications [43,44], thereby showing greater stability. Based on the use of multiple models, Liu Xiaochang et al. constructed ensemble learning models using Monte Carlo Simulation (MCS) to quantify and analyze complex nonlinear problems involving multiple driving factors in urban contexts [45,46]. This approach enhances computational efficiency and the reliability of predictions. However, due to differences in ensemble strategies, focusing on homogeneous model integration often overlooks the contribution of heterogeneous model diversity in reducing bias.
Therefore, this study revises the methodological framework for developing single-model algorithms with multivariate data by expanding the species distribution database and selecting eight widely used model algorithms to construct ensemble models (see Figure 1). Furthermore, we selected Michelia chapensis, one of the dominant species in the climax community of subtropical evergreen broad-leaved forests, as a pilot tree species to address three scientific questions: (1)What are dominant variables influencing the distribution of Michelia chapensis? (2) How effectively can machine learning predict suitable areas for Michelia chapensis under current climatic conditions? (3) What is the potential distribution of Michelia chapensis shift under future climate scenarios? The findings of this study will provide a significant theoretical foundation for the conservation and sustainable management of urban landscape tree species under climate change conditions, thereby facilitating the development of future management and conservation strategies for urban trees.

2. Materials and Methods

2.1. Significance of Michelia chapensis

Michelia chapensis (see Figure 2), a spring-flowering tree species of the Magnoliaceae family, is highly valued as one of the dominant foundation species in subtropical evergreen broad-leaved forests. Due to its fast-growing trait, abundant sesquiterpenoid compounds, graceful form and fragrant flowers, it exhibits significant ecological, economic, and ornamental value [47,48]. These characteristics have led to its widespread application in ecological afforestation, timber and chemical industries, and landscape architecture. It has also received policy support from national and local authorities, including China’s National Forestry and Grassland Administration, the Guizhou Forestry Department, and city environmental agencies [49,50,51,52]. The species is naturally distributed across multiple regions in China, including Fujian, Guangdong, Guangxi, Guizhou, Hunan, Hubei, Jiangxi, Yunnan, and Tibet [53,54,55]. However, the increasing anthropogenic disturbances and habitat degradation have led to a decline in wild populations, resulting in its classification as a near-threatened (NT) species by the IUCN [56]. The increasing recognition of Michelia chapensis has led to its extensive utilization in East China, South China, and Southwest China. However, in recent years, concerns have emerged concerning its artificial introduction and cultivation, including suboptimal adaptation to new environments, inadequate growth conditions, disorderly resource exploitation, insufficient maintenance and management, and the frequent replacement of seedlings. These issues may be attributed to a number of factors, including a lack of comprehensive scientific predictions of its distribution, an insufficient understanding of its ecological and geographical distribution and dominant influencing factors, and a limited knowledge of its adaptability to local climatic conditions.

2.2. Distribution Data

We compiled data on species distributions provided by Global Biodiversity Information Facility (GBIF, 2023) [57], the Chinese Virtual Herbarium (CVH, 2024) [58], the Flora of China—iPlant Species Information System (iPlant.cn, 2023), and field observations. Additionally, this study innovatively incorporated citizen science data from Sina Weibo (weibo.com, 2023) and rigorously filtered the records according to the workflow for constructing species distribution databases using social media data (see Figure S1). This pioneering approach enabled the construction of a comprehensive dataset documenting both wild and cultivated populations of Michelia chapensis across southern China. Subsequent analyses were based on distribution data with precise longitude and latitude coordinates. For records lacking accurate geographic coordinates, the Amap Open Platform was utilized to retrieve map API information [59], thereby transforming textual records into three-dimensional coordinate data. Following the removal of redundant or suspicious data, the database comprised 503 distribution records across mainland China. Due to variations in mapping methodologies and precision between vegetation surveys and citizen science data, the spatial coverage of the data is uneven [23,59]. In order to ensure data consistency and comparability, all observational data were standardized to the WGS1984 coordinate system. A 0.25° grid was applied, and random resampling was conducted (i.e., selecting only one observation point per grid from the distribution data) to mitigate the effects of uneven sampling intensity and maintain uniform data point density [60]. Following resampling, a total of 256 observations were retained for the construction of SDMs (see Figure 3). The study area was delineated by establishing a 500 km buffer zone [23].

2.3. Climate Data

In order to obtain current climate data, bioclimatic variables were obtained from the World-Clim—Global Climate Database (v2.1; worldclim.org, accessed on 3 January 2024) [62]. A dataset comprising 19 bioclimatic variables (at 2.5 min resolution) was downloaded from the WorldClim 2.1 database. These variables are derived from monthly temperature and precipitation records and are widely used in SDM. The Pearson correlation coefficient was calculated for all bioclimatic variables based on the values observed, and variables with strong correlations (|r| ≥ 0.7) were excluded to reduce redundancy. The variance inflation factor (VIF) was computed using the “vif” function in the R package “car” to assess the impact of multicollinearity [63]. This step ensured the selection of variables with low multicollinearity (i.e., low inter-variable correlation and stable regression coefficients) [64]. The selection of bioclimatic variables for the development of the Michelia chapensis distribution model was informed by the identification of those with the highest explanatory power. These variables include annual mean temperature (Bio1), iso-thermality (Bio3), temperature annual range (Bio7), the mean temperature of the wettest quarter (Bio8), the precipitation of driest month (Bio14), and precipitation seasonality (Bio15).
The future climate data were based on the Shared Socioeconomic Pathways (SSPs) provided by the Intergovernmental Panel on Climate Change (IPCC) Sixth Assessment Report (AR6) [65], which updated the Representative Concentration Pathways (RCPs) taken from the IPCC Fifth Assessment Report (IPCC AR5) [66]. Data from the Beijing Climate Center Climate System Model (BCC-CSM2-MR) [67], a Global Circulation Model (GCM) better suited to China’s climatic conditions, were used as future climate data to predict the potential suitable areas of Michelia chapensis. The model demonstrates the best performance in reproducing anomalous precipitation patterns in eastern China, with the highest spatial correlation coefficient [68]. Predictions were made for two future climate scenarios, an optimistic scenario (SSP126) and a pessimistic scenario (SSP585), focusing on four timeframes: 2021–2040 (the 2030s); 2041–2060 (the 2050s); 2061–2080 (the 2070s); and 2081–2100 (the 2090s). The SSP126 scenario reflects sustainable development, representing the most optimistic scenario corresponding to RCP2.6 in the Fifth Assessment Report, while the SSP585 scenario is based on a “business-as-usual” fossil fuel development pathway, corresponding to RCP8.5. For each SSP and timeframe, a resolution of 2.5 min was selected for prediction, consistent with the species distribution data.

2.4. Constructing Species Distribution Models

The Biomod2 package [69] was selected as the platform for ensemble modeling, as Biomod2 is one of the most well known and widely applied integrated software tools in SDM [30]. Utilizing R (version 4.4.0) and Biomod2 (version 4.2-4), an ensemble model was constructed by incorporating eight widely used SDM algorithms, including the Generalized Linear Model (GLM), the Generalized Boosted Model (GBM), the Generalized Additive Model (GAM), Classification Tree Analysis (CTA), the Artificial Neural Network (ANN), Multivariate Adaptive Regression Splines (MARSs), Random Forest (RF), and the Maximum Entropy Model (MAXENT) [70]. These algorithms were employed for the purpose of predicting the climatically suitable spatial distribution of Michelia chapensis under climate change scenarios. The default parameters were applied to all models, with 80% of the distribution data being utilized for model training and the remaining 20% reserved for model validation. In order to reduce spatial bias and better simulate the actual distribution [71], 800 pseudo-absence points were randomly generated five times, and the models were run five times, resulting in a total of 200 SDMs. The performance of the models was evaluated based on the Area Under the Receiver Operating Characteristic Curve (AUC), the True Skill Statistic (TSS) [72], and KAPPA statistics [73].

2.5. Model Visualization

The weights assigned to each model were determined using proportionality, with higher TSS values corresponding to greater weights in the construction of the ensemble model [72]. The projection results of the ensemble models for each period were then used to generate suitable area distribution maps for Michelia chapensis. The binary classification threshold for area suitability was determined using the TSS maximization principle, where grid values above the threshold were assigned a value of 1 (suitable) and those below it were assigned a value of 0 (unsuitable). The distribution maps obtained from the modeling were then used to calculate the suitability index, which was classified into four categories using the equal interval method: non-suitable areas (0–0.25), low-suitability areas (0.25–0.50), moderately suitable areas (0.50–0.75), and highly suitable areas (0.75–1.00) [18,26]. The “temp_myBiomodRangeSize” function in the Biomod2 package was employed to calculate the stable, expanded, and contracted regions, as well as the centroid positions of Michelia chapensis for each period. Subsequent to this, ecological niche overlap maps and centroid migration trajectories were plotted.

3. Results

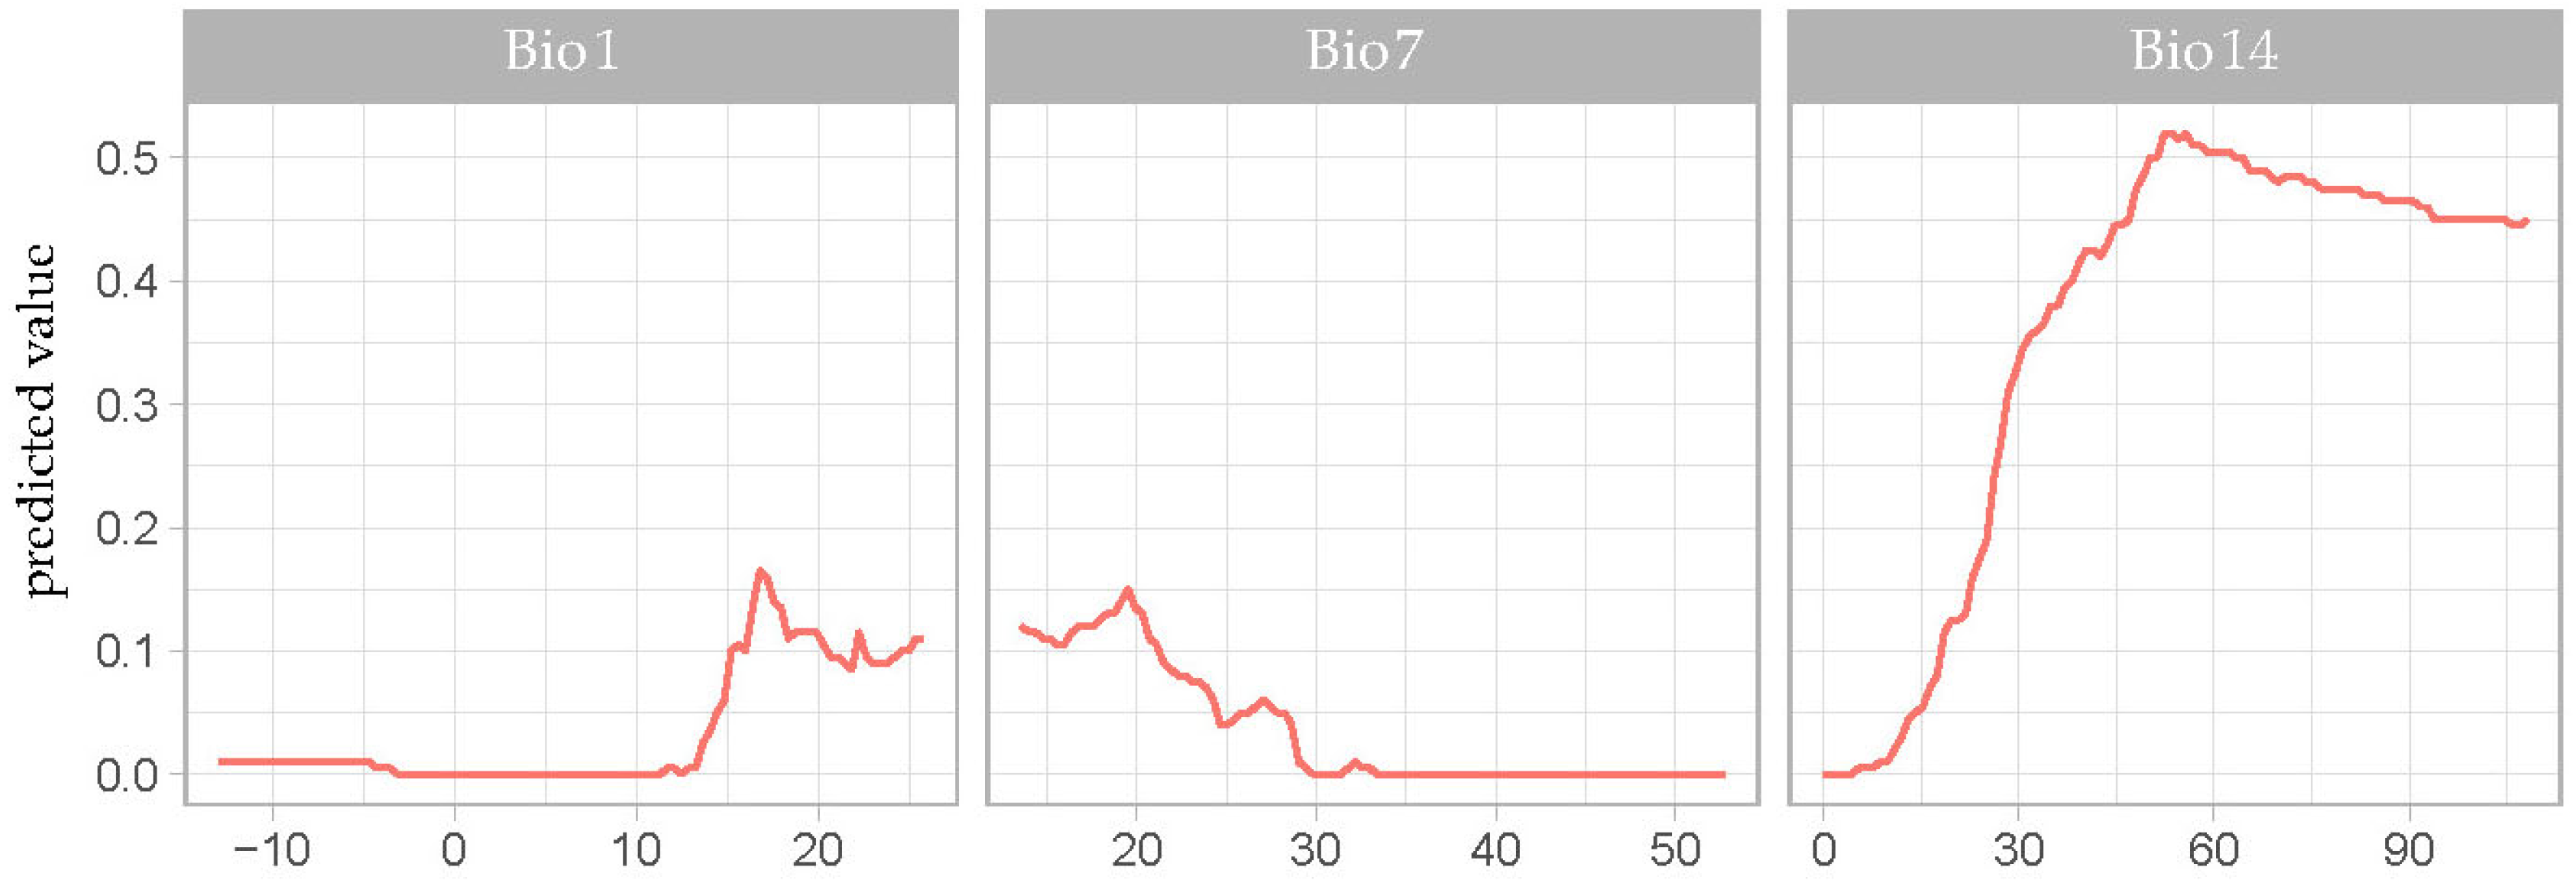
3.1. Model Evaluation and Variable Contribution

The mean TSS, AUC, and KAPPA values for the single models and the ensemble model of Michelia chapensis were evaluated using the Biomod2 platform (see Table 1). According to the committee averaging method, the ensemble model achieved valuws of TSS = 0.75, AUC = 0.95, and KAPPA = 0.62. It indicated that the SDMs of Michelia chapensis were stable and reliable with high robustness. Other ensemble models exhibited comparable performances across multiple metrics, but were marginally inferior to the EMca (ensemble model based on committee averaging). In view of the need to exploit the advantages of ensemble models to further enhance predictive performance, subsequent analyses were conducted on the EMca. Among the individual models evaluated, RF demonstrated the strongest performance, followed by GBM, MAXENT, GAM, etc.
The results from single models indicated that Bio14 significantly impact the distribution of Michelia chapensis. Specifically, the ensemble model aligns with the results of most single models (Figure S1), demonstrating the stability of the ensemble model. Both single and ensemble model results indicate that Bio14, Bio1, and Bio7 significantly impact model performance.
The results from the ensemble model EMca demonstrated that Bio14, Bio1, and Bio7 were the most significant bioclimatic variables, with relative contribution rates of 38.5%, 29.0%, and 25.0%, respectively (see Figure S2 and Table S1). Among the response curves of variables, only the Bio14 had a predicted value greater than 0.4. The optimal growth conditions for Michelia chapensis were seen when precipitation levels in the driest month ranged between 45 and 90 mm. Conversely, a marked decline in predicted was observed when precipitation levels dropped to 30 mm or less, with a further decline to almost zero observed when precipitation was less than 10 mm (see Figure 4).

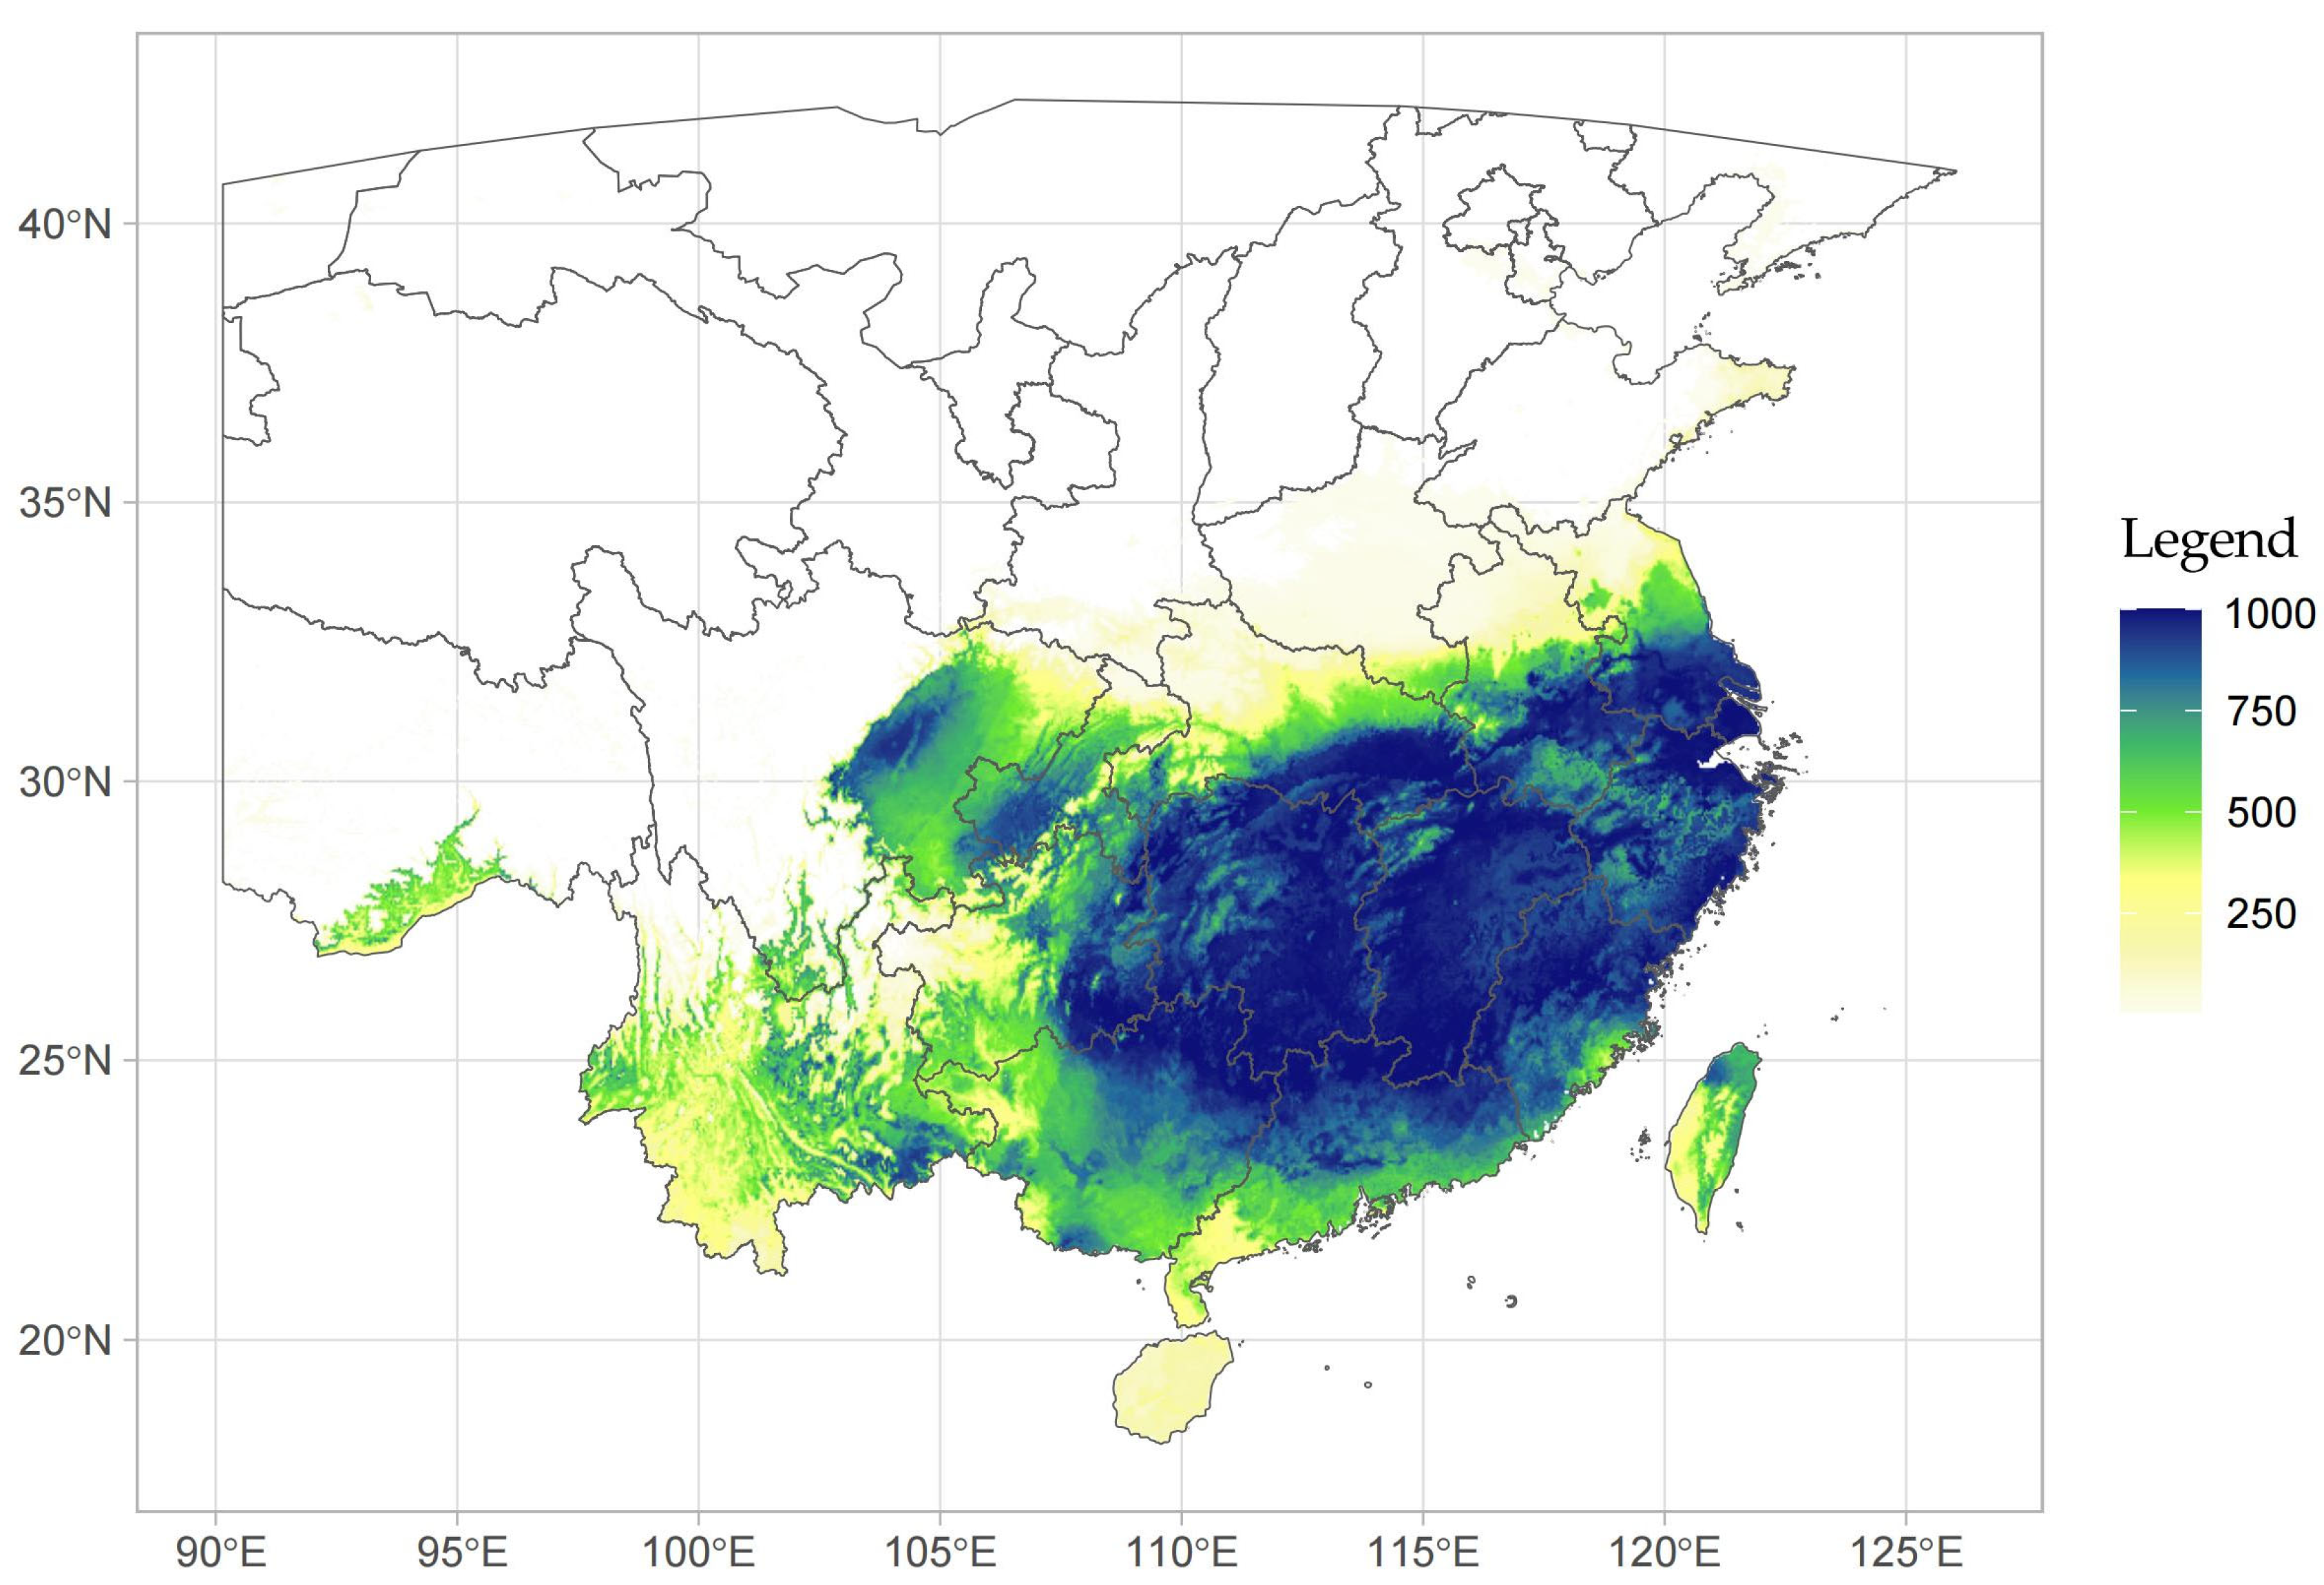
3.2. Distribution of Suitable Areas Under Current Climate Conditions

Based on the EMca model, the potential suitable areas for Michelia chapensis under current climatic conditions are approximately 15.9 × 10⁵ km2 in size. These are primarily distributed in regions south of the Yangtze River (see Figure 5 and Figure 6). Among all regions, highly suitable areas for Michelia chapensis extend across Zhejiang, Fujian, Jiangxi, and Hunan provinces, as well as parts of southern Jiangsu, Anhui, Hubei, Chongqing, Guangxi, Guangdong, Sichuan, Guizhou, Yunnan, and Taiwan. Moderately and low-suitability areas are primarily located in the northern regions of Jiangsu, Anhui, and Hubei provinces, as well as parts of Shandong, Henan, Shaanxi, Guangxi, Guangdong, and the southern Tibet Autonomous Region. Additional regions include Hainan, the central districts of Yunnan and Guizhou provinces, and the majority of Taiwan.

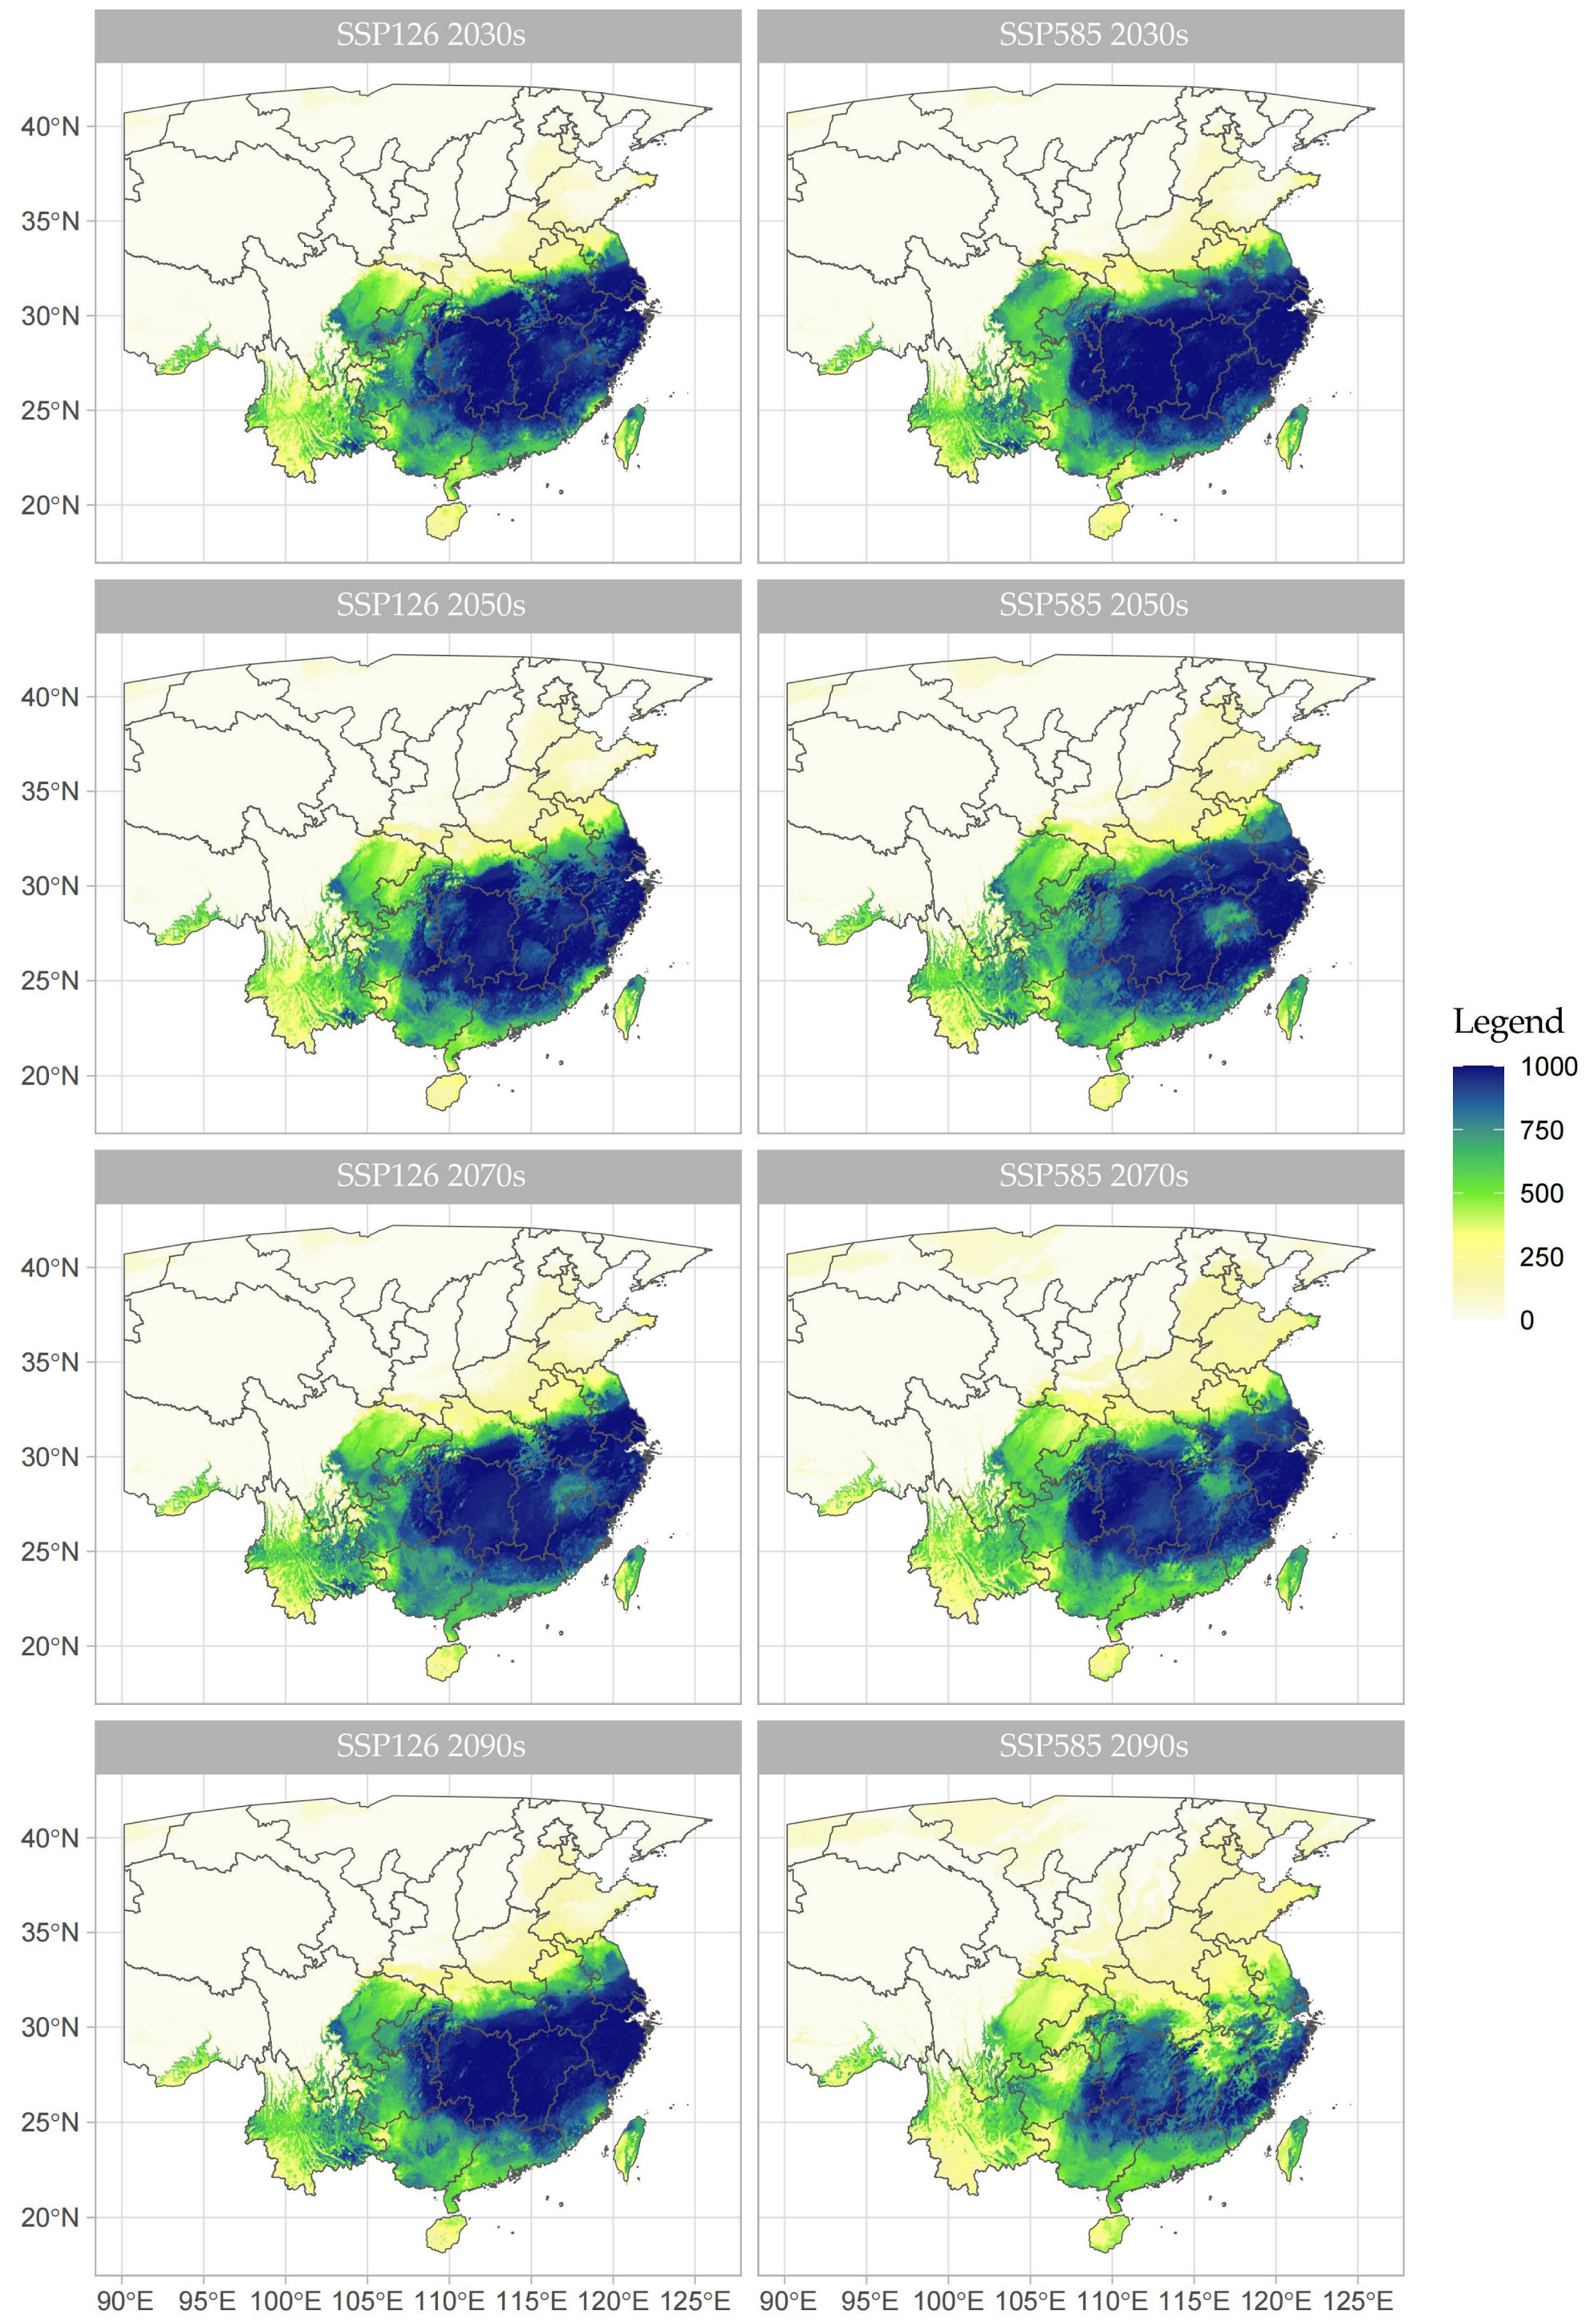
3.3. Prediction of Suitable Areas Under Future Climate Scenarios

The distribution area of Michelia chapensis exhibits distinct development trends under the two future climate scenarios (see Table 2 and Figure 7). Under SSP126, the suitable areas of Michelia chapensis are projected to expand compared to current conditions. The suitable area increased by 6.91%, 1.99%, 13.03%, and 15.83% in the 2030s, 2050s, 2070s, and 2090s, respectively. Meanwhile, the distribution area is projected to extend further into Northern China, reflecting broader adaptation to future climate scenario. Furthermore, highly suitable areas of Michelia chapensis in the middle and lower regions of the Yangtze River and Southern China are expanding continuously.
Conversely, under SSP585, the suitable areas of Michelia chapensis are projected to expand first and then shrink. Compared to the current condition, the suitable habitat area will increase by 14.80% and 14.47% in the 2030s and 2050s, respectively, and will extend into Central China and even Northern China. Nevertheless, the expansion area exhibits low suitability. In the 2070s, although suitable areas will decrease compared with the 2030s and 2050s, the distribution area will still increase by 5.50% compared to the current climate condition. However, in the 2090s, the suitable areas of Michelia chapensis are projected to decrease by 19.03% compared to the current climate condition.
Overall, the suitable areas of Michelia chapensis are projected to show an expanding trend in the future, but the rate of expansion will vary significantly. Specifically, in the near to medium term, the suitable areas will continue to increase in size. However, in the long-term projections, the changes in suitable areas are significantly negatively correlated with the greenhouse gas emission scenarios. That is, under high-emission scenarios, suitable areas may show a trend of contraction.

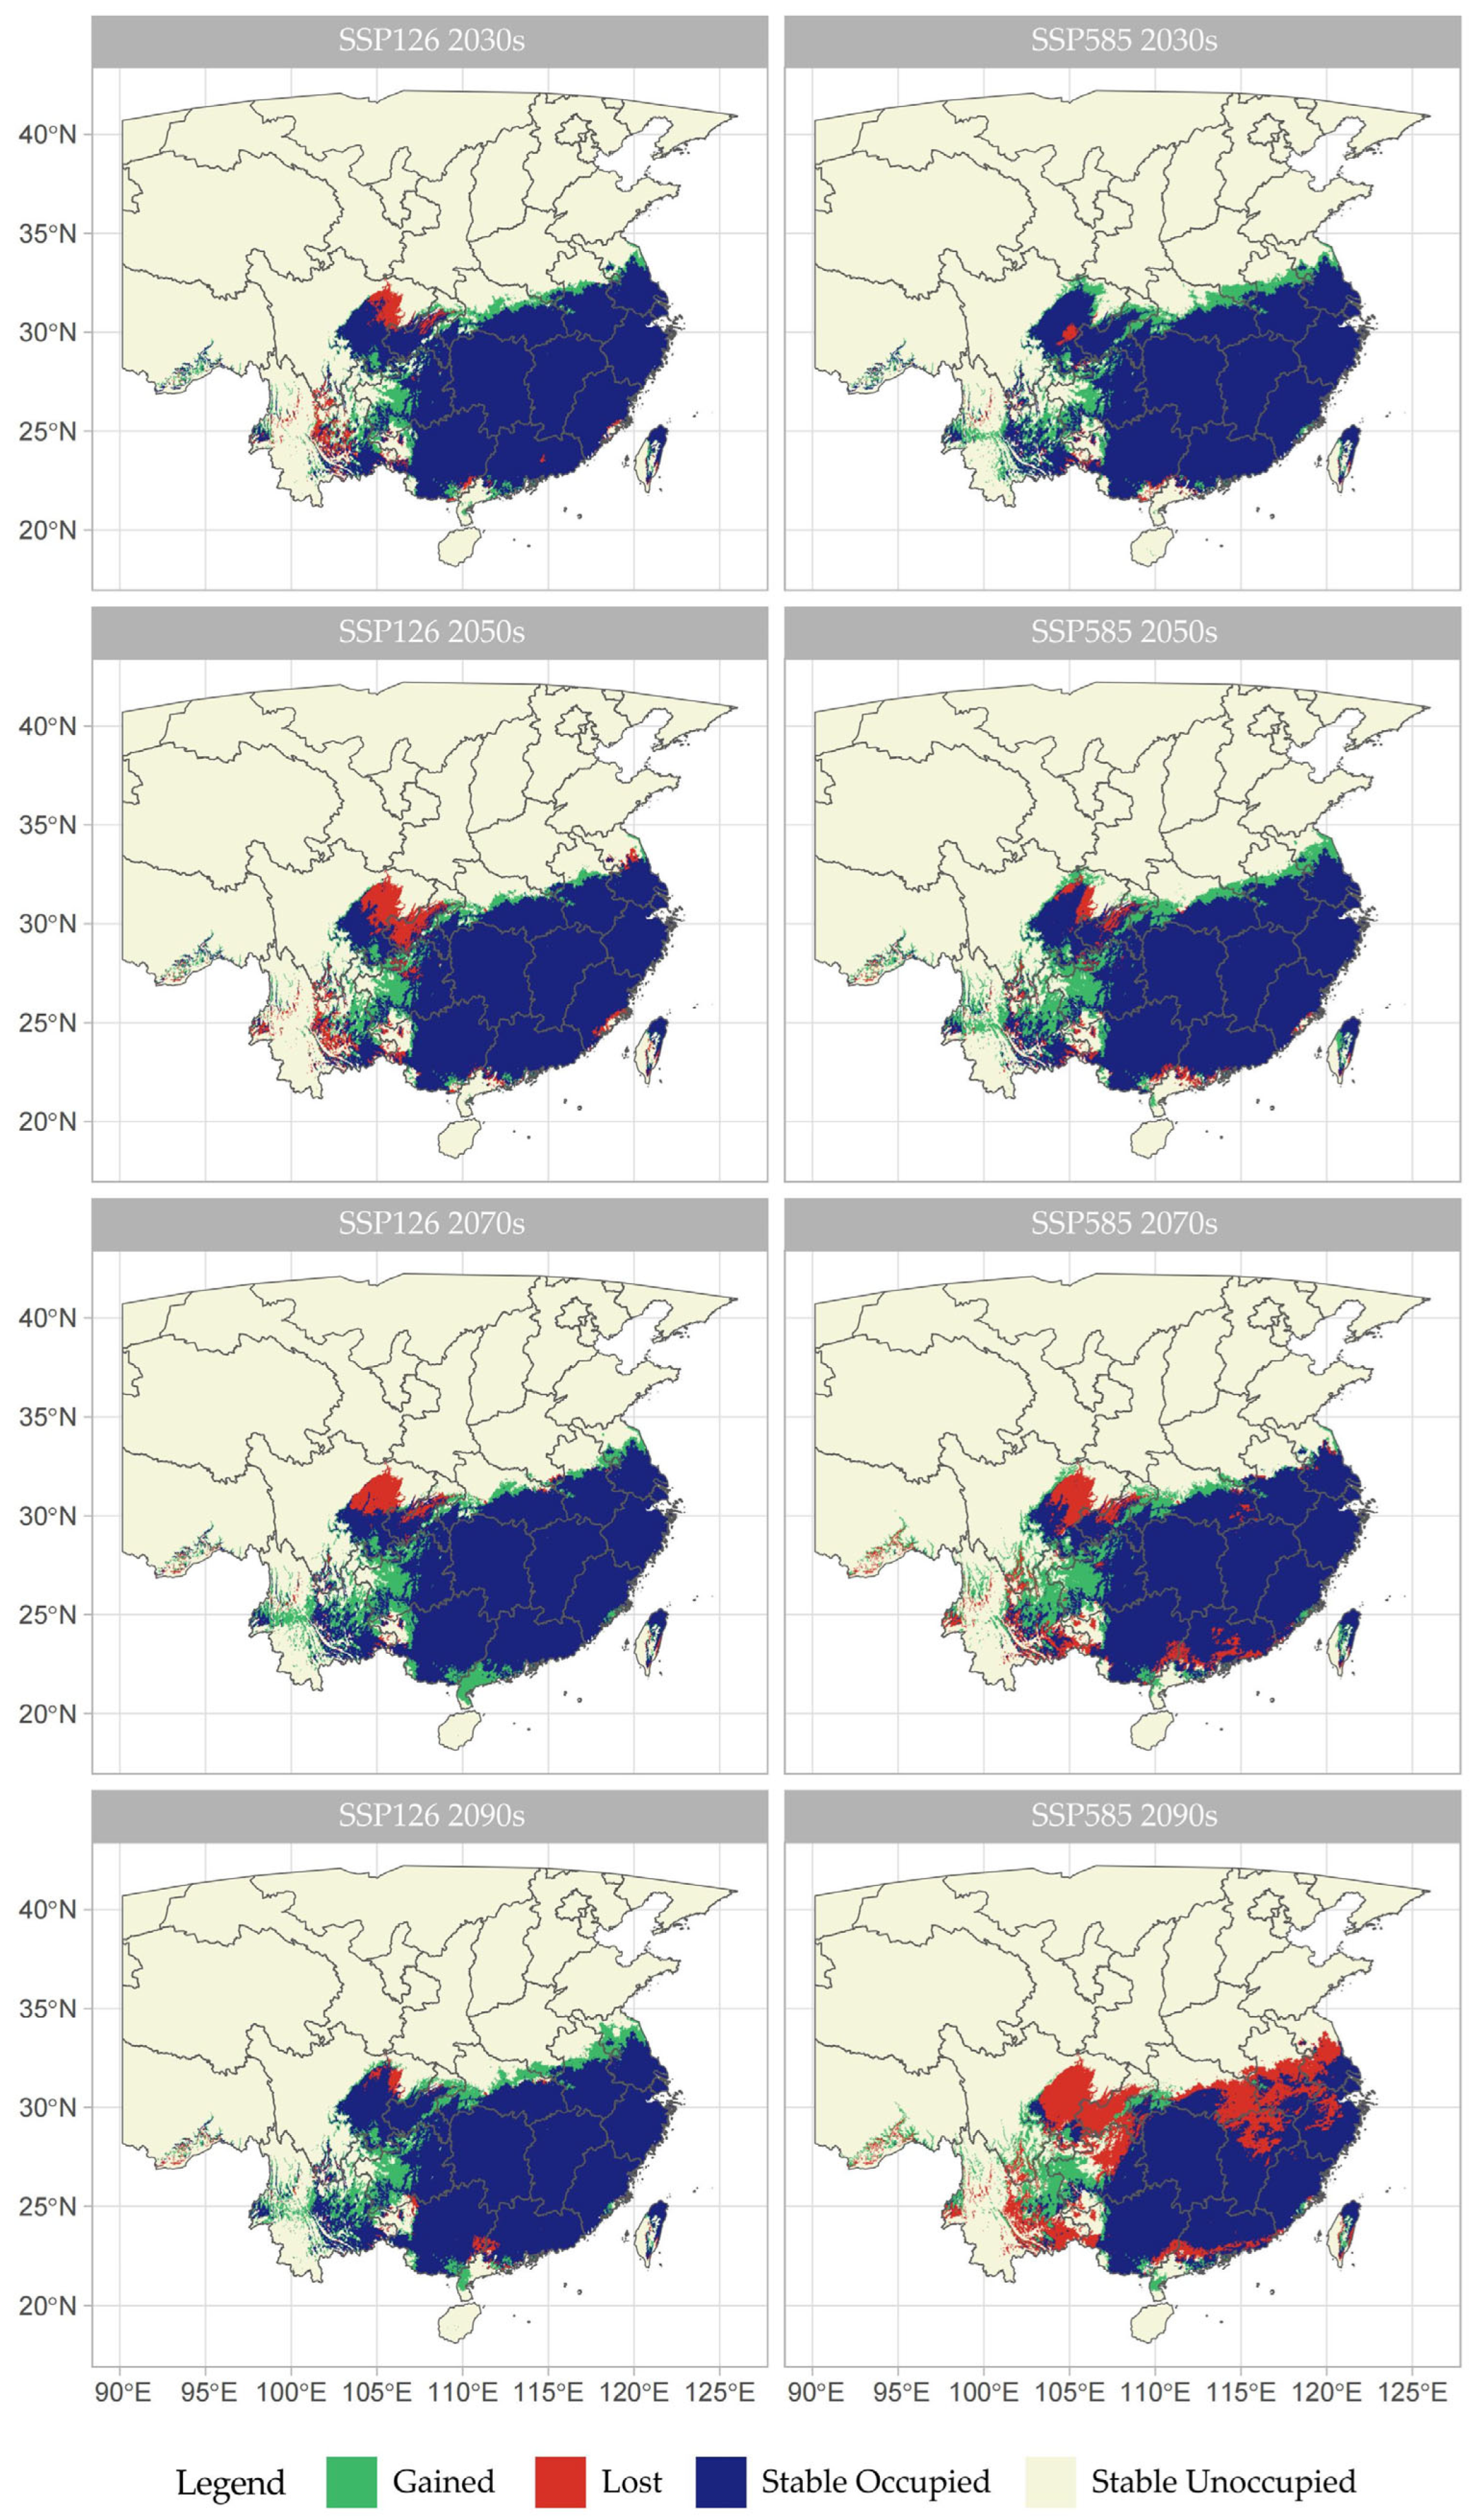
3.4. Change in Suitable Distribution Areas and Changes in Centroid Under Different Climate Scenarios

Compared to the current climate, the suitable distribution area of Michelia chapensis expanded more than it declined overall, indicating an expansion trend (see Figure 8). The change in suitable distribution areas of Michelia chapensis varies depending on the time and climate scenario considered. The suitable habitat will expand the most in 2090s (15.83%) and the least in the 2050s (1.99%) under SSP126. Furthermore, the expansion area will be located in the Huai River Basin, the southern side of the Qinling Mountains, and parts of Yunnan and Guizhou. Conversely, a contraction of suitable habitat is projected under SSP585 in the 2090s, with a decrease from 15.9 × 10⁵ km2 to 12.9 × 10⁵ km2. Overall, in the four periods under the SSP585 scenario, the suitable distribution areas in the Sichuan–Chongqing region, parts of the middle and lower reaches of the Yangtze River, the area around Poyang Lake, and parts of southern Guangdong show an increasing trend of decline over time, with the most significant reductions in the 2070s and 2090s.
From the perspective of centroid migration, the centroid of the current distribution area of Michelia chapensis is located in Hengdong County, Hengyang City, Hunan Province (27.36° N, 112.34° E). Under future climate scenarios, the centroid will shift westward. In the SSP126 (see Figure 9a), the centroid for Michelia chapensis will shift from Loudi City during the 2030s and 2050s (with migration distances of 21.84 km and 17.65 km, respectively) to Shaoyang City by the 2070s (61.54 km away), reaching a distance of 35.94 km by the 2090s. However, under SSP585 (see Figure 9b), the centroid demonstrates a more complex migration pattern: it shifts from Loudi City in the 2030s (62.96 km from the current location) to Shaoyang City in the 2050s (7.26 km away), then returns to Loudi City by the 2070s (36.50 km away), and finally moves to Hengyang City by the 2090s, which is 74.25 km away.
Consequently, we found that as climate warming intensifies, the distribution centroid of Michelia chapensis shifts more significantly, with a greater distance and a more irregular direction.

4. Discussion

4.1. Overall Model Evaluation

In our study, the ensemble model developed, integrating eight single-algorithm models, exhibited excellent predictive performance (AUC = 0.95). The evaluation of the model results indicated that ensemble models, generated using different integration methods, exhibited improved performances. The integration of models derived from different single algorithms enhances predictive accuracy by more accurately capturing species–environment relationships, thereby reducing complexity and uncertainty while improving the reliability of species distribution predictions [74,75,76].
Moreover, we chose the BCC-CSM2-MR climate model from the CMIP6 project to simulate the suitable distribution areas of Michelia chapensis under the SSP126 and SSP585 scenarios for the 2030s, 2050s, 2070s, and 2090s. This study utilized bioclimatic variables to simulate changes in the suitable areas of the species under the influence of global climate change. It has been demonstrated by analogous studies that, in addition to bioclimatic variables, non-climatic variables can also be incorporated into models when investigating the impacts of climate change on species’ suitable areas. Nevertheless, bioclimatic variables have been shown to exert a more substantial influence than non-climatic variables [28,32]. In this study, we assessed which bioclimatic variable has the greatest impact on species distribution and identified Bio14 as the most critical climatic factor.
This study, conducted at the scale of mainland China, revealed that Michelia chapensis is more sensitive to precipitation, with the optimal suitability index occurring when the Bio14 ranges between 45 and 90 mm. In addition to precipitation, Bio1 and annual temperature range were identified as critical factors influencing the distribution of Michelia chapensis. It is evident that shifts in precipitation and temperature collectively influence the species’ adaptability to its environment [77]. Organisms can adapt to environmental changes through in situ evolution or range shifts, with species distribution primarily constrained by habitat conditions at the geographic scale [78]. Projections indicate that, from the present to the 2090s, the expansion/contraction of suitable areas and shifts in the centroid of Michelia chapensis suggest that global warming may, to some extent, favor its survival. However, the potential for losses may be compounded by the species’ inability to adapt to local climatic conditions, a consequence of unstable precipitation and temperature changes.

4.2. Analysis of Species Suitable Area Evolution

A considerable body of research has employed SDMs to simulate the distribution ranges of species under climate change scenarios. These studies, which are based on machine learning algorithms, have explored potential adverse developments that may arise during this process [18,39,79]. Projections indicate that, under future climate scenarios, the distribution ranges of species may undergo expansion compared to the current situation. The potential for such changes is significant, with the expansion or contraction of species’ ranges being a key concern, as climate change will alter the potential distribution areas of these species [18]. Consequently, conducting scientific research to understand the impacts of climate change on the geographic distribution of these species is imperative.
In the context of global warming, plants in low-latitude regions have been observed to migrate or expand in range towards higher latitudes [80,81]. However, the changes in suitable areas for Michelia chapensis under different scenarios exhibit varying trends, which is likely due to the combined effects of its physiological characteristics and human activities. SSP126 is characterized by moderate precipitation and temperature changes that increasingly meet the physiological growth requirements of Michelia chapensis, resulting in a gradual expansion of its suitable habitat. Conversely, under SSP585, temperature and precipitation changes are more extreme, resulting in unstable precipitation or extreme temperatures (e.g., droughts or floods) that exceed the physiological growth thresholds of Michelia chapensis, leading to substantial losses in its suitable habitat.
Although the spread of species’ suitable areas is driven by climate, it still can be influenced by human activities to a large extent. This is especially true in urban areas, where spread is influenced by activities including urban development, land use changes, and urban forest management [82]. The study found that the northward expansion of Michelia chapensis’ suitable habitat is not significant, which may be related to human influences present in the original research data. With human intervention, the actual amount of water available to plants exceeds the levels of climatic precipitation, altering their environmental conditions and enabling them to survive in climates they would otherwise not be able to adapt to. Human activities can also have negative impacts on plant growth. Recent studies have found a positive correlation between urban expansion and the loss of species’ habitats as well as the degradation of ecosystem services [83,84]. Future studies could obtain systematic data on human management within the framework of urban governance (such as irrigation data) to construct more refined models and enhance the robustness and reliability of these models. Alternatively, future land use changes predicted by urban expansion models (e.g., expansion of built-up areas, reduction in green space ratio) could be used as inputs to assess the impact of habitat fragmentation or loss on species distribution.
However, the overall impact of climate change on the core distribution areas of Michelia chapensis has not been found to be significant. Most regions of Hunan and Jiangxi provinces, as well as parts of Fujian, Zhejiang, Yunnan, and Anhui provinces, have been identified as stable, high-suitability regions for this species. According to the results of the sensitivity analysis after excluding urban records, the area of highly suitable regions predicted by modeling with the field distribution points of Michelia chapensis is smaller than that predicted using comprehensive data. Moreover, under future climate change projections, these highly suitable regions remain highly suitable, with consistently high suitability indices (see Figures S3 and S4). From the perspective of climate variables, the data of these climate variables in these regions have always been within the suitable range for Michelia chapensis, while the edges of the suitable areas for Michelia chapensis are more sensitive to changes in climate variable data. Additionally, the trajectory of the centroid of Michelia chapensis is confined within the scope of Hengyang, Loudi, and Shaoyang cities, which means that the high-suitability regions for Michelia chapensis are relatively stable. Consequently, future landscape planning or conservation efforts for Michelia chapensis could be optimized by focusing on these regions.

4.3. Exploration of Urban Forest Management and Administration

As the impacts of climate change on urban vegetation intensify, urban forest management faces numerous challenges. The protection of rare tree species and the impacts of invasive species under climate change have been emphasized in many previous academic studies, yet urban trees have received relatively limited attention. Michelia chapensis, a notable species within the Magnoliaceae family, is of particular significance in the context of urban forestry. It performs a pivotal role in preserving urban forest ecosystems, serving as a long-term carbon sink, regulating microclimates and enhancing air quality.
Our study projects that the suitable habitat of Michelia chapensis will generally expand in the future, with policy implications for all stakeholders in urban forest management that are adaptable to diverse interests. Before all else, urban forest management departments and relevant practitioners must meticulously recognize the predictability and inevitability of urban trees under climate change and understand the potential impacts of climate change on their growth and survival. Second, scholars should focus on predicting the trends exhibited by the urban trees current widely used, especially in high-risk areas where habitat “loss” is projected. In response to the projected habitat “loss” of urban trees, particularly in high-risk regions such as southeastern Yunnan, central Guizhou, central Guangdong, the Sichuan Basin, and the border areas of the Hubei, Jiangxi, and Anhui provinces, it is recommended to establish digital monitoring systems and implement refined management strategies. By developing public participation mechanisms, optimizing tree management strategies, and conducting regular monitoring, the adaptability of urban trees to climate change can be effectively enhanced, strengthening the resilience and robustness of urban forest systems and providing scientific support for landscape planning and forestry industry protection.
Third, policymakers should propose recommendations to encourage urban landscape designers and practitioners to increase the use of “stable” tree species. By selecting diverse species and constructing multi-layered plant communities, ecological stability can be enhanced, while also ensuring the proper maintenance and management of the species. For example, the mixed planting of Michelia chapensis with Schima superba, Castanopsis fissa, and Cunninghamia lanceolata shows promising prospects for cultivation and development [49]. Fourth, preplanning should be conducted for the introduction and breeding of tree species in the “gained” suitable areas to enhance urban tree species diversity and landscape richness. The model prediction of Michelia chapensis indicates that its suitable habitat will expand northward to areas north of the Huai River Basin (e.g., Suqian, Huaibei, and Zhumadian). It is recommended to prioritize the introduction of this species in the aforementioned areas under the principle of “right tree, right place” [85]. Additionally, urban forest management should also develop public property risk insurance schemes to increase the likelihood of rebuilding properties after inevitable climate disasters and the resulting economic losses [86].

4.4. Research Limitations

The establishment and analysis of the model in this study are subject to certain inherent limitations and challenges. Primarily, the utilization of machine learning algorithms for the prediction of species distribution is inherently constrained. Secondly, the sources of species coordinate data are diverse, and insufficient field surveys may introduce human bias. Finally, the incompleteness of data collection and the limited selection of environmental factors during modeling may lead to errors. For instance, this study only incorporated 19 bioclimatic variables as environmental factors, while other non-climatic variables such as topography, soil, or human influences were not included in model training [28,32,70]. Collectively, these factors may contribute to discrepancies between the simulated distribution and the actual conditions.

5. Conclusions

This study employed the Biomod2 package to construct and select the optimal ensemble model for simulating the suitable area distribution of Michelia chapensis across different periods. The findings are consistent with the current distribution of Michelia chapensis under present climatic conditions, indicating that the ensemble model significantly enhances reliability compared to single models. The analysis identified three bioclimatic variables that exert the greatest influence on the distribution of Michelia chapensis: Bio14 (38.5%), Bio1 (29.0%), and Bio7 (25.0%). Projections indicate that, under future global warming scenarios, the suitable area of Michelia chapensis is expected to expand overall. However, under SSP585, a significant reduction in its suitable area is projected. It is recommended that the growth status of existing trees in regions such as southeastern Yunnan, central Guizhou, central Guangdong, the Sichuan Basin, and the border areas of Hubei, Jiangxi, and Anhui Provinces be monitored. Furthermore, to enhance the quality of urban landscape tree species, the introduction and cultivation of Michelia chapensis should be maintained north of the Huai River Basin, guided by the principle of “right tree, right place,” as a potential candidate for future urban forest applications. The findings of this study provide robust scientific support for the future landscape planning and management of Michelia chapensis. Moreover, the framework developed in this study can serve as an effective tool for predicting the responses of suitable distributions of urban tree species to climate change, offering valuable insights into urban planning and landscape management to proactively address climate change. The approach adopted in this study is both highly generalizable and of significant reference value.

Supplementary Materials

The following supporting information can be downloaded at https://www.mdpi.com/article/10.3390/land14030638/s1.

Author Contributions

Conceptualization, C.S. and K.L.; methodology, C.S., K.L., X.C. and C.Z.; software, C.S., L.X. and M.Q.; validation, C.S., H.Z. and K.L.; formal Analysis, C.S.; investigation, C.S. and M.Q.; resources, H.Z. and K.L.; data curation, C.S.; writing—original draft preparation, C.S. and K.L.; writing—review and editing, K.L.; visualization, C.S.; supervision, H.Z.; project administration, K.L.; funding acquisition, H.Z., K.L. and C.S. All authors have read and agreed to the published version of the manuscript.

Funding

This research was funded by the Research and Development Fund of Zhejiang A&F University (No. 2023LFR002) and Zhejiang Provincial College Student Science and Technology Innovation Plan and Planted Talent Plan Funding Project (No. 2024R412B045).

Data Availability Statement

The multi-year administrative boundary data for cities in China used in this study is sourced from the Resource and Environment Science Data Registration and Publishing System, and the relevant data can be found here: (https://www.resdc.cn/, accessed on 18 May 2024). The species distribution datasets included in this study are not immediately available, as they are part of an ongoing research project. Requests for access to these datasets should be directed to the authors.

Acknowledgments

The authors gratefully acknowledge the support of the funding. Special thanks are extended to the Chinese Virtual Herbarium (CVH) for providing valuable data resources. We are particularly grateful to Xiyang Ye from Zhejiang A&F University for his generous provision of high-quality photographs of Michelia chapensis.

Conflicts of Interest

The authors declare no conflicts of interest.

References

  1. Maleknia, R.; Enescu, R.E. Does Climate Change Stimulate Citizens’ Responses to Conserving Urban Forest? Insights from Stimulus-Organism-Response Theory. Ecol. Model. 2025, 501, 111000. [Google Scholar] [CrossRef]
  2. IPCC. Climate Change 2023: Synthesis Report. Contribution of Working Groups I, II and III to the Sixth Assessment Report of the Intergovernmental Panel on Climate Change; Core Writing Team, Lee, H., Romero, J., Eds.; IPCC: Geneva, Switzerland, 2023; pp. 35–115. [Google Scholar] [CrossRef]
  3. McCulloch, M.T.; Winter, A.; Sherman, C.E.; Trotter, J.A. 300 Years of Sclerosponge Thermometry Shows Global Warming Has Exceeded 1.5 °C. Nat. Clim. Change 2024, 14, 171–177. [Google Scholar] [CrossRef]
  4. Dong, L.; Xing, X.Y. Research Review on the Impact of Climate Change on Urban Vegetation. Landsc. Archit. 2021, 28, 61–67. [Google Scholar] [CrossRef]
  5. Nowak, D.J.; Greenfield, E.J.; Hoehn, R.E.; Lapoint, E. Carbon Storage and Sequestration by Trees in Urban and Community Areas of the United States. Environ. Pollut. 2013, 178, 229–236. [Google Scholar] [CrossRef]
  6. Livesley, S.J.; McPherson, G.M.; Calfapietra, C. The Urban Forest and Ecosystem Services: Impacts on Urban Water, Heat, and Pollution Cycles at the Tree, Street, and City Scale. J. Environ. Qual. 2016, 45, 119–124. [Google Scholar] [CrossRef]
  7. Escobedo, F.J.; Nowak, D.J. Spatial and Air Pollution Removal by an Urban Forest. Landsc. Urban Plann. 2009, 90, 102–110. [Google Scholar] [CrossRef]
  8. Sicard, P.; Agathokleous, E.; Araminiene, V.; Carrari, E.; Hoshika, Y.; De Marco, A.; Paoletti, E. Should We See Urban Trees As Effective Solutions to Increasing Ozone Levels in Cities? Environ. Pollut. 2018, 243, 163–176. [Google Scholar] [CrossRef]
  9. Salmond, J.A.; Tadaki, M.; Vardoulakis, S.; Arbuthnott, K.; Coutts, A.; Demuzere, M.; Dirks, K.N.; Heaviside, C.; Lim, S.; MacIntyre, H.; et al. Health and Climate Related Ecosystem Services Provided by Street Trees in the Urban Environment. Environ. Health 2016, 15, 95–111. [Google Scholar] [CrossRef]
  10. Sydnor, T.; Subburayalu, S. Should We Consider Expected Environmental Benefits When Planting Larger or Smaller Tree Species? Arboric. Urban For. 2011, 37, 167–172. [Google Scholar] [CrossRef]
  11. Mullaney, J.; Lucke, T.; Trueman, S.J. A Review of Benefits and Challenges in Growing Street Trees in Paved Urban Environments. Landsc. Urban Plann. 2015, 134, 157–166. [Google Scholar] [CrossRef]
  12. Qu, S.; Wang, L.; Lin, A.; Yu, D.; Yuan, M.; Li, C. Distinguishing the Impacts of Climate Change and Anthropogenic Factors on Vegetation Dynamics in the Yangtze River Basin, China. Ecol. Indic. 2020, 108, 105724. [Google Scholar] [CrossRef]
  13. Corlett, R.T.; Westcott, D.A. Will Plant Movements Keep up with Climate Change? Trends Ecol. Evol. 2013, 28, 482–488. [Google Scholar] [CrossRef]
  14. Ordóñez, C.; Duinker, P.N. Assessing the Vulnerability of Urban Forests to Climate Change. Environ. Rev. 2014, 22, 311–321. [Google Scholar] [CrossRef]
  15. Locosselli, G.M.; de Camargo, E.P.; Moreira, T.C.L.; Todesco, E.; Andrade, M.d.F.; de André, C.D.S.; de André, P.A.; Singer, J.M.; Ferreira, L.S.; Saldiva, P.H.N.; et al. The Role of Air Pollution and Climate on the Growth of Urban Trees. Sci. Total Environ. 2019, 666, 652–661. [Google Scholar] [CrossRef]
  16. Guan, X.; Shen, H.; Li, X.; Gan, W.; Zhang, L. A Long-Term and Comprehensive Assessment of the Urbanization-Induced Impacts on Vegetation Net Primary Productivity. Sci. Total Environ. 2019, 669, 342–352. [Google Scholar] [CrossRef]
  17. Casazza, G.; Abeli, T.; Bacchetta, G.; Dagnino, D.; Fenu, G.; Gargano, D.; Minuto, L.; Montagnani, C.; Orsenigo, S.; Peruzzi, L.; et al. Combining Conservation Status and Species Distribution Models for Planning Assisted Colonization under Climate Change. J. Ecol. 2021, 109, 2284–2295. [Google Scholar] [CrossRef]
  18. Gülçin, D.; Arslan, E.S.; Örücü, Ö.K. Effects of Climate Change on the Ecological Niche of Common Hornbeam (Carpinus Betulus L.). Ecol. Inform. 2021, 66, 101478. [Google Scholar] [CrossRef]
  19. Yousefzadeh, H.; Walas, Ł.; Amirchakhmaghi, N.; Alipour, S.; Pouramin, M.; Song, Y.-G.; Kozlowski, G. Potential Effects of Climate Change on Future Distribution of an Endangered Tree Species, Acer Mazandaranicum, in the Hyrcanian Forest. For. Ecol. Manag. 2024, 555, 121654. [Google Scholar] [CrossRef]
  20. Taleshi, H.; Jalali, S.G.; Alavi, S.J.; Hosseini, S.M.; Naimi, B.; Zimmermann, N.E. Climate Change Impacts on the Distribution and Diversity of Major Tree Species in the Temperate Forests of Northern Iran. Reg. Environ. Change 2019, 19, 2711–2728. [Google Scholar] [CrossRef]
  21. Arslan, E.S.; Akyol, A.; Örücü, Ö.K.; Sarıkaya, A.G. Distribution of Rose Hip (Rosa Canina L.) under Current and Future Climate Conditions. Reg. Environ. Change 2020, 20, 107. [Google Scholar] [CrossRef]
  22. Çoban, H.O.; Örücü, Ö.K.; Arslan, E.S. MaxEnt Modeling for Predicting the Current and Future Potential Geographical Distribution of Quercus Libani Olivier. Sustainability 2020, 12, 2671. [Google Scholar] [CrossRef]
  23. Anibaba, Q.A.; Dyderski, M.K.; Jagodziński, A.M. Predicted Range Shifts of Invasive Giant Hogweed (Heracleum Mantegazzianum) in Europe. Sci. Total Environ. 2022, 825, 154053. [Google Scholar] [CrossRef]
  24. Iverson, L.R.; Prasad, A.M.; Peters, M.P.; Matthews, S.N. Facilitating Adaptive Forest Management under Climate Change: A Spatially Specific Synthesis of 125 Species for Habitat Changes and Assisted Migration over the Eastern United States. Forests 2019, 10, 989. [Google Scholar] [CrossRef]
  25. Maphanga, T.; Shoko, C.; Sibanda, M.; Kavhu, B.; Coetsee, C.; Dube, T. Bush Encroachment with Climate Change in Protected and Communal Areas: A Species Distribution Modelling Approach. Ecol. Model. 2025, 503, 111056. [Google Scholar] [CrossRef]
  26. Kim, J.; Lee, D.K.; Kim, H.G. Suitable Trees for Urban Landscapes in the Republic of Korea under Climate Change. Landsc. Urban Plan. 2020, 204, 103937. [Google Scholar] [CrossRef]
  27. Bai, J.; Wang, H.; Yang, D. Identification of Urban Trees at Risk Due to Climate Change- A Case Study of Tianjin City. Ecol. Indic. 2024, 167, 112611. [Google Scholar] [CrossRef]
  28. Song, H.; Zhang, X.; Wang, X.; Wang, Y.; Li, S.; Xu, Y. Not the Expected Poleward Migration: Impact of Climate Change Scenarios on the Distribution of Two Endemic Evergreen Broad-Leaved Quercus Species in China. Sci. Total Environ. 2023, 889, 164273. [Google Scholar] [CrossRef]
  29. Elith, J.; Leathwick, J.R. Species Distribution Models: Ecological Explanation and Prediction across Space and Time. Annu. Rev. Ecol. Evol. Syst. 2009, 40, 677–697. [Google Scholar] [CrossRef]
  30. Hao, T.; Elith, J.; Guillera-Arroita, G.; Lahoz-Monfort, J.J. A review of evidence about use and performance of species distribution modelling ensembles like BIOMOD. Divers Distrib. 2019, 25, 839–852. [Google Scholar] [CrossRef]
  31. Fang, Y.; Zhang, X.; Wei, H.; Wang, D.; Chen, R.; Wang, L.; Gu, W. Predicting the Invasive Trend of Exotic Plants in China Based on the Ensemble Model under Climate Change: A Case for Three Invasive Plants of Asteraceae. Sci. Total Environ. 2021, 756, 143841. [Google Scholar] [CrossRef]
  32. Yang, W.; Sun, S.; Wang, N.; Fan, P.; You, C.; Wang, R.; Zheng, P.; Wang, H. Dynamics of the Distribution of Invasive Alien Plants (Asteraceae) in China under Climate Change. Sci. Total Environ. 2023, 903, 166260. [Google Scholar] [CrossRef]
  33. Dyderski, M.K.; Paź, S.; Frelich, L.E.; Jagodziński, A.M. How Much Does Climate Change Threaten European Forest Tree Species Distributions? Glob. Change Biol. 2018, 24, 1150–1163. [Google Scholar] [CrossRef]
  34. Zhang, P.; Dong, X.; Grenouillet, G.; Lek, S.; Zheng, Y.; Chang, J. Species Range Shifts in Response to Climate Change and Human Pressure for the World’s Largest Amphibian. Sci. Total Environ. 2020, 735, 139543. [Google Scholar] [CrossRef]
  35. Biber, M.F.; Voskamp, A.; Hof, C. Potential Effects of Future Climate Change on Global Reptile Distributions and Diversity. Glob. Ecol. Biogeogr. 2023, 32, 519–534. [Google Scholar] [CrossRef]
  36. Xie, D.; Du, H.; Xu, W.-H.; Ran, J.-H.; Wang, X.-Q. Effects of Climate Change on Richness Distribution Patterns of Threatened Conifers Endemic to China. Ecol. Indic. 2022, 136, 108594. [Google Scholar] [CrossRef]
  37. Li, G.; Xiao, N.; Luo, Z.; Liu, D.; Zhao, Z.; Guan, X.; Zang, C.; Li, J.; Shen, Z. Identifying Conservation Priority Areas for Gymnosperm Species under Climate Changes in China. Biol. Conserv. 2021, 253, 108914. [Google Scholar] [CrossRef]
  38. Guisan, A.; Tingley, R.; Baumgartner, J.B.; Naujokaitis-Lewis, I.; Sutcliffe, P.R.; Tulloch, A.I.T.; Regan, T.J.; Brotons, L.; Mcdonald-Madden, E.; Mantyka-Pringle, C.; et al. Predicting species distributions for conservation decisions. Ecol. Lett. 2013, 16, 1424–1435. [Google Scholar] [CrossRef]
  39. Zhang, L.; Jing, Z.; Li, Z.; Liu, Y.; Fang, S. Predictive Modeling of Suitable Habitats for Cinnamomum Camphora (L.) Presl Using Maxent Model under Climate Change in China. Int. J. Environ. Res. Public Health 2019, 16, 3185. [Google Scholar] [CrossRef]
  40. Martínez-Minaya, J.; Cameletti, M.; Conesa, D.; Pennino, M.G. Species distribution modeling: A statistical review with focus in spatio-temporal issues. Stoch. Environ. Res. Risk Assess. 2018, 32, 3227–3244. [Google Scholar] [CrossRef]
  41. Araújo, M.B.; New, M. Ensemble Forecasting of Species Distributions. Trends Ecol. Evol. 2007, 22, 42–47. [Google Scholar] [CrossRef]
  42. Dormann, C.F.; Calabrese, J.M.; Guillera-Arroita, G.; Matechou, E.; Bahn, V.; Bartoń, F.; Hartig, F. Model Averaging in Ecology: A Review of Bayesian, Information-Theoretic and Tactical Approaches. Ecol. Monogr. 2018, 88, 485–504. [Google Scholar] [CrossRef]
  43. Friedman, J.H.; Popescu, B.E. Predictive Learning via Rule Ensembles. Ann. Appl. Stat. 2008, 2, 916–954. [Google Scholar] [CrossRef]
  44. Seni, G.; Elder, J.F. Ensemble Methods in Data Mining: Improving Accuracy through Combining Predictions. Synth. Lect. Data Min. Knowl. Discov. 2010, 2, 1–126. [Google Scholar] [CrossRef]
  45. Xiaochang, L.; Renlu, Q.; Xiuning, Z. Dissecting the Nonlinear Economic Implications of Urban Extreme Thermo-Environment Using a Monte Carlo Simulation-Based Ensemble Learning Model. Habitat Int. 2025, 156, 103274. [Google Scholar] [CrossRef]
  46. Liu, X.; Liu, Z.; Zhu, Z.; Qiao, R. Decoupling the Multi-Drivers of Urban Extreme Heat Environment in Urban Agglomerations Using Ensemble Learning. Build. Environ. 2024, 258, 111618. [Google Scholar] [CrossRef]
  47. Shen, G.F. Silviculture Technique for the Principal Tree Species of China, 2nd ed.; Chinese Forestry Press: Beijing, China, 2020; pp. 714–716. [Google Scholar]
  48. Zhou, H.; Wei, R.; Li, J.; Su, Y.; Hu, D.; Zheng, H. Research Progress on the Cultivation and Development of Michelia chapensis. China Wild Plant Resour. 2022, 41, 61–66. [Google Scholar]
  49. LY/T 2208-2013; Cultivation Technology Regulations for Michelia Chapensis. Standards Press of China: Beijing, China, 2013.
  50. DB52/T 1167-2017; Technical Regulations for Cultivation of Michelia, L. Michelia chapesis Dandy. Guizhou Provincial Market Supervision Administration: Guizhou, China, 2017.
  51. Shaoguan Forestry Bureau. Notice on the Synchronous Application for the 2025 Special Fund Project Library to Promote High-Quality and Stable Growth of Foreign Trade on the “Yuecai Assistance” Platform. Shaoguan Municipal People’s Government Portal. 8 August 2024. Available online: https://www.sg.gov.cn/bmpdlm/swj/tzgg/content/post_2656800.html (accessed on 4 March 2025).
  52. Quanzhou Municipal People’s Government. Notice on Issuing the Implementation Plan for the Reform of the Administrative Approval System in Quanzhou City. Quanzhou Municipal People’s Government Portal. 4 January 2019. Available online: https://www.quanzhou.gov.cn/zfb/xxgk/zfxxgkzl/zxwj/xsqwj/201901/t20190104_1007015.htm (accessed on 4 March 2025).
  53. Wu, Z.Y. Flora of China; Science Press: Beijing, China, 1996; Volume 30, p. 151, No. 1. [Google Scholar]
  54. Yang, X.Z. Michelia chapensis Afforestation Experiment and Effect Analysis. J. Fujian For. Sci. Technol. 2011, 38, 84–87. [Google Scholar]
  55. Ye, H.; Tan, B.; Wang, Y.; Xie, Y.; Deng, T.; Xie, D.; Zhang, D. Four New Records of Woody Plants in Hubei and Their Resource Status. Acta Bot. Boreali-Occid. Sin. 2020, 40, 895–898. [Google Scholar]
  56. Zhu, Y.L.; Zhang, J. Flowering and Pollination Biology of Michelia chapensis in Shanghai. Sci. Silvae Sin. 2024, 60, 86–93. [Google Scholar]
  57. GBIF.org. (23 November 2023) GBIF Occurrence Download; GBIF: Copenhagen, Denmark, 2023. [Google Scholar] [CrossRef]
  58. Chinese Magnolia (Michelia chapensis) Specimen Data Set (2024); CSTR:11277.11.DSA2024.0119.1f444f07. Available online: https://www.cvh.ac.cn/ (accessed on 4 March 2025).
  59. Amap Open Platform. Amap Map API. Available online: https://lbs.amap.com/api/ (accessed on 26 November 2023).
  60. Rocchini, D.; Garzon-Lopez, C.X. Cartograms Tool to Represent Spatial Uncertainty in Species Distribution. Res. Ideas Outcomes 2017, 3, e12029. [Google Scholar] [CrossRef]
  61. Xu, X.L.; Multi-Year City and County Administrative Boundary Data of China. Resource and Environment Science Data Registration and Publishing System. Available online: http://www.resdc.cn/DOI (accessed on 18 May 2024). [CrossRef]
  62. Fick, S.E.; Hijmans, R.J. WorldClim 2: New 1 km Spatial Resolution Climate Surfaces for Global Land Areas. Int. J. Climatol. 2017, 37, 4302–4315. [Google Scholar] [CrossRef]
  63. Fox, J.; Weisberg, S. An R Companion to Applied Regression, 3rd ed.; Sage Publications: New York, NY, USA, 2019; Available online: https://CRAN.R-project.org/package=car (accessed on 26 June 2024).
  64. Guisan, A.; Thuiller, W.; Zimmermann, N.E. Habitat Suitability and Distribution Models: With Applications in R; Cambridge University Press: Cornwall, UK, 2017. [Google Scholar]
  65. IPCC. Climate Change 2021: The Physical Science Basis. Contribution of Working Group I to the Sixth Assessment Report of the Intergovernmental Panel on Climate Change. Cambridge University Press. 2021. Available online: https://www.ipcc.ch/report/ar6/wg1/ (accessed on 6 July 2024).
  66. IPCC. Climate Change 2014: Synthesis Report. Contribution of Working Groups I, II, and III to the Fifth Assessment Report of the Intergovernmental Panel on Climate Change; IPCC: Geneva, Switzerland, 2014. [Google Scholar]
  67. Wu, T.; Lu, Y.; Fang, Y.; Xin, X.; Li, L.; Li, W.; Jie, W.; Zhang, J.; Liu, Y.; Zhang, L.; et al. The Beijing Climate Center Climate System Model (BCC-CSM): The Main Progress from CMIP5 to CMIP6. Geosci. Model Dev. 2019, 12, 1573–1600. [Google Scholar] [CrossRef]
  68. Xin, X.; Wu, T.; Zhang, J.; Yao, J.; Fang, Y. Comparison of CMIP6 and CMIP5 Simulations of Precipitation in China and the East Asian Summer Monsoon. Int. J. Climatol. 2020, 40, 6423–6440. [Google Scholar] [CrossRef]
  69. Thuiller, W.; Georges, D.; Engler, R. biomod2: Ensemble Platform for Species Distribution Modeling. R Package. 2021. Available online: https://CRAN.R-project.org/package=biomod2 (accessed on 10 July 2024).
  70. Frans, V.F.; Liu, J. Gaps and Opportunities in Modelling Human Influence on Species Distributions in the Anthropocene. Nat. Ecol. Evol. 2024, 8, 1365–1377. [Google Scholar] [CrossRef]
  71. Yu, Y.; Li, Z. Predicting the Potential Distribution of Cheirotonus Jansoni (Coleoptera: Scarabaeidae) Under Climate Change. Insects 2024, 15, 1012. [Google Scholar] [CrossRef]
  72. Allouche, O.; Tsoar, A.; Kadmon, R. Assessing the Accuracy of Species Distribution Models: Prevalence, Kappa and the True Skill Statistic (TSS). J. Appl. Ecol. 2006, 43, 1223–1232. [Google Scholar] [CrossRef]
  73. Cohen, J. A coefficient of agreement of nominal scales. Educ. Psychol. Meas. 1960, 20, 37–46. [Google Scholar] [CrossRef]
  74. Lomba, A.; Pellissier, L.; Randin, C.; Vicente, J.; Moreira, F.; Honrado, J.; Guisan, A. Overcoming the Rare Species Modelling Paradox: A Novel Hierarchical Framework Applied to an Iberian Endemic Plant. Biol. Conserv. 2010, 143, 2647–2657. [Google Scholar] [CrossRef]
  75. Jones-Farrand, D.T.; Fearer, T.M.; Thogmartin, W.E.; Thompson, F.R.; Nelson, M.D.; Tirpak, J.M. Comparison of Statistical and Theoretical Habitat Models for Conservation Planning: The Benefit of Ensemble Prediction. Ecol. Appl. 2011, 21, 2269–2282. [Google Scholar] [CrossRef]
  76. Guo, C.; Lek, S.; Ye, S.; Wei, L.; Liu, J.; Li, Z. Uncertainty in Ensemble Modelling of Large-Scale Species Distribution: Effects from Species Characteristics and Model Techniques. Ecol. Modell. 2015, 306, 67–75. [Google Scholar] [CrossRef]
  77. Zhao, M.; Running, S.W. Drought-Induced Reduction in Global Terrestrial Net Primary Production from 2000 Through 2009. Science 2010, 329, 940–943. [Google Scholar] [CrossRef]
  78. King, T.W.; Vynne, C.; Miller, D.; Fisher, S.; Fitkin, S.; Rohrer, J.; Ransom, J.I.; Thornton, D.H. The Influence of Spatial and Temporal Scale on the Relative Importance of Biotic vs. Abiotic Factors for Species Distributions. Divers. Distrib. 2020, 27, 327–343. [Google Scholar] [CrossRef]
  79. Akhter, S.; McDonald, M.A.; van Breugel, P.; Sohel, S.; Kjær, E.D.; Mariott, R. Habitat Distribution Modelling to Identify Areas of High Conservation Value under Climate Change for Mangifera Sylvatica Roxb. of Bangladesh. Land Use Policy 2017, 60, 223–232. [Google Scholar] [CrossRef]
  80. Xi, Y.; Zhang, W.; Wei, F.; Fang, Z.; Fensholt, R. Boreal Tree Species Diversity Increases with Global Warming but Is Reversed by Extremes. Nat. Plants 2024, 10, 1473–1483. [Google Scholar] [CrossRef]
  81. Randin, C.F.; Engler, R.; Normand, S.; Zappa, M.; Zimmermann, N.E.; Pearman, P.B.; Vittoz, P.; Thuiller, W.; Guisan, A. Climate Change and Plant Distribution: Local Models Predict High-Elevation Persistence. Glob. Change Biol. 2009, 15, 1557–1569. [Google Scholar] [CrossRef]
  82. Čertner, M.; Kúr, P.; Kolář, F.; Suda, J. Climatic Conditions and Human Activities Shape Diploid–Tetraploid Coexistence at Different Spatial Scales in the Common Weed Tripleurospermum Inodorum (Asteraceae). J. Biogeogr. 2019, 46, 1355–1366. [Google Scholar] [CrossRef]
  83. Feng, Y.F.; Li, C.; Feng, J.M. Spatial-Temporal Response of Ecosystem Service Value to Urban Expansion in the Jinan Metropolitan Area Based on the GTWR Model. J. Beijing For. Univ. 2024, 46, 104–118. [Google Scholar] [CrossRef]
  84. Li, G.; Fang, C.; Li, Y.; Wang, Z.; Sun, S.; He, S.; Qi, W.; Bao, C.; Ma, H.; Fan, Y.; et al. Global Impacts of Future Urban Expansion on Terrestrial Vertebrate Diversity. Nat. Commun. 2022, 13, 1628. [Google Scholar] [CrossRef]
  85. Ren, H.; Lu, H. Ecosystem Restoration and the Principle of Right Tree for the Right Place. J. Trop. Subtrop. Bot. 2025, 33, 100–106. [Google Scholar]
  86. Thomas, V. Climate Change and Natural Disasters: Transforming Economies and Policies for a Sustainable Future, 1st ed.; Taylor & Francis: Boca Raton, FL, USA, 2017. [Google Scholar]
Figure 1. Research framework.
Land 14 00638 g001
Figure 2. Photographs of Michelia chapensis (Photo courtesy of Xiyang Ye). (a) The plant of Michelia chapensis; (b) the flower of Michelia chapensis, with a flowering period from March to April.
Land 14 00638 g002
Figure 3. Occurrence records of Michelia chapensis in mainland China [61].
Land 14 00638 g003
Figure 4. The response curves illustrate the relationship between the probability of Michelia chapensis presence and the three most important climatic variables. The ensemble model results were integrated using the committee averaging (CA) method, weighted by the TSS performance of individual models. In each panel, the x-axis and y-axis represent the climatic variable and the probability of species presence, respectively.
Land 14 00638 g004
Figure 5. Habitat suitability index of Michelia chapensis under current climatic conditions. The habitat suitability index was predicted using ensemble SDM and the CA method was used to integrate results from multiple individual models.
Land 14 00638 g005
Figure 6. Potential geographic distribution of Michelia chapensis habitats under current climate conditions. Based on the distribution maps obtained from the modeling, the suitability index was calculated and classified into four categories using the equal interval method, which divides the range of habitat suitability values into equal intervals. The four categories are non-suitable areas, representing regions that lack suitable habitat conditions; low-suitability areas, characterized by minimal habitat suitability; moderately suitable areas, indicating regions with moderate habitat suitability; and highly suitable areas, denoting regions with high habitat suitability.
Land 14 00638 g006
Figure 7. Habitat suitability index of Michelia chapensis under future climate scenarios.
Land 14 00638 g007
Figure 8. Changes in the suitable growing areas for Michelia chapensis under future climate scenarios.
Land 14 00638 g008
Figure 9. Changes in the centroid of the potential of Michelia chapensis under different climate scenarios. Arrows indicate the possible direction and magnitude of centroid shifts over time. (a) The trajectory of centroid shift under the SSP126 scenario; (b) The trajectory of centroid shift under the SSP585 scenario.
Land 14 00638 g009
Table 1. Evaluation results of different models. EMmean, EMmedian, EMca, and EMwmean represent four ensemble methods for integrating SDMs. These methods enhance prediction accuracy and robustness by calculating the mean, median, committee average, and weighted mean of model predictions, respectively.
ModelsTSSAUCKAPPA
MeanSDCVMeanSDCVMeanSDCV
GLM0.65760.01810.02740.87530.00730.00830.52060.01400.0270
GBM0.80920.01140.01410.95780.00340.00360.73480.01750.0238
GAM0.69760.02180.03130.90380.00920.01020.58160.02440.0420
CTA0.71330.05680.07960.87520.03360.03840.58190.06920.1190
ANN0.66780.03730.05580.87200.02520.02890.56370.04180.0742
MARS0.67890.01330.01960.88840.00910.01020.55420.01430.0258
RF0.98670.00490.00500.99980.00040.00040.98150.00570.0058
MAXENT0.69920.02380.03400.92630.01030.01110.62710.03220.0513
EMmean0.7340NA 1NA0.9210NANA0.3990NANA
EMmedian0.7360NANA0.9120NANA0.3420NANA
EMca0.7540NANA0.9500NANA0.6220NANA
EMwmean0.7350NANA0.9200NANA0.3920NANA
1 the SD and CV columns for the ensemble model are left blank, as its final output is a composite of predictions from multiple base models, precluding the direct calculation of the standard deviation and coefficient of variation.
Table 2. Changes in the suitable areas and distribution range of Michelia chapensis under different climate scenarios compared to current conditions. “Gain”, “Loss”, and “Stable Suitable Area” represent changes in suitable areas compared to current conditions. “Net Change in Suitable Area” indicates the percentage of these changes relative to current conditions.
Climate ModelsTimeCurrent Rang (km2)Gain (km2)Loss (km2)Stable Suitable Area (km2)Net Change in Suitable Area (km2)
ssp1262030s1,587,822196,69387,0171,697,4986.91
2050s1,587,822185,494153,9121,619,4041.99
2070s1,587,822286,44479,5581,794,70813.03
2090s1,587,822294,91143,5371,839,19615.83
ssp5852030s1,587,822268,50233,4461,822,87814.80
2050s1,587,822315,60885,9161,817,51414.47
2070s1,587,822273,582186,2251,675,1795.50
2090s1,587,822202,039504,1711,285,690−19.03
Disclaimer/Publisher’s Note: The statements, opinions and data contained in all publications are solely those of the individual author(s) and contributor(s) and not of MDPI and/or the editor(s). MDPI and/or the editor(s) disclaim responsibility for any injury to people or property resulting from any ideas, methods, instructions or products referred to in the content.

