Article

Spatial and Temporal Changes and Influencing Factors of Mercury in Urban Agglomeration Land Patterns: A Case from Changchun Area, Old Industrial Base of Northeast China

by
Zhe Zhang
1,†,
Zhaojun Wang
1,†,
Jing Zong
1,
Hongjie Zhang
1,
Yufei Hu
1,
Yuliang Xiao
1,
Gang Zhang
1,2,3,4,* and
Zhenxin Li
1,2,4,*
1
School of Environment, Northeast Normal University, Changchun 130117, China
2
State Environmental Protection Key Laboratory of Wetland Ecology and Vegetation Restoration, Changchun 130024, China
3
Institute of Grassland Science, Northeast Normal University, Changchun 130024, China
4
Key Laboratory of Vegetation Ecology, Ministry of Education, Northeast Normal University, Changchun 130024, China
*
Authors to whom correspondence should be addressed.
These authors contributed equally to this work.
Land 2025, 14(3), 652; https://doi.org/10.3390/land14030652
Submission received: 12 February 2025 / Revised: 13 March 2025 / Accepted: 18 March 2025 / Published: 19 March 2025

Abstract

:
Mercury, a global pollutant with high biotoxicity, is widely distributed in soils, water bodies, and the atmosphere. Anthropogenic activities such as industrial emissions and coal combustion release large quantities of mercury into the environment, posing health risks to human populations. Strict implementation of the Minamata Convention and innovative remediation technologies can mitigate escalating environmental and public health risks. This study investigated the spatiotemporal dynamics of mercury in soils and atmosphere across four spatial scales (central city, county, township, and village) within the Changchun urban agglomeration, China. During spring, summer, and autumn of 2023, surface soil and atmospheric mercury concentrations (at 0 cm and 100 cm) were measured using LUMEX RA-915+ at 361 sites. Soil mercury exhibited seasonal variability, with a mean concentration of 46.2 µg/kg, showing peak values in spring and troughs in summer; concentrations decreased by 29.40% from spring to summer, followed by a 27.85% rebound in autumn. Spatially, soil mercury concentrations exhibited a core–periphery decreasing gradient (central city > county > township > village). Average concentrations at county, township, and village levels were 9.92%, 35.07%, and 42.11% lower, respectively, than those in the central city. Atmospheric mercury displayed seasonal variations; mean concentrations at 0 cm and 100 cm heights were 6.13 ng/m3 and 6.75 ng/m3, respectively, both peaking in summer. At 0 cm, summer concentrations increased by 35.61% compared to spring, then declined by 35.96% in autumn; at 100 cm, summer concentrations rose by 49.39% from spring and decreased by 31.08% in autumn. Atmospheric mercury at both heights decreased from the central city to the peripheries, with reductions of approximately 40% at 0 cm and 37–39% at 100 cm. Atmospheric mercury dynamics were significantly correlated with meteorological parameters such as temperature and humidity. Spatial autocorrelation analysis revealed scale-dependent clustering patterns: soil mercury Moran’s I ranked central city > county > village > township, while atmospheric mercury followed township > village > county > central city. Structural equation modeling demonstrated that different spatial scales had a significant negative effect on soil mercury concentrations, atmospheric mercury concentrations at 0 cm and 100 cm, and mercury and its compounds emissions. Organic matter content had a significant positive effect on soil mercury content. Temperature and humidity positively influenced near-surface atmospheric mercury. This multi-scale approach elucidates urban agglomeration mercury dynamics, highlighting core–periphery pollution gradients and seasonal patterns, thereby providing empirical evidence for regional mercury transport studies and providing a scientific foundation for future heavy metal management strategies.

1. Introduction

Mercury (Hg) is a toxic, persistent, and bioconcentrated pollutant [1,2,3] which is globally abundant and present in soil, water bodies, and the atmosphere. Mercury is released into the environment through natural processes, including volcanic eruptions, geothermal activity, forest fires, and human activities [4,5]. It undergoes long-range transport through air masses and enters ecosystems through atmospheric deposition, accumulating in the food chain [6,7], which has implications for ecosystem health.
In urban ecosystems, urban mercury concentrations are closely related to human activities [8], and the main sources of contamination are fossil fuel combustion in industrial areas, mercury-containing waste emissions, long-term human activities in commercial areas, and improper disposal of household waste [9,10,11]. Li et al. [12] evaluated soil mercury contamination in an urban area of Beijing, China, and found that the total mercury content of surface soil ranged from 12.1 to 8487 ng/g, with higher content levels in the city center. Another study analyzed the surface soil mercury concentration and distribution in Shenzhen, and found that the average soil mercury value in Shenzhen was 70.52 ng/g, 37% of the sample sites had soil mercury concentrations exceeding the soil background value, and 5% of the sample sites were at a moderate or higher mercury contamination level [13]. Soil mercury concentration levels are generally higher in mining areas. For example, total mercury concentrations in soils in the Wanshan mining area in Guizhou, China, soils with high mercury content near or in contact with slag piles in mining areas, ranged from 1.1 to 790 mg/kg [14]. Soils represent the largest global mercury reservoir [15]. Consequently, crops cultivated in mercury-contaminated soils accumulate elevated methylmercury (MeHg) concentrations [16]. While seafood consumption remains the dominant pathway of methylmercury exposure globally [17], recent evidence indicates that methylmercury-contaminated rice is also a critical exposure source [18]. In mercury-contaminated regions with low fish consumption, dietary rice consumption constitutes the predominant pathway for human MeHg exposure [19].
Natural sources of atmospheric mercury and anthropogenic emissions are key contributors to the global mercury budget [20]. As a source of mercury emissions, urban areas have higher atmospheric mercury concentrations, deposition rates, and fluxes than remote areas [21]. For instance, atmospheric mercury concentrations in Guangzhou (4.86 ng/m3 [22]), Guiyang (8.8 ng/m3 [23]), and Beijing (6.2–24.7 ng/m3 [24]) all exceed the global background range of 1.3–1.7 ng/m3 [25]. Moreover, according to statistics, the atmospheric mercury concentrations in China are significantly higher than in developed countries such as the United States due to the absolute dominance of oil and coal in our energy structure [26,27], with mercury emissions from coal combustion accounting for about 37–54% of total mercury emissions [28]. As centers of economic and industrial development, cities are the main consumers of coal and emitters of atmospheric mercury, hence the high atmospheric mercury concentrations in urban areas in China [29]. In addition, the atmospheric mercury content in mining areas is high. For example, in the mercury mining areas of Guizhou Province, the total atmospheric gaseous mercury concentration is 7.90–354 ng/m3 in winter and about 12.7–468 ng/m3 in summer [30].
Urban agglomeration is one of the main carrying spaces for human activities [31], and is the place where people’s production and life are concentrated. Urban agglomeration is not an isolated spatial unit, but a densely populated and integrated area with closely connected socio-economic activities, including not only the core urban area, but also the peripheral areas closely related to the core [32]. Mercury contamination in urbanizing regions has garnered global attention due to its persistence and cross-media mobility. Previous studies predominantly focused on mercury distribution within single administrative scales (such as at the city level [33,34] or town level [35]), limiting the scope to a specific scale of investigation and generally ignoring distributional characteristics across multiple scales. In addition, findings from mercury studies often lack generalizability due to socio-economic and environmental heterogeneity inherent to different administrative regions. Moreover, in rapidly urbanizing areas, the combined impacts of seasonal climate fluctuations and multi-scale anthropogenic drivers (e.g., industrial emissions and land-use changes) on mercury dynamics remain poorly quantified. As a core city within the traditional industrial base of Northeast China, Changchun City is characterized by an industrial structure dominated by automotive manufacturing, chemical industries, and metallurgy. These sectors may release substantial amounts of mercury during production processes, rendering the region a representative area for investigating mercury pollution. Therefore, this study focuses on the Changchun urban agglomeration, a rapidly urbanizing region in northeast China. A multi-seasonal investigation was conducted at four scales (central city, county, township, and village) to address three key research questions: (1) spatiotemporal variation patterns of soil and atmospheric mercury concentrations across spatial scales (central city, county, township, and village) and seasons; (2) spatial aggregation patterns of soil and atmospheric mercury distribution at different scales; and (3) quantification of driving factors, including soil properties, climatic parameters, and anthropogenic activities (emissions of mercury and its compounds), on mercury dynamics in the soil and the atmosphere. This research seeks to establish fundamental theoretical foundations for comprehending the spatial and temporal dynamics of metallic mercury and its influencing factors within other urban agglomerations.

2. Materials and Methods
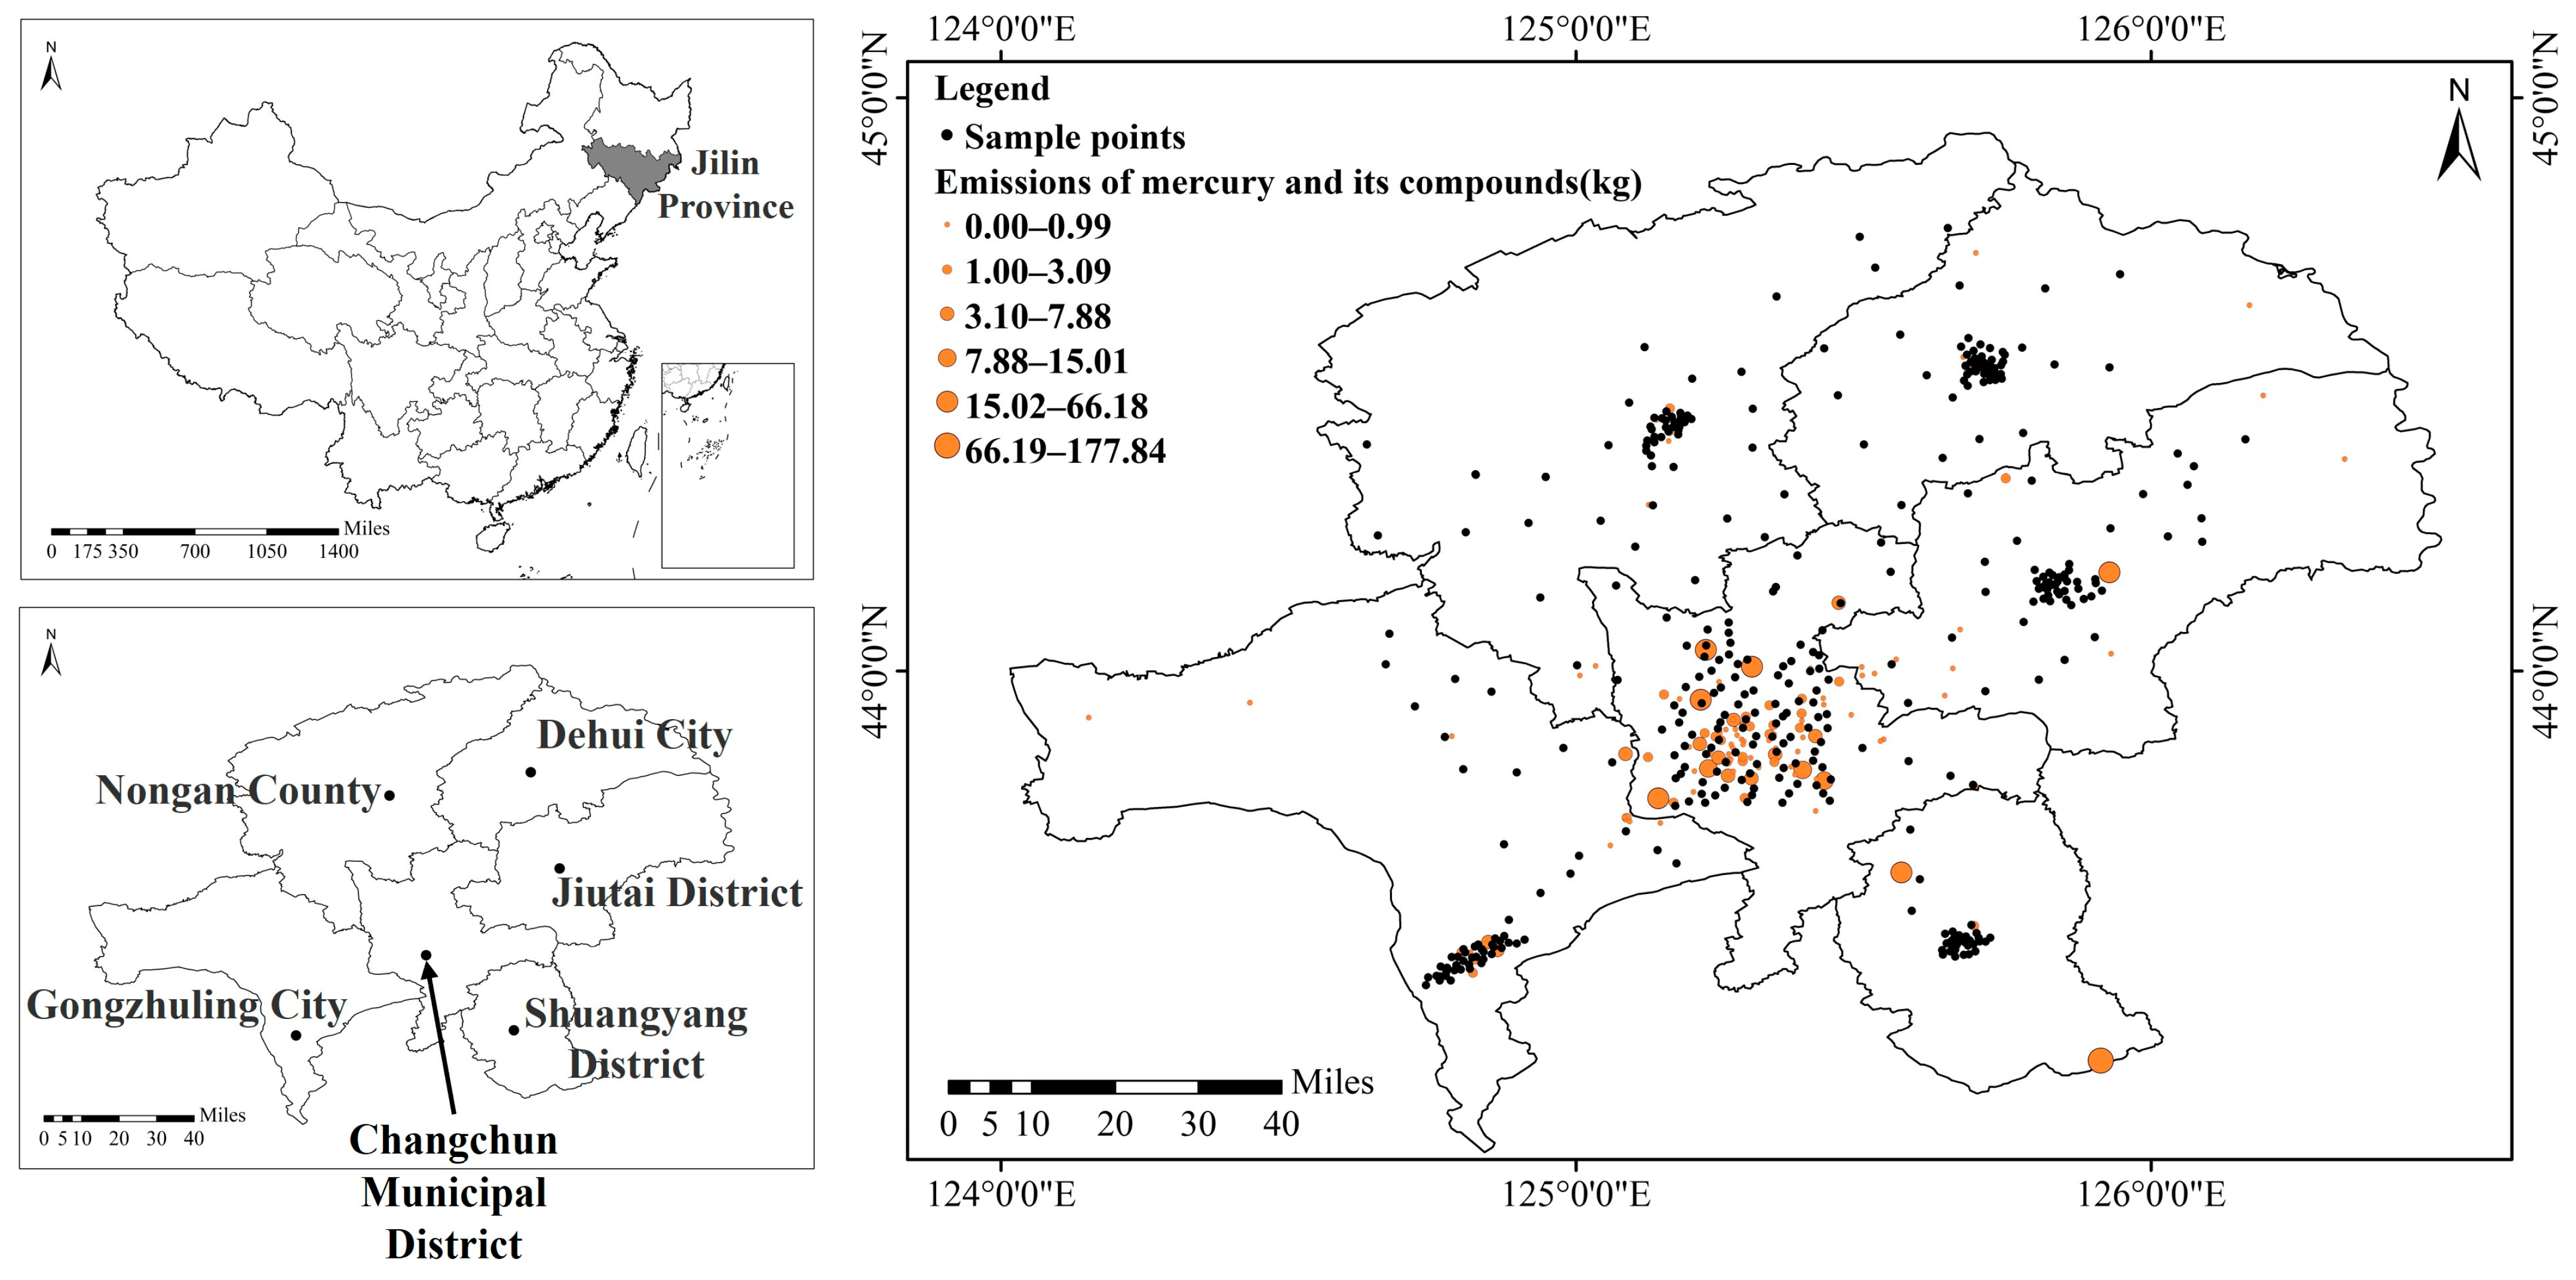
2.1. Study Area

The study area is Changchun City, located in the north-central region of Jilin Province, bordering Siping City and Jilin City, and Songyuan City and Heilongjiang Province, with a geographic location spanning longitude 124°32′21″–127°05′12″ E and latitude 43°15′36″–45°15′02″ N. The total area of Changchun is about 24,744 km2 with rich soil types, mainly black soil, meadow soil, and black calcium soil, and the climate type of a temperate continental climate, with an average annual temperature of 4.8 °C. Nongan County, a county under the jurisdiction of Changchun City, is situated in the northwest of Changchun City. With an area of 5400 km2, it is a major agricultural county in the country. Dehui City, a county-level city, is located in the northeast of Changchun City. With an area of 3322.24 km2, it belongs to a typical agricultural region. Jiutai District, positioned in the northeast of Changchun City, has an area of 3375.27 km2 and is a national key commodity grain production base. Gongzhuling City, a county-level city, is located in the south of Changchun City. With an area of 4058 km2, it is a large agricultural city. Shuangyang District is on the southeast side of Changchun City. With an area of 1677.42 km2, it is a national-level ecological demonstration area.

2.2. Sample Point Layout and Processing

In this study, the sampling points of the Changchun urban agglomeration were laid out as shown in Figure 1, and the study adopted the grid uniform distribution method, dividing the study area into a sampling unit of 5 km × 5 km, and the main urban area was divided into a sampling unit of 2.5 km × 2.5 km. A total of 361 sampling points were deployed (107 in the main city of Changchun Municipal District, 56 in Nongan County, 52 in Dehui City, 57 in Jiutai District, 55 in Gongzhuling City, and 34 in Shuangyang District). The study area was divided into four spatial scales based on administrative boundaries and functional characteristics: (1) central city (core districts with high population density and industrial activity): 107 sampling points; (2) county (suburban areas with mixed urban rural features): 168 sampling points; (3) township (peri-urban areas with agricultural and light industrial activities): 35 sampling points; (4) village (rural areas dominated by natural landscapes and low-intensity human activities): 51 sampling points.
In this study, sampling was carried out in May (spring), July (summer), and September (autumn) 2023. Soil samples were collected using the five-point mixing method, in which five equal samples were collected within a 1 m × 1 m area and homogeneously mixed into one sample. Before collecting, a stainless-steel shovel was used to remove debris such as surface plant leaves and twigs, and then, surface soil (0–5 cm) was collected at the sampling point, with each sample weighing about 500 g in a self-sealing bag. After the samples were brought back to the laboratory, plant and animal debris other than soil and stones were removed, mixed thoroughly, and air-dried. Subsequently, the samples were extracted using the tetrad method, ground, sieved in a 100-mesh nylon sieve, then stored for the measurement of soil pH, organic matter, and total mercury content.
At each sampling point, the total atmospheric mercury concentration was measured using a LUMEX RA-915+ (Russia, RU) mercury analyzer at heights of 0 cm and 100 cm, respectively, for 3 min at different heights, and one monitoring data point was obtained every 10 s, for a total of 18 monitoring data points, whose mean values were the total atmospheric mercury measurements at that sampling point. The mercury analyzer main unit employs high-frequency Zeeman-effect background correction atomic absorption spectroscopy, enabling the direct measurement of atmospheric mercury concentrations without requiring gold amalgam pre-concentration. This instrument features an ultra-low detection limit of 1 ng/m3 and a broad measurement range of 0–2 × 10⁴ ng/m3 for atmospheric mercury quantification, with a built-in mercury standard for automated calibration. At the same time, the latitude, longitude, and ambient conditions of each sampling point were recorded, as well as the meteorological factors including temperature, relative humidity, wind speed, wind direction, and barometric pressure.

2.3. Statistical Analysis

To reveal the spatial distribution characteristics and seasonal variation of soil and atmospheric mercury concentration in urban agglomeration, statistical analyses were performed using SPSS 26.0, including basic descriptive statistics, one-way ANOVA, and correlation analysis. Basic descriptive statistics including maximum, minimum, average, and one-way ANOVA analysis was performed to evaluate the difference in the mercury concentrations between different study areas. Pearson correlation analysis was used to find the correlation between soil pH, organic matter, meteorological factors, and mercury concentrations in different study areas. The mercury concentrations were mapped based on the inverse distance method using ArcGIS 10.8 software to allow the spatial patterns to be assessed. Spatial autocorrelation analysis was conducted to quantify the aggregation patterns of mercury concentrations across the Changchun urban agglomeration. Geoda 1.22 was used to calculate spatial weights, perform global and local spatial autocorrelation tests and spatial autocorrelation, and draw Moran scatter plots and spatial clustering maps. The methodological steps included Global Moran’s I Calculation (Equation (1)) and Local Spatial Autocorrelation (Equation (2)).
I = n i = 1 n j = 1 n w i j x i x ¯ x j x ¯ i = 1 n x i x ¯ 2 i = 1 n j = 1 n w i j ,
where n is the number of sampling points, xi and xj denote mercury concentrations at locations i and j, x ¯ is the mean mercury concentration, and wij represents the spatial weight matrix.
I i = x i x ¯ i = 1 n x i x ¯ 2 j = 1 n w i j x j x ¯
To further quantify the effects of various factors on soil mercury concentrations and atmospheric mercury concentrations at different heights in the Changchun urban agglomeration, and to identify key influencing factors, we developed a structural equation model (SEM) using R version 4.3.3. The model included spatial covariates (central city, county, township, and village) and environmental covariates categorized as: (1) soil properties (pH and organic matter content), (2) meteorological factors (temperature, air pressure, humidity, wind speed, and wind direction), and (3) anthropogenic factors (emissions of mercury and its compounds from industrial enterprises). Soil mercury and atmospheric mercury concentration (0 cm, 100 cm) were specified as response variables.

3. Results

3.1. Spatial and Temporal Characteristics of Soil Mercury

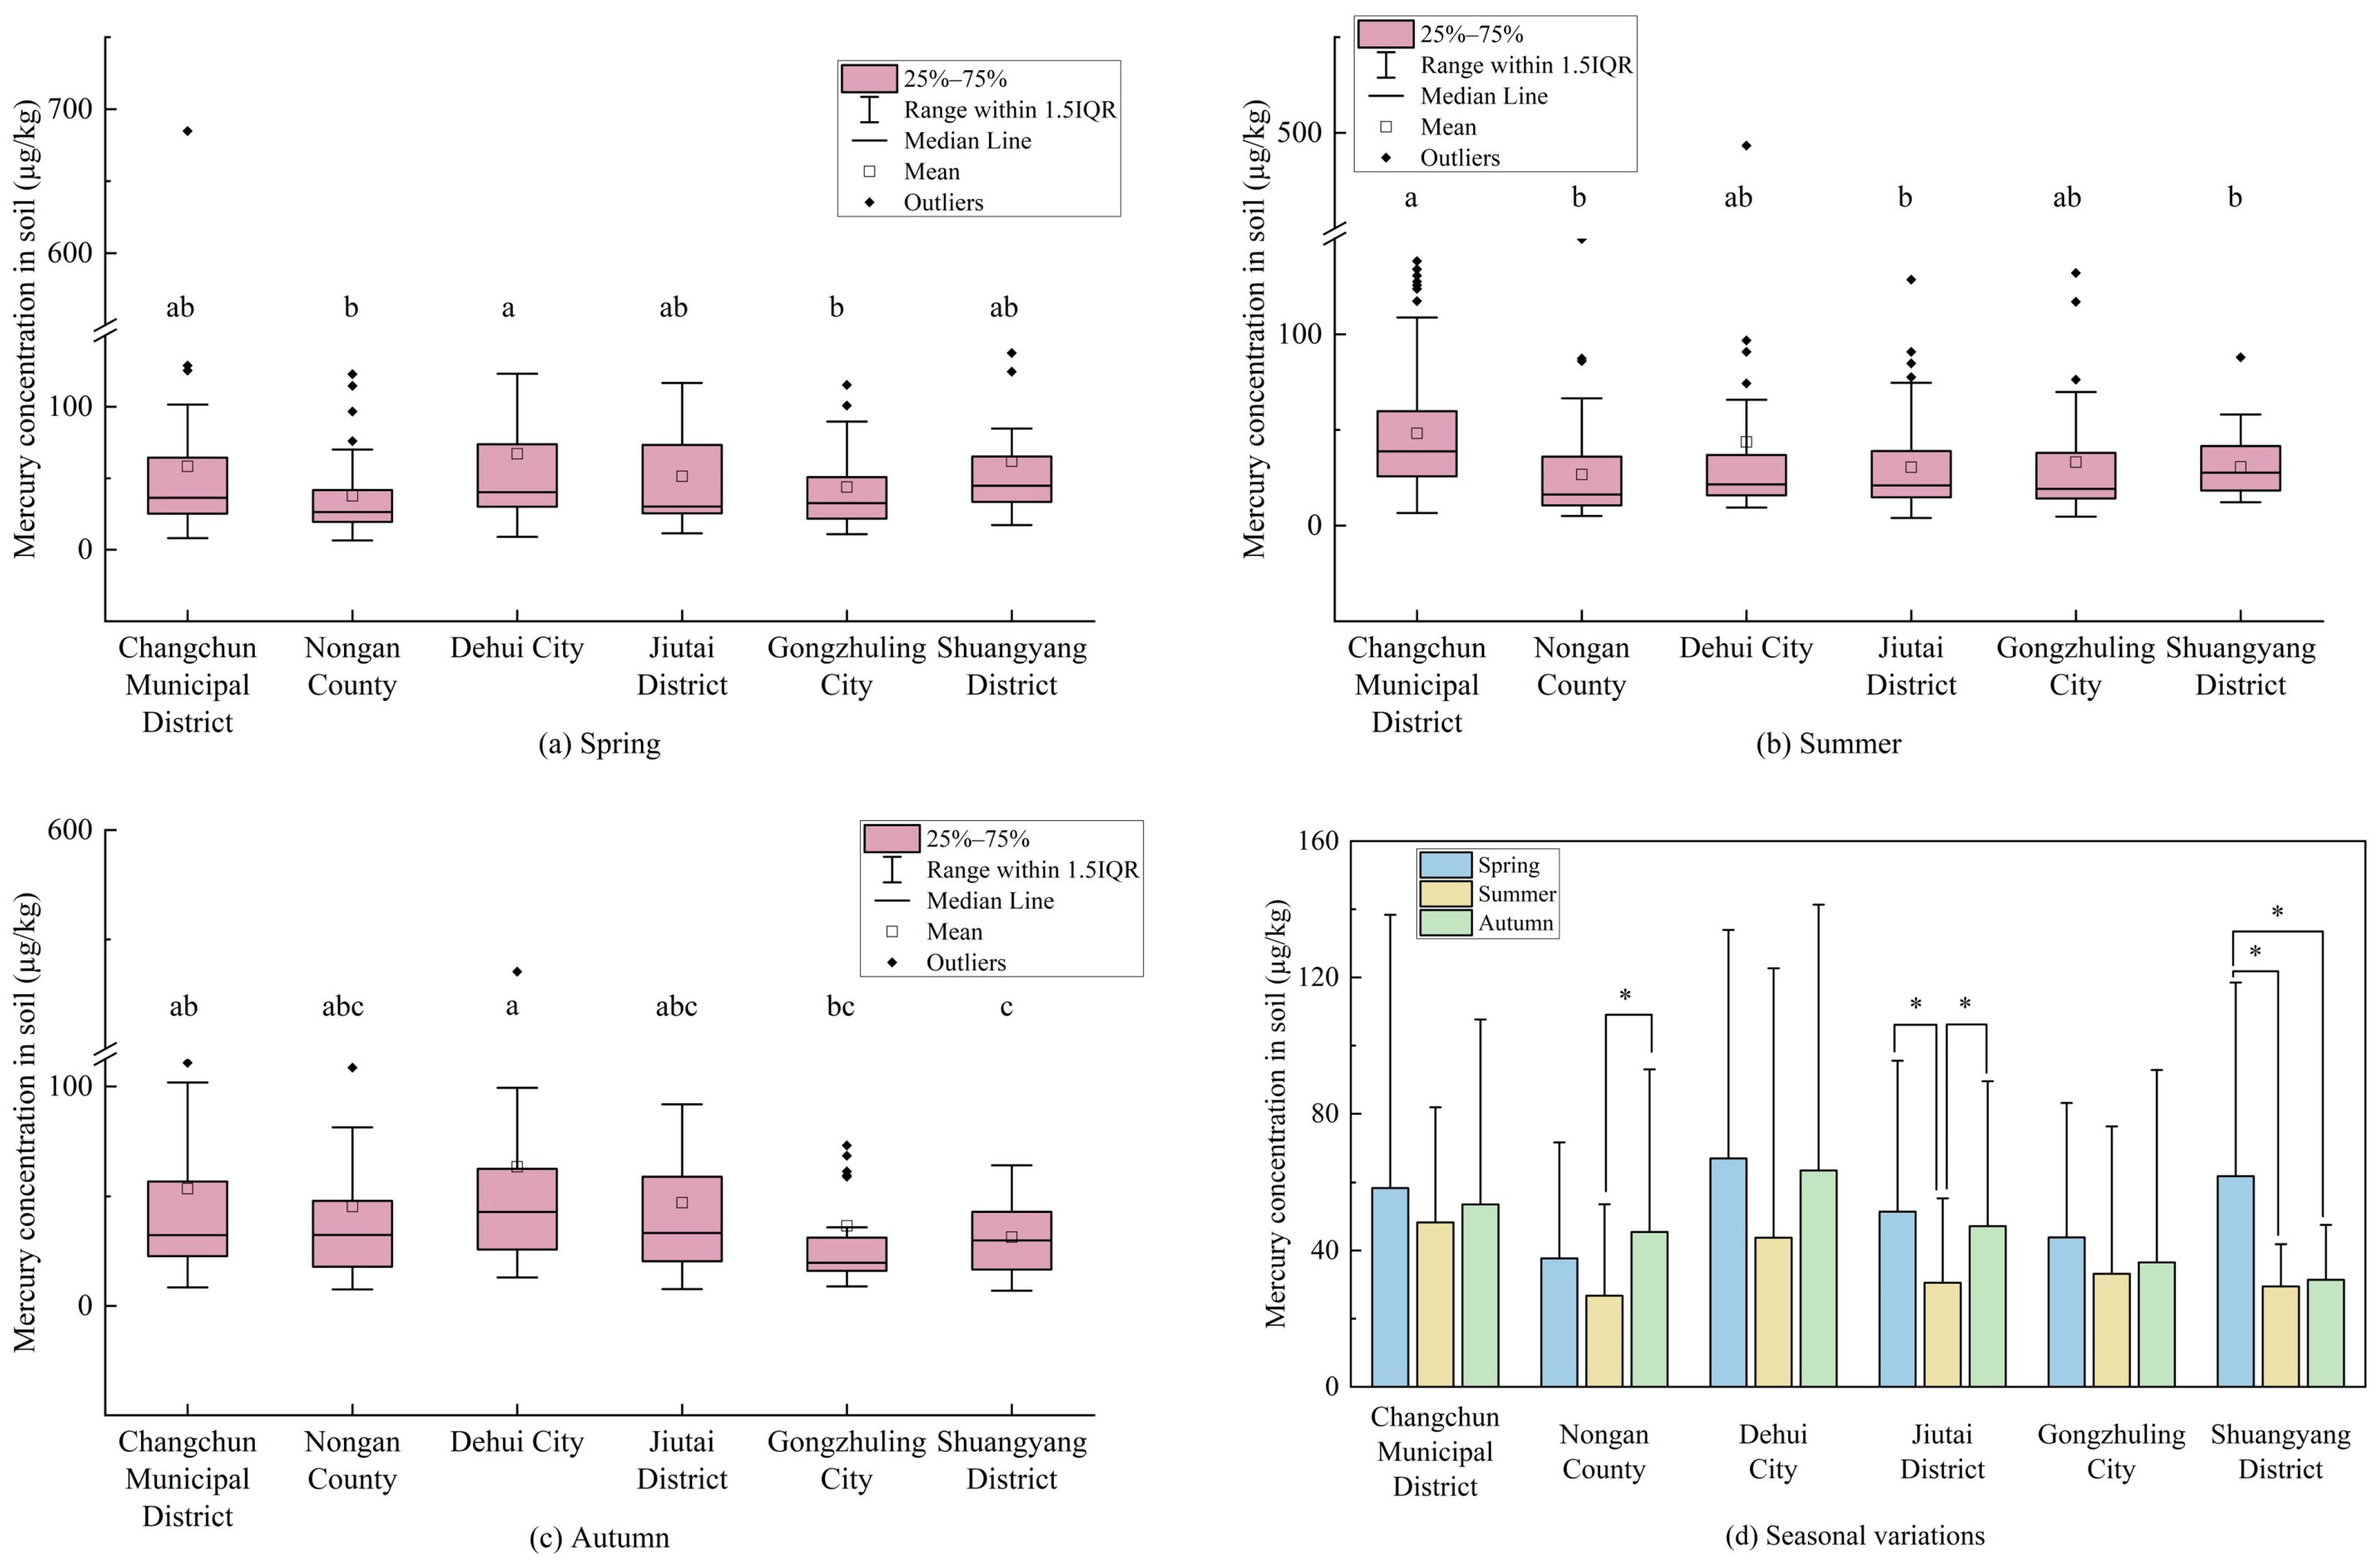
3.1.1. Seasonal Variations in the Soil Mercury Concentration

Statistics of the mercury content of heavy metal elements in the soil of the Changchun urban agglomeration in each season include the average values, range, and the coefficient of variation (CV). The coefficient of variation is used to characterize the degree of variability within the concentrations of soil heavy metals, which is the ratio of standard deviation to the mean value, reflecting the spatial variability among sampling points and the degree of dispersion of the data. Generally speaking, CV < 0.20 is considered low variability, 0.20 < CV < 0.50 observed as moderate variability, 0.50 < CV < 1.00 is ranged as high variability, while CV ≥ 1.00 shows exceptionally high variability [36].
The data of soil mercury concentrations within the Changchun urban agglomeration across different seasons, as presented in Table 1, reveal that the average soil mercury concentrations in the Changchun urban agglomeration during spring, summer, autumn, and overall were 53.4 ± 60.2, 37.7 ± 42.0, 48.2 ± 54.4, and 46.2 ± 39.5 µg/kg, respectively. It is evident that the soil mercury concentrations within the urban agglomeration followed the order of spring > autumn > summer, with the mean value surpassing the background soil mercury levels in Changchun City (0.04 mg/kg [37]).
From the statistical results of soil heavy metals in the Changchun urban agglomeration in each season in Figure 2, it can be seen that the order of soil mercury concentration in the Changchun urban agglomeration in spring is as follows: the average value of soil mercury concentration in Dehui City is 67.1 ± 66.9 µg/kg, in Shuangyang District 61.9 ± 56.7 µg/kg, in Changchun Municipal District 58.4 ± 80.0 µg/kg, in Jiutai District 51.4 ± 44.1 µg/kg, in Gongzhuling City 43.9 ± 39.3 µg/kg, and in Nongan County 37.7 ± 34.1 µg/kg. According to the results of the one-way ANOVA, there were significant differences in the soil mercury concentrations in spring between Dehui City and Gongzhuling City (p = 0.011) and Nongan County (p = 0.046). The average spring soil mercury concentrations in Changchun Municipal District, Dehui City, Jiutai District, Gongzhuling City, and Shuangyang District exceeded the background value of soil in Changchun City.
The order of soil mercury concentrations in the Changchun urban agglomeration during the summer is as follows: Changchun Municipal District 48.2 ± 33.7 µg/kg, Dehui City 43.7 ± 78.9 µg/kg, Gongzhuling City 33.2 ± 43.0 µg/kg, Jiutai District 30.5 ± 24.8 µg/kg, Shuangyang District 29.4 ± 12.4 µg/kg, and Nongan County 26.7 ± 26.9 µg/kg. According to the results of one-way ANOVA, there was a significant difference in the summer soil mercury concentration between Changchun Municipal District and Jiutai District (p = 0.009), Shuangyang District (p = 0.016), and Nongan County (p = 0.003). The average summer soil mercury concentrations in Changchun Municipal District and Dehui City exceeded the background value of soil in Changchun City.
The order of soil mercury concentrations in the Changchun urban agglomeration in autumn is as follows: 63.6 ± 77.8 µg/kg in Dehui City, 53.6 ± 54.1 µg/kg in Changchun Municipal District, 47.1 ± 42.4 µg/kg in Jiutai District, 45.4 ± 47.6 µg/kg in Nongan County, 36.5 ± 56.3 µg/kg in Gongzhuling City, and 31.4 ± 16.1 µg/kg in Shuangyang District. According to the results of one-way ANOVA, there was a significant difference between Dehui City and Gongzhuling City (p = 0.01) and Shuangyang District (p = 0.008), and there was a significant difference between Changchun Municipal District and Shuangyang District (p = 0.04). The average soil mercury concentrations in autumn in Changchun Municipal District, Nongan County, Dehui City, and Jiutai District exceeded the background value for soils in Changchun City.
In the three seasons, there was a significant difference between summer and autumn in Nongan County; spring and summer were significantly different from autumn in Jiutai District; spring was significantly different from summer and autumn in Shuangyang District; and no significant differences in the other administrative districts were found. In the Changchun urban agglomeration, soil mercury content changed with seasonal changes, with the lowest soil mercury content being in summer. Soil mercury concentrations in Changchun Municipal District, Dehui City, Jiutai District, Gongzhuling City and Shuangyang District were spring > autumn > summer, and in Nongan County, autumn > spring > summer.

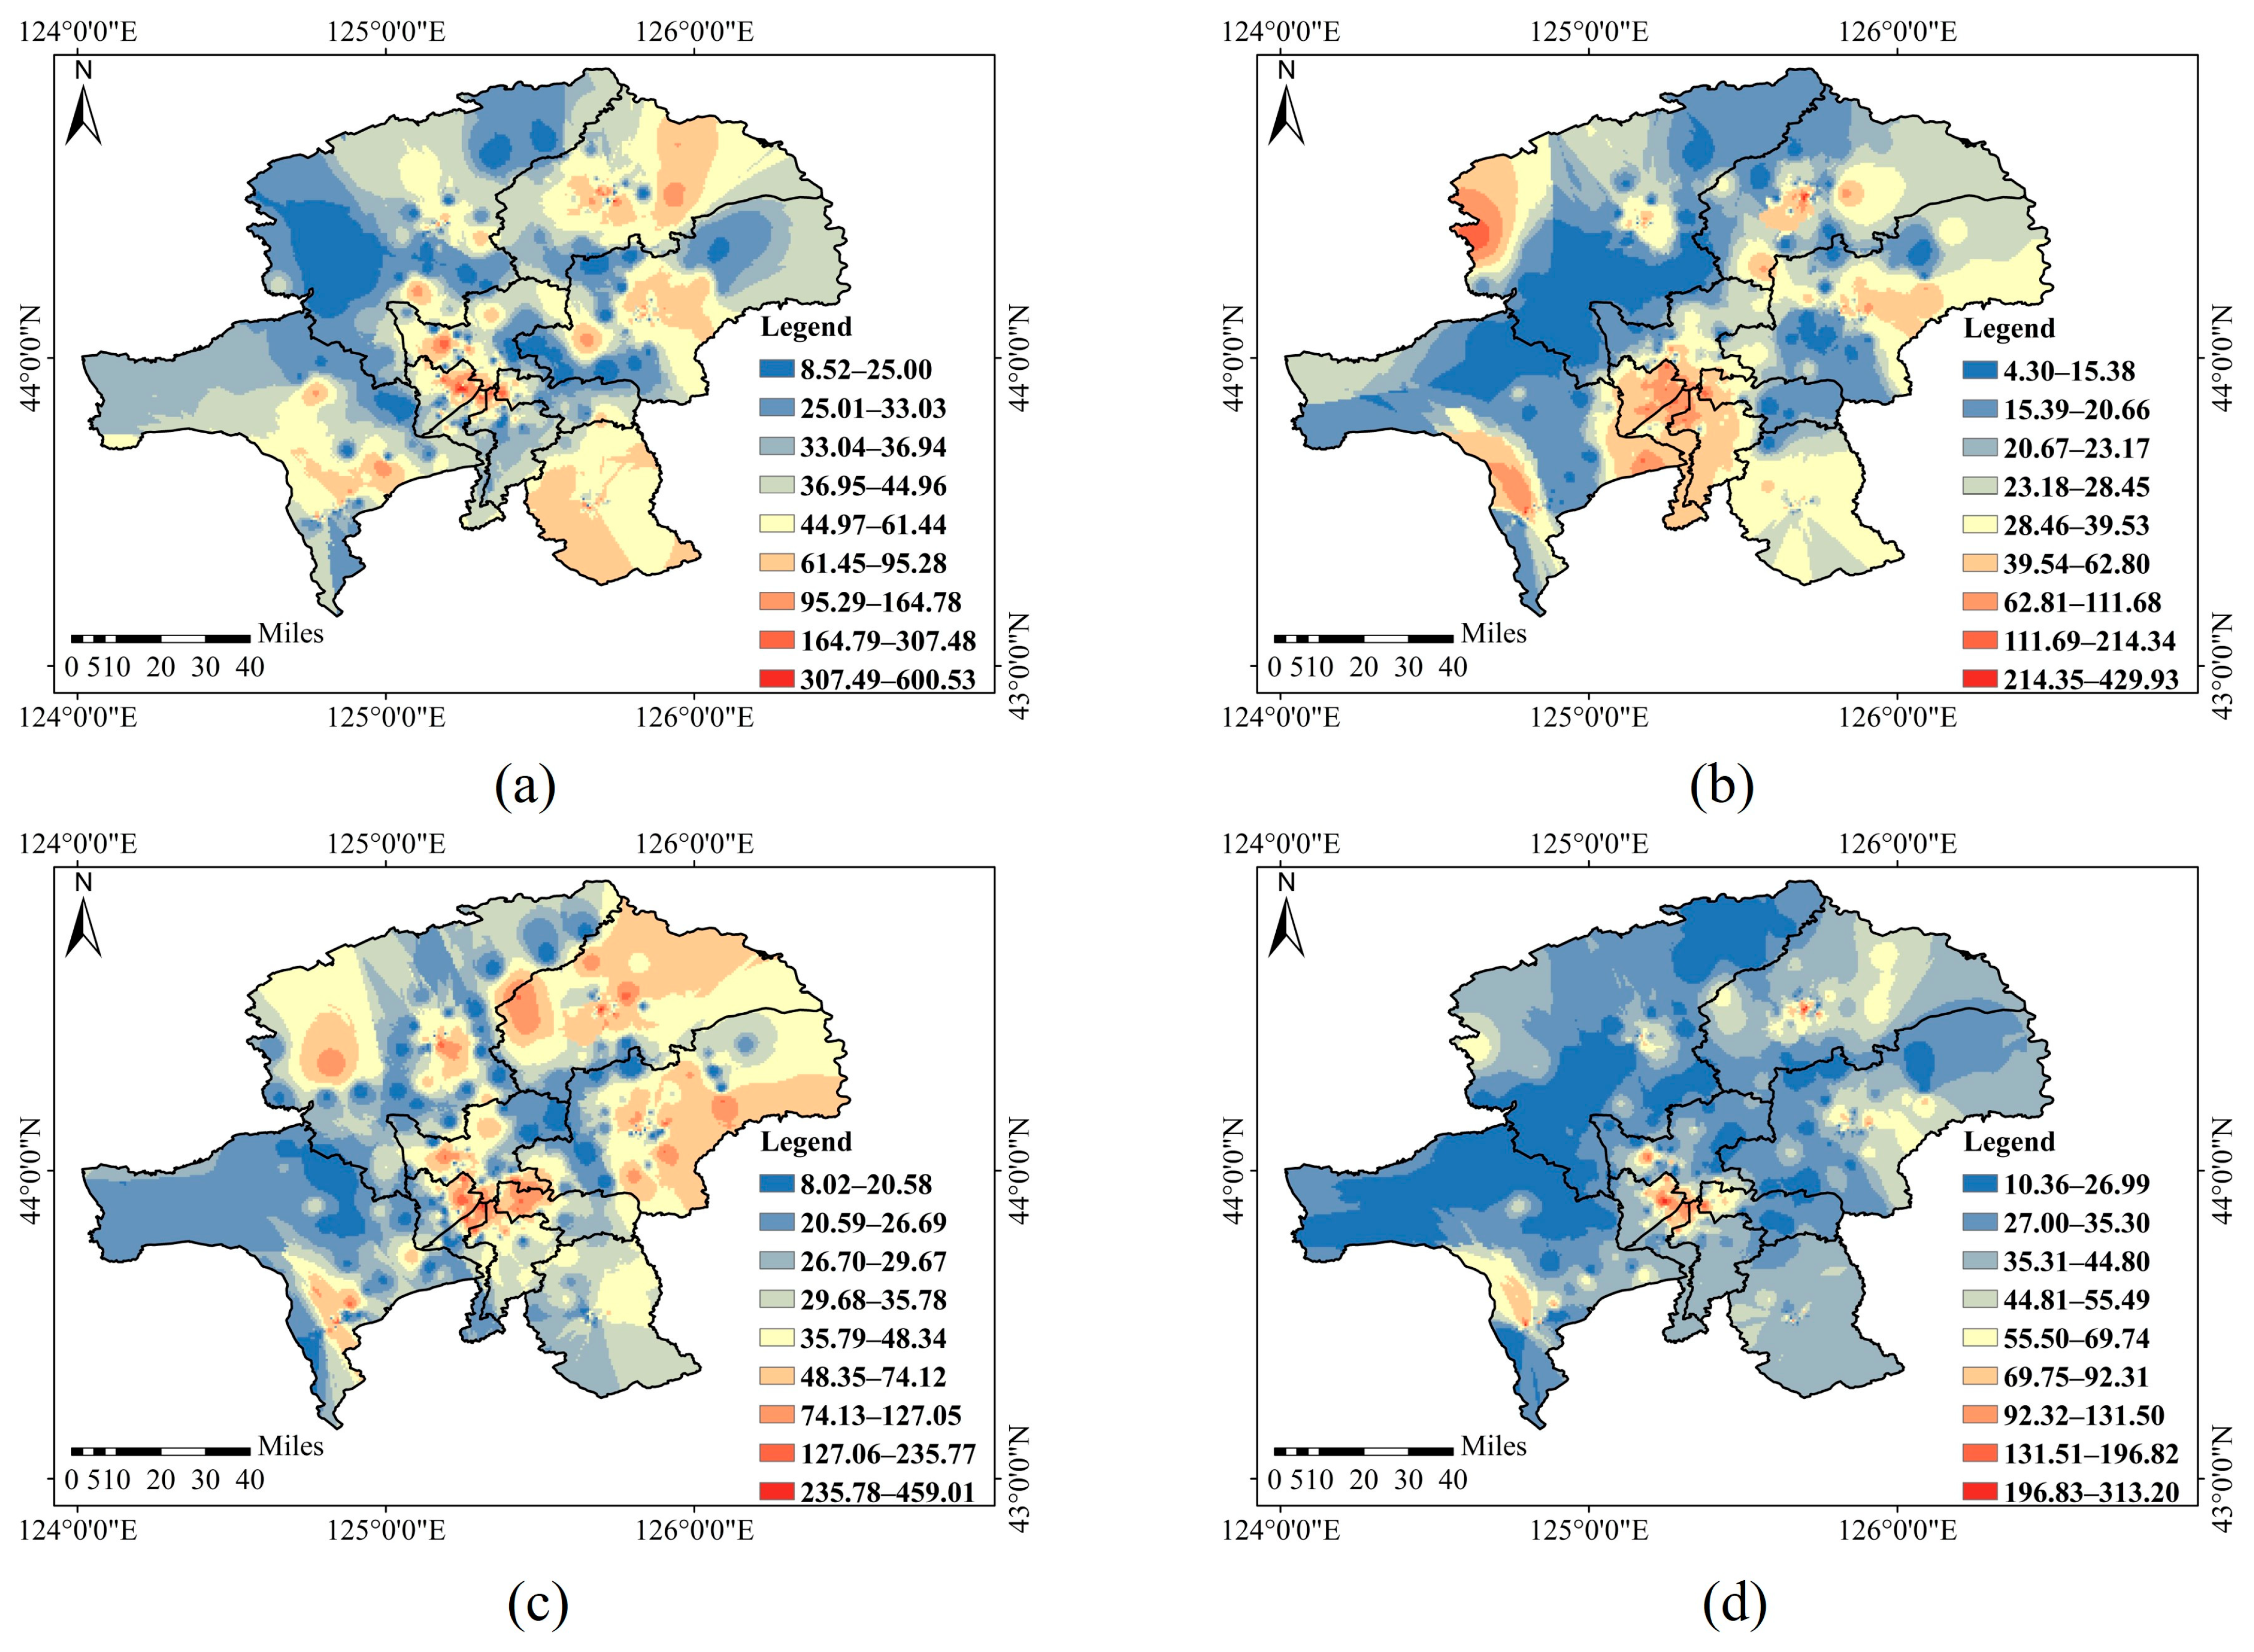
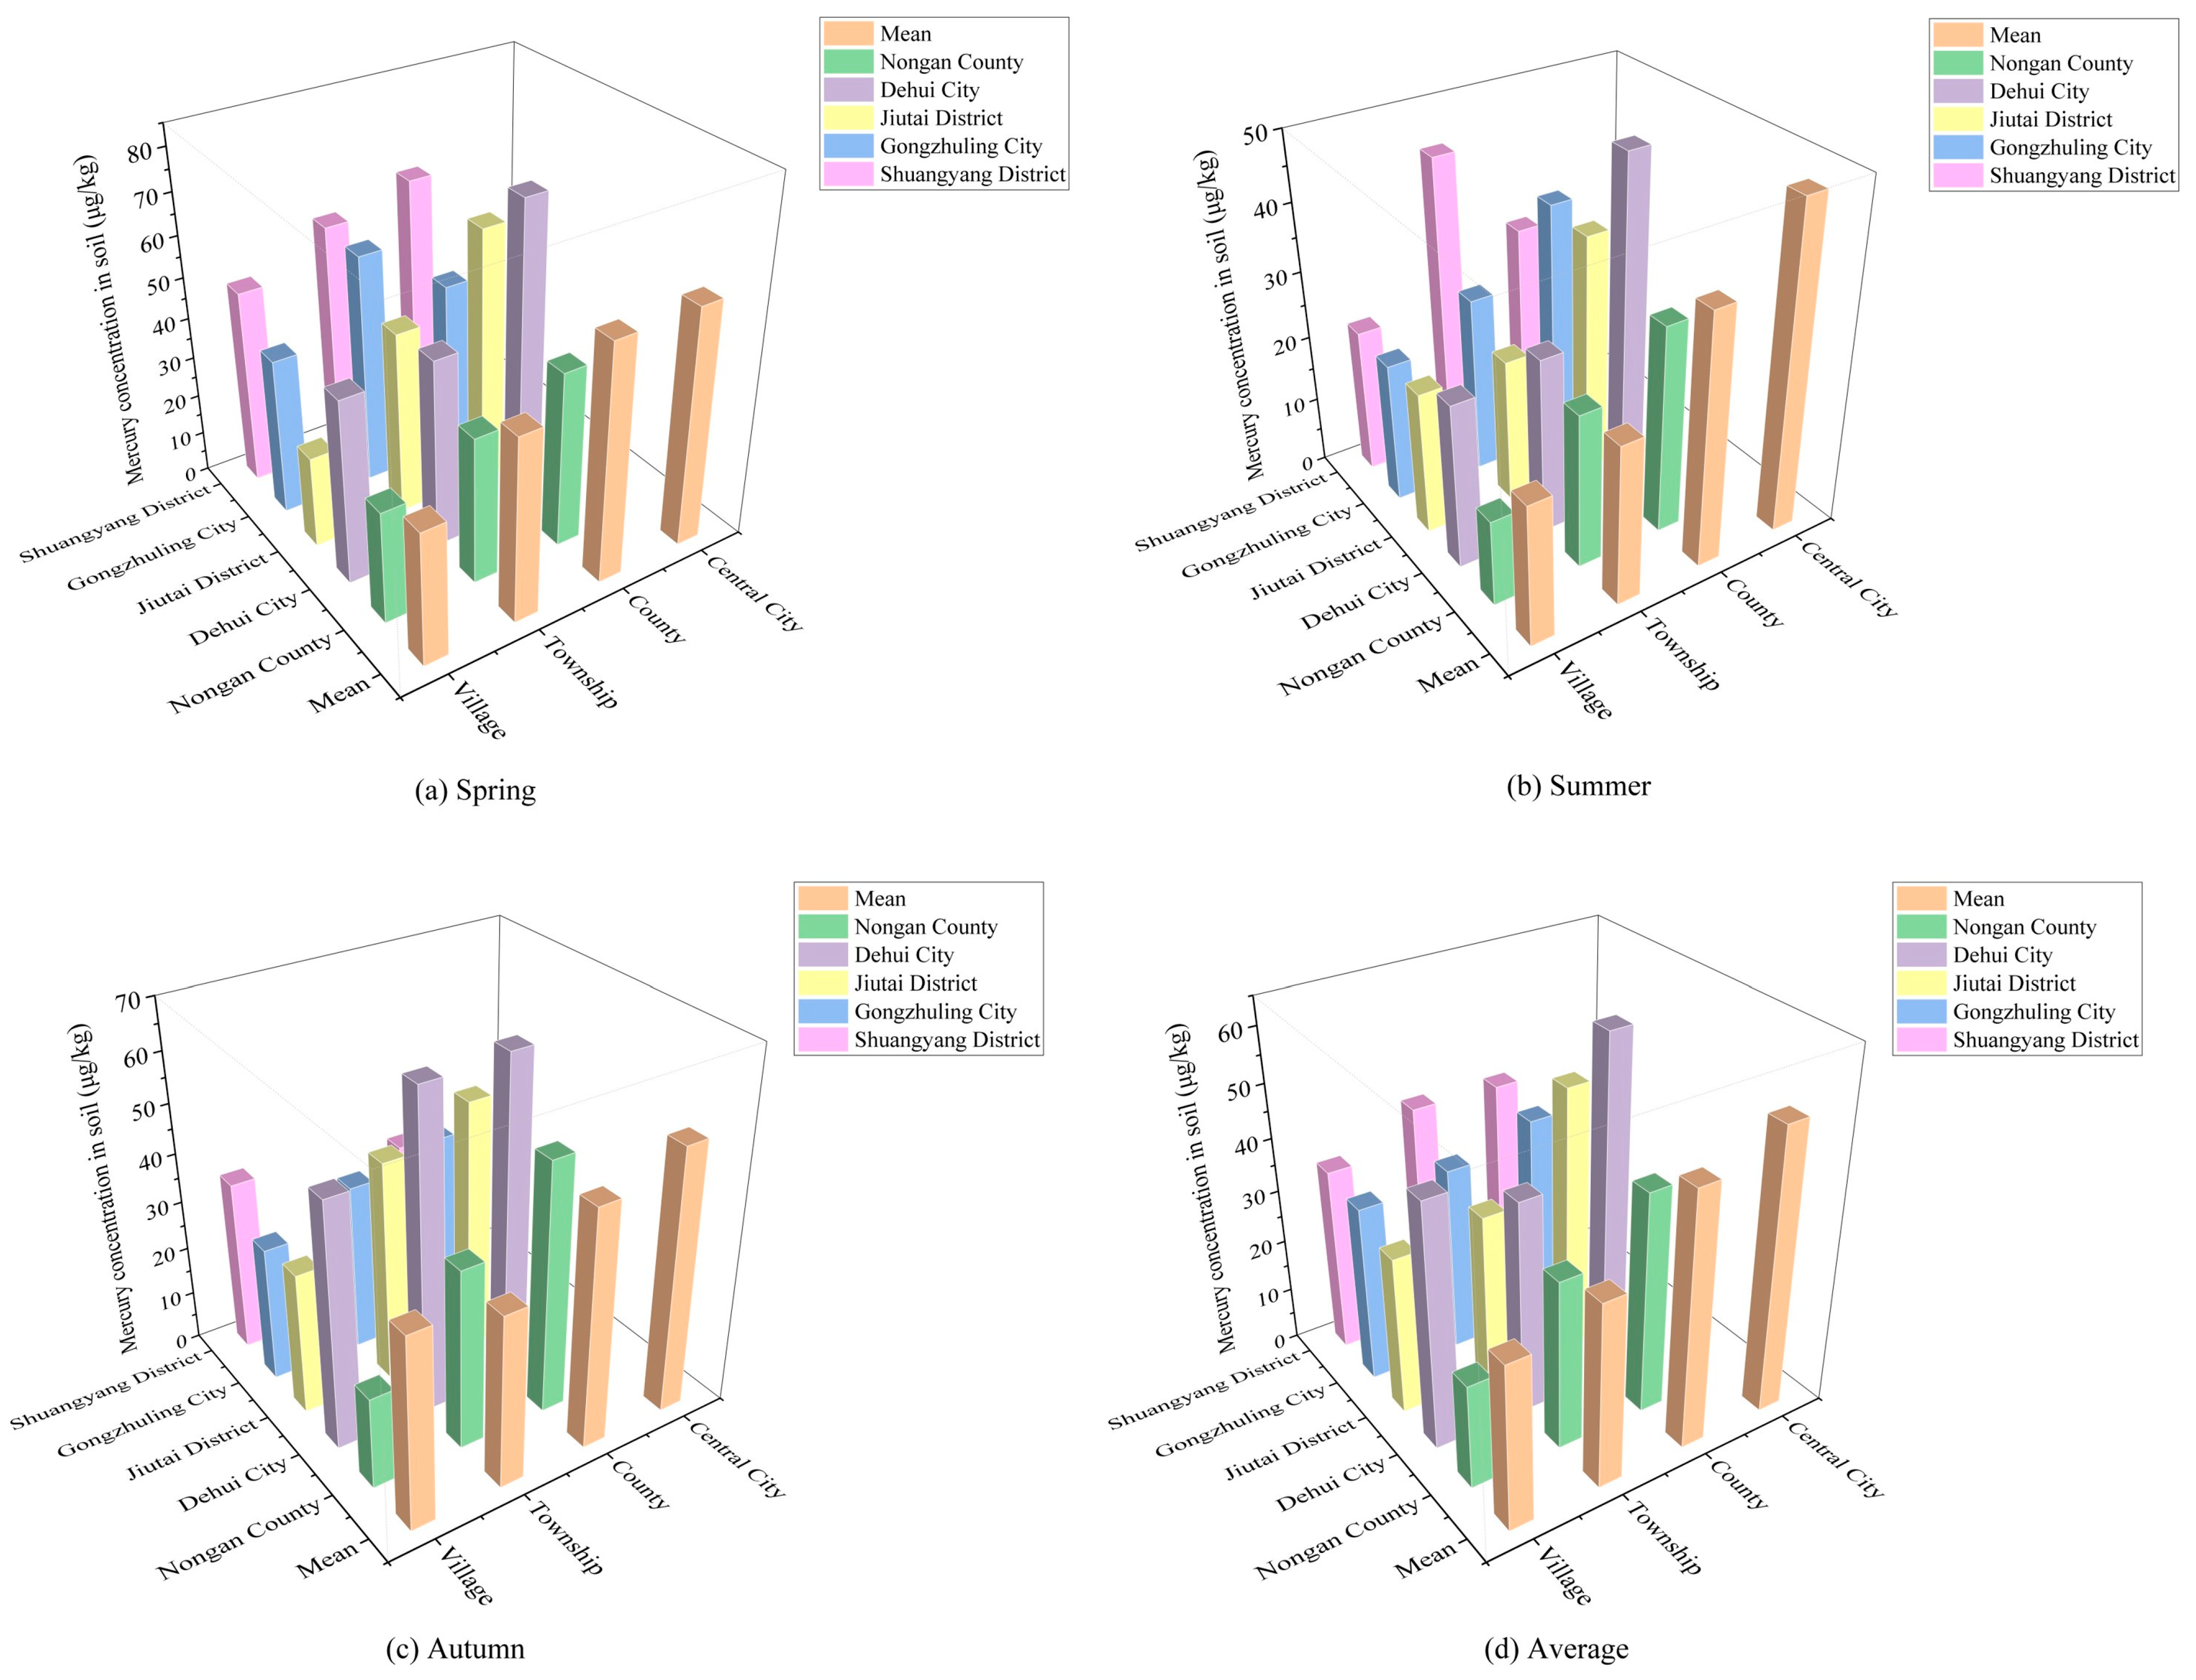
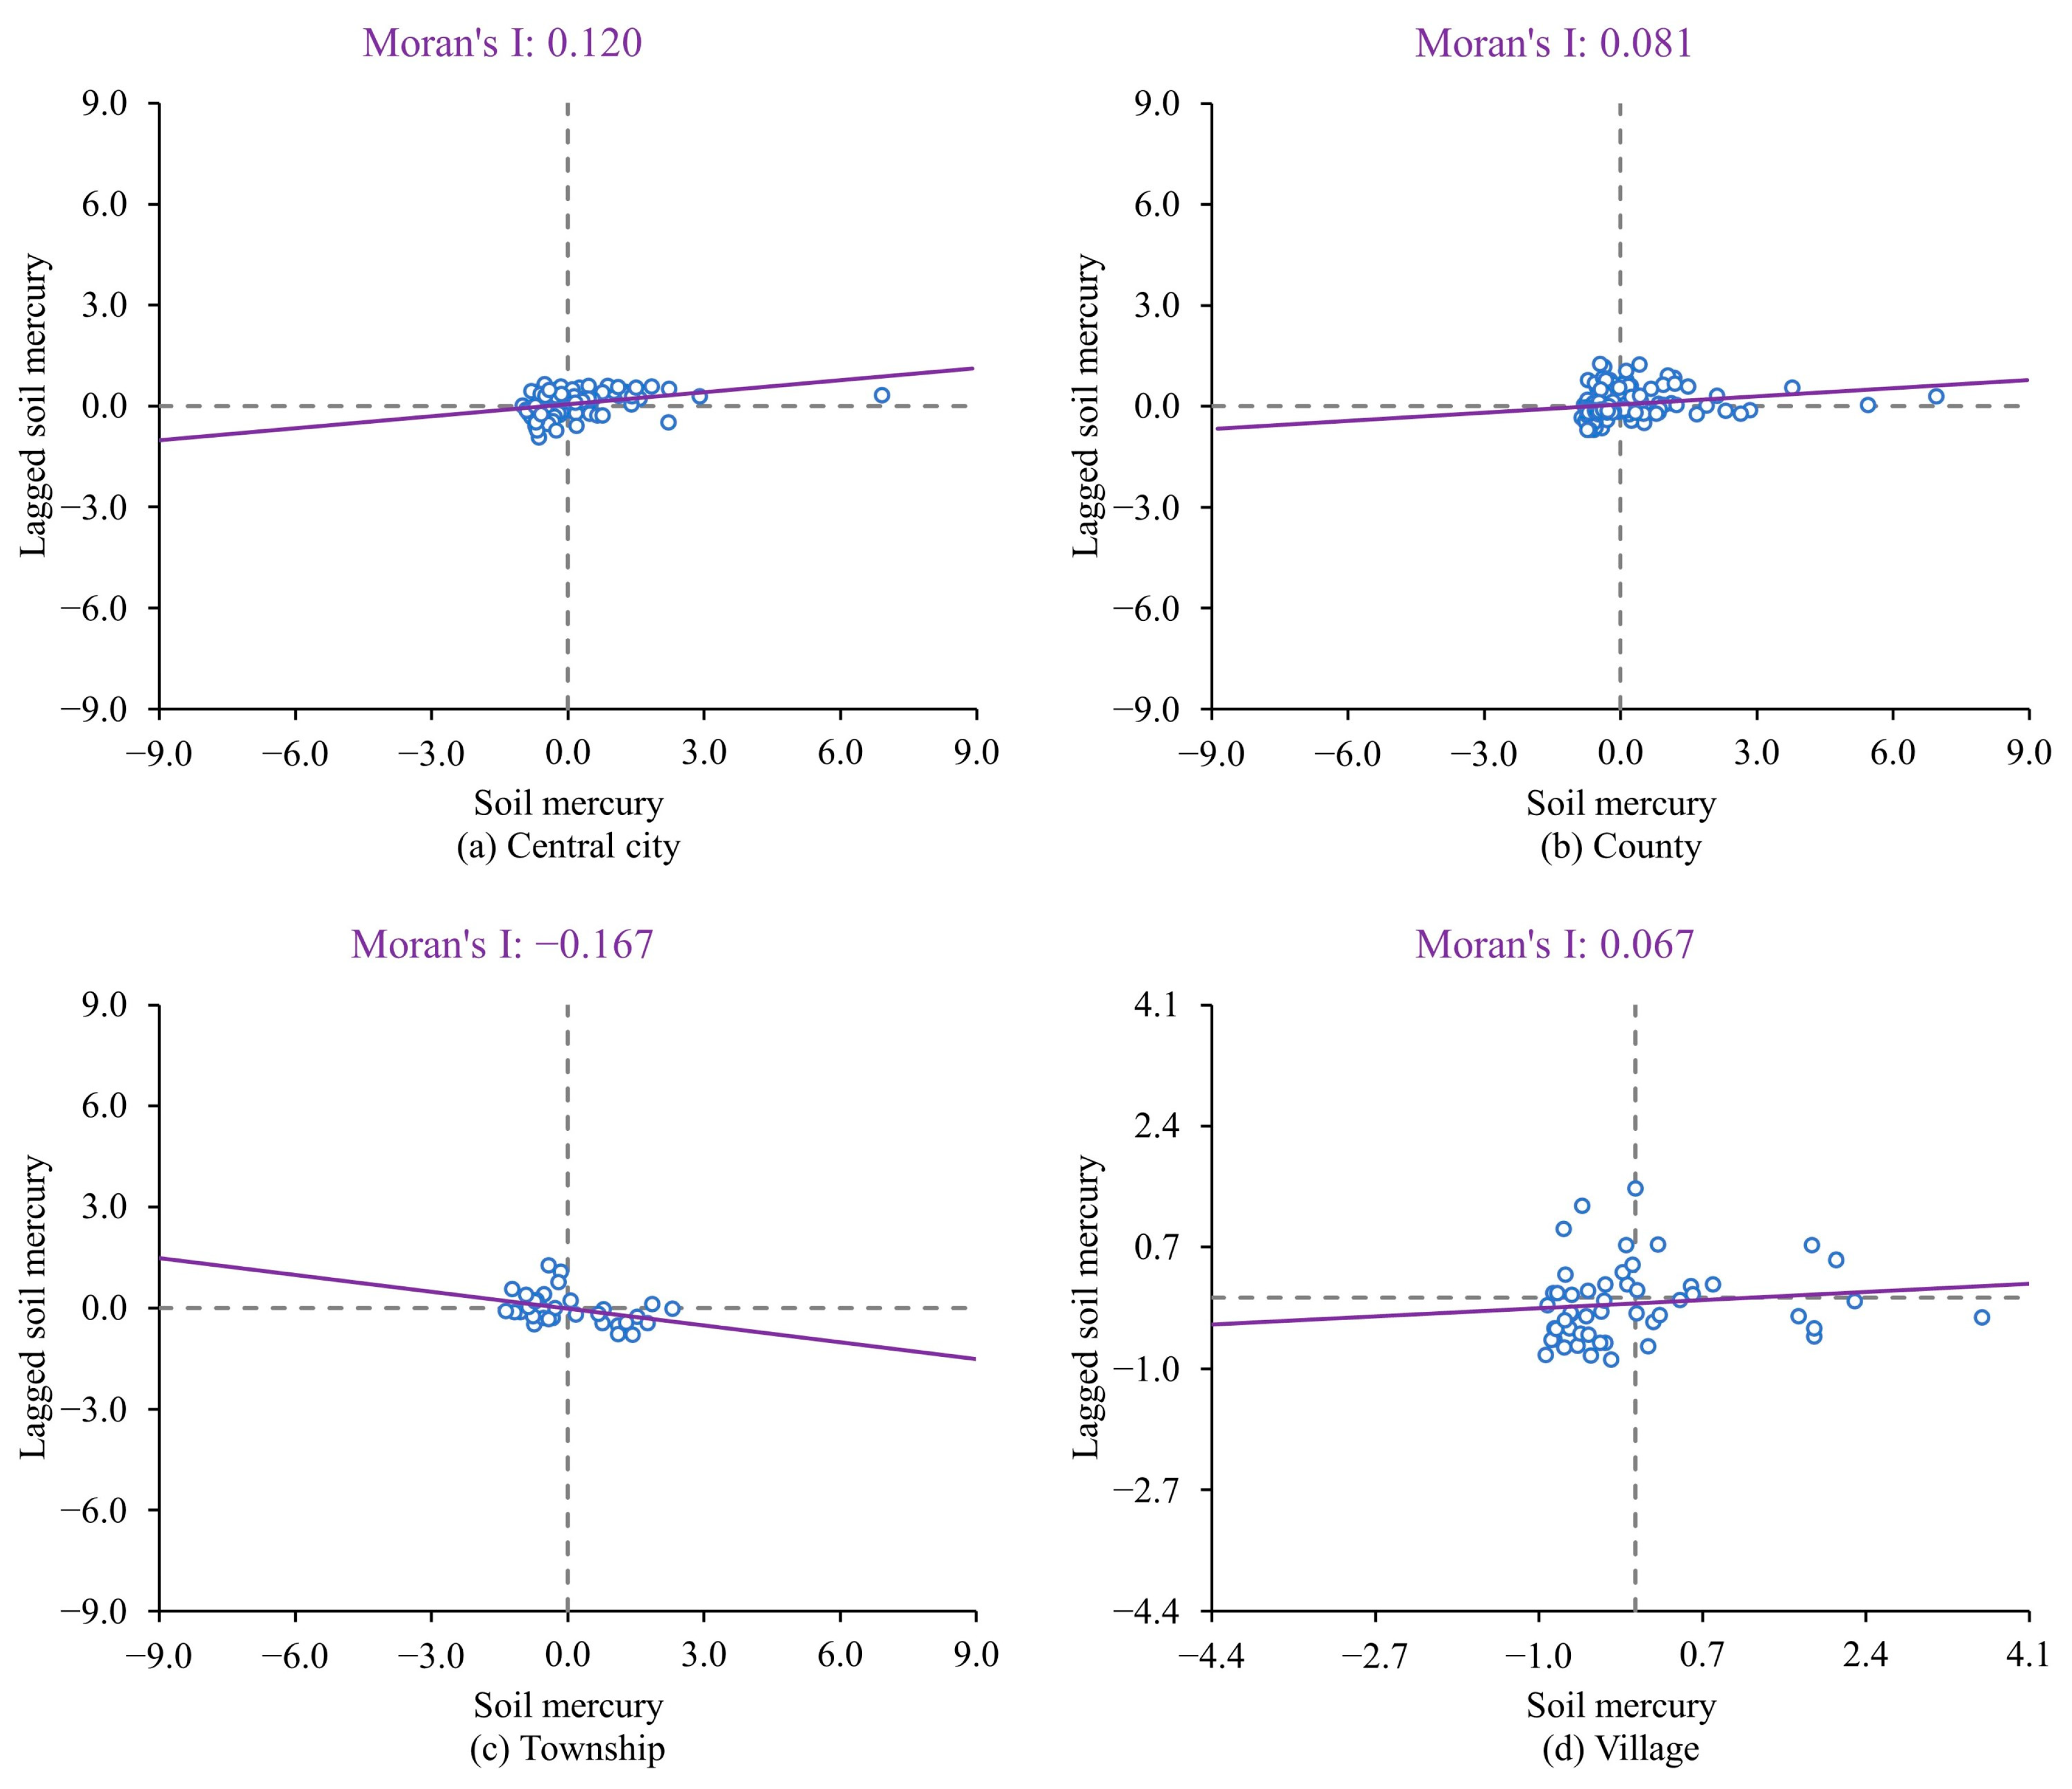
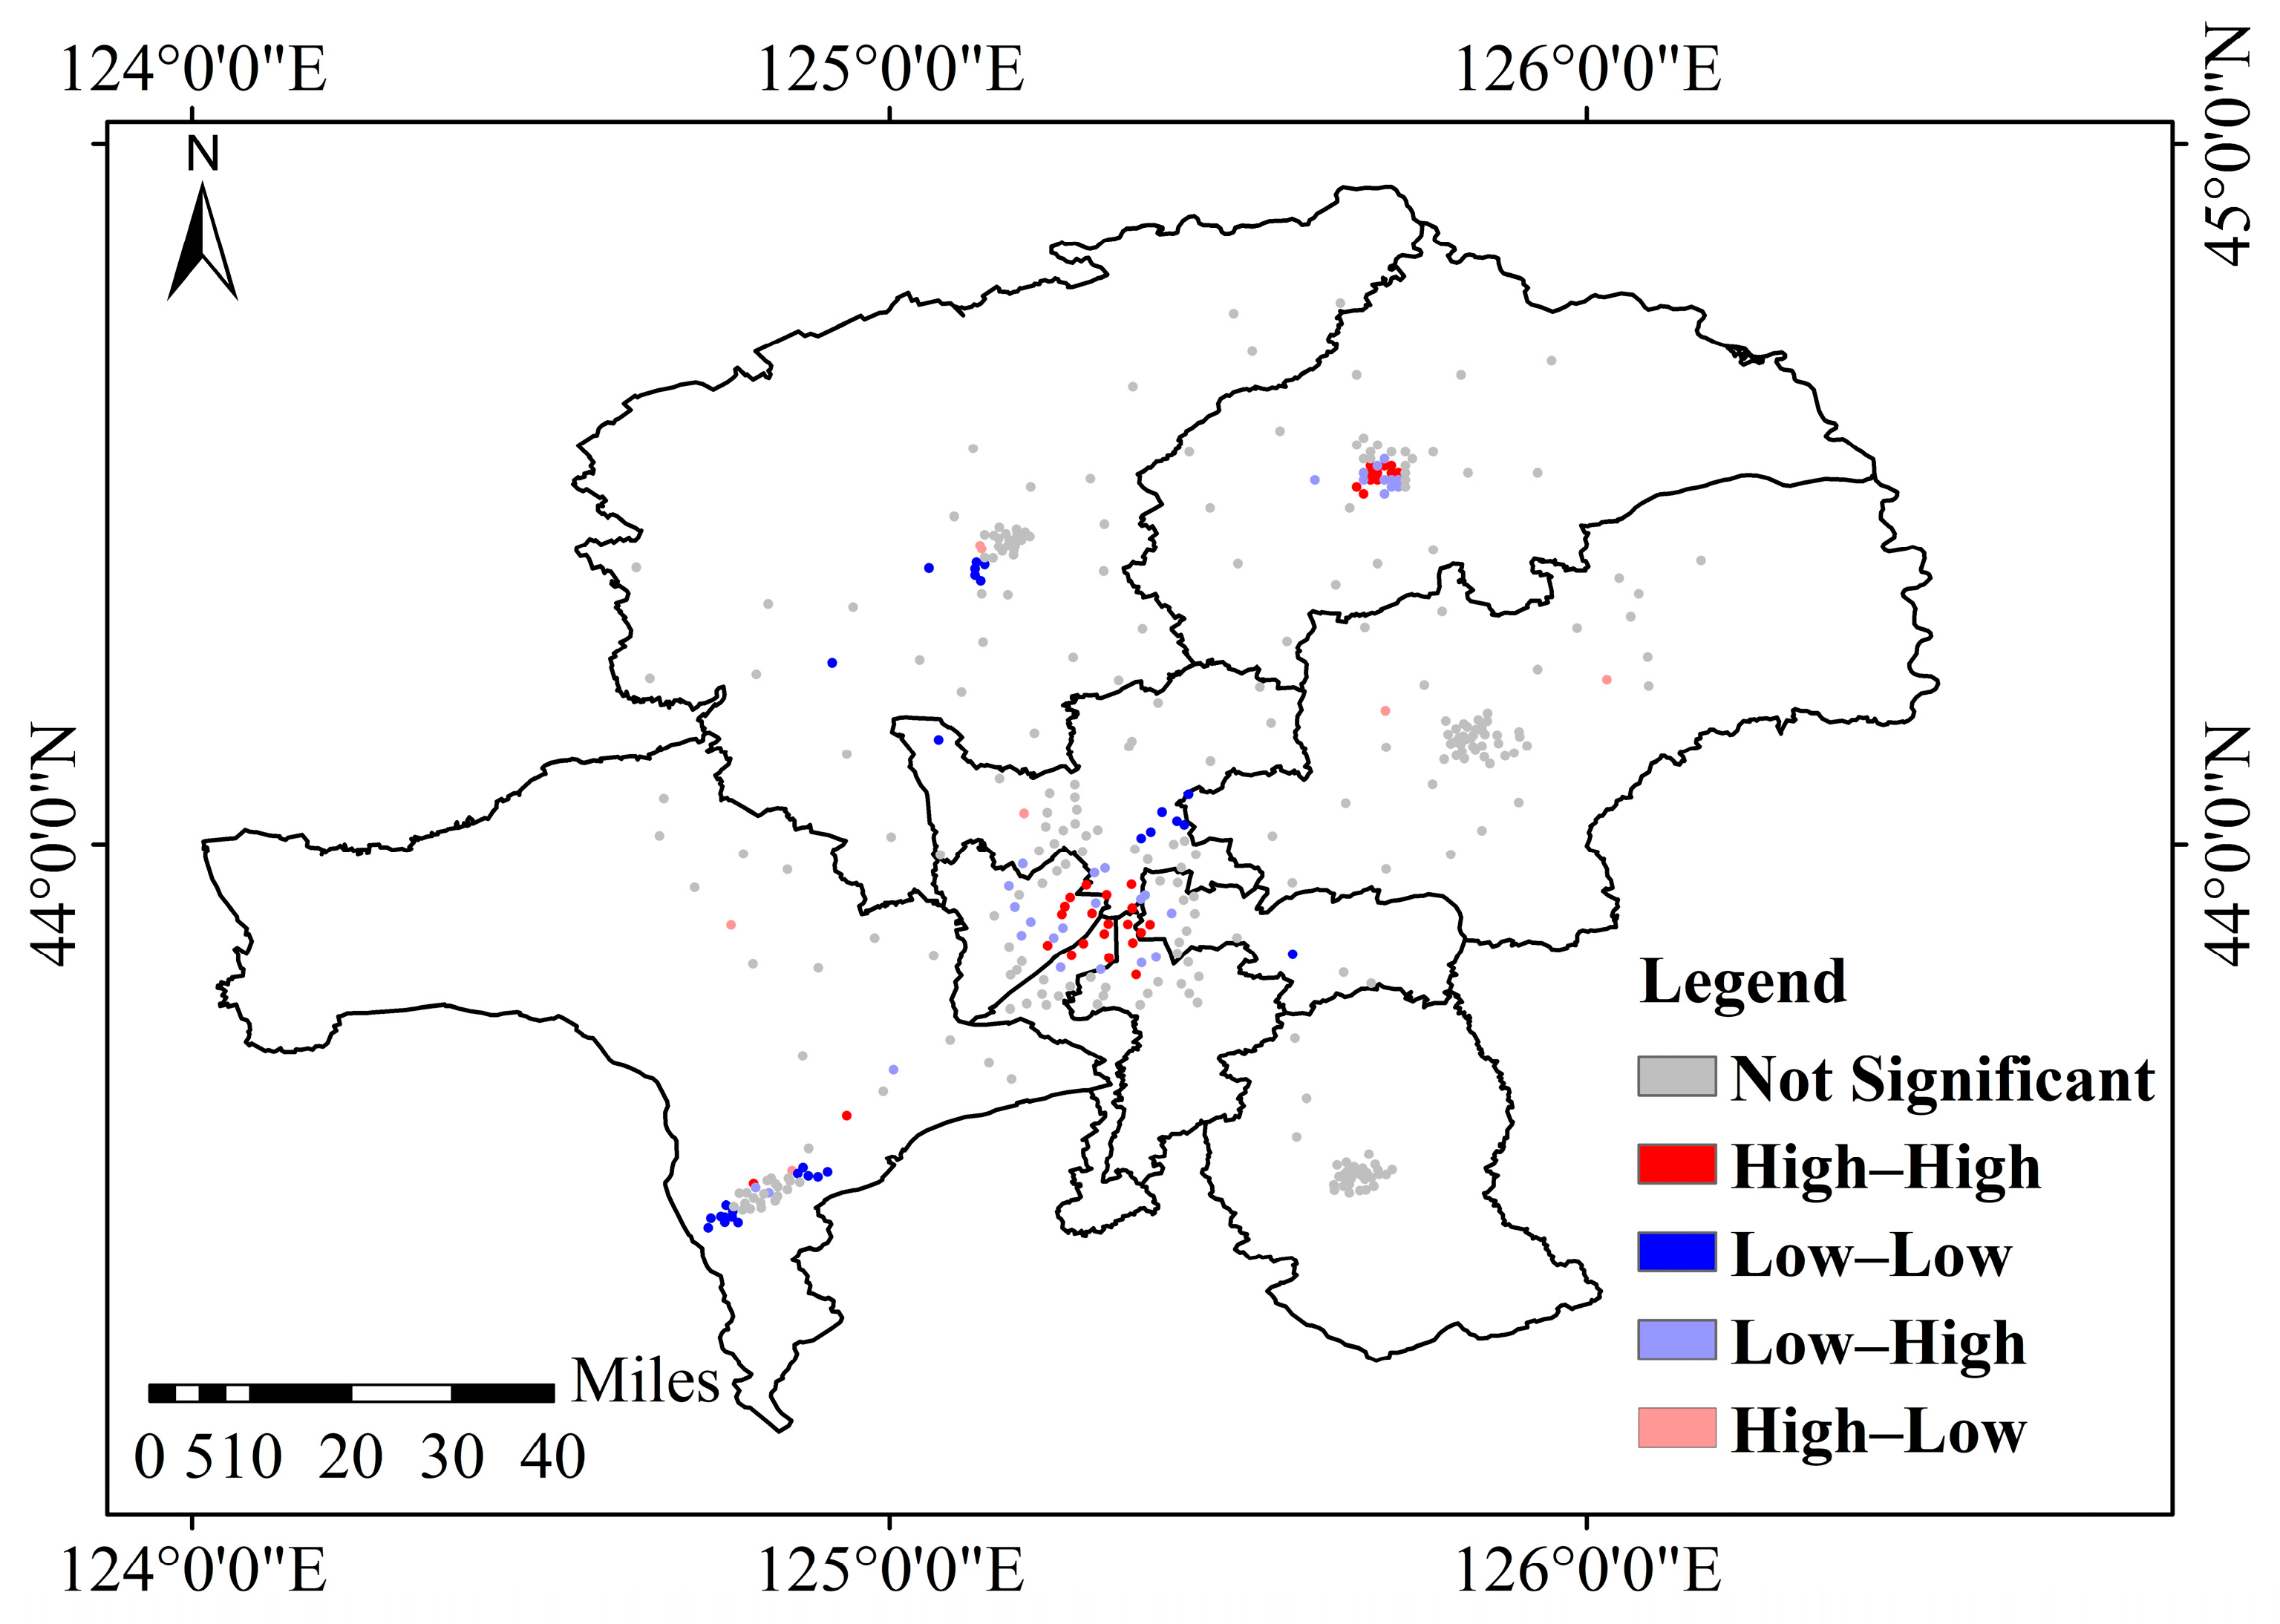
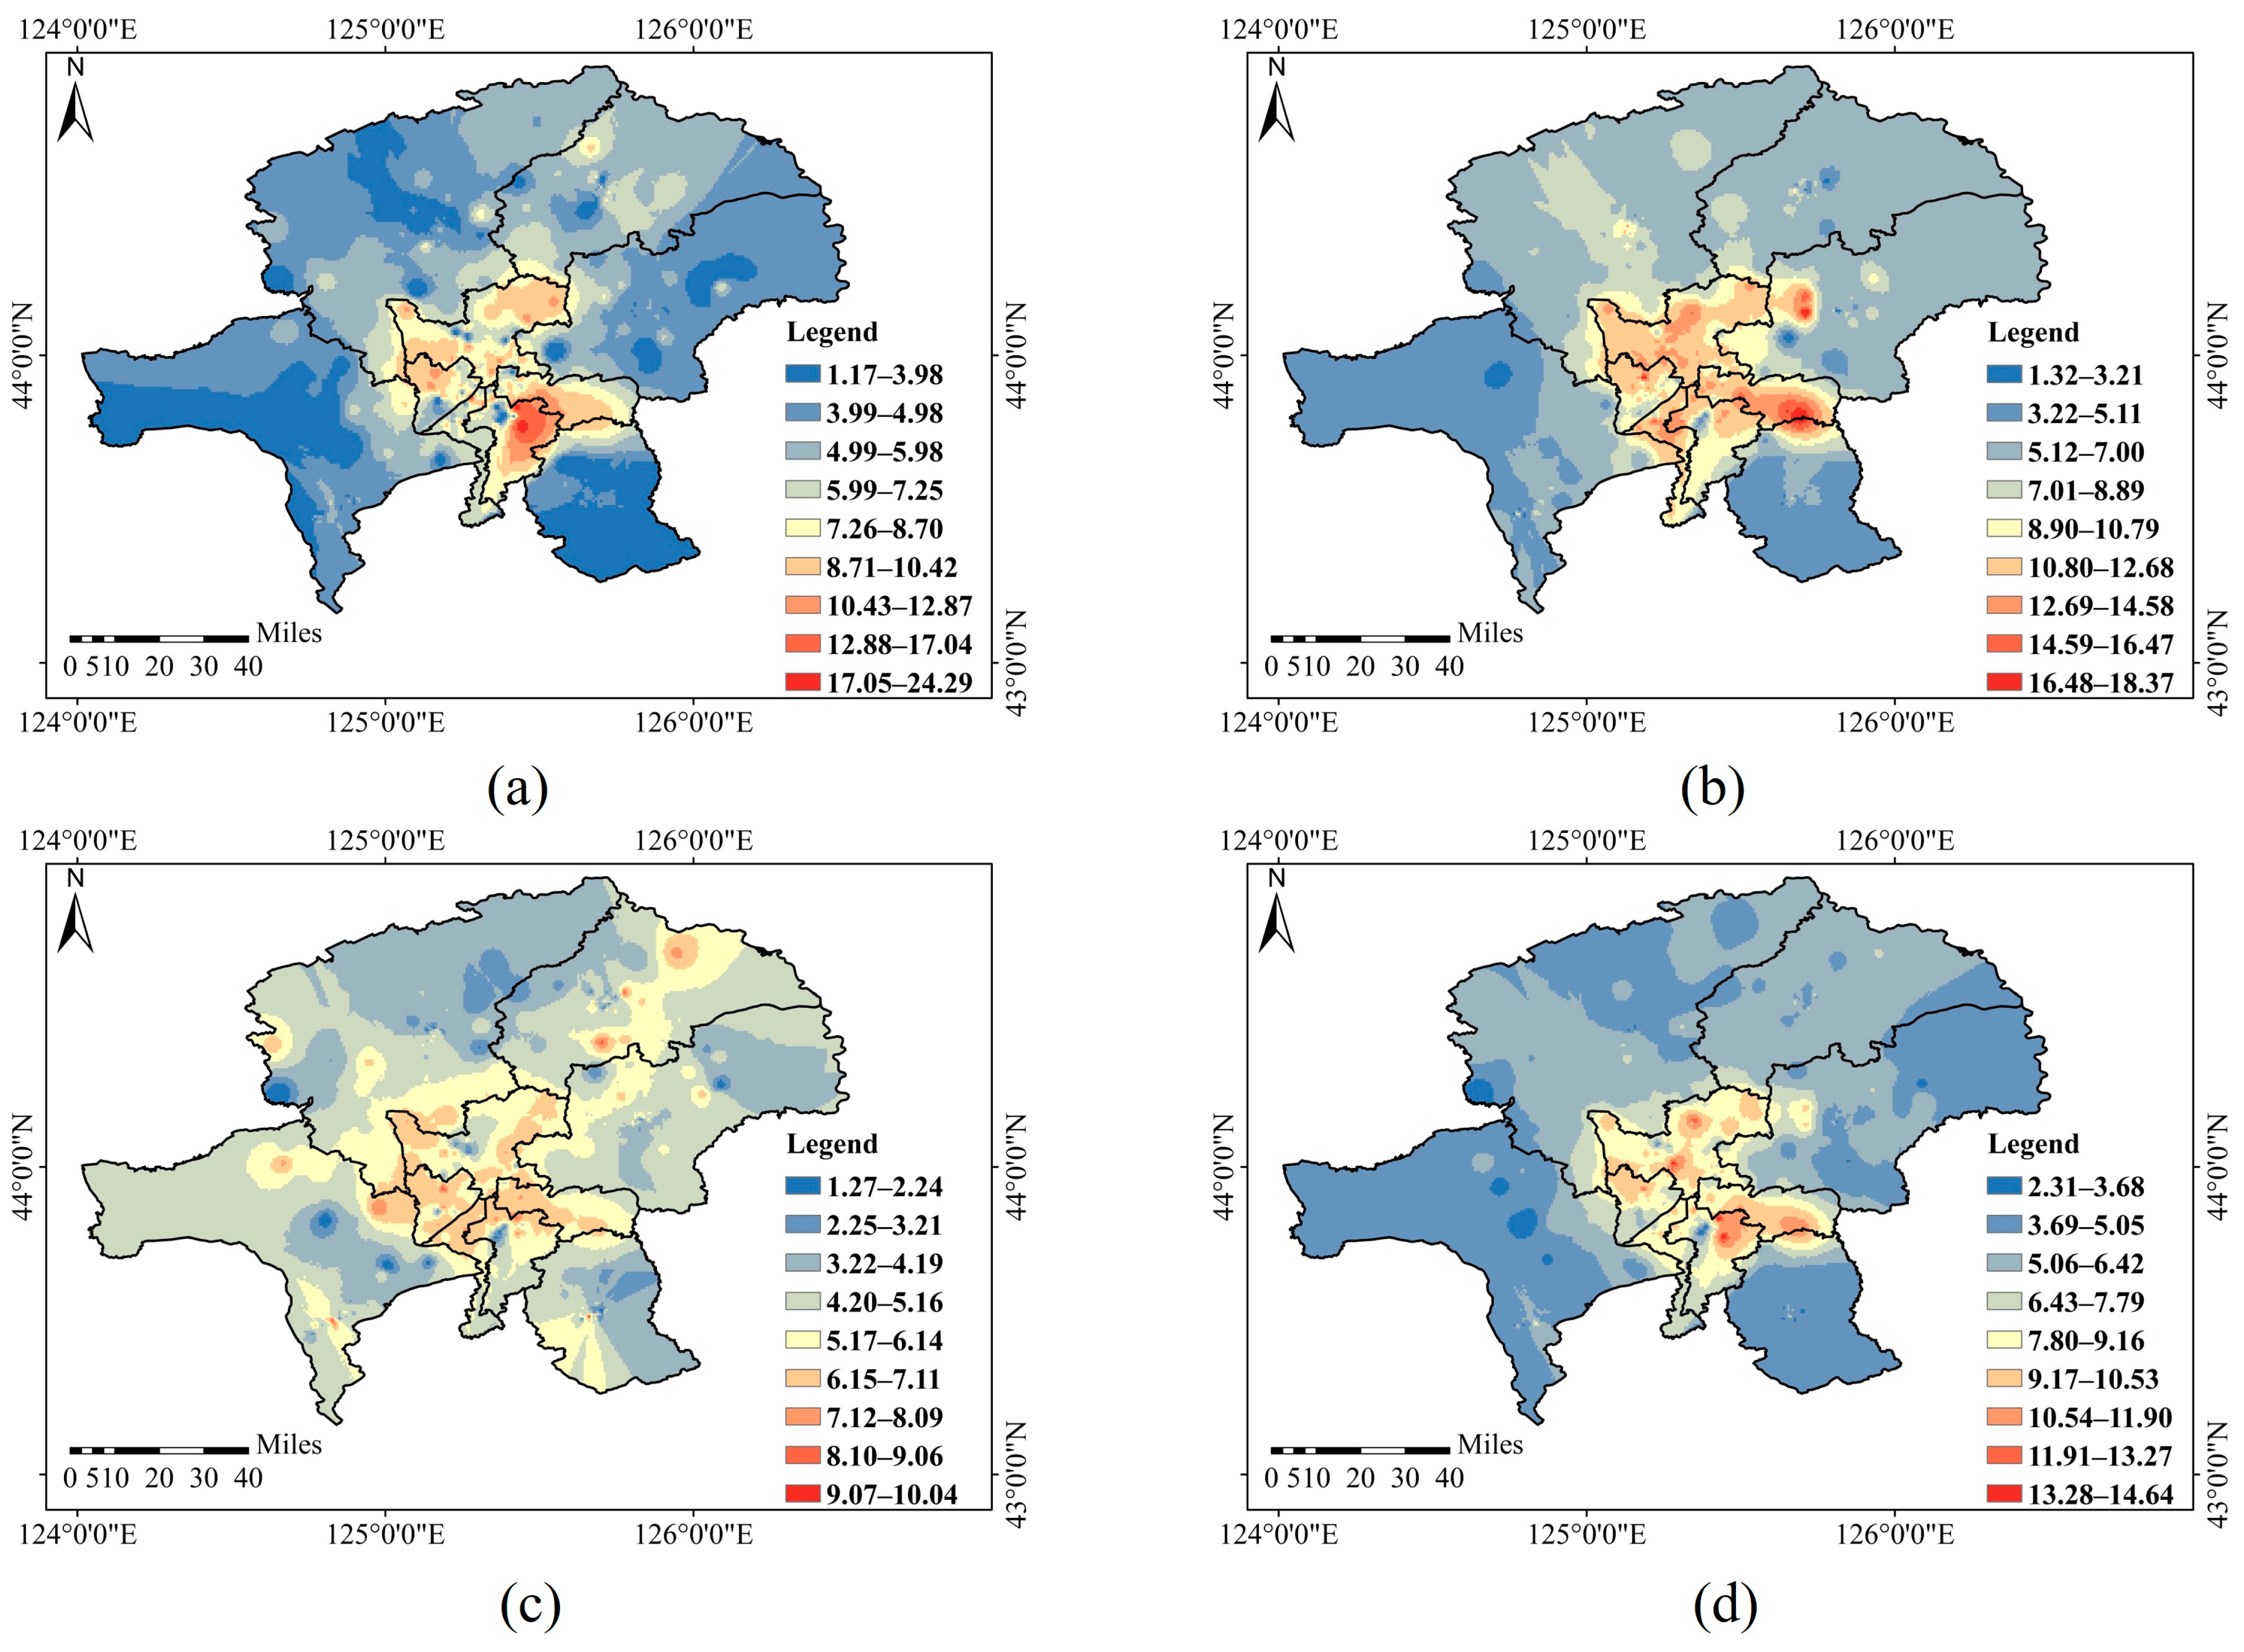
3.1.2. Distribution Characteristics of Soil Mercury in Different Spatial Scales

Heavy metals have the characteristics of being hidden, persistent, and irreversible, accumulating in time and space and posing a serious threat to human health. As can be seen from Figure 3, the mercury content of soil in the administrative districts of the Changchun urban agglomeration varied greatly and was unevenly distributed in all seasons. The areas with high mercury values in the Changchun urban agglomeration were mostly located in the centers of cities and counties (districts), decreasing in all directions. In different seasons, the distribution of soil mercury content in the Changchun urban agglomeration was different. In spring, soil mercury concentration in Changchun Municipal District and Nongan County was higher in the northwest direction; in Dehui City it was higher in the east direction; in Jiutai District, Gongzhuling City, and Shuangyang District it was higher in the southwest direction. In summer, soil mercury concentration was higher in the southern part of Changchun Municipal District, in the northern part of Nongan County, the eastern part of Dehui City, in the southeastern part of Jiutai District and Gongzhuling City, and in the northern part of Shuangyang District. In autumn, soil mercury concentration was higher in the central and northwestern part of Changchun Municipal District, in the northwestern part of Nongan County and Dehui City, in the southeastern part of Jiutai District and Gongzhuling City, and in the northeastern part of Shuangyang District. In addition, soil mercury concentrations are elevated in townships and villages located within urban–rural transitional zones, particularly those near the administrative boundaries of central city and their surrounding counties (districts).
Figure 4 shows the soil mercury content in the Changchun urban agglomeration at different spatial scales in each season. It presents the soil mercury content at four spatial scales: central city, county, township, and village. The figure shows that soil mercury content in the central city and the county was higher than that in townships and villages in all seasons. Two distinct patterns of decreasing soil mercury content were observed in the central city–county–township–village scales and central city–county–village–township scales, respectively, across all seasons.
The Moran scatter plots of the average soil mercury content at the four scales are presented in Figure 5. In Figure 5, the first and third quadrants signify a positive spatial correlation of heavy metal content values among sampling points, meaning that the high value sampling points are surrounded by other high value points, and low value sampling points are surrounded by other low value points. Conversely, the second and fourth quadrants indicate a negative spatial correlation, where low value sampling points are surrounded by high value ones, and high value sampling points are surrounded by low value ones. As can be observed from the figure, under the central city scale, most of the soil mercury content of the sampling points fall within the first quadrant, indicating a positive spatial correlation and belonging to the high–high aggregation type. Under the county scale, most points are primarily located in the third quadrant, representing a low–low aggregation type. The number of points in the first and second quadrants are equal, also suggesting a positive spatial correlation. Under the township scale, most sampling points lie in the second quadrant, belonging to the high–low type. The negative Moran’s I coefficient indicates that most points are spatially repellent, demonstrating a negative spatial correlation. Under the village scale, an equal number of sampling points are located in the second and third quadrants, belonging to the low–low aggregation type with the presence of a low–high type, meaning that high value points exist around low value sampling points. There is spatial autocorrelation of soil mercury in the study area across different spatial scales. The magnitude of the Moran’s I value reflects the degree of autocorrelation: central city > county > village > township. Among them, the central city, county, and village scales exhibit positive spatial correlations, while the township scale shows a negative spatial correlation.
Figure 6 presents spatial clustering maps of soil mercury in the study area at different scales. Evidently, under the central city scale, the high–high spatial aggregation points are predominantly concentrated in the central region of Changchun Municipal District, while the low–low spatial aggregation points are mainly located in its northeastern area. Under the county scale, the high–high spatial aggregation points are mainly located in Dehui City, and the low–low spatial aggregation points are primarily situated in Shuangyang District. Under the township scale, the high–low spatial isolated areas are distributed in the east and southwest, with the presence of high-value outliers and a significant degree of spatial variation. Under the village scale, the low–low aggregations are dispersed in the northwest, and the low–high spatial isolated areas are located in the southwest and northeast.

3.2. Spatial and Temporal Characteristics and Distribution of Atmospheric Mercury in Urban Agglomeration

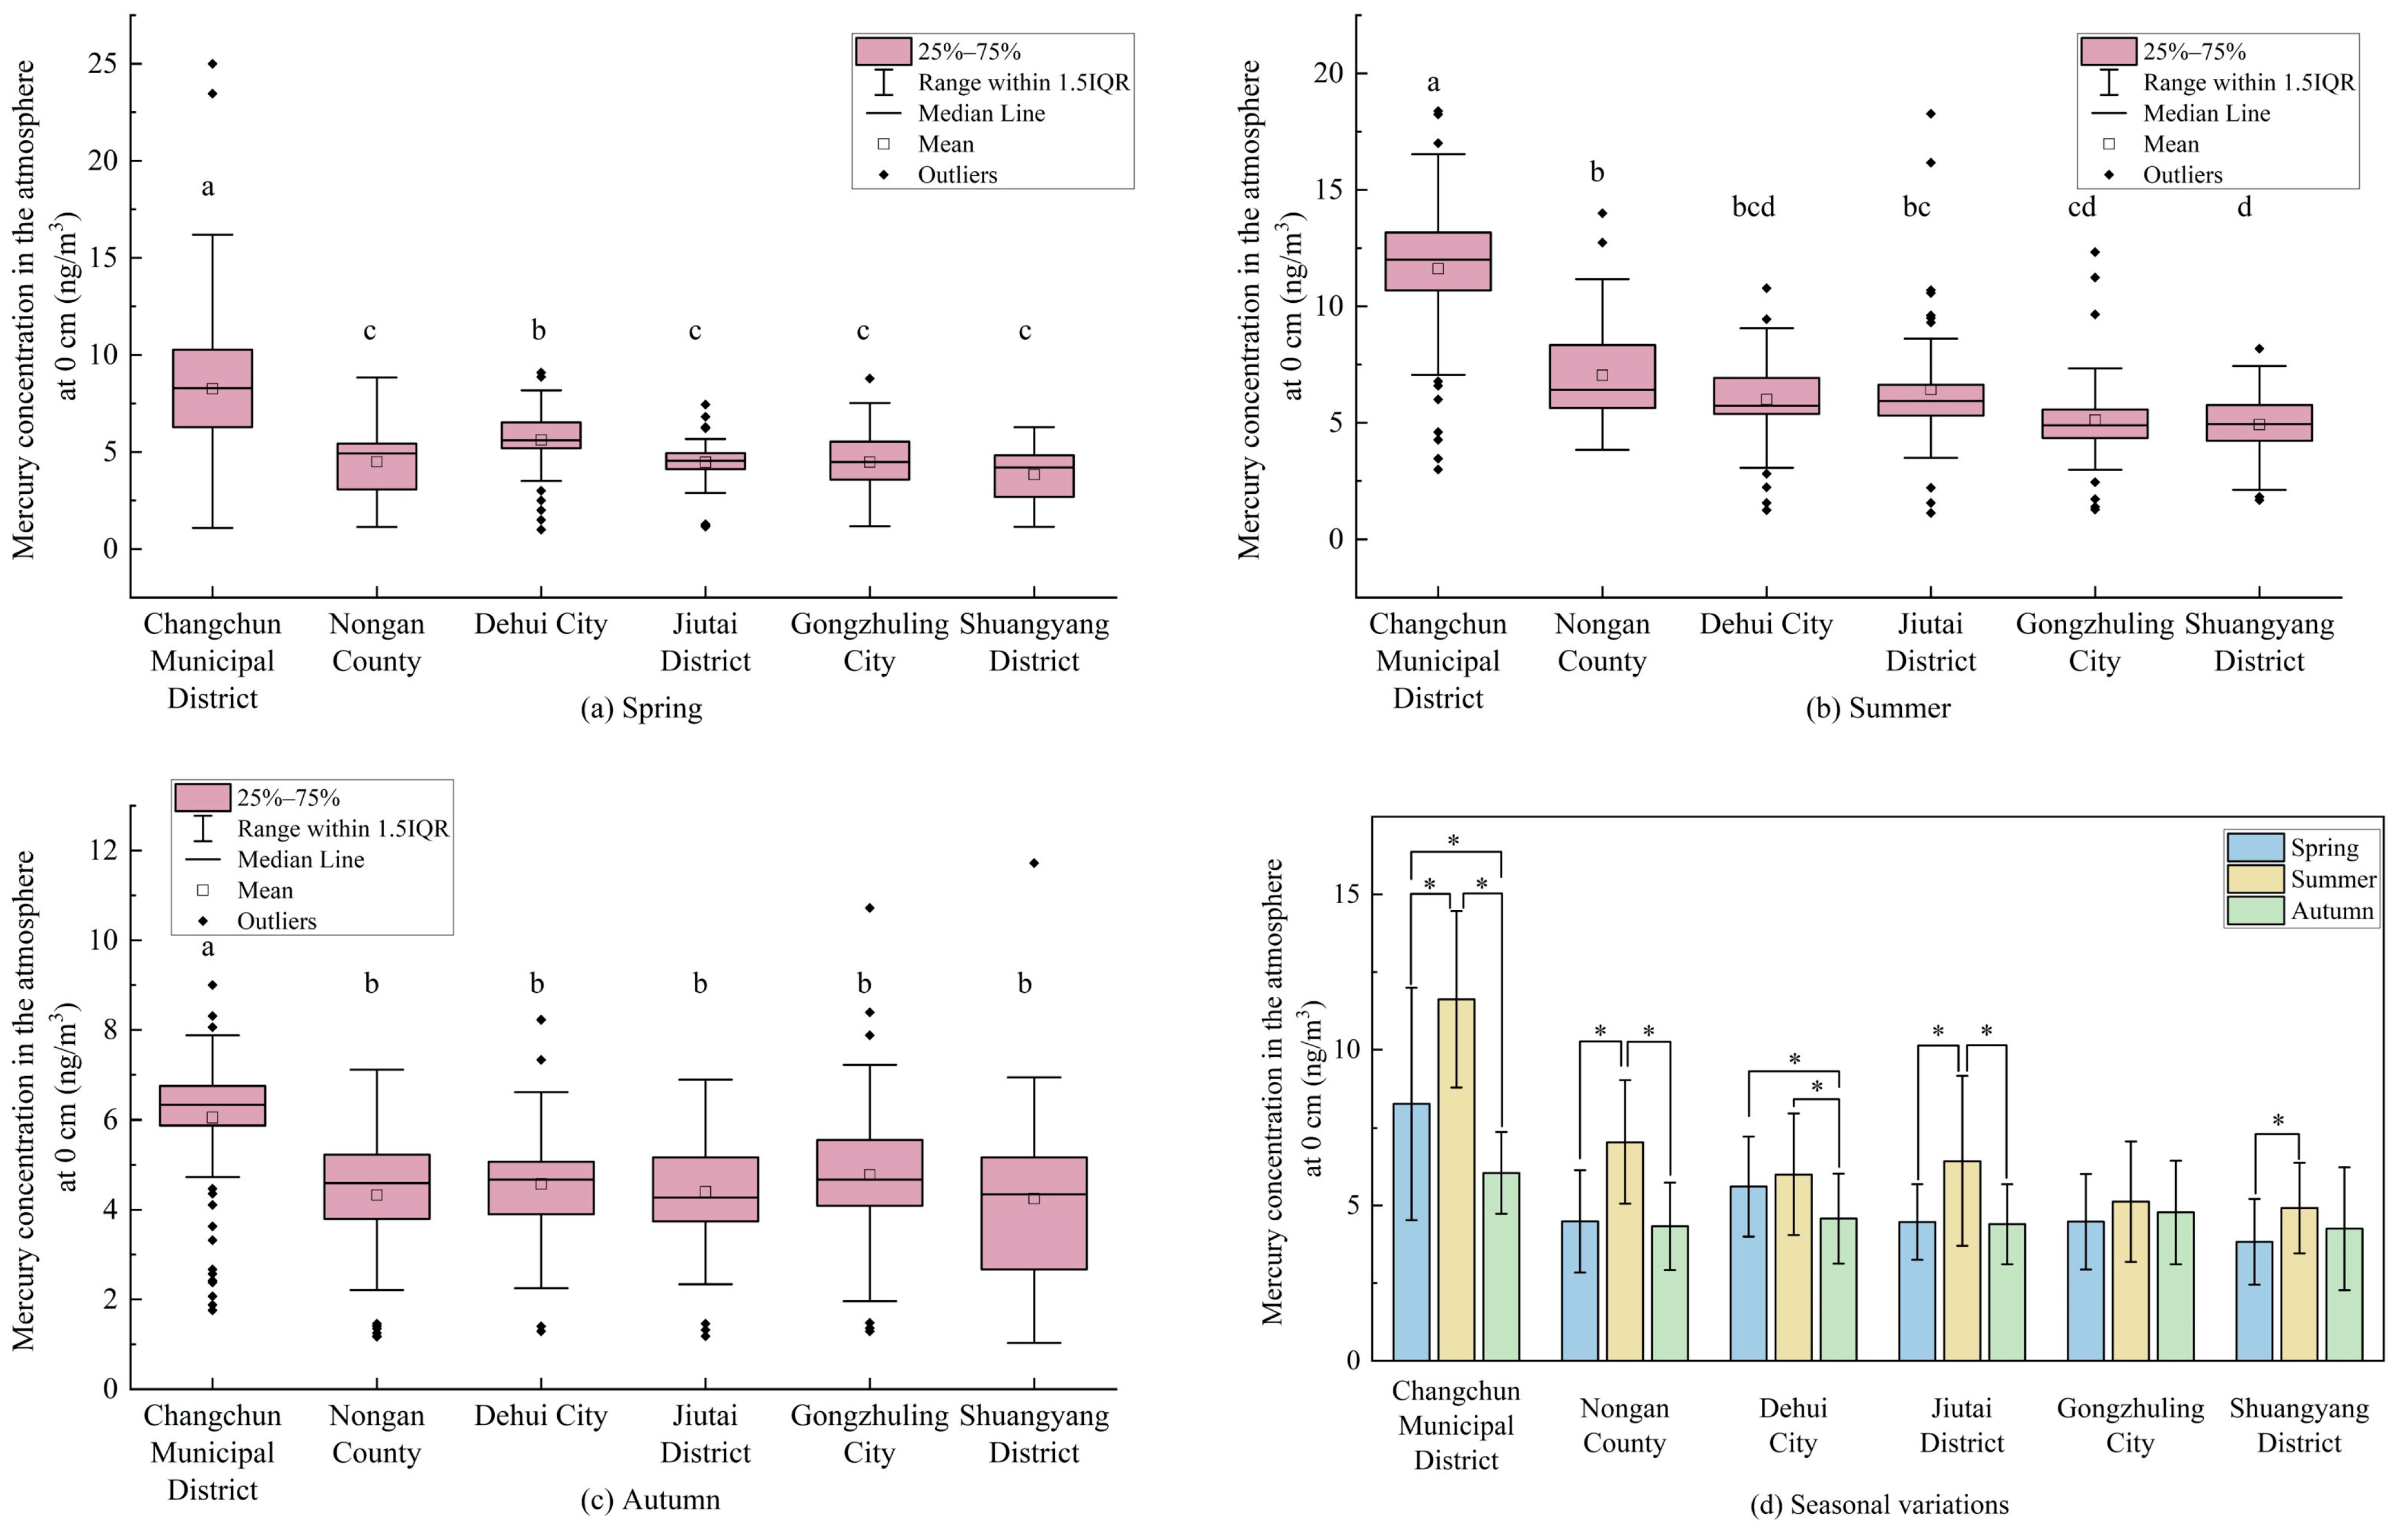
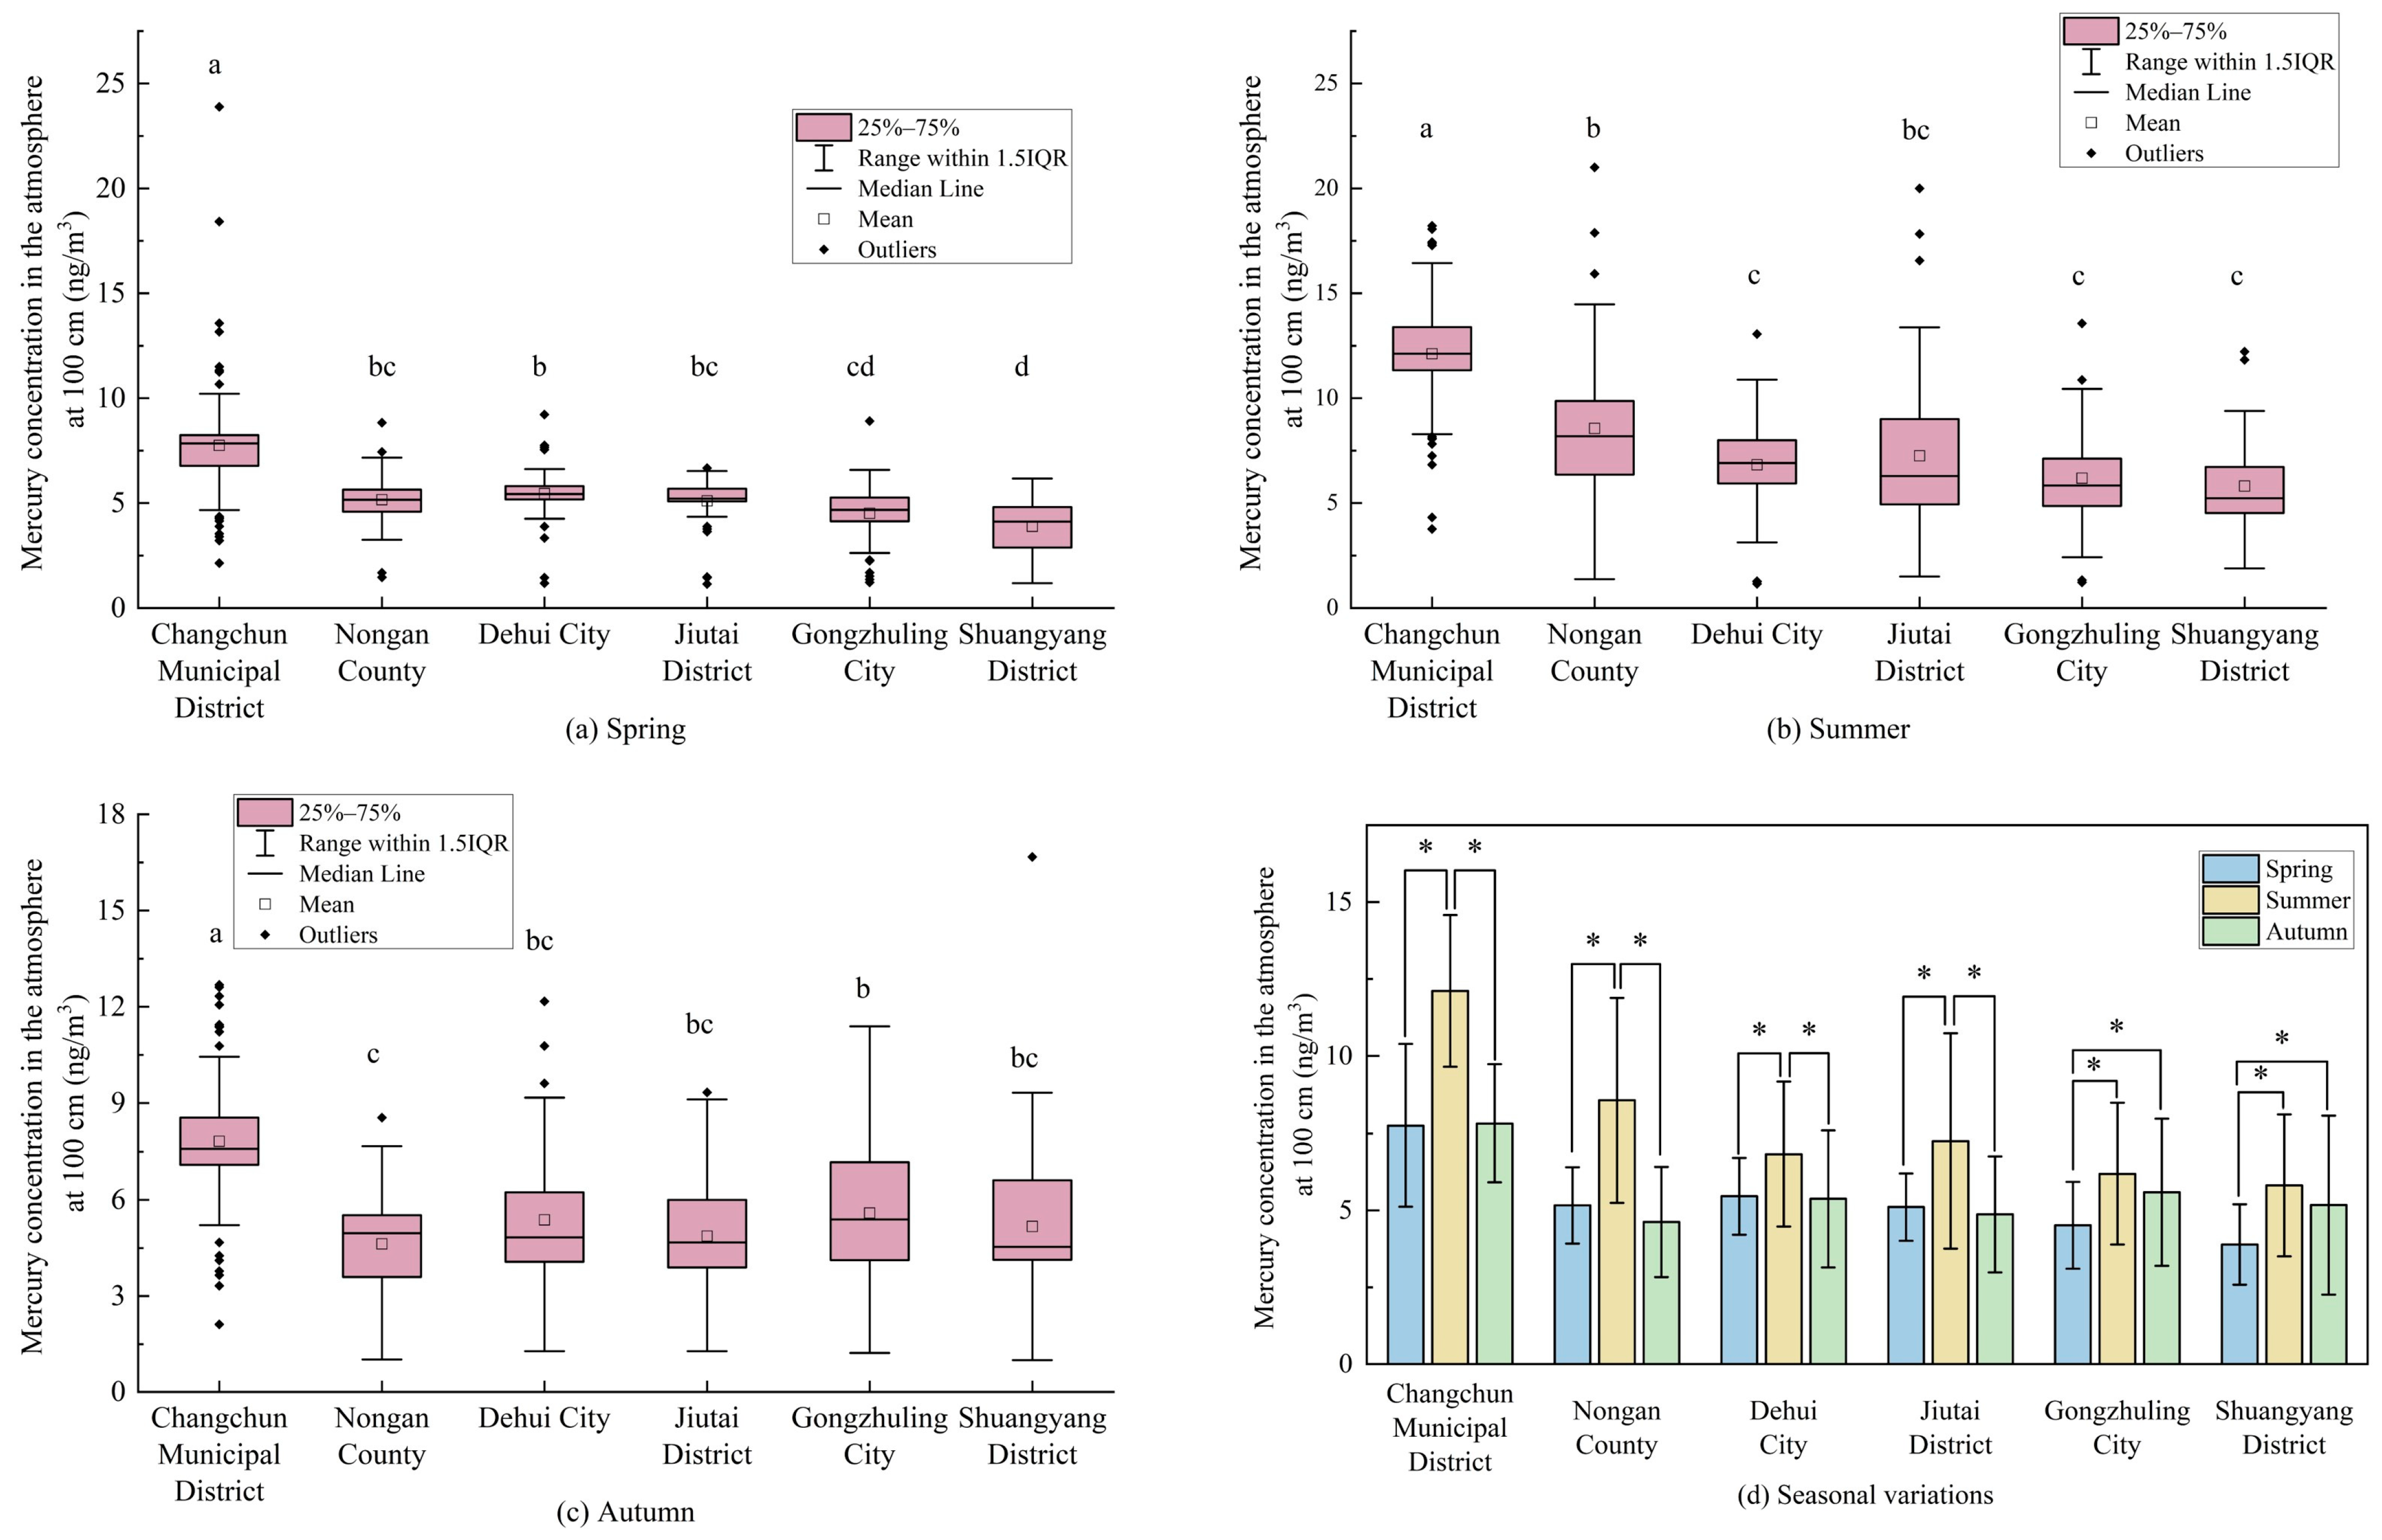
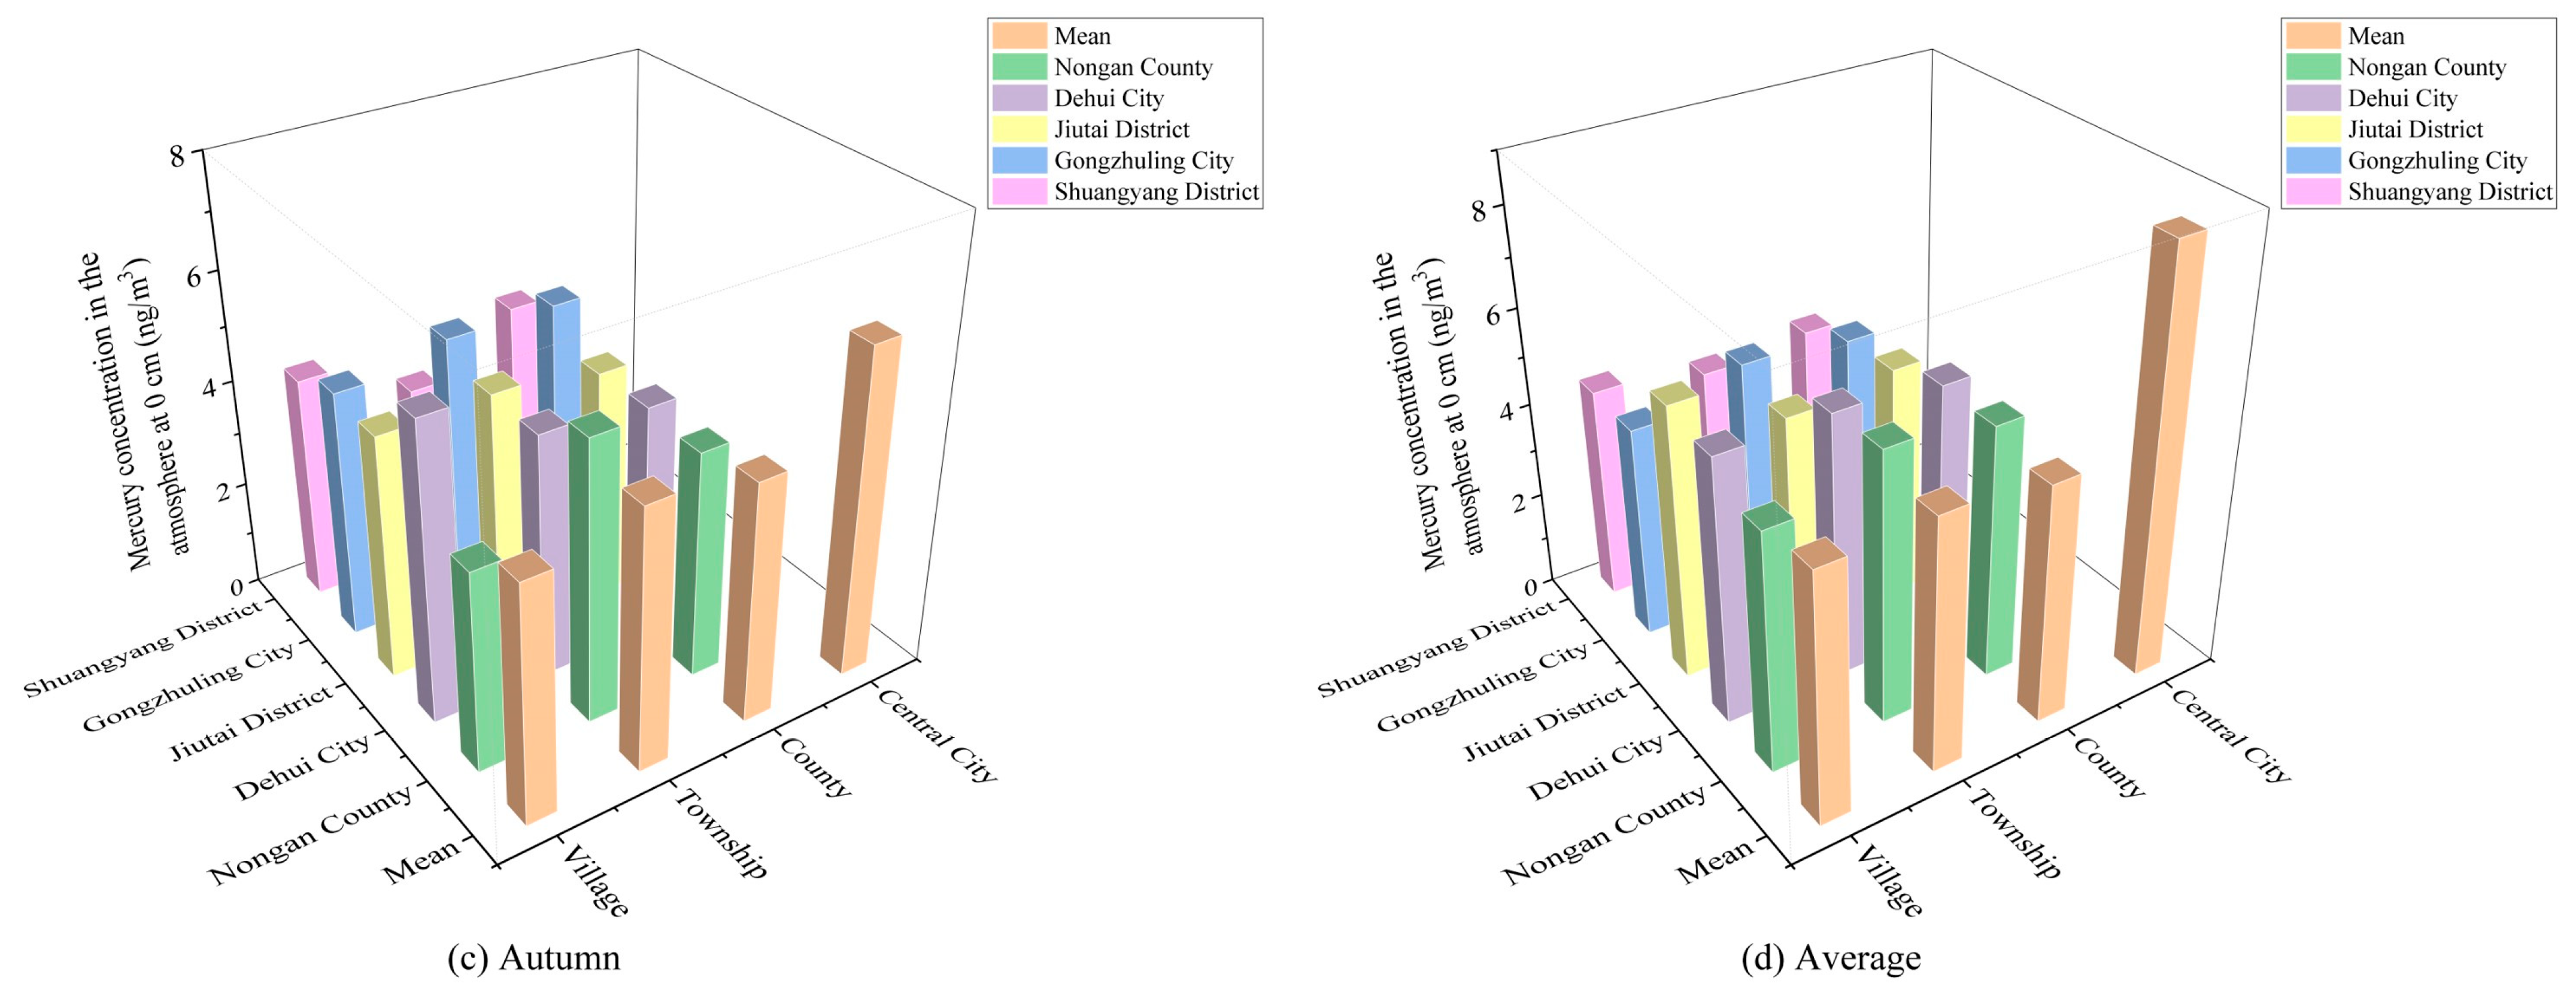
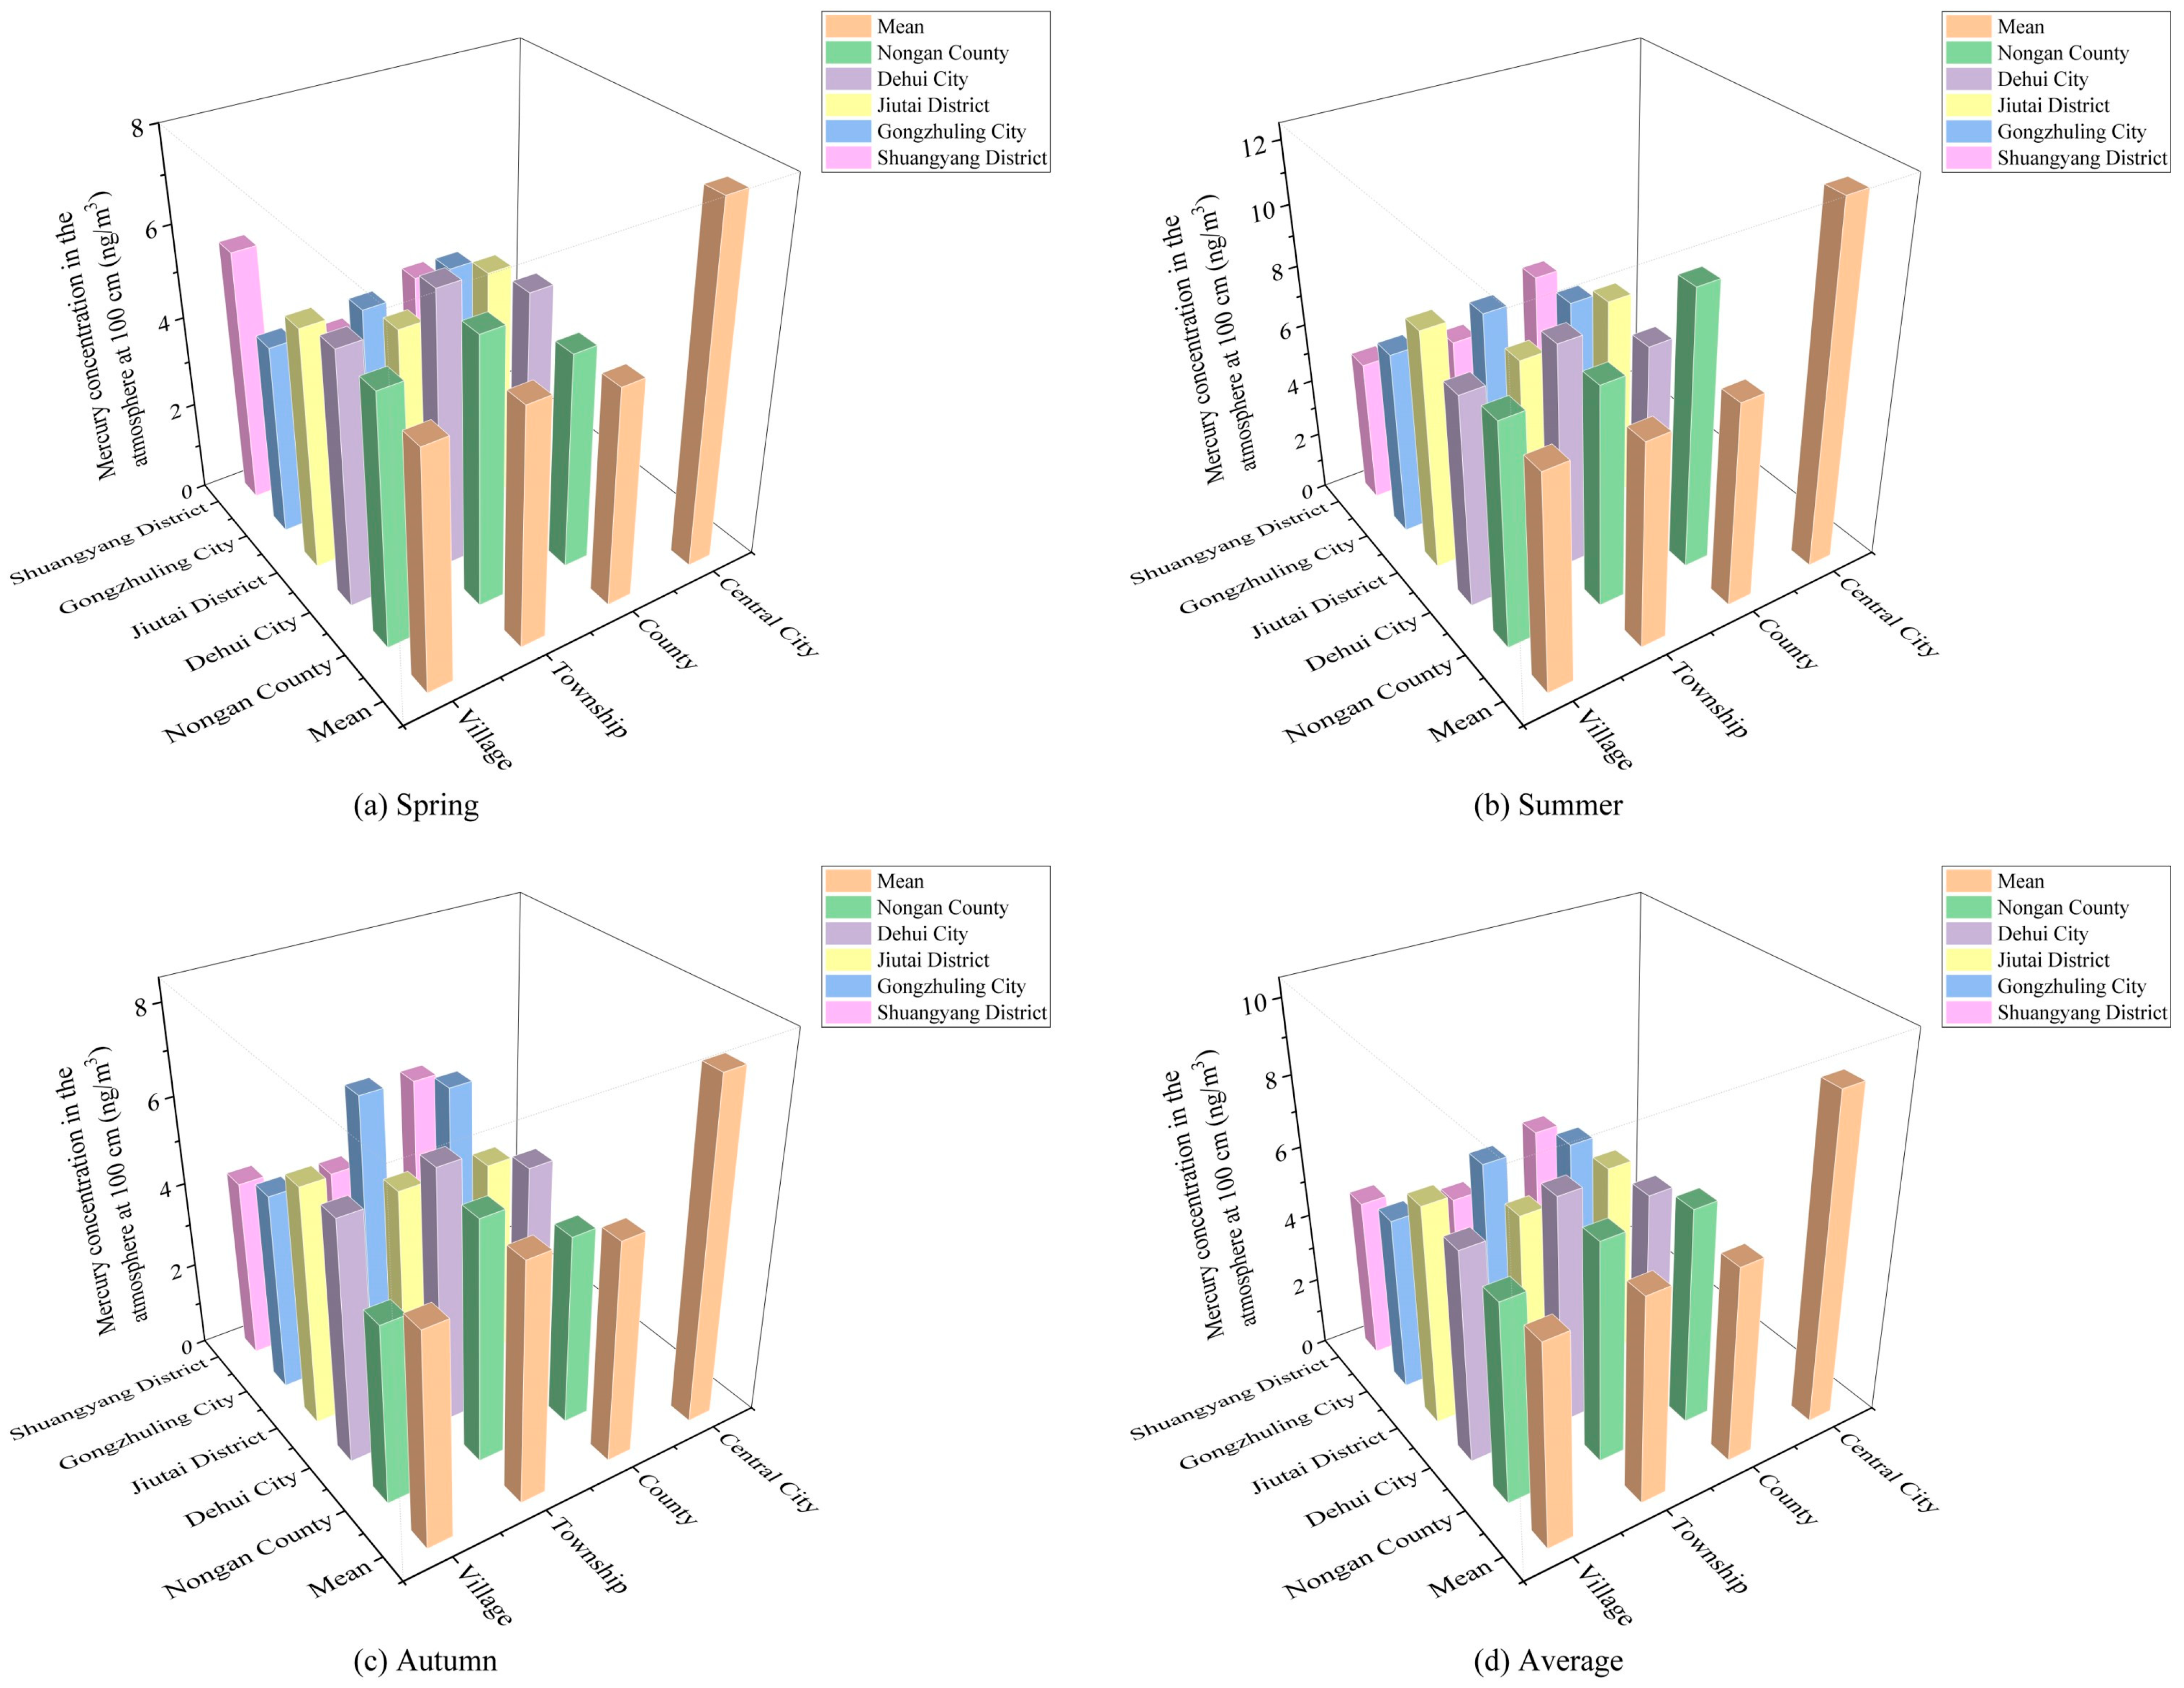
3.2.1. Seasonal Variations in the Atmospheric Mercury Concentration at Different Heights

During the study period, atmospheric mercury concentrations in the Changchun urban agglomeration ranged from 1.00 to 25.00 ng/m3 at 0 cm, with a mean value of 6.13 ng/m3. Seasonal averages were 5.70 ng/m3 (spring), 7.73 ng/m3 (summer), and 4.95 ng/m3 (autumn). At 100 cm height, concentrations ranged from 1.00 to 23.89 ng/m3, with a mean value of 6.75 ng/m3, and seasonal averages of 5.75 ng/m3 (spring), 8.59 ng/m3 (summer), and 5.92 ng/m3 (autumn). In the Changchun urban agglomeration, the atmospheric mercury concentration at 0 cm in each administrative district is shown in Table 2 and Figure 7. In spring, summer, and autumn, the atmospheric mercury concentration in Changchun Municipal District, as the regional central city of the Changchun urban agglomeration, is significantly higher than that in the other county-level cities. The seasonal changes in atmospheric mercury concentration at 0 cm in Changchun Municipal District, Nongan County, Dehui City, and Jiutai District were summer > spring > autumn; in Gongzhuling City and Shuangyang District, they were summer > autumn > spring. There were significant differences in concentrations between the seasons in Changchun Municipal District; in Nongan County and Jiutai District, in summer from spring and autumn; in Dehui City, in spring and summer from autumn; and in Shuangyang District between spring and summer.
In the Changchun urban agglomeration, the atmospheric mercury concentration at 100 cm in each administrative district is shown in Table 2 and Figure 8. In spring and summer, atmospheric mercury concentrations were the highest at 100 cm in Changchun Municipal District and the lowest in Shuangyang District. In autumn, the highest concentration of atmospheric mercury was found at 100 cm in Changchun Municipal District and the lowest in Nongan County. The seasonal variation of atmospheric mercury concentration at 100 cm in Gongzhuling City and Changchun Municipal District was summer > autumn > spring, and the seasonal variation of atmospheric mercury concentration at 100 cm in Nongan County, Dehui City, and Jiutai District was summer > spring > autumn. In Changchun Municipal District, Nongan County, Dehui City, and Jiutai District, the atmospheric mercury concentration at 100 cm was significantly different in summer from that in spring and autumn; in Gongzhuling City and Shuangyang District it was significantly different in spring from that in summer and autumn.

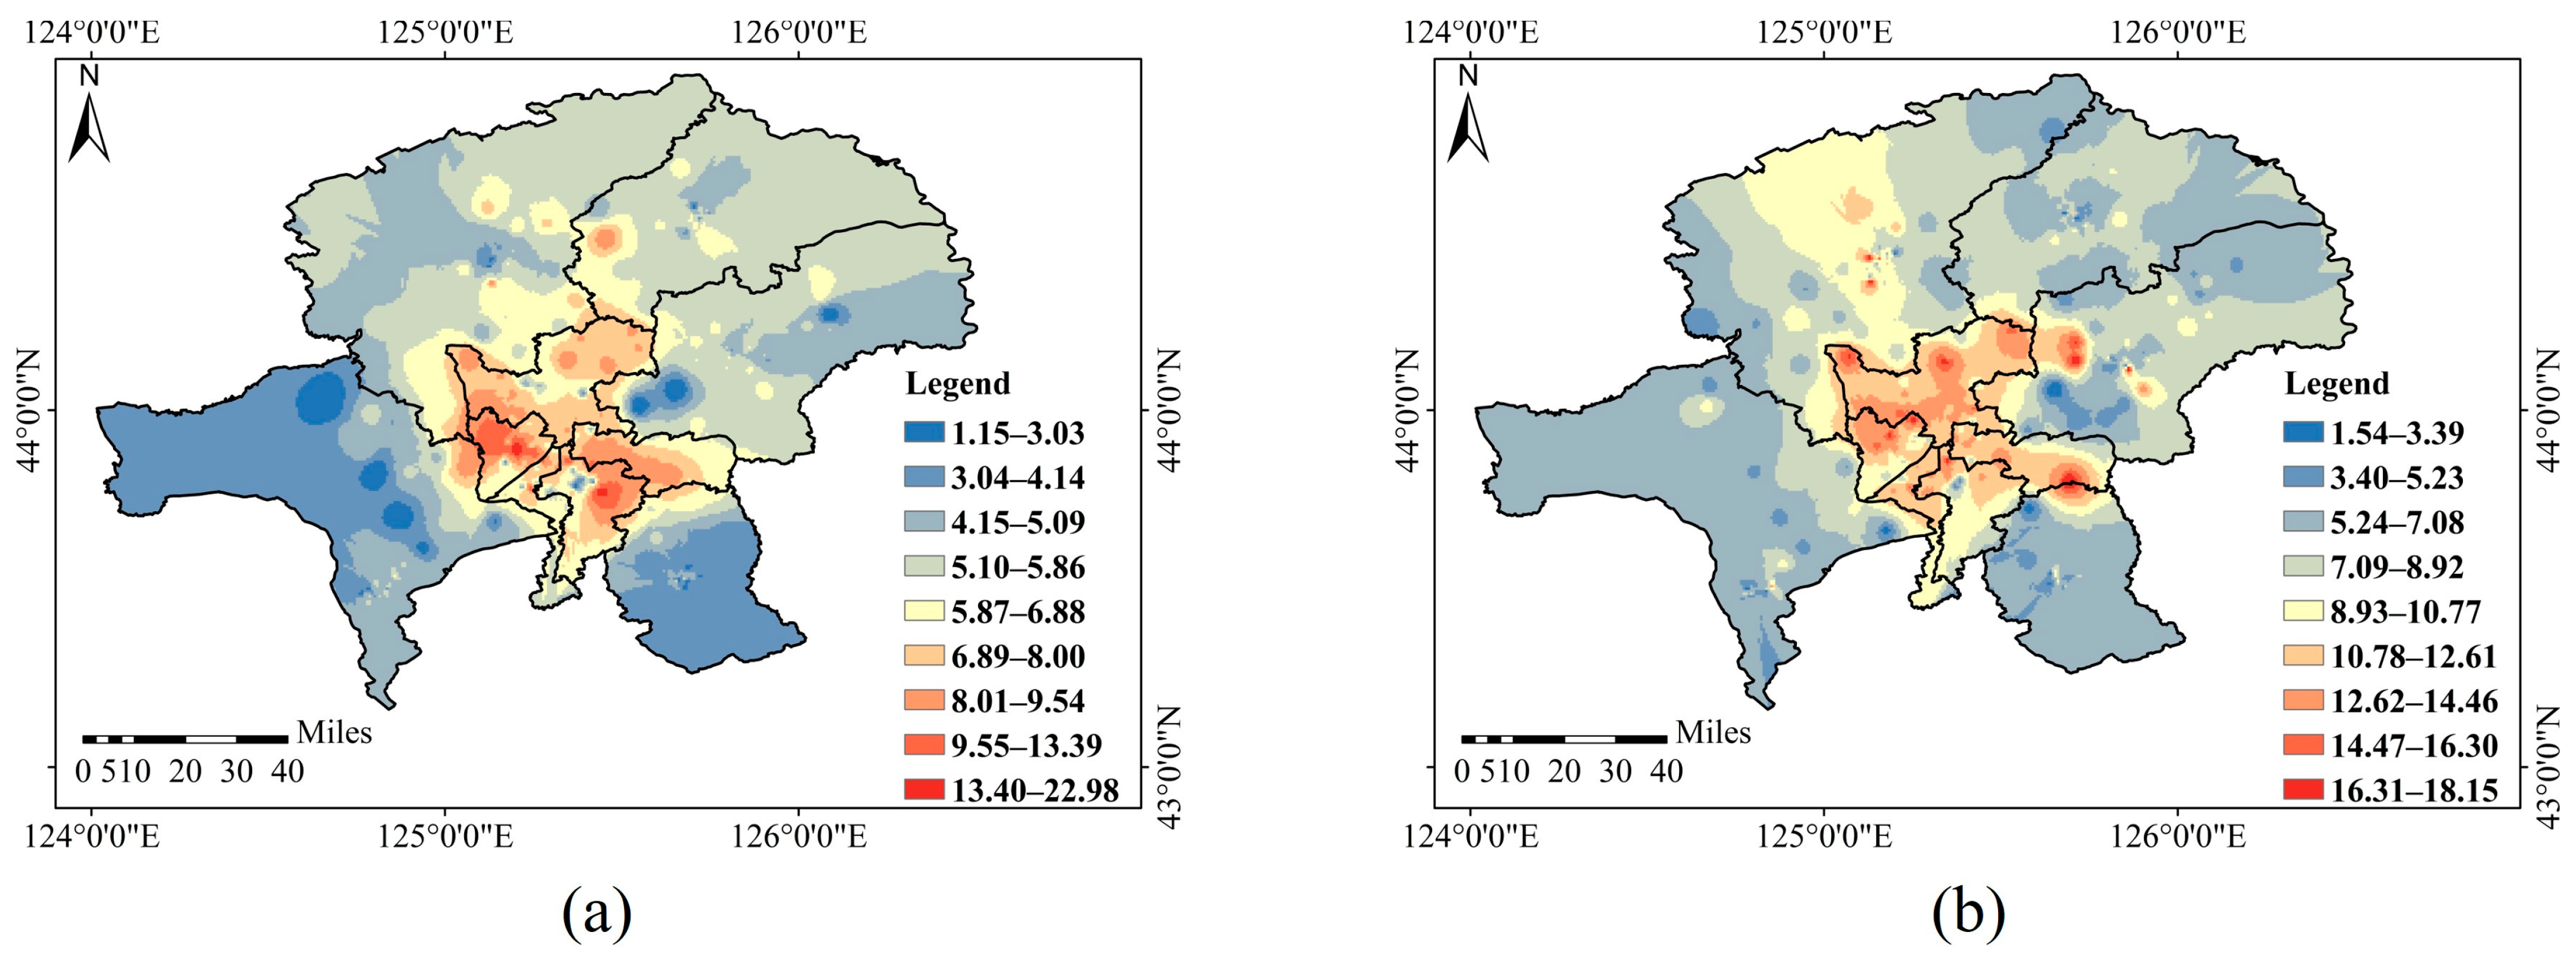
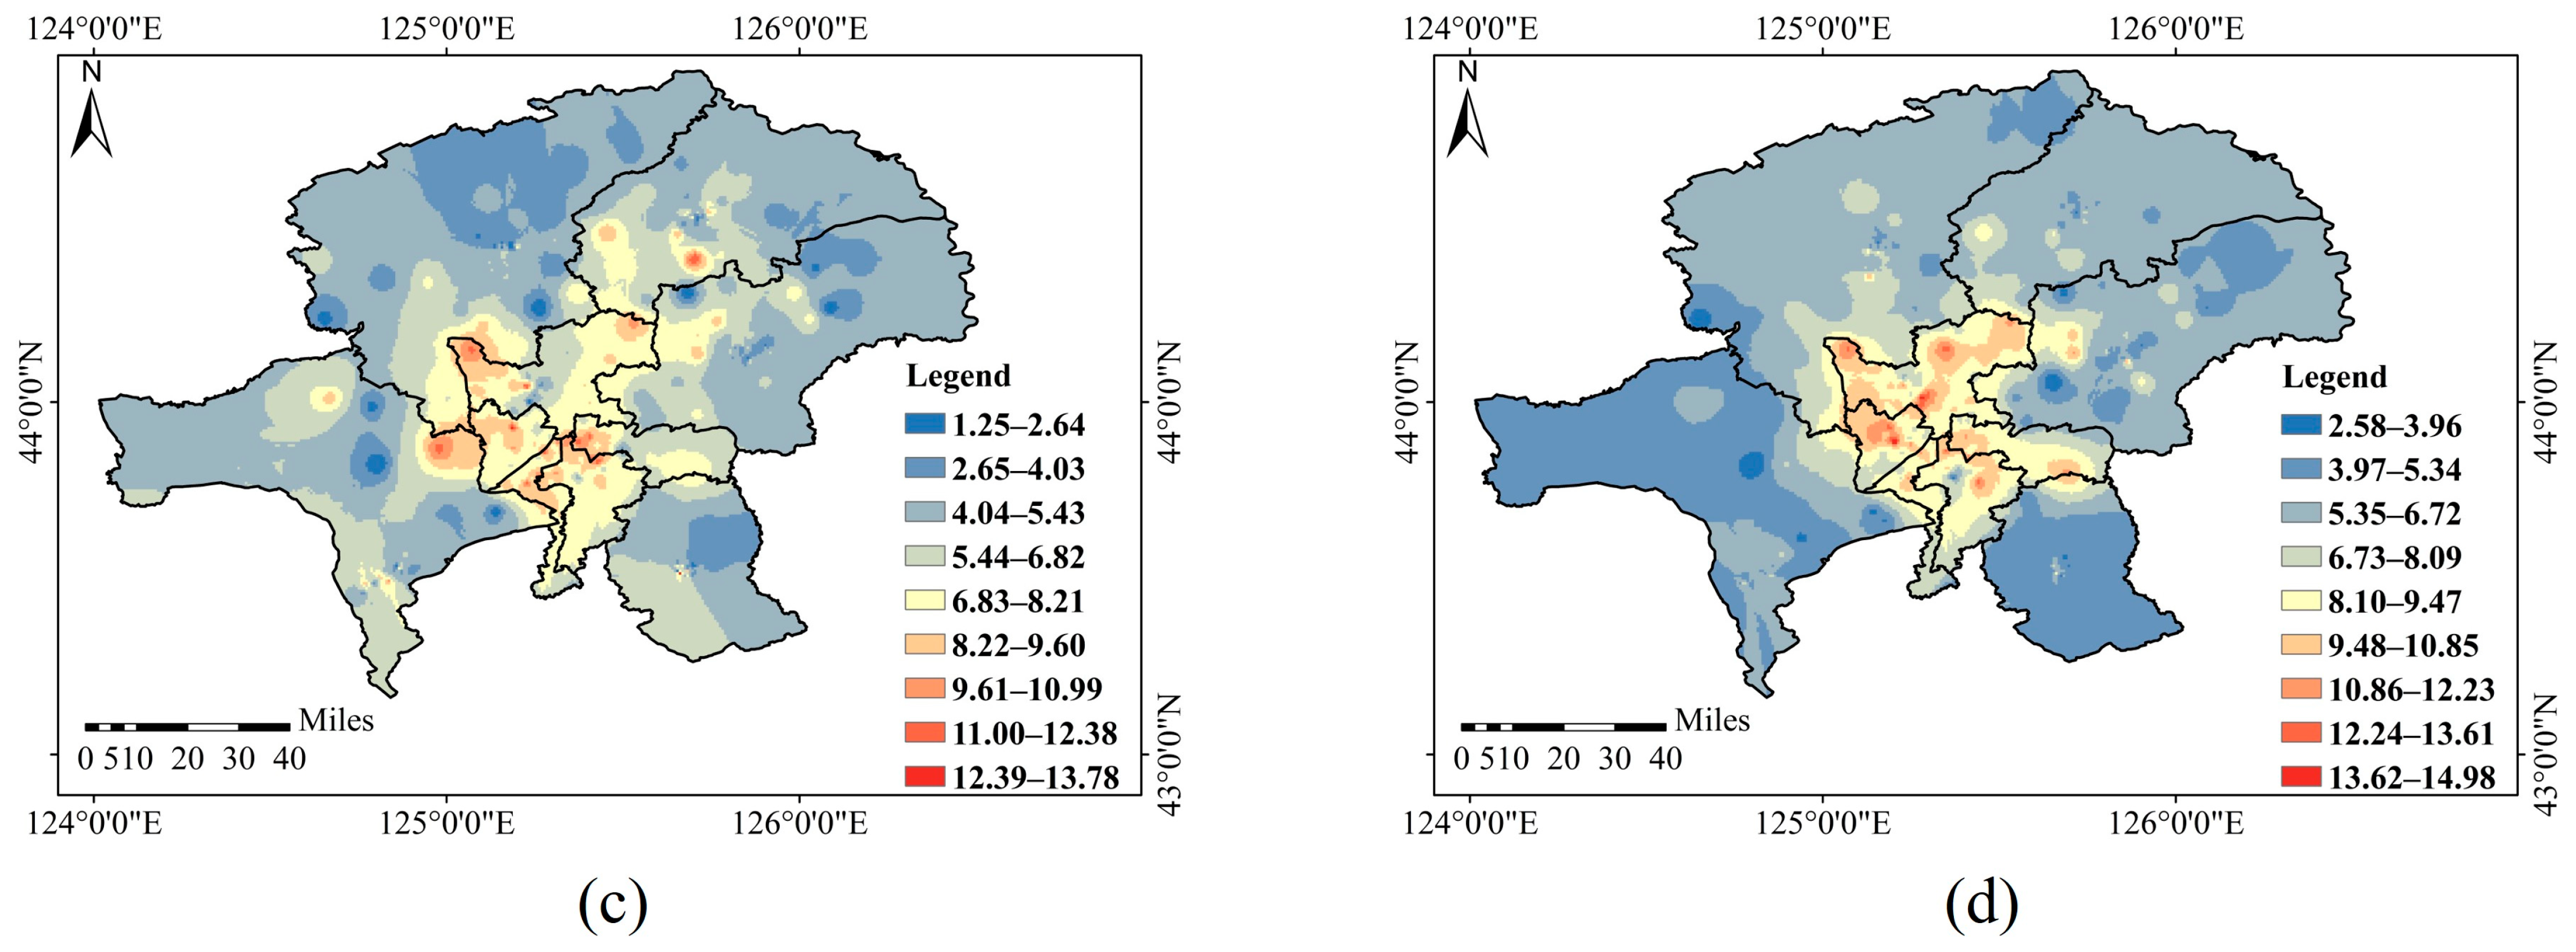
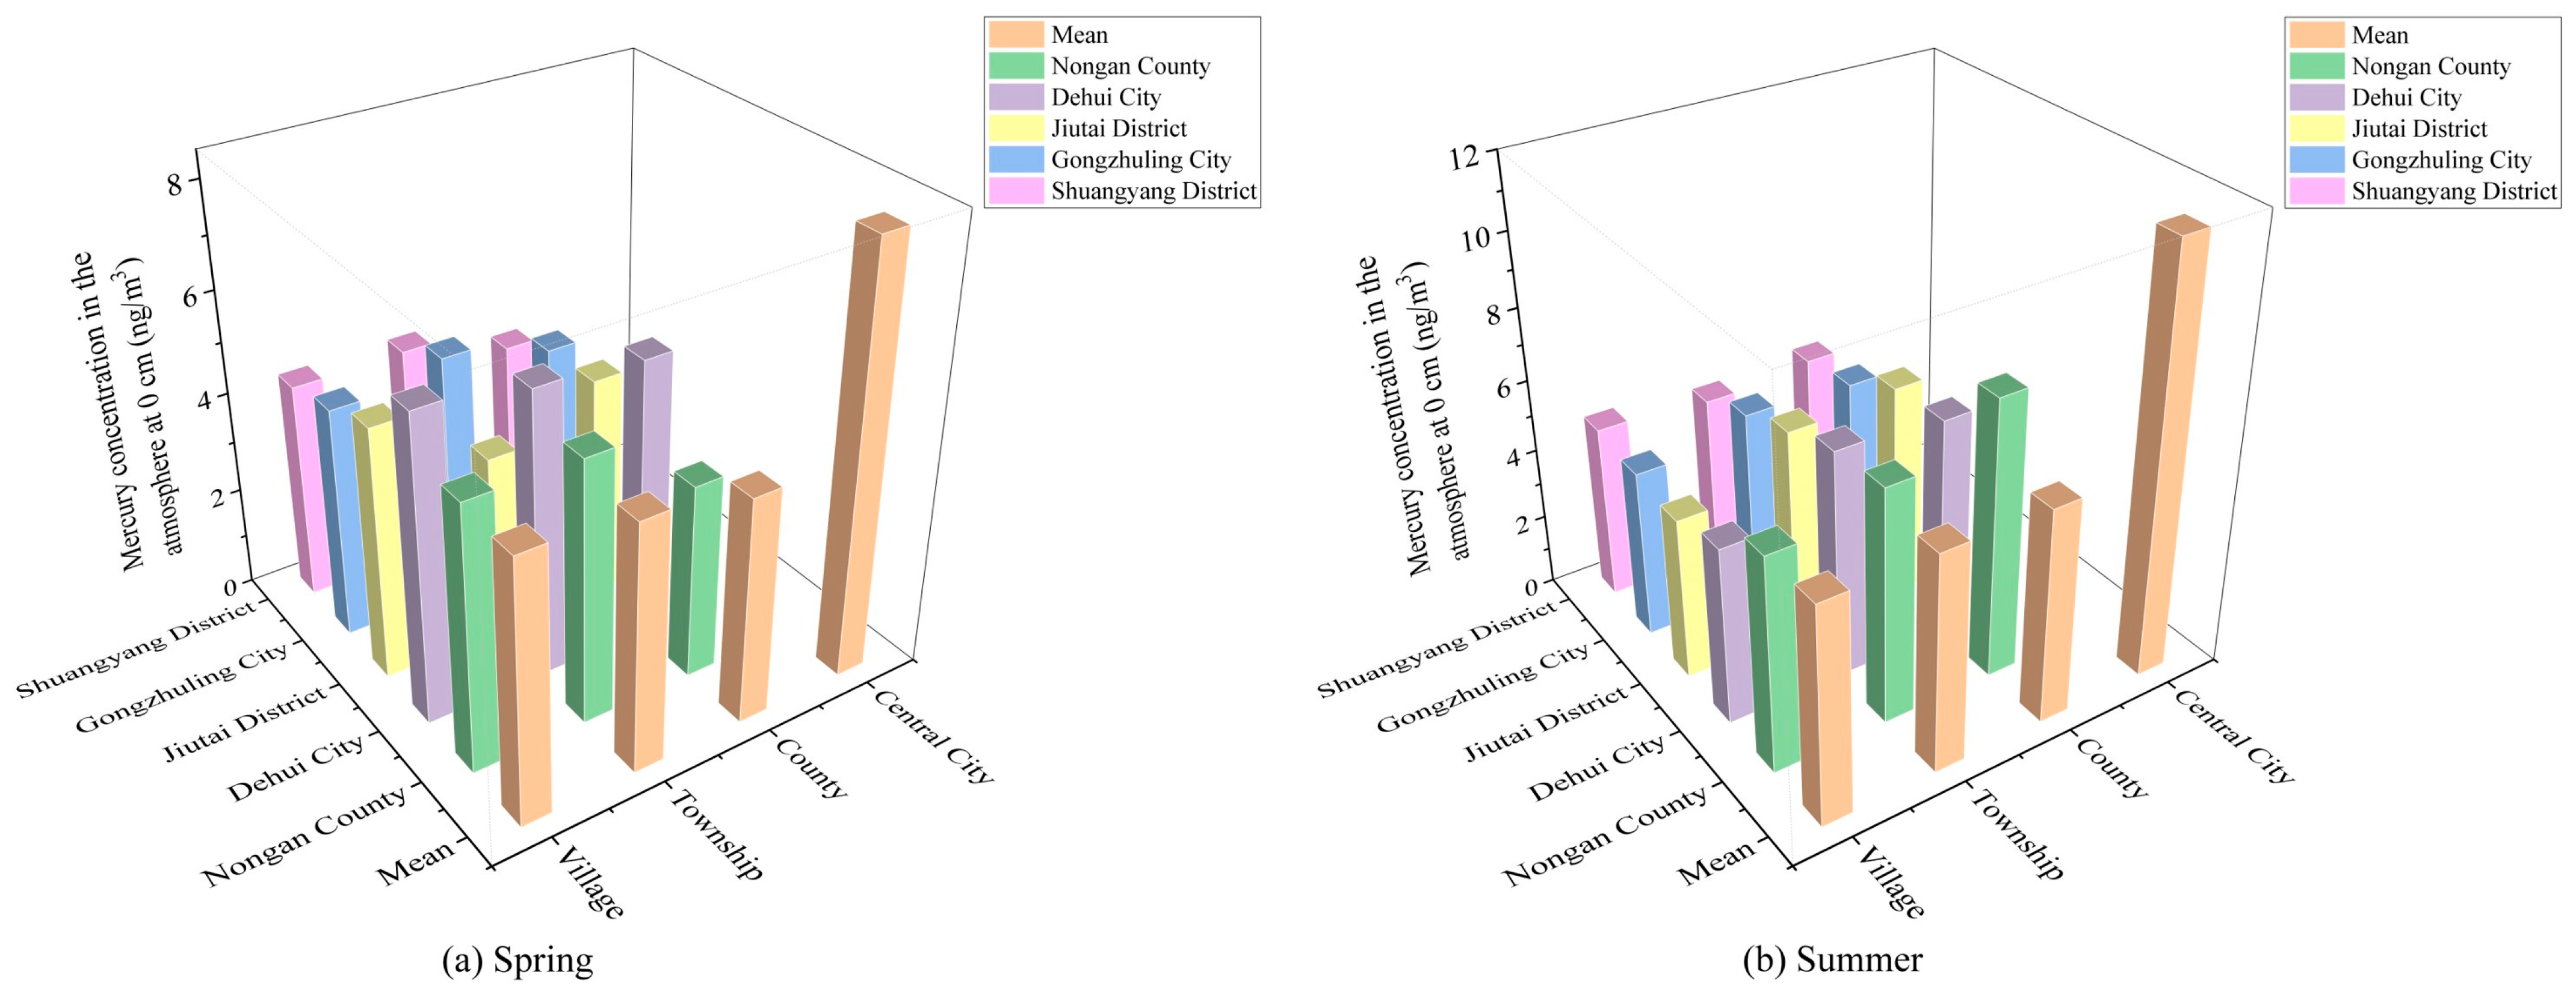
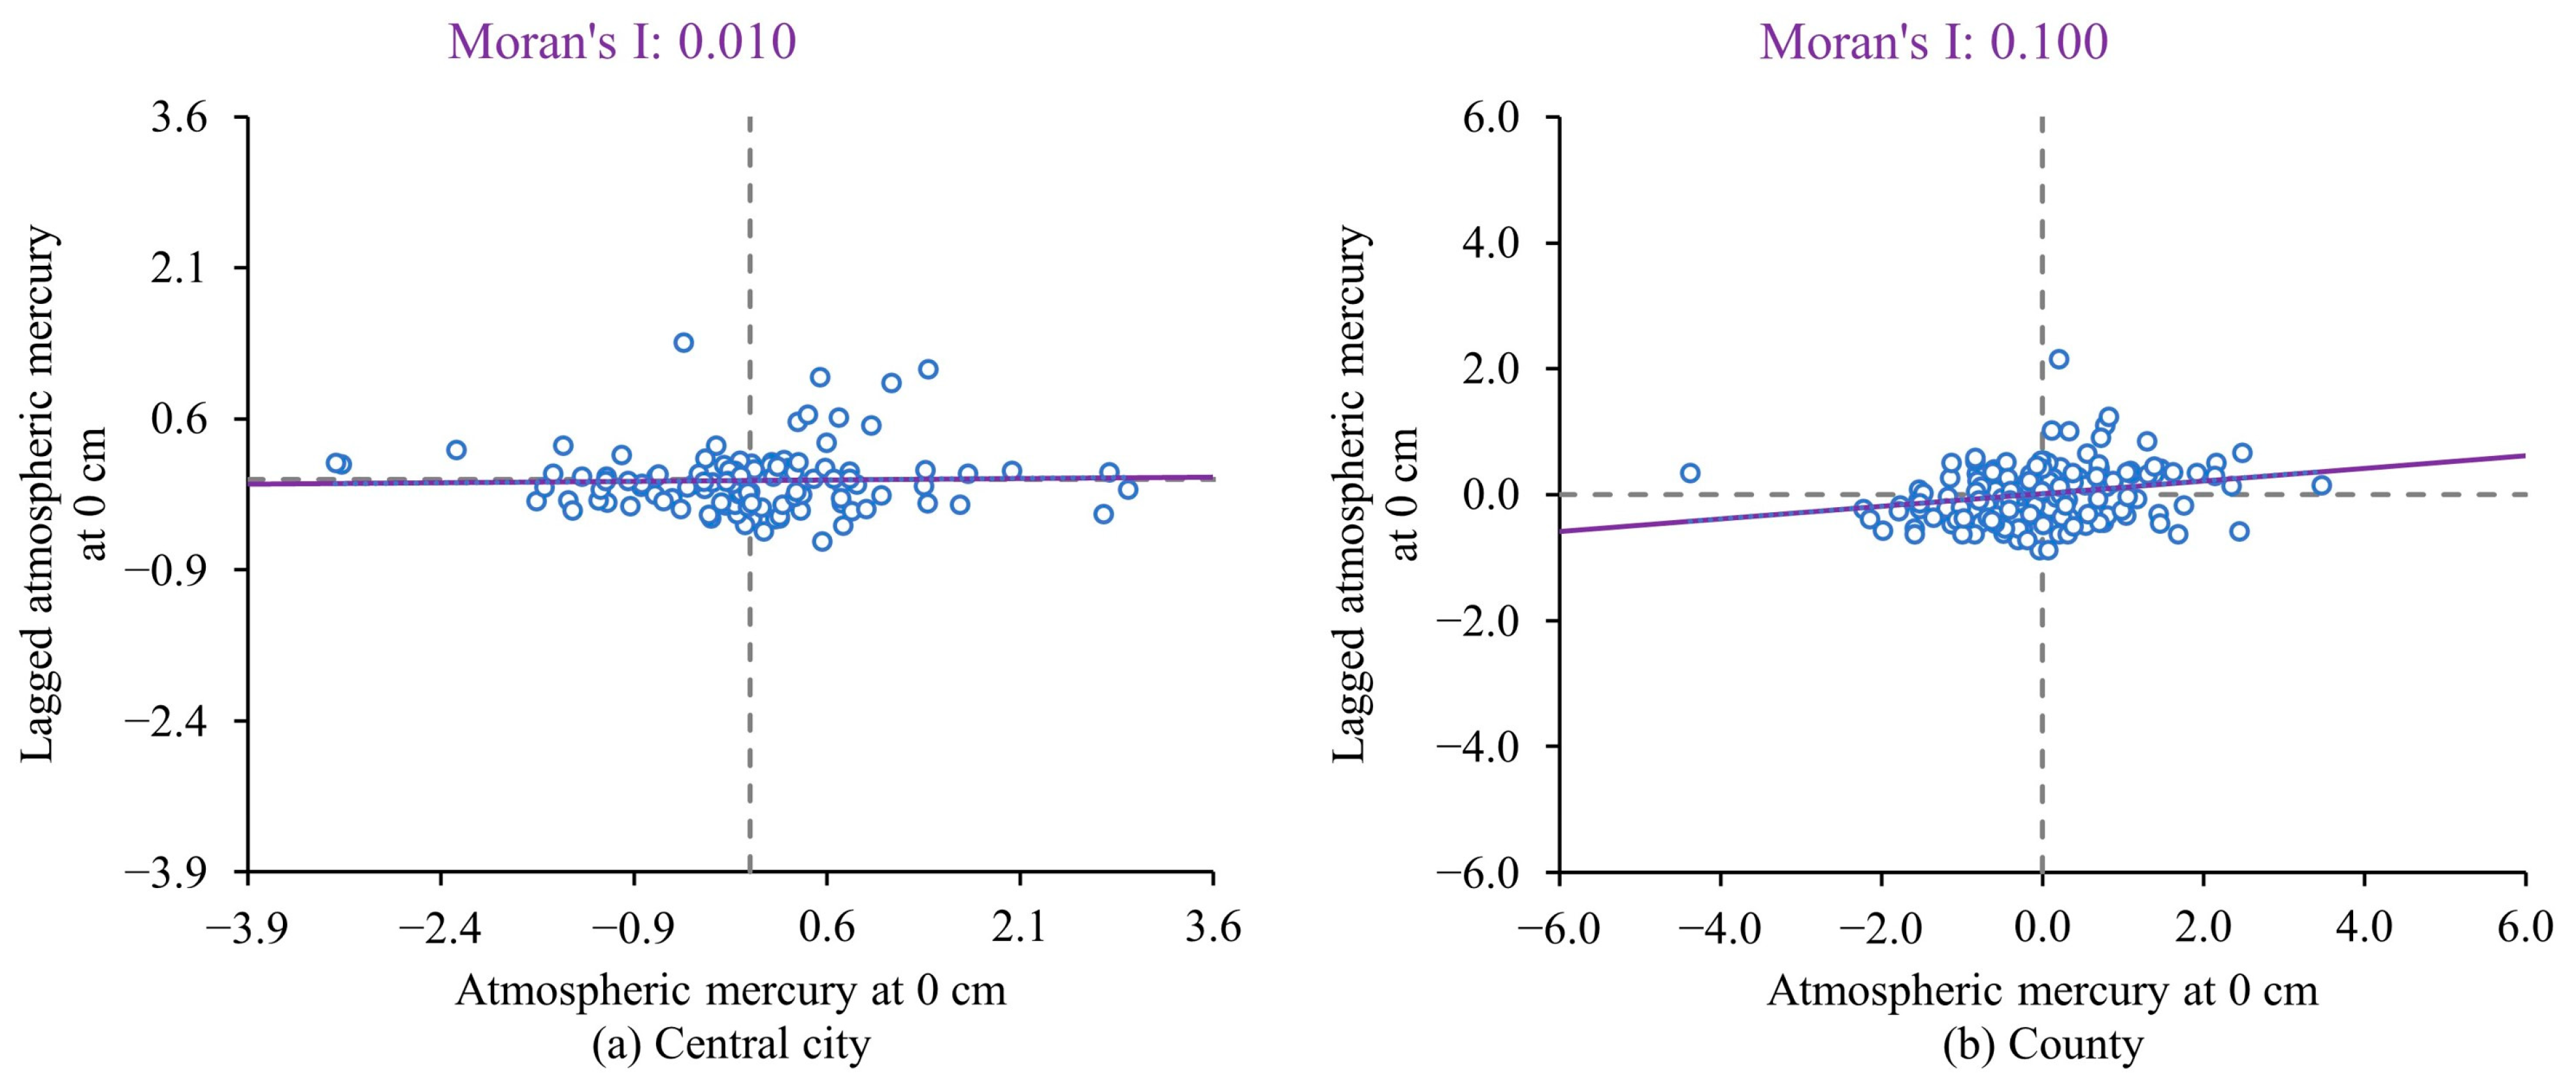
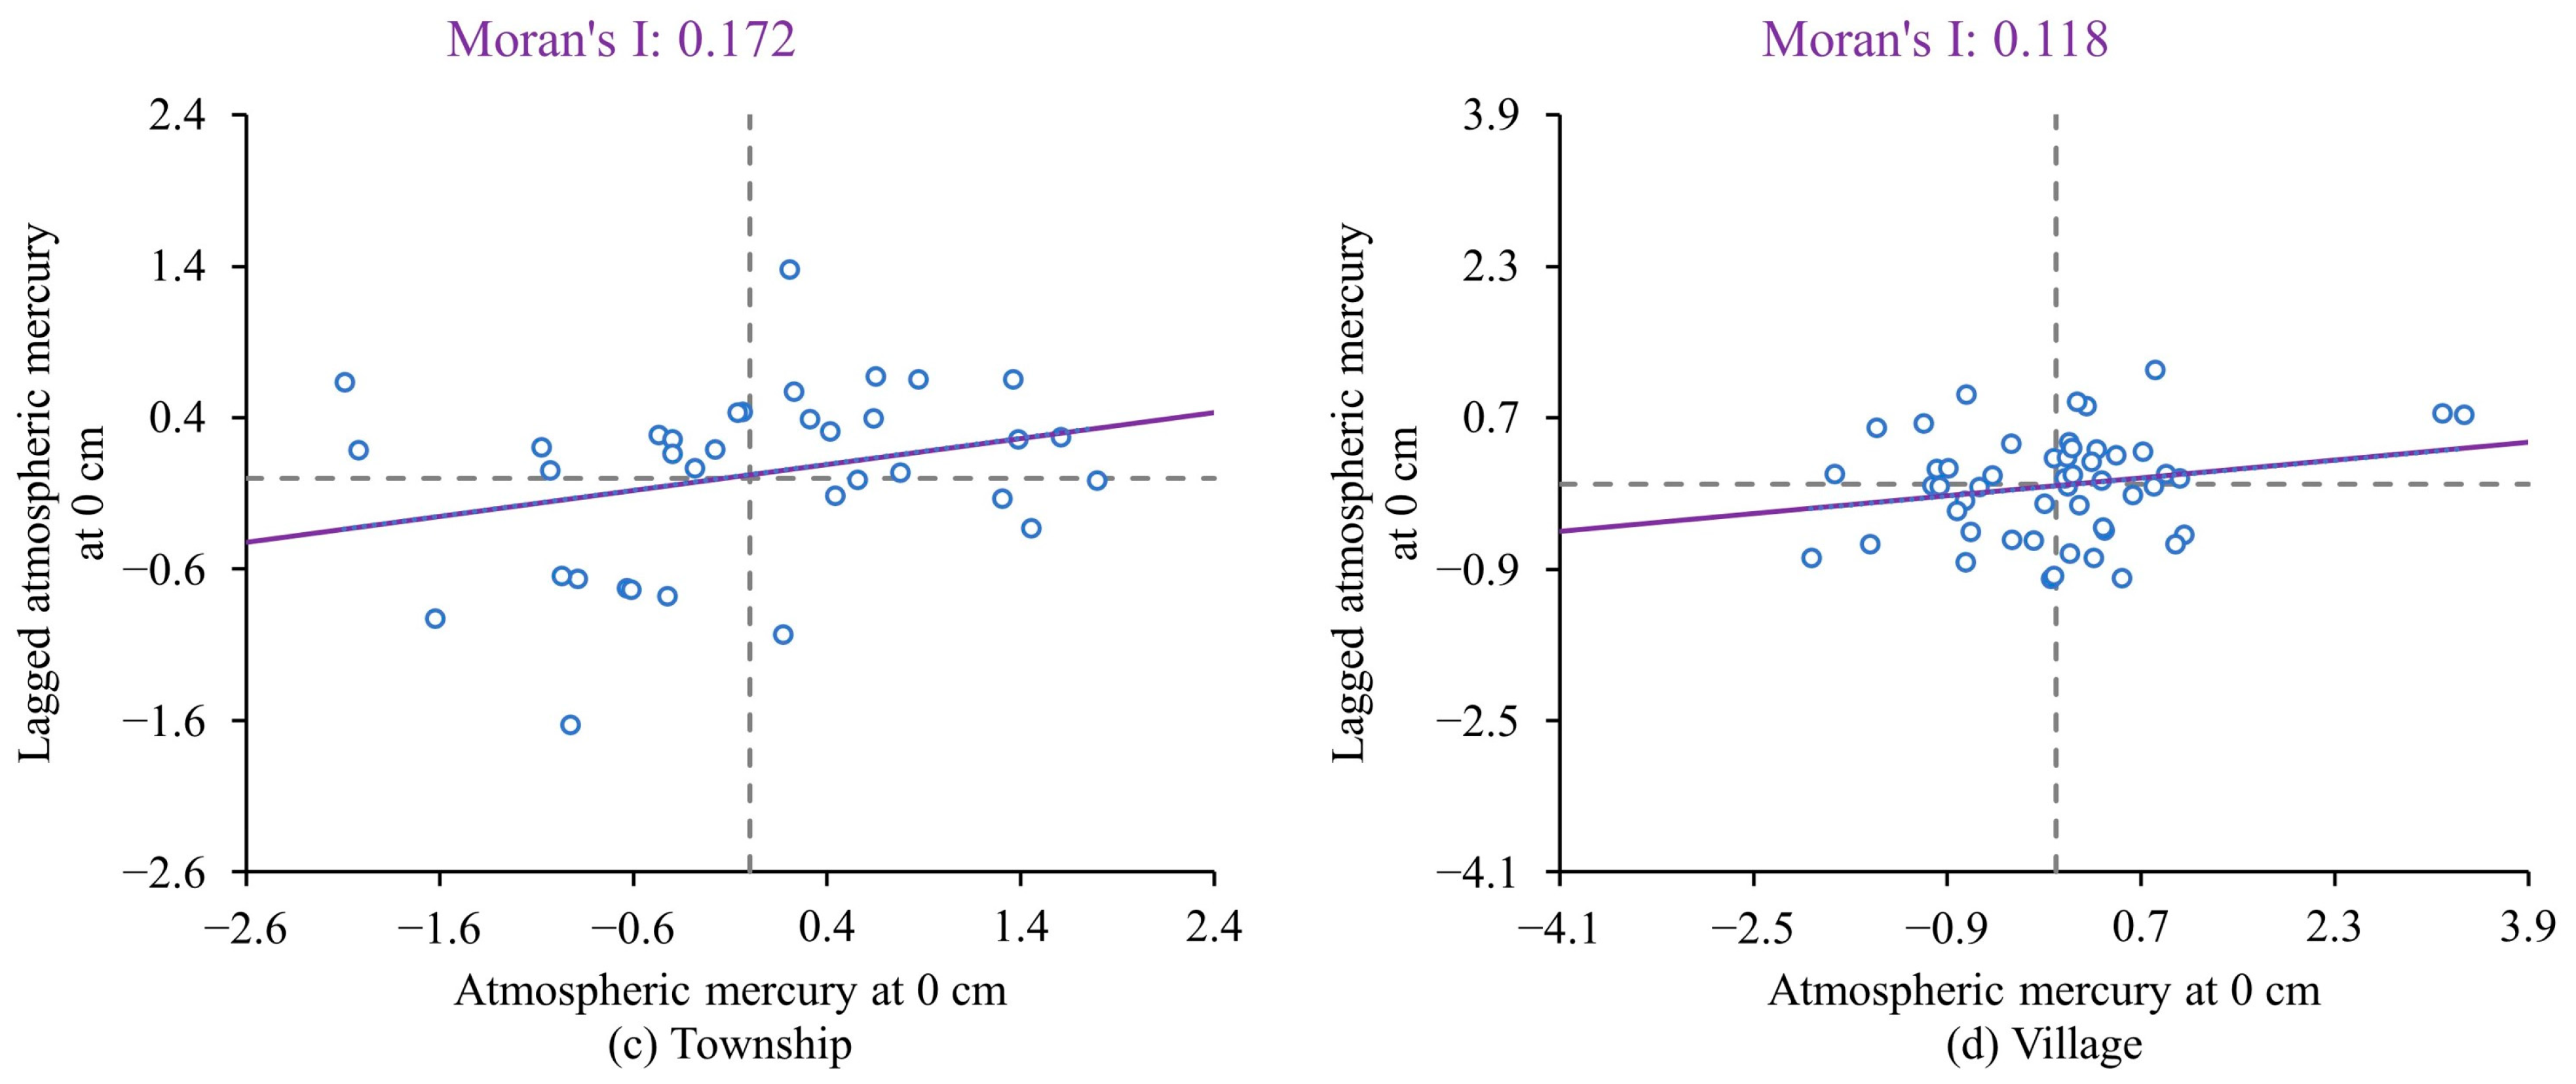
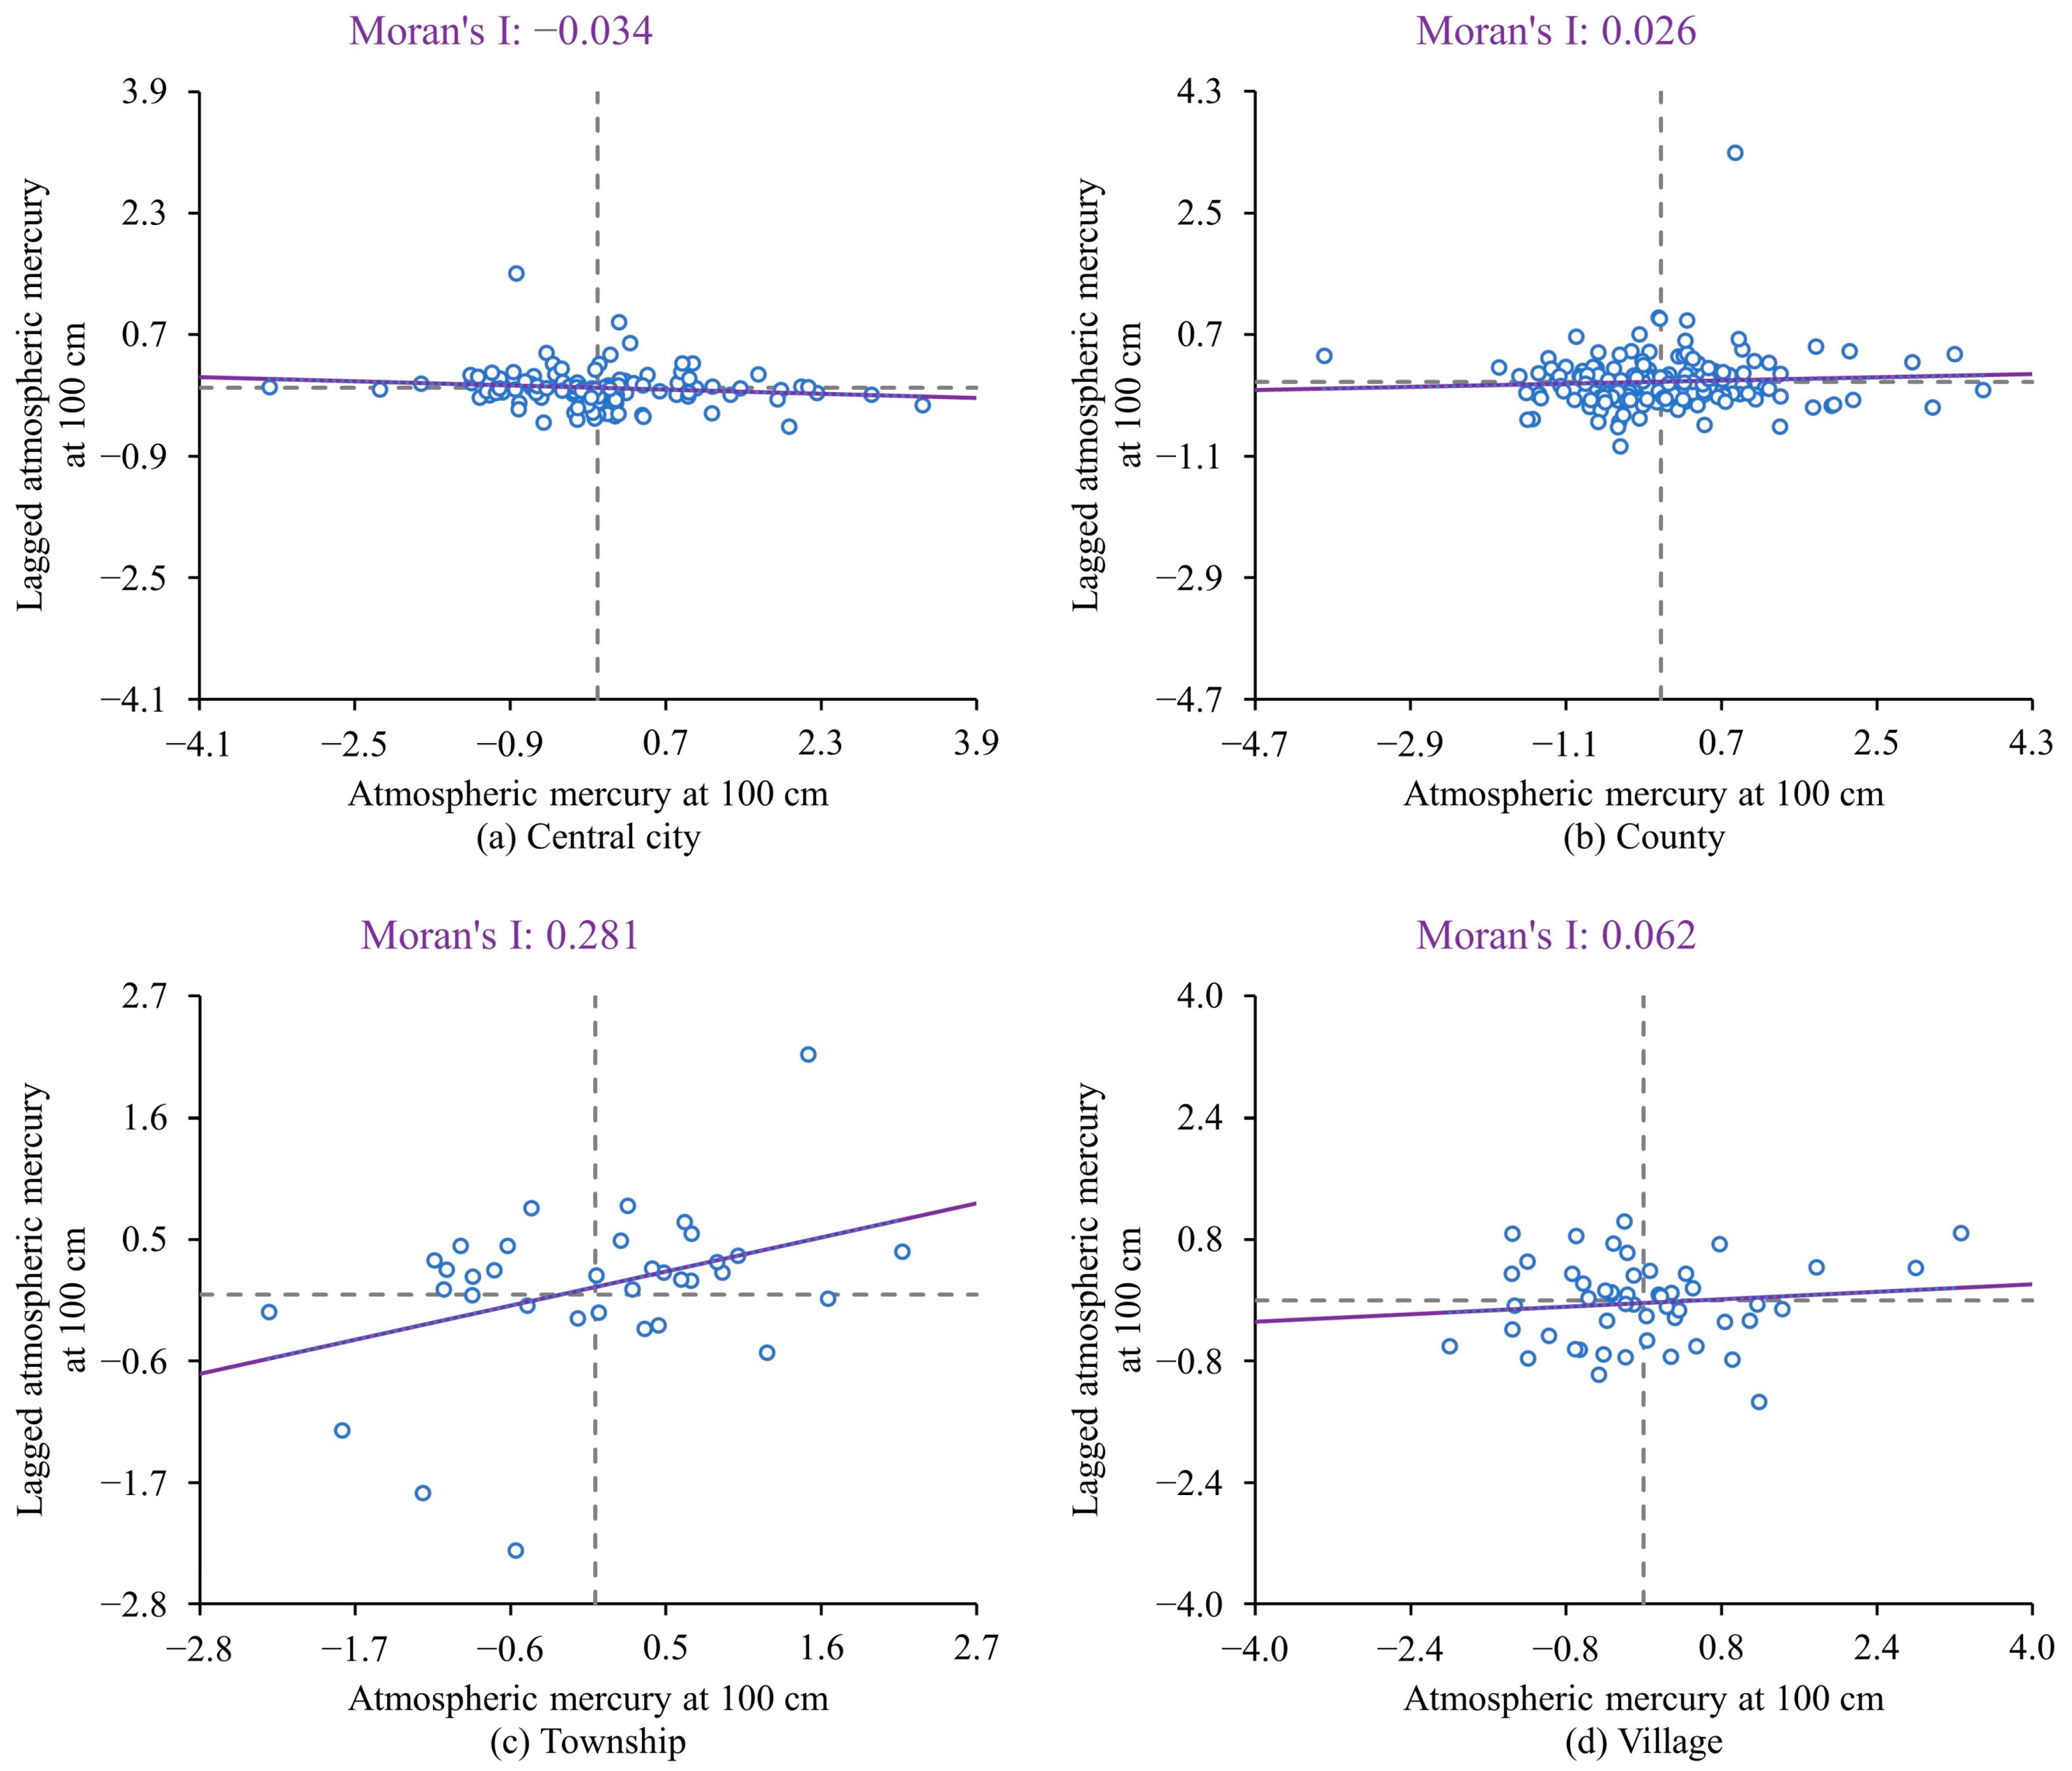
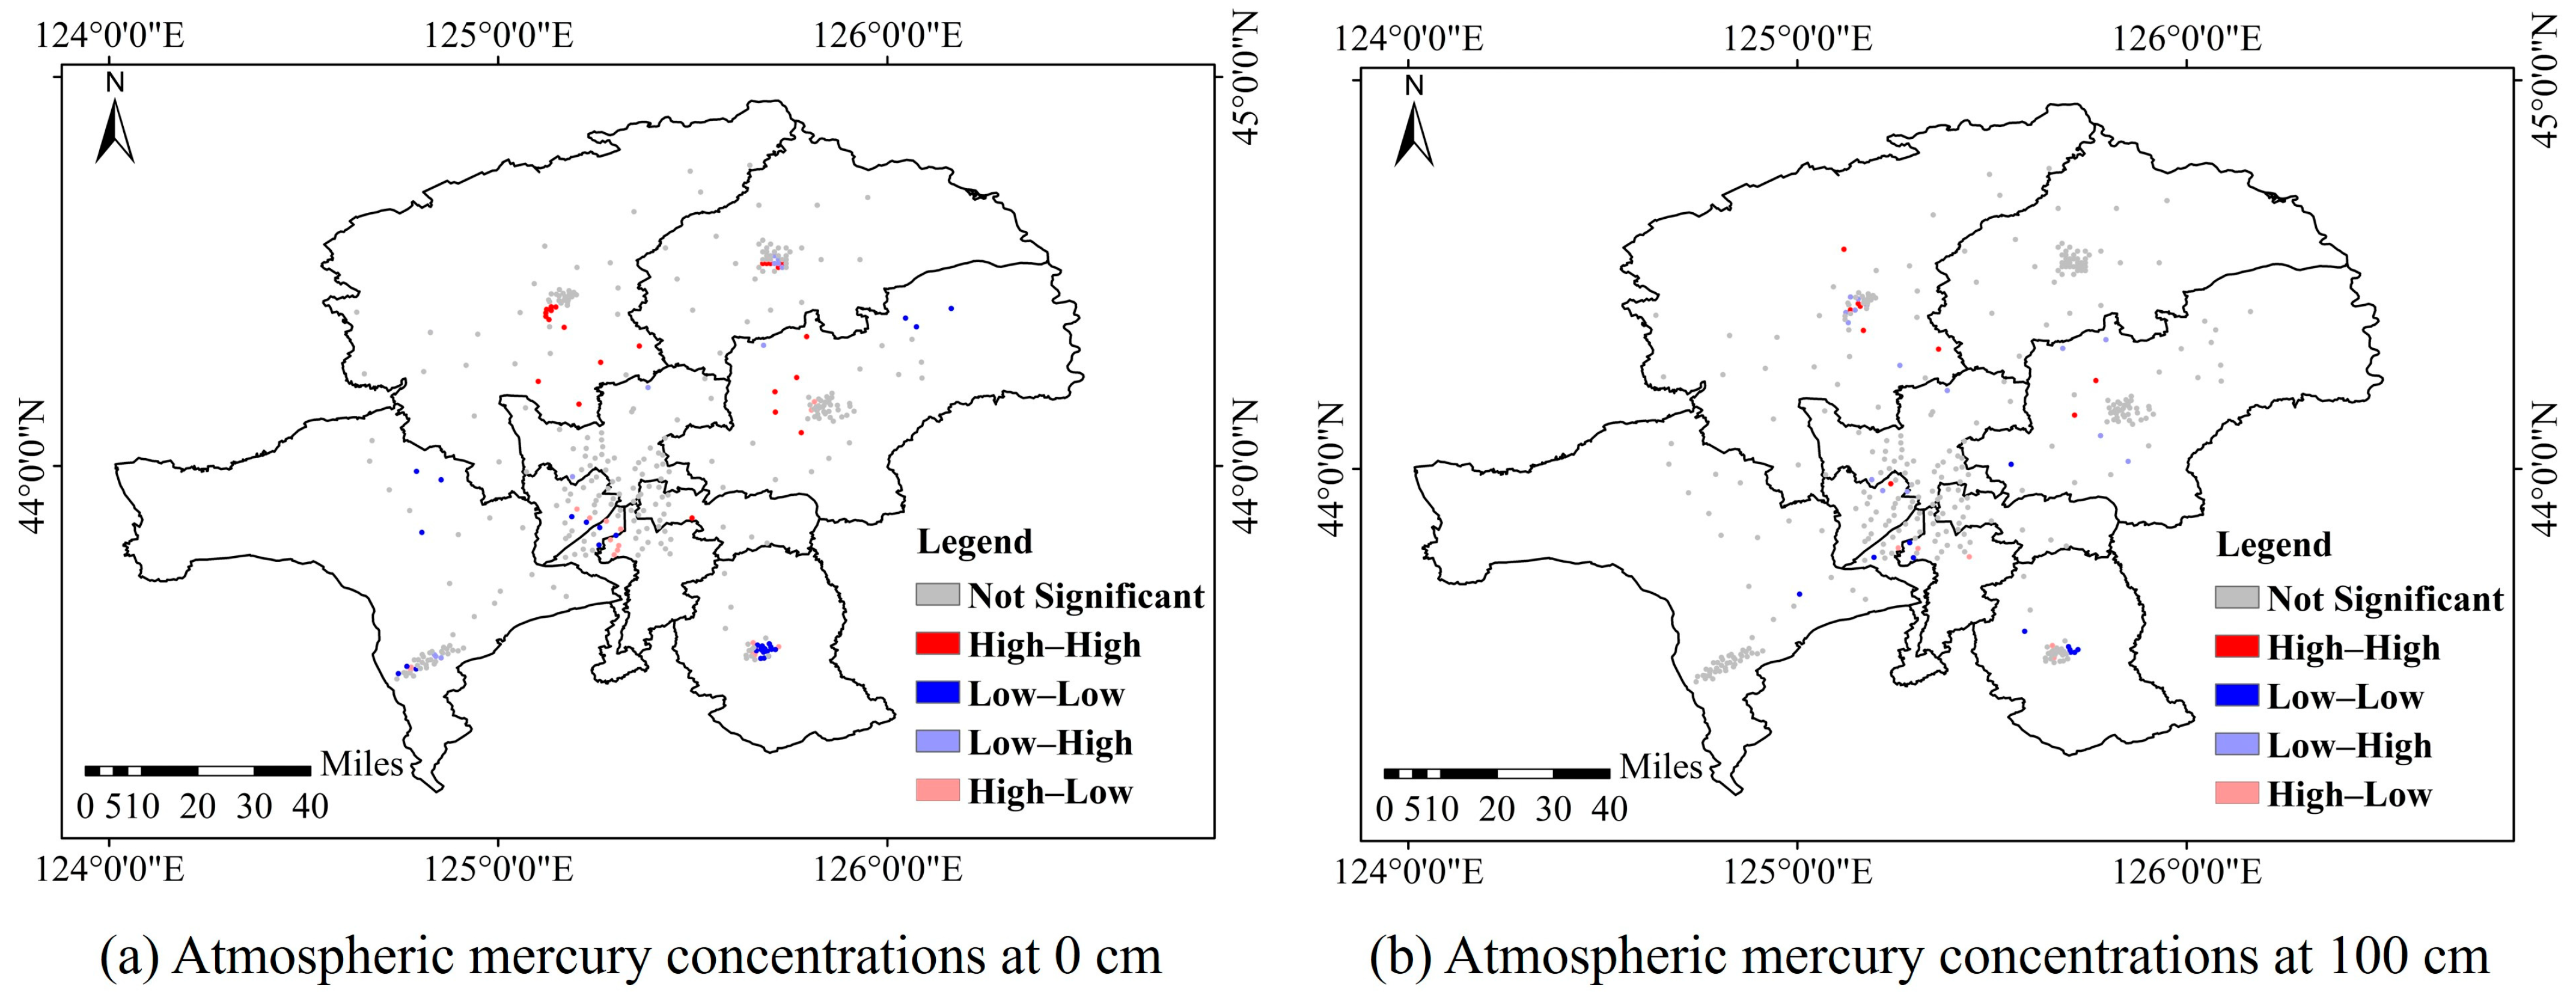
3.2.2. Distribution Characteristics of Atmospheric Mercury in Different Spatial Scales

As the regional central city of the urban agglomeration, the atmospheric mercury concentration in Changchun Municipal District is significantly higher than that in county-level cities (districts). Figure 9 and Figure 10 show the distribution of the atmospheric mercury concentration in the Changchun urban agglomeration, which exhibits a discernible spatial pattern. The pattern shows the regional central city as the center of the circle, gradually decreasing to the surrounding county-level cities (districts), townships, and villages of a slightly smaller scale. Comparing the spatial distribution characteristics of atmospheric mercury in Changchun urban agglomeration, it can be found that the highest levels of atmospheric mercury content are observed in Changchun Municipal District. Centered in Changchun Municipal District, the atmospheric mercury content decreases gradually with the increase in the distance in the north and south directions. Small peaks of the atmospheric mercury concentration occur when large townships are encountered in the east and west directions, and then decrease significantly when entering the village areas. In the central part of Changchun Municipal District, the atmospheric mercury content is high in different seasons and decreases gradually with distance, while in the urban–rural transition zone at the border of Changchun Municipal District, the atmospheric mercury concentration is higher in the northwestern and southeastern parts of the district.
As can be seen from Figure 11 and Figure 12, at different spatial scales, atmospheric mercury concentrations at 0 cm and 100 cm in spring, summer, and autumn were highest in the central city. Additionally, the order of magnitude varies among counties, towns, and villages in different seasons. The order of average atmospheric mercury at 0 cm and 100 cm from high to low was central city, township, village, and county. In Nongan County and Gongzhuling City, the order of concentration at 0 cm and 100 cm from high to low was township, county, and village. In Dehui City, the highest concentration at 0 cm and 100 cm of mercury was observed in the township, followed by the village and then the county. In the case of Jiutai District, the order of concentration at 0 cm and 100 cm is as follows: village, county, township. For Shuangyang District, it is village, county, and township at 0 cm, county, village, and township at 100 cm.
Figure 13 and Figure 14 represent the Moran’s I scatter plots of atmospheric mercury at 0 cm and 100 cm under different spatial scales. Figure 15 presents spatial clustering maps of atmospheric mercury at different scales. Under the four spatial scales, the Moran’s I coefficients of atmospheric mercury at 0 cm are all positive, with the values descending in the order of township > village > county > central city. For atmospheric mercury at 100 cm, the Moran’s I coefficient is negative in the central city, while positive in other spatial scales, and the values decrease in the order of township > village > county > central city. Regarding atmospheric mercury at 0 cm, in the central city, most of the points show spatial repulsion and are located in the fourth quadrant, indicating high–low values, followed by low–low clustering. These points are mostly located in the southwest. At 100 cm, most of the points are located in the second quadrant, indicating low–high values, predominantly in the northwest, followed by low–low clustering, which is mainly located in the southwest. Under the county scale, at 0 cm, the low–low aggregations are the most numerous, mainly distributed in Shuangyang District and Gongzhuling City, followed by high–high aggregations, which are mostly located in Nongan County and Dehui City. At 100 cm, low–high outliers are the most prevalent, mostly located in Nongan County, followed by low–low aggregations, mainly distributed in Shuangyang District, and high–high aggregations, which are mostly located in Nongan County. Under the township scale, at 0 cm, the high–high aggregations are the most abundant, mostly located in the central region, followed by low–low aggregations, which are mostly located in the northeast. At 100 cm, high–high aggregations are mostly located in the northwest, and low–low aggregations are mostly located in the southeast, with an equal number of both. Under the village scale, at 0 cm, the high–high aggregations are the most numerous, mostly located in the northeast, followed by low–low aggregations, which are mostly located in the southwest. At 100 cm, low–high outliers are the most common, mostly located in the southeast, followed by high–high aggregations, which are mostly located in the northeast.

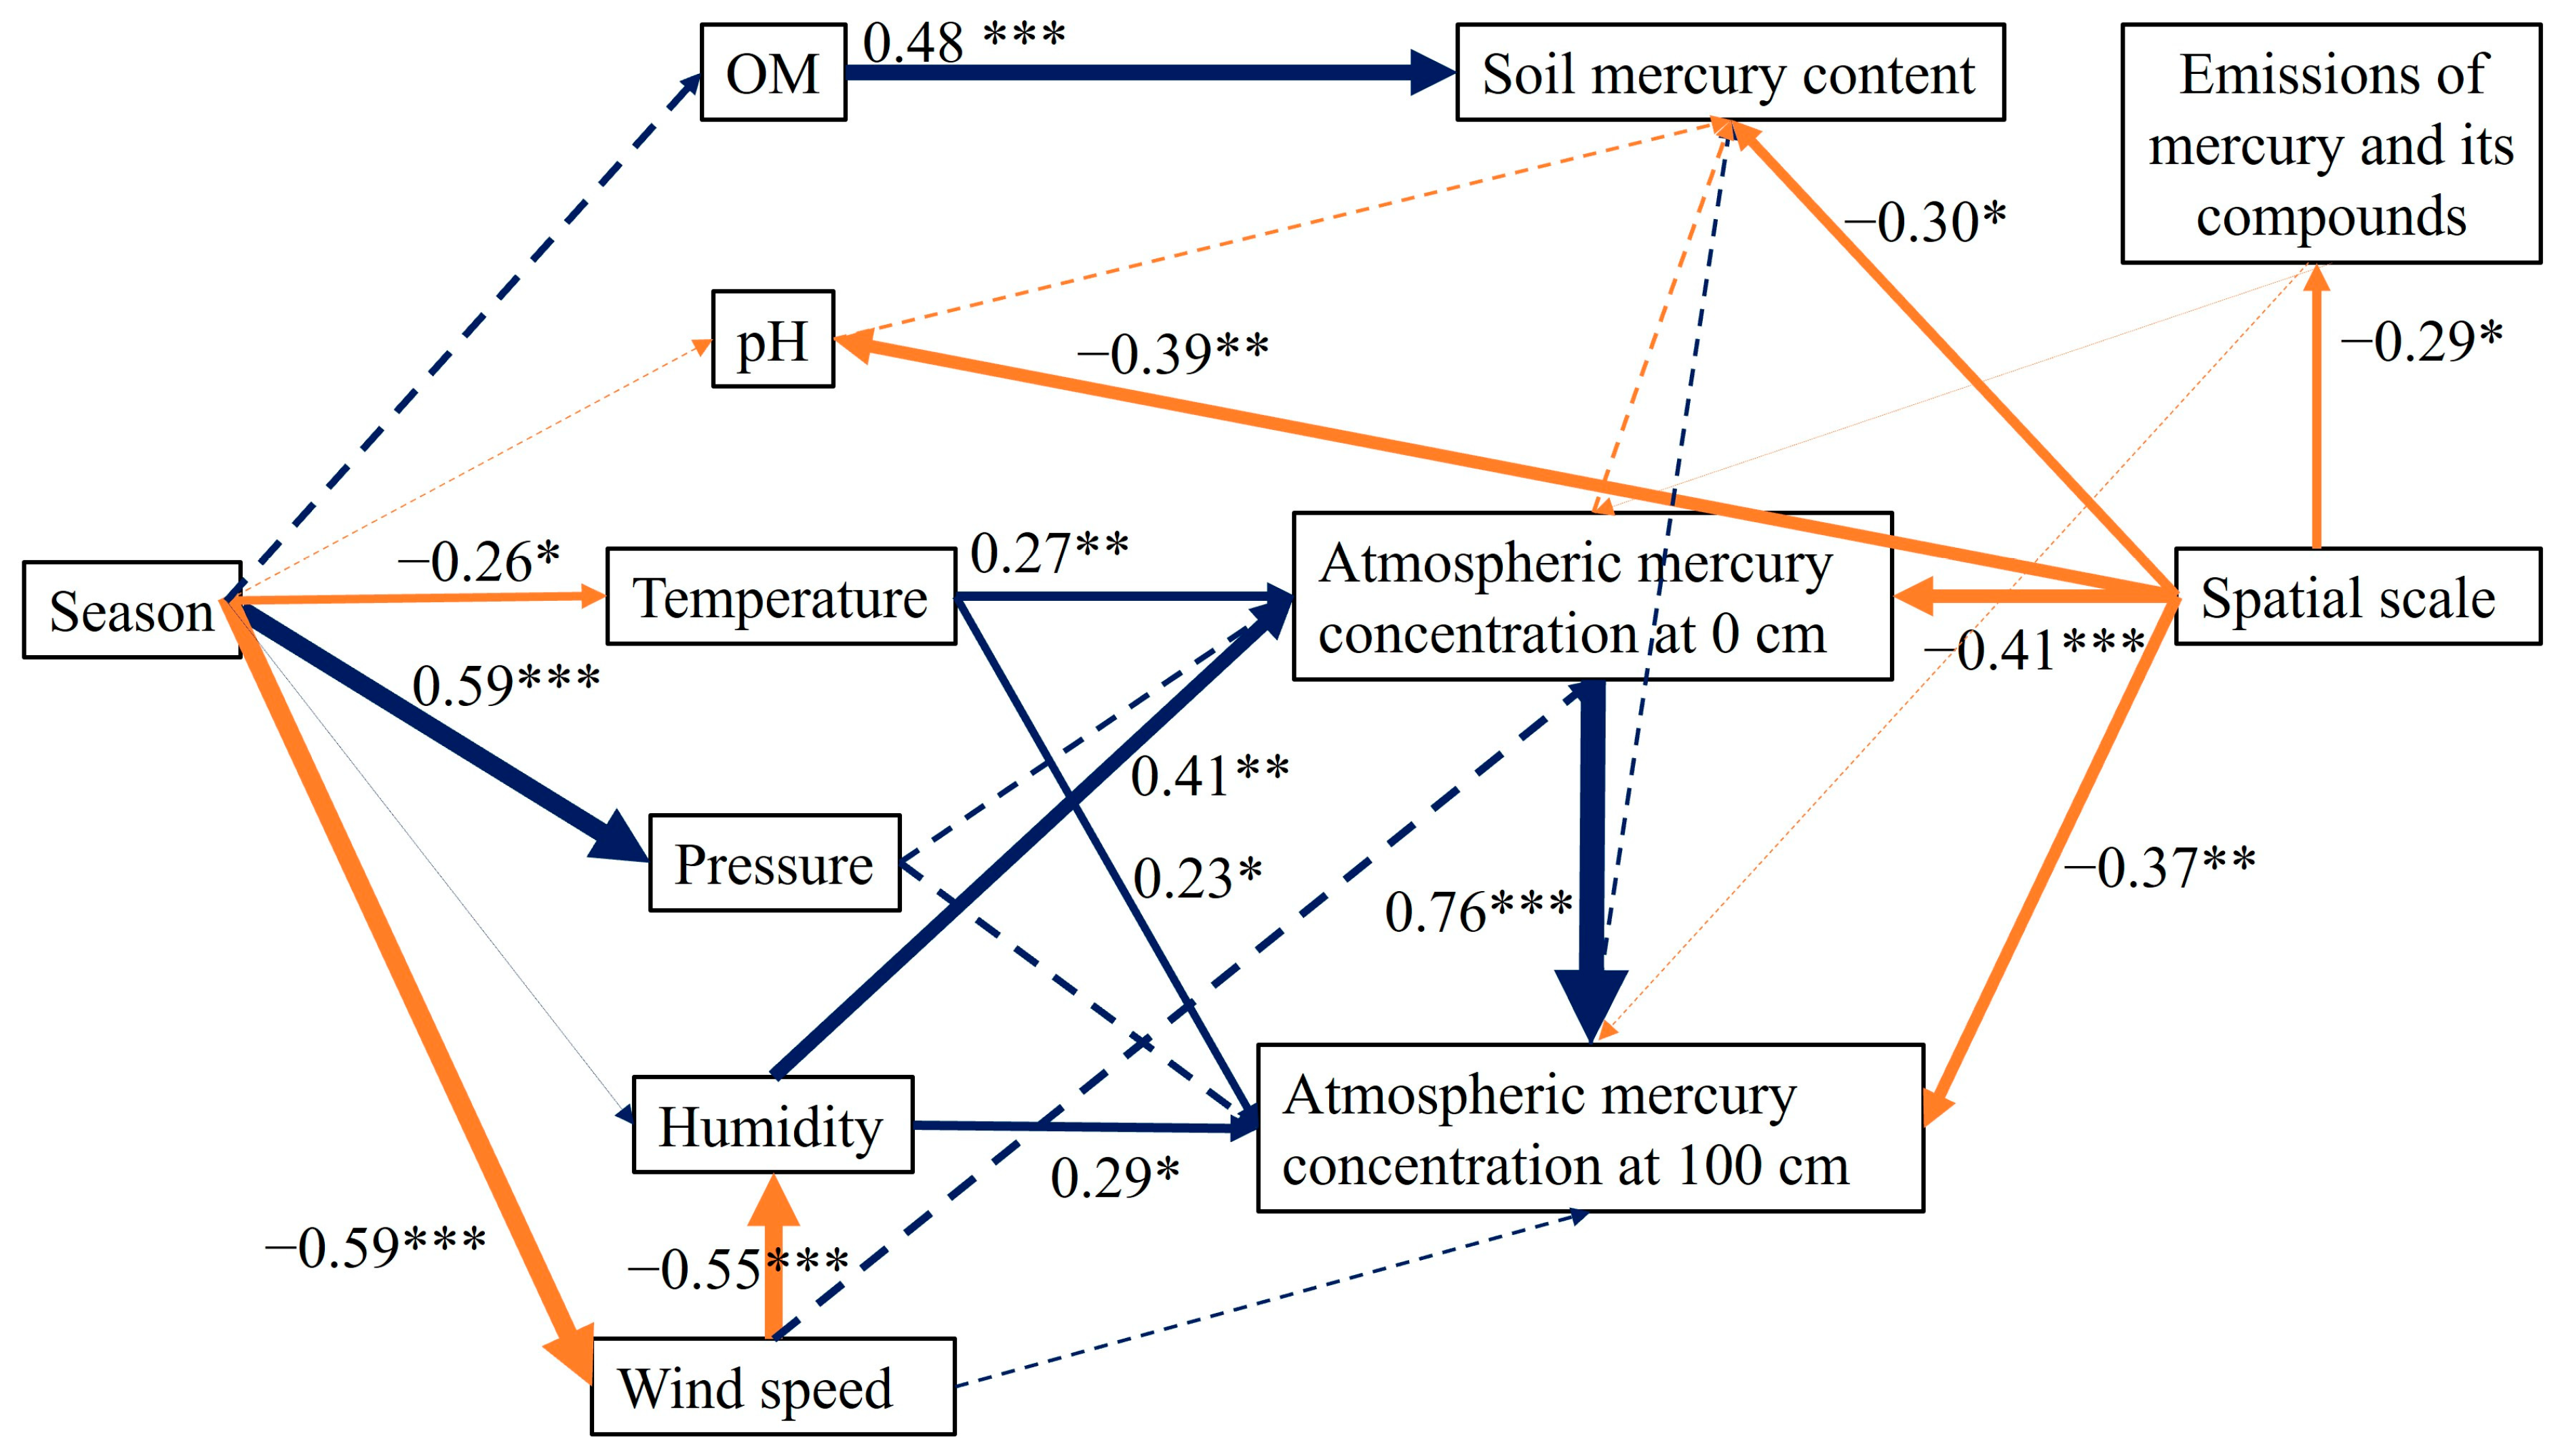
3.3. Path Analyses of the Main Influencing Factors of Soil Mercury and Atmospheric Mercury in Metropolitan Areas

3.3.1. Influencing Factors of Soil Mercury in Changchun Urban Agglomeration

In accordance to the soil acidity and alkalinity (pH) grading standard in the Chinese National Standard DZ/T0295-2016 [38], “Land Quality Geochemical Evaluation Specification”, a pH range of 6.5 to 7.5 is classified neutral, and 7.5 to 8.5 is alkaline. The soil in Changchun Municipal District, Nongan County, Dehui City, Gongzhuling City, and Shuangyang District is alkaline during the spring, summer, and autumn. In contrast, the soil in Jiutai District soil is neutral in the spring, summer, and autumn.
In this study, the soil organic matter content was determined and analyzed by Pearson correlation with the soil mercury content. The results are shown in Table 3, which shows that there was a significant correlation (p < 0.05) between the soil organic matter content and the soil mercury content.

3.3.2. Factors Affecting Atmospheric Mercury in the Changchun Urban Agglomeration

Meteorological parameters are important factors affecting the transport and transformation of atmospheric pollutants. Table 4 shows the correlation coefficients between meteorological factors and atmospheric mercury concentrations at 0 cm and 100 cm. It can be found that the atmospheric mercury concentrations at different heights are significantly correlated with meteorological parameters, and this correlation has obvious regional and seasonal differences. The atmospheric mercury concentrations at 0 cm and 100 cm in each study area of Changchun urban agglomeration were positively correlated with air temperature in different seasons; the correlation coefficients between other meteorological factors and atmospheric mercury varied. In spring, the atmospheric mercury concentration at 100 cm in Changchun Municipal District was significantly and negatively correlated with wind speed. In Nongan County, it was significantly and negatively correlated with air pressure, while in Jiutai District it was significantly and negatively correlated with humidity. In summer, atmospheric mercury concentrations at 0 cm and 100 cm in Changchun Municipal District, Dehui City, and Gongzhuling City were significantly negatively correlated with humidity, while atmospheric mercury concentrations at 100 cm in Nongan County, Jiutai District, and Shuangyang District were significantly negatively correlated with humidity. The atmospheric mercury concentrations at 0 cm in Nongan County exhibited a negative correlation with air pressure, while those at both 0 cm and 100 cm in Gongzhuling City were significantly negatively correlated with air pressure. In Dehui City, the atmospheric mercury concentrations at both 0 cm and 100 cm exhibited a positive correlation with wind speed. In autumn, there was a significant positive correlation between atmospheric mercury concentrations at 0 cm and 100 cm and wind speed at Changchun Municipal District, Nongan County, and Shuangyang District. In Jiutai District and Gongzhuling City, this correlation was only observed at 100 cm.
Figure 16 shows that the model has a chi-square value of 58.59, a degree of freedom of 38, and a ratio of 1.54. These results of the structural equation modelling demonstrate that different spatial scales have a significant negative effect on the emission of mercury and its compounds (β = −0.29), soil mercury content (β = −0.30), and the atmospheric mercury concentration at 0 cm and 100 cm (β = −0.41, β = −0.37). Soil organic matter showed a strong direct positive effect on soil mercury content (β = 0.48), which combined with the significant positive correlation between soil mercury and organic matter, reflects the strong complexation of soil organic matter functional groups to Hg2+ in soil. The results of Liu [39], by constructing structural equations, similarly showed that organic matter exhibited a positive effect on soil mercury concentration (β = 0.56). Seasonal variations directly affected air temperature, air pressure, and humidity, which had a negative effect on air temperature and wind speed (β = −0.26, β = −0.59), and a positive effect on air pressure (β = 0.59). Both air temperature and humidity had a positive effect on atmospheric mercury concentrations at different heights. The total effect of air temperature on atmospheric mercury concentrations at 0 and 100 cm was 0.27 and 0.23, and the total effect of humidity on atmospheric mercury concentrations at 0 and 100 cm was 0.41 and 0.29. In addition, atmospheric mercury concentration at 0 cm had a significant positive effect on atmospheric mercury concentration at 100 cm (β = 0.76), which indicated that the atmospheric mercury concentration at 0 cm also played a role in atmospheric mercury concentration at 100 cm, which is mediated by meteorological factors and spatial scales.

4. Discussion

4.1. Soil Mercury Shows Obvious Seasonal Changes in Different Spatial Scales

The spatial distribution of soil heavy metals is influenced by a combination of natural and social environmental factors, resulting in strong spatial heterogeneity [40]. Soils in different areas were contaminated with different levels of mercury and, compared with other cities in China, the soil mercury concentration in the administrative districts of the Changchun urban agglomeration were higher than those in less densely populated cities, such as the Tibet (0.026 mg/kg) [41], and lower than those in cities with large numbers of heavy industries, such as Chongqing (0.096 mg/kg) [42], Sichuan Province (0.154 mg/kg) [43], Beijing (0.073 mg/kg) [44], Nanjing (0.430 mg/kg) [45], and Guangzhou City (0.614 mg/kg) [46]. Variations in soil mercury levels are primarily due to differences in socio-economic development across regions, with the main anthropogenic factors including land use types, population, and mercury emissions from human activities. Significant variations in heavy metal concentrations exist among different land use types. Zhang et al. found that mercury levels decreased sequentially as follows: agricultural land > green belts > woodland [47]. Anthropogenic and production activities are very likely to release large amounts of mercury-containing waste into the soil and contribute to mercury enrichment in some areas, such as industrial production, agricultural production, and daily life. Therefore, in the more populated and economically developed areas, human life production has caused an increase in anthropogenic mercury emissions, while large mining activities and non-ferrous metal smelting in some areas produce large amounts of mercury-containing waste and slag, which also increase the mercury concentration in the surrounding soil. And, the mercury content of the soil in the vicinity of the area varies depending on the local wind direction and topographic features [48].
Of the three seasons, soil mercury concentrations are lowest in the summer. This is mainly related to the exchange between soil and the atmosphere [49]. Soil mercury emissions in summer are influenced by meteorological factors (solar radiation, temperature, and humidity) and other factors, which increase and cause the content to decrease. It is considered that mercury released from the soil surface is an important part of the natural source of mercury in the atmosphere, and it is estimated that about 700 t of mercury is released from the soil to the atmosphere every year [50], and environmental factors such as light radiation intensity, surface wind speed, soil temperature, relative humidity, and rainfall affect the natural emission of mercury from the soil [51]. Increased light radiation intensity will cause more Hg2+ to undergo photoreduction reactions, resulting in a significant increase in soil mercury emissions [52]. In addition, increased radiation intensity will lead to an increase in surface temperature, which accelerates the reduction of Hg2+ to Hg0 and facilitates the release of mercury from the soil to the atmosphere [53]. Within a certain range, soil mercury flux release is positively correlated with soil moisture, and the mechanism related research has thought that this is due to the fact that the affinity of soil surface for H2O is stronger than that of Hg0, so when soil moisture increases, the soil will adsorb more water molecules and release Hg0. Liu et al. [54] found that there is a significant positive correlation between soil mercury exchange fluxes and soil moisture for each monitoring point of the black soil area of Heilongjiang Province, and the correlation coefficient of some sample points were higher than those between radiation intensity and mercury exchange fluxes, indicating that soil moisture is an important influence on mercury emissions.
Industrial activities often lead to multi-metal composite pollution. Although different metals exhibit distinct geochemical behaviors, their environmental risks are jointly regulated by the combined effects of climate change and anthropogenic disturbances [55]. The spatial distribution of soil mercury in the Changchun urban agglomeration is influenced by both natural and anthropogenic factors. Natural factors include soil texture, while anthropogenic sources include industrial production, human activities, and historical urban development [56]. The Changchun City Master Plan (2011–2020) plans that industries in Changchun Municipal District are mainly located on both sides of the railway in the southwest, in the eastern part of the city, and in the northern part of the economic development zone [57]. Industries in Nongan County are mainly located in the central region and southwest of the county. Industries in Dehui City are mainly located in the center, north, and northeast of the city. Industries in Jiutai District are mainly located in the center and southwest of the city. Gongzhuling City’s industries are mainly located in the city center, northwest, and northeast of the city. Shuangyang District industries are mainly located in the city center, southeast, and northwest of the district. These industrial enterprises emit a large quantity of mercury-containing substances into the external environment during the industrial production process. These substances enter the soil through atmospheric dry and wet deposition under suitable conditions. The adsorption effect of clay minerals and organic matter in the soil result in the fixation of the majority of these substances, thereby influencing the distribution characteristics of the Changchun urban agglomeration. Our results indicate that industrial enterprises, as significant sources of mercury emissions, exert a substantial influence on the spatial distribution of mercury. Areas with elevated soil mercury concentrations are predominantly located in urban centers and county (district) regions, with concentrations decreasing as the distance from these urban and county (district) centers increases. This spatial pattern highlights the critical role of anthropogenic activities in shaping mercury distribution, particularly in densely populated and industrialized areas.
The acceleration of urbanization has resulted in the majority of the population being concentrated in urban and county (district) centers. Solid waste refuse, including thermometers, batteries, and discarded electronic products generated by human activity contains certain amounts of mercury [37]. This results in a higher soil mercury content in central urban areas and counties, where the population is relatively concentrated, than in townships and villages. The road traffic network in Changchun Municipal District is well developed, with a significantly higher density than that observed in counties, townships, and villages. Higer traffic flow contributes significantly to heavy metal accumulation in road dust, primarily through exhaust emissions and mechanical abrasion of vehicle components (e.g., tires and brakes). Some studies have shown that the mercury content of urban road dust is higher than that of the villages [58], which is a contributing factor to the observed differences in soil mercury content at different spatial scales. In addition, at this stage, heating methods are mostly based on clean energy. However, the Changchun urban agglomeration has a long history of coal heating, and there are some heating methods such as loose coal burning. The mercury in the coal drifts with the soot particles and is deposited in the nearby soil, resulting in higher levels of soil mercury content in densely populated areas.

4.2. Atmospheric Mercury Shows Significant Differences in Different Spatial Scales

Atmospheric mercury concentrations in different areas of the Changchun urban agglomeration were significantly higher than the global background values of atmospheric mercury concentrations (1.3–1.7 ng/m3 [25]). Changchun Municipal District exhibited higher average atmospheric mercury concentrations than Lanzhou City (4.48 ng/m3 [59]), Chongqing City (6.74 ng/m3 [60]), and Shanghai City (7.79 ng/m3 [61]). This high-concentration mercury pollution may enter the surface ecosystem through dry and wet sedimentation, form methylmercury bioaccumulation in the soil–water system, and finally, threaten the health of residents through the food chain. In contrast, Nongan County, Dehui City, Jiutai District, Gongzhuling City, and Shuangyang District demonstrated lower atmospheric mercury concentrations compared to Chongqing City and Shanghai City.
In the Changchun urban agglomeration, the three-season average atmospheric mercury concentration at 100 cm was higher than that at 0 cm. This is mainly attributed to the rapid construction and development of the Changchun urban agglomeration in recent years, which strengthened the urban heat island effect and enhanced vertical air convection [62,63]. It has been shown that the urban heat island circulation is a weak mesospheric circulation, and wind is an important factor affecting the diffusion of pollutants, so the urban heat island circulation is extremely important for the spread of pollutants in the city and surrounding areas [64], and observations and simulations by several scholars have pointed out that the heat island circulation will cause pollutants to converge in the city and its downwind places. The study of Ye [65] showed that the heat island circulation causes the ground-level pollutant concentration in the city to always be larger than that in the suburbs, and the maximum ground-level concentration distance from the source in the city is shortened compared with that in the suburbs.
The seasonal variations of atmospheric mercury exhibit significant regional differences, influenced by geographical environment, emission sources, and meteorological factors [66]. In this study, vertical heterogeneity in seasonal atmospheric mercury patterns was observed within the Changchun urban agglomeration. At 0 cm, concentrations ranked as summer > spring > autumn, whereas at 100 cm, concentrations ranked as summer > autumn > spring. The prevalence of summer peaks is consistent with observations in Ulsan [67], Qingdao [68], and other cities (e.g., Beijing [69] and Shanghai [70]). Key drivers for this pattern may include temperature. In the Changchun urban agglomeration, spring temperatures are low and the release of soil mercury due to temperature increase is limited, while high temperatures and increased radiation intensity in summer are more favorable for soil mercury release. Song et al. [71] suggested that the highest temperatures in the summer are favorable for soil mercury release, and the highest values of concentrations may occur. Previous studies have identified temperature as a very important factor influencing the mechanism of gaseous mercury release, and have also indicated that temperature is one of the most sensitive variables affecting the distribution of mercury over most environmental surfaces [72]. An increase in temperature favors the re-release of gaseous mercury in the environment. Rosa et al. [73] obtained a positive correlation between total gaseous mercury (TGM) and temperature for the areas of Mexico with less anthropogenic impacts. Zhang Yanyan et al. [61] showed a positive correlation between the atmospheric mercury concentration and the temperature in their study of the Shanghai area. Atmospheric mercury mainly comes from anthropogenic emissions and secondary releases from soil, water bodies, and plants. Except for emissions from anthropogenic sources, which are not affected by temperature, the release of mercury from soils, water bodies, and plants is closely related to meteorological parameters. The reduction process of mercury in soil mainly includes photoreduction, thermal reduction, and microbial reductions, and the increase in temperature can accelerate the rate of these reduction reactions, leading to the release of mercury from the soil into the atmosphere. Another key driver is external contribution to atmospheric mercury. Studies have demonstrated that atmospheric mercury concentration variability is closely associated with the origin and transport pathways of externally derived polluted air masses [74]. The elevated atmospheric mercury concentrations observed in the Changchun urban agglomeration during summer may originate from external sources. Specifically, the influx of mercury-enriched air masses from the surrounding regions could be a primary driver of this seasonal increase. In contrast, Guangzhou showed a different seasonal trend, with atmospheric mercury concentrations ranked as spring > winter >autumn > summer. This opposite trend is mainly related to monsoons, variations in the boundary layer, and oxidation [75].
Atmospheric mercury concentrations are higher in Changchun Municipal District than in counties, townships, and villages due to anthropogenic sources, urban surfaces (soil, pavement and building surfaces, and mainly legacy emissions), indoor mercury-containing products [76], and air mass transport [77,78]. Studies have shown that atmospheric mercury levels are generally lower in rural areas than in urban areas [70,79,80], highlighting the role of anthropogenic activities in the atmospheric mercury cycle [79,81]. Similar urban > rural patterns are also obtained in the atmospheric mercury levels in Nguyen Van Cu, Vietnam (2.49 ng/m3—urban) compared with Can Gio, Ho Chi Minh City (1.76 ng/m3—rural) [72].

4.3. Analysis of the Mechanisms by Which Environmental Factors Significantly Influence Mercury Concentration

The organic matter content is an important factor in determining the soil mercury concentration, and the level of organic matter content strongly influences the migration and accumulation in the soil. It is generally accepted that the higher the humus content in the soil, the stronger the ability of the soil to adsorb mercury. Other studies have shown that a 1% increase in organic matter in soil can increase the fixation rate of mercury by 30%. This is mainly due to the ability of organic matter to absorb and complexate with mercury, thereby elevating the mercury concentration in the soil [82].
Meteorological conditions are considered to be the main driver of atmospheric mercury seasonality [83]. Frequent rainfall and strong winds can remove atmospheric mercury through vertical wet deposition and horizontal atmospheric transport, respectively [84]. In addition, factors such as solar radiation, surface winds, and temperature can influence the natural release of mercury from soils [85]. The results of this study show that the negative correlation between atmospheric mercury concentration and humidity occurs mostly in summer and autumn. During the sampling period, the humidity in summer and autumn was higher than that in spring, which shows that when the atmospheric humidity is higher, its effect on atmospheric mercury is more significant. The study of Qingdao by Zhang [68] showed that the atmospheric mercury concentration was significantly negatively correlated with the humidity in winter and summer, and a very weak negative correlation during spring and autumn. Additionally, the atmospheric relative humidity during winter and summer was significantly higher than that in spring and autumn.
Studies have shown that wind speed is negatively correlated with atmospheric mercury concentration [86,87]. Higher wind speed facilitates the diffusion of atmospheric pollutants, reducing the atmospheric mercury concentration. Conversely, lower wind speed is not conducive to atmospheric flow, leading to pollutant accumulation in localities [88]. In the three seasons of Changchun Municipal District, wind speed is highest in spring and lowest in summer, while the concentration of atmospheric mercury at the 100 cm level is highest in summer and lowest in spring. In addition, it was observed that there were both positive and negative correlations between wind speed and atmospheric mercury concentration at different heights in each administrative district of the Changchun urban agglomeration. The positive correlation can be attributed to the fact that certain wind speeds and directions result in the transport of mercury-containing air masses, which affects the atmospheric mercury concentration. For example, in the autumn of Changchun Municipal District, the autumn of Nongan county, and the summer of Dehui city, there was an increase in wind speed and an increase in atmospheric mercury content, suggesting that the area was affected by atmospheric mercury transport.

5. Conclusions

Soil mercury in the Changchun urban agglomeration exhibits distinct spatiotemporal variation, with seasonal peaks in spring and autumn, and a core to periphery spatial gradient (central city > county > township/village) driven by anthropogenic and natural inputs. Soil mercury accumulation is positively linked to organic matter content, confirmed by structural equation modeling. Atmospheric mercury displays concentration correlating with temperature, humidity, and wind speed; SEM further reveals that meteorological factors significantly enhance near-surface atmospheric mercury, while spatial scaling inversely suppresses concentrations. Spatial autocorrelation analysis highlights scale-dependent aggregation; soil mercury clustering intensity follows central city > county > village > township (Moran’s I), whereas atmospheric mercury exhibits reverse patterns (township > village > county > central city). These findings emphasize that anthropogenic activities, ecological drivers (organic matter), and climatic variables significantly influence the distribution and transport of mercury in the atmosphere and soil. Based on these findings, we propose the following multi-scale management strategies to address the complexity of mercury pollution in urban agglomerations. At the urban agglomeration level, establish a regional mercury emission inventory and optimize industrial layout. At the city level, promote cleaner production technologies to control mercury emissions from industrial sources and build green infrastructure to intercept mercury deposition. At the community level, raise public awareness of environmental protection and promote the use of low-mercury products to achieve long-term control of mercury pollution in urban agglomerations. Future research should focus on the impacts of dynamic land use changes on mercury bioavailability and speciation in soil–water systems, which are essential for the development of risk-based remediation strategies. Furthermore, assessing long-term trends in mercury pollution using predictive modeling approaches will provide scientific support for adaptive environmental management.

Author Contributions

Conceptualization, Z.Z.; methodology, G.Z.; software, Z.Z.; validation, Z.Z.; formal analysis, J.Z. and H.Z.; investigation, Y.H. and Y.X.; resources, Z.W.; data curation, Z.Z.; writing—original draft preparation, Z.Z.; writing—review and editing, Z.Z., Z.W. and Z.L.; visualization, Z.L.; supervision, G.Z.; project administration, G.Z.; funding acquisition, Z.W. All authors have read and agreed to the published version of the manuscript.

Funding

This research was funded by Science and Technology Development Plan Project of Jilin Province, China (20240101067JC); the Science and Technology Research Project of Jilin Provincial Education Department (No. JJKH20231316KJ); the Major science and technology project of China Power Engineering Consulting Group Co., LTD (No. DG3-P01-2022); the Chinese National Natural Science Foundation of China (Grant No. 31230012, 31770520); the Fundamental Research Funds for the Central Universities (No. 134-135132028); and the Chinese Postdoctoral Science Foundation (2021M700496).

Data Availability Statement

The data presented in this study are available on request from the corresponding author.

Acknowledgments

We are grateful to the Key Laboratory of Vegetation ecology of the Ministry of Education for its help and support.

Conflicts of Interest

The authors declare no conflicts of interest.

References

  1. Gworek, B.; Dmuchowski, W.; Baczewska-Dąbrowska, A.H. Mercury in the Terrestrial Environment: A Review. Environ. Sci. Eur. 2020, 32, 128. [Google Scholar] [CrossRef]
  2. Lyman, S.N.; Cheng, I.; Gratz, L.E.; Weiss-Penzias, P.; Zhang, L. An Updated Review of Atmospheric Mercury. Sci. Total Environ. 2020, 707, 135575. [Google Scholar] [CrossRef] [PubMed]
  3. Yang, L.; Zhang, Y.; Wang, F.; Luo, Z.; Guo, S.; Strähle, U. Toxicity of Mercury: Molecular Evidence. Chemosphere 2020, 245, 125586. [Google Scholar] [CrossRef] [PubMed]
  4. Si, L.; Ariya, P. Recent Advances in Atmospheric Chemistry of Mercury. Atmosphere 2018, 9, 76. [Google Scholar] [CrossRef]
  5. Griggs, T.; Liu, L.; Talbot, R.W.; Torres, A.; Lan, X. Comparison of Atmospheric Mercury Speciation at a Coastal and an Urban Site in Southeastern Texas, USA. Atmosphere 2020, 11, 73. [Google Scholar] [CrossRef]
  6. Lin, Y.; Vogt, R.; Larssen, T. Environmental Mercury in China: A Review. Environ. Toxicol. Chem. 2012, 31, 2431–2444. [Google Scholar] [CrossRef] [PubMed]
  7. Acquavita, A.; Brandolin, D.; Cattaruzza, C.; Felluga, A.; Maddaleni, P.; Meloni, C.; Pasquon, M.; Predonzani, S.; Poli, L.; Skert, N.; et al. Mercury Distribution and Speciation in Historically Contaminated Soils of the Isonzo River Plain (NE Italy). J. Soils Sediments 2022, 22, 79–92. [Google Scholar] [CrossRef]
  8. Morton-Bermea, O.; Schiavo, B.; Salgado-Martínez, E.; Almorín-Ávila, M.A.; Hernández-Álvarez, E. Gaseous Elemental Mercury (GEM) in the Mexico City Metropolitan Area. Bull. Environ. Contam. Toxicol. 2021, 107, 514–518. [Google Scholar] [CrossRef]
  9. Duan, L.; Wang, X.; Wang, D.; Duan, Y.; Cheng, N.; Xiu, G. Atmospheric Mercury Speciation in Shanghai, China. Sci. Total Environ. 2017, 578, 460–468. [Google Scholar] [CrossRef]
  10. Zhao, L.; Xu, L.; Wu, X.; Zhao, G.; Jiao, L.; Chen, J.; Hong, Y.; Deng, J.; Chen, Y.; Yang, K.; et al. Characteristics and Sources of Mercury in Precipitation Collected at the Urban, Suburban and Rural Sites in a City of Southeast China. Atmospheric Res. 2018, 211, 21–29. [Google Scholar] [CrossRef]
  11. Zhou, Z.; Tang, Z.; Wang, H.; Liu, K.; Wang, Y.; Xiao, X.; Yin, Y.; Liu, G.; Cai, Y.; Li, Y. Spatial and Temporal Variations in the Pollution Status and Sources of Mercury in the Jiaozhou Bay. Environ. Pollut. 2024, 346, 123554. [Google Scholar] [CrossRef]
  12. Li, X.; Cheng, H.; Zhao, C.; Xu, X. Mercury Contamination in the Topsoil and Subsoil of Urban Areas of Beijing, China. Bull. Environ. Contam. Toxicol. 2010, 85, 224–228. [Google Scholar] [CrossRef] [PubMed]
  13. Zhang, M.; Zhang, X.; Qin, P.; Ni, H.; Zeng, H. Spatial distribution of mercury contents in surface soil in Shenzhen City. China Environ. Sci. 2010, 30, 1645–1649. (In Chinese) [Google Scholar]
  14. Qiu, G.; Feng, X.; Wang, F.; Fu, X. Preliminary Investigation of Soil Mercury Pollution in Wanshan Mercury Mining Area, Guizhou Province. Bull. Miner. Rock. Geochem. 2006, 25, 34–36. [Google Scholar] [CrossRef]
  15. Wang, X.; Yuan, W.; Lin, C.-J.; Zhang, L.; Zhang, H.; Feng, X. Climate and Vegetation As Primary Drivers for Global Mercury Storage in Surface Soil. Environ. Sci. Technol. 2019, 53, 10665–10675. [Google Scholar] [CrossRef] [PubMed]
  16. Zhao, L.; Meng, B.; Feng, X. Mercury Methylation in Rice Paddy and Accumulation in Rice Plant: A Review. Ecotoxicol. Environ. Saf. 2020, 195, 110462. [Google Scholar] [CrossRef]
  17. Zhang, H.; Feng, X.; Larssen, T.; Qiu, G.; Vogt, R.D. In Inland China, Rice, Rather than Fish, Is the Major Pathway for Methylmercury Exposure. Environ. Health Perspect. 2010, 118, 1183–1188. [Google Scholar] [CrossRef]
  18. Song, Z.; Wang, C.; Ding, L.; Chen, M.; Hu, Y.; Li, P.; Zhang, L.; Feng, X. Soil Mercury Pollution Caused by Typical Anthropogenic Sources in China: Evidence from Stable Mercury Isotope Measurement and Receptor Model Analysis. J. Clean. Prod. 2021, 288, 125687. [Google Scholar] [CrossRef]
  19. Li, P.; Feng, X.; Chan, H.-M.; Zhang, X.; Du, B. Human Body Burden and Dietary Methylmercury Intake: The Relationship in a Rice-Consuming Population. Environ. Sci. Technol. 2015, 49, 9682–9689. [Google Scholar] [CrossRef]
  20. Rawat, B.; Yin, X.; Sharma, C.M.; Tripathee, L.; Truong, M.T.; Tiwari, P.; Kandel, K.; Kang, S.; Zhang, Q. Total Gaseous Mercury in Kathmandu, a South Asian Metropolis: Temporal Variations, Sources Apportionment and Health Risk Assessment. J. Hazard. Mater. 2025, 483, 136644. [Google Scholar] [CrossRef]
  21. Fu, X.W.; Zhang, H.; Yu, B.; Wang, X.; Lin, C.-J.; Feng, X.B. Observations of Atmospheric Mercury in China: A Critical Review. Atmospheric Chem. Phys. 2015, 15, 9455–9476. [Google Scholar] [CrossRef]
  22. Liu, M.; Chen, L.; Tao, J.; Xu, Z.; Zhu, L.; Qian, D.; Fan, R. Seasonal and Diurnal Variation of Total Gaseous Mercury in Guangzhou City. China Environ. Sci. 2012, 32, 1554–1558. (In Chinese) [Google Scholar]
  23. Fu, X.; Feng, X. Variations of Atmospheric Total Gaseous Mercury Concentrations for the Sampling Campaigns of 2001/2002 and 2009/2010 and Implications of Changes in Regional Emissions of Atmospheric Mercury. Bull. Mineral. Geochem. 2015, 34, 242–249. [Google Scholar] [CrossRef]
  24. Liu, S.; Nadim, F.; Perkins, C.; Carley, R.J.; Hoag, G.E.; Lin, Y.; Chen, L. Atmospheric Mercury Monitoring Survey in Beijing, China. Chemosphere 2002, 48, 97–107. [Google Scholar] [CrossRef]
  25. Driscoll, C.T.; Mason, R.P.; Chan, H.M.; Jacob, D.J.; Pirrone, N. Mercury as a Global Pollutant: Sources, Pathways, and Effects. Environ. Sci. Technol. 2013, 47, 4967–4983. [Google Scholar] [CrossRef]
  26. Rothenberg, S.E.; McKee, L.; Gilbreath, A.; Yee, D.; Connor, M.; Fu, X. Evidence for Short-Range Transport of Atmospheric Mercury to a Rural, Inland Site. Atmos. Environ. 2010, 44, 1263–1273. [Google Scholar] [CrossRef]
  27. Brooks, S.; Ren, X.; Cohen, M.; Luke, W.; Kelley, P.; Artz, R.; Hynes, A.; Landing, W.; Martos, B. Airborne Vertical Profiling of Mercury Speciation near Tullahoma, TN, USA. Atmosphere 2014, 5, 557–574. [Google Scholar] [CrossRef]
  28. Chen, B.; Li, J.S.; Chen, G.Q.; Wei, W.D.; Yang, Q.; Yao, M.T.; Shao, J.A.; Zhou, M.; Xia, X.H.; Dong, K.Q.; et al. China’s Energy-Related Mercury Emissions: Characteristics, Impact of Trade and Mitigation Policies. J. Clean. Prod. 2017, 141, 1259–1266. [Google Scholar] [CrossRef]
  29. Wu, Z.; Ye, H.; Shan, Y.; Chen, B.; Li, J. A City-Level Inventory for Atmospheric Mercury Emissions from Coal Combustion in China. Atmos. Environ. 2020, 223, 117245. [Google Scholar] [CrossRef]
  30. Wang, S.; Feng, X.; Qiu, G.; Wei, Z.; Xiao, T. Mercury Emission to Atmosphere from Lanmuchang Hg–Tl Mining Area, Southwestern Guizhou, China. Atmos. Environ. 2005, 39, 7459–7473. [Google Scholar] [CrossRef]
  31. Zhang, Y.; Zhang, S.; Gong, Y. The Association between Carbon Emission and Urban Spatial Form—A Study of Zhuhai, China. Land 2023, 12, 720. [Google Scholar] [CrossRef]
  32. Cao, W.; Dong, L.; Cheng, Y.; Wu, L.; Guo, Q.; Liu, Y. Constructing Multi-Level Urban Clusters Based on Population Distributions and Interactions. Comput. Environ. Urban Syst. 2023, 99, 101897. [Google Scholar] [CrossRef]
  33. Liu, F.; Cheng, H.; Yang, K.; Zhao, C.; Liu, Y.; Peng, M.; Li, K. Characteristics and Influencing Factors of Mercury Exchange Flux between Soil and Air in Guangzhou City. J. Geochem. Explor. 2014, 139, 115–121. [Google Scholar] [CrossRef]
  34. Shao, L.; Wang, Y.; Liu, X.; Liu, R.; Han, K.; Zhang, Y. Temporal Variation of Gaseous Elemental Mercury in a Northern Coastal City in China: Monsoon and COVID-19 Lockdown Effects. Atmospheric Pollut. Res. 2022, 13, 101436. [Google Scholar] [CrossRef]
  35. Sarkar, A.; Deb, S.; Ghosh, S.; Mandal, S.; Quazi, S.A.; Kushwaha, A.; Hoque, A.; Choudhury, A. Impact of Anthropogenic Pollution on Soil Properties in and around a Town in Eastern India. Geoderma Reg. 2022, 28, e00462. [Google Scholar] [CrossRef]
  36. Pan, L.; Ma, J.; Hu, Y.; Su, B.; Fang, G.; Wang, Y.; Wang, Z.; Wang, L.; Xiang, B. Assessments of Levels, Potential Ecological Risk, and Human Health Risk of Heavy Metals in the Soils from a Typical County in Shanxi Province, China. Environ. Sci. Pollut. Res. 2016, 23, 19330–19340. [Google Scholar] [CrossRef]
  37. Wang, Z.; Wang, L.; Xiao, T.; Yu, T.; Li, X.; Tang, Z.; Zhang, G. Pollution Characteristics and Risk Assessments of Mercury in the Soil of the Main Urban Regions in a Typical Chinese Industrial City: Changchun. Pol. J. Environ. Stud. 2021, 30, 3829–3841. [Google Scholar] [CrossRef]
  38. DZ/T 0295-2016; Specification of Land Quality Geochemical Assessment. Ministry of Land and Resources of the People’s Republic of China: Beijing, China, 2016.
  39. Liu, N. Quantifying Mercury Distribution and Source Contribution in Surface Soil of Qinghai-Tibetan Plateau Using Mercury Isotopes. Master’s Thesis, Southwest University, Chongqing, China, 2023. [Google Scholar]
  40. Sun, J.; Chen, M.; Xiao, J.; Xu, G.; Zhang, H.; Zhang, G.; Yang, F.; Zhao, C.; Guo, L. Exploring the Spatial Distribution Characteristics of Urban Soil Heavy Metals in Different Levels of Urbanization. Agronomy 2025, 15, 418. [Google Scholar] [CrossRef]
  41. Zhu, Y.; Zhang, Y.; Liu, M.; Chen, L.; He, Q.; Ye, Z.; Sun, J. Distribution and pollution assessment of the mercury in soils of Tibet. Ecol. Environ. Sci. 2014, 23, 1487–1491. [Google Scholar] [CrossRef]
  42. Dong, R.; Jia, Z.; Li, S.; Fu, X.; Yang, X.; Tan, Q.; Ming, L.; Lin, T.; Lin, C.; Li, X.; et al. Risk Assessment and Sources Identification of Soil Heavy Metals in a Typical County of Chongqing Municipality, Southwest China. Process Saf. Environ. Prot. 2018, 113, 275–281. [Google Scholar] [CrossRef]
  43. Shi, J.; Meng, M.; Shao, J.; Zhang, K.; Zhang, Q.; Jiang, G. Spatial Distribution of Mercury in Topsoil from Five Regions of China. Environ. Sci. Pollut. Res. 2013, 20, 1756–1761. [Google Scholar] [CrossRef] [PubMed]
  44. Han, P.; Wang, J.; Feng, X.; Ma, Z.; Lu, A.; Wei, L.; Yan, L. Ecological Risk Assessment of Heavy Metals in Soils in Shunyi, Beijing. J. Agro-Environ. Sci. 2015, 34, 103–109. [Google Scholar] [CrossRef]
  45. Huang, S.; Wu, X.; Yan, Z.; Jin, Y.; Bi, K.; Wen, Z. Heavy Metal Content and Spatial Distribution Characteristics of Urban Soils in Nanjing. Urban Environ. Urban Ecol. 2007, 20, 1–4. (In Chinese) [Google Scholar]
  46. Yi, W.; Lu, Y.; Li, J.; Chen, C.; Zhang, C.; Dong, F. Distribution characteristics and pollution assessment of mercury in urban soils of Guangzhou. Chin. J. Soil Sci. 2009, 40, 1185–1188. [Google Scholar] [CrossRef]
  47. Zhang, P.; Hu, L.; Gao, B.; Gao, F.; Zhu, X.; Li, Y.; Yao, H. Spatial–Temporal Variation and Source Analysis of Heavy Metals in Different Land Use Types in Beilun District (2015 and 2022). Sci. Rep. 2024, 14, 15127. [Google Scholar] [CrossRef] [PubMed]
  48. Dong, L.; Zhang, Z.; Zhang, T. Progress in research on the current status of mercury contamination in the soil environment and its influencing factors. Earth Environ. 2022, 50, 397–414+319. [Google Scholar] [CrossRef]
  49. Liu, R.; Liu, S.; Wang, J.; Wang, Y.; Cui, X.; Zhang, Y. Change of mercury and methylmercury in Yellow River Delta wetlands from autumn to summer. Acta Sci. Circumstantiae 2017, 37, 272–279. [Google Scholar] [CrossRef]
  50. Gustin, M.S.; Lindberg, S.E.; Austin, K.; Coolbaugh, M.; Vette, A.; Zhang, H.; Fu, X.; Yang, X.; Tan, Q.; Ming, L.; et al. Assessing the Contribution of Natural Sources to Regional Atmospheric Mercury Budgets. Sci. Total Environ. 2000, 259, 61–71. [Google Scholar] [CrossRef]
  51. Du, B. Field Measurement of Soil Mercury Emission Flux in Forest. Master’s Thesis, Tsinghua University, Beijing, China, 2015. [Google Scholar]
  52. Gustin, M.S.; Biester, H.; Kim, C.S. Investigation of the Light-Enhanced Emission of Mercury from Naturally Enriched Substrates. Atmos. Environ. 2002, 36, 3241–3254. [Google Scholar] [CrossRef]
  53. Zhu, J. Characteristics of Mercury Exchange at the Soil/Water-Gas Interface in Agricultural Fields in the Hilly Areas of Eastern Sichuan Province. Master’s Thesis, Southwest University, Chongqing, China, 2009. [Google Scholar]
  54. Liu, F.; Cheng, H.; Yang, K.; Zhao, C.; Peng, M.; Li, K.; Liu, Y. Exchange flux of mercury on soil/air interface in black soils of Heilongjiang. Earth Sci. Front. 2015, 22, 402–410. [Google Scholar] [CrossRef]
  55. Izaditame, F.; LeMonte, J.J.; Siebecker, M.G.; Yu, X.; Fischel, M.; Tappero, R.; Sparks, D.L. Sea−level Rise and Arsenic−rich Soils: A Toxic Relationship. J. Hazard. Mater. 2024, 472, 134528. [Google Scholar] [CrossRef] [PubMed]
  56. Zhang, X.; Zha, T.; Guo, X.; Meng, G.; Zhou, J. Spatial Distribution of Metal Pollution of Soils of Chinese Provincial Capital Cities. Sci. Total Environ. 2018, 643, 1502–1513. [Google Scholar] [CrossRef]
  57. Zu, J. The Evolution and Reconstruction of Industrial Space in Changchun Metropolitan Area. Ph.D. Thesis, Northeast normal university, Changchun, China, 2017. [Google Scholar]
  58. Yu, X.; Li, F.; Fu, G.; Feng, H.; Xiong, F. The Spatial-Temporal Distribution Characteristics and Contamination Assessments of Heavy Metals in the Road Dusts of Beijing. Geoscience 2019, 33, 169–175. [Google Scholar] [CrossRef]
  59. Yin, X.; Zhou, W.; Kang, S.; de Foy, B.; Yu, Y.; Xie, J.; Sun, S.; Wu, K.; Zhang, Q. Latest Observations of Total Gaseous Mercury in a Megacity (Lanzhou) in Northwest China. Sci. Total Environ. 2020, 720, 137494. [Google Scholar] [CrossRef] [PubMed]
  60. Yang, Y.; Chen, H.; Wang, D. Spatial and Temporal Distribution of Gaseous Elemental Mercury in Chongqing, China. Environ. Monit. Assess. 2009, 156, 479–489. [Google Scholar] [CrossRef]
  61. Zhang, Y.; Xiu, G.; Zhang, D.; Zhang, M.; Zhang, R. Total Gaseous Mercury in Ambient Air of Shanghai:Its Seasonal Variation in Relation to Meteorological Condition. Environ. Sci. Technol. 2012, 35, 155–158+205. (In Chinese) [Google Scholar]
  62. Zhou, B.; Rybski, D.; Kropp, J.P. The Role of City Size and Urban Form in the Surface Urban Heat Island. Sci. Rep. 2017, 7, 4791. [Google Scholar] [CrossRef]
  63. Feng, Z.; Wang, S.; Jin, S.; Yang, J. Influence of Urban Form and Wind Environment on Surface Temperature in Changchun City. Acta Geofraphica Sin. 2019, 74, 902–911. [Google Scholar] [CrossRef]
  64. Zhu, L.; Miao, J. Progress of Urban Heat Island Circulation in China. Meteorol. Sci. Technol. 2019, 47, 52–61. [Google Scholar] [CrossRef]
  65. Ye, Z. Influence of Chimney Height and Night-Time Urban Heat Island Effect on Pollutant Transport and Dispersion. Environ. Sci. 1986, 2, 11–17. [Google Scholar] [CrossRef]
  66. Nguyen, L.S.P.; Pham, T.D.H.; Truong, M.T.; Tran, A.N. Characteristics of Total Gaseous Mercury at a Tropical Megacity in Vietnam and Influence of Tropical Cyclones. Atmospheric Pollut. Res. 2023, 14, 101813. [Google Scholar] [CrossRef]
  67. Cho, I.-G.; Lee, H.; Kwon, S.Y.; Jo, M.-J.; Hwang, D.-W.; Lim, J.-H.; Choi, S.-D. Isotopic Fractionation of Gaseous Mercury in a Large Industrial City: Spatio-Temporal Variations and Source Apportionment. J. Hazard. Mater. 2025, 487, 137162. [Google Scholar] [CrossRef]
  68. Zhang, Y. Research on Distribution Characteristics and Source of Atmospheric Mercury in Qingdao. Master’s Thesis, Ocean University of China, Qingdao, China, 2015. [Google Scholar]
  69. Zhang, L.; Wang, S.X.; Wang, L.; Hao, J.M. Atmospheric Mercury Concentration and Chemical Speciation at a Rural Site in Beijing, China: Implications of Mercury Emission Sources. Atmospheric Chem. Phys. 2013, 13, 10505–10516. [Google Scholar] [CrossRef]
  70. Fu, X.; Liu, C.; Zhang, H.; Xu, Y.; Zhang, H.; Li, J.; Lyu, X.; Zhang, G.; Guo, H.; Wang, X.; et al. Isotopic Compositions of Atmospheric Total Gaseous Mercury in 10 Chinese Cities and Implications for Land Surface Emissions. Atmospheric Chem. Phys. 2021, 21, 6721–6734. [Google Scholar] [CrossRef]
  71. Song, X.; Cheng, I.; Lu, J. Annual Atmospheric Mercury Species in Downtown Toronto, Canada. J. Environ. Monit. 2009, 11, 660–669. [Google Scholar] [CrossRef]
  72. Li, J. Variation of atmospheric mercury and estimating the mercury exposure dose in residential area of city, China-Sweden. Ph.D. Thesis, Southwest University, Chongqing, China, 2007. [Google Scholar]
  73. de la Rosa, D.A.; Volke-Sepúlveda, T.; Solórzano, G.; Green, C.; Tordon, R.; Beauchamp, S. Survey of Atmospheric Total Gaseous Mercury in Mexico. Atmos. Environ. 2004, 38, 4839–4846. [Google Scholar] [CrossRef]
  74. Phu Nguyen, L.S.; Zhang, L.; Lin, D.-W.; Lin, N.-H.; Sheu, G.-R. Eight-Year Dry Deposition of Atmospheric Mercury to a Tropical High Mountain Background Site Downwind of the East Asian Continent. Environ. Pollut. 2019, 255, 113128. [Google Scholar] [CrossRef]
  75. Chen, L.; Liu, M.; Xu, Z.; Fan, R.; Tao, J.; Chen, D.; Zhang, D.; Xie, D.; Sun, J. Variation Trends and Influencing Factors of Total Gaseous Mercury in the Pearl River Delta—A Highly Industrialised Region in South China Influenced by Seasonal Monsoons. Atmos. Environ. 2013, 77, 757–766. [Google Scholar] [CrossRef]
  76. Feng, X.; Wang, S.; Qiu, G.; Hou, Y.; Tang, S. Total Gaseous Mercury Emissions from Soil in Guiyang, Guizhou, China. J. Geophys. Res. Atmospheres 2005, 110, D14306. [Google Scholar] [CrossRef]
  77. Tang, Y.; Wang, S.; Wu, Q.; Liu, K.; Wang, L.; Li, S.; Gao, W.; Zhang, L.; Zheng, H.; Li, Z.; et al. Recent Decrease Trend of Atmospheric Mercury Concentrations in East China: The Influence of Anthropogenic Emissions. Atmospheric Chem. Phys. 2018, 18, 8279–8291. [Google Scholar] [CrossRef]
  78. Nguyen, L.S.P.; Sheu, G.-R.; Lin, D.-W.; Lin, N.-H. Temporal Changes in Atmospheric Mercury Concentrations at a Background Mountain Site Downwind of the East Asia Continent in 2006–2016. Sci. Total Environ. 2019, 686, 1049–1056. [Google Scholar] [CrossRef] [PubMed]
  79. Mao, H.; Cheng, I.; Zhang, L. Current Understanding of the Driving Mechanisms for Spatiotemporal Variations of Atmospheric Speciated Mercury: A Review. Atmospheric Chem. Phys. 2016, 16, 12897–12924. [Google Scholar] [CrossRef]
  80. Fu, X.; Yang, X.; Tan, Q.; Lin, T.; Lin, C.; Li, X.; Feng, X. Isotopic Composition of Gaseous Elemental Mercury in the Marine Boundary Layer of East China Sea. J. Geophys. Res. Atmos. 2018, 123, 7656–7669. [Google Scholar] [CrossRef]
  81. Kumari, A.; Kumar, B.; Manzoor, S.; Kulshrestha, U. Status of Atmospheric Mercury Research in South Asia: A Review. Aerosol Air Qual. Res. 2015, 15, 1092–1109. [Google Scholar] [CrossRef]
  82. Su, J.; Cheng, J.; Wang, W. Analysis on the current situation and causes of soil mercury pollution in Lanzhou. Energy Environ. 2006, 1, 69–72. (In Chinese) [Google Scholar]
  83. Xu, Z.; Chen, L.; Zhang, Y.; Han, G.; Chen, Q.; Chu, Z.; Zhang, Y.; Li, C.; Yang, Y.; Wang, X. Meteorological Drivers of Atmospheric Mercury Seasonality in the Temperate Northern Hemisphere. Geophys. Res. Lett. 2022, 49, e2022GL100120. [Google Scholar] [CrossRef]
  84. Koenig, A.M.; Magand, O.; Laj, P.; Andrade, M.; Moreno, I.; Velarde, F.; Salvatierra, G.; Gutierrez, R.; Blacutt, L.; Aliaga, D.; et al. Seasonal Patterns of Atmospheric Mercury in Tropical South America as Inferred by a Continuous Total Gaseous Mercury Record at Chacaltaya Station (5240 m) in Bolivia. Atmospheric Chem. Phys. 2021, 21, 3447–3472. [Google Scholar] [CrossRef]
  85. Naccarato, A. Sea Surface Temperature Variation Linked to Elemental Mercury Concentrations Measured on Mauna Loa. Geophys. Res. Lett. 2016, 43, 7751–7757. [Google Scholar] [CrossRef]
  86. Wang, C.; Wang, Z.; Zhang, X. Speciated Atmospheric Mercury during Haze and Non-Haze Periods in Winter at an Urban Site in Beijing, China: Pollution Characteristics, Sources, and Causes Analyses. Atmospheric Res. 2021, 247, 105209. [Google Scholar] [CrossRef]
  87. Vardè, M.; Barbante, C.; Barbaro, E.; Becherini, F.; Bonasoni, P.; Busetto, M.; Calzolari, F.; Cozzi, G.; Cristofanelli, P.; Dallo, F.; et al. Characterization of Atmospheric Total Gaseous Mercury at a Remote High-Elevation Site (Col Margherita Observatory, 2543 m a.s.l.) in the Italian Alps. Atmos. Environ. 2022, 271, 118917. [Google Scholar] [CrossRef]
  88. Du, G. Characteristics and Sources of Atmospheric Mercury in Typical Urban Area of Yunnan Province. Master’s Thesis, Kunming University of Science & Technology, Kunming, China, 2020. [Google Scholar]
Figure 1. Map of the study area.
Land 14 00652 g001
Figure 2. Soil mercury concentrations in administrative districts of Changchun urban agglomeration (a) spring; (b) summer; (c) autumn; (d) seasonal variations. Different letters (a, b, c) indicate significant differences between groups (one-way ANOVA, p < 0.05). * indicates significant correlation at the 0.05 level (two-sided).
Land 14 00652 g002
Figure 3. Spatial distribution of soil mercury in Changchun urban agglomeration (a) spring; (b) summer; (c) autumn; (d) average.
Land 14 00652 g003
Figure 4. Soil mercury content in central city, counties, townships, and villages (a) spring; (b) summer; (c) autumn; (d) average.
Land 14 00652 g004
Figure 5. Moran’s I scatter plots of soil mercury in the study area at different scales. (a) central city; (b) county; (c) township; (d) village. Each point represents the standardized mercury content of a sampling point and its spatial lag value. The line represents the fitted regression line, the slope of which is the Moran’s I coefficient.
Land 14 00652 g005
Figure 6. Spatial clustering maps of soil mercury in the study area at different scales.
Land 14 00652 g006
Figure 7. Atmospheric mercury concentration at 0 cm in Changchun urban agglomeration (a) spring; (b) summer; (c) autumn; (d) seasonal variations. Different letters (a, b, c) indicate significant differences between groups (one-way ANOVA, p < 0.05). * indicates significant correlation at the 0.05 level (two-sided).
Land 14 00652 g007
Figure 8. Atmospheric mercury concentration at 100 cm in Changchun urban agglomeration (a) spring; (b) summer; (c) autumn; (d) seasonal variations. Different letters (a, b, c) indicate significant differences between groups (one-way ANOVA, p < 0.05). * indicates significant correlation at the 0.05 level (two-sided).
Land 14 00652 g008
Figure 9. Atmospheric mercury concentration at 0 cm in Changchun urban agglomeration (a) spring; (b) summer; (c) autumn; (d) average.
Land 14 00652 g009
Figure 10. Atmospheric mercury concentration at 100 cm in Changchun urban agglomeration (a) Spring; (b) Summer; (c) Autumn; (d) Average.
Land 14 00652 g010aLand 14 00652 g010b
Figure 11. Atmospheric mercury concentrations at 0 cm in central city, counties, townships, and villages (a) spring; (b) summer; (c) autumn; (d) average.
Land 14 00652 g011aLand 14 00652 g011b
Figure 12. Atmospheric mercury concentrations at 100 cm in central city, counties, townships, and villages. (a) spring; (b) summer; (c) autumn; (d) average.
Land 14 00652 g012
Figure 13. Moran’s I scatter plots of atmospheric mercury at 0 cm in the study area at different scales. (a) central city; (b) county; (c) township; (d) village. Each point represents the standardized mercury content of a sampling point and its spatial lag value. The line represents the fitted regression line, the slope of which is the Moran’s I coefficient.
Land 14 00652 g013aLand 14 00652 g013b
Figure 14. Moran’s I scatter plots of atmospheric mercury at 100 cm in the study area at different scales. (a) central city; (b) county; (c) township; (d) village. Each point represents the standardized mercury content of a sampling point and its spatial lag value. The line represents the fitted regression line, the slope of which is the Moran’s I coefficient.
Land 14 00652 g014
Figure 15. Spatial clustering maps of atmospheric mercury in the study area at different scales. (a) atmospheric mercury concentrations at 0 cm; (b) atmospheric mercury concentrations at 100 cm.
Land 14 00652 g015
Figure 16. Structural equation modelling to explain the spatial distribution of mercury. The presence of solid arrows and numbers indicates a significant direct effect at the 95% statistical confidence level, the presence of dashed arrows indicates a non-significant effect at the 95% statistical confidence level. Orange arrows: negative path coefficients; Blue arrows: positive path coefficients. Values next to the arrows are path coefficients with associated statistical significance (“***”, p < 0.001; “**”, p < 0.01; “*”, 0.01 < p < 0.05).
Land 14 00652 g016
Table 1. Seasonal soil mercury concentrations in Changchun urban agglomeration (µg/kg).
Study AreaSeasonSoil Mercury Concentration (µg/kg)RangeCV
Changchun urban agglomerationSpring53.4 ± 60.26.5–684.81.13
Summer37.7 ± 42.04.0–493.31.12
Autumn48.2 ± 54.46.9–535.31.13
Average46.2 ± 39.59.7–353.50.86
Table 2. Atmospheric mercury concentration at 0 cm and 100 cm in Changchun urban agglomeration (ng/m3).
Study AreaSpringSummerAutumn
AverageRangeCVAverageRangeCVAverageRangeCV
Atmospheric mercury concentration at 0 cmChangchun MunicipalDistrict8.26 ± 3.731.08–25.000.4511.62 ± 2.843.00–18.380.246.05 ± 1.321.76–9.000.22
Nongan County4.49 ± 1.651.13–8.830.377.04 ± 1.983.84–14.000.284.33 ± 1.411.17–7.110.33
Dehui City5.61 ± 1.611.00–9.090.296.00 ± 1.951.25–10.780.324.58 ± 1.451.29–8.230.32
Jiutai District4.47 ± 1.221.15–7.440.276.43 ± 2.731.13–18.270.424.40 ± 1.291.18–6.890.29
Gongzhuling City4.48 ± 1.541.17–8.780.345.12 ± 1.941.28–12.330.384.78 ± 1.671.29–10.720.35
Shuangyang District3.83 ± 1.381.14–6.280.364.92 ± 1.461.68–8.180.304.25 ± 1.981.03–11.720.47
Atmospheric mercury concentration at 100 cmChangchun MunicipalDistrict7.75 ± 2.642.14–23.890.34 12.12 ± 2.46 3.77–18.220.207.82 ± 1.91 2.12–12.680.24
Nongan County5.16 ± 1.241.46–8.830.248.56 ± 3.32 1.38–21.990.39 4.62 ± 1.79 1.02–8.560.39
Dehui City5.46 ± 1.251.18–9.220.23 6.82 ± 2.35 1.15–13.060.34 5.37 ± 2.23 1.28–12.170.42
Jiutai District5.11 ± 1.101.14–6.670.21 7.25 ± 3.49 1.50–20.000.48 4.87 ± 1.89 1.28–9.330.39
Gongzhuling City4.51 ± 1.411.22–8.910.31 6.19 ± 2.30 1.22–13.560.37 5.59 ± 2.39 1.21–11.390.43
Shuangyang District3.89 ± 1.311.18–6.170.34 5.81 ± 2.31 1.89–12.220.40 5.17 ± 2.91 1.00–16.670.56
Table 3. Correlation analysis of soil pH and organic matter content with soil mercury content in the study area.
Study AreaSpringSummerAutumn
pHOMpHOMpHOM
Content (g/kg)Correlation CoefficientContent (g/kg)Correlation CoefficientContent (g/kg)Correlation Coefficient
Changchun Municipal District8.232.980.491 **8.434.180.472 **8.231.980.221 *
Nongan County7.831.750.464 **8.629.260.523 **8.230.500.475 **
Dehui City7.528.870.549 **8.130.930.507 **7.932.650.492 **
Jiutai District7.031.360.632 **7.130.130.553 **7.332.470.581 **
Gongzhuling City7.733.340.565 **8.633.580.423 **8.131.210.371 **
Shuangyang District8.030.980.501 **8.131.160.599 **8.329.420.698 **
* indicates significant correlation at the 0.05 level (two-sided), ** indicates significant correlation at the 0.01 level (two-sided).
Table 4. Correlation coefficients between seasonal meteorological parameters and atmospheric mercury concentrations at 0 cm and 100 cm in Changchun urban agglomeration.
Study AreaSeason0 cm100 cm
Wind SpeedAir PressureTemperatureHumidityWind SpeedAir PressureTemperatureHumidity
Changchun MunicipalDistrictSpring--0.293 **-−0.193 *-0.235 **-
Summer--0.335 **−0.283 **--0.380 **−0.394 **
Autumn0.228 *-0.203 **-0.224 *-0.390 **-
Nongan CountySpring--0.344 **--−0.352 *0.381 **-
Summer-0.300 *0.466 **---0.497 **−0.431 **
Autumn0.278 *-0.235 **-0.382 *-0.446 **-
Dehui CitySpring--0.345 *---0.292 *-
Summer0.336 *-0.320 *−0.345 *0.322 *-0.359 *−0.317 *
Autumn--0.319 *−0.527 **--0.320 *−0.447 **
Jiutai DistrictSpring--0.232 **---0.423 **−0.281 *
Summer--0.290 **---0.355 **−0.447 **
Autumn--0.262 **-−0.282 *-0.309 *−0.445 **
Gongzhuling CitySpring--0.310 *---0.405 **-
Summer-−0.344 *0.425 **−0.341 *-−0.308 *0.419 **−0.339 *
Autumn--0.327 *-−0.267 *-0.369 **-
Shuangyang DistrictSpring--0.322 **---0.476 **-
Summer--0.373 *---0.423 **−0.419 **
Autumn−0.522 **-0.485 **-−0.580 **-0.471 **-
* indicates significant correlation at the 0.05 level (two-sided), ** indicates significant correlation at the 0.01 level (two-sided).
Disclaimer/Publisher’s Note: The statements, opinions and data contained in all publications are solely those of the individual author(s) and contributor(s) and not of MDPI and/or the editor(s). MDPI and/or the editor(s) disclaim responsibility for any injury to people or property resulting from any ideas, methods, instructions or products referred to in the content.

