Article

Central Place Theory Based on Mobile Signal Data: The Case of Urban Parks in Beijing and Changsha

by
Ning Wen
1,2,
Hang Yin
3,4,*,
Zhanhong Ma
1,2,
Jiajie Peng
1,2,
Kai Tang
1,2,
Deyi Yao
1,2,
Guangxin Xiang
1,2,
Liyan Xu
3,
Junyan Ye
3,4 and
Hongbin Yu
3
1
Hunan Planning Institute of Land and Resources, Changsha 410119, China
2
Hunan Key Laboratory of Land Resources Evaluation and Utilization, Changsha 410119, China
3
College of Architecture and Landscape Architecture, Peking University, Beijing 100871, China
4
College of Urban and Environmental Sciences, Peking University, Beijing 100871, China
*
Author to whom correspondence should be addressed.
Land 2025, 14(4), 673; https://doi.org/10.3390/land14040673
Submission received: 22 February 2025 / Revised: 16 March 2025 / Accepted: 20 March 2025 / Published: 22 March 2025

Abstract

:
The Central Place Theory (CPT) proposed the basic concepts of central places and their service areas. Urban parks provide a wide variety of ecosystem services to residents. Most studies on central places focus on urban commercial facilities; however, it remains unclear whether parks exhibit patterns of central places, what features their service areas, and hierarchical structures. Based on mobile signaling data, we identified the service areas, dominant influence areas, and hierarchical structures of Beijing and Changsha. We also analyzed the factors influencing the hierarchical structure of park services, as well as the number of visitors and dominant service areas at each level of parks. We found that visits by residents to parks in Beijing and Changsha exhibit a clear hierarchical structure. Parks that occupy the top level attract a large number of residents and demonstrate strong service capacity and extensive coverage. We also found that park area and infrastructure attributes are significantly correlated with the hierarchical outcomes in Changsha but entirely different results in Beijing. Box plot analysis of visitor numbers and service areas at each level reveals that the influencing factors for these two aspects differ. Overall, both cities’ parks exhibit centrality and hierarchical structures in providing services to residents; however, there is a considerable difference in the factors influencing visitor numbers and dominant service areas for the two cities. These conclusions provide important theoretical support for government officials to better understand the characteristics of park services and offer practical guidance for optimizing urban park planning, enhancing service efficiency, and formulating policies that promote equitable access to green spaces.

1. Introduction

The Central Place Theory (CPT) was proposed by German urban geographer W. Christaller and German economist A. Lösch in 1933 and 1940, respectively. It is one of the foundational theories for studying urban clusters and urbanization [1,2,3]. CPT explains the distribution and relative size of central places within a region. In the conception of CPT, the hierarchy of central places is typically determined by indicators such as regional gross domestic product, total retail sales of consumer goods, non-agricultural population, the proportion of the tertiary industry, population density, and the proportion of the workforce employed in service-oriented industries. The central place hierarchy is often used to describe the spatial range of goods or services consumption, with the k = 3 system forming its foundational part, known as the market principles. The transportation and administrative principles can be seen as supplements to the market principles. Although urban parks do not directly provide goods, they offer various ecosystem services. At the same time, these services are also subject to supply relationships and can be influenced by transportation principles.
As important spaces for providing leisure services to residents, urban parks enrich green vegetation, facilities, and cultural heritage sites, thereby also providing multiple ecosystem services such as recreational services and air quality regulation [4,5,6]. In addition, urban parks play an irreplaceable role in promoting urban biodiversity, improving microclimates, and enhancing the value of urban landscapes [7,8,9]. Therefore, urban parks are crucial for improving the quality of life for residents. However, in China, urban park planning and development have long been overlooked in comprehensive urban development. Chinese cities, especially large cities, face issues such as insufficient per capita public green space, irrational park distribution, and imbalances between supply and demand when providing public services to residents [10]. The CPT emphasizes hierarchical structures and service areas, which are directly related to the equity and efficiency of urban parks in serving residents. Therefore, an in-depth analysis of the park’s service area and their CPT patterns are of great practical importance in understanding the rationality of the park’s spatial pattern for serving residents.
Whether for commercial centers or parks, the residential locations of visitors can be seen as the service areas that determine the centrality and hierarchy in Central Place Theory. Early research on park service areas can be categorized into two paradigms. One approach simulates park service areas based on accessibility, focusing on the geographic perspective and using methods such as cost distance to delineate service areas [11,12]. This method overlooks stakeholders’ selectivity and can be regarded as a potential service area. The other approach uses empirical data to infer park service areas, offering a more objective reflection of actual service areas. Studies in this paradigm typically relied on survey data [13,14], but with the development of big data technologies, internet and mobile signaling data have become increasingly popular in this research [15,16,17]. Compared to traditional survey data, big data offers a clear advantage in terms of data volume. Currently, park service area analyses based on big data often focus on horizontal analyses [18,19], with less attention paid to the hierarchical structure of park services. Defining dominant parks through the hierarchy of service areas is of significant importance for urban managers, as it helps assess the rationality of park spatial patterns from the perspective of citizens.
Obtaining service areas and intensity is a fundamental step in analyzing CPT patterns. Mobile signaling data from urban park visitors provides an objective means to capture both aspects simultaneously. Based on this, our study focuses on two key research questions. First, how can mobile signaling data be used to delineate park service areas and intensities and further analyze the central place hierarchy of urban parks? Second, what are the key factors influencing the formation of this hierarchy? Additionally, we compare the differences between cities of different scales.

2. Materials and Methods
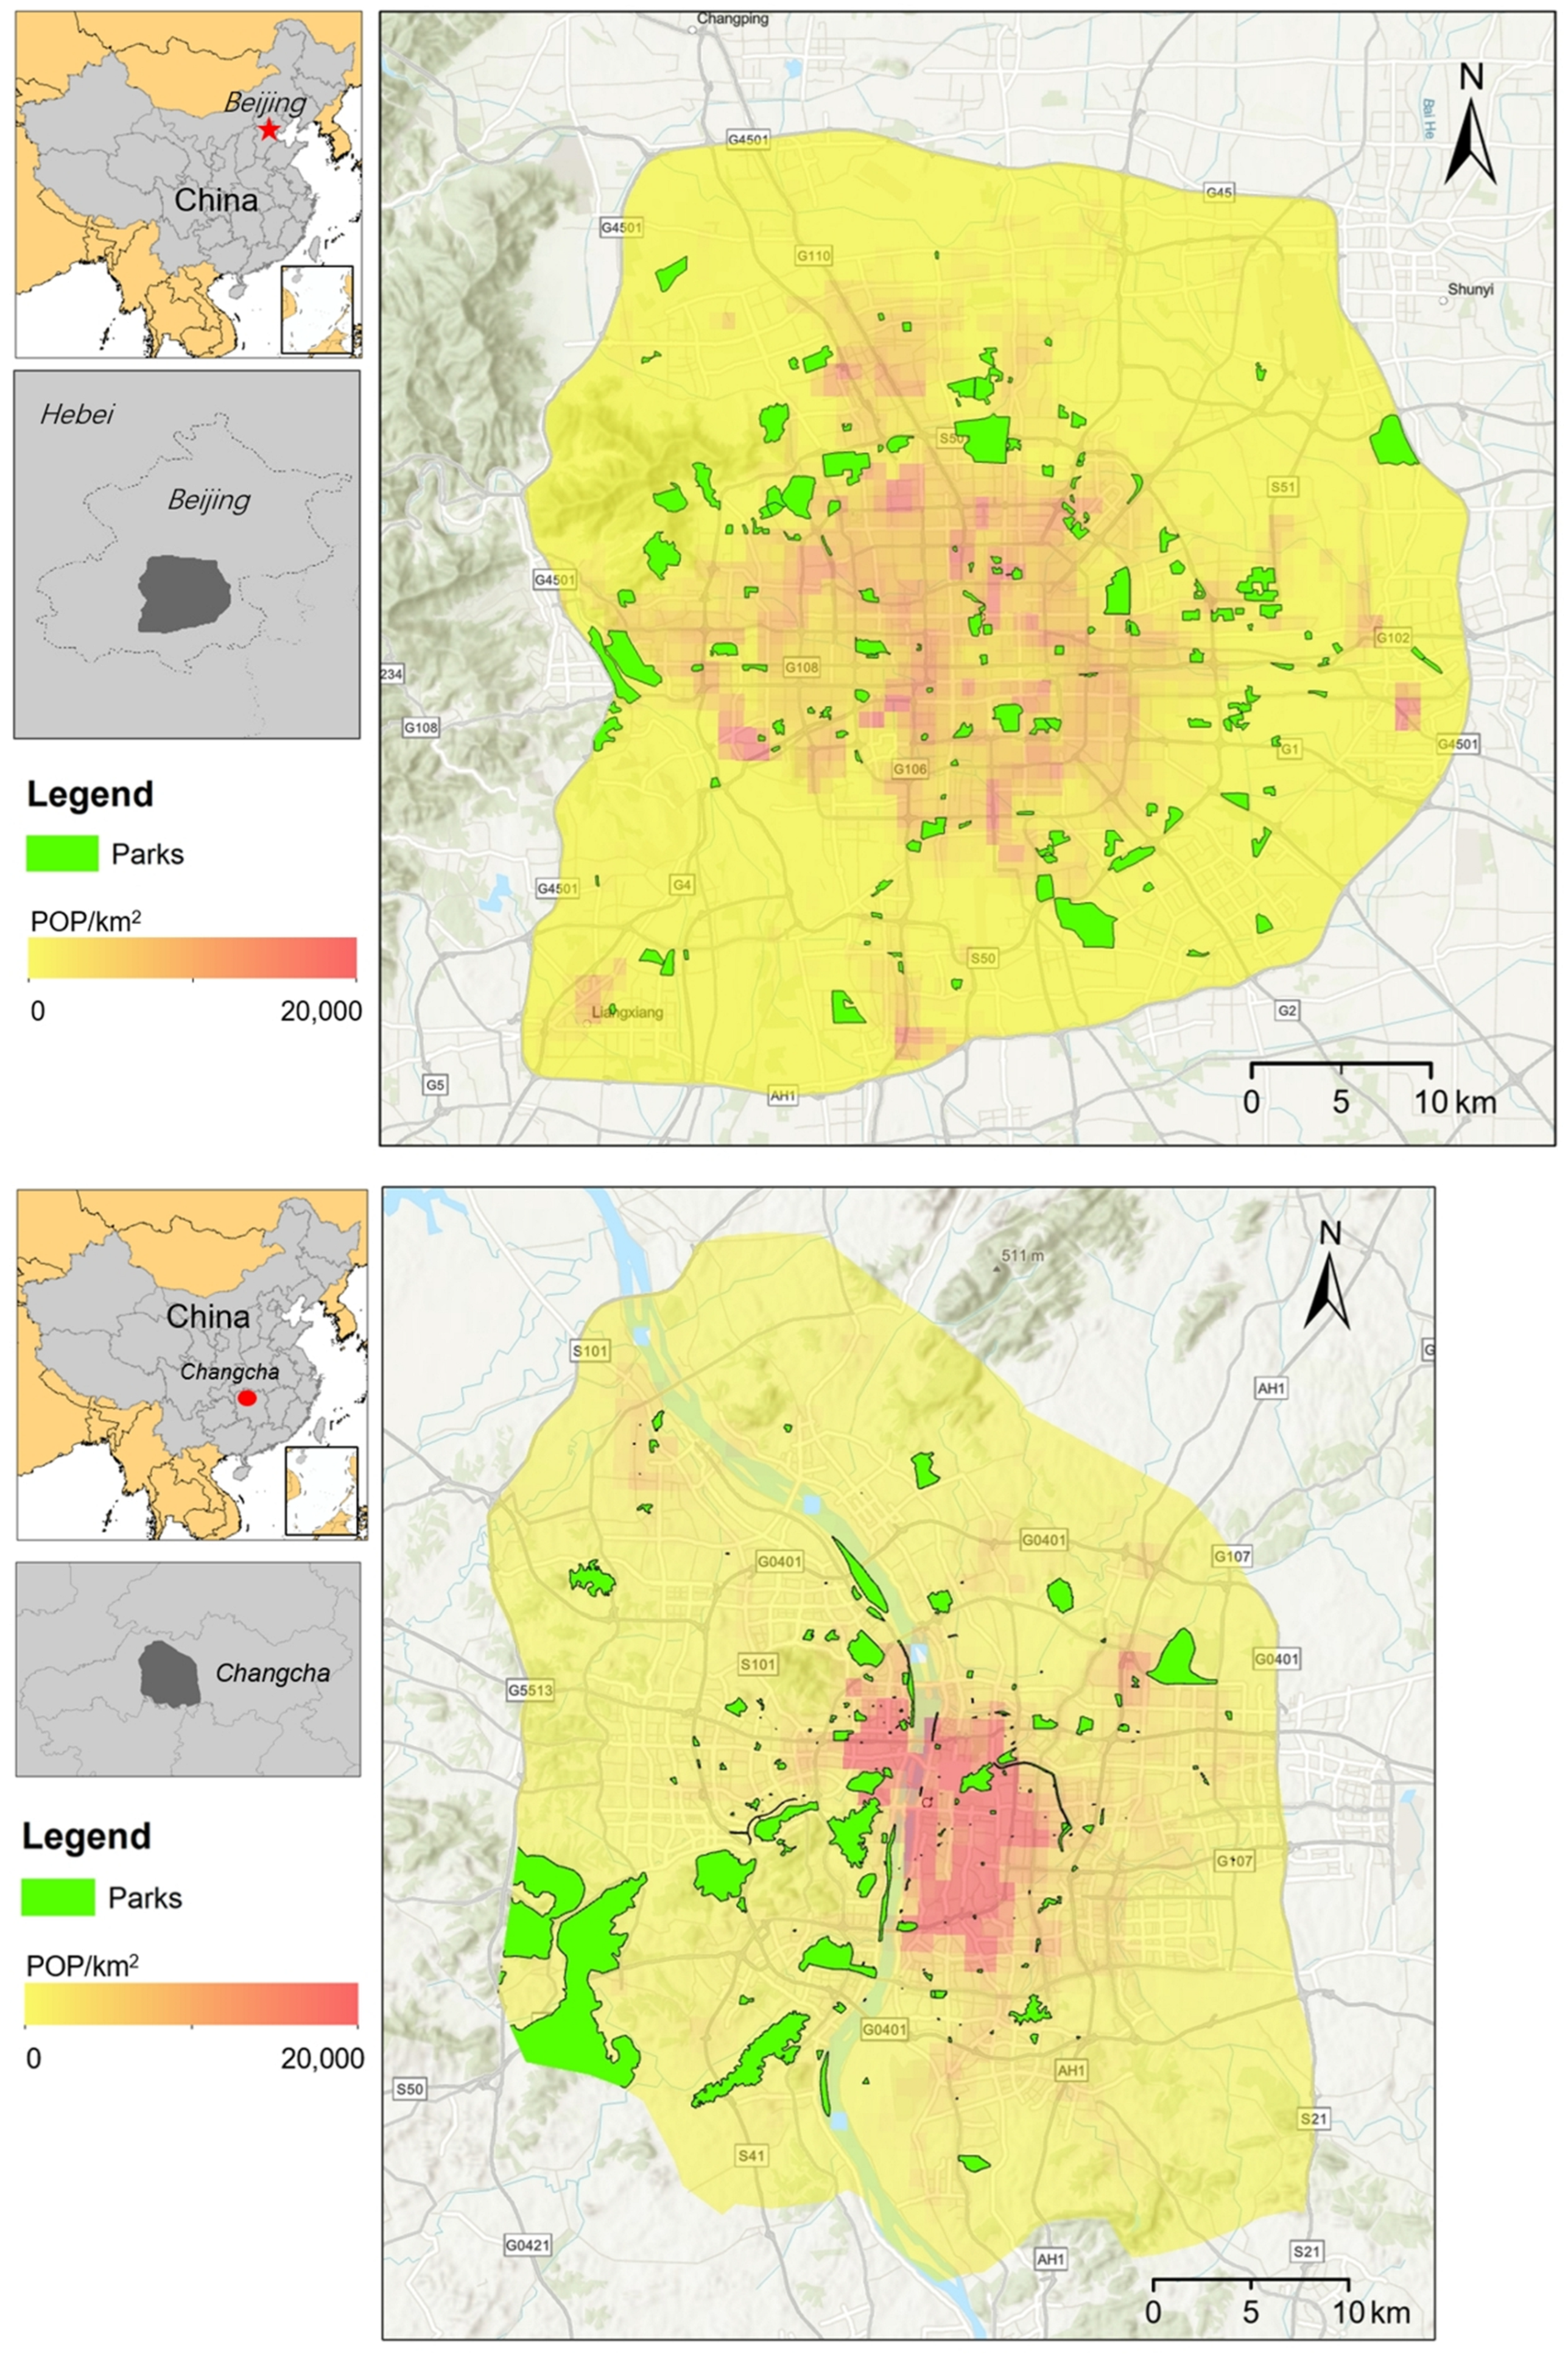
2.1. Study Area

As the capital of China, Beijing is classified as a megacity in terms of both population and built area. Its administrative region covers a total area of 16,410 km2, with a population of 21.86 million in 2023. Early urban planning in Beijing aimed to increase the number of ring roads surrounding the city center, along with the development of radial roads extending outward [20]. These ring roads have gradually evolved into what are now the Second to Seventh Ring Roads. The area within the Sixth Ring Road is densely populated and includes a large amount of land designated for construction [21,22,23]. Changsha, the capital of Hunan Province, is classified as a second-tier city in China. It covers a total administrative area of 11,819 square kilometers, with a population of 10.513 million in 2023. In its early stages of urban planning, Changsha emphasized a development strategy centered on the core urban area, gradually expanding outward through a transportation network. Similar to Beijing, Changsha optimized its urban traffic structure by constructing ring roads and radial roads. In the early planning stages, the city developed a “dual-bank development pattern” along the Xiang River as its central axis [24], connecting major urban areas and surrounding regions through ring roads. As the city expanded, Changsha’s ring road system was gradually refined, now forming a network of “First to Third Ring Roads” centered around the Ring Expressway. Within the Third Ring Road, the population and construction land are highly concentrated, particularly in core districts, which support a significant share of residential, commercial, and public service functions.
Apart from differences in urban development patterns, economic scale, and population size, Beijing and Changsha also differ in their park development strategies and geographic characteristics. Beijing prioritizes the development of a “Park City”, emphasizing the integration of ecology and urban life to create a livable environment. In addition to serving as spaces for recreation and leisure, Beijing’s parks also play essential roles in ecological conservation and cultural heritage preservation [25] and integrate natural landscapes and ecological green spaces to form the green framework of a modern mountain-water city, developing an urban green space system that combines riverfront and roadside green belts [26]. Furthermore, Beijing, a representative northern city, has a temperate monsoon climate, whereas Changsha, a southern city, experiences a subtropical monsoon climate with hot, humid summers and diverse park vegetation. These differences in climate, geography, and park landscapes provide a valuable comparative perspective on how CPT patterns align with urban parks. Specifically, we examined 143 parks in Beijing and 173 parks in Changsha as part of our research (Figure 1).

2.2. Mobile Signaling Data

As the location attributes of mobile signaling data are determined by signal towers, the positioning accuracy is 250 m. In this study, we used mobile signaling data obtained from China Unicom. A new grid was created by applying park boundaries (excluding a 250 m buffer zone) and a regular grid, mapping the signaling data onto the grid. Weighted centroids were then used to identify park visitors’ residential areas. Finally, the regular grid was utilized to determine their origin. Additionally, the mobile signaling data source had already filtered out non-local residents to avoid interference from out-of-town tourists. After excluding the effects of the pandemic and major events, we selected mobile signaling data from 17 to 23 June 2019 in Beijing and 6 to 12 November 2023 to reflect the activity patterns of city residents.

2.3. Park Service Areas

Based on the mobile signaling data, we identified the origin locations of park visitors. Since the original data consisted of vector point data, we used the point density analysis function in ArcGIS 10.3 to convert the point data into raster data, ultimately obtaining visitor source density data for each park. Figure 2 shows the mobile signaling hotspot map for the parks of Beijing and Changsha. This hotspot represents the sampled data of the residential locations of park visitors. The example mapping of Chaoyang Park and Martyrs’ Park indicates that the hotspot intensity gradually decreases from the park to the suburbs (Figure 2b,d). The highest hotspots for all parks are distributed in the southern and southeastern areas within the Fourth Ring Road (Figure 2a). This suggests that more residents in these areas get park services compared to other regions.
Since visitor density tends to approach zero in areas far from the parks, it is necessary to select a threshold to determine the service area of the parks. In this study, we chose 95% of the maximum park service density as the threshold for defining the park service area.
P g = a r g   m a x p K p x g , y g
D I A p = g G   |   P g = p
The service areas of different parks significantly overlap in space, meaning that residents in these areas can benefit from the services provided by multiple parks. To differentiate this service intensity, we defined “park service advantage areas”. For each analysis grid g , different residents within the grid K p x g , y g may choose to visit different parks. We defined the park visited by most residents within the grid P g as the dominant influence area (DIA). Based on this, we delineated the DIA for all parks and also delineated the service areas for each type of advantage park.

2.4. Analysis of Factors Influencing the Park Service Areas

The DIA of a park is influenced by multiple factors, among which we focused on parks’ intrinsic characteristics. The intrinsic characteristics of parks mainly include park area, lake area, infrastructure conditions, and vegetation coverage within the park. These features determine a park’s scale, landscape attributes, functional properties, and accessibility, making them key factors in attracting local residents. Given the diverse attributes and differences in data representation, all data were effectively structured (as shown in Table 1).
Since park service areas exhibit differences in both “vertical” and “horizontal” directions, we employed logistic regression and box plots to analyze the factors influencing parks’ DIA. The “vertical” spatial differences refer to the significant overlap in service areas of parks located close to each other, with one park typically dominating. This can be used to categorize parks. Logistic regression is a classic method for solving classification problems and can explicitly reflect the degree of correlation between various influencing factors. Therefore, this study applies the logistic regression method to evaluate the impact of different park characteristics on park hierarchy. The independent variables in the logistic regression model are the park attribute characteristics, while the dependent variable is the park’s classification level. For model evaluation, we used precision, recall, and F1-score to assess classification performance. These metrics provide a comprehensive evaluation of the model’s predictive capability, with F1-score balancing precision and recall. Additionally, we performed binary classification significance tests on category distinctions using p-values. This ensured that the classification was statistically meaningful and that the model effectively captured differences among park categories.
For parks of the same hierarchy, differences in their service areas can be considered the result of competition in the “horizontal” direction. We used box plots to better visualize the impact of each park characteristic on the advantage service area within each hierarchy.

3. Results

We completed the hierarchical classification of DIA for Beijing’s parks, the service intensity decay curves with distance, and the correlation analysis related to park characteristics.

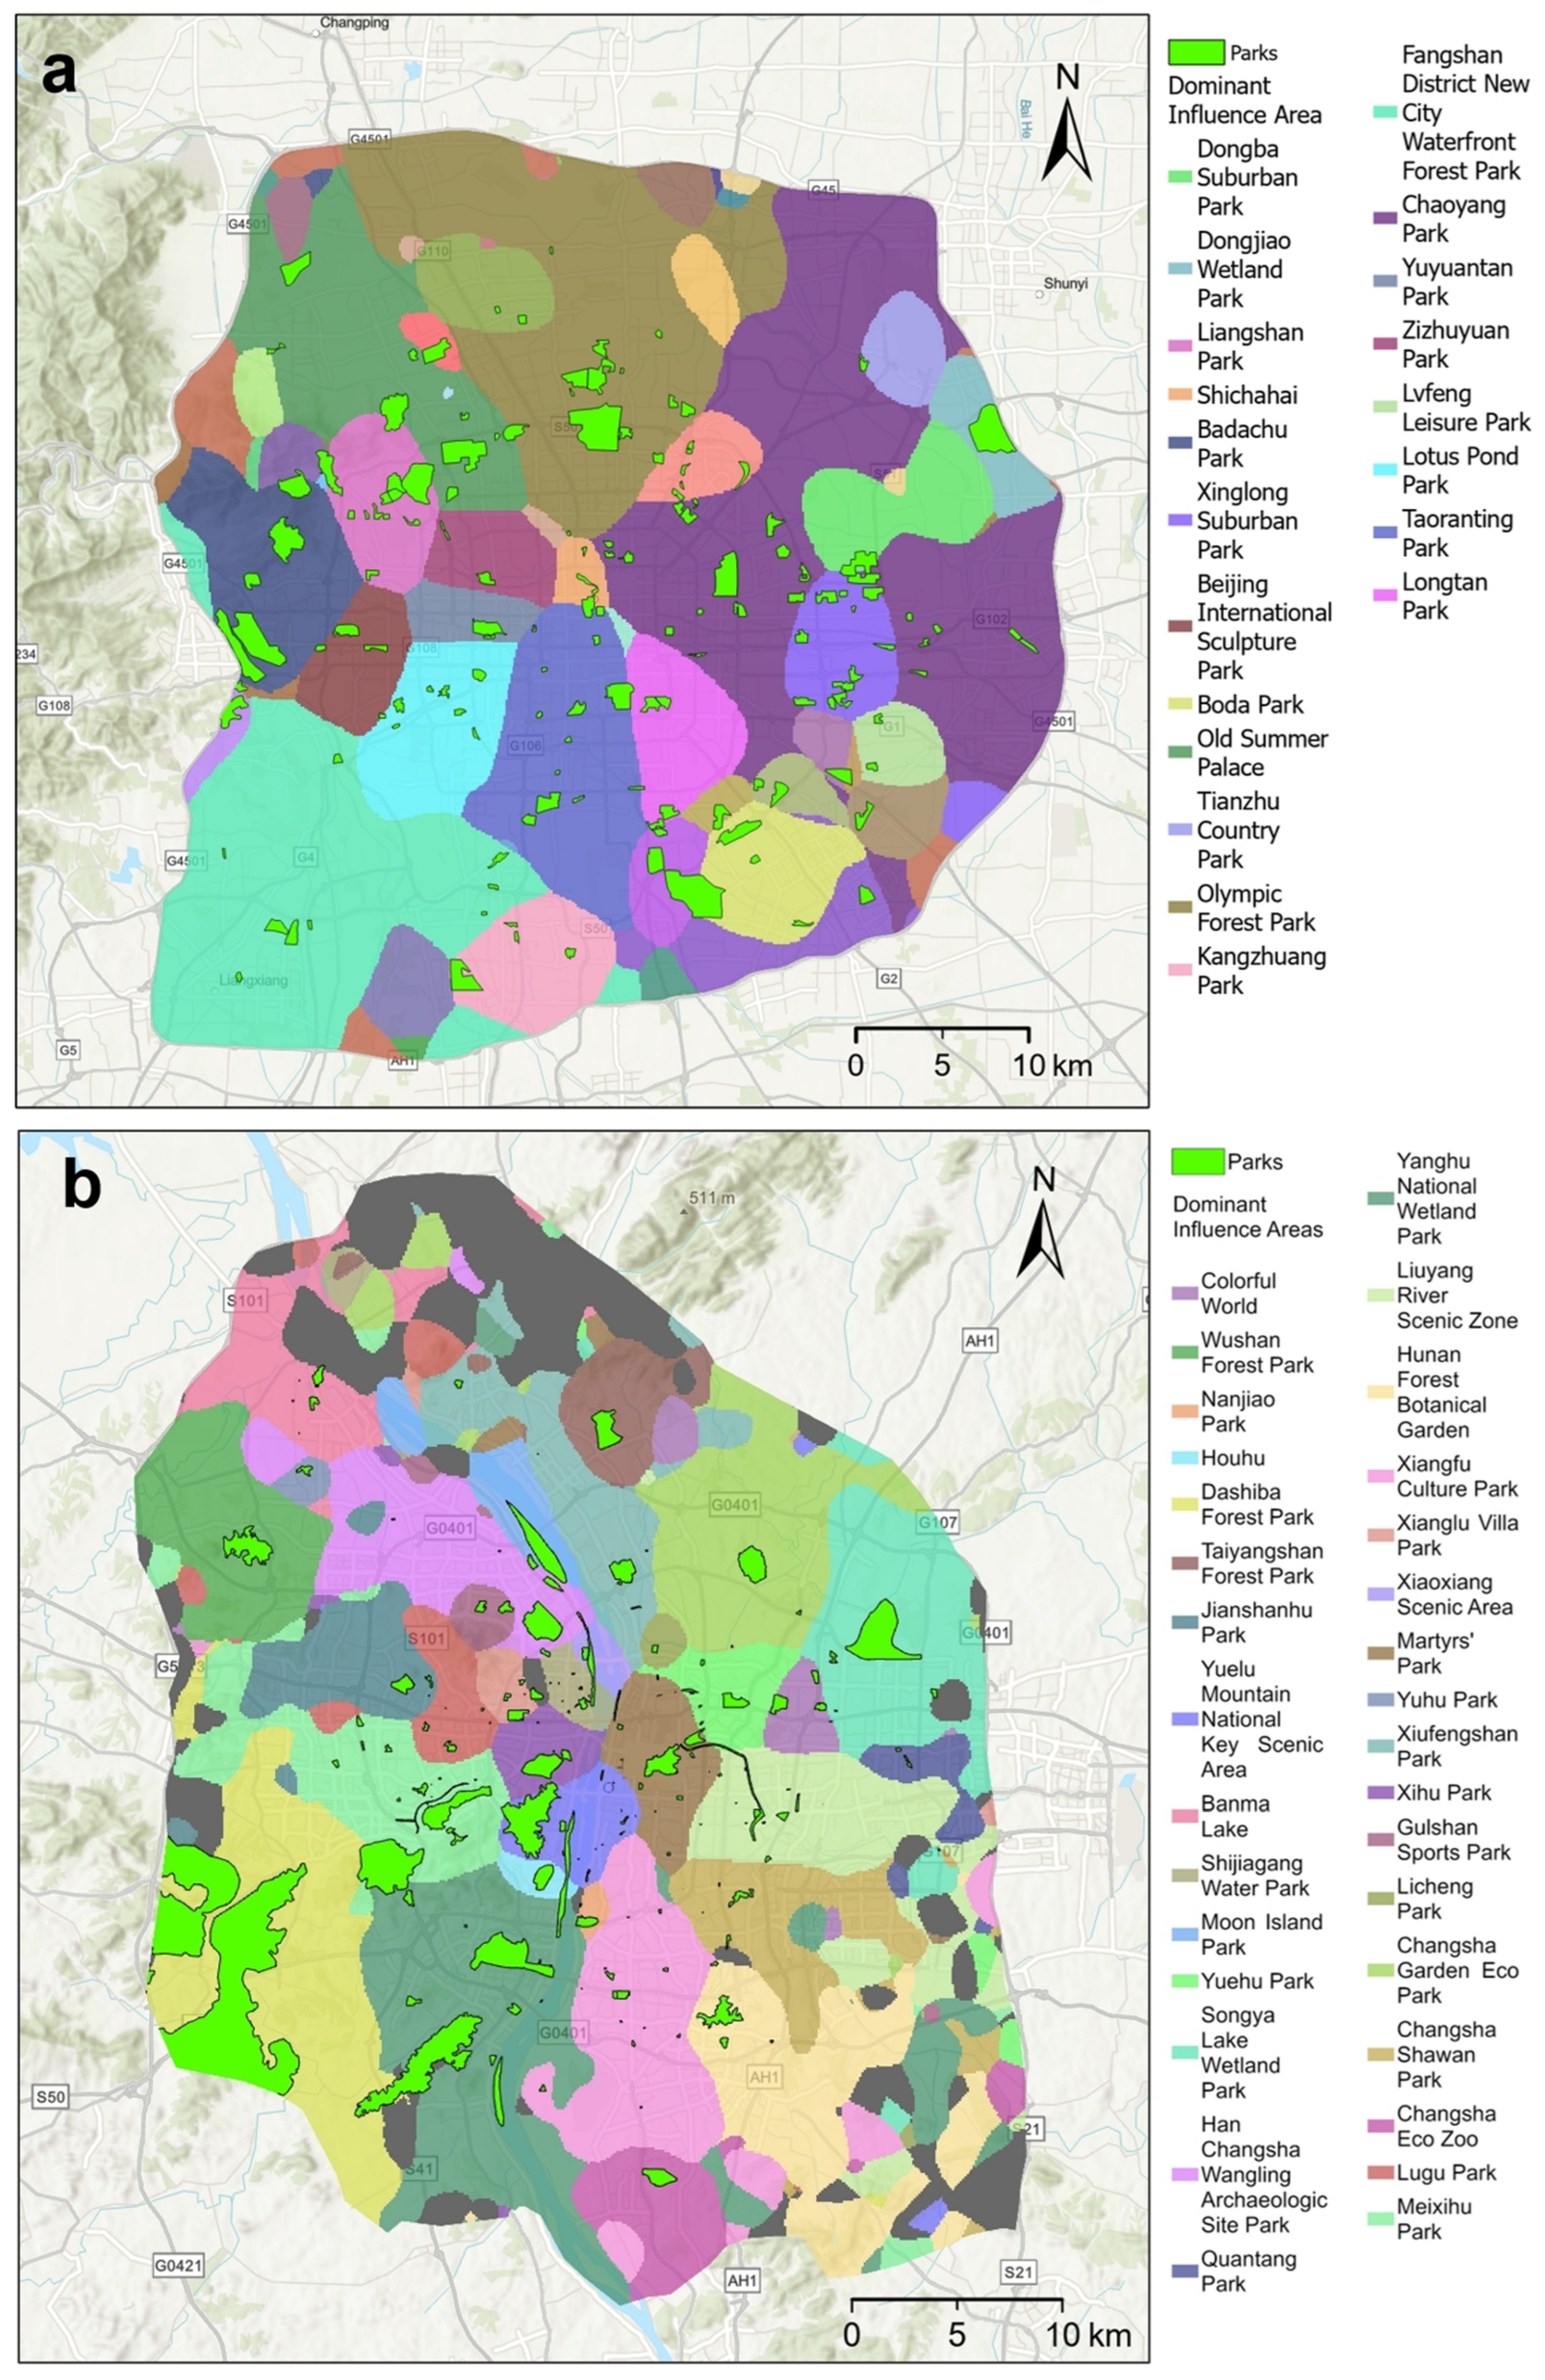
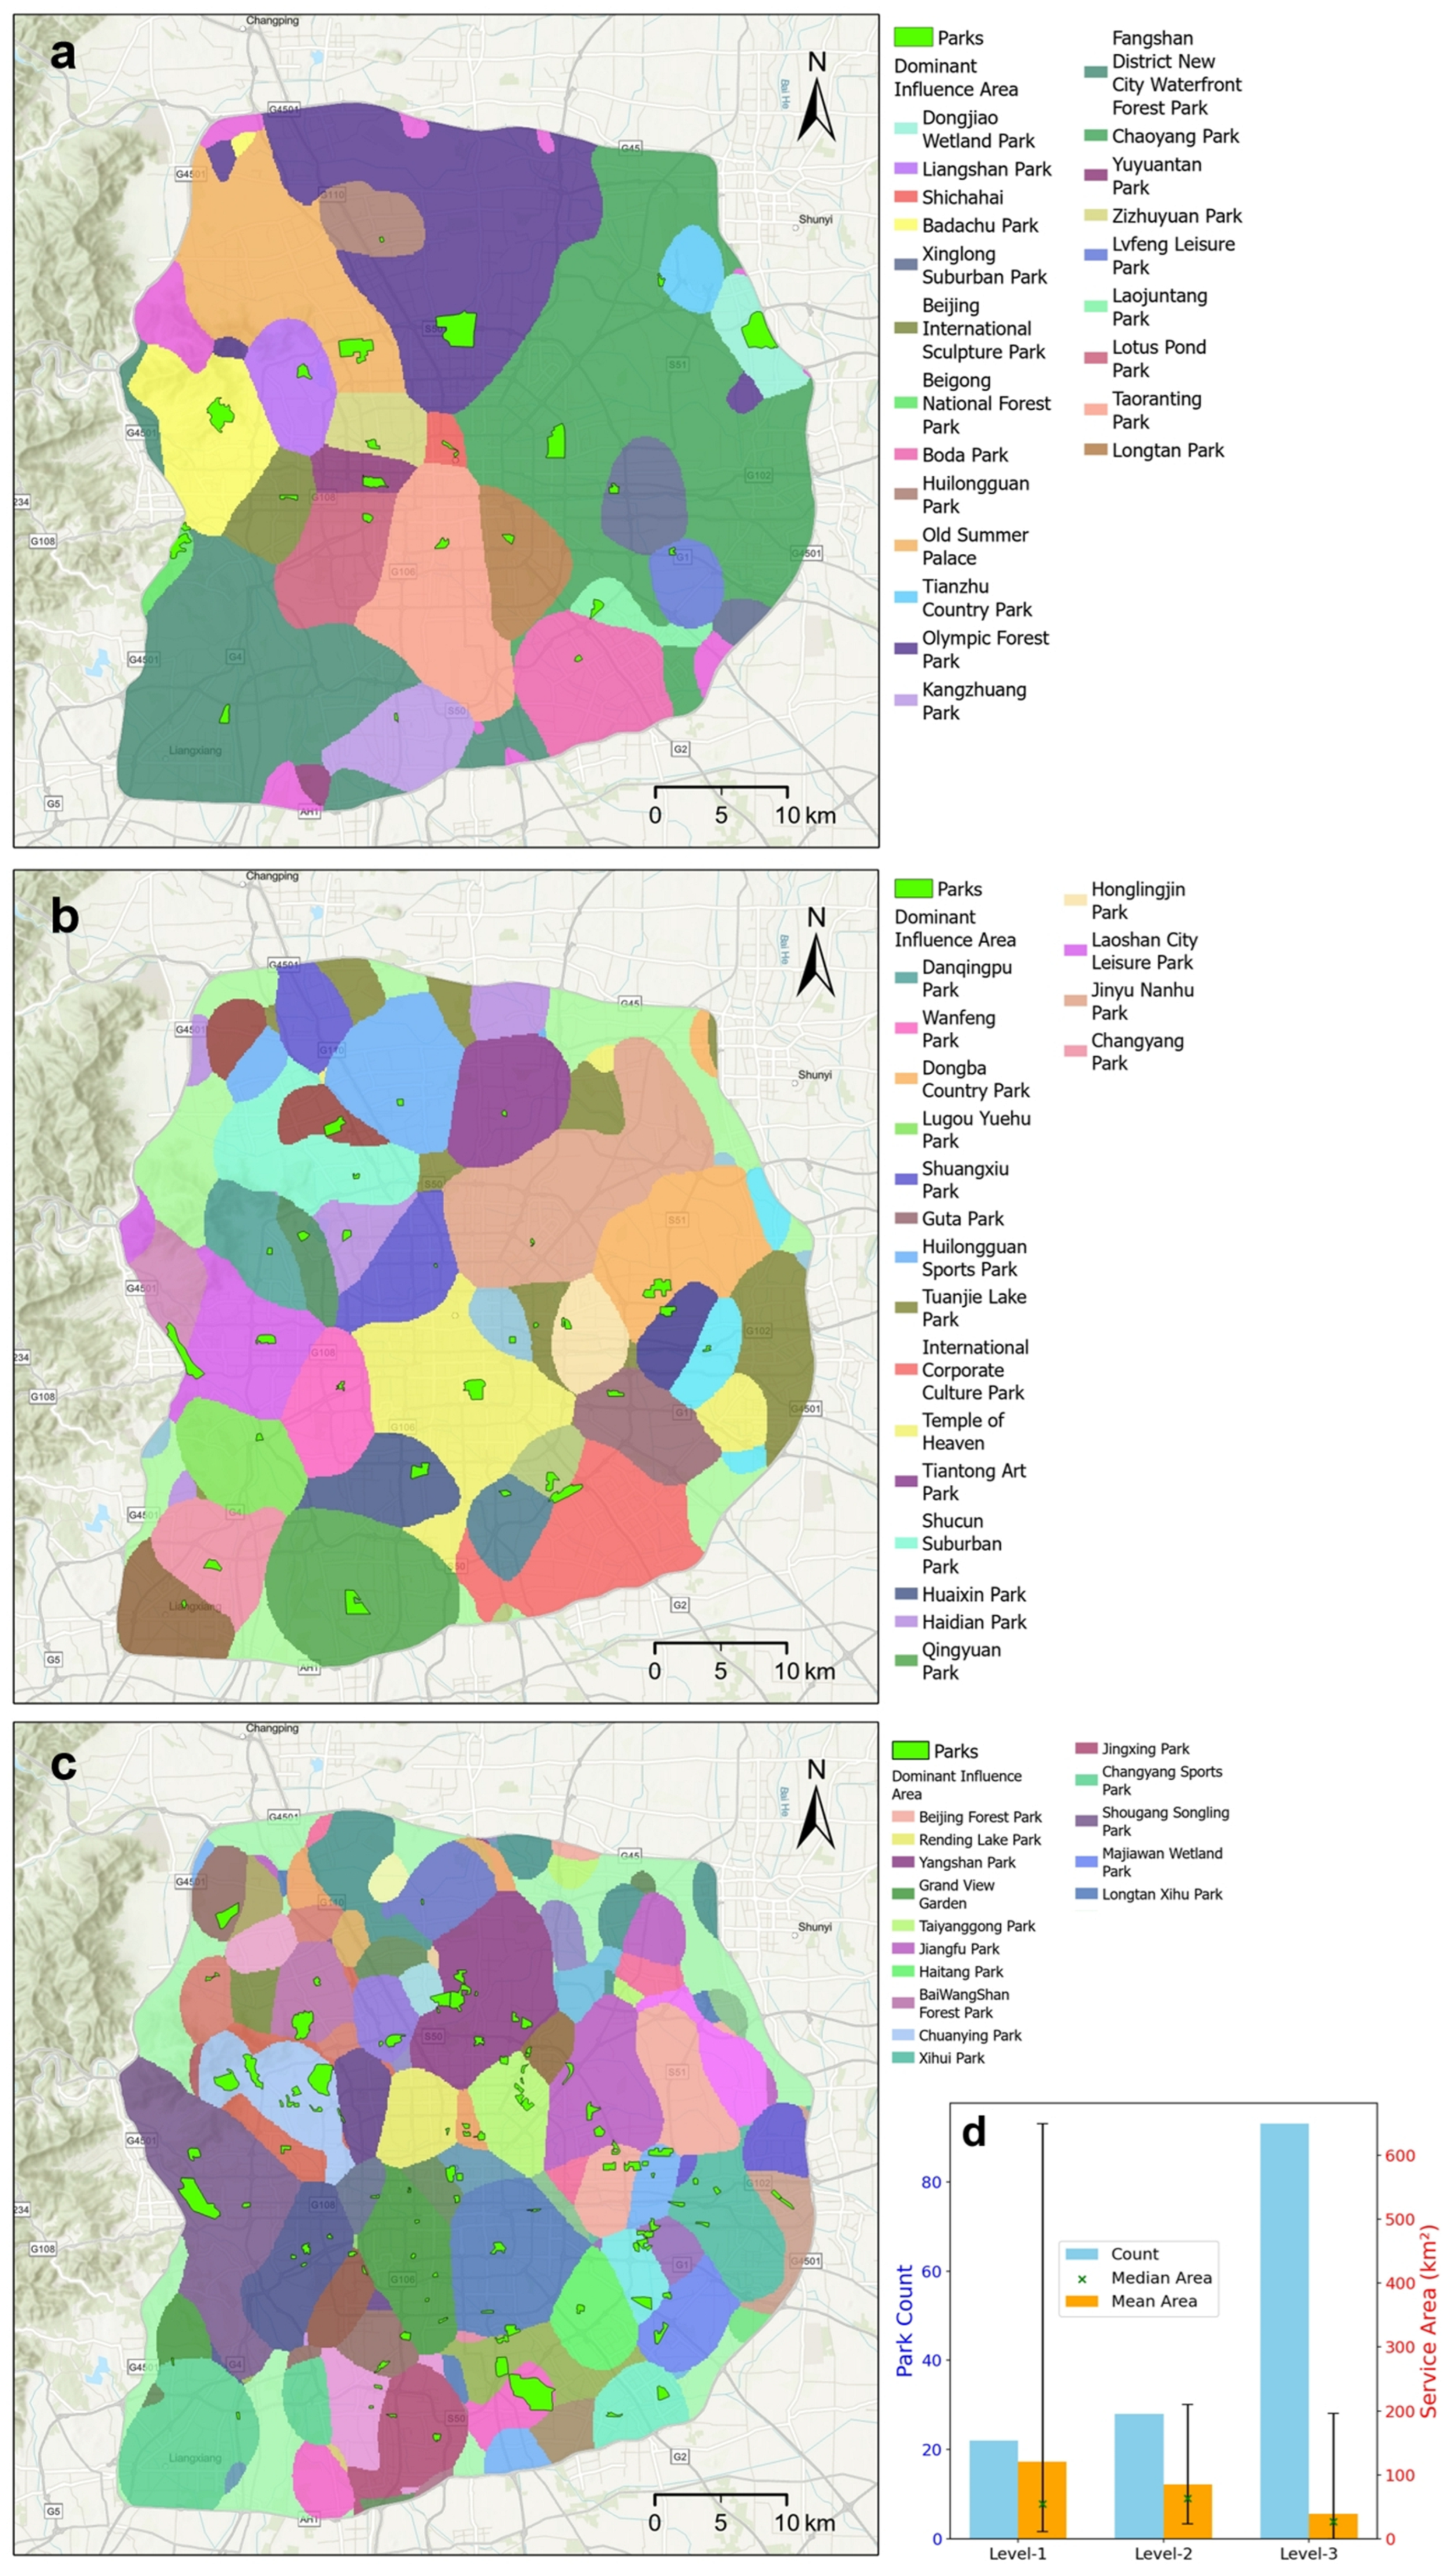
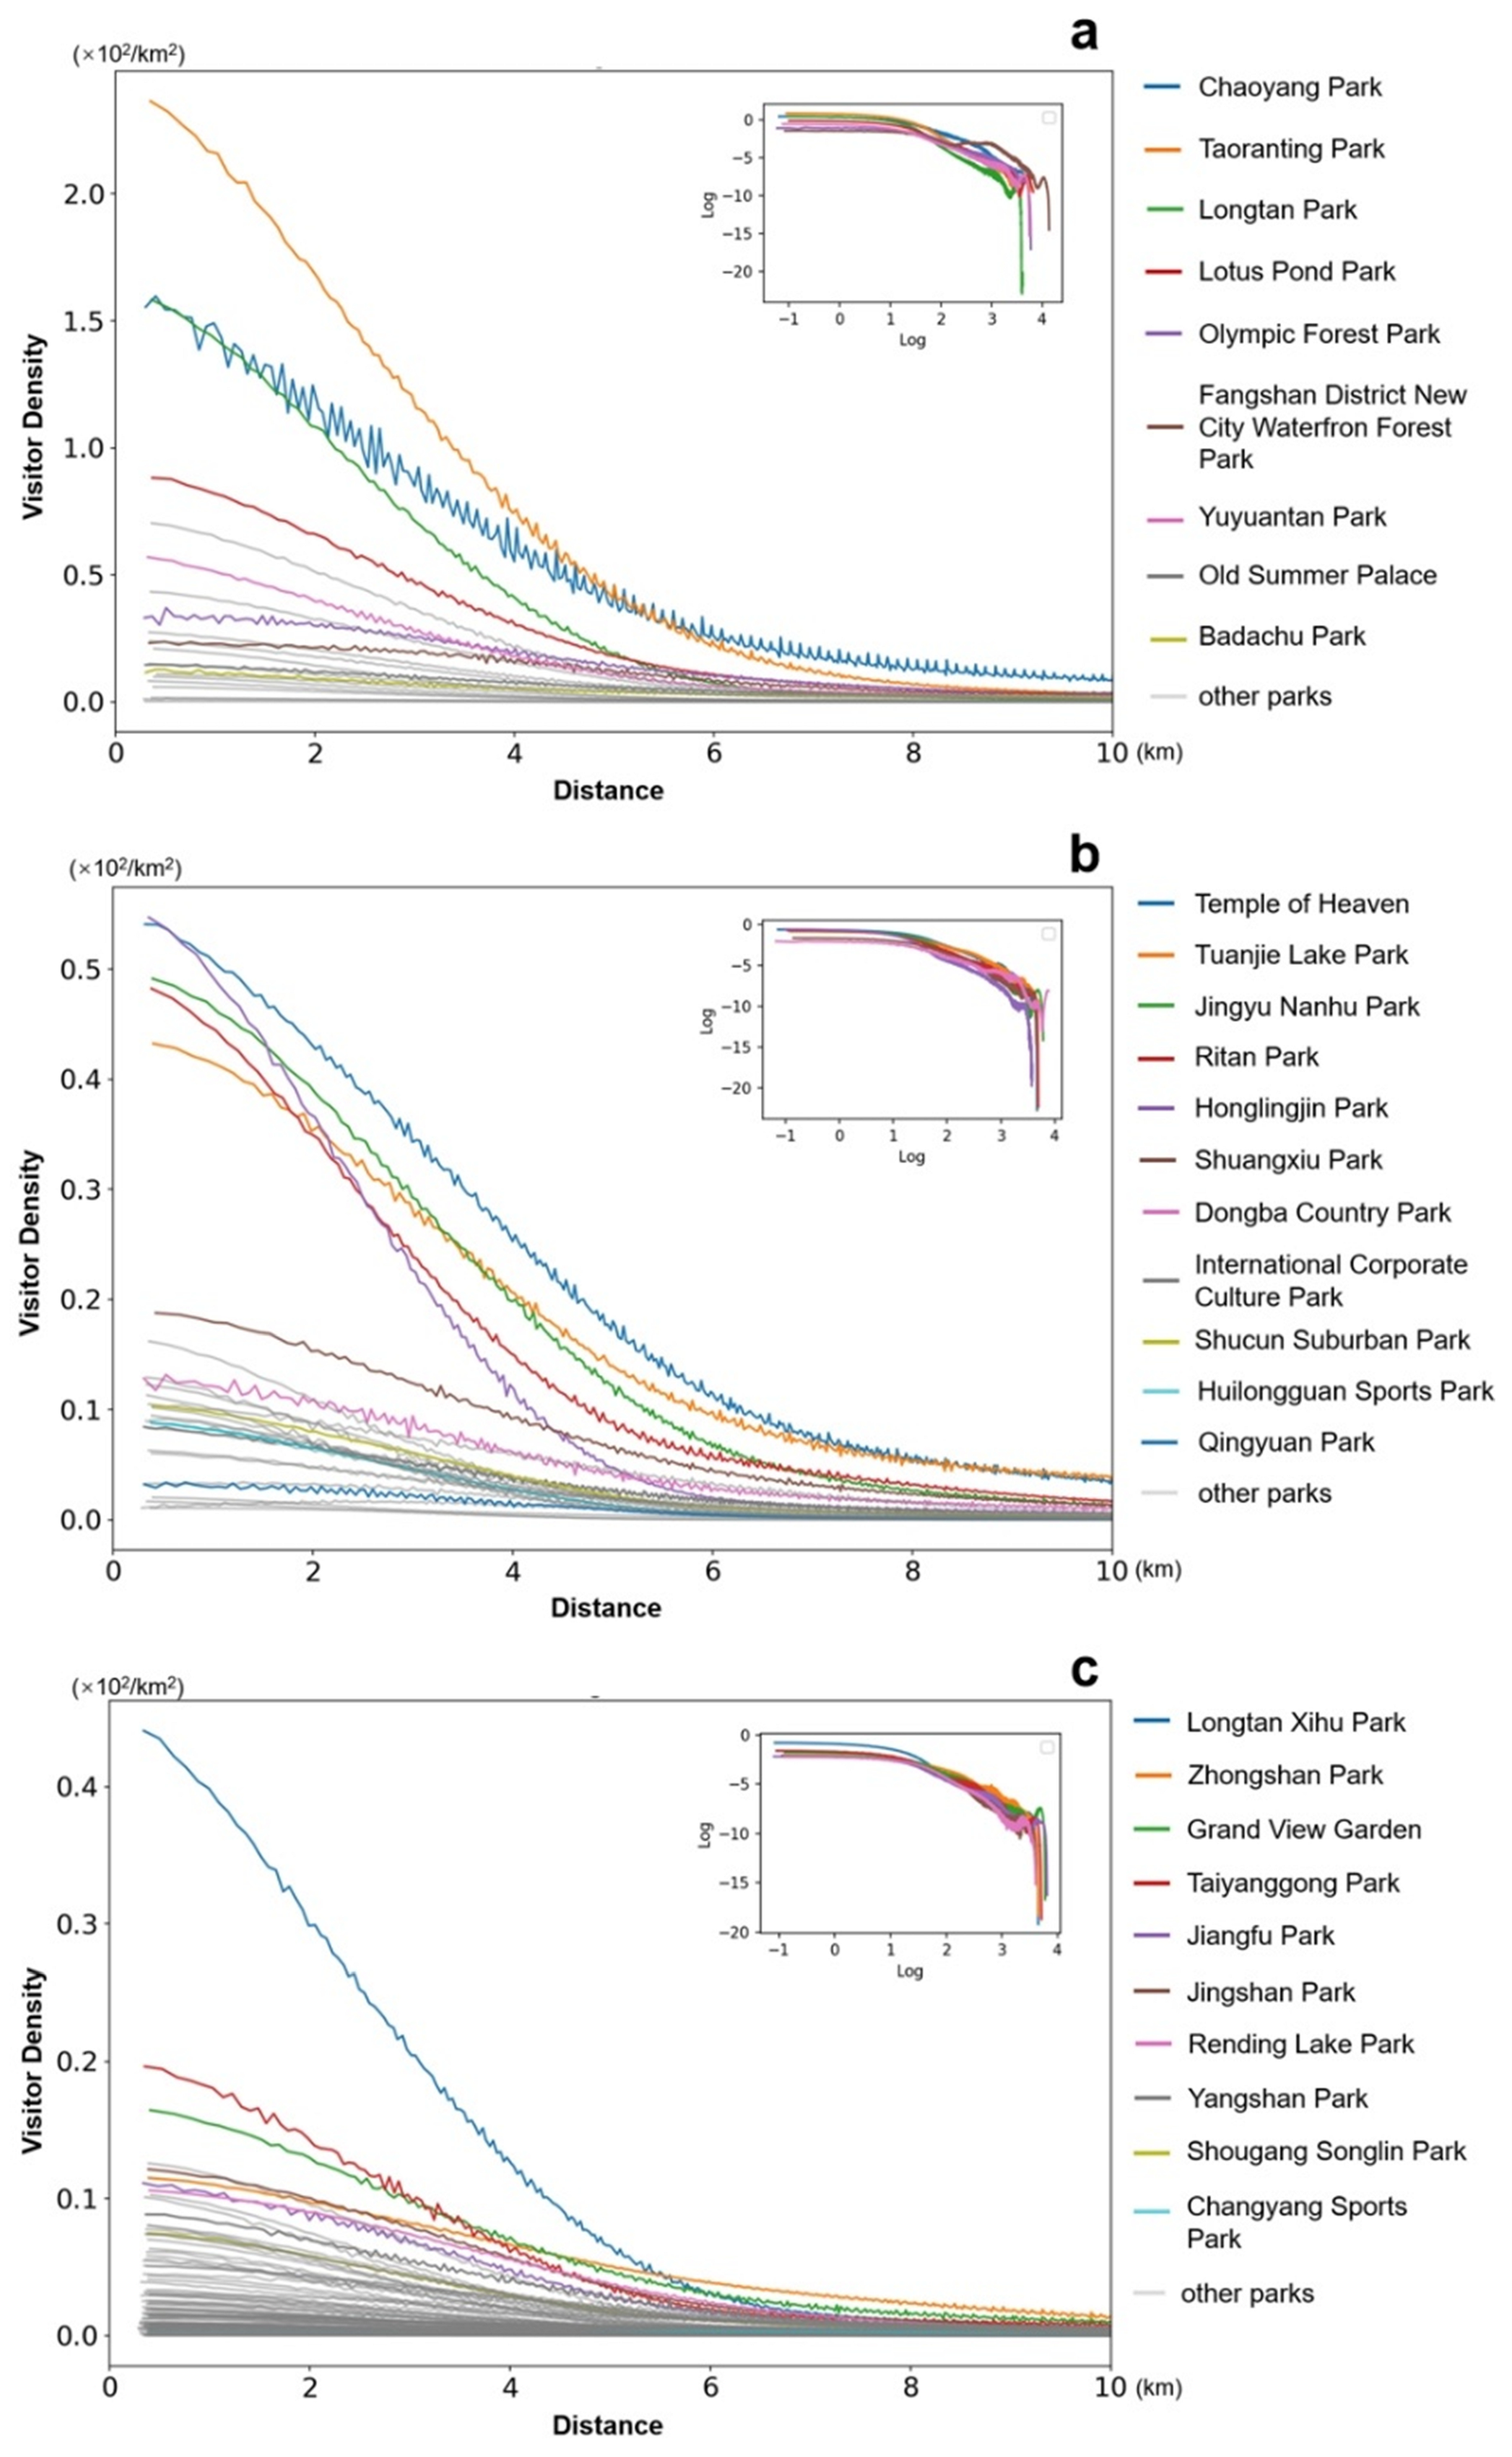
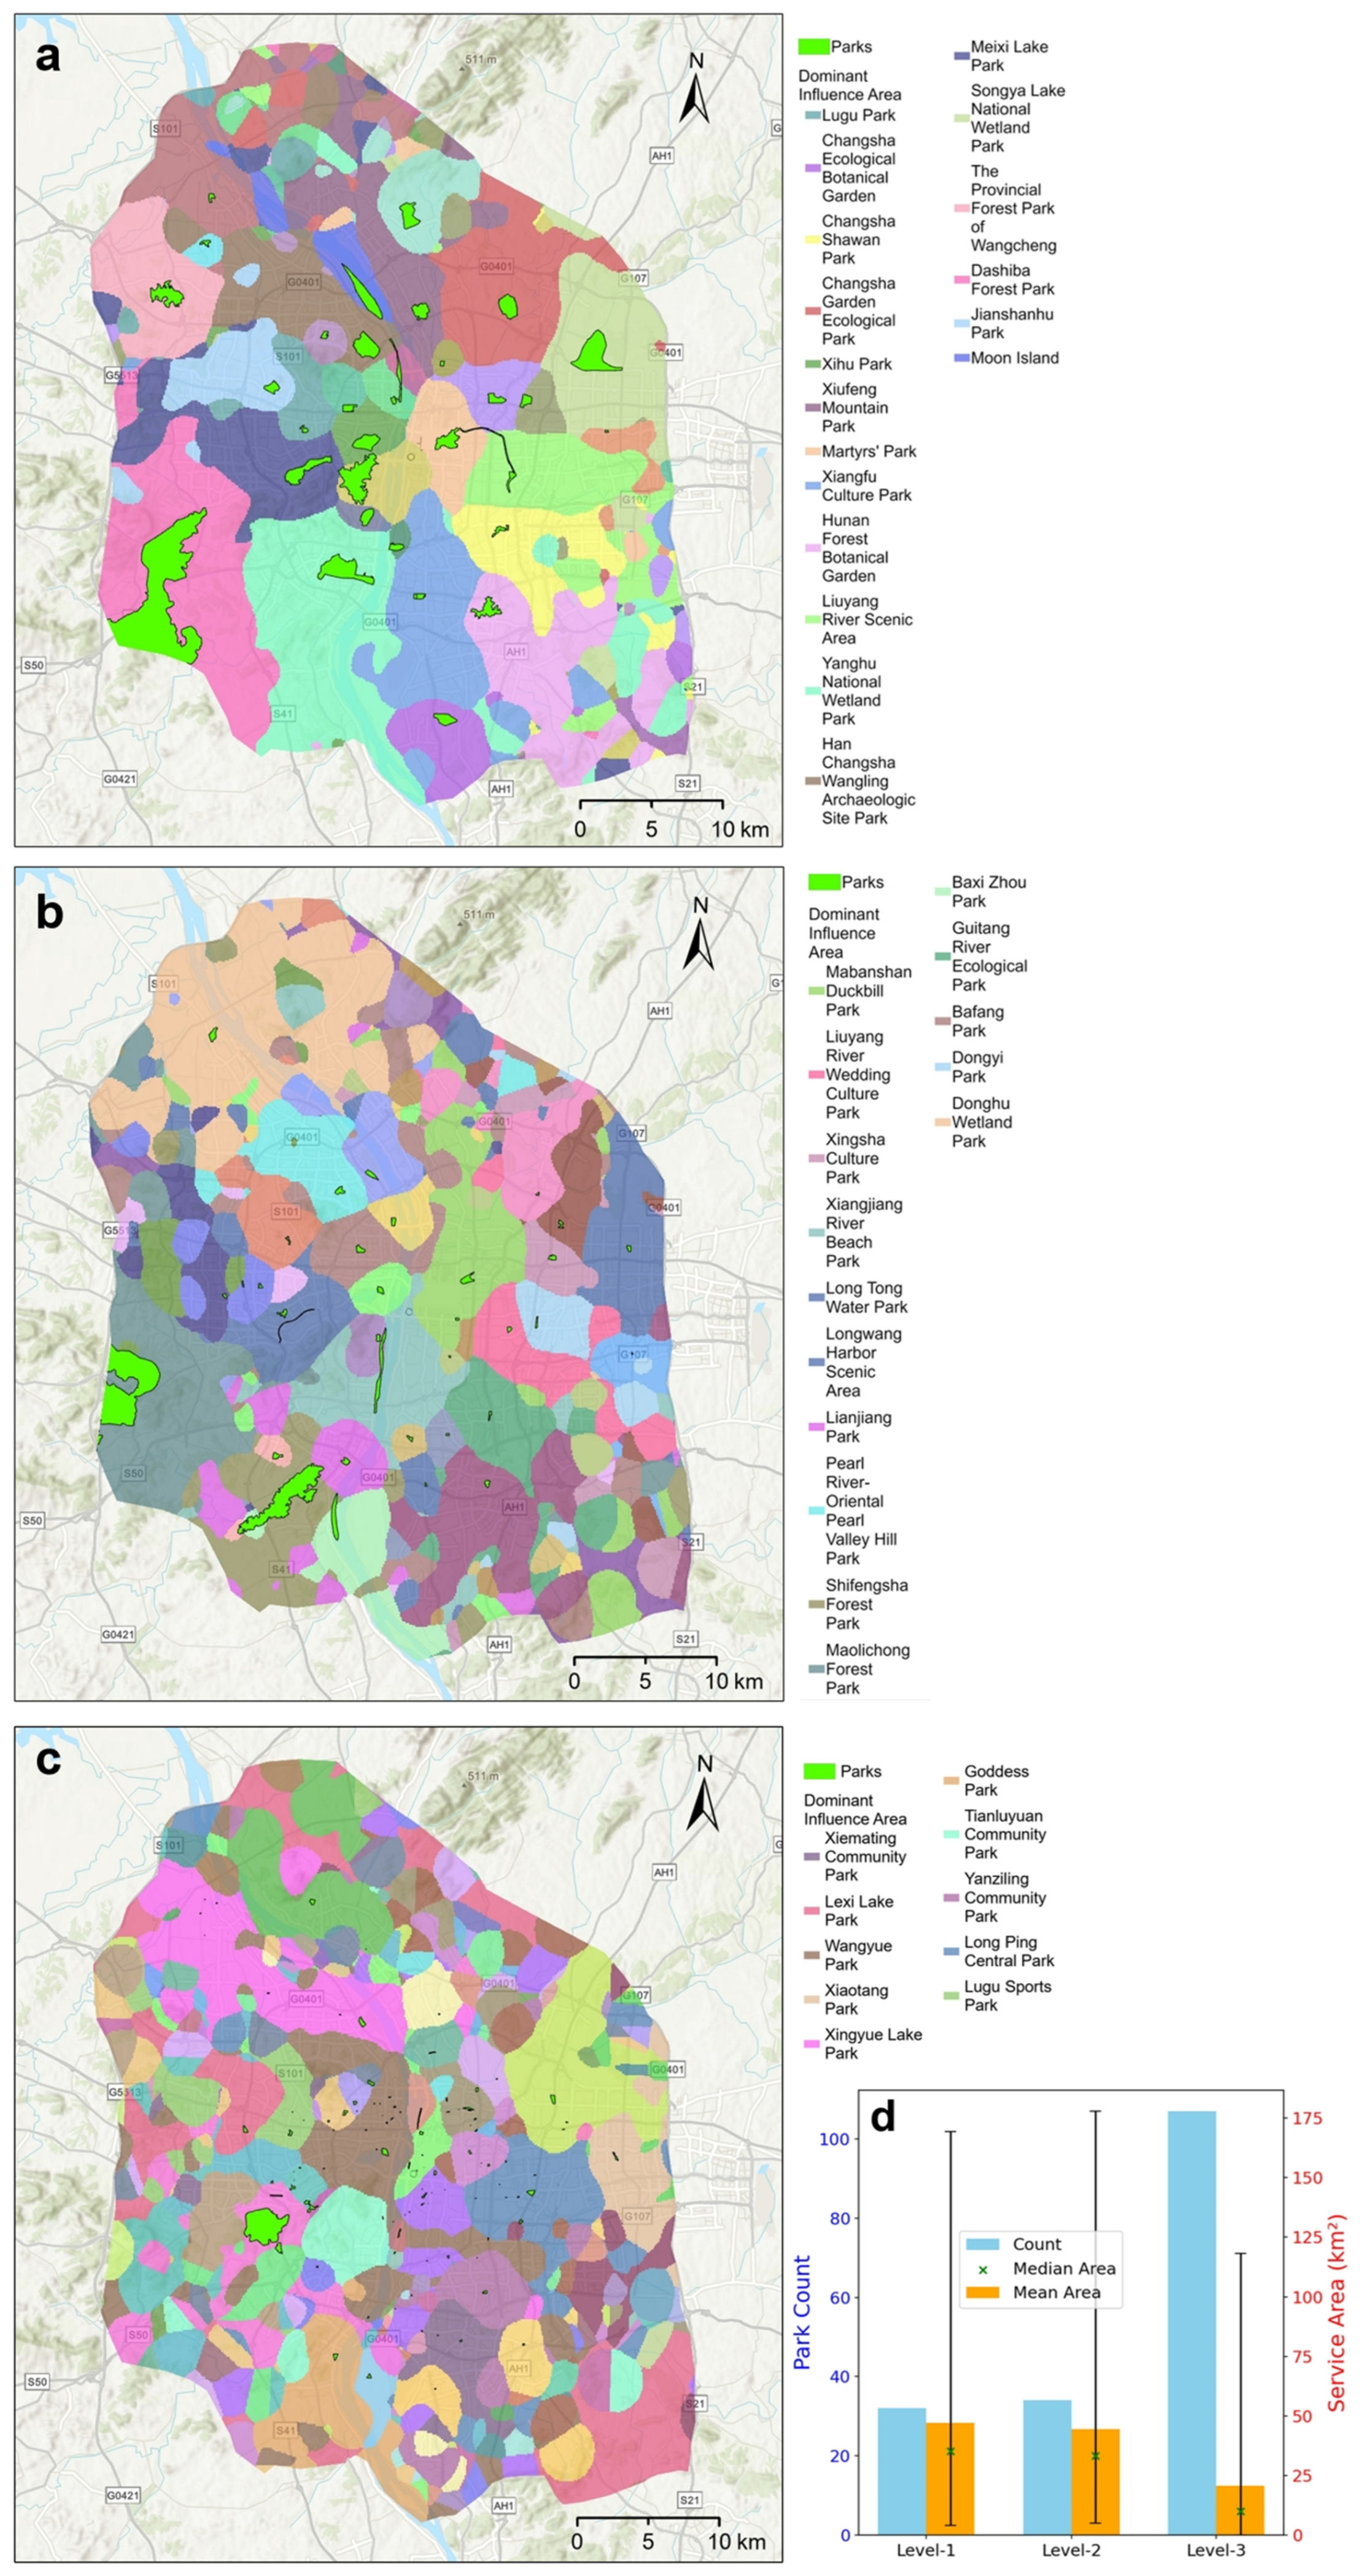
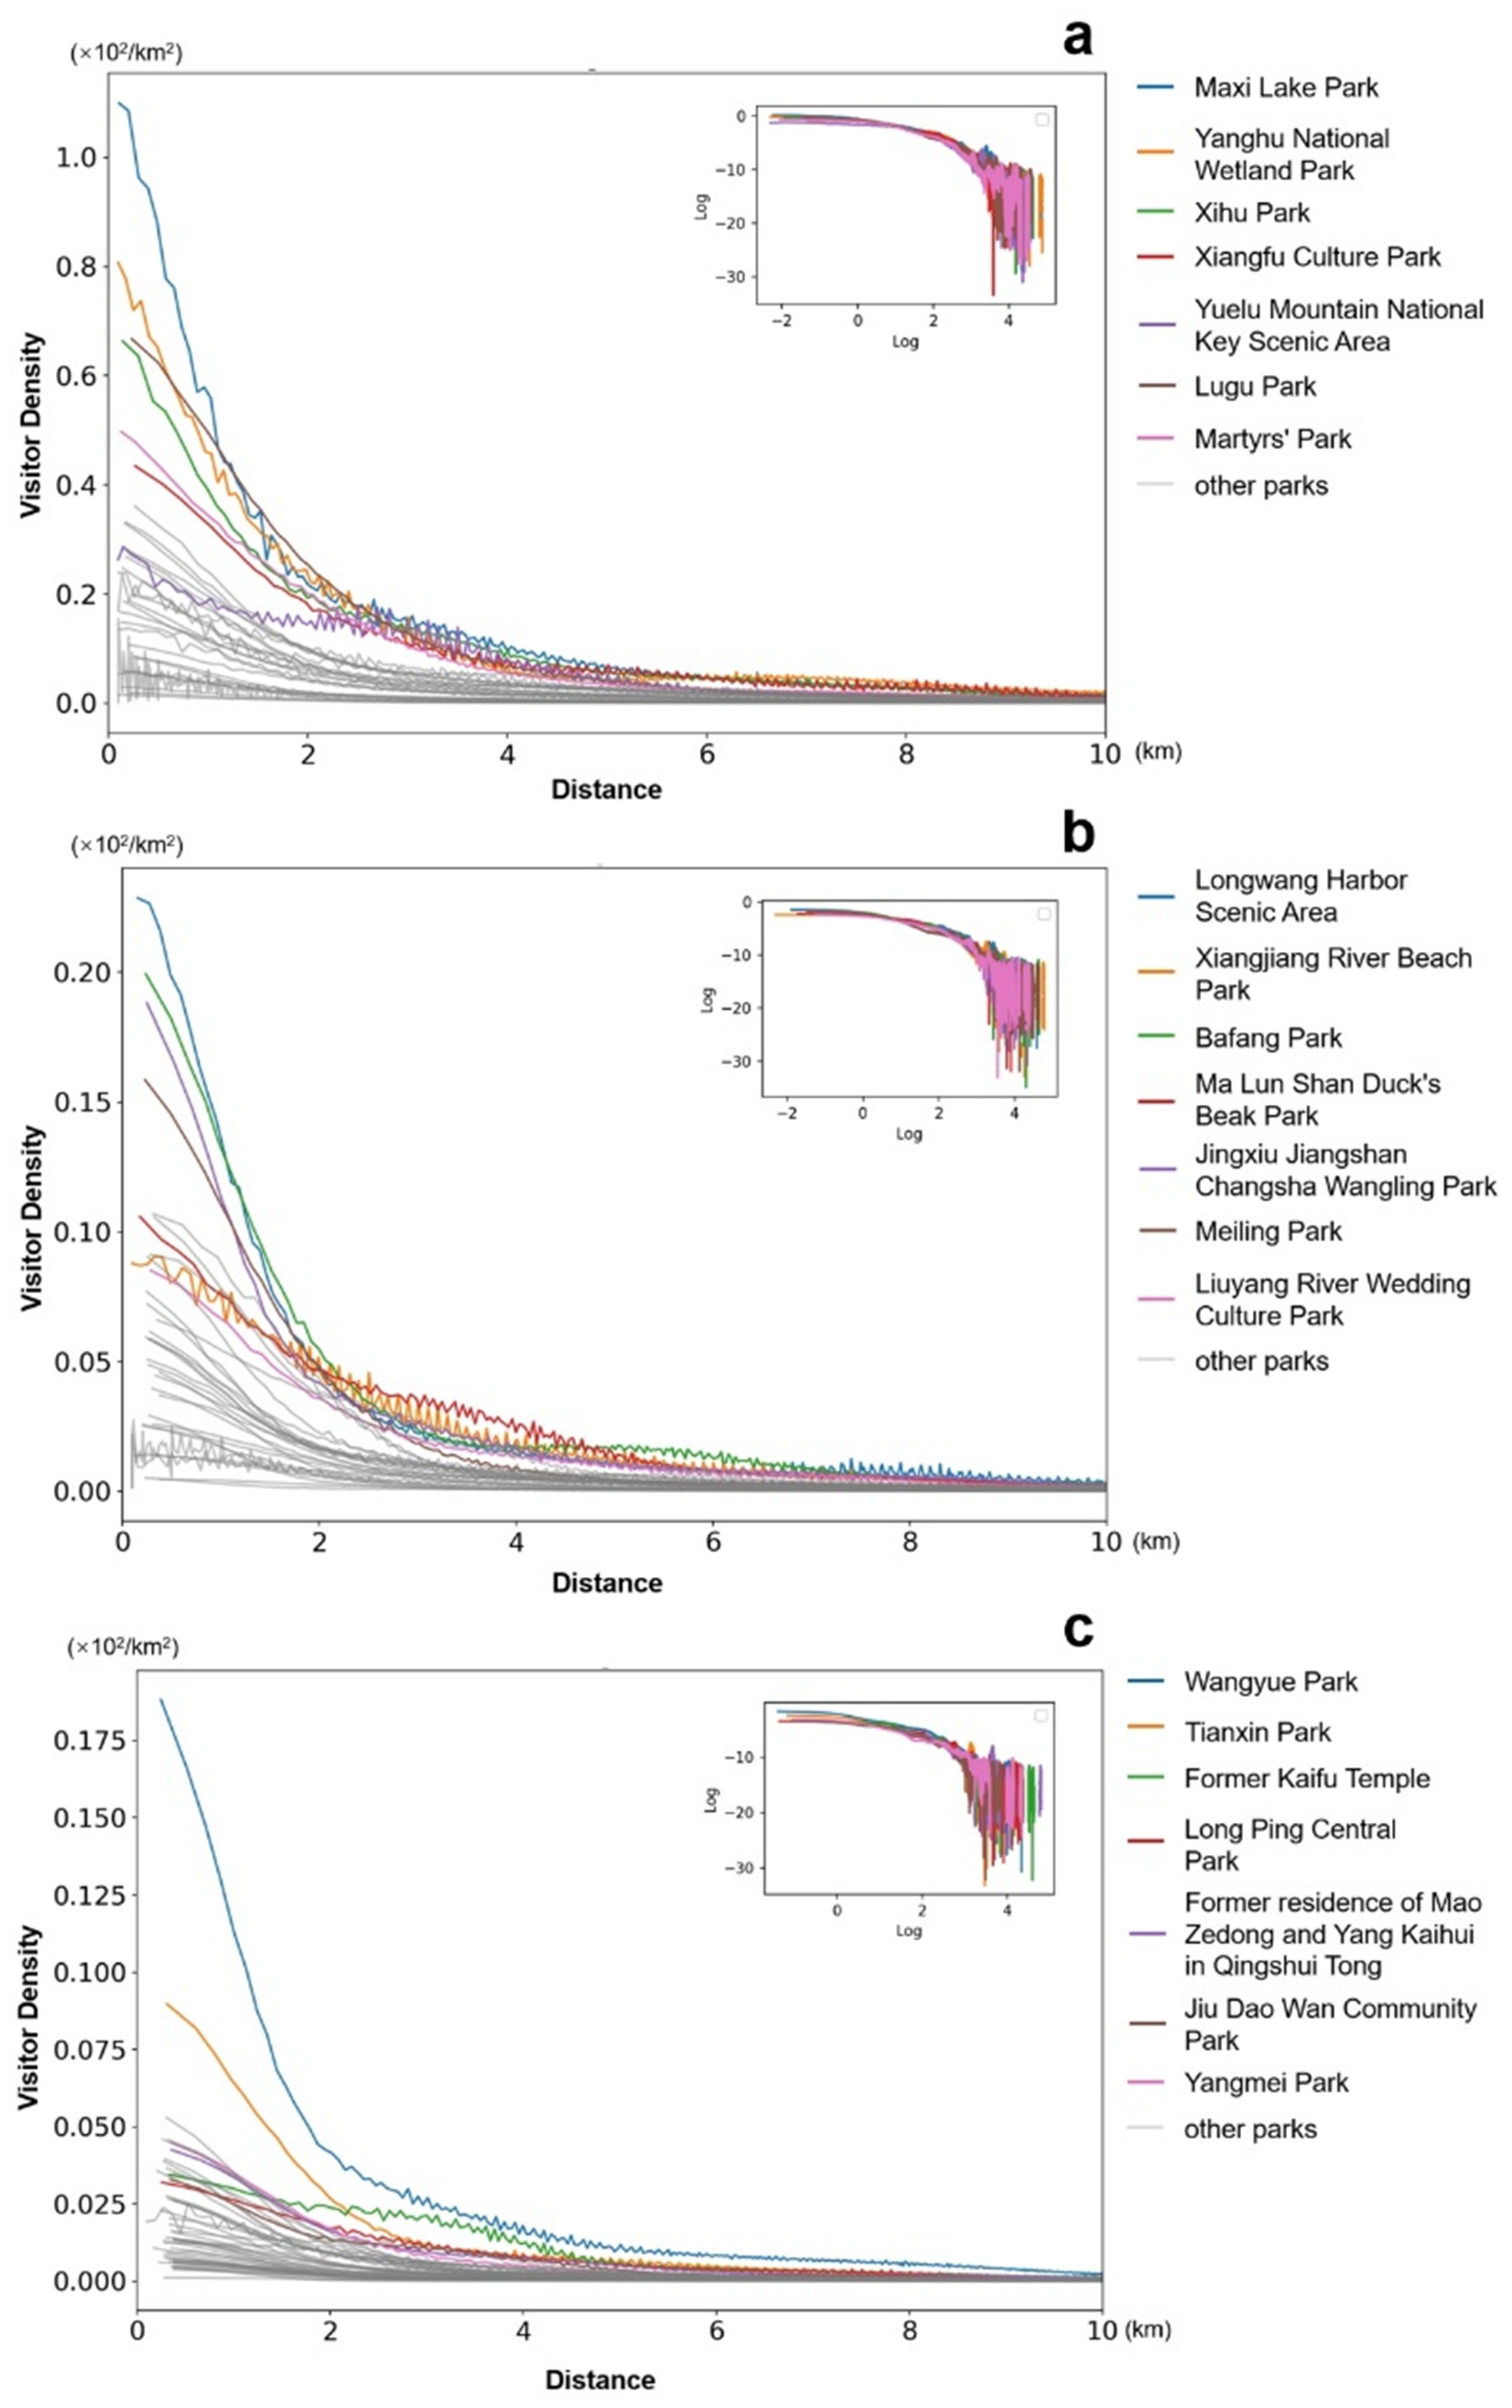
3.1. Dominant Influence Areas of Park Service

Figure 3 shows the DIA of park service in two cities. The results show that Chaoyang Park and Olympic Forest Park are the two parks with the largest DIAs, and the two parks cover most of the northeastern and due north areas of Beijing, respectively. The southwestern area is mainly covered by New City Waterfront Forest Park in Fangshan District, and other parks such as Old Summer Palace, Taoranting Park, and Lotus Pond Park also cover a larger area. In Changsha, park service areas are more fragmented than in Beijing. Parks such as Changsha Gardon Eco Park and Dashiba Forest Park have relatively larger dominant service areas.
The above describes the advantage service areas of parks across Beijing. Among the 143 parks, only 22 have their DIAs, so these 22 parks are classified as Level-1 (Figure 4a). After excluding these 22 parks, we mapped the remaining 121 parks. The results show that 28 parks now have their DIAs (Figure 4b), including large parks like the Temple of Heaven and Dongba Country Park. However, none of these areas are as extensive as the advantage service areas of Level-1 parks such as Chaoyang Park and Olympic Forest Park. These 28 parks are defined as Level-2 parks. After excluding these, we mapped the remaining 93 parks. The results indicated that the advantage service areas have further diminished, with only parks like Haidian Park and Jinyu Nanhu Park exhibiting relatively large service areas. Ultimately, we classified these 93 parks as Level-3 parks (Figure 4c). The number of parks of each level in Changsha is 32, 34, and 107, respectively (Figure 4d). As the park level decreases, the number of parks increases. Meanwhile, park DIA becomes increasingly fragmented, and the average service area gradually decreases. This pattern aligns with the conception of with the conception of CPT.
The analysis of visitor density trends with distance for parks of different levels (Figure 5) reveals that the service intensity of Level-1 parks is not always greater than that of Level-2 and -3 parks. Only Taoranting Park, Chaoyang Park, Longtan Park, and Lotus Pond Park have visitor densities higher than those of Level-2 and -3 parks. Among the Level-2 and -3 parks, visitor densities are relatively high in places like the Temple of Heaven Park, Tuanjiehu Park, and Longtan Xihu Park. While visitor density decreases with distance for each level of parks, the rate of decline varies significantly. For example, Taoranting Park and the Temple of Heaven Park belong to Level-1 and Level-2, respectively, but the visitor density of the Temple of Heaven Park within a 2 km radius is noticeably higher than that of many Level-1 parks. Temple of Heaven is classified as a Level-2 park primarily because its service area is largely overlapped by Taoranting Park due to its proximity.
In Changsha, among the 173 parks, 32 have their own dominant service areas and are classified as first-tier parks (Figure 6a). Additionally, 34 parks are categorized as second-tier parks (Figure 6b), while the remaining 107 are classified as third-tier parks (Figure 6c). In both Beijing and Changsha, the number of parks increases progressively across the three tiers. However, the numbers of first-tier and second-tier parks are relatively close. The DIA fragmentation of parks in Changsha is more pronounced than in Beijing. Moreover, in both cities, fragmentation increases progressively across the tiers.
The analysis of service intensity trends across different park tiers with increasing distance (Figure 7) reveals notable patterns. Similar to Beijing, the service intensity of Level-1 parks is not always higher than that of Level-2 and -3 parks. Only a few parks, such as Meixi Lake Park and Yanghu National Wetland Park, exhibit higher visitor density than Level-2 and -3 parks. Among Level-2 and -3 parks, Longwang Harbor Scenic Area and Bafang Park have relatively high visitor densities. Visitor density in all levels decreases with distance, but the rate of decline varies significantly. For instance, in the 0–2 km range, Meixi Lake Park experiences a sharp drop in visitor density, whereas in Martyrs’ Park, the decline is much more gradual. A similar pattern is observed among Level-2 and -3 parks.

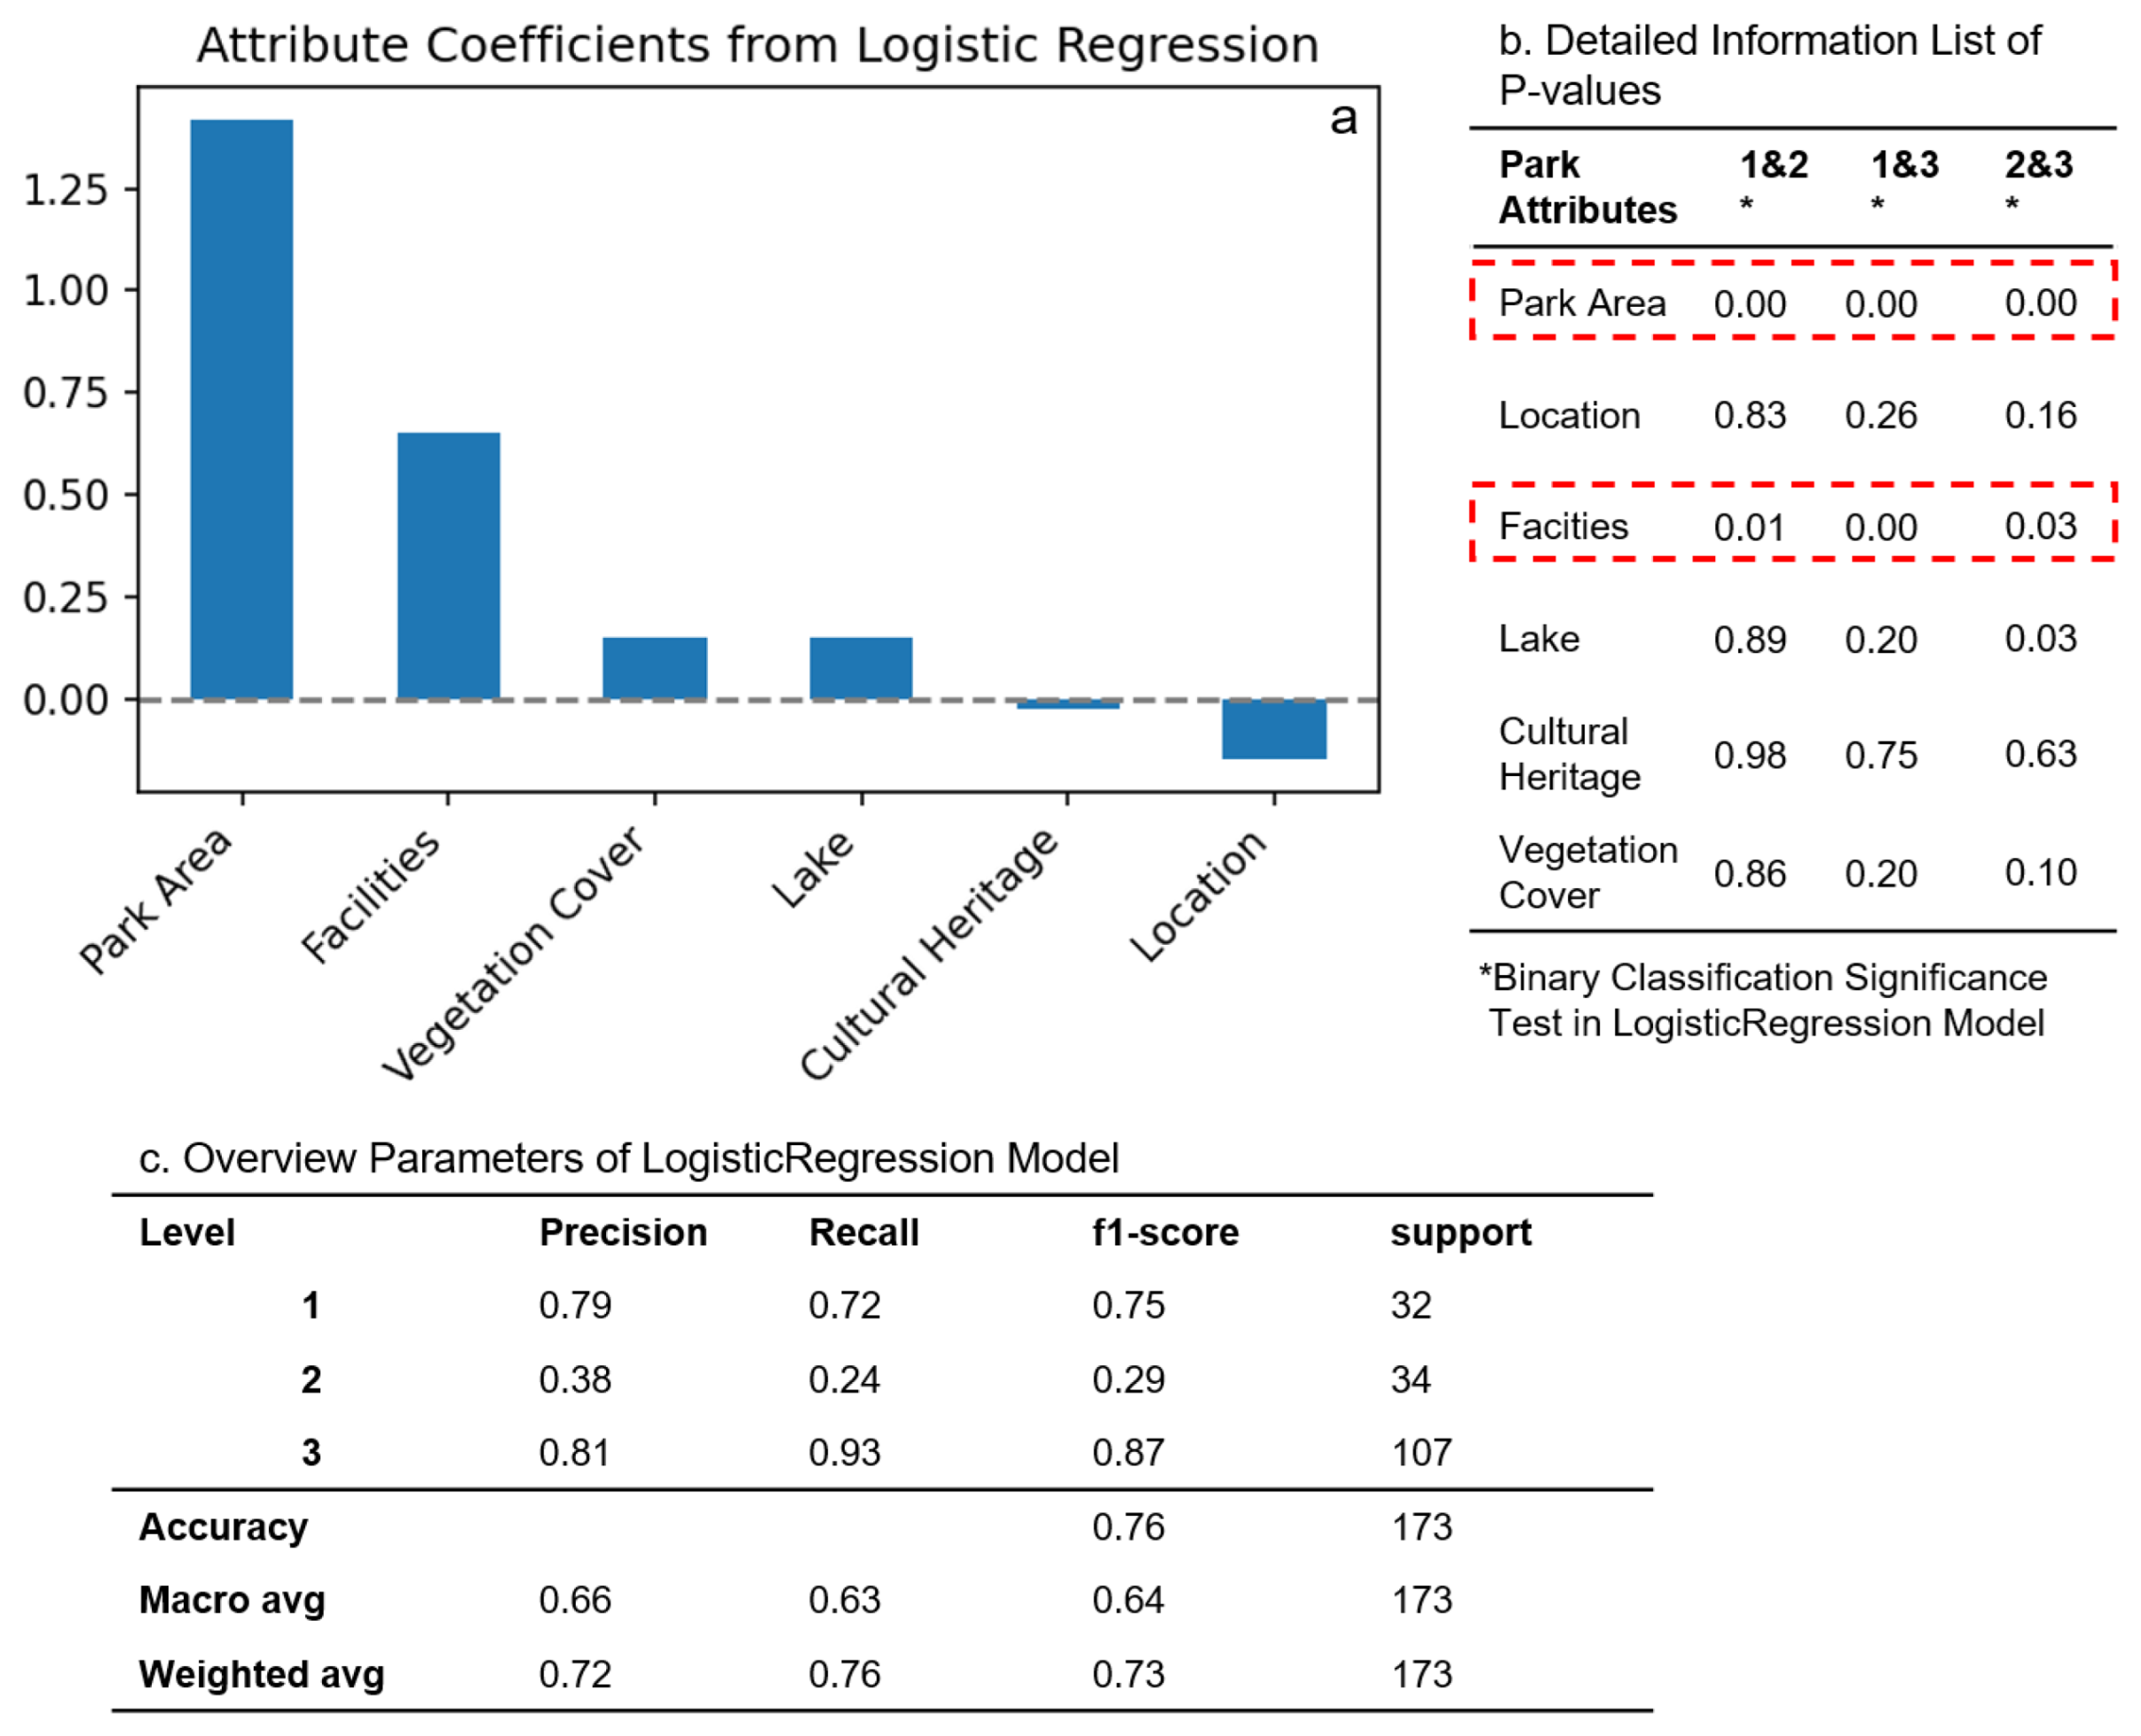
3.2. Factors Analysis for Park Grading

In the previous subsection, we examined the service level distribution of parks in two cities. This classification may be influenced by the inherent attributes of the parks. Therefore, it is necessary to further analyze the potential influencing factors and their statistical significance.
In Beijing, the results of the logistic regression analysis on factors influencing park hierarchy (Figure 8) show that the correlation coefficients of all six park attributes are below 0.5. Factors such as cultural heritage sites and park areas exhibit a positive correlation with park hierarchy, while vegetation coverage and infrastructure development show a negative correlation. However, significance testing results indicate that most intrinsic park characteristics do not pass the significance test, with only cultural heritage sites meeting the 0.05 significance level for distinguishing between first-tier and third-tier parks (Figure 7b). Additionally, the model’s prediction accuracy for first- and second-tier parks is only 0.50 and 0.25, respectively, whereas the accuracy for third-tier parks reaches 0.67. The overall model accuracy is 0.63. Given the correlation coefficients of each factor, the results suggest that no single attribute significantly influences park classification.
Unlike Beijing, park area and infrastructure in Changsha show a significant positive correlation with park classification. Except for infrastructure, which passes the 0.05 significance test for distinguishing between second- and third-tier parks, all other factors pass the 0.01 significance test (Figure 9). This suggests that in Changsha, park area and infrastructure development play a dominant role in determining park hierarchy. In other words, larger parks with better infrastructure are more likely to be classified at a higher tier. Additionally, the model’s prediction accuracy for Changsha reaches 0.81, outperforming that of Beijing.

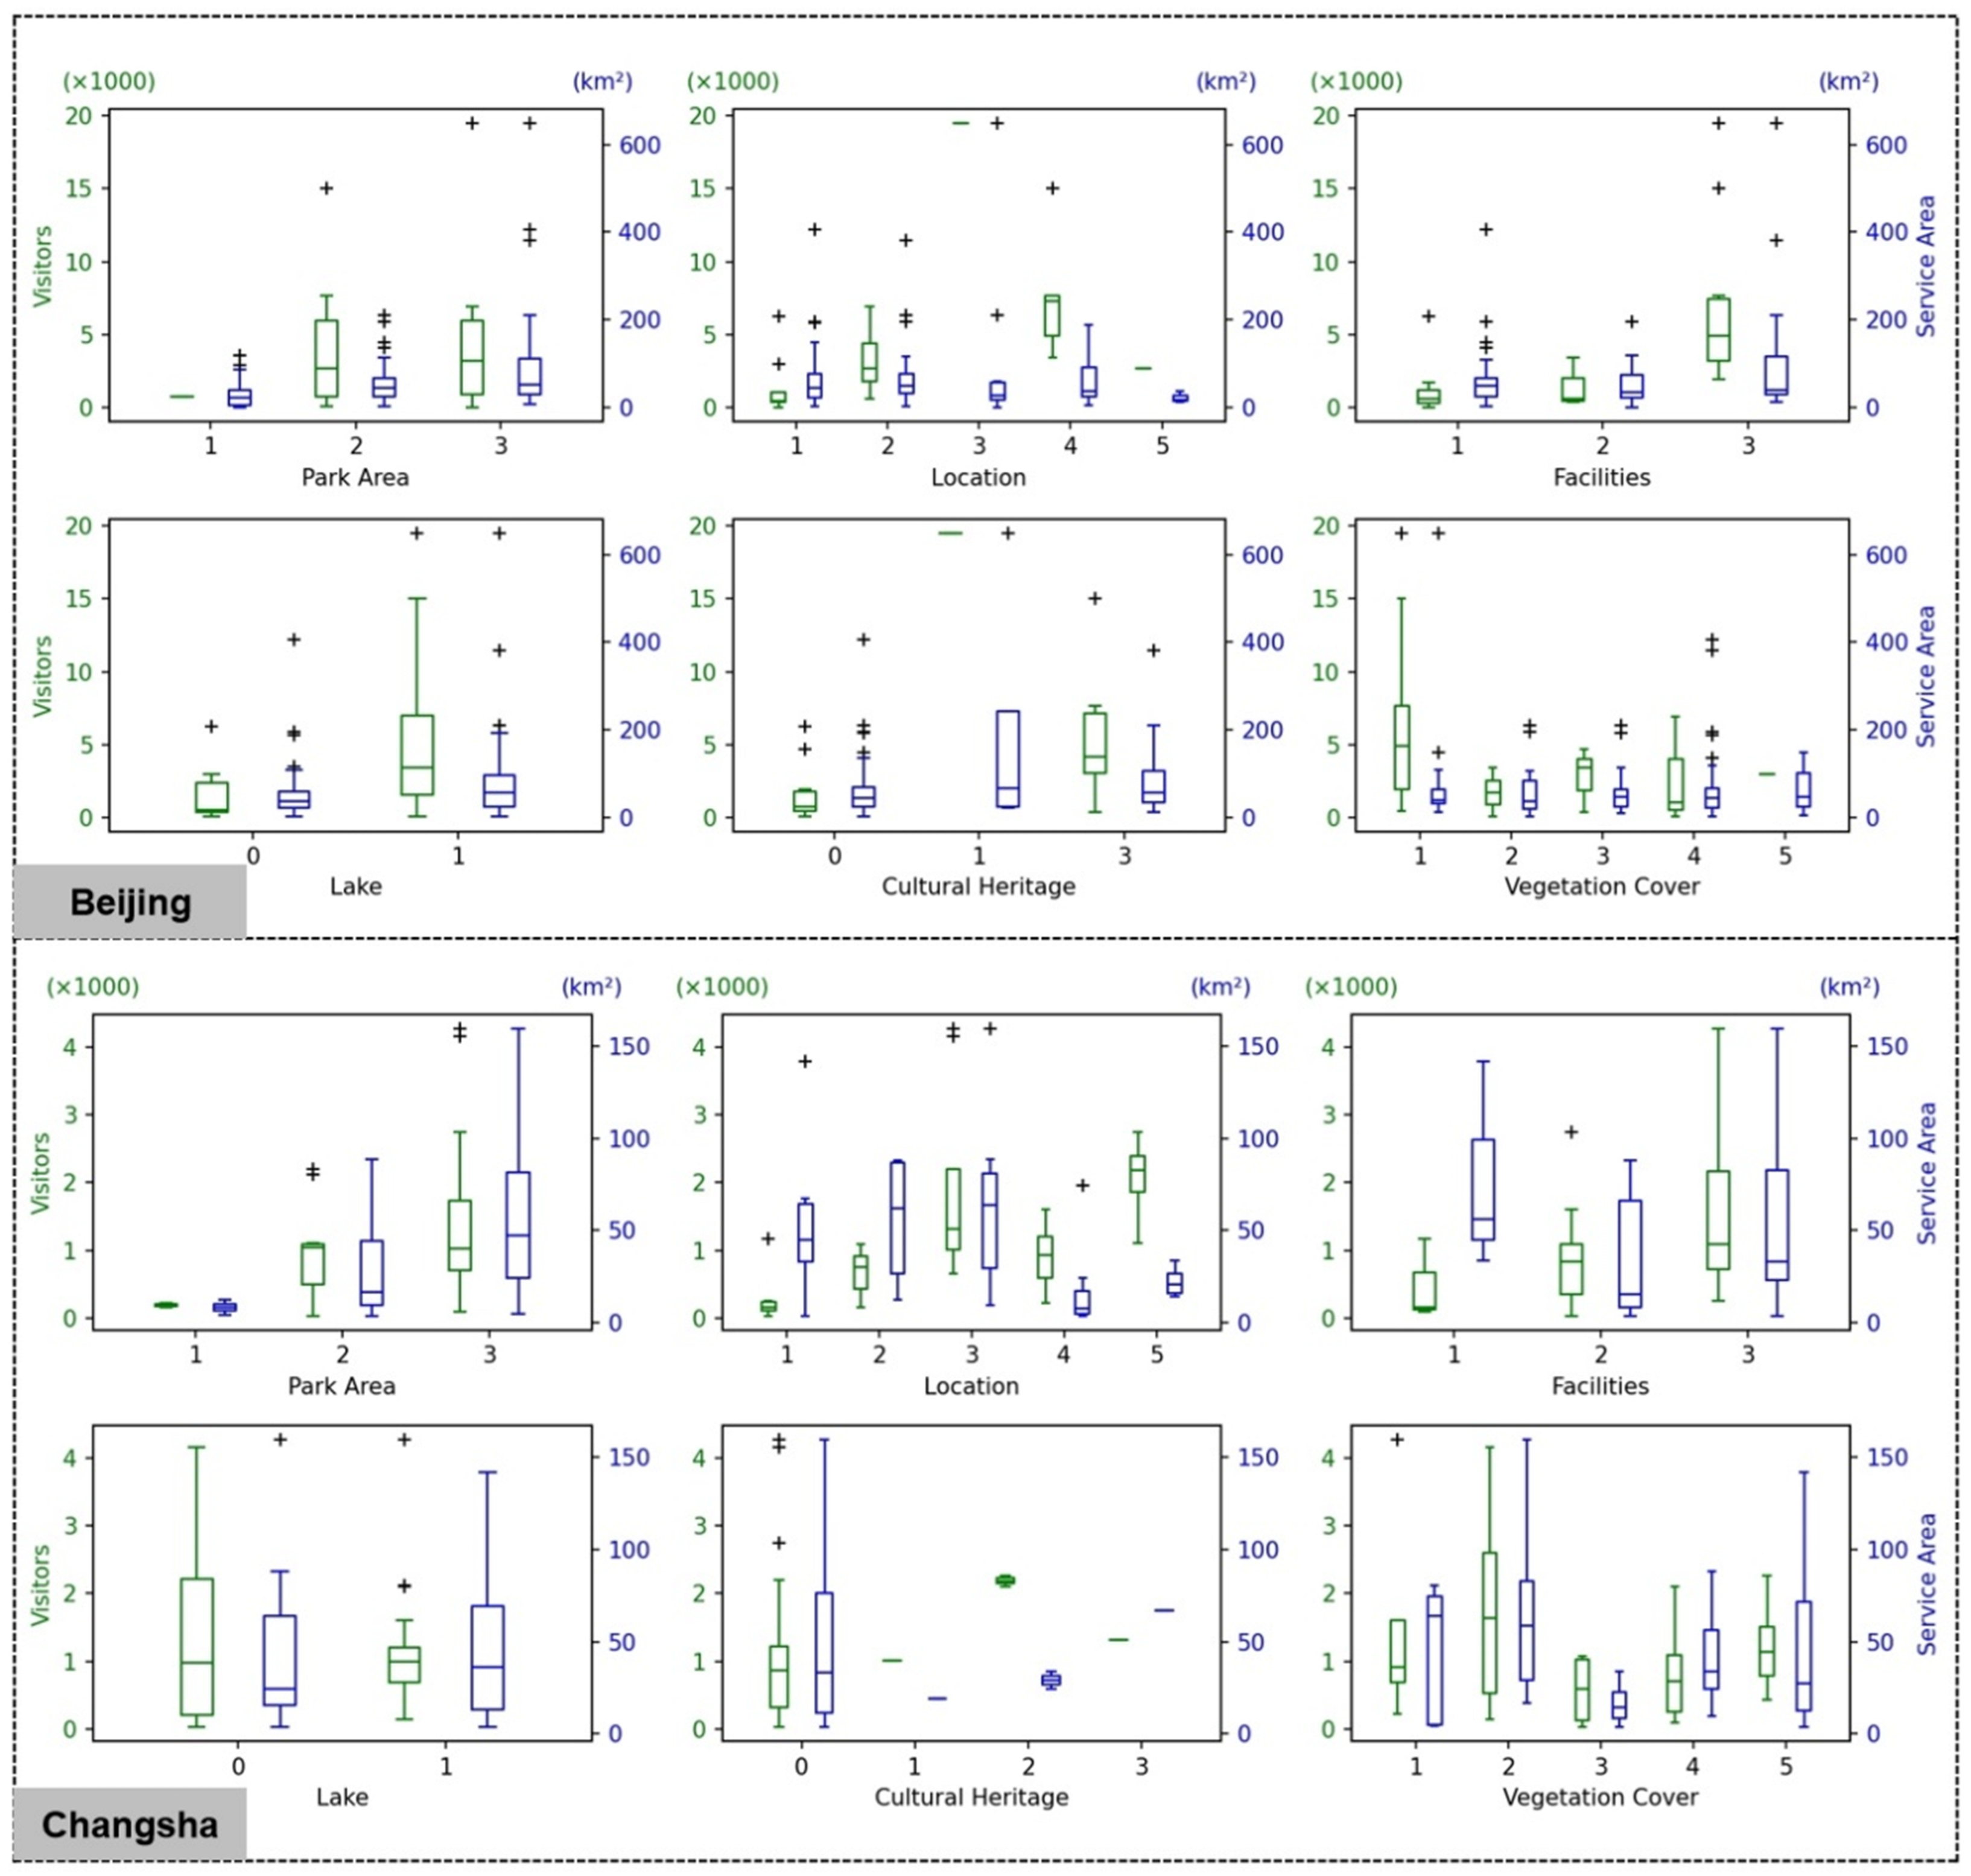
3.3. Factors Analysis for DIA on Each Level

Based on the results in Section 3.1, we found that the DIA of parks does not completely align with the number of visitors (Figure 4 and Figure 5). Therefore, We analyzed boxplots of park attributes versus the number of visitors and scope of services for each level separately. For Level-1 parks in Beijing, facilities and lakes have a positive impact on the number of visitors, while other influencing factors do not show a consistent trend (Figure 10). Only the park area has a positive relation with the service area. There are some park characteristics corresponding to a large fluctuation in the number of visitors, and for vegetation cover, the range of visitors with a vegetation cover rating of 1 fluctuates widely, from 200 to 15,000. For park lake, the number of visitors in the park with a lake also fluctuated in a larger range, while the parks without a lake all covered less than 3000 residents. Overall, there was a large difference in the impact of park characteristics on the number of visitors and the service area. Park area and infrastructure positively influence visitor numbers for first-tier parks in Changsha, while other factors show no consistent trend. In terms of service area, only park area exhibits a consistent pattern of variation.
For Level-2 parks, we found that location and facilities are the primary influencing factors (Figure 11). As the location level increases, so does the number of visitors, indicating that for Level-2 parks, the closer the park is to the city center, the more visitors it attracts. Other factors do not exhibit consistent trends. Unlike visitor numbers, no park characteristics exhibit consistent patterns with service areas. In Changsha, only park area shows a relatively strong correlation with service areas. Other parks’ characteristics do not demonstrate a clear consistency with either visitor numbers or service areas. For Level-2 parks in Changsha, neither park area nor infrastructure maintains a consistent relationship with visitor numbers or service areas.
For Level-3 parks, the attribute influencing visitor numbers, as shown in the box plot (Figure 12), is primarily location. As the location rank increases, the number of visitors also increases. This suggests that for Level-3 parks, parks located closer to the city center tend to attract more visitors. Other factors do not exhibit consistent trends. Similar to Level-2 parks, park area is a positive factor influencing the dominant service area of parks. In Changsha, park area positively influences both visitor numbers and service areas. Unlike in Beijing, there is only one third-tier park in Changsha with a relatively large area, while in Beijing, larger parks fall into Level-3.
In summary, our analysis highlights CPT patterns in park service areas, visitor density, and influencing factors across different hierarchical levels in Beijing and Changsha. The classification of parks into three levels reveals that a small number of large parks dominate service provision in both cities. The service intensity analysis indicates that higher-tier parks do not always maintain the highest visitor densities, as proximity and local competition significantly affect park usage. The logistic regression results suggest that in Beijing, individual park attributes have limited influence on service hierarchy, with only cultural heritage sites showing a statistically significant correlation. However, in Changsha, park area and infrastructure play a more substantial role in determining park classification. Further factor analysis demonstrates that visitor density and service areas are influenced by different attributes depending on each level. Overall, our findings emphasize the complex interplay between park attributes, spatial distribution, and service intensity.

4. Discussion

4.1. Data Reliability

With the widespread application of geographic big data, researchers have begun to integrate new data and methods into urban geography studies [28,29,30]. This study utilized mobile signaling data as the core data source. Although it is more objective compared to traditional survey methods, potential biases in these data still need to be acknowledged. Mobile signaling data, as a type of social sensing data, can reflect the perspectives of specific groups in the city. However, they are still sample data, with the sampling process involving supplier selection and data thinning by the providers, which may lead to temporal and spatial sparsity and bias, thereby affecting the reliability of the research results.
Therefore, when using big data as empirical data, particular caution should be exercised for “counterintuitive” results in the conclusions. In this study, we found that some of our findings align with previous research, such as Chaoyang Park and Olympic Forest Park being classified as Level-1 parks with extensive DIA [10]. However, Taoranting Park, despite having fewer visitors than the aforementioned parks, attracts more visitors despite its smaller park area and fewer facilities. By comparing population distribution (Figure 1), we found that the population density near Taoranting Park is much higher than that near Olympic Forest Park, which may partly explain the higher number of visitors at Taoranting Park. Regardless, conclusions drawn from big data need to be interpreted with caution, especially when it comes to anomalies, which must be properly explained; otherwise, potential biases inherent in the data should be considered.
Michiel et al. conducted a study based on Twitter and Foursquare data to analyze the central place patterns of Louisville, Kentucky [31]. Their conclusions suggest that big data-based methods are not fundamentally different from classic central place theory (CPT). They first determined the range and thresholds of various central functions through an analysis of the micro-foundations of CPT. However, the researchers also emphasized that the robustness of big data should not be overestimated [32,33,34]. In summary, although this study used relatively objective mobile signaling data, the data source remains somewhat limited. If multi-source data such as internet media data and video data could be used for cross-validation, the reliability of the conclusions would be strengthened.

4.2. The CPT Mode for Parks’ Recreational Services

The morphology of cities, such as residential areas, commercial districts, parks, and roads, varies widely in geospatial distribution. As a result, fitting center-place locations in ideal regular geometries (e.g., Christaller’s hexagonal pattern) becomes analytically less important. Previous studies have established that real-world geographic features can rapidly distort the hexagonal geometric location of CPT, significantly altering their spatial configuration [35,36,37]. While the results of this study do not strictly adhere to a hexagonal pattern, certain areas exhibit hexagonal characteristics. For example, in the Level-1 parks, Old Summer Palace, Osun Park, and Chaoyang Park seem to form part of a hexagonal shape (Figure 5a). In Changsha, the distribution of “central parks” does not conform to the hexagonal shape, which also leads to another problem: the theory of central place is a theory for commercial services, although the service objects of commercial centers and parks are both residents, the logic of the construction of commercial centers and parks is indeed different. For example, the construction of parks will take more consideration of the natural geographical conditions, such as the distribution of rivers, lakes, cultural heritage, and post-industrial landscapes [38,39,40,41], which complicates the formation of a regular geometric pattern for the distribution of “center parks”.
Additionally, we found that for hierarchical structures, the enclave phenomenon of Level-1 parks’ advantage service areas is not significant. Taking Chaoyang Park and Olympic Forest Park as examples, our observations indicate that although these parks have large advantage service areas, their boundaries are clear and continuous. This suggests that residents’ choices for parks within the same level tend to be homogeneous based on accessibility.
We also found that when parks provide services to residents, they still adhere to core concepts of Central Place Theory, such as “hierarchy” and “centrality”, exhibiting characteristics where the higher the level, the fewer the park count. Urban parks exhibit a hierarchical effect when serving residents, which can be simply understood as the phenomenon where, regardless of how close a park is to a residential area, its number of visitors may still be dominated by a larger, more distant park, thereby establishing the irreplaceability of the larger park. For example, Olympic Forest Park offers a full 10 km of plastic running path, which most other parks do not have. Furthermore, the hierarchical phenomenon determined by park visitor numbers does not align with the government’s planned park types. For example, Taoranting Park and Temple of Heaven are both classified as historical and cultural parks by the government, but they belong to Level-1 and Level-2, respectively. In fact, this irreplaceability extends beyond urban parks. Recent studies have begun to explore the concept of “irreplaceability” in urban geography [42,43], which is often closely linked to the high demand for certain facilities and their limited availability [44].
Similarly, the results of our grading of park DIA also reveal some interesting results. For instance, Old Summer Palace, Temple of Heaven, and Summer Palace are among Beijing’s most well-known parks [45,46,47], yet our analysis indicates that these parks belong to different levels when it comes to providing recreational services to residents. Old Summer Palace is a Level-1 park, with a clear advantage service area, while Temple of Heaven is a Level-2 park, with its DIA significantly constrained by the nearby Taoranting Park. Even in Level-3 parks, the DIA of the Summer Palace is substantially reduced by other parks. This suggests that more residents in the vicinity of Old Summer Palace benefit from its recreational services, while Temple of Heaven Park and Summer Palace provide fewer such services to residents.
Although urban parks in both Beijing and Changsha align with the hierarchical structure of the Central Place Theory (CPT) model, they exhibit notable differences. In Beijing, first-tier parks are primarily dominated by major parks such as Olympic Forest Park and Chaoyang Park, with a relatively large DIA. In contrast, first-tier parks in Changsha are more fragmented. This discrepancy is likely closely related to urban planning and land use policies.
For instance, Beijing’s urban planning emphasizes functional zoning, with the central district primarily serving administrative functions [20]. As a result, large parks are concentrated in specific areas and play a significant role in providing ecological and recreational services. This has led to a tendency for urban residents to gravitate toward certain major parks. In comparison, Changsha’s urban expansion has been more balanced, featuring a greater number of small and medium-sized parks distributed throughout the city. Additionally, due to differences in population scale, Changsha does not have residential communities exceeding 300,000 residents, as seen in Beijing. Two super-large residential communities, Huilongguan and Tiantongyuan in Beijing, are respectively covered by the DIA of Olympic Forest Park and Chaoyang Park, despite the considerable distance between them. Consequently, the spatial distribution of first-tier parks’ DIA differs significantly between the two cities.
Moreover, in Changsha, park area and infrastructure have a strong positive correlation with the hierarchical levels, indicating that these two factors positively influence the attractiveness of parks. In contrast, Beijing’s park attributes do not significantly affect park classification. The factors influencing visitor numbers and DIA also differ across park levels. Existing research has shown that the correlation between park area and user numbers is not significant [34], and our findings in Beijing support this conclusion. Additionally, visitor numbers and DIA do not align, and the density of park visitors declines at varying rates with distance. This suggests that the factors influencing how parks serve the public are complex.
In addition to the six factors considered in this study, other elements, such as ticket prices, park reputation, and transportation accessibility [16,48,49], need to be quantified. Existing studies have begun to focus on the influence of external factors on park service areas. Research by Gou et al., based on mobile signaling data, indicates that population density and the number of commercial facilities significantly impact park service areas [16]. Furthermore, factors like human mobility characteristics and travel habits may also play a decisive role. Integrating park characteristics with external factors in a systematic way is essential for a more comprehensive understanding of the CPT model in parks. This is also a key aspect that this study aims to refine.
Compared to commercial centers, urban parks share a key common characteristic as well as a distinguishing feature. The common characteristic is that both commercial centers and urban parks provide services to urban residents. The distinguishing feature is that the development of commercial centers differs from that of parks. The location of commercial centers is primarily influenced by factors such as population density, transportation accessibility, and economic vitality et al. [50,51,52]. The development of urban parks with strong natural attributes usually depends on the city’s original natural geographical conditions (such as the distribution of water systems and lakes within the city) [53,54], while parks with strong cultural attributes depend on the location of cultural heritage sites [41,55].
The central place theory for urban parks holds significant practical implications for urban planners’ comprehension of citizens’ travel habits. More scholars are now analyzing the value of urban parks from the perspective of social equity [56]. In our study, we found the irreplaceability of Level-1 parks, which cannot be compensated simply by reducing travel distances. The construction costs of Level-1 parks differ substantially from those of small community parks. Therefore, it is crucial to plan the layout of Level-1 parks as reasonably as possible within the limited urban space to ensure social equity.

5. Conclusions

The primary objective of this study was to analyze the CPT patterns of urban parks. Using mobile signaling data as the core dataset, we delineated the service areas of urban parks in Beijing and Changsha and subsequently derived the DIA. Based on the DIA, we assessed the centrality and hierarchy of urban parks. Finally, we examined the factors influencing park hierarchy and the determinants of service area variations across different park levels. The key findings are as follows:
First, urban parks in both cities exhibit clear centrality and hierarchical structures, with the number of parks increasing as their hierarchical level decreases. Level-1 parks are the least numerous but exhibit the highest centrality. Most Level-1 parks have a larger and more intense service area than Level-2 parks. However, Beijing has fewer Level-1 parks than Changsha, and the top-ranked Level-1 parks in Beijing serve significantly larger areas than those in Changsha. This suggests that the DIA in Changsha is more fragmented. Additionally, the visitor density decay curves indicate that the rate at which service intensity declines with distance varies across parks, reflecting differentiation among them.
Second, the factors influencing park hierarchy differ between the two cities. In Changsha, park size and infrastructure are significant determinants of park hierarchy, whereas these factors do not exhibit statistical significance in Beijing. Similarly, the factors affecting park service areas and visitor numbers vary between the two cities. This finding suggests that the physical characteristics of parks influencing residents’ access to park services are not consistent across different urban contexts. Our findings of urban parks’ CPT patterns provide valuable insights for urban planning and park management. To enhance the efficiency and accessibility of urban parks, planners should consider both park attributes and external urban factors in decision-making. A well-structured park system can promote spatial equity by ensuring that recreational opportunities are not concentrated in a few high-level parks but are accessible to diverse urban populations. Additionally, improving connectivity between parks and surrounding urban areas can enhance residents’ travel convenience and optimize park utilization. By integrating data-driven approaches and comprehensive spatial planning, policymakers can create a more balanced and sustainable urban park network that better serves public needs.
Additionally, we found that the factors influencing urban park services and their CPT patterns are highly complex. Therefore, future research will consider incorporating additional factors that may influence the CPT patterns of urban parks. Additionally, by expanding data types and refining the specific purposes of recreational services, we aim to provide a deeper understanding of the CPT patterns in urban parks.

Author Contributions

Conceptualization, N.W. and H.Y. (Hang Yin); methodology, N.W., H.Y. (Hang Yin) and Z.M.; validation, N.W. and H.Y. (Hang Yin); formal analysis, H.Y. (Hang Yin); writing—original draft preparation, N.W. and K.T.; writing—review and editing, N.W. and L.X.; resources, D.Y., G.X. and H.Y. (Hongbin Yu); visualization, J.P. and J.Y.; supervision, H.Y. (Hang Yin) and N.W.; project administration, N.W. and Z.M. All authors have read and agreed to the published version of the manuscript.

Funding

The research is supported by the Research Foundation of the Department of Natural Resources of Hunan Province (Grant No. 20240104GH), Key Technologies Development and Demonstration of Country Spatial Planning and Observation Network (CSPON) System (Grant No. 2023ZRBSHZ072), Hunan Provincial Natural Science Foundation of China (Grant No. 2024JJ8324), and Hunan Provincial Natural Science Foundation of China (Grant No. 2025JJ80041).

Data Availability Statement

The original contributions presented in the study are included in the article, further inquiries can be directed to the corresponding author.

Conflicts of Interest

The authors declare no conflicts of interest.

References

  1. Dacey, M.F. The Geometry of Central Place Theory. Geogr. Ann. Ser. B Hum. Geogr. 1965, 47, 111–124. [Google Scholar]
  2. Cresswell, T. Place: An Introduction, 2nd ed.; John Wiley & Sons Inc.: New York, NY, USA, 2014; ISBN 9780470655627. [Google Scholar]
  3. Tammiksaar, E.; Jauhiainen, J.S.; Pae, T.; Ahas, R. Edgar Kant, Estonian Geography and the Reception of Walter Christaller’s Central Place Theory, 1933–1960. J. Hist. Geogr. 2018, 60, 77–88. [Google Scholar] [CrossRef]
  4. Setälä, H.; Francini, G.; Allen, J.A.; Jumpponen, A.; Hui, N.; Kotze, D.J. Urban Parks Provide Ecosystem Services by Retaining Metals and Nutrients in Soils. Environ. Pollut. 2017, 231, 451–461. [Google Scholar] [CrossRef] [PubMed]
  5. Buchel, S.; Frantzeskaki, N. Citizens’ Voice: A Case Study about Perceived Ecosystem Services by Urban Park Users in Rotterdam, the Netherlands. Ecosyst. Serv. 2015, 12, 169–177. [Google Scholar] [CrossRef]
  6. Kabisch, N.; Kraemer, R.; Brenck, M.E.; Haase, D.; Lausch, A.; Luttkus, M.L.; Mueller, T.; Remmler, P.; von Döhren, P.; Voigtländer, J.; et al. A Methodological Framework for the Assessment of Regulating and Recreational Ecosystem Services in Urban Parks under Heat and Drought Conditions. Ecosyst. People 2021, 17, 464–475. [Google Scholar] [CrossRef]
  7. Jameel, S.M.; Hussien, S.H. Urban Parks as a Green Enhancement of City Branding: Insights from Iraq. Cities 2023, 10, 107–122. [Google Scholar]
  8. Georgi, N.J.; Zafiriadis, K. The Impact of Park Trees on Microclimate in Urban Areas. Urban Ecosyst. 2006, 9, 195–209. [Google Scholar] [CrossRef]
  9. Palliwoda, J.; Kowarik, I.; von der Lippe, M. Human-Biodiversity Interactions in Urban Parks: The Species Level Matters. Landsc. Urban Plan. 2017, 157, 394–406. [Google Scholar] [CrossRef]
  10. Xu, L.; Yin, H.; Fang, J. Evaluating the Supply-Demand Relationship for Urban Green Parks in Beijing from an Ecosystem Service Flow Perspective. Urban For. Urban Green. 2023, 85, 127974. [Google Scholar]
  11. Wang, D.; Brown, G.; Liu, Y. The Physical and Non-Physical Factors That Influence Perceived Access to Urban Parks. Landsc. Urban Plan. 2015, 133, 53–66. [Google Scholar] [CrossRef]
  12. Lee, G.; Hong, I. Measuring Spatial Accessibility in the Context of Spatial Disparity between Demand and Supply of Urban Park Service. Landsc. Urban Plan. 2013, 119, 85–90. [Google Scholar] [CrossRef]
  13. Kaźmierczak, A. The Contribution of Local Parks to Neighbourhood Social Ties. Landsc. Urban Plan. 2013, 109, 31–44. [Google Scholar] [CrossRef]
  14. Wright Wendel, H.E.; Zarger, R.K.; Mihelcic, J.R. Accessibility and Usability: Green Space Preferences, Perceptions, and Barriers in a Rapidly Urbanizing City in Latin America. Landsc. Urban Plan. 2012, 107, 272–282. [Google Scholar] [CrossRef]
  15. Guan, C.; Song, J.; Keith, M.; Akiyama, Y.; Shibasaki, R.; Sato, T. Delineating Urban Park Catchment Areas Using Mobile Phone Data: A Case Study of Tokyo. Comput. Environ. Urban Syst. 2020, 81, 101474. [Google Scholar] [CrossRef]
  16. Guo, S.; Yang, G.; Pei, T.; Ma, T.; Song, C.; Shu, H.; Du, Y.; Zhou, C. Analysis of Factors Affecting Urban Park Service Area in Beijing: Perspectives from Multi-Source Geographic Data. Landsc. Urban Plan. 2019, 181, 103–117. [Google Scholar] [CrossRef]
  17. Chen, Y.; Liu, X.; Gao, W.; Wang, R.Y.; Li, Y.; Tu, W. Emerging Social Media Data on Measuring Urban Park Use. Urban For. Urban Green. 2018, 31, 130–141. [Google Scholar] [CrossRef]
  18. Ullah, H.; Wan, W.; Haidery, S.A.; Khan, N.U.; Ebrahimpour, Z.; Muzahid, A.A.M. Spatiotemporal Patterns of Visitors in Urban Green Parks by Mining Social Media Big Data Based upon WHO Reports. IEEE Access 2020, 8, 39197–39211. [Google Scholar] [CrossRef]
  19. Donahue, M.L.; Keeler, B.L.; Wood, S.A.; Fisher, D.M.; Hamstead, Z.A.; McPhearson, T. Using Social Media to Understand Drivers of Urban Park Visitation in the Twin Cities, MN. Landsc. Urban Plan. 2018, 175, 1–10. [Google Scholar] [CrossRef]
  20. Gu, C.; Wei, Y.D.; Cook, I.G. Planning Beijing: Socialist City, Transitional City, and Global City. Urban Geogr. 2015, 36, 905–926. [Google Scholar] [CrossRef]
  21. Gan, L.; Feng, C. Study on the Spatial Differentiation and Temporal Evolution of Urban Land Price: Evidence from Beijing. In Proceedings of the 19th International Symposium on Advancement of Construction Management and Real Estate; Springer: Berlin/Heidelberg, Germany, 2015; pp. 693–706. [Google Scholar]
  22. Tian, G.; Wu, J.; Yang, Z. Spatial Pattern of Urban Functions in the Beijing Metropolitan Region. Habitat Int. 2010, 34, 249–255. [Google Scholar] [CrossRef]
  23. Ma, M.; Lu, Z.; Sun, Y. Population Growth, Urban Sprawl and Landscape Integrity of Beijing City. Int. J. Sustain. Dev. World Ecol. 2008, 15, 326–330. [Google Scholar]
  24. Zhou, G.; He, Y. The Influencing Factors of Urban Land Expansion in Changsha. J. Geogr. Sci. 2007, 17, 487–499. [Google Scholar]
  25. The People’s Government of Beijing Municipality. Beijing Municipal Master Plan (2016–2035); The People’s Government of Beijing Municipality: Beijing, China, 2017. Available online: https://www.beijing.gov.cn/gongkai/guihua/wngh/cqgh/201907/t20190701_100008.html (accessed on 21 February 2025).
  26. The People’s Government of Hunan Province. Changsha Municipal Plan (2003–2020) (2014 Revision); The People’s Government of Hunan Province: Changsha, China, 2014. Available online: https://www.hunan.gov.cn/xxgk/fzgh/201408/t20140806_4902778.html (accessed on 21 February 2025).
  27. GB/T51346-2019; Green Space Standard for Urban Systematic Planning. China Architecture & Building Press: Beijing, China, 2019.
  28. Thatcher, J.; Shears, A.; Eckert, J. Thinking Big Data in Geography: New Regimes, New Research; University of Nebraska Press: Lincoln, NE, USA, 2018; ISBN 1496205375. [Google Scholar]
  29. Kandt, J.; Batty, M. Smart Cities, Big Data and Urban Policy: Towards Urban Analytics for the Long Run. Cities 2021, 109, 102992. [Google Scholar]
  30. Hao, J.; Zhu, J.; Zhong, R. The Rise of Big Data on Urban Studies and Planning Practices in China: Review and Open Research Issues. J. Urban Manag. 2015, 4, 92–124. [Google Scholar]
  31. Van Meeteren, M.; Poorthuis, A. Christaller and “Big Data”: Recalibrating Central Place Theory via the Geoweb. Urban Geogr. 2018, 39, 122–148. [Google Scholar]
  32. Lyu, F.; Zhang, L. Using Multi-Source Big Data to Understand the Factors Affecting Urban Park Use in Wuhan. Urban For. Urban Green. 2019, 43, 126367. [Google Scholar]
  33. Guo, H.; Luo, Z.; Li, M.; Kong, S.; Jiang, H. A Literature Review of Big Data-Based Urban Park Research in Visitor Dimension. Land 2022, 11, 864. [Google Scholar] [CrossRef]
  34. Zhai, Y.; Wu, H.; Fan, H.; Wang, D. Using Mobile Signaling Data to Exam Urban Park Service Radius in Shanghai: Methods and Limitations. Comput. Environ. Urban Syst. 2018, 71, 27–40. [Google Scholar]
  35. Taylor, P.J. Urban Economics in Thrall to Christaller: A Misguided Search for City Hierarchies in External Urban Relations. Environ. Plan. A 2009, 41, 2550–2555. [Google Scholar]
  36. Ozuduru, B.H.; Webster, C.J.; Chiaradia, A.J.F.; Yucesoy, E. Associating Street-Network Centrality with Spontaneous and Planned Subcentres. Urban Stud. 2021, 58, 2059–2078. [Google Scholar]
  37. Openshaw, S.; Veneris, Y. Numerical Experiments with Central Place Theory and Spatial Interaction Modelling. Environ. Plan. A 2003, 35, 1389–1403. [Google Scholar]
  38. Biernacka, M.; Kronenberg, J.; Łaszkiewicz, E. An Integrated System of Monitoring the Availability, Accessibility and Attractiveness of Urban Parks and Green Squares. Appl. Geogr. 2020, 116, 102152. [Google Scholar]
  39. Stoianov, I.; Chapra, S.; Maksimovic, C. A Framework Linking Urban Park Land Use with Pond Water Quality. Urban Water 2000, 2, 47–62. [Google Scholar]
  40. González, P.A. Cultural Parks and National Heritage Areas: Assembling Cultural Heritage, Development and Spatial Planning; Cambridge Scholars Publishing: Newcastle, UK, 2013; ISBN 1443854123. [Google Scholar]
  41. Cranz, G.; Boland, M. Defining the Sustainable Park: A Fifth Model for Urban Parks. Landsc. J. 2004, 23, 102–120. [Google Scholar]
  42. Gu, X.; Tao, S.; Dai, B. Spatial Accessibility of Country Parks in Shanghai, China. Urban For. Urban Green. 2017, 27, 373–382. [Google Scholar] [CrossRef]
  43. Wu, C.; Gao, F.; Ye, X.; He, Q. Unraveling the Impact of Urban Form on Location’s Irreplaceability: An Analysis from the Perspective of Spatiotemporal Heterogeneity. Trans. GIS 2024, 28, 701–725. [Google Scholar]
  44. Yuan, F.; Wei, Y.D.; Wu, J. Amenity Effects of Urban Facilities on Housing Prices in China: Accessibility, Scarcity, and Urban Spaces. Cities 2020, 96, 102433. [Google Scholar] [CrossRef]
  45. Su, M.M.; Wall, G. Exploring the Shared Use of World Heritage Sites: Residents and Domestic Tourists’ Use and Perceptions of the Summer Palace in Beijing. Int. J. Tour. Res. 2015, 17, 591–601. [Google Scholar]
  46. Su, M.M.; Wall, G. Residents’ Recreational and Social Use of and Perspectives on a World Heritage Site: Temple of Heaven, Beijing, China. J. Tour. Cult. Change 2017, 15, 15–36. [Google Scholar]
  47. Wang, N.; Lew, A.; Yu, L.; Ap, J.; Zhang, G. Chinese Vernacular Heritage as a Tourist Attraction: The Case of Beijing. In Tourism in China; Lew, A., Yu, L., Ap, J., Zhang, G., Eds.; Routledge: London, UK, 2003; pp. 51–62. [Google Scholar]
  48. Mohamed, A.A.; Kronenberg, J. Users’ Experiences of Park Accessibility and Attractiveness Based on Online Review Analytics. Sci. Rep. 2025, 15, 4268. [Google Scholar]
  49. Zhang, S.; Zhou, W. Recreational Visits to Urban Parks and Factors Affecting Park Visits: Evidence from Geotagged Social Media Data. Landsc. Urban Plan. 2018, 180, 27–35. [Google Scholar] [CrossRef]
  50. Wang, L.; Fan, H.; Wang, Y. Site Selection of Retail Shops Based on Spatial Accessibility and Hybrid BP Neural Network. ISPRS Int. J. Geo-Inf. 2018, 7, 202. [Google Scholar] [CrossRef]
  51. Hao, F.; Yang, Y.; Wang, S. Patterns of Location and Other Determinants of Retail Stores in Urban Commercial Districts in Changchun, China. Complexity 2021, 2021, 8873374. [Google Scholar] [CrossRef]
  52. Sevtsuk, A. Location and Agglomeration: The Distribution of Retail and Food Businesses in Dense Urban Environments. J. Plan. Educ. Res. 2014, 34, 374–393. [Google Scholar] [CrossRef]
  53. Walmsley, A. Greenways and the Making of Urban Form. Landsc. Urban Plan. 1995, 33, 81–127. [Google Scholar] [CrossRef]
  54. Gorgorova, Y.; Sarkisyants, V.M.G.; Sotnikova, M.A. The Principles of Sustainable Development of the Architectural Space of Linear Parks. In Proceedings of the IOP Conference Series: Materials Science and Engineering; IOP Publishing: Bristol, UK, 2020; Volume 753, p. 42025. [Google Scholar]
  55. Fischer, L.K.; Honold, J.; Botzat, A.; Brinkmeyer, D.; Cvejić, R.; Delshammar, T.; Elands, B.; Haase, D.; Kabisch, N.; Karle, S.J. Recreational Ecosystem Services in European Cities: Sociocultural and Geographical Contexts Matter for Park Use. Ecosyst. Serv. 2018, 31, 455–467. [Google Scholar] [CrossRef]
  56. Xiao, Y.; Wang, Z.; Li, Z.; Tang, Z. An Assessment of Urban Park Access in Shanghai—Implications for the Social Equity in Urban China. Landsc. Urban Plan. 2017, 157, 383–393. [Google Scholar] [CrossRef]
Figure 1. Study area.
Land 14 00673 g001
Figure 2. Visitor source hotspots in Beijing & Changsha parks (city residents), (a) map of visitor source hotspots in all Beijing parks; (b) visitor source hotspots in Chaoyang Park (case mapping); (c) map of visitor source hotspots in all Changsha parks; (d) visitor source hotspots in Martyrs’ Park (case mapping).
Land 14 00673 g002
Figure 3. Dominant influence areas for all parks in Beijing (a) and Changsha (b).
Land 14 00673 g003
Figure 4. The hierarchical structure of park service areas in Beijing. (a) Parks with DIA Level-1; (b) parks with DIA Level-2; (c) parks with DIA Level-3; (d) statistical information, including the number of parks and service areas for each level.
Land 14 00673 g004
Figure 5. Trends in visitor density with distance for each park in Beijing: (a) parks with DIA Level-1; (b) parks with DIA Level-2; (c) parks with DIA Level-3.
Land 14 00673 g005
Figure 6. The hierarchical structure of park service areas in Changsha. (a) Parks with DIA Level-1; (b) parks with DIA Level-2; (c) parks with DIA Level-3; (d) statistical information, including the number of parks and service areas for each level.
Land 14 00673 g006
Figure 7. Trends in visitor density with distance for each park in Changsha: (a) parks with DIA Level-1; (b) parks with DIA Level-2; (c) parks with DIA Level-3.
Land 14 00673 g007
Figure 8. Influences of park characteristics for grading in Beijing. (a) Correlation coefficients of park attributes; (b) list of p-value details; (c) overview parameters logistic regression models.
Land 14 00673 g008
Figure 9. Influences of park characteristics for grading in Changsha. (a) Correlation coefficients of park attributes; (b) list of p-value details; (c) overview parameters logistic regression models.
Land 14 00673 g009
Figure 10. Boxplot of park visitors and service area for Level-1 parks versus park attributes. “+” represents outliers that fall beyond 1.5 times the interquartile range; “−” indicates that the sample size is 1 or all values are identical, resulting in a collapsed box; the color green represents visitor numbers; the color blue represents service area.
Land 14 00673 g010
Figure 11. Boxplot of park visitors and service area for Level-2 parks versus park attributes. “+” represents outliers that fall beyond 1.5 times the interquartile range; “−” indicates that the sample size is 1 or all values are identical, resulting in a collapsed box; the color green represents visitor numbers; the color blue represents service area.
Land 14 00673 g011
Figure 12. Boxplot of park visitors and service area for Level-3 parks versus park attributes. “+” represents outliers that fall beyond 1.5 times the interquartile range; “−” indicates that the sample size is 1 or all values are identical, resulting in a collapsed box; the color green represents visitor numbers; the color blue represents service area.
Land 14 00673 g012
Table 1. Grading criteria of park properties.
PropertiesGradingGrading Basis
Area① 1–10 ha; ② 10–50 ha; ③ >50 ha[27]
Facilities① support large-scale outdoor activities;
② support regular sports like basketball
③ basic facilities
Downloaded through an API from https://lbs.amap.com/
(accessed on 3 March 2020)
Lake① with lake; ② without lakeInterpretation from remote sensing data
Cultural heritage① heritage-less; ② regular heritage; ③ history relics; ④ lager-scale former industrial sitesObtained from the Internet
Vegetation cover① low; ② medium–low; ③ medium; ④ medium–high; ⑤ highExtracted from remote sensing data
LocationFive categories from Second to Sixth Ring RoadThe centroid location of parks
Disclaimer/Publisher’s Note: The statements, opinions and data contained in all publications are solely those of the individual author(s) and contributor(s) and not of MDPI and/or the editor(s). MDPI and/or the editor(s) disclaim responsibility for any injury to people or property resulting from any ideas, methods, instructions or products referred to in the content.

