Article

Does Proximity Enhance Compliance? Investigating the Geographical Distance Decay in Vertical Supervision of Non-Grain Cultivation on China’s Arable Land?

College of Economics, Sichuan Agricultural University, Chengdu 611130, China
*
Author to whom correspondence should be addressed.
Land 2025, 14(4), 701; https://doi.org/10.3390/land14040701
Submission received: 6 March 2025 / Revised: 24 March 2025 / Accepted: 24 March 2025 / Published: 26 March 2025

Abstract

:
Economic geography suggests that geographical distance tends to weaken supervisory effectiveness, giving rise to a “distance decay effect”. However, in the context of vertical governance by the central government, local authorities tend to intensify their efforts to enhance performance. The existence of the “distance decay effect” under such circumstances requires further investigation. This paper considers the establishment of China’s National Agency of Natural Resources Supervision as a quasi-natural experiment, utilizing panel data from 2015 to 2020 for cities and employing a continuous DID model to explore how geographical distance under vertical governance affects the supervisory effectiveness of non-grain cultivation on arable land. This research indicates that the supervisory effectiveness of the supervisory agency on the non-grain cultivation of arable land tends to decrease with an increase in geographical distance. This negative impact is achieved through an escalation in direct supervisory costs. Further analysis reveals that the diminishing effect of geographical distance on supervisory effectiveness intensifies as the opportunity costs of local government response increase. The above study provides fresh evidence for the “distance decay effect” on supervisory effectiveness, which is beneficial for the central government in optimizing control measures to prevent the phenomenon of non-grain cultivation on arable land.

1. Introduction

The relationship between the central and local governments is a systemic root cause for understanding deviations between central policy objectives and local policy implementation outcomes. To prevent policy execution discrepancies arising from divergent central and local interests, the central government typically dispatches supervisory agencies for vertical oversight of local governance, addressing issues such as corruption control and land use [1,2]. The effectiveness of supervisory agencies on local governments is often influenced by multiple factors, with geographical distance being a focal point. As the geographical distance between supervisory agencies and their targets increases, issues such as information asymmetry and escalating supervisory costs emerge [3], gradually weakening their interaction and consequently diminishing supervisory effectiveness—a phenomenon known as the “distance decay effect”. However, where lower-level governments are subordinate leaders in vertical governance, their promotions are entirely determined by higher-level governments. Coupled with intense competition among local officials for promotions, lower-level governments tend to intensify their efforts to enhance their job performance [4]. This strategic move aims to mitigate the adverse effects of weakened political advantages due to geographical distance on officials’ promotions. Vertical governance may reduce the negative impact of geographical distance on the supervisory effectiveness of local governments. The actual manifestation of the “distance decay effect” requires further empirical testing.
Since initiating the reform and opening-up policies, China has consistently emphasized the protection of arable land, implementing a series of policies, including the “combination punch” of measures like the “Land Management Law”. However, as economic and social development has progressed comprehensively, the deepening contradictions between this development and arable land protection, coupled with the escalation of extreme climate events and international turbulence, have led to continuous deterioration in China’s food security situation. Arable land protection has evolved from explicit supervision strictly adhering to absolute quantities in the past to implicit requirements focused on preventing non-grain cultivation. In 2020, China issued the “Opinions on Preventing Non-grain Cultivation to Stabilize Grain Production1”, emphasizing the resolute prevention of the trend toward arable land “non-grain cultivation” to safeguard the nation’s vital food security. The No. 1 Central Document in 2023 also explicitly outlined the need to “comprehensively strengthen the foundation of food security and enhance the material basis for storing grain in the land and utilizing technology”. It is evident that ensuring food security has become a top priority in China’s current and future work related to rural areas. However, China’s current legal framework regarding “non-grain cultivation” is seriously lacking. The central government often intervenes vertically in local grain production through supervisory discussions, creating downward pressure but needing more stable legal efficacy [5], which hinders the reinforcement of local government responsibilities for grain production. Therefore, addressing how to effectively prevent “non-grain cultivation” through central government intervention without a well-established legal system becomes crucial in ensuring China’s food security.
Establishing China’s national natural resources inspection system provides an apt research context for investigating the issues above. In 2006, China initiated the national land inspection system, establishing the national land supervisory agency under the Ministry of Land and Resources. Nine National Land Supervisory Agencies were dispatched to oversee the land use and management practices of provincial, autonomous regional, and directly governed municipalities, as well as planned single-city governments. In September 2018, China upgraded the National Land Supervision system to the Natural Resources Supervision system, with the National Land Supervisory Agency as the National Natural Resources Supervisory Agency. The latter inherited the functions and organizational structure of the former, directly engaging in supervisory discussions with local governments regarding land utilization and management.
Furthermore, personnel and resources are centrally allocated, facilitating the inspection bureau’s independence from local interference. For the supervisory agency, there is a risk of information distortion in the land use data reported by local governments. A more prudent supervisory approach involves on-site inspections. However, the decision-making and execution intensity of on-site inspections must consider the variations in inspection costs induced by geographical distance and transportation convenience. When law enforcement resources are limited, the supervisory agency may prioritize areas closer to its base for on-site inspections, particularly in rural regions with poorer transportation accessibility [6]. Thus, it becomes apparent that the “distance increase effect” in the direct supervisory costs incurred by the supervisory agency leads to the “distance decay effect” in supervisory intensity. This dynamic results in lesser supervisory scrutiny in more distant areas, exacerbating non-grain cultivation issues on arable land and ultimately generating the “distance decay effect” on supervisory effectiveness.
In addition to the supervisory intensity exerted by the supervisory agency, the responsiveness of local governments to supervisory agencies is another crucial factor influencing the effectiveness of non-grain cultivation supervision on arable land. The degree of responsiveness from local governments generally hinges on the resulting loss of benefits incurred by discontinuing non-grain cultivation on arable land, collectively termed response opportunity costs. These are the indirect costs of supervision. Depending on the type of benefits sacrificed by local governments in response to supervision, response opportunity costs can be categorized into economic opportunity costs (such as a decline in the overall agricultural output due to switching from economic crops to food crops) and social opportunity costs (such as increased local governance costs and potential impacts on ethnic unity stability resulting from shifts in planting structures in ethnic regions). When local governments face excessively high economic or social opportunity costs in responding to supervision, their responsiveness significantly decreases, leading to a corresponding weakening of the supervisory agency’s supervisory effectiveness in curbing non-grain cultivation on arable land. Hence, it is evident that the impact of supervisory distance on the efficacy of non-grain cultivation supervision is also subject to the modulation of local government response opportunity costs.
According to the above analysis, the impact of supervisory distance on the effectiveness of non-grain cultivation supervision on arable land may not only be influenced by the “distance decay effect” of supervisory agency supervisory intensity but also be subject to modulation by local government response opportunity costs. However, these logical inferences urgently require rigorous empirical analysis for validation. Specifically, this paper treats the establishment of the National Natural Resources Supervisory Agency as a quasi-natural experiment, utilizing panel data from 2015 to 2020 for cities at the prefecture level and employing a continuous DID (difference-in-differences) approach to investigate the influence of geographical distance on the supervisory effectiveness of non-grain cultivation and its underlying mechanisms. Simultaneously, this paper examines the moderating effect of local government response opportunity costs. The potential marginal contributions of this paper are twofold: First, by focusing on prefecture-level cities using the establishment of the National Natural Resources Supervisory Agency as a quasi-natural experiment, this paper narrows its scope to a more homogeneous policy implementation environment compared to provincial-level administrative regions. This approach aids in better controlling for unobservable factors at the prefecture level that do not change over time, providing a more accurate identification of the causal relationship between geographical distance and supervisory effectiveness. It offers more scientifically rigorous evidence for the “distance decay effect” on supervisory effectiveness. Second, from the dual perspectives of supervisory direct and opportunity costs, this paper identifies the direct cost “distance decay effect” as a channel through which geographical distance affects supervisory effectiveness. It further discovers that the magnitude of this effect is influenced by local government response opportunity costs, enhancing our understanding of the “distance decay effect” on supervisory effectiveness. The findings of this paper provide decision-making references for the central government to optimize arable land supervisory measures, innovate the application of supervisory tools, and formulate differentiated policies for non-grain cultivation on arable land. Figure 1 shows the distribution and jurisdictional scope of the National Natural Resources Supervisory Agency.
The remaining sections of this paper are as follows: Section 2 presents literature review, Section 3 presents theoretical analysis and research hypotheses, Section 4 outlines materials and methods, Section 5 reports results, Section 6 reports conclusions and discussion, and finally, this paper concludes with Section 7, providing limitations and future recommendations.

2. Literature Review

2.1. Factors Affecting Non-Grain Cultivation on Arable Land

The existing literature predominantly examines the formation mechanisms of farmland non-grain cultivation from the perspectives of economic incentives and policy constraints [7,8]. At the economic incentive level, the disparity in planting profits is identified as the primary driver of non-grain cultivation. Zhang et al. found that farmers exhibit significant non-grain cultivation tendencies due to the high costs and low returns of grain cultivation [9]. The higher the proportion of cash crop income in total household income, the more likely farmers are to make non-grain cultivation decisions. Zhao further quantified the impact of price signals, showing through a binary logistic model that a 1 yuan/kg increase in cash crop prices raises the probability of non-grain cultivation decisions by 10.10% [10]. Additionally, differences in land transfer markets play a crucial role. Zhao et al. used provincial panel data from 2000 to 2020 in China to reveal a significant correlation between the development level of land transfer markets and non-grain cultivation, with larger transfer scales leading to more pronounced non-grain cultivation tendencies [11]. At the policy constraint level, existing studies confirm the inhibitory effect of policy constraints on non-grain cultivation [12]. The essence of institutions lies in enforcement, and ensuring policy implementation is key to realizing policy value [13]. However, conflicts of interest between local officials and the central government often lead to deviations between policy implementation and objectives. Yang observed significant gaps between local government enforcement and policy texts when analyzing the “Three-Right-Division” Policy, creating opportunities for speculation and frequent non-grain cultivation in policy implementation areas [14]. Moreover, from the perspective of policy constraints on individual farmers, China lacks clear prohibitions and penalties [15], resulting in limited policy effectiveness in constraining smallholder farmers. Smallholders continue to choose higher-profit cash crops under economic incentives, contributing to farmland non-grain cultivation.

2.2. Impact of Land Regulation Policies on Non-Grain Cultivation on Arable Land

In recent years, China has implemented a series of land regulation policies to address issues such as food security [16]. These include the Cultivated Land Balance Policy [17], the Permanent Basic Farmland Protection System [18], and the High-Standard Farmland Construction Program [19]. Existing research has extensively examined the impact of land regulation policies on non-grain cultivation. Most scholars affirm the inhibitory effect of these policies on non-grain cultivation. For instance, Zhao et al. used provincial panel data from 2003 to 2008 to evaluate the Land Supervision System, finding that cultivated land area increased by an average of 12% annually after the system’s implementation, effectively supporting grain production [20]. Similarly, Yan et al. analyzed satellite remote sensing data from 109 high-standard farmland projects in Henan Province, revealing that average farmland productivity increased by 145 kg/mu after the construction of high-standard farmland [21]. However, a minority of scholars remain skeptical about the effectiveness of land regulation policies. Zheng et al. argue that the lack of oversight during the implementation of land protection policies can lead to rent-seeking behavior, resulting in the failure of government efforts to protect land [22].

2.3. Impact of Geographic Distance on Policy Effectiveness

The impact of geographic distance on policy effectiveness has been discussed from multiple perspectives in academia. Some studies suggest that geographic distance weakens policy implementation. For instance, Chen et al. found that villages farther from urban areas in Shandong Province, China, faced a 23% higher risk of seasonal farmland abandonment compared to villages near cities, indicating that geographic distance increases information transmission costs and undermines the effectiveness of land intensification policies [23]. Similarly, Shi and Hu examined how the distance between governments and firms affects economic activities, revealing that companies located farther from environmental regulatory agencies emitted more sulfur dioxide [24]. However, other studies highlight that geographic distance can generate positive policy incentives. Zhang et al. developed a global value chain cooperation model and found an inverted U-shaped relationship between geographic distance and policy coordination [25]. When the distance between two economies is below a critical threshold, increased distance can encourage firms to rely more on policy-coordinated value chain division, thereby deepening cooperation. Lu et al. argued that after government relocation increased the distance between firms and government agencies, firms actively enhanced their policy attention, leading to higher tax rebate benefits [26]. This suggests that information barriers caused by distance may incentivize market actors to improve their policy responsiveness. Additionally, Jin and Chen used environmental regulatory data from China to show that pollution removal rates decreased by 12% for firms located more than 20 km from environmental bureaus [27]. However, digital regulatory technologies completely eliminated this distance decay effect, demonstrating that technological innovation can reshape the role of geographic distance in policy effectiveness.
Existing studies have confirmed that geographic distance is a critical variable influencing policy effectiveness, but no consensus has been reached, and the mechanisms through which geographic distance affects policy outcomes remain unclear. Furthermore, while the literature predominantly focuses on the “distance decay effect” in horizontal governance, it overlooks the potential counteracting effects of performance competition among local governments under central vertical supervision. This gap presents an opportunity for this study to establish a theoretical framework integrating geographical distance, cost, and non-grain cultivation to analyze how geographical distance under vertical governance affects the supervisory effectiveness of non-grain cultivation on arable land.

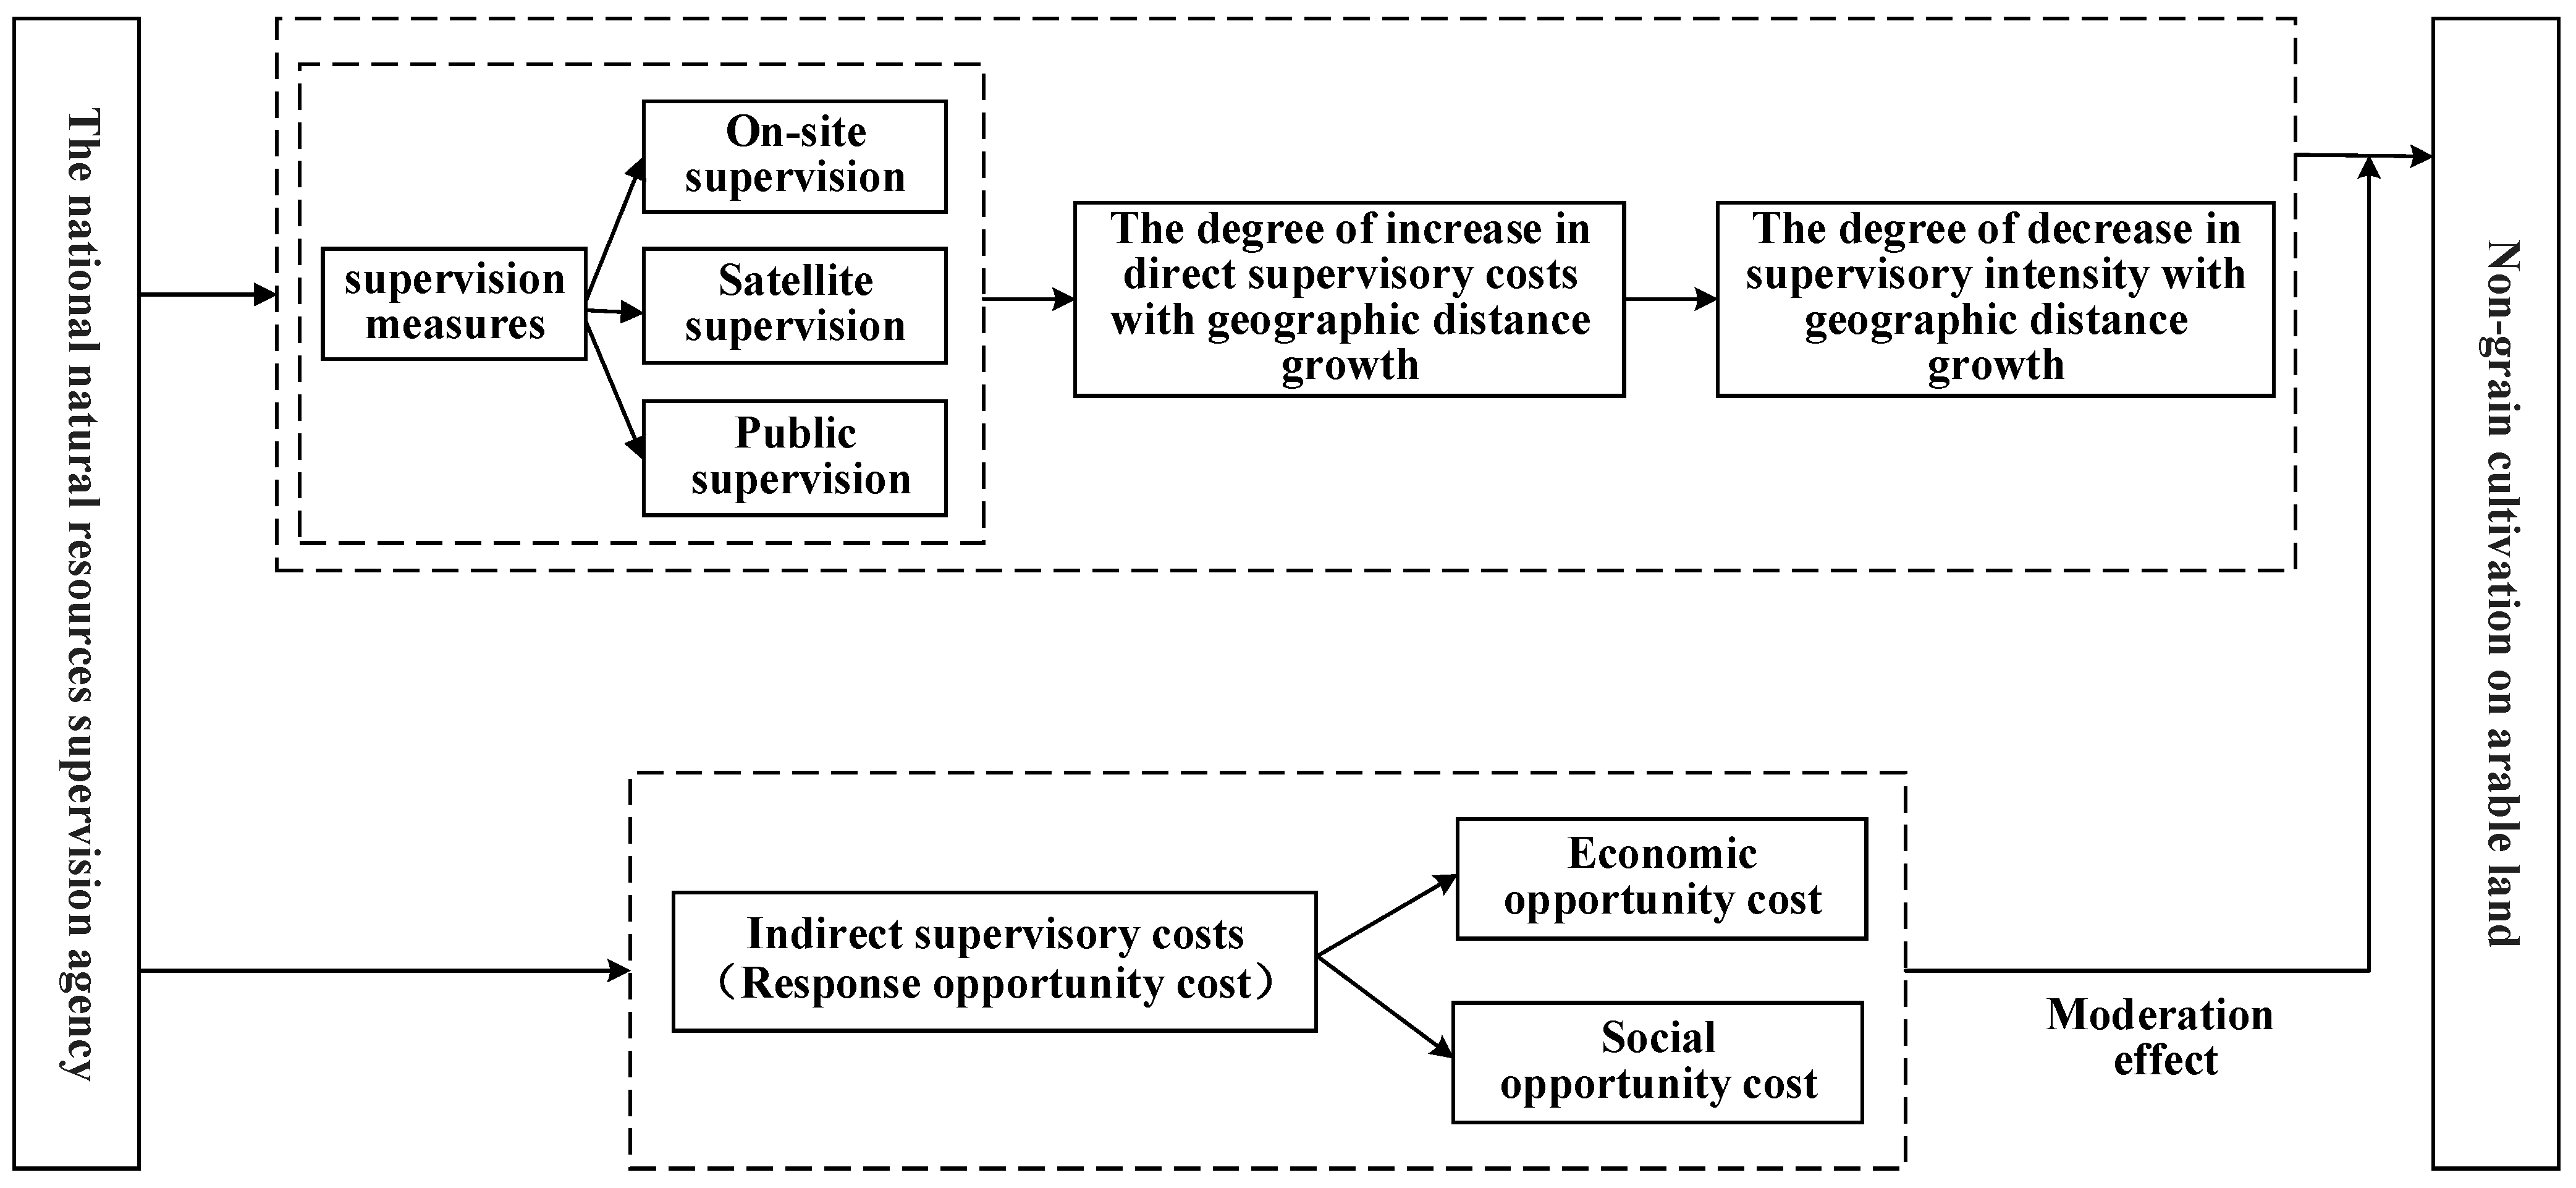
3. Theoretical Analysis and Research Hypotheses

For the National Natural Resources Supervisory Agency, the information provided by local governments is limited and often fails to reflect the actual land use situation. The supervisory agency needs to conduct routine inspections in local areas every year to obtain more detailed land use information. Due to constraints in law enforcement resources, the administration prefers selecting cities at the prefecture level that are closer in proximity for inspections, which leads to less supervisory oversight and higher levels of non-grain cultivation in areas that are farther away, indicating the presence of a “distance decay effect” in supervisory effectiveness. The main reason for the administration’s choice is that geographical distance affects various costs incurred during the supervisory process. The farther the geographical distance, the higher the direct supervisory costs for the supervisory agency and the greater the difficulty in obtaining information [28], implying the existence of a “distance increase effect” on direct supervisory costs.
With technological advancements, the importance of satellite remote sensing monitoring, public supervision, and other supervisory methods in land use inspections is gradually becoming more apparent. The “Opinions on Strengthening Farmland Protection and Improving the Balance between Occupancy and Compensation” issued by the Central Committee of the Communist Party of China and the State Council emphasize the establishment of a shared responsibility measure, including public supervision2. Similarly, the “Opinions on Preventing Non-grain Cultivation on Farmland and Stabilizing Grain Production” from the State Council’s General Office suggest the comprehensive use of modern information technologies, such as satellite remote sensing, for semi-annual nationwide monitoring and evaluation of the grain cultivation situation, establishing a reporting measure for the situation of non-grain cultivation on arable land3. Establishing a multi-faceted supervision system that includes the government, the public, and non-governmental organizations can broaden the channels through which the supervisory agency obtains land use information, weakening the impact of geographical distance on the increase in direct supervisory costs [6], which implies that with the introduction of various supervisory methods, the degree of “distance increase” in the supervisory agency’s direct supervisory costs will decrease. Distant municipal governments can also receive adequate supervision, alleviating the positive correlation between geographical distance and non-grain cultivation on arable land, indirectly confirming the role of the supervisory agency’s direct supervisory costs. In summary, this paper suggests that geographical distance reduces the supervisory agency’s effectiveness in supervising non-grain cultivation on arable land by increasing direct supervisory costs and proposes the following hypotheses:
H1: 
The closer the geographical distance to the location of the supervisory agency, the lower the degree of non-grain cultivation on arable land in the prefecture-level cities, indicating the presence of a “distance decay effect” in supervisory effectiveness.
H2: 
The weakening effect of geographical distance on the supervisory agency’s effectiveness in preventing non-grain cultivation on arable land is primarily achieved through an increase in the agency’s direct supervisory costs.
In addition to the supervisory agency’s intensity, local governments’ responsiveness to supervision influences non-grain cultivation on arable land. The degree of local government response to supervision depends on the magnitude of response opportunity costs. If local governments sacrifice too much economic or social benefit when complying with supervision on planting food crops, their response to supervision may decrease, negatively impacting the supervisory agency’s effectiveness in preventing non-grain cultivation on arable land. For local governments with similar supervisory distances, the variation in the efficacy of non-grain cultivation supervision is primarily determined by the level of response, varying due to differences in local government response opportunity costs. Based on this, the following hypothesis is proposed:
H3: 
The negative impact of geographical distance on the supervisory agency’s supervision of non-grain cultivation on arable land is subject to the moderating effect of local government response opportunity costs.
The schematic diagram of the mechanism is in Figure 2.

4. Materials and Methods

4.1. Model Specification

This article regards the establishment of the National Natural Resources Supervisory Agency as a quasi-natural experiment, utilizing the difference-in-differences (DID) method to explore the impact of geographical distance on the supervisory effectiveness of the administration concerning non-grain cultivation on arable land. In contrast to binary DID, continuous DID captures variations in supervisory effectiveness caused by subtle changes in geographical distance and mitigates biases introduced by the subjective assignment of experimental and control groups [29]. Therefore, this paper employs continuous DID as the benchmark regression model, with the specific formula outlined below:
Y it = β 0 + β 1 Post t × Distance i + θ Control i × α t + γ i + α t + ε it
Among these, Y it represents the extent of non-grain cultivation on arable land in the city i during year t . The term Post t serves as a temporal dummy variable indicating the period before and after the establishment of the National Natural Resources Supervisory Agency. Its value is set to 0 for years before the establishment (Year < 2019) and 1 for years after that (Year ≥ 2019). Distance i denotes the continuous distance from the National Natural Resources Supervisory Agency headquarters to the municipal governments within its jurisdiction. Using this distance as a core explanatory variable is essential because the supervisory agency is responsible for supervising the land use management of municipal governments within its jurisdiction, and it conducts discussions with municipal governments regarding prominent issues, such as non-grain cultivation on arable land, identified during inspections4. Control i represents other control variables. Given that post-control variables may compromise the consistency of coefficient estimates, this paper follows the approach of Li et al. [30]. It introduces interaction terms between pre-control variables and time-fixed effects to control for potential differences in time trends among prefecture-level cities before policy implementation. γ i and α t , respectively, denote city-fixed effects and time-fixed effects, controlling for factors at the regional and temporal levels that do not vary over time and across regions. β 0 is the constant term, and θ represents the regression coefficients for control variables. The coefficient of interest for this paper is β 1 , which indicates the pure effect of geographic distance on the supervisory agency’s supervisory effectiveness regarding non-grain cultivation on arable land. When β 1 is greater than 0, it suggests that geographic distance weakens the supervisory agency’s supervisory effectiveness on non-grain cultivation of arable land; conversely, it strengthens the supervisory effectiveness when β 1 is less than 0. ε it represents the random disturbance term.

4.2. Variable Selection

4.2.1. The Dependent Variable

This paper’s dependent variable is non-grain cultivation on arable land. When calculating non-grain cultivation, scholars use various approaches, with some representing it as the proportion of non-grain crop sown area to total arable land area [31], while others use the proportion of non-grain crop sown area to total crop sown area [32]. Compared to the total arable land area, the total crop sown area better reflects the actual utilization efficiency of arable land. Additionally, considering the possibility of multiple cropping cycles for food crops, representing non-grain cultivation as a proportion of total arable land area may introduce bias. Therefore, correction using a multiple cropping index is necessary. Due to limitations in the availability and accuracy of multiple cropping index data, this paper ultimately adopts the method employed by Zhang et al. [31], using the proportion of non-grain crop sown area to total crop sown area to depict the non-grain cultivation on arable land at the prefecture-level city level.

4.2.2. The Core Explanatory Variable

The central explanatory variable in this paper is the interaction between policy and geographic distance. The National Natural Resources Supervisory Agency was established on 11 September 20185, a time when many late-spring crops were already planted, minimizing the immediate influence of the policy on the planting structure for that year. Therefore, this paper assigns values to the time dummy variable around the establishment of the National Natural Resources Supervisory Agency according to the following rule: when Year < 2019, the variable “Policy” takes the value of 0; otherwise, it takes the value of 1. As per the supervision of the National Natural Resources Supervisory Agency, the administration oversees different prefecture-level cities (Appendix A). The geographic distance is calculated based on the latitude and longitude of the supervisory agency headquarters and the municipal governments within its jurisdiction.

4.2.3. Control Variables

Previous research indicates that economic growth, population changes, government policies, and natural conditions influence land use patterns [33,34,35]. Therefore, this paper selects nine control variables from socio-economic and meteorology/geography perspectives. The socio-economic control variables include the agricultural economic level, represented by the logarithm of the ratio of the value-added of the primary industry to regional GDP; population situation, expressed by the logarithm of the urbanization rate; fiscal decentralization level, obtained by taking the logarithm of the ratio of municipal fiscal general budget revenue to fiscal general budget expenditure; agricultural production condition, represented by the logarithm of effective irrigated area. The meteorological/geography control variables include five variables: annual average temperature, the square of annual average temperature, annual average rainfall, the square of annual average rainfall, and elevation. Additionally, this paper incorporates city-specific and year dummy variables to account for the potential influences of omitted variables on the research results.

4.3. Data Sources

This paper’s initial research cohort comprises 270 prefecture-level cities across China from 2015 to 20206. The latitude and longitude data for the National Natural Resources Supervisory Agency headquarters and municipal governments were obtained using measurements from Baidu Maps [36]. Annual average temperature data were calculated from the National Meteorological Science Data Sharing Service Platform7. Annual average precipitation data were sourced from the National Meteorological Science Data Sharing Service Platform8. Elevation data were derived from the ASTER Global Digital Elevation Model, providing a global 30 m resolution digital elevation model (DEM)9. The remaining data were obtained from the EPS database10, China Urban Statistical Yearbook, China Regional Statistical Yearbook, and statistical yearbooks and bulletins from various prefecture-level cities. Missing values were imputed using linear interpolation, and to address heteroscedasticity concerns, some variables underwent a logarithmic transformation. A 1% winsorization was applied to all continuous variables to mitigate the impact of outliers. Descriptive statistics for the main variables are presented in Table 1. This paper used Stata.16 to process the data. Stata.16 is equipped with efficient panel data management capabilities, a rich library of econometric models, and a reproducible analytical framework, which is suitable for complex econometric modeling needs.

4.4. Robustness Checks

Although the continuous difference-in-differences (DID) model can effectively mitigate endogeneity issues, this study needs to address the following potential confounding factors: First, other farmland protection policies implemented during the study period may generate synergistic or offsetting effects with the regulatory policies of inspection agencies, potentially leading to biased estimates of policy effectiveness. Second, unobserved variables may interfere with causal inference through spatial correlations. To enhance the reliability of our conclusions, this study will conduct robustness analyses using five types of tests: (1) parallel trend tests to ensure consistency between treatment and control groups before policy implementation; (2) substitution of geographic distance indicators to examine the sensitivity of variable construction; (3) controlling for other policy variables to isolate the effects of multiple overlapping policies; (4) excluding the influence of unobservable factors to mitigate the impact of omitted variables on research results. If the core explanatory variables remain significant when the robustness test is used, the results of this study are reliable.

5. Results

5.1. Benchmark Regression Results

Table 2 presents the benchmark regression results based on model (1). Column (1) reports the results with only city-fixed effects and time-fixed effects controlled, while columns (2)–(4) progressively introduce control variables on top of the specifications in Column (1). Column (5) conducts robustness testing by clustering at the provincial level. Across all scenarios, the coefficient for “Policy × Geographic distance” is consistently positive and statistically significant, ranging from 3% to 5%, which suggests that as the distance between the supervisory agency and the city government increases, the supervisory effectiveness of the administration in controlling non-grain cultivation on arable land weakens. Relying on the results in Column (4), the coefficient for “Policy × Geographic distance” is 0.439, significant at a 1% confidence level, which indicates that geographic distance plays a diminishing role in the supervisory effectiveness of the supervisory agency on non-grain cultivation on arable land. In economic terms, the regression results imply that for every 100 km increase in the distance from the supervisory agency to the city government at the prefecture-level12, the corresponding non-grain cultivation on arable land increases by 0.439 percentage points.

5.2. Robustness Test

5.2.1. Parallel Trends Test

A critical assumption for effectively assessing policy effects using the difference-in-differences method is that the treatment and control groups follow parallel trends. This paper employs two methods to test whether the treatment and control groups satisfy the assumption of parallel trends: first, by using the event analysis method, and second, by conducting a pre-treatment counterfactual test. To begin with, following the approach of Zhang et al. [37], this paper constructs the following event analysis econometric model based on model (1):
Y it = β 0 + n = - 4 1 β n D t 0 + n × Distance i + θ Control i × α t + γ i + α t + ε it
Among these, D t 0 + n represents a series of yearly dummy variables, indicating the nth year before and after policy implementation, while other variables remain consistent with model (1). Following the standard practice in current research, this paper uses the pre-policy period (2018) as the base year and excludes it to avoid multicollinearity issues. The event analysis results are presented in Column (1) of Table 3. It can be observed that for the 2nd to 4th years before policy implementation, the estimated coefficients are not statistically significant, indicating no significant differences between the control and treatment groups before the establishment of the supervisory agency, satisfying the parallel trends assumption. Additionally, following the approach of Hu and Dai [38], this paper retains only the samples from the pre-policy period. It creates variables “One-year pre-policy × Geographic distance” and “Two-year pre-policy × Geographic distance” by shifting the policy implementation time backward by 1–2 years for counterfactual tests. The results in columns (2)–(3) of Table 3 show that the coefficients are not statistically significant, confirming the parallel trends assumption between the control and treatment groups.

5.2.2. Replacing the Explanatory Variable

This paper examines the robustness of the above research findings by changing the measurement method of variables. Firstly, taking the logarithm of both variables, “Non-grain” and “Geographical distance”, separately, the regression results are shown in columns (1)–(2) of Table 4. The results indicate that the coefficients of “Policy × Geographical distance” and “Policy × lnGeographical distance” are both significantly positive, consistent with the previous research conclusions. Secondly, considering the vast expanse of China and the regional differences in land area between the eastern, central, and western parts, the geographical distance is transformed into a discrete variable. This paper divides all prefecture-level cities into nine groups based on the supervisory scope of the supervisory agency. Then, within each group, the median geographical distance is calculated. When the geographical distance from the supervisory agency’s location to the municipal government’s distance exceeds the median distance of the group, the variable “Dummy geographic distance” takes the value of 1; otherwise, it takes the value of 0. The regression results are presented in Column (3) of Table 4, showing that the coefficient of “Policy × Dummy geographic distance” remains significantly positive, consistent with the previous research findings. Additionally, following Nian [39], the geographical distance is divided into three segments based on deciles: within the deciles, between deciles and the median, and beyond the median. Two dummy variables, “Geographical distance I” and “Geographical distance II”, are generated accordingly. When the geographical distance is less than the deciles, “Geographical distance I” takes the value of 1, and “Geographical distance II” takes the value of 0. When it is between the deciles and the median, “Geographical distance I” takes the value of 0, and “Geographical distance II” takes the value of 1. When it is beyond the median, both “Geographical distance I” and “Geographical distance II” take the value of 0. The regression results in Column (4) of Table 4 indicate that the coefficients of “Policy × Geographical distance I” and “Policy × Geographical distance II” are both significantly negative at the 1% confidence level, with the absolute value of “Policy × Geographical distance I” being more significant than that of “Policy × Geographical distance II”, implying that the closer the distance, the stronger the supervisory effectiveness of the supervisory agency on non-grain cultivation, consistent with the previous research conclusions.

5.2.3. Controlling for Other Relevant Policies

From 2015 to 2020, China introduced various policies and experienced events that could impact the non-grain cultivation of arable land. These policy events might influence the conclusions of this paper and, therefore, need to be systematically excluded. In 2015, the Central Committee of the Communist Party of China and the State Council issued the “Decision on Winning the Battle Against Poverty”, marking the beginning of a comprehensive campaign to eradicate poverty. This decision strengthened the central government’s support for poverty-stricken areas, including various initiatives such as industrial poverty alleviation. Within the context of agricultural industry poverty alleviation, the focus shifted towards the cultivation of specialty crops [40,41], altering the planting structure for farmers and potentially affecting the research conclusions presented in this paper. Consequently, this paper calculated the annual proportion of poverty-stricken counties in each prefecture-level city based on the decapitation year data of 832 nationally designated impoverished counties. This information was then used to generate the variable “Poverty alleviation efforts”, allowing for controlling the impact of poverty alleviation policies on the research findings.
Furthermore, as the foundation for ensuring China’s food security, the cultivation structure of permanent basic farmland is continually tilting towards grain crops. In 2016, the Ministry of Land and Resources initiated a special inspection on the demarcation of permanent basic farmland13, primarily focusing on 106 key cities and their surrounding areas. This paper posits that the demarcation of permanent basic farmland can impact the region’s planting structure, influencing the research conclusions. This paper introduces the variable “Permanent basic farmland” to mitigate this influence, assigning a value of 1 when the sample belongs to one of the 106 key cities and the year is 2016 or later; otherwise, it is assigned a value of 0.
Table 5 reports the estimated results of controlling for the policy events of poverty alleviation and the special inspection on the demarcation of permanent basic farmland in columns (1) and (2), respectively. Column (3) presents the results after controlling for both policy events. It is observed that the coefficients for “Policy × Geographic distance” are significantly positive at the 1% confidence level, indicating that the policy above events do not substantially impact the benchmark regression results of this paper, highlighting the robustness of the benchmark regression results.

5.2.4. Exclude the Impact of Unobservable Factors

Despite controlling for variables that could affect the research conclusions from various perspectives and excluding the impact of concurrent policy events, the benchmark regression results still need to include unobservable factors. This paper follows the approach of Altonji et al. [42]. It assesses unobservable factors based on observable ones to address the potential influence of unobservable factors on the research findings, which involves comparing the differences in the coefficients of the core explanatory variable under constrained and unconstrained conditions. The calculation formula is given by Ration = | β F / ( β R - β F ) . Here, Ration is the outcome of interest, representing the difference in the coefficients of the core explanatory variable under constrained and unconstrained conditions for the control variables. β F is the coefficient of the core explanatory variable in the unconstrained equation, and β R is the coefficient in the constrained equation. If the econometric model has already controlled for the main influencing factors, introducing additional control variables should result in minimal changes in the coefficient of the main explanatory variable. In other words, the difference between β F and β R should be slight, yielding a large Ration indicating a low probability of significant bias from unobservable factors. This paper takes the results from Table 2, Column (4) as the unconstrained equation and columns (1), (2), and (3) as the constrained equations for calculation. Table 6 presents the calculated values based on this approach. All combinations of Ration values are observed to be greater than the reference value of 1 [43], with a minimum value of around 6, a maximum of around 31, and an average of approximately 22. These results imply that unobservable factors would need at least 6 times, on average 22 times, the controlled observable factors to significantly bias the coefficients of the core explanatory variable in the benchmark regression presented earlier. This paper believes that the diminishing effect of geographical distance on the supervision of non-grain cultivation by the inspection agency in the benchmark regression is unlikely to be influenced by unobservable factors to such a high degree. Therefore, the conclusions drawn from this paper are robust.

5.3. Mechanism Analysis

Based on the hypotheses outlined earlier, this paper anticipates that the impact of geographical distance on non-grain cultivated land by supervisory agencies primarily manifests through its influence on the direct supervisory costs incurred by these agencies. Following the approach of Ma et al. [44], mechanism variables and interaction terms between policy variables are introduced into model (1) for a mechanism test. The specific model is as follows:
Y it = β 0 + β 1 Post t × Distance i + β 2 Post t × Distance i × Intermediary i + θ Control i × α t + γ i + α t + ε it
In the above model, Intermediary i represents a series of mechanism variables that can reflect the magnitude of direct supervisory costs incurred by supervisory agencies. To prevent the mechanism variables from being influenced by policies, all mechanism variables are treated as pre-event variables, represented by data from the year 2017. β 2 is the coefficient of interest in this paper, reflecting the size of the effect of mechanism variables. The meanings of other letters and symbols are the same as in model (1). According to the earlier analysis, this paper follows a logical approach of “introducing multiple supervision measures—weakening the degree of direct supervisory cost increase with distance—diminishing the degree of supervision intensity attenuation with distance—reducing the extent of non-grain of cultivated land”. Following this logic, mechanism variables are constructed from on-site supervision, satellite remote sensing supervision, and public supervision. By comparing the impact differences on supervisory effectiveness between the use and non-use of various supervision measures, this paper indirectly demonstrates the channel effect of supervisory agencies’ direct supervisory costs.

5.3.1. On-Site Supervision

The convenience of transportation influences the scope and frequency of on-site supervision by the supervisory agency. The more convenient the transportation, the lower the transportation costs, and the greater the intensity of supervision. This paper refers to the methods of Wan et al. [45], using per capita road mileage to represent transportation convenience. A dummy variable, “Transportation”, is generated based on whether the logarithmized per capita road mileage is greater than the median, indicating the on-site supervision level in each region. Regions with a logarithmized per capita road mileage above the median are defined as transportation-convenient areas with a value of 1; otherwise, they are considered transportation-inconvenient areas with a value of 0. We can reasonably expect that the coefficient of the variable “Policy × Geographical distance × Transportation” is negative, indicating that transportation convenience can reduce the direct supervision costs of the supervisory agency and enhance the effectiveness of monitoring non-grain cultivation. The estimated results in Column (1) of Table 7 show that the coefficient of “Policy × Geographical distance × Transportation” is significantly negative at the 1% confidence level, confirming the expected results.

5.3.2. Satellite Supervision

The effectiveness of satellite supervision is influenced by meteorological factors, with more cloudy and rainy weather resulting in poorer supervisory effectiveness [46,47]. Cloudy and rainy weather is typically correlated with precipitation since precipitation generally forms from water droplets or ice crystals condensing in cloud layers [48]. Based on this, this paper generates a dummy variable, “Non-cloudy-rainy”, based on whether the logarithmized annual average precipitation is less than the median, representing the level of satellite supervision in each region. Regions with the logarithmized annual average precipitation below the median are defined as non-cloudy-rainy areas, with a value of 1; conversely, those with the logarithmized annual average rainfall above the median are considered cloudy-rainy areas, with a value of 0. We can reasonably expect that the coefficient of the variable “Policy × Geographical distance × Non-cloudy-rainy” should be negative. In other words, in non-cloudy-rainy areas, the level of satellite supervision is higher, which can reduce the direct supervision costs of the supervisory agency and enhance the effectiveness of supervision of non-grain cultivation on arable land. The estimated results in Column (2) of Table 7 show that the coefficient of “Policy × Geographical distance × Non-cloudy-rainy” is significantly negative at the 1% confidence level, confirming the expected results.

5.3.3. Public Supervision

In addition to on-site and satellite supervision, public supervision is also crucial in China’s natural resources oversight. Research results from Zhou [49] indicate that the rapid development of the Internet provides a robust platform for public supervision, becoming an essential measure for the Chinese government to be supervised by the public. This paper follows the approach of Ma et al. [50]. It generates a dummy variable, “Internet”, based on whether the logarithmized international Internet user count is greater than the median, representing each region’s level of public supervision. Regions with a logarithmized international Internet user count above the median are defined as Internet-developed areas, with a value of 1; conversely, those below the median are considered Internet-undeveloped areas, with a value of 0. We can reasonably expect that the coefficient of the variable “Policy × Geographical distance × Internet” should be negative. In other words, in Internet-developed areas, the level of public supervision is higher, potentially reducing the direct supervision costs of supervisory agencies and enhancing the effectiveness of supervision of non-grain cultivation on arable land. The estimated results in Column (3) of Table 7 show that the coefficient of “Policy × Geographical distance × Internet” is significantly negative at the 10% confidence level, confirming the expected results. Thus, Hypothesis 2 is validated by this research.

5.4. Moderation Effects Analysis

Based on the previous analysis, the impact of geographical distance on the effectiveness of the supervisory agency in supervising non-grain cultivation on arable land is moderated by the local government’s opportunity cost of responding. Generally, when the work objectives of a local government align closely with grain production, it is inclined to allocate land towards grain cultivation even before supervisory measures are implemented. In such cases, the benefits lost by complying with supervision on planting grain crops are relatively low, resulting in lower opportunity costs for compliance. Conversely, if a local government’s work objectives significantly differ from grain production, the actual land use before the supervisory response may vary significantly from the supervised land use. In these instances, the benefits lost by complying with supervision on planting grain crops are higher, leading to increased opportunity costs for compliance. Thus, there is a correlation between the work objectives of local governments and the opportunity costs they incur in responding to supervision—the closer the alignment between local government objectives and grain production, the lower the opportunity costs for compliance. Following Jiang [51], interaction terms between the moderating variable and the core explanatory variable can be generated when the moderating variable is a dummy variable. The moderating effect can be examined by grouping and comparing coefficients’ intergroup heterogeneity. This paper constructs three dummy variables—“Grain”, “Higher-level”, and “Ethnic”—as interaction terms with “Policy × Geographical distance” based on the work objectives of local governments. This paper uses a grouping comparison approach to explore how the local government’s opportunity cost of responding moderates the impact of geographical distance on the supervisory agency’s effectiveness in supervising the conversion of arable land to non-grain crops.

5.4.1. Grain Production

Grain-producing regions play a pivotal role in China’s overall grain production and are responsible for ensuring national food security. They have consistently prioritized the development of grain production. Therefore, it is reasonable to expect that, compared to non-grain-producing regions, grain-producing regions face lower economic and social opportunity costs when responding to the requirements of converting arable land to non-grain crops. This paper examines this hypothesis by introducing the variable “Grain”, assigning a value of 1 if a prefecture-level city is located within a grain-producing region and 0 otherwise. The estimated results in Column (1) of Table 8 show that the coefficient of “Policy × Geographical distance × Grain” is significantly negative at the 1% confidence level, confirming the expected outcome.

5.4.2. Economic Growth

In China, higher-level cities, relative to typical prefecture-level cities, exhibit higher economic growth and often prioritize economic growth as a significant goal. In their development, they tend to encroach upon the survival space of low-economic-benefit grain industries. It is reasonable to anticipate that higher-level cities may incur higher economic opportunity costs when responding to the requirements of converting arable land to non-grain crops and potentially exhibit poorer supervisory effectiveness than ordinary cities. This hypothesis is tested in this paper by introducing the variable “Higher-level”, assigning a value of 1 if a prefecture-level city is a provincial capital, a direct-administered municipality, or a planned separately administered city, and 0 otherwise. The estimated results in Column (2) of Table 8 show that the coefficient of “Policy × Geographical distance × Higher-level” is significantly positive at the 5% confidence level, confirming the expected outcome.

5.4.3. Ethnic Unity

China is a multi-ethnic nation, and maintaining ethnic harmony and protecting ethnic cultures are among the core tasks for developing ethnic regions. In these regions, local governments may exhibit reduced responsiveness to the conversion of arable land to non-grain crops to protect ethnic cultures and promote ethnic unity, as suggested by Chen and Lan [52]. For instance, the Tibetan people in China have a tradition of drinking buttered tea, which requires significant cultivation of tea leaves. Convincing them to shift from cultivating tea to growing grain crops would pose substantial challenges. We can reasonably expect that the social opportunity costs of responding to the requirements of converting arable land to non-grain crops may be higher in ethnic minority areas, leading to potentially poorer supervisory effectiveness. This paper introduces the variable “Ethnic” and, following the approach of Yang et al. [53], assigns a value of 1 to prefecture-level cities belonging to the eight ethnic provinces and autonomous regions with ethnic minority populations and 0 to others to test this hypothesis14. The estimated results in Column (3) of Table 8 show that the coefficient of “Policy × Geographical distance × Ethnic” is significantly positive at the 5% confidence level, confirming the expected outcome. Thus, this paper validates H3.

6. Conclusions and Discussion

6.1. Conclusions

This paper utilizes panel data from 270 prefecture-level cities in China from 2015 to 2020. This research employs a continuous treatment difference-in-differences approach to investigate the impact of geographical distance on the supervisory effectiveness of the supervisory agency in controlling non-grain cultivation on arable land. Additionally, this paper explores the moderating role of local government response opportunity costs. The findings indicate that the supervisory effectiveness of the supervisory agency in controlling non-grain cultivation on arable land decreases as the distance of supervision increases. This conclusion holds even after conducting a series of robustness tests. Mechanism analysis reveals that the weakening effect of geographical distance on the supervisory effectiveness of the supervisory agency is primarily achieved by increasing the direct supervisory costs. Further exploration indicates that the negative influence of supervisory distance on the supervisory effectiveness of non-grain cultivation on arable land is subject to the moderating effect of local government response opportunity costs.

6.2. Discussion

Based on the research findings of the “distance decay effect”, this study proposes a dual-dimensional framework for arable land protection, integrating institutional innovation and digital technology. At the institutional level, the spatial layout of vertical supervision should be optimized by establishing regional regulatory branches in geographically remote areas with weak regulatory capacity. This approach reduces direct regulatory costs by minimizing physical distances. Additionally, a three-tier decentralized governance network should be established, encompassing “central coordination, provincial collaboration, and county implementation”. The central government would set core indicators for arable land protection and conduct macro-level regulation, while provincial governments would utilize intelligent monitoring platforms for dynamic oversight. County-level governments would implement protection measures and upload real-time rectification data, creating a clear, interconnected regulatory system with well-defined responsibilities. From the perspective of digital technology, a comprehensive “space-air-ground” monitoring system should be developed. This system would leverage high-resolution satellite remote sensing and drone inspections to enable real-time dynamic monitoring of arable land use, with enhanced focus on key areas. Regulatory agencies could utilize 5G technology for remote enforcement, establish cross-regional joint inspection mechanisms, and integrate AI algorithms to automatically detect non-grain cultivation on arable land and generate early warning alerts. The deep integration of institutional innovation and digital technology not only addresses geographical constraints and reduces regulatory costs but also enhances regulatory efficiency through precision governance. This approach provides a systematic solution to mitigate the “distance decay effect” in arable land protection.
For specific regions, the government can implement tailored solutions to address unique challenges. In areas with persistent cloud cover, establishing a collaborative supervision system combining “public oversight and equipment subsidies” is useful. On one hand, the government can incentivize farmers to upload photos documenting their planting activities through agricultural input subsidies. On the other hand, the government can include multispectral cameras in the agricultural machinery subsidy catalog, which can encourage villages to monitor arable land. Additionally, in regions with high indirect regulatory costs, such as major grain-producing areas, we need to introduce differentiated subsidy policies like establishing an interest linkage mechanism between grain-producing and non-grain-producing regions to reduce local government resistance to policy implementation. Additionally, the government can permit major grain-producing regions to establish production bases in non-grain-producing regions through technical assistance, which will create an “enclave economy” model. This approach would both ensure grain production capacity and accommodate local development needs.
Institutional innovation and digital technology play distinct roles in arable land protection, each suited to different contexts. Institutional innovation focuses on optimizing organizational structures and management systems, with costs primarily associated with information system development, office equipment procurement, and ongoing personnel training and management. This approach is particularly suitable for regions with underdeveloped regulatory systems and limited economic resources. For instance, in economically disadvantaged remote areas with weak digital infrastructure, establishing regional regulatory branches and clarifying responsibilities across government levels can quickly create an effective regulatory framework. While initial costs include institutional setup and staffing, ongoing expenses are limited to salaries and operational costs. The benefit lies in fostering efficient intergovernmental collaboration and establishing a robust regulatory order. Over the long term, this strategy ensures stable and sustainable regulation of arable land use, which is critical for the stability and sustainable development of the grain industry. Digital technology, on the other hand, relies more heavily on advanced technological tools. Its costs include upfront investments in digital equipment and ongoing expenses for maintenance and data processing. This approach is particularly advantageous in economically developed regions with robust technological infrastructure and high demands for regulatory precision and efficiency. For example, in eastern coastal areas with comprehensive 5G coverage and a strong talent pool, digital technology enables real-time, high-precision monitoring of arable land, significantly improving regulatory efficiency and reducing the need for costly on-site inspections. Precise data also facilitate optimal allocation of grain production resources, driving the grain industry toward intelligent and efficient development, thereby enhancing its overall competitiveness.
In summary, local governments face significant fiscal challenges when transitioning to compliance-oriented agricultural policies. In the initial phase, substantial financial investments are required for institutional innovation, including the establishment of new agencies, staffing, and system development, as well as for digital technology empowerment, such as equipment procurement and technological research. During the intermediate phase, ongoing costs arise, including salaries and operational expenses for institutional innovation, as well as equipment maintenance and data processing for digital technologies. Although long-term benefits, such as stabilizing the grain industry and increasing its added value, are expected, the short- and medium-term financial pressures are considerable. To alleviate fiscal strain, local governments can seek special transfer payments from higher-level authorities to ease funding constraints. They should also optimize fiscal expenditure structures by cutting unnecessary spending and reallocating resources toward the agricultural policy transition. Additionally, exploring diversified funding channels, such as attracting private capital for agricultural infrastructure development or partnering with enterprises to share the costs of digital technology procurement and maintenance, can help balance short-term investments with long-term gains. These measures ensure a smoother policy transition while maintaining fiscal sustainability.

7. Limitations and Future Recommendations

This study finds that the effectiveness of monitoring agencies in monitoring non-grain cultivation on arable land declines with increasing geographical distance, providing new evidence of the “distance decay effect” of monitoring effectiveness. However, this study still has the following limitations and directions for future improvement: first, due to the limitation of data availability, the time window of this study is up to 2020, which fails to capture the long-term dynamic changes of the policy effect, and the observation period can be extended in the future to test the robustness of the conclusions. Second, the measurement of the degree of non-grain utilization is based on the proportion of sown area, which does not take into account the systematic bias that may be caused by the differences in the cropland replanting index, and the subsequent study can improve the accuracy of the measurement through high-precision remote sensing data or field research. Third, in terms of policy optimization, a multi-subject game model can be further constructed to quantify the cost–benefit equilibrium points under different regulatory radii, so as to provide more refined decision support for the central government to coordinate the allocation of regulatory resources.

Author Contributions

Conceptualization, G.W.; methodology, G.W.; software, G.W.; validation, G.W.; formal analysis, G.W.; investigation, G.W.; resources, G.W.; data curation, G.W.; writing—original draft preparation, G.W.; writing—review and editing, P.W.; visualization, P.W.; supervision, P.W.; project administration, P.W.; funding acquisition, P.W. All authors have read and agreed to the published version of the manuscript.

Funding

This research received no external funding.

Data Availability Statement

The datasets used and/or analyzed during the current study are available from the corresponding author upon reasonable request.

Acknowledgments

The author extend great gratitude to the anonymous reviewers and editors for their helpful review and critical comments.

Conflicts of Interest

The author declares no conflicts of interest.

Appendix A

The inspection jurisdictions of the nine National Natural Resources Supervisory Agencies are as follows: National Natural Resources Supervisory Agency in Beijing: municipal governments and local governments under the jurisdiction of Beijing, Tianjin, Hebei, Shanxi, and the Inner Mongolia Autonomous Region. National Natural Resources Supervisory Agency in Shenyang: municipal governments and local governments under the jurisdiction of Liaoning, Jilin, Heilongjiang, and Dalian. National Natural Resources Supervisory Agency in Shanghai: municipal governments and local governments under the jurisdiction of Shanghai, Zhejiang, Fujian, Ningbo, and Xiamen. National Natural Resources Supervisory Agency in Nanjing: provincial governments and local governments under the jurisdiction of Jiangsu, Anhui, and Jiangxi. National Natural Resources Supervisory Agency in Jinan: provincial governments and local governments under the jurisdiction of Shandong, Henan, and Qingdao. National Natural Resources Supervisory Agency in Guangzhou: provincial governments and local governments under the jurisdiction of Guangdong, Guangxi Zhuang Autonomous Region, Hainan, and Shenzhen. National Natural Resources Supervisory Agency in Wuhan: provincial governments and local governments under the jurisdiction of Hubei, Hunan, and Guizhou. National Natural Resources Supervisory Agency in Chengdu: municipal governments and local governments under the jurisdiction of Chongqing, Sichuan, Yunnan, and Tibet. National Natural Resources Supervisory Agency in Xi’an: provincial governments and local governments under the jurisdiction of Shaanxi, Gansu, Qinghai, Ningxia Hui Autonomous Region, Xinjiang Uygur Autonomous Region, Xinjiang Production and Construction Corps, divisions (cities), and regimental farms.

Notes

1
2
3
4
5
6
This paper excludes Beijing, where the municipal government relocated post policy implementation, and cities with significantly missing data on non-grain cultivation on arable land.
7
8
9
10
11
This paper uses data from 2017 to represent the socio-economic pre-control variables.
12
This paper calculates the geographical distance in units of 100 km.
13
14
The eight ethnic provinces include the five autonomous regions with significant minority populations—Inner Mongolia, Ningxia, Xinjiang, Tibet, and Guangxi—and the three provinces where ethnic minorities are concentrated, namely Qinghai, Guizhou, and Yunnan.

References

  1. Tsui, K.Y.; Wang, Y. Decentralization with political trump: Vertical control, local accountability and regional disparities in China. China Econ. Rev. 2008, 19, 18–31. [Google Scholar] [CrossRef]
  2. Ma, Y. Vertical Environmental Management: A Panacea to the Environmental Enforcement Gap in China? Chin. J. Environ. Law 2017, 1, 37–68. [Google Scholar] [CrossRef]
  3. Li, J.; Pan, Y.; Yang, Y.; Tse, C.H. Digital platform attention and international sales: An attention-based view. J. Int. Bus. Stud. 2022, 53, 1817–1835. [Google Scholar] [CrossRef]
  4. Shi, X.; Xi, T. Race to safety: Political competition, neighborhood effects, and coal mine deaths in China. J. Dev. Econ. 2018, 131, 79–95. [Google Scholar] [CrossRef]
  5. Ren, D.; Peng, B. Research on the Rule of Legal Regulation to Prevent “Non-grain” of Cultivated Land. China Land Sci. 2022, 36, 1–9. [Google Scholar] [CrossRef]
  6. Kedia, S.; Rajgopal, S.; Madoff, B.; Thomsen, L. Do the SEC’s Enforcement Preferences Affect Corporate Misconduct? J. Account. Econ. 2011, 51, 259–278. [Google Scholar] [CrossRef]
  7. Song, M.; Peng, J.; Yi, L.; Fu, J. Quantity and quality balance of farmland in Hubei Province in the contextof compensation for comprehensive occupation’ and its impact on grainproduction capacity. China Popul. Resour. Environ. 2024, 34, 173–186. [Google Scholar]
  8. Huang, J.; Zhang, Z. The logic and governance of local government’s participation in the “non-grain” transfer of cultivated land: A case study based on planting and greening of cultivated land. China Land Sci. 2023, 37, 114–123. [Google Scholar] [CrossRef]
  9. Zhang, Q.; Qu, X.; Wei, C. A study of “Non-Grain Production” of family farmers in the background of grain security. Southeast Acad. Res. 2014, 3, 94–100+247. [Google Scholar] [CrossRef]
  10. Zhao, T. Analysis of the Current Situation and Causes of “non-grain” Cultivated Land-Take Dujiazhai Village, Sinan County as an Example. Mod. Agric. 2023, 48, 50–54. [Google Scholar] [CrossRef]
  11. Zhao, S.; Xiao, D.; Yin, M. Spatiotemporal Patterns and Driving Factors of Non-Grain Cultivated Land in China’s Three Main Functional Grain Areas. Sustainability 2023, 15, 13720. [Google Scholar] [CrossRef]
  12. Zhou, L.; Liang, Y.; Xiong, L.; Hu, X.; Chao, Z. Suitability evaluation and consolidation zoning of supplementary cultivated land in Guangdong Province. J. Agric. Resour. Environ. 2025, 42, 57–65. [Google Scholar] [CrossRef]
  13. Liu, T.; Chen, M. The status-quo and improvement path for the implementation of cultivated land protection policy in China. China Land Sci. 2020, 34, 32–37+47. [Google Scholar]
  14. Yang, Y. The Causes and Corrections of “Three-Right-Division” Policy Implementing Deviation in Traditional Agricultural Area. Issues Agric. Econ. 2017, 38, 23–30+1. [Google Scholar] [CrossRef]
  15. Quan, S. The evolution logic of agricultural policy: On the key problems and potential risks of China’s agricultural transformation. Chin. Rural Econ. 2022, 2, 15–35. [Google Scholar]
  16. Liu, Y.; Fang, F.; Li, Y. Key issues of land use in China and implications for policy making. Land Use Policy 2014, 40, 6–12. [Google Scholar] [CrossRef]
  17. Liu, C.; Song, C.; Ye, S.; Cheng, F.; Zhang, L.; Li, C. Estimate provincial-level effectiveness of the arable land requisition-compensation balance policy in mainland China in the last 20 years. Land Use Policy 2023, 131, 106733. [Google Scholar] [CrossRef]
  18. Zhang, Q.; Wu, C. Optimization Model of Permanent Basic Farmland Indicators Distribution from the Perspective of Equity: A Case from W County, China. Land 2022, 11, 1290. [Google Scholar] [CrossRef]
  19. Ling, L.; Tang, H.; Chen, X.; Li, S.; Han, X. Spatial zoning and effect evaluation of county high-standard farmland siting delineation for sustainable cultivated land use in China: A case study in Dali, Shaanxi. Ecol. Indic. 2024, 167, 112647. [Google Scholar] [CrossRef]
  20. Zhao, Y.; Huang, X.; Zhong, T.; Zhang, X.; Du, G.; Zhang, B. Effects of land supervision on cultivated land requisition-compensation balance in China. Trans. Chin. Soc. Agric. Eng. 2012, 28, 1–7. [Google Scholar]
  21. Yan, H.; Du, W.; Zhou, Y.; Luo, L.; Niu, Z. Satellite-Based Evidences to Improve Cropland Productivity on the High-Standard Farmland Project Regions in Henan Province, China. Remote Sens. 2022, 14, 1724. [Google Scholar] [CrossRef]
  22. Zheng, P.; Zhu, D.; Zhang, X. Analysis on the Public Select Theory of the Government’s Farmland Protection Action. Nat. Resour. Econ. China 2005, 9, 10–12+46. [Google Scholar]
  23. Chen, L.; Chang, Y.; Ruan, X. The role of geographic distances in green industrial pilot policies evaluation: A sustainability transition perspective. Environ. Sci. Pollut. Res. 2024, 31, 10245–10258. [Google Scholar] [CrossRef]
  24. Shi, D.; Hu, K. The relationship between geographic distance to environmental protection agencies and industrial pollution emissions. Scott. Geogr. J. 2024, in press. [CrossRef]
  25. Zhang, Z.; Zhou, Y.; Xiong, H.; Li, H. How Does Geographic Distance Affect the Global Value ChainCooperation? Theoretical Model and International Empirical Evidence. Econ. Rev. 2021, 3, 75–88. [Google Scholar] [CrossRef]
  26. Lu, S.; Ma, J.; Chen, S. Geographical Distance from Government Seats, Attention to and Gains from Government Policies. Financ. Trade Econ. 2023, 44, 84–101. [Google Scholar] [CrossRef]
  27. Jin, H.; Chen, S. Does Geographic Distance Matter for the Governmental Supervision ofFirms’ Pollution Emission? J. Quant. Technol. Econ. 2022, 39, 123–140. [Google Scholar] [CrossRef]
  28. Bloom, N.; Garicano, L.; Sadun, R.; Reenen, J.V. The Distinct Effects of Information Technology and Communication Technology on Firm Organization. Manag. Sci. 2014, 60, 2859–2885. [Google Scholar] [CrossRef]
  29. Nunn, N.; Qian, N. The Potato’s Contribution to Population and Urbanization: Evidence from an Historical Experiment. Q. J. Econ. 2011, 126, 593–650. [Google Scholar] [CrossRef]
  30. Li, P.; Lu, Y.; Wang, J. Does flattening government improve economic performance? Evidence from China. J. Dev. Econ. 2016, 123, 18–37. [Google Scholar] [CrossRef]
  31. Zhang, W.; Ma, L.; Wang, X.; Chang, X.; Zhu, Z. The impact of non-grain cultivation of cultivated land on the relationship between agricultural carbon supply and demand. Appl. Geogr. 2024, 162, 103166. [Google Scholar] [CrossRef]
  32. Li, T.; Hao, D. Current situation of “non-grain production” of cultivated land in China and the research progress of re-tillage and fertilization technology. Chin. J. Appl. Ecol. 2023, 34, 1703–1712. [Google Scholar] [CrossRef]
  33. Qian, W.; Wang, D.; Zheng, L. The impact of migration on agricultural restructuring: Evidence from Jiangxi Province in China. J. Rural Stud. 2016, 47, 542–551. [Google Scholar] [CrossRef]
  34. Chen, Z.; Zhang, X.; Huang, X.; Chen, Y. Influence of government leaders’ localization on farmland conversion in Chinese cities: A “sense of place” perspective. Cities 2019, 90, 74–87. [Google Scholar] [CrossRef]
  35. Su, Y.; Qian, K.; Lin, L.; Wang, K.; Guan, T.; Gan, M. Identifying the driving forces of non-grain production expansion in rural China and its implications for policies on cultivated land protection. Land Use Policy 2020, 92, 104435. [Google Scholar] [CrossRef]
  36. Xue, Y.; Li, C. Extracting Chinese geographic data from Baidu Map API. Stata J. 2020, 20, 805–811. [Google Scholar] [CrossRef]
  37. Zhang, H.; Xu, T.; Feng, C. Does public participation promote environmental efficiency? Evidence from a quasi-natural experiment of environmental information disclosure in China. Energy Econ. 2022, 108, 105871. [Google Scholar] [CrossRef]
  38. Hu, X.; Dai, M. Effects of High-standard Farmland Construction Policies on Food Production. J. South China Agric. Univ. (Soc. Sci. Ed.) 2023, 21, 71–85. [Google Scholar] [CrossRef]
  39. Nian, Y. Incentives, penalties, and rural air pollution: Evidence from satellite data. J. Dev. Econ. 2023, 161, 103049. [Google Scholar] [CrossRef]
  40. Ma, J.; Li, F.; Zhang, H.; Nawab, K. Commercial cash crop production and households’ economic welfare: Evidence from the pulse farmers in rural China. J. Integr. Agric. 2022, 21, 3395–3407. [Google Scholar] [CrossRef]
  41. Cui, Z.; Li, E.; Li, Y.; Deng, Q.; Shahtahmassebi, A.R. The impact of poverty alleviation policies on rural economic resilience in impoverished areas: A case study of Lankao County, China. J. Rural Stud. 2023, 99, 92–106. [Google Scholar] [CrossRef]
  42. Altonji, J.G.; Elder, T.E.; Taber, C.R. Selection on Observed and Unobserved Variables: Assessing the Effectiveness of Catholic Schools. J. Political Econ. 2000, 113, 151–184. [Google Scholar] [CrossRef]
  43. Nunn, N.; Wantchékon, L. The Slave Trade and the Origins of Mistrust in Africa. Am. Econ. Rev. 2011, 101, 3221–3252. [Google Scholar] [CrossRef]
  44. Ma, Q.; Tariq, M.; Mahmood, H.; Khan, Z. The nexus between digital economy and carbon dioxide emissions in China: The moderating role of investments in research and development. Technol. Soc. 2022, 68, 101910. [Google Scholar] [CrossRef]
  45. Wan, J.; Wang, Z.; Ma, C.; Su, Y.; Zhou, T.; Wang, T.; Zhao, Y.; Sun, H.; Li, Z.; Wang, Y.; et al. Spatial-temporal differentiation pattern and influencing factors of high-quality development in counties: A case of Sichuan, China. Ecol. Indic. 2023, 148, 110132. [Google Scholar] [CrossRef]
  46. Zhang, A.; Jia, G. Monitoring meteorological drought in semiarid regions using multi-sensor microwave remote sensing data. Remote Sens. Environ. 2013, 134, 12–23. [Google Scholar] [CrossRef]
  47. Yan, Y.; Liu, Y.; Lu, J. Cloud vertical structure, precipitation, and cloud radiative effects over Tibetan Plateau and its neighboring regions. J. Geophys. Res. Atmos. 2016, 121, 5864–5877. [Google Scholar] [CrossRef]
  48. Li, Z.; Niu, F.; Fan, J.; Liu, Y.; Rosenfeld, D.; Ding, Y. Long-term impacts of aerosols on the vertical development of clouds and precipitation. Nat. Geosci. 2011, 4, 888–894. [Google Scholar] [CrossRef]
  49. Zhou, X. E-Government in China: A Content Analysis of National and Provincial Web Sites. J. Comput. Mediat. Commun. 2006, 9, JCMC948. [Google Scholar] [CrossRef]
  50. Ma, H.; Han, Z.; Jiang, H. The characteristics and spatial differences of basic public services of cities at prefecture level and above in China. Econ. Geogr. 2011, 31, 212–217. [Google Scholar] [CrossRef]
  51. Jiang, T. Mediating Effects and Moderating Effects in Causal Inference. China Ind. Econ. 2022, 5, 100–120. [Google Scholar] [CrossRef]
  52. Chen, S.; Lan, X. There Will Be Killing: Collectivization and Death of Draft Animals. Am. Econ. J. Appl. Econ. 2017, 9, 58–77. [Google Scholar] [CrossRef]
  53. Yang, J.; Wu, Y.; Wang, J.; Wan, C.; Wu, Q. A Study on the Efficiency of Tourism Poverty Alleviation in Ethnic Regions Based on the Staged DEA Model. Front. Psychol. 2021, 12, 642966. [Google Scholar] [CrossRef]
Figure 1. The distribution and jurisdictional scope of the National Natural Resources Supervisory Agency. Note: The black flags indicate the locations of the national natural resources supervisory agencies. Regions of the same color denote areas under the jurisdiction of the same National Natural Resources Supervisory Agency.
Land 14 00701 g001
Figure 2. The schematic diagram of the mechanism.
Land 14 00701 g002
Table 1. Mean difference of each variable.
TypeVariablesDefinitionUnitNumberMeanS.t. Error
Dependent variableNon-grain100-(Grain sown area × 100/crop sown area)%162033.29717.531
Core explanatory variableGeographic distanceThe distance from the National Natural Resources Supervisory Agency to municipal governments within its jurisdiction100 km16203.4612.640
PolicyTime dummy variable before and after the establishment of the National Natural Resources Supervisory Agency-16200.3330. 472
Control variables: socio-economic11Agricultural economic levelThe primary industry added value as a percentage of regional GDP in 2017%162011.5567.446
Population situationThe urbanization rate in the region in 2017%162056.42513.754
Fiscal decentralization levelThe ratio of regional general budget revenue to general budget expenditure in 2017-16200. 4250.217
Agricultural production conditionThe effective irrigated area in the region in 201710,000 hectares162019.84916.710
Control variables: meteorology/geographyAnnual average temperatureThe regional annual average temperature°C162014.8545.069
The square of the annual average temperatureThe square of the regional annual average temperature-1620246.319145.513
Annual average precipitationThe regional annual average precipitation100 mL 162010.4824.971
The square of annual average precipitationThe square of the regional annual average precipitation-1620134.567122.336
ElevationThe average elevation of the regionMeters1620379.482769.129
Table 2. Benchmark regression results.
VariablesNon-Grain
(1)(2)(3)(4)(5)
Policy × Geographic distance0.367 ***
(0.125)
0.423 ***
(0.123)
0.453 ***
(0.122)
0.439 ***
(0.114)
0.439 *
(0.228)
Socio-economic control variables × Time-fixed effects YESYESYESYES
Geographic control variables × Time-fixed effects YESYESYES
Meteorological control variables YESYESYES
_cons34.034 ***
(0.244)
−4.213
(13.588)
−4.540
(13.629)
13.093
(15.710)
48.694 ***
(9.124)
Time-fixed effectsYESYESYESYESYES
City-fixed effectsYESYESYESYESYES
Observations16201620162016201620
R20.0410.0850.1150.1150.115
Note: 1. The brackets are the robust standard errors clustered to the city level. 2. ***, and * represent significance levels of 1% and 10%, respectively.
Table 3. Parallel trends test results.
VariablesNon-Grain
(1)(2)(3)
Pre40.015
(0.148)
Pre30.111
(0.143)
Pre2−0.068
(0.111)
One-year pre-policy × Geographic distance −0.037
(0.098)
Two-year pre-policy × Geographic distance −0.094
(0.107)
Socio-economic control variables × Time-fixed effectsYESYESYES
Geographic control variables × Time-fixed effectsYESYESYES
Meteorological control variablesYESYESYES
_cons8.784
(15.902)
18.612
(12.305)
20.433
(12.592)
Time-fixed effectsYESYESYES
City-fixed effectsYESYESYES
Observations162010801080
R20.1280.1120.114
Note: The brackets are the robust standard errors clustered to the city level.
Table 4. Estimation results after variable modification.
VariableslnNon-GrainNon-Grain
(1)(2)(3)(4)
Policy × Geographic distance0.018 ***
(0.007)
Policy × lnGeographic distance 0.840 *
(0.483)
Policy × Dummy geographic distance 1.719 ***
(0.644)
Policy × Geographic distance Ι −3.271 **
(1.482)
Policy × Geographic distance Ι Ι −1.595 ***
(0.592)
Socio-economic control variables × Time-fixed effectsYESYESYESYES
Geographic control variables × Time-fixed effectsYESYESYESYES
Meteorological control variablesYESYESYESYES
_cons2.233 *
(1.293)
12.090
(16.194)
12.671
(16.080)
9.889
(16.119)
Time-fixed effectsYESYESYESYES
City-fixed effectsYESYESYESYES
Observations1620162016201620
R20.1450.1090.1080.113
Note: 1. The brackets are the robust standard errors clustered to the city level. 2. ***, **, and * represent significance levels of 1%, 5%, and 10%, respectively.
Table 5. Estimation results after controlling for other relevant policies.
VariablesNon-Grain
(1)(2)(3)
Policy × Geographic distance0.438 ***
(0.114)
0.439 ***
(0.113)
0.439 ***
(0.113)
Poverty alleviation efforts0.403
(0.520)
0.407
(0.519)
Permanent basic farmland 0.573
(0.812)
0.577
(0.811)
Socio-economic control variables × Time-fixed effectsYESYESYES
Geographic control variables × Time-fixed effectsYESYESYES
Meteorological control variablesYESYESYES
_cons13.066
(15.719)
11.568
(16.078)
11.531
(16.085)
Time-fixed effectsYESYESYES
City-fixed effectsYESYESYES
Observations162016201620
R20.1150.1150.115
Note: 1. The brackets are the robust standard errors clustered to the city level. 2. *** represents significance levels of 1%.
Table 6. Evaluation results of unobservable factors based on observable factors.
Constrained Group of Control VariablesUnconstrained Group of Control Variables β R β F Ration
Column (1) of Table 2Column (4) of Table 20.3670.4396.097
Column (2) of Table 2Column (4) of Table 20.4230.43927.438
Column (3) of Table 2Column (4) of Table 20.4530.43931.357
Table 7. Results of mechanism testing.
VariablesNon-Grain
(1)(2)(3)
Policy × Geographic distance0.736 ***
(0.139)
0.689 ***
(0.140)
0.512 ***
(0.119)
Policy × Geographic distance × Transportation−0.559 ***
(0.141)
Policy × Geographic distance × Non-cloudy-rainy −0.400 ***
(0.132)
Policy × Geographic distance × Internet −0.258 *
(0.133)
Socio-economic control variables × Time-fixed effectsYESYESYES
Geographic control variables × Time-fixed effectsYESYESYES
Meteorological control variablesYESYESYES
_cons10.021
(15.690)
12.089
(15.663)
14.705
(16.048)
Time-fixed effectsYESYESYES
City-fixed effectsYESYESYES
Observations162016201614
R20.1280.1230.118
Note: 1. The brackets are the robust standard errors clustered to the city level. 2. *** and * represent significance levels of 1% and 10%, respectively. 3. Due to the absence of international internet user data for Suihua in 2017, we excluded Suihua from the regression in Column (3).
Table 8. Results of moderation testing.
VariablesNon-Grain
(1)(2)(3)
Policy × Geographic distance0.524 ***
(0.107)
0.303 **
(0.139)
0.262 *
(0.153)
Policy × Geographic distance × Grain−0.428 ***
(0.135)
Policy × Geographic distance × Higher–level 0.399 **
(0.172)
Policy × Geographic distance × Ethnicity 0.315 **
(0.129)
Socio-economic control variables × Time-fixed effectsYESYESYES
Geographic control variables × Time-fixed effectsYESYESYES
Meteorological control variablesYESYESYES
_cons11.726
(15.494)
14.038
(15.836)
12.400
(15.652)
Time-fixed effectsYESYESYES
City-fixed effectsYESYESYES
Observations162016201620
R20.1220.1190.119
Note: 1. The brackets are the robust standard errors clustered to the city level. 2. ***, **, and * represent significance levels of 1%, 5%, and 10%, respectively.
Disclaimer/Publisher’s Note: The statements, opinions and data contained in all publications are solely those of the individual author(s) and contributor(s) and not of MDPI and/or the editor(s). MDPI and/or the editor(s) disclaim responsibility for any injury to people or property resulting from any ideas, methods, instructions or products referred to in the content.

