Article

Spatial and Temporal Evolution Assessment of Landscape Ecological Resilience Based on Adaptive Cycling in Changsha–Zhuzhou–Xiangtan Urban Agglomeration, China

1
College of Landscape Architecture & Hunan Big Data Engineering Research Center of Natural Protected Areas Landscape Resources & Institute of Urban and Rural Landscape Ecology, Central South University of Forestry and Technology, Yuelushan Laboratory Carbon Sinks Forests Variety Innovation Center, Changsha 410004, China
2
Management Committee of Hangzhou Campus of Zhejiang Normal University, Jinhua 321004, China
3
College of Public Administration, Huazhong University of Science and Technology, Wuhan 430079, China
*
Authors to whom correspondence should be addressed.
Land 2025, 14(4), 709; https://doi.org/10.3390/land14040709
Submission received: 26 February 2025 / Revised: 24 March 2025 / Accepted: 24 March 2025 / Published: 26 March 2025

Abstract

:
Urban agglomeration ecosystems are impacted by human activities and natural disasters, so analyzing the spatial and temporal evolution of landscape ecological resilience from the perspective of adaptive cycling is crucial. Using the Changsha–Zhuzhou–Xiangtan urban agglomeration in China as a case study, this research constructs a “Risk-Potential-Connectivity” framework to evaluate ecological resilience. This framework applies exploratory spatial data analysis methods to examine the spatiotemporal evolution and associated patterns of resilience and the Geodetector model to measure the driving factors of spatial variation. This study constructs an adaptive cycle model based on ecological resilience analysis, integrating potential and connectivity indices to classify the development stages of urban agglomeration regions dynamically. The results showed that the overall spatial distribution pattern of ecological risk decreased from the center outward, whereas ecological potential and connectivity increased. The average resilience index from 2000 to 2020 was 0.31, with a declining trend and shifting center of gravity from northwest to southeast. The spatial and temporal distribution of toughness exhibited high and low aggregation, with an overall Moran index greater than 0.75. Land-use intensity had the strongest explanatory power (q = 0.3662) for the spatial differentiation of landscape ecological resilience drivers and the joint effects of factor interaction had a higher explanatory power than single factors. Adaptive cycle analysis revealed that Furong District is in the protection stage, Xiangtan County in the development stage, and Liling City in the reorganization stage, with no region yet in the release stage. The findings offer a better understanding of the interactive adaptation characteristics and evolutionary patterns of social-ecological systems over extended periods, providing scientific support for the formulation of protection strategies to respond to dynamic changes in urban agglomeration ecosystems.

1. Introduction

Urban agglomerations are collections of cities with transportation, production, information, technology, and culture at the core. They are a concrete manifestation of spatial agglomeration, linkage, and centrality of population density and land-use types. A complex and dynamic urban agglomeration ecosystem exhibits multi-stability and dynamic development characteristics [1]. Urban agglomerations face long-term, complex risks that exacerbate vulnerabilities and disrupt self-regulation [2,3]. Landscape ecological resilience is an important indicator for preserving ecosystem structure, function, and quality. The concept of “evolutionary resilience” focuses on a system’s ability to withstand perturbations and risks, self-adjust, and adapt after impacts [4,5,6,7]. Adaptive cycling theory, an important model for resolving the problems of complex systems, includes four cyclic processes (development, protection, release, and restructuring) and three attributes to characterize potential, connectivity, and resilience [8,9,10]. Given that resilience attributes are interrelated and the influence of each factor cannot be analyzed independently, analyzing the dynamic characteristics of landscape ecological resilience from the perspective of the adaptive cycle provides a more comprehensive understanding [11]. Therefore, based on landscape ecology theory, this study comprehensively considers the diversity, dynamics, and complexity of nature-society-ecology, analyzes the dynamic changes in system attributes, and identifies the development stages in different regions. It provides a foundation for comprehending the interactions between nature, society, and ecology, and offers a scientific viewpoint to support the sustainable development of urban agglomerations [12].
In accelerated global urbanization, the contradiction between spatial expansion and ecological protection of urban agglomerations, the main drivers of regional economic growth, is becoming increasingly evident. The urbanization rate in China has risen from 36.2% in 2000 to 63.89% in 2020, and the expansion of construction land has led to a reduction in ecologicalin ecological space [13]. Human activities alter the stress state and coping capacity of the system, and natural disasters trigger the system to recover and renew, with the dynamic interaction mechanism between the two affecting the spatial and temporal evolution characteristics of resilience. A coupled analysis can reveal the intrinsic mechanism of dynamic change in resilience. The ecological space of urban agglomerations is being challenged by both sprawl and ‘suburbanization’, making it increasingly difficult to balance development requirements with a single restoration measure.
Most studies have examined how human activities and natural factors affect ecological resilience in different areas to ensure human-land relations and sustainable development of urban socio-economic systems, including inland economic zones, coastal cities, mountainous urban areas, and forest ecosystems. For example: Liu [14], Ning [15], and Zhang [16] explored the impact of climate change on resilience, evaluated the relationship between ecological resilience and distance bands, and analyzed the potential heterogeneity of urban ecological resilience in the context of urbanization. Chao [17] and Cao [18] examined the interaction between natural landform features and urban landscape evolution and the conflicts between urban resilience and land use change. Wu [19] investigated strategies and mechanisms for enhancing the ecological resilience of resource-based cities through green infrastructure. Zhang [20] identified the key factors influencing ecological resilience and their spatial distribution along the East China Sea coast. Lin [21] and Wang [22] analyzed the synergistic or conflicting relationship between urbanization and ecological resilience in the Yangtze River Economic Belt and the northern Tianshan Economic Belt, revealing the dynamic characteristics of their interaction. Nathwani [23] revealed the structural characteristics and performance of ecological resilience in 27 key cities along the coast of China in the context of climate change; Rumson [24] explored data-driven resilience in East Anglia, UK. Wang [25] determined that the dominant driver of ecosystem resilience in the Plateau Lake Area in Central Yunnan, China, is related to urbanization. Donald A Falk [26] analyzed the process of maintaining or transforming the ecological status of forest ecosystem resilience through the mechanism of “Persistence-Resilience-Reorganization” under risky disturbance. These studies have demonstrated that urban ecological resilience is prone to more complex and variable disturbances on specific scales, and the impact of human activities on resilience becomes more profound. They provide empirical guidance and data support for further research on regional ecological resilience and sustainable development. However, research on urban ecological resilience lacks systematic integration across multiple scales, dimensions, and dynamic changes, particularly regarding the collaborative effects of multiple factors and the construction of adaptive cycle models.
In terms of ecosystem resilience assessment, researchers have provided some qualitative and theoretical frameworks to understand the dynamic response characteristics and driving mechanisms of ecological resilience. For example: Bo [27], Zhang [28], and Meng [29] explored the spatiotemporal evolution and driving factors of ecological resilience under changes in land use, climate, and human activities using the “resistance-adaptation-recovery” framework. Zhang [30], Xu [31], and Zhao [32] used the “pressure-state-response” framework to reveal the dynamic response characteristics and driving mechanisms of ecological resilience during the urbanization process. Lee [33] assessed urban agglomeration ecological resilience through the “morphology-density-coordination” framework. Huang [34] investigated the spatiotemporal differentiation and driving factors of watershed ecological resilience using the “scale-density-morphology” framework. Li [35] examined the spatiotemporal evolution and driving mechanisms of urban resilience within the “source-sink” framework. Tong [36] analyzed the spatiotemporal changes and influencing factors of urban agglomeration ecological resilience through the “complex network” framework. The extant literature on the subject draws on a variety of theoretical frameworks to confirm that ecological resilience is an intrinsic characteristic of urban ecosystems. These studies demonstrate that urban ecosystems possess a dynamic capacity to defend against disturbances, as well as to self-organize and learn. The enhancement of resilience requires a comprehensive consideration of multiple factors. Policies or measures that are synergistic, connected, and modular across regions can effectively alleviate ecological pressures and achieve sustainable system development. However, while they explored the spatiotemporal evolution and driving mechanisms of ecological resilience, providing technical support for optimizing regional resilience, they largely focused on the impact of individual factors on the spatial heterogeneity of ecosystems, with limited exploration of the interrelationships between potential, connectivity, and resilience and their joint impacts.
To address this limitation, this study examines the Changsha–Zhuzhou–Xiangtan urban agglomeration (CZXUA) in China, analyzing the spatial-temporal dynamic evolution trend of landscape ecological resilience and its driving factors from the perspective of the adaptive cycle. The specific objectives were to (1) assess ecological risk, ecological potential, and ecological connectivity; (2) construct a “Risk-Potential-Connectivity” framework and analyze the spatial and temporal evolutionary trends and correlation patterns of resilience and its spatial differentiation drivers; and (3) identify the characteristics of ecosystem change and the dynamic cycle development stage of each district and county of the urban agglomeration from the perspective of the adaptive cycle. Figure 1 presents the research framework and processes. The results of this study will contribute to elucidating the characteristics and evolution of social-ecological system interaction over an extended period. Furthermore, they will offer a scientific foundation for devising ecological protection strategies under the dynamic change in urban agglomeration ecosystems.

2. Materials and Methods

2.1. Study Area

CZXUA is located at 26°03′ N–28°40′ N, 111°53′ E–114°15′ E. It includes basins and hills interspersed with towns and villages. CZXUA is characterized by a unique ecological pattern and presents a spatial structure of “one main and two sub-centers around the green center”, with Changsha as the main core, Zhuzhou and Xiangtan as the sub-centers, and the combined area of the three cities as the green center (Figure 2). A preponderance of mountains can be observed within the western and southeastern regions, the complex topography and ecological environment of CZXUA provide a distinct context for studying landscape ecological resilience. In 2023, CZXUA was predicted to have a total population of 17,066,300 people and an annual gross domestic product (GDP) of 2.07 trillion yuan, accounting for more than 40% of the contribution of the province, making it the region with the most significant changes in urbanization and ecological environment. The urbanization rate increased from 31.88% in 2000 to 73.53% in 2020. The significant expansion of urban areas has encroached upon large portions of ecological land, such as grasslands and forests, leading to landscape fragmentation and the degradation of ecosystem functions, severely threatening the ecological sustainability of the region. Increased.

2.2. Data Sources and Processing

This study utilized multiple data sources to assess landscape ecological resilience, including land use data for 2000, 2010, and 2020, GDP, meteorological data, vegetation coverage, PM2.5, surface temperature, soil types, nighttime lights, evapotranspiration, net primary productivity, NDVI, population, and road network data (Table 1). All data sources were rigorously selected to ensure their reliability and accuracy. A consistent geographic projection coordinate system (WGS1984-49N) was applied to ensure spatial reference system consistency across all datasets. Missing data were substituted with values from nearby areas.
Following an analysis of the impact of different granularity intervals on the output of regional information loss evaluation models [37], the granularity was set at 50 m. In addition, using a moving window method and semi-variance function, the optimal window scale was determined to be 500 m. To ensure data compatibility and consistency, all grid data were resampled to 500 m × 500 m pixel sizes.

2.3. Research Methodology

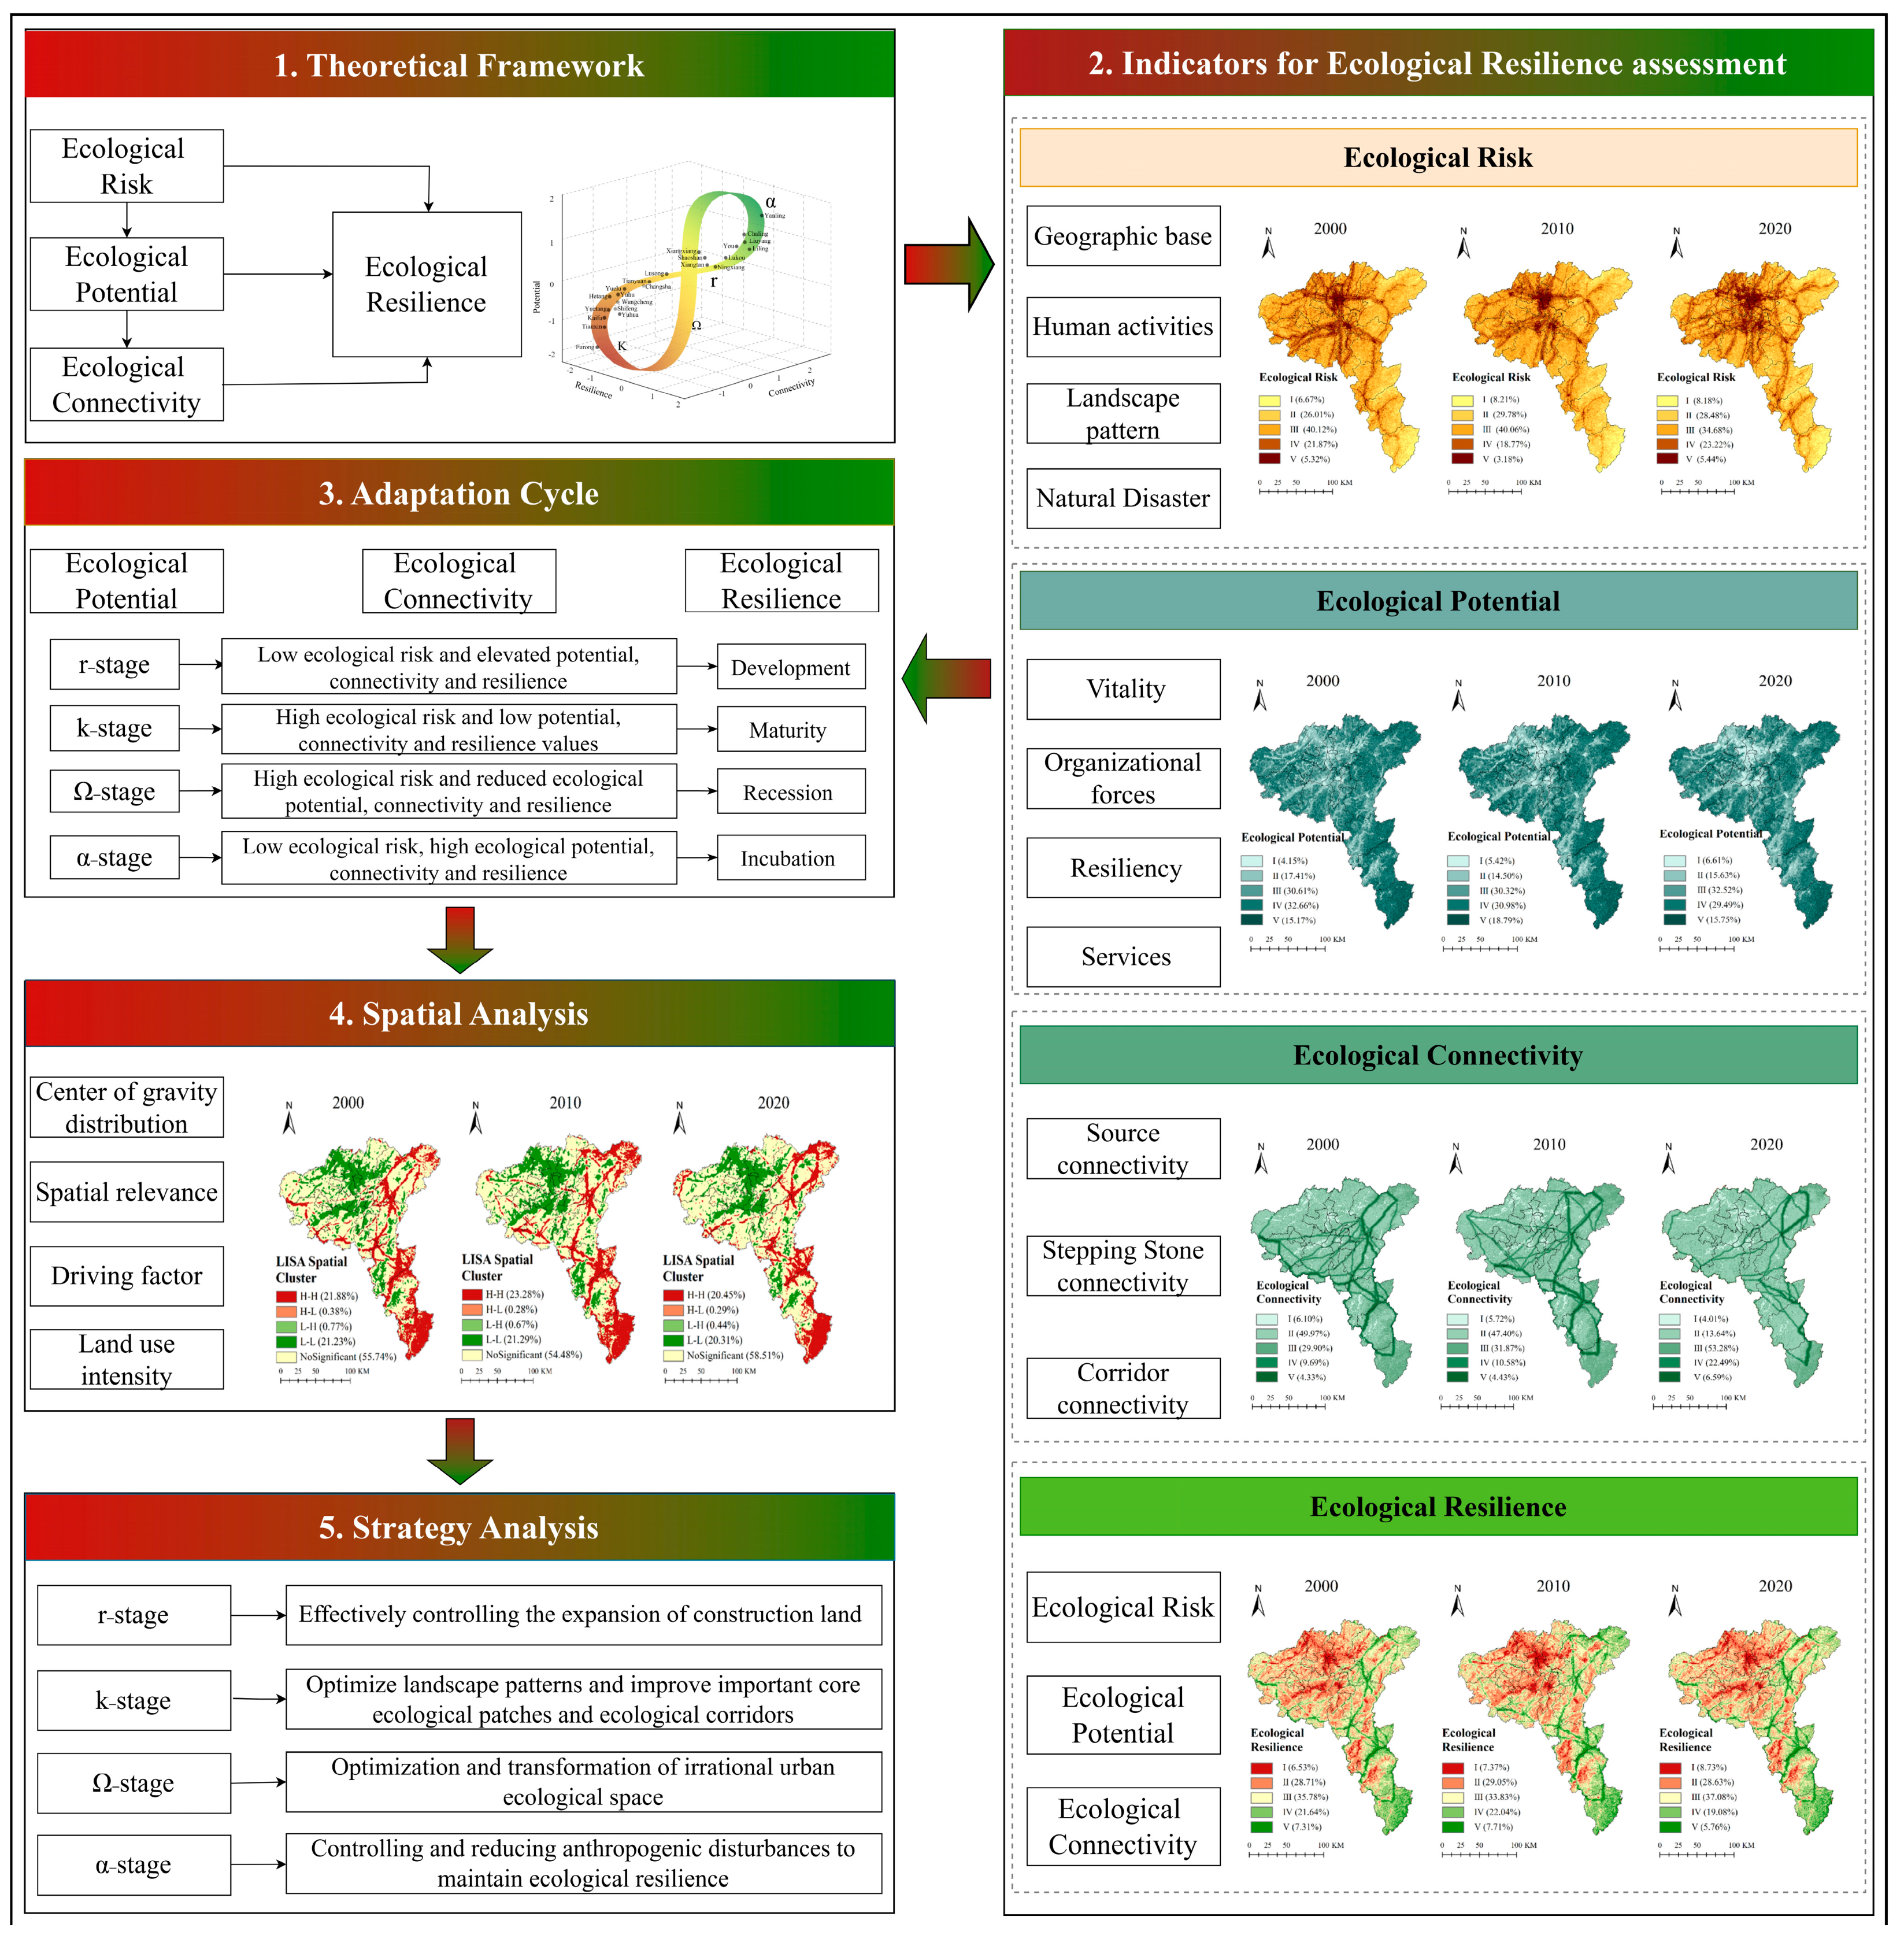
2.3.1. Indicators of Landscape Ecological Resilience

An urban agglomeration ecosystem is a typical natural-social-economic composite system faced with the risks of multidimensional factors, characterized by multiple sources, exposures, and complex disturbance mechanisms [38,39]. Adhering to the principles of systematization, quantifiability, and ecological process relevance, this study incorporated natural background constraints and human activity disturbances from a dual perspective. We selected four indicator categories (geographical foundation, landscape patterns, human activities, and natural disasters) comprising 15 indicators made with the intention of emphasizing the attributes of resistance, adaptation, resilience, and renewal, which are considered to be of particular significance in terms of ecological resilience. The construction of a closed network of “natural background constraints—landscape function response—human disturbance pressure—disaster risk feedback” was undertaken for the purpose of assessing the spatial distribution of ecological risk.
The geographical foundation indicators included the terrain position index, terrain roughness, and soil types. These indicators quantify the inherent resistance thresholds of ecosystems to external disturbances, chosen to establish the ecological risk substrate. The terrain position index and terrain roughness can reflect potential risks associated with soil erosion and the occurrence of geological disasters [40]. Soil types were chosen as they influence carbon sequestration, erosion resistance, local climate regulation, and habitat quality.
The landscape pattern indicators included the landscape disturbance index, NDVI, Shannon diversity index, and contagion index, and were selected to reflect the stability of the system structure to achieve resilience. The landscape disturbance index quantifies the extent of landscape disturbance (often calculated using patch density, landscape fragmentation index, and landscape separation index), while the other three indices reflect vegetation coverage, landscape heterogeneity, and landscape integrity, which are negatively correlated with landscape ecological risk [41].
The human activity indicators included population density pressure, economic pressure (GDP), air pollution pressure (PM2.5), electricity consumption pressure (nighttime light intensity), transportation network pressure, and land use pressure and were selected as dynamic sources of stress to reflect the environmental pollution, infrastructure strain, and landscape fragmentation effects associated with urbanization [42], to measure the anthropogenic interference with resilience thresholds.
The natural disaster indicators included geological hazards, flood and waterlogging, and surface thermal environment and were selected to characterize the constraints on regenerative renewal of toughness after damage. Geological hazards describe the risks of extreme events such as landslides and mudslides within urban agglomerations. The flood index reflects risks associated with flooding from extreme precipitation, while the surface thermal environment index highlights the urban heat island effect, with higher surface temperatures indicating increased ecological risks [43].
By integrating all of these indicators through spatial coupling and causal transmission, this study offers a comprehensive portrayal of the complexity and cascading characteristics of ecological risk. This approach incorporates both static attributes and dynamic processes while also integrating environmental exposure and social vulnerability factors.
To eliminate dimensional differences, this study applied a range normalization method, standardizing all indicator values within the [0–1] range (see Table 2). In the weight assignment process, the Analytic Hierarchy Process (AHP) and inter-standard correlation weighted averaging method were used to determine the final weights of the indicators [20]. AHP constructed a judgment matrix through pairwise comparisons, calculated the characteristic vector weights, and performed a consistency test (CR = 0.0516, which satisfies the CR < 0.1 standard) to ensure the scientific validity of the weight assignments, while the inter-standard correlation method calculated the objective weight for each indicator based on data standard deviation and the Pearson correlation coefficient matrix, reducing human bias and subjectivity. The combination of these two methods retains the logical rigor of systematic decision-making while correcting subjective bias through data quantification and achieving scientific allocation of weights by comprehensively considering comprehensiveness and objectivity.
“Potential” refers to the attributes of the ecosystem itself, its ability to meet human development needs and mitigate risk, and its self-repairing and regenerating capacity, which are crucial for the sustainable development of urban ecosystems. Referring to the improved ecosystem health assessment model [53], this study used ecosystem health to characterize the potential of sustainable development of urban cluster ecosystems in combination with ecosystem service functions. The formula is as follows:
he EcoP = P H × E S V
P H = E V × E O × E R 3
where EcoP is ecosystem potential; PH is ecosystem organizational health; ESV is ecosystem services, including carbon sequestration, habitat quality, water containment, and soil conservation services, which were calculated using the InVEST3.14 model and normalized and summed to obtain ecosystem services [54]; and EV, EO, and ER are ecosystem vitality, organization, and resilience, respectively.
This study characterized ecosystem vitality in terms of net primary productivity (NPP), Organizational strength is the number and diversity of interactions among ecosystem components evaluated. The formula is as follows:
E O = 0.35 × L H + 0.35 × L C + 0.3 × I P C = 0.2 × S H D I + 0.15 × A M P F D + 0.2 × P D + 0.15 × C O N T A G + 0.1 × P D 1 + 0.05 × C O H E S I O N 1 + 0.1 × P D 2 + 0.05 × C O H E S I O N 2
where SHDI, AMPFD, PD, and CONTAG are the Shannon diversity index, area-weighted mean patch fractal index, patch density, and spread index, respectively; PD1 and PD2 are the water and forest landscape patch densities, respectively; and COHESION1 and COHESION2 are the water and forest landscape spread indices, respectively.
Land use can reflect ecosystem resilience, and the resilience coefficients of different land use are set according to their ease of recovery, characterized by the area and ecological resilience coefficients of each land use in the region [55,56], The formula is as follows:
E R = i = 1 n A i A × R C i
where ER is the ecosystem resilience, A is the total land use area, Ai denotes the area of the i land use, and RCi denotes the ecological resilience coefficient of the i land use. The ecological resilience coefficients of cultivated land, forest, grassland, water body, construction land, and bare land are 0.3, 0.8, 0.6, 0.8, 0.2, and 1 [57].
Ecological connectivity is a core mechanism for responding to ecological risks, and maintaining ecosystem stability and health can reduce landscape fragmentation and improve regional habitat quality and ecosystem self-recovery [58]. This study measures the ecological connectivity of urban agglomerations by integrating source-country connectivity, stepping-stone connectivity, and corridor connectivity. Among them, ecological source-country connectivity was assessed by indicators such as ecological potential, connectivity probability, and source area share [59,60,61], and ecological stepping-stone connectivity was assessed by combining patch morphology and ecological potential [62], The formula is as follows:
E S C = 0.5 × E c o P + 0.25 × A R E A + 0.25 × d P C
E S s C = 0.5 × A R E A s A R E A s + A R E A + 0.5 × E c o P E L P
where ESC is ecological source-country connectivity; AREA is the percentage of ecological source-country area in the 500 m grid; dPC is the probability of connectivity. ESsC is the ecological stepping stone connectivity; AREAs is the percentage of stepping stone area in the 500 m grid; ELP is the percentage of ecological land in the grid (water, grassland, and forest). All data were subjected to standard normalization before being brought into the equation.
Ecological potential was assessed using the InVEST model, which applied landscape morphology spatial pattern analysis to identify high-potential ecological source sites. The least cumulative resistance model and gravity model are then used to assign values to ecological corridor connectivity under the principle of approximate linear attenuation of gravitational values [63] (Table 3).

2.3.2. Landscape Ecological Resilience

Urbanization imposes multidimensional pressures that lead to the fragmentation of landscape patterns, degradation of ecosystem functions, and increased risks. Ecosystems can leverage their high-potential states to alleviate external risks and adapt to environmental changes, thus achieving system balance and renewal.
Ecological risk reflects the external multidimensional disturbances and pressures on the system, while potential reflects the state of health of the system. Connectivity, through spatial connections of landscape components, responds to ecological risks, thereby triggering system recovery and regeneration. Based on the “Pressure-State-Response” model and integrating the system’s risk response feedback mechanism, this study constructs a “Risk-Potential-Connectivity” evaluation framework. Using a multidimensional factor assessment methodology [64], each line segment represents ecological risk, ecological potential, and ecological connectivity, respectively, and the area of the polygon formed by the sequence of line segments represents the landscape ecological resilience of urban agglomerations. The formula is as follows:
E c o R = 0.5 × s i n 120 ° × ( E c o S × E c o P + E c o S × E c o C + E c o C × E c o P )  
where EcoR is the ecological resilience of the urban agglomerations; EcoS, EcoP, and EcoC are risk, potential, and connectivity, respectively.

2.3.3. Adaptive Cycling Stages

Multi-stable mechanisms are present in ecosystems due to external risks, coercion, and ecosystem changes, which result in the decline of original healthy ecosystems into sub-healthy states. Ecosystems in sub-healthy states can be resurrected to a healthy state due to their self-organized connectivity and recovery potential. The adaptive cycle theory provides a robust framework for understanding the complex adaptive processes of ecosystems, explaining dynamic system changes through cyclic feedback mechanisms [65]. Initially proposed by Holling et al. [6], this theory emphasizes the periodic adaptive reconstruction and transition processes that systems undergo in response to risks, disturbances, and other external shocks.
System development is divided into four phases: exploitation (γ), conservation (k), release (Ω), and reorganization (α). In the exploitation (γ) phase, the system accumulates resources and energy, leading to an increase in potential and connectivity. During the conservation (k) phase, resource demands to maintain system balance rise, resulting in stability, though internal structures become more rigid and vulnerable. In the release (Ω) phase, external disturbances or internal structural optimizations release inherent resources, reducing connectivity and pushing the system into a state of decline. In the reorganization (α) phase, the system adjusts by learning and restructuring, ultimately shifting towards a new equilibrium.
The mechanism of the adaptive cycle is driven by the interplay between potential and connectivity. System potential is regulated by connectivity— the stronger the connectivity, the greater the flexibility of the system and its ability to respond to external risks [66]. Drawing on this theory, the present study analyzed the spatial distribution of ecological potential, connectivity, and resilience values, and constructed an adaptive cycle model to identify the development stage of different regions. Based on the model results, this study proposed targeted ecological space protection strategies for urban agglomerations, providing a scientific basis for the sustainable development of regional ecosystems [67].

2.3.4. Moran’s Index

Global spatial autocorrelation measures the degree of spatial autocorrelation within a study area, whereas local spatial autocorrelation analyzes the degree of adjacent spatial correlation and is used to identify clusters of high and low values of local spatial locations. Moran’s index quantifies the degree of similarity of attribute values of spatially adjacent or neighboring regional units, ranging from −1 to +1. The global Moran’s index (IG) and local Moran’s index (IL) are commonly used, and their expressions are as follows:
t h e   I G = n i = 1 n j = 1 n w i j ( x i x ¯ ) ( x j x ¯ ) S 2 i = 1 n j 1 n w i j , ( i j )
S 2 = 1 n i = 1 n ( x i x ¯ ) ;   x ¯ = 1 n i = 1 n x i
I L = ( x i x ¯ ) j = 1 n w i j ( x j x ¯ ) S 2 , ( i j )
where IG and IL are the global and local spatial autocorrelation index values of landscape ecological toughness, respectively; n is the total number of rasters; S2 is the variance of the toughness value of each raster; xi and xj are the i and j raster toughness values; x ¯ is the average value of all raster attributes; and wij is the spatial weight.

2.3.5. Geodetector Model

Geodetector is a statistical method to detect geospatial stratified heterogeneity and the driving forces behind it [68]. This study applied factor detection and interaction detection to analyze the spatial differentiation of landscape ecological resilience in CZXUA [69]. Factor detection quantifies the spatial heterogeneity of resilience and whether there is a driving force for spatial differentiation with the independent variable. Interaction detection identifies the interactions of different factors superimposed on each other, assessing the combined effects of multiple factors compared to individual factors. The formula is as follows:
q = 1 h = 1 L N h σ h 2 N σ 2
where q is the factor explanatory power index, ranging from [0–1], with the larger the value, the stronger the explanatory power of the factors on the spatial distribution of landscape ecological resilience; N is the total number of samples; σ2 is the variance of the dependent variable; Nh is the sample size and variance of the stratum h; σh2 is the variance of the stratum h; and L is the stratification of the dependent or independent variable.

3. Results

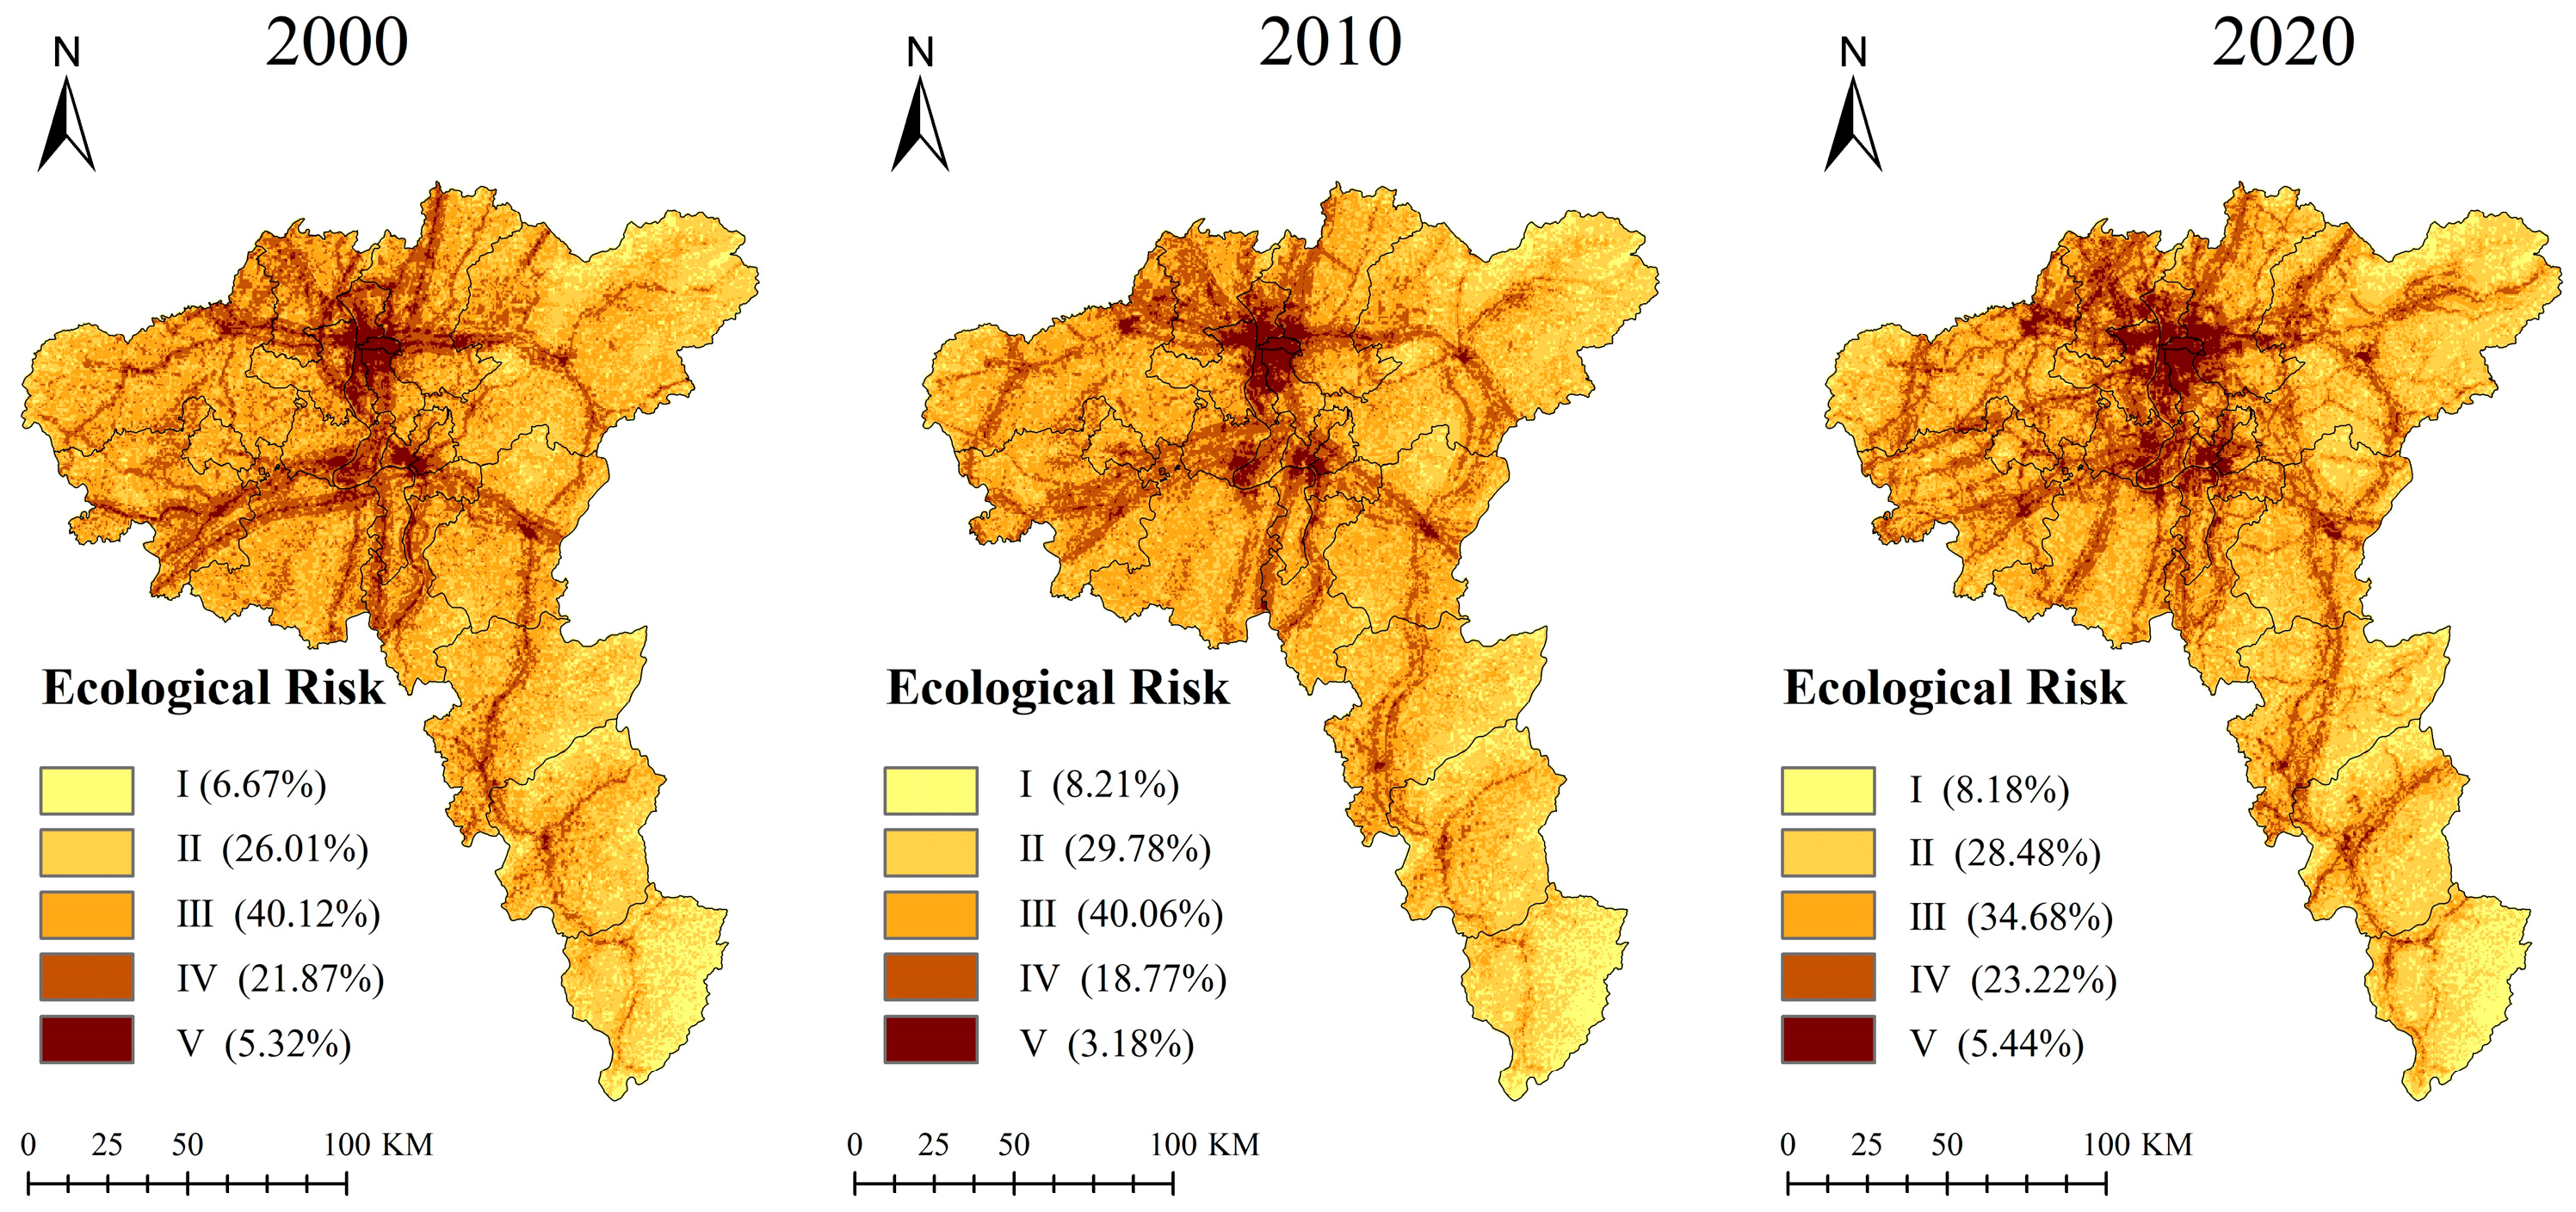
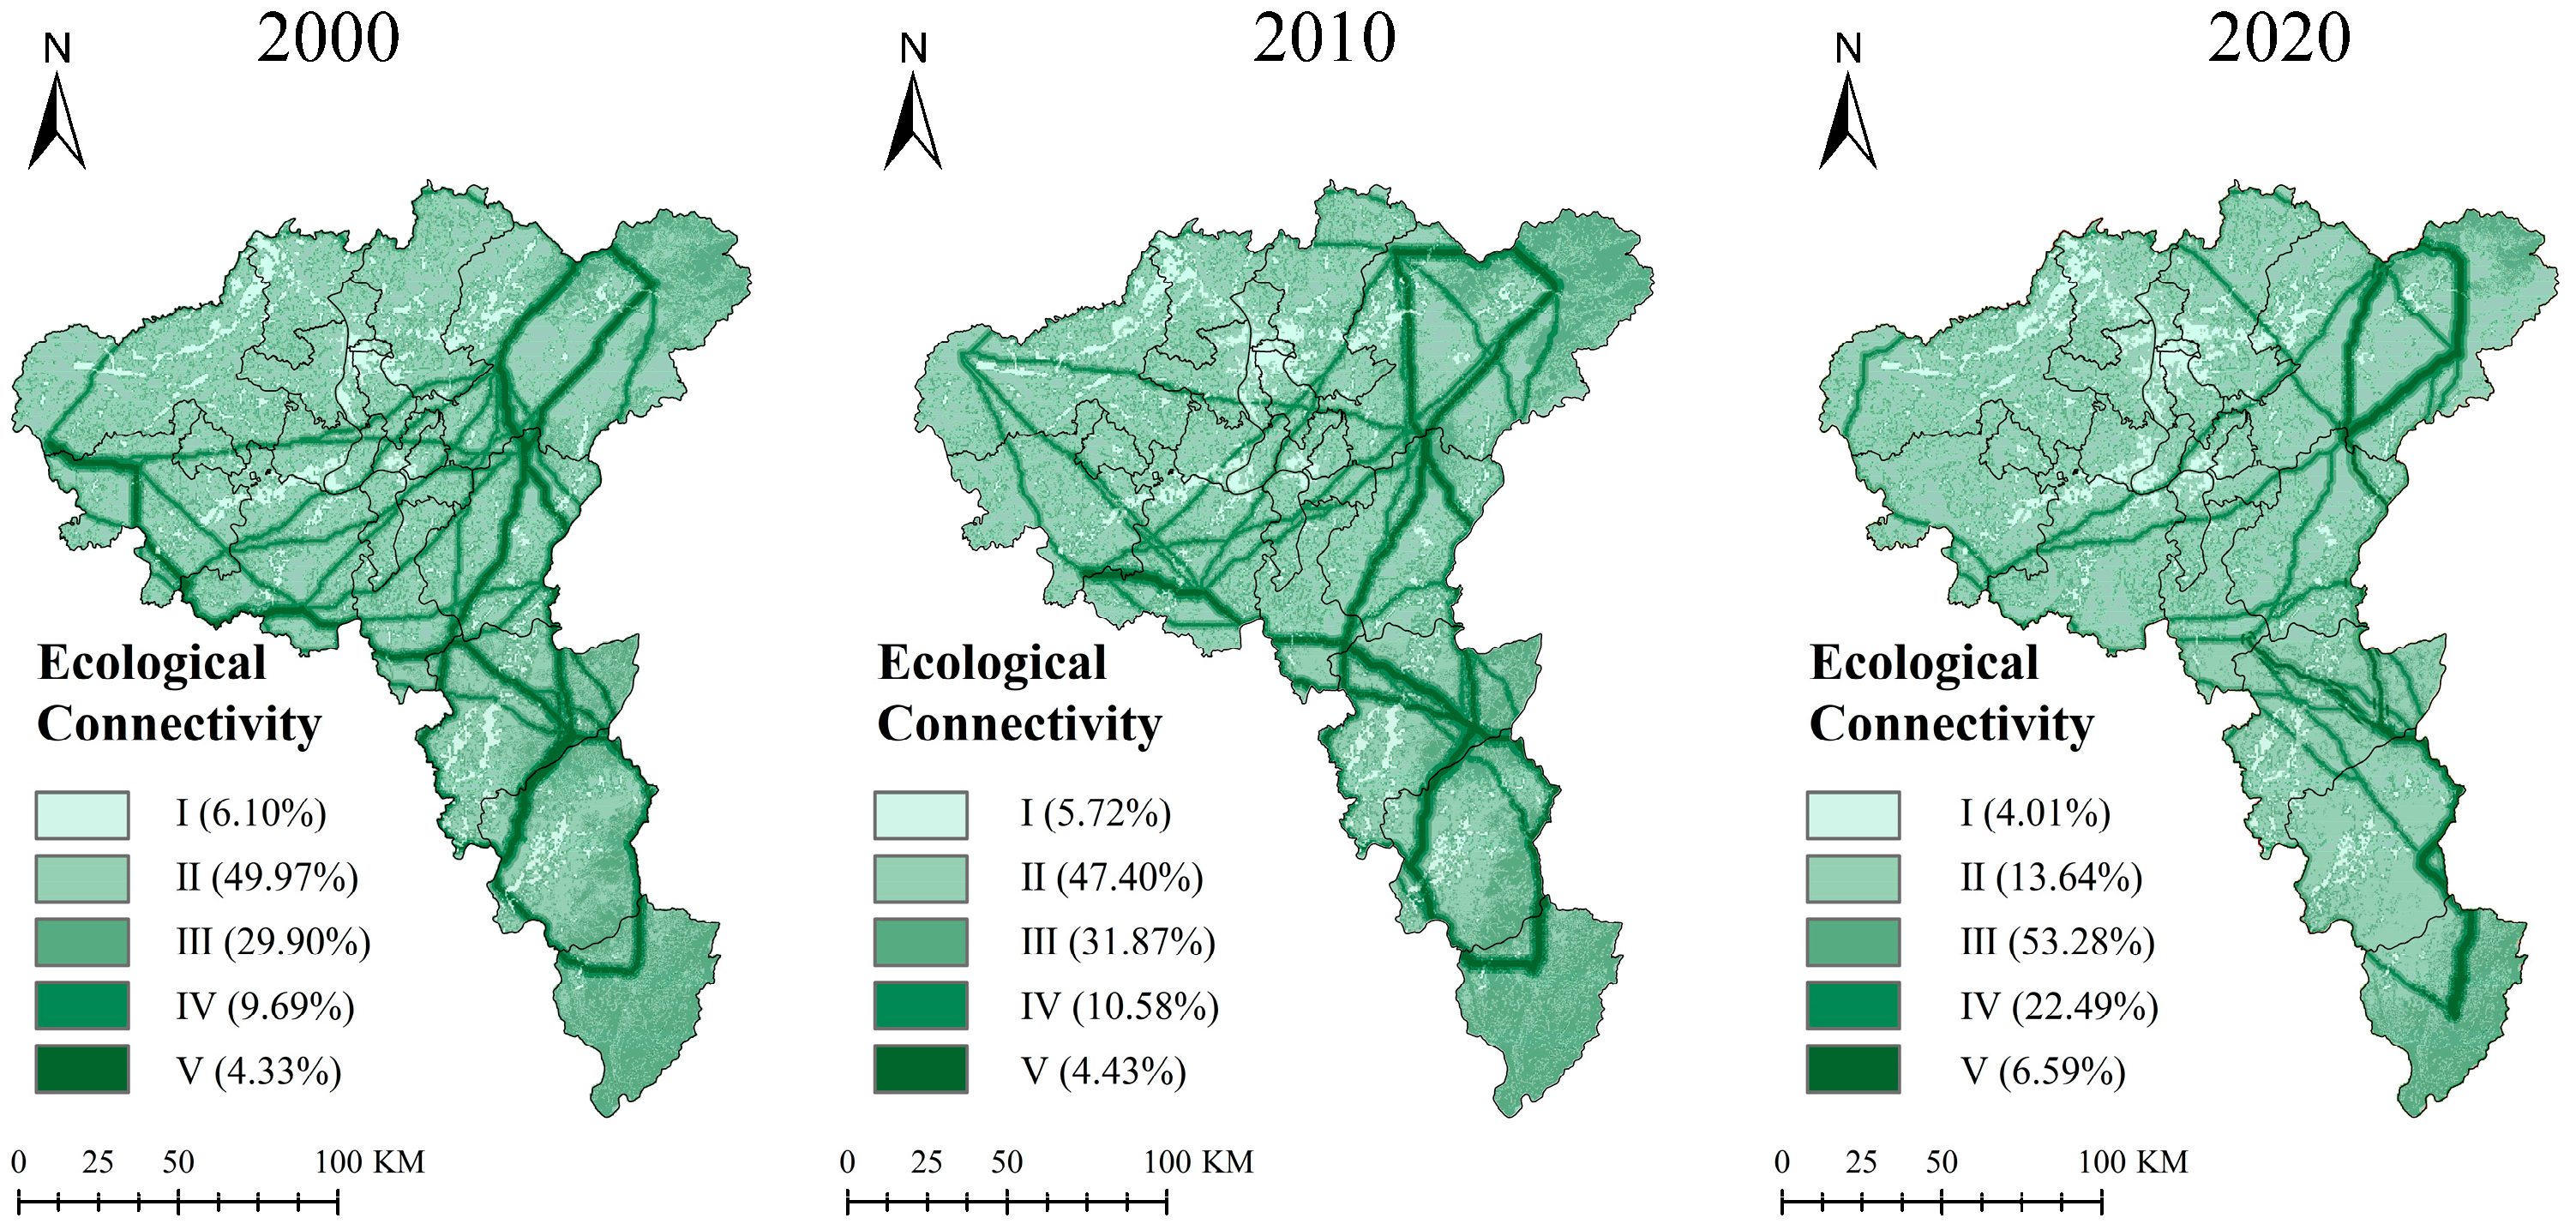
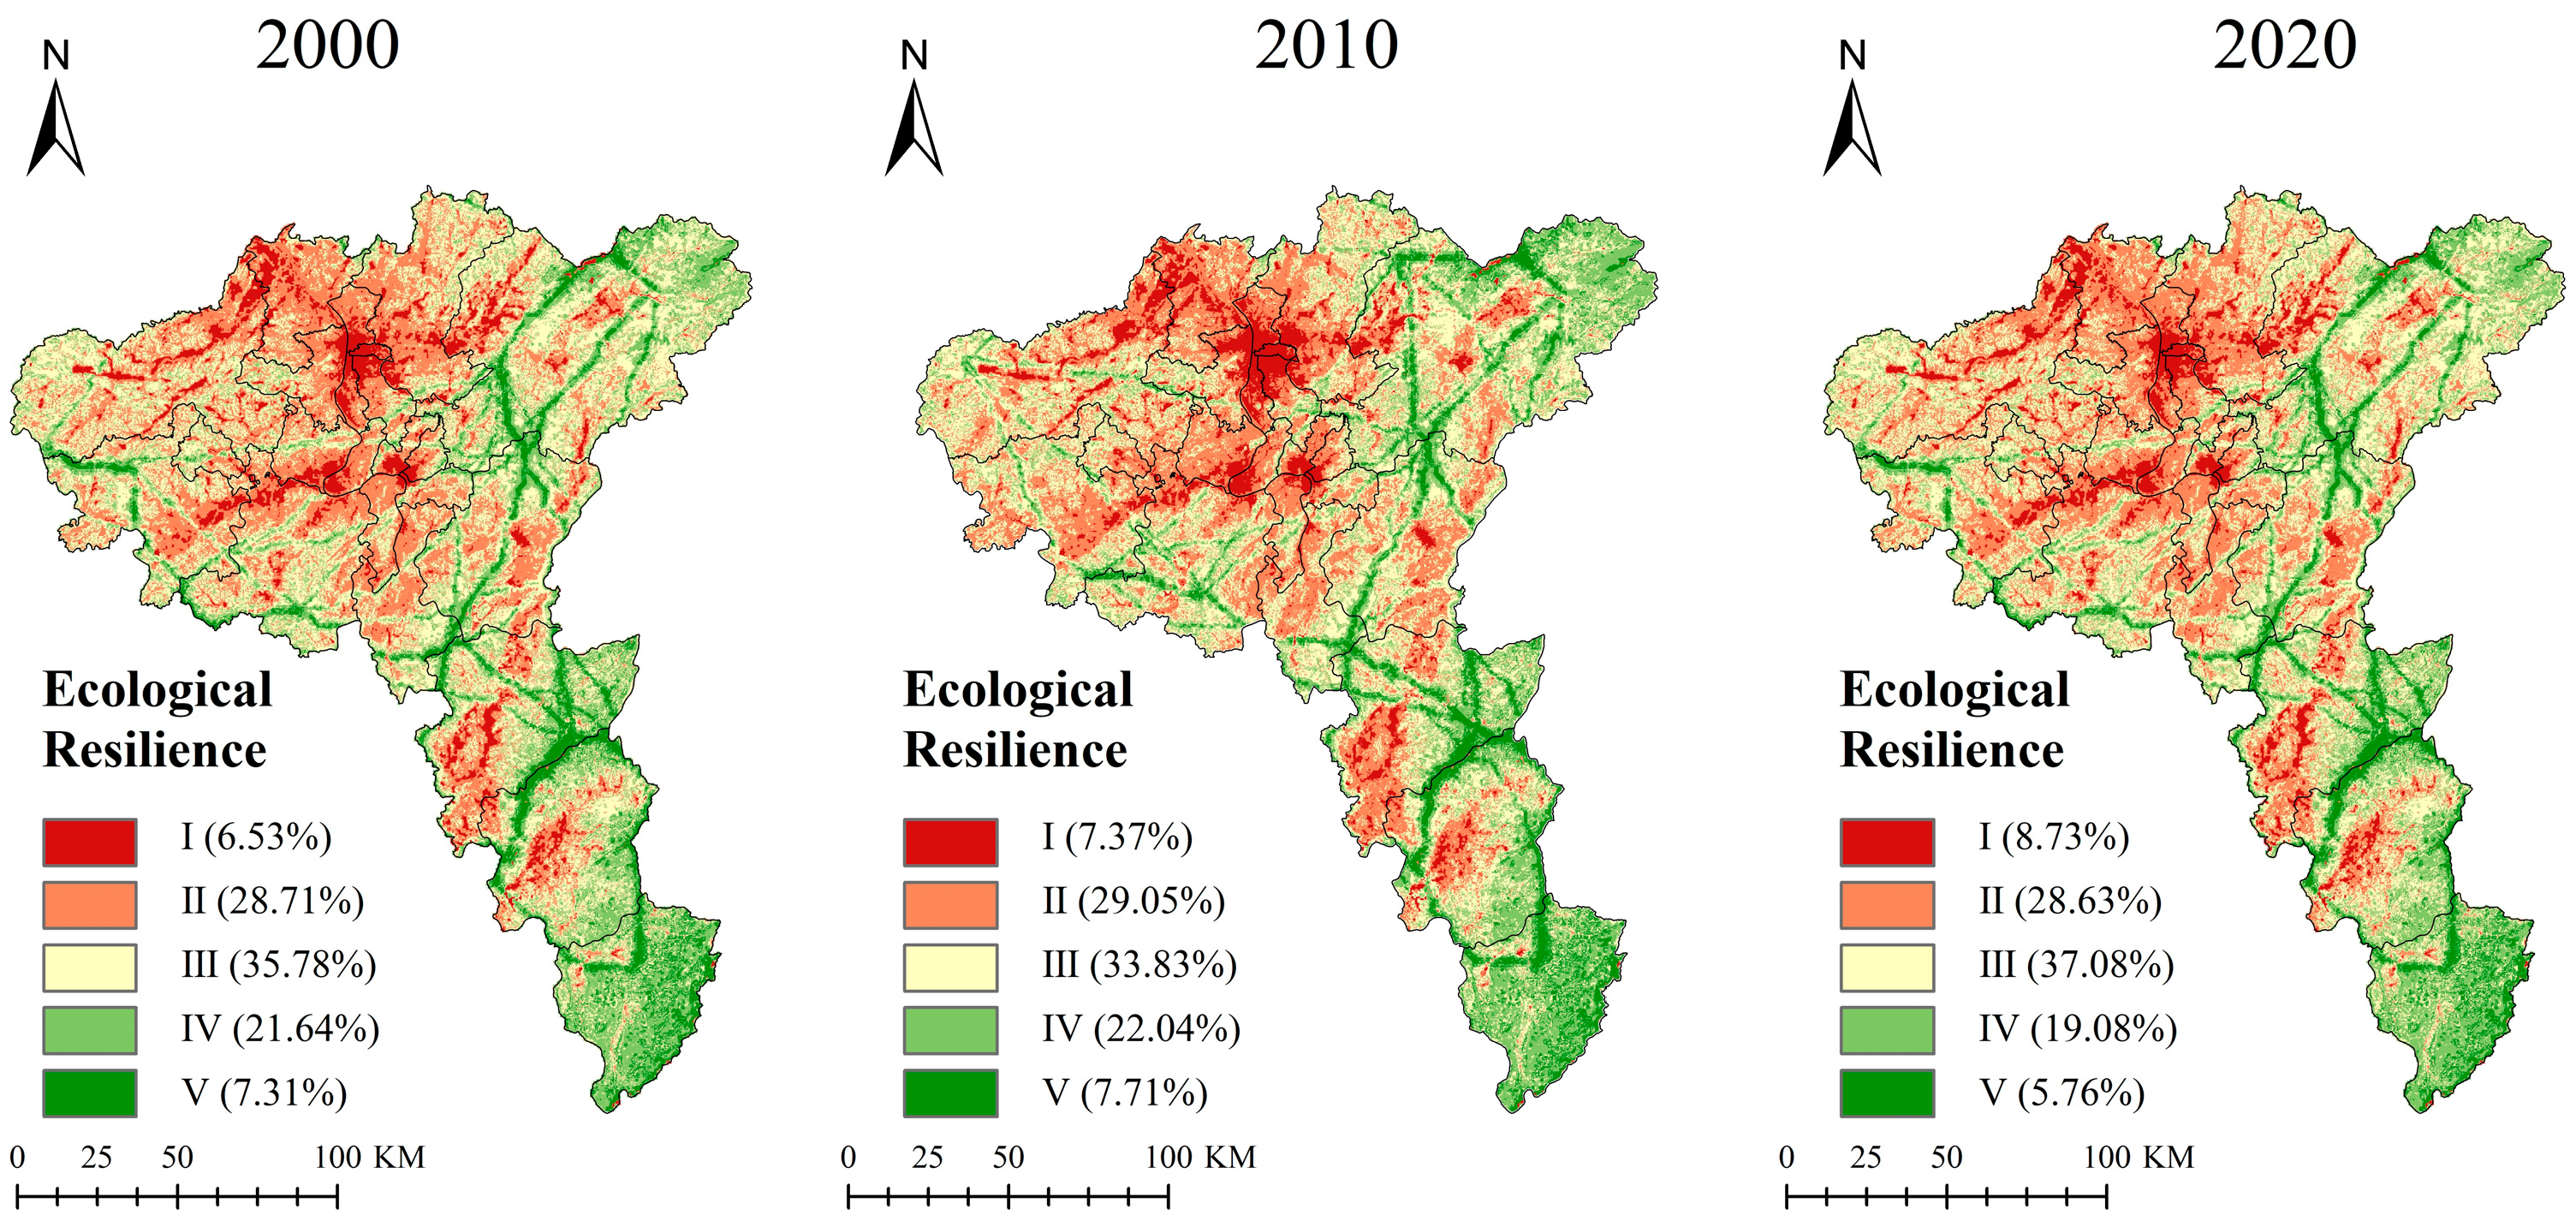
3.1. Assessment of Landscape Ecological Resilience Indicators

The spatial distribution patterns of ecological risk, potential, and connectivity in the CZXUA from 2000 to 2020 were determined using evaluation methods for landscape ecological resilience indicators and natural breakpoint classification (Figure 3, Figure 4 and Figure 5). From 2000 to 2020, the ecological risk steadily increased from 0.3875 to 0.3966, a rise of 2.35%, while ecological potential and connectivity continually declined, from 0.4389 to 0.4327 (1.43%) and 0.3456 to 0.3120 (10.77%), respectively. These changes were driven by several factors, including a reduction in green spaces (2.44% decrease in area), degradation of ecosystem functions (15.18% in ecosystem services), fragmentation of landscape patches (34.55% decrease in ecological corridors), and increased pressure from economic development.
In response, to achieve the sustainable and healthy development of the socio-ecological system, it is critical to prioritize the establishment of ecological protection boundaries, promote low-impact development models to improve the efficiency of green infrastructure services and create inter-regional mechanisms for coordinated economic and ecological development. The overall ecological risk exhibited a decreasing trend from the center to the periphery, and the high-risk areas were mainly concentrated in the core urban areas of Changsha, Zhuzhou, and Xiangtan, where the land use is mostly construction land and the patches are mostly in the form of agglomerated blocks and strips. This is consistent with the trend of the distribution of the urban transportation network and construction land expansion area. In addition, low-risk areas were concentrated in Liuyang, You, Chaling, Yanling, and other marginal districts and counties. These areas are dominated by forests and grasslands with patches, which provide significant protection. The ecological potential and connectivity gradually increased from the center to the periphery. Low-potential and low-connectivity areas were mainly concentrated in the core urban areas, dominated by construction land, with patches spreading to the periphery in the form of radiation. In contrast, high-potential and high-connectivity areas were distributed in the fringe districts and counties, dominated by forest and grassland, with fractured but basically stable spatial patterns, with sheet-like or strip-like patches. The results indicate that the spatial and temporal evolution of ecological risk, potential, and connectivity is not a single process. A comparative analysis of the three indices shows that low-risk areas have better potential and connectivity, while high-risk areas have lower potential and connectivity.
The spatial distribution of the ecological risk, potential, and connectivity indices were all mainly dominated by classes II, III, and IV, with an area share of more than 70%. Compared with 2000–2010, the trend of change in 2010–2020 shows that the ecological risk I and II level areas increased and then decreased, III level areas continually decreased, and IV and V level areas decreased and then increased. This trend may be related to the initial disturbance caused by human activities and the accelerated urbanization process. As a result, the original ecological protective measures are only partially restored. The ecological potential I level area proportion continually increased, II and III level areas first decreased and then increased, and IV and V level areas continually decreased. This trend may be related to transitions between levels, where ecologically healthy source areas are disturbed by human activities, leading to fragmentation of source patches, a decline in habitat quality, and a reduction in biodiversity. The ecological connectivity I and II level areas continually decreased, III and IV level areas continually increased, and V level areas decreased and then increased. This trend may be related to decreasing ecological corridors and increasing stepping stones and connectivity. Overall, the ecosystem of the study area is predominantly in a suboptimal state, experiencing moderate risks while maintaining potential and connectivity for self-recovery. However, if this state persists over the long term, the system may suffer from a lack of high potential and connectivity, leading to an accumulation of system risks and a gradual increase in vulnerability. Therefore, to reduce the risk of collapse in the median region, there is an urgent need to establish a dynamic monitoring mechanism that comprehensively analyses multidimensional attribute characteristics and identifies critical nodes.

3.2. Analysis of Spatial Heterogeneity of Landscape Ecological Resilience

3.2.1. Trends in the Spatial and Temporal Evolution of Landscape Ecological Resilience

This study constructed the “Risk-Potential-Connectivity” model and obtained the spatial distribution pattern of landscape ecological resilience by evaluating the indicators of ecological risk, potential, and connectivity (Figure 6). The results showed that the overall distribution of landscape ecological resilience gradually increased from the center to the periphery. It was high in the east and low in the west, high in the south and low in the north. The low-value area in the center gradually spread, and the low-toughness area is mainly concentrated in the core urban areas, and its land use is dominated by construction land, with patches spreading radially to the periphery. The high-toughness area is distributed in the fringe districts and counties, and its land use is dominated by forest, with patches in the shape of slices or strips. The overall average resilience index from 2000 to 2020 was 0.31, with the annual average declining from 0.3288 to 0.2914, a decrease of 12.83%. Over the past 20 years, landscape ecological resilience continuously declined. This not only leads to the degradation of ecosystem services, weakening the health and stability of ecosystems, but also negatively impacts human quality of life, regional ecological security, and the sustainable development of the socio-economic system. The spatial distribution of resilience was mainly dominated by grades II and III with an area share of more than 60%. Among them, there was an overall increase in the area share of grades I and III landscape ecological toughness and an overall decrease in the area share of grades II, IV, and V landscape ecological toughness. In 2000–2010 and 2010–2020, grade I landscape ecological resilience area continued to increase; II, IV, and V grades landscape ecological resilience areas first increased and then decreased; and grade III landscape ecological resilience area first decreased and then increased. Comparing the trends in risk, potential, and connectivity, the continuous increase in lower resilience and potential levels may be attributed to the degradation or self-repair of high-level landscape ecological conditions. The fluctuating trends in these indicators are likely associated with factors such as excessive population concentration and uneven economic development, leading to increased local vulnerabilities and risk rebounds. Therefore, analyzing the spatial distribution changes in resilience levels requires a focus on the complex interrelationships and driving mechanisms within ecosystems. This approach will help guide the prioritization of ecological restoration efforts, provide early warnings of potential ecological crises, and offer comprehensive scientific support for regional ecological security and sustainable development, from assessment and diagnosis to intervention.
Analysis of the distribution and trajectory of the center of gravity of landscape ecological resilience in CZXUA revealed that the center of gravity of resilience was located in the urban area of Zhuzhou and continuously migrated from the northwest to the southeast, with a gradual slowdown from 2000 to 2020 (Figure 7a). The standard deviation ellipse rotation angle of the center of gravity is approximately 150°, and the direction of the ellipse is consistent with the distribution direction of the main urban area of the urban aggregation. The long axis is approximately twice as long as the short axis, suggesting that the landscape ecological resilience is more widely dispersed in the northwestern-southeastern direction. This feature may be associated with spatially continuous changes in the spatial distribution of landscape ecological resilience in relation to its geographic base (distribution of mountains, and watercourses). Low-grade landscape ecological resilience is mainly distributed in core urban areas because of the high degree of urbanization, pressure of population aggregation, and frequent activities; serious damage to the natural ecosystem; and a decline in the ability of the ecosystem to resist, mitigate, and adapt to risks. As a result, low-resilience zones continue to spread into peripheral areas. The peripheral areas have relatively fewer human interference activities, a better ecological environment background, and higher ecological potential of natural ecosystems such as forests, grasslands, and waters. These are important ecological regulation zones, with stronger stability, self-organization ability, and stronger connectivity in response to external disturbances. Patches of natural habitats are also natural ecological barriers that provide ecosystem services and risk evacuation functions for the core urban area, blocking and buffering the spillover effects of ecological environment pollution and destructive behaviors of the surrounding cities and making the peripheral areas show higher landscape ecological resilience. The landscape ecological resilience levels of districts and counties in CZXUA differed greatly (Figure 7b)., with the highest average value of the resilience index in Yanling County from 2000 to 2020 (0.4433) and the lowest average value of the resilience index in Furong District (0.0589). The landscape ecological resilience indices of Kaifu, Tianxin, and Yutang districts had lower resilience levels, and the rest of the districts and counties fluctuated around the boundaries, with medium and higher resilience levels. Therefore, it should focus on ecological connectivity in the direction of the long axis, strengthen the multi-center group ecological structure, and focus on the change in resilience gradient zone (such as the urban-rural combination), so as to enhance local resilience and gradually realize the coordinated development of ecological protection and economic development.

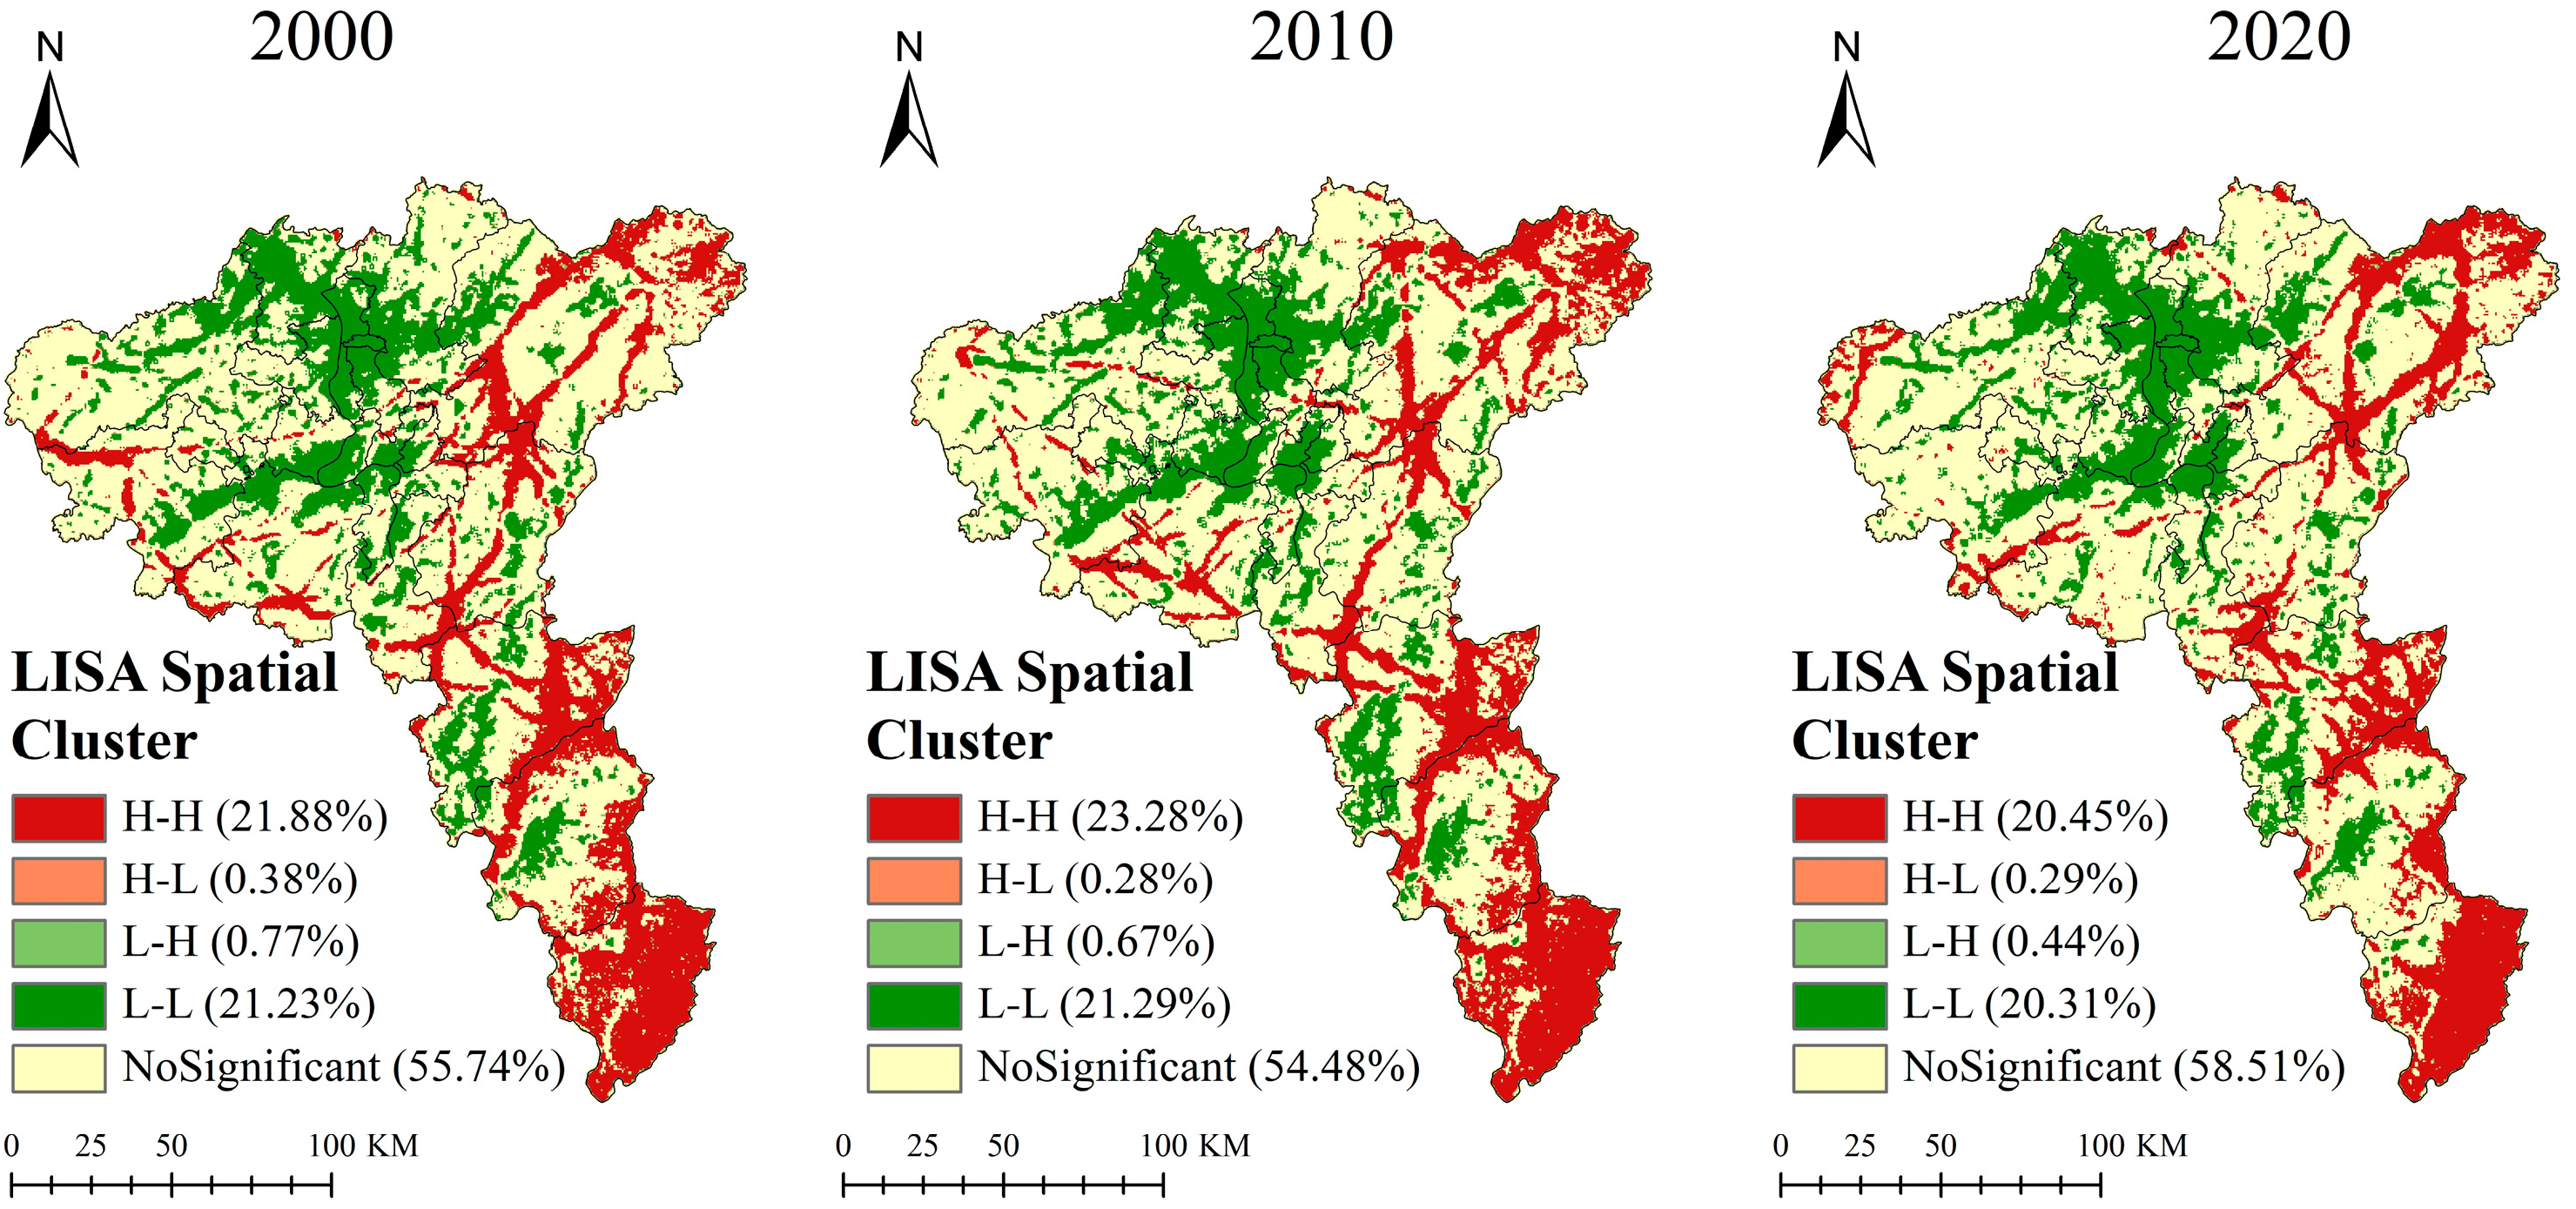
3.2.2. Landscape Ecological Resilience Spatial Association Patterns

From 2000 to 2020, the landscape ecological resilience of CZXUA showed a stable spatial distribution pattern of “high in the peripheral region and low in the central region”. Analysis of the global spatial autocorrelation of landscape ecological resilience showed that the overall Moran’s index was greater than 0.75, showing an increasing trend. This indicates that the spatial clustering trend improved and there is a more significant positive correlation between landscape ecological resilience during the study period. There was a relatively stable distribution of high and low clustering of the landscape ecological resilience index in the region, and the spatial distribution had obvious heterogeneity. Based on this, we further analyzed the local spatial autocorrelation of landscape ecological resilience (Figure 8) and found that the “high-high” agglomeration was distributed in Liuyang, You, Chaling, and Yanling, and other marginal counties in the form of ecological sources and corridors in the form of patches in the peripheral mountainous areas, and the land use was dominated by forest. This agglomeration area will generate spillover effects on the surrounding ecosystems, thereby enhancing the overall stability of the regional ecosystem and identifying clear focal areas for ecological protection. As such, it is crucial to strengthen differentiated management and foster cross-regional cooperation in both ecological protection and regional development to ensure the coordinated conservation of the ecosystem. The “low-low” landscape ecological resilience agglomeration area was mainly distributed in the core area of the urban agglomeration in the form of pieces or clusters and is dominated by construction land. This agglomeration area may be linked to the expansion of construction land, which compresses ecological space and rapidly fragments natural habitats, resulting in the spread of low-value areas. Uncontrolled expansion exacerbates risks to regional ecosystems, economic development challenges, and spatial equity imbalance, ultimately becoming a source of ecological risk and diminishing overall ecological resilience. Therefore, it is crucial to curb the unplanned expansion of construction land in this region, implement gray-green infrastructure to prevent the spread of low-value areas and establish ecological protection buffers to reduce human-induced disturbances. These measures will help address the challenges posed by the concentration of low-resilience areas on the sustainable development of the ecosystem. There are also “low-high” or “high-low” agglomeration characteristics in local areas. The agglomeration areas passed the significance test (p < 0.05) and the distribution of significant areas (p > 0.001) was concentrated in the central core urban areas and the southern fringe districts and counties, showing an expansion trend (Figure 9). This trend suggests that peripheral areas, influenced by the core urban zones, are gradually facing increasing ecological risks as transitional zones of resilience. These areas may become hotspots where ecological potential is impaired, and habitat connectivity is reduced. Therefore, for these areas, it is crucial to implement a development strategy that promotes both conservation and growth, tailored to the specific conditions of the urban-rural interface, to mitigate spatial polarization. By combining the global and local spatial clustering patterns, it can be seen that the overall spatial autocorrelation of landscape ecological resilience in the study area increased, and the spatial clustering and the trend of significance also increased. This trend may be linked to concentrated economic development or policies such as ecological protection redlines and restricted protected areas, which promote the concentration of high-value regions. To address this, differentiated management should be implemented based on the concentration of resilience, thereby reducing governance costs. Additionally, continuous monitoring of resilience trends should be established, along with an early warning system to identify key factors, ensuring the long-term and effective protection of ecological resilience.

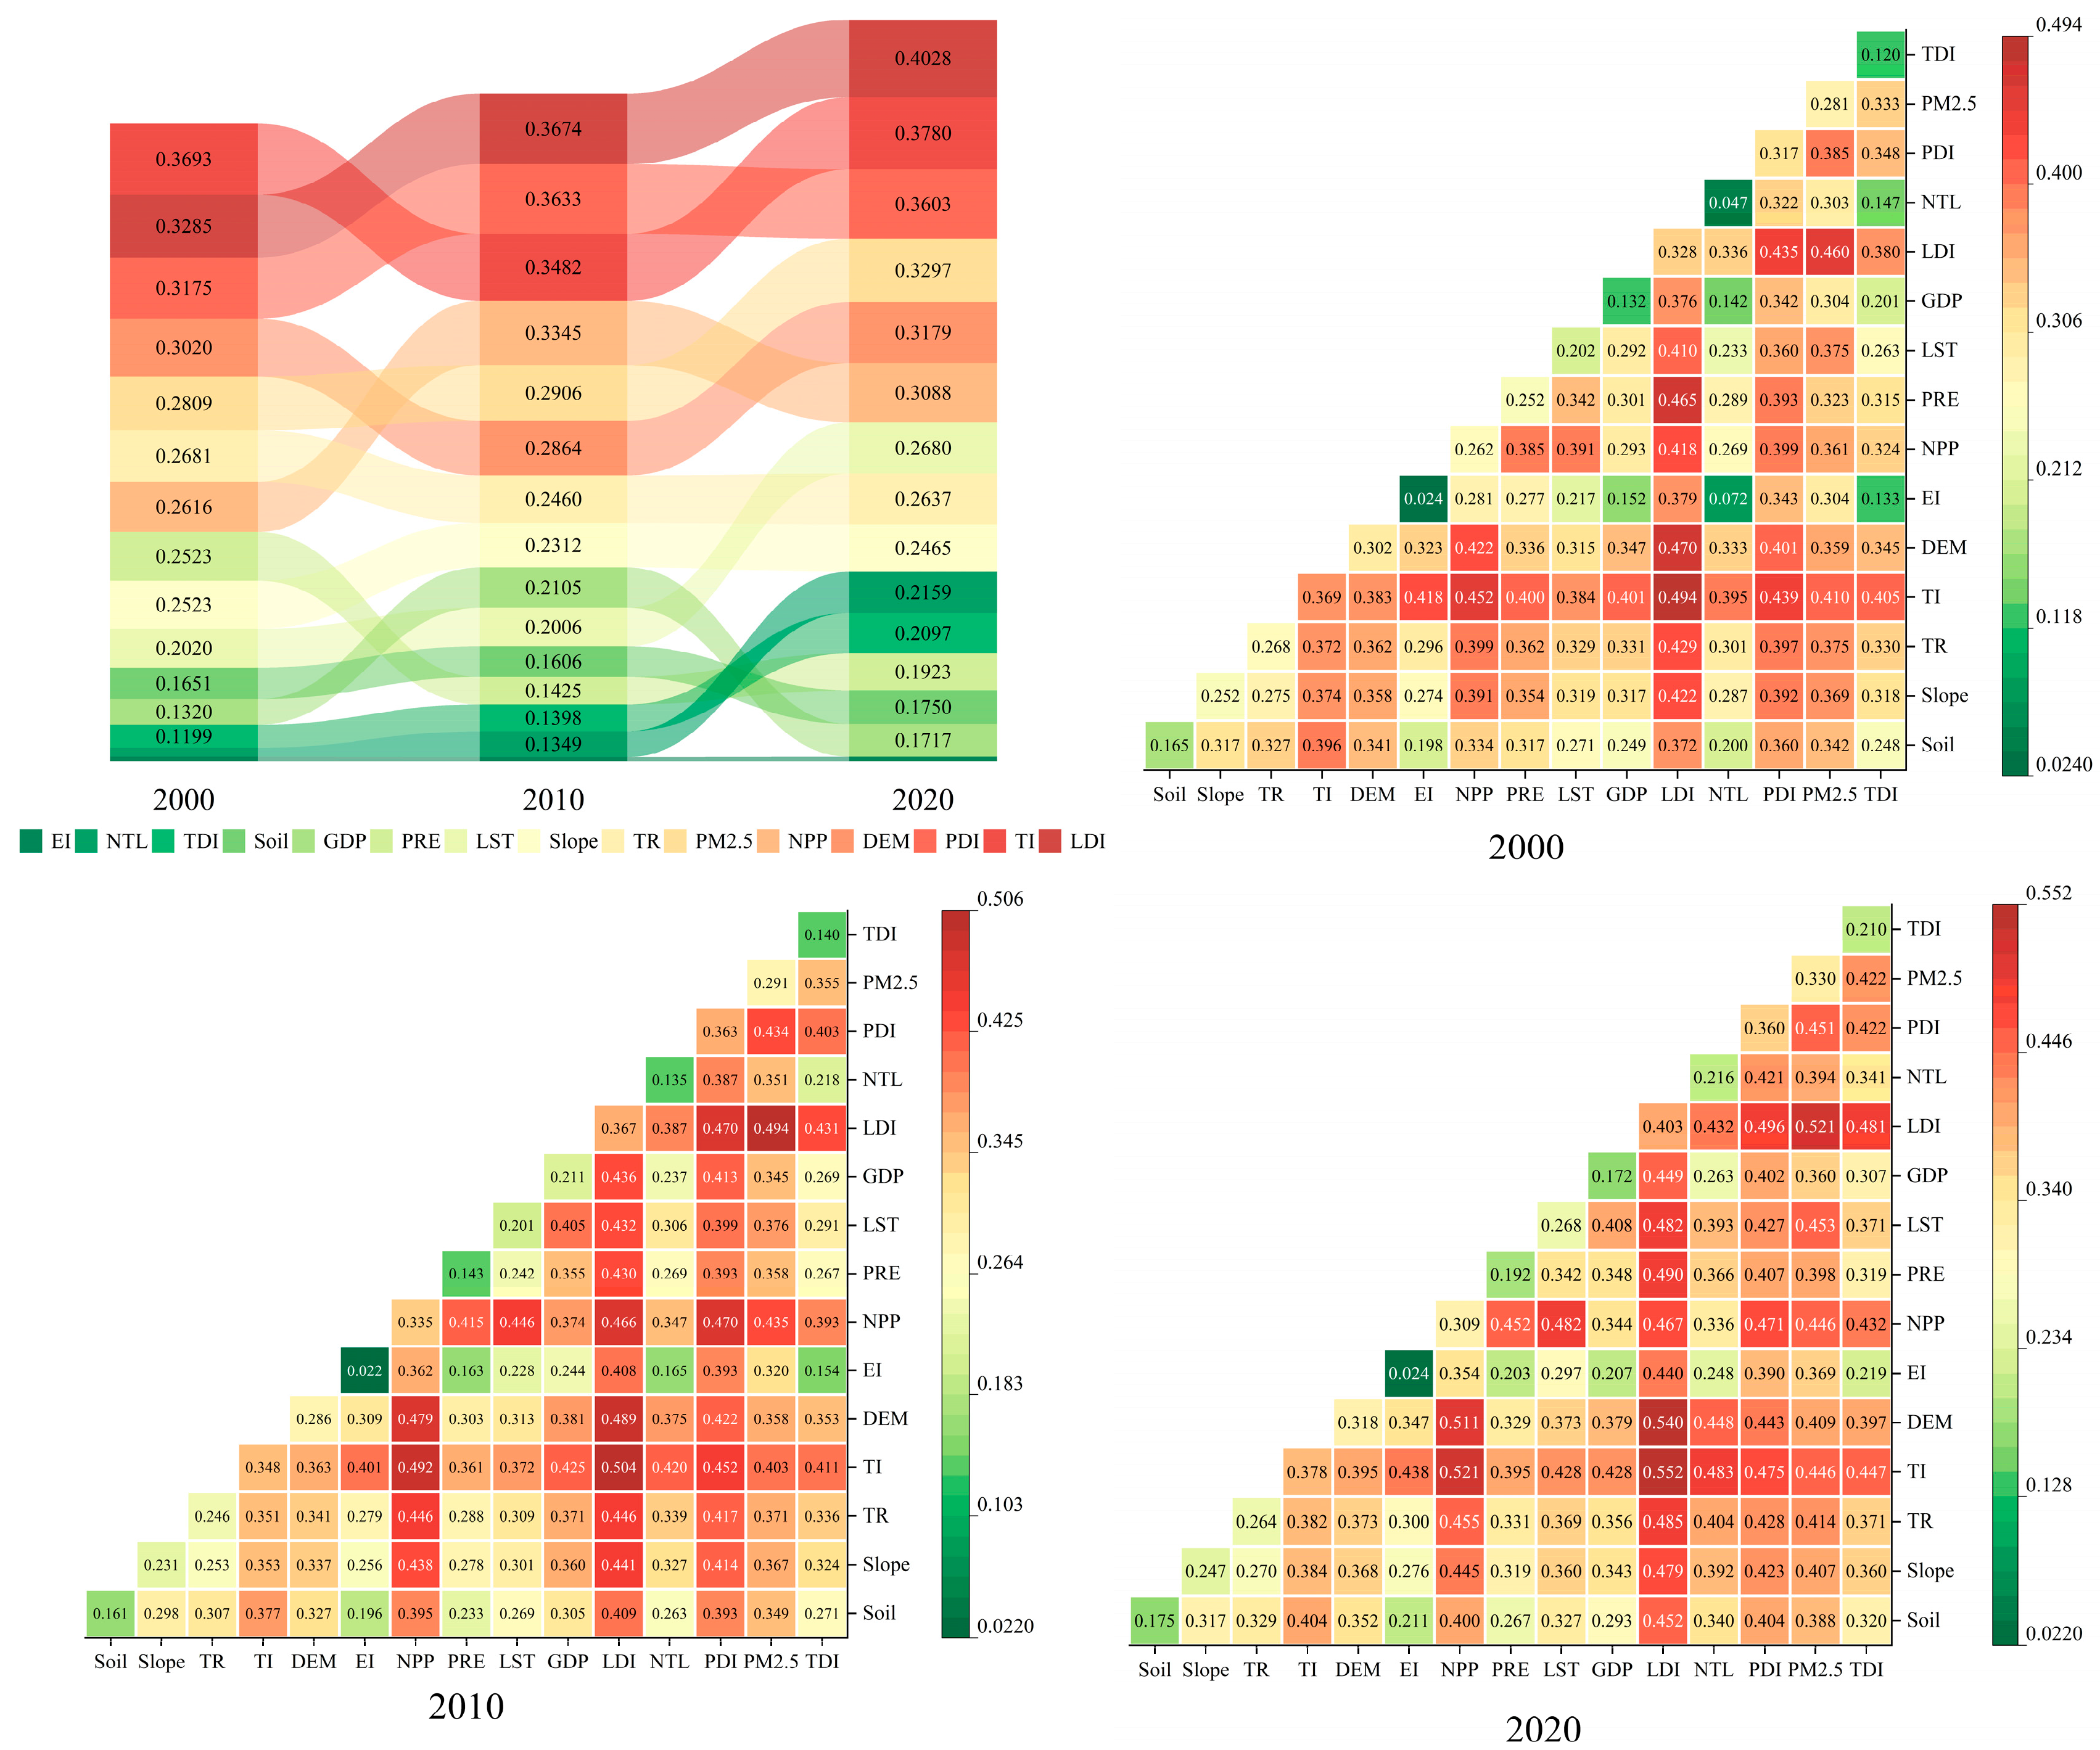
3.2.3. Drivers of Spatial Differentiation in Landscape Ecological Resilience

The spatial differentiation of landscape ecological resilience in the complex ecosystems of urban agglomerations is influenced by a variety of factors. The following were selected for this study: geographic basis (Soil, Slope, Rise and Fall (TR), Topographic Location Index (TI) and Elevation (DEM)), Meteorological factors (surface temperature (LST) and rainfall (PRE)), landscape patterns (landscape disturbance index (EI) and net primary productivity (NPP)) and human activities (gross domestic product (GDP) per capita, land use intensity (LDI), nighttime lighting (NTL), population agglomeration pressure (PDI), PM2.5, and traffic pressure index (TDI)) with 15 indicators in 4 categories of elements. Geodetector was used to analyze the drivers of the spatial divergence of landscape ecological resilience in CZXUA from 2000 to 2020, and the degree of explanation of every single factor and factor interaction was determined (Figure 10). The results showed that the degree of explanation for landscape ecological resilience varied greatly among the factors, and the explanatory power was LDI, TI, PDI, DEM, NPP, PM2.5, TR, Slope, LST, PRE, GDP, Soil, TDI, NTL, and EI, in descending order. The average explanatory power of the geographic base was 0.2674, with the topographic location index explaining the highest degree of this factor (q-value of 0.3652) and the soil type explaining the lowest degree of this factor (q-value of 0.1669). The average explanatory power of human activities was 0.2457. This factor had the highest degree of explanation in the land-use intensity index (q-value of 0.3662) and the lowest degree of explanation in nighttime lighting (q-value of 0.1325). The average explanatory powers of the meteorological factors and landscape patterns were 0.2096 and 0.1625, respectively. Among all the factors, the q-value of land use intensity was the largest and showed an increasing trend. The nighttime lighting index, PM2.5, and traffic pressure index also gradually increased, indicating that the spatial distribution pattern of resilience is predominantly influenced by human activities and geographic base, with the influence of human activities exhibiting an upward trend. In the future, efforts to enhance resilience must be meticulously coordinated with human activities, taking into account the constraints imposed by geographic factors. This approach should be complemented by a systematic monitoring and analysis of emerging variables, such as PM2.5 levels and traffic pressure, to ensure a comprehensive and nuanced understanding of the evolving environmental context. Analysis of the interaction detection results of the driving factors of landscape ecological resilience revealed that the explanatory power of the factor combination interaction on landscape ecological resilience was significantly higher than that of a single factor and showed an upward trend. The interaction between land use intensity and topographic position index had the highest degree of explanation of landscape ecological toughness and showed an upward trend. Traffic pressure and nighttime lighting interaction showed the most significant increase, and the interaction of landscape disturbance index and rainfall showed the most significant decrease in the explanation of toughness. It can be seen that the joint effect has an increasing influence on spatial differentiation: the joint effect between human activities and other factors has a stronger explanatory power for the spatial distribution of resilience compared to other factors, and the explanatory power of a single factor of resilience in the human activities and geographic basis is stronger than that of a single factor in the meteorological factors and landscape pattern. It can be seen that the joint effect of the driving factors has gradually become the core factor affecting resilience, the conflict between the interference of human activities and the constraints of the geographic base has been intensified, the compound effect of infrastructure construction (transport roads) and economic development has been strengthened, and the system self-recovery mechanism has been weakened in the context of climate change. Therefore, in order to enhance ecological resilience, it is necessary to take complex systems as the basis, focus on the transformation of ecological development and construction, identify the key nodes of changes in the compound factors, and gradually realize the system self-recovery and sustainable development.

3.3. Adaptive Cycle Stage Identification

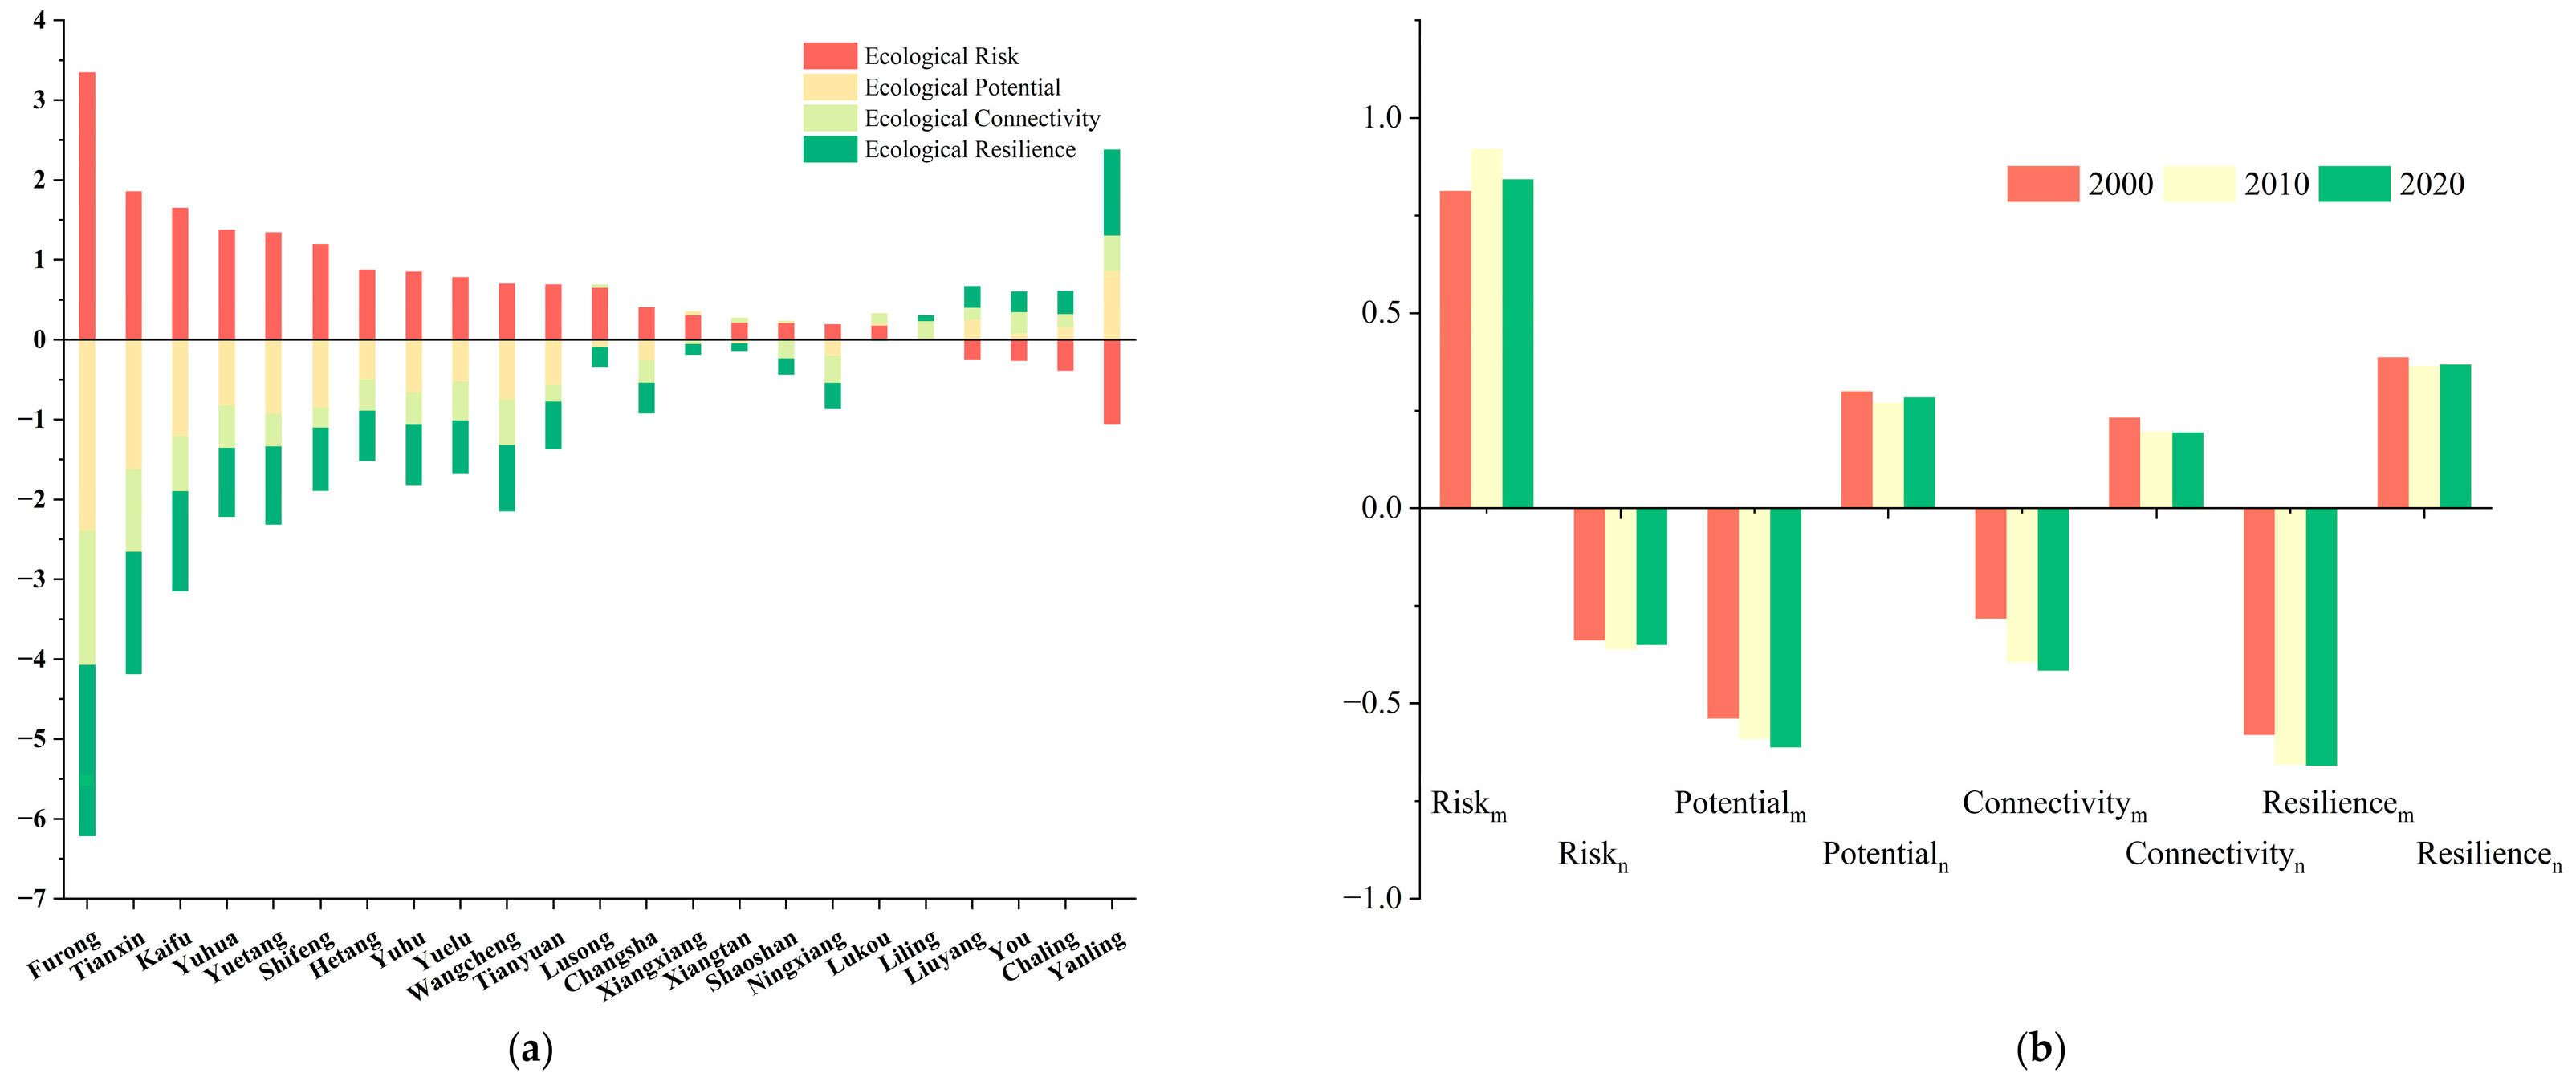
3.3.1. Analysis of the “Potential-Connectivity-Resilience” Eigenvalue

This study counted the three-dimensional eigenvalues of “Potential-Connectivity-Resilience” in each district and county of the CZXUA and analyzed the differences in the spatial three-dimensional eigenvalues of the regions based on the ecological risk (Figure 11a). Comparisons among the spatial distributions of ecological risk, potential, connectivity, and resilience revealed that the core urban areas had larger ecological risk values and lower potential, connectivity, and resilience values, whereas the marginal districts and counties had smaller ecological risk values and higher potential, connectivity, and resilience values. Furong, Tianxin, Kaifu, Yuhua, Yutang, Shifeng, Yuhu, Yuelu, Wangcheng, Tianyuan, Lusong, and Changsha counties had the highest ecological risk values and the lowest potential, connectivity, and resilience values. Xiangxiang County, Xiangtan County, Shaoshan City, Ningxiang County, and Lukou District had higher ecological risk values and lower potential, connectivity, and resilience values. Liling City, Liuyang City, You, and Chaling Counties had lower ecological risk values and higher potential, connectivity, and resilience values. Yanling City had the lowest ecological risk values, higher potential, connectivity, and highest resilience values. In terms of the “Center-Edge” circle structure, the landscape ecological resilience eigenvalues of the metropolitan and non-metropolitan areas in the CZXUA were distributed in the opposite direction (Figure 11b). The metropolitan area showed large changes, with fluctuating increases in ecological risk and decreasing trends in potential, connectivity, and resilience, whereas the non-metropolitan area showed smaller changes, with insignificant changes in ecological risk, potential, connectivity, and resilience.

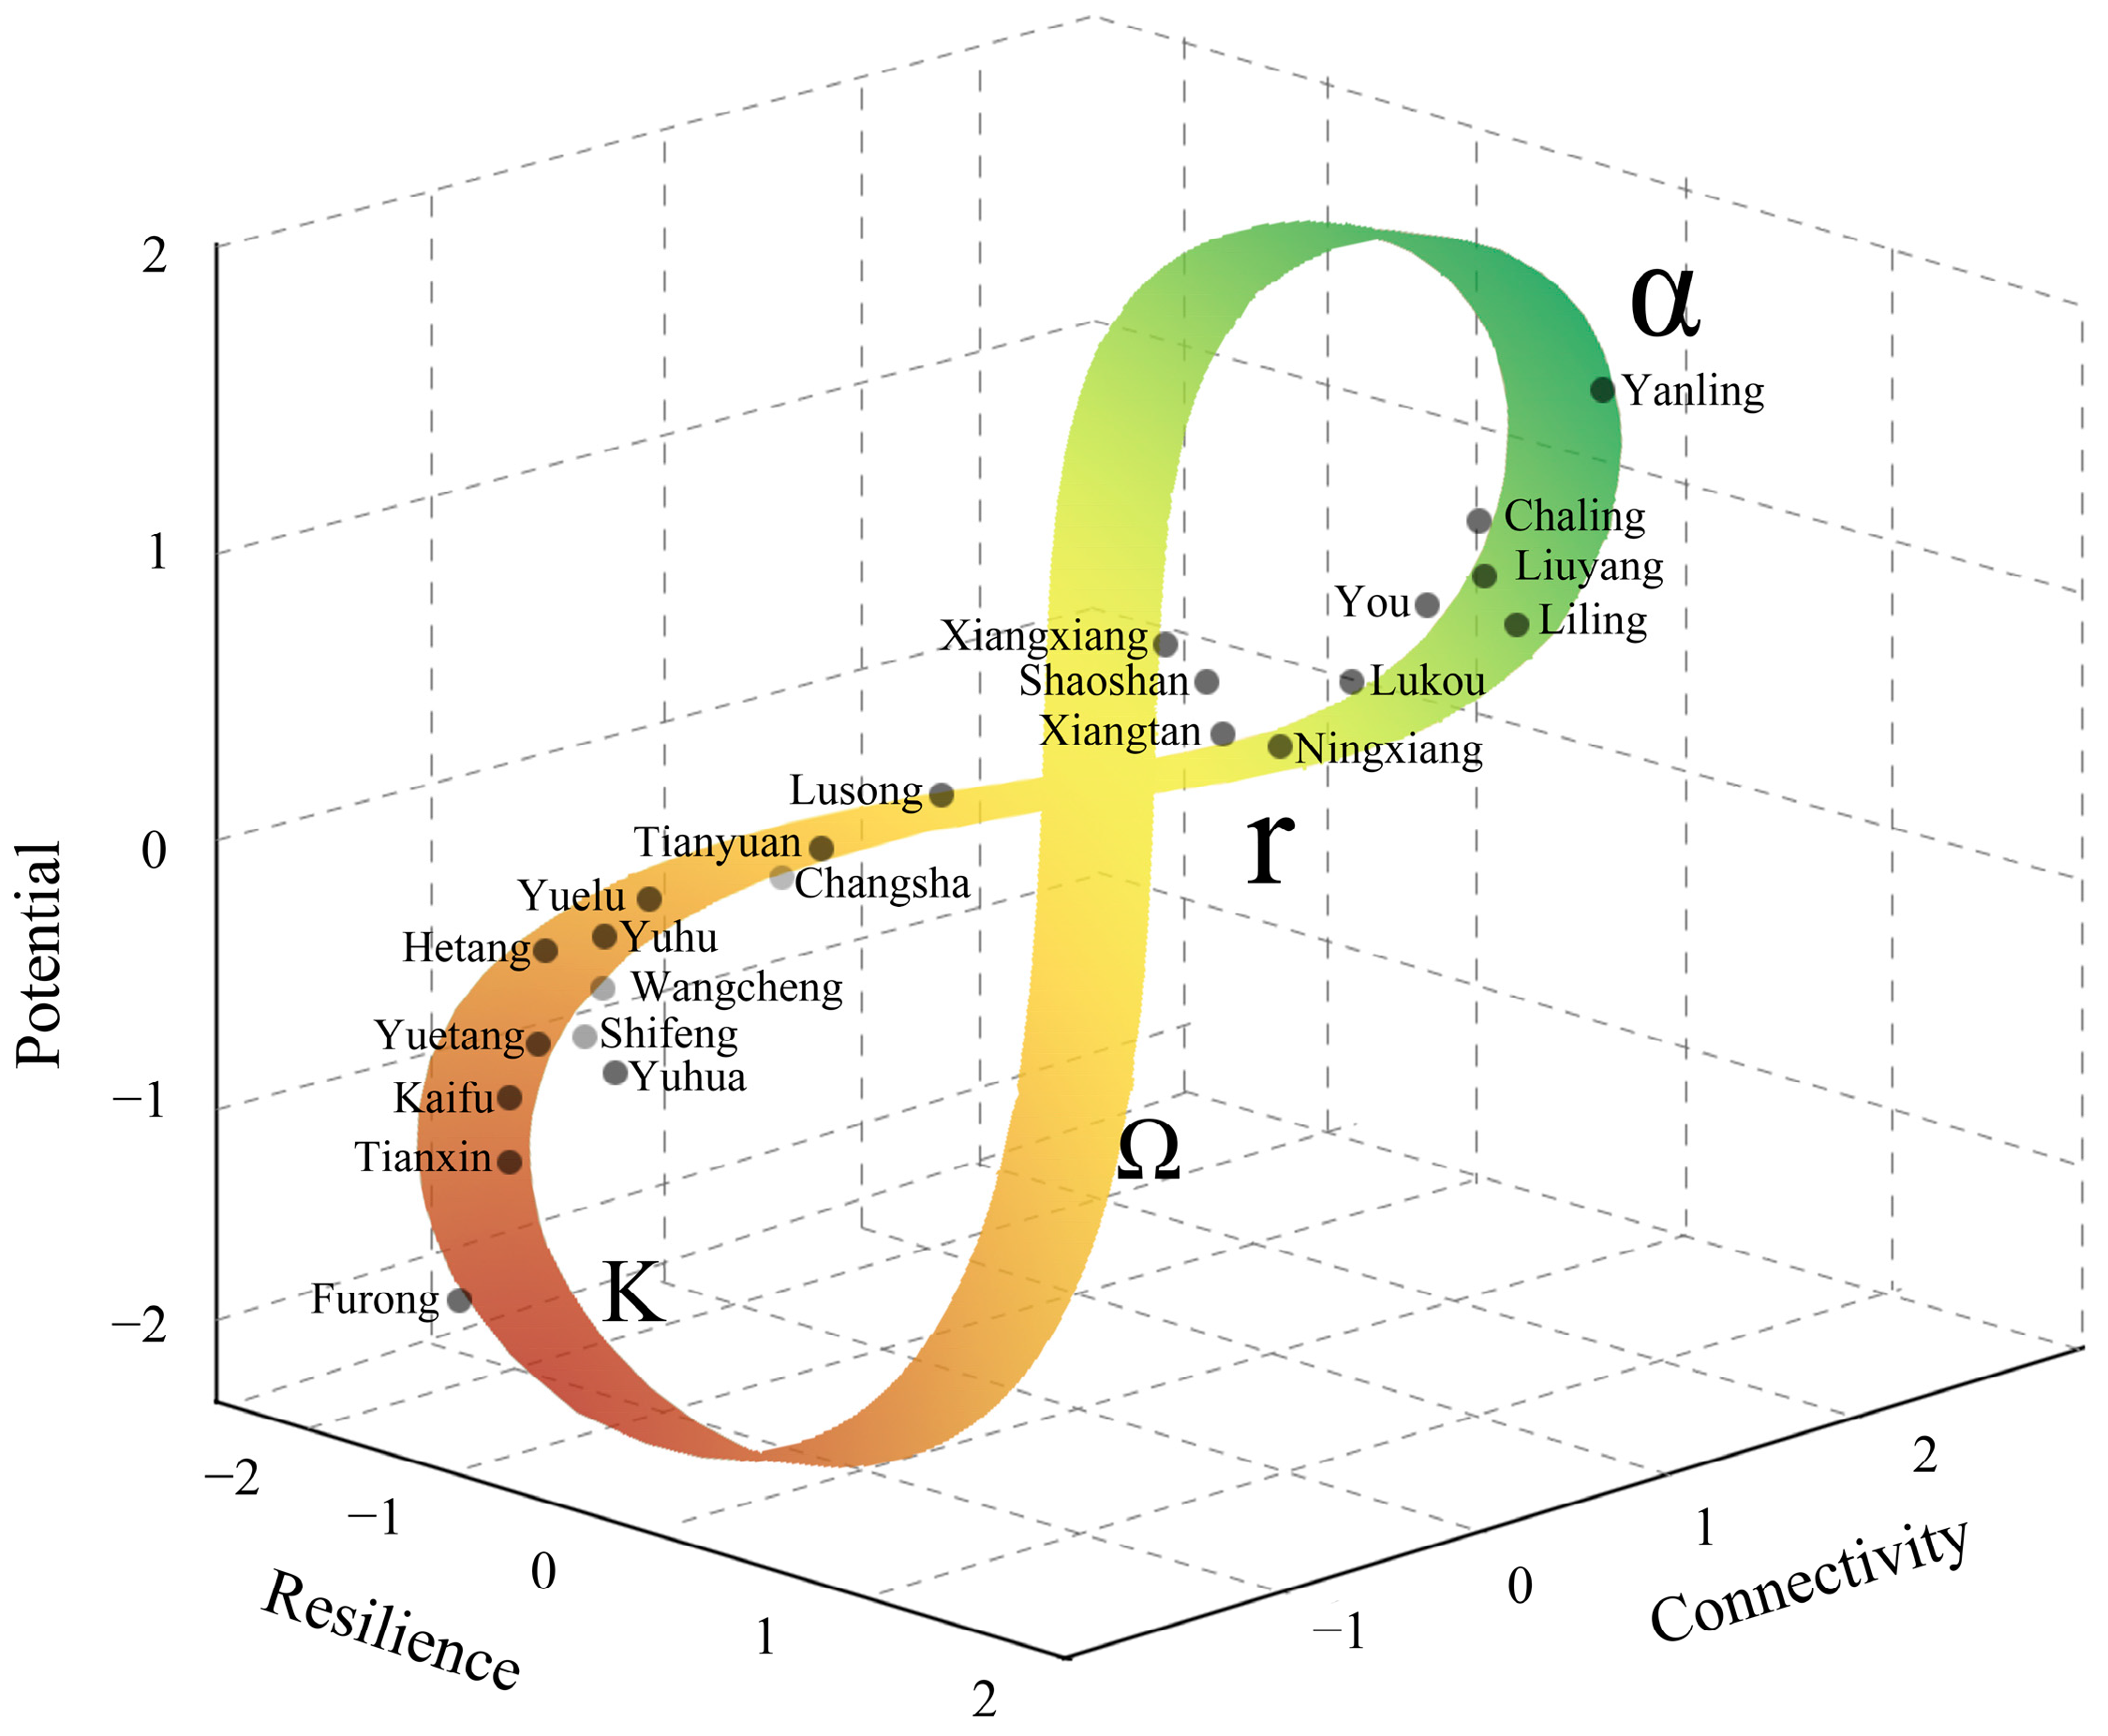
3.3.2. Adaptation Stage Identification

Combined with the adaptive cycle model, identify the adaptive dynamics of landscape ecosystems based on the three-dimensional spatial coordinates of “potential-connectivity-resilience” and the eigenvalues of each county (Figure 12). In this study, thresholds of −1 and 1 were selected [70]. If the three-dimensional characteristic values fell within the range of −1 to 0, they were considered to be in the protection phase (K phase). If all values were greater than 0, they were in the reorganization phase (α phase). If the values were between −1 and 1 and showed a decline, they were in the development phase (γ phase). If all values were less than −1, they were in the release phase (Ω phase). As can be seen, Furong, Tianxin, and Kaifu districts and Yuhua, Yutang, Shifeng, Yuhu, Yuelu, Wangcheng, Tianyuan, Lusong, and Changsha counties were in the protection phase (k). Economic development was in a high state, with high-risk values, low potential, connectivity, and resilience values. The landscape ecosystems were beginning to enter an upward state from the lowest threshold, indicating that these areas entered a mature and stable stage and were transitioning towards valuing ecological development and mitigating ecological risks brought about by urban construction. Xiangxiang, Xiangtan, Shaoshan, Ningxiang, and Lukou Counties were in the development stage (r), with economic development expanding, ecological risk increasing, and potential, connectivity, and resilience declining. This stage is characterized by urban economic development and expansion of construction land. Liling, Liuyang, You, Chaling, and Yanling counties were in the restructuring stage (α), with low ecological risk and high potential, connectivity, and resilience, driven by the large distance from the economic core area of the urban agglomeration. The impact of human activity interference was small, and the natural basic conditions were superior, with self-repair ability; hence, this stage is manifested in the initial development and construction state. According to the landscape ecological resilience trend during the whole study period, the resilience of the peripheral region increased, the resilience of the core region decreased, and no region reached the release stage (Ω). Peripheral areas move from the development stage into the protection stage as urbanization and regional integration progress. The vulnerability of the urban system is expected to increase, posing a potential threat to regional ecological security and sustainable development. Therefore, urban construction should focus on shifting from quantitative to qualitative changes to improve the quality and stability of ecosystems and increase the ecological resilience of urban landscapes to resist external risks.

4. Discussion

4.1. Resilience Analysis of Different Land Use

The “Risk-Potential-Connectivity” framework was built in this study to assess the ecological resilience of the CZXUA landscape and the spatiotemporal evolution trends and associated patterns. This study investigated the driving factors influencing ecological resilience from the perspectives of geographical foundation, landscape patterns, human activities, and natural disasters. The findings revealed significant variations in the ecological resilience characteristics across different land use (Figure 13a). The resilience grades were in the following order from high to low: grassland > forest > water body > cultivated land > bare land > construction land. The land use in the region was dominated by forest and the proportions of the area in 2000, 2010, and 2020 were 63.79%, 63.00%, and 62.28%, respectively. The area of cultivated land, forest land, and grassland showed a decreasing trend, whereas the area of construction land showed an increasing trend (Figure 13b,c). The combined pressures of population concentration and intensive land development led to decreased vegetation cover, degraded natural ecosystems, and reduced capacity for self-restoration [71]. For example, in core urban areas such as Furong and Tianxin districts, the high proportion of construction land led to fragmentation of source patches and reduced connectivity, resulting in relatively low ecological resilience. In these regions, it is essential to control and limit uncontrolled urban expansion. This can be achieved through the implementation of ecological engineering projects, optimizing land use structures, and enhancing ecological restoration efforts. These actions will help improve ecological resilience, increase the spatial efficiency of construction land, reduce the per capita ecological footprint, and minimize human-induced disturbances to natural systems. Additionally, landscape ecological resilience exhibited significant spatial heterogeneity, which makes it a valuable tool for monitoring and evaluating the ecological effectiveness of current protection measures. It can also be utilized to simulate and predict the impacts of future development activities, providing essential scientific support for optimizing land use and ensuring a balanced, harmonious development between urban growth and ecological conservation. However, the ecological resilience values of grassland and forest landscapes were high, with relatively low rates of change. They accounted for a large proportion of the study area and played a key role in maintaining regional resilience and stability. For example, fringe counties (e.g., Yanling and You Counties) had higher vegetation cover and biodiversity, a more reasonable land use structure, better ecosystem integrity and connectivity that are relatively more resilient to external disturbances, and maintain ecosystem stability. In addition, ecological functional areas such as water and wetlands play important roles in regulating climate, purifying water quality, maintaining biodiversity, and showing high ecological resilience [72]. In these areas, ecological protection agencies can use the spatial distribution patterns of ecological resilience identified in the study area to accurately define zones for ecological protection and restoration [73]. For regions with degraded landscape ecological resilience, natural restoration should be prioritized to minimize ecological risk impacts and avoid secondary environmental damage. However, in areas with fragmented patches, protective measures should be implemented promptly to restore ecological connectivity.

4.2. Adaptive Strategies for Landscape Ecological Resilience in Urban Clusters

External disturbances may cause the system state to change from gradual to sudden and then enter a non-ideal state because the ecosystem has a multi-stable mechanism. The ecosystem has a self-organization ability that can make the system recover to the original stable state or enter a new stable state. The attributes and spatial and temporal characteristics of the landscape ecological resilience of the urban agglomeration were taken into account based on the theory of adaptive cycling and the trend of socio-economic development and land use intensity in CZXUA (Figure 14). In addition, this study identified the adaptive stage of the landscape ecological resilience level in the study area from 2000 to 2020 and examined the relationship between the complex system of the urban agglomeration and the landscape ecosystems to propose a spatial planning strategy for the adaptive stage of the CZXUA and provide references for urban spatial management and landscape planning.
The results revealed that Furong and Tianxin districts, among others, are in the protection stage (K) and are mainly located in the economic core and functional areas of the urban agglomeration. At this stage, the spillover of economic development in the core area of the urban agglomeration intensifies land use expansion, with higher ecological risk values and lower potential, connectivity, and resilience values. For regions with a high level of urbanization, it is difficult to significantly reduce ecological risk; therefore, urban construction should focus on landscape pattern optimization and ecological development transformation, improve core ecological patches and important ecological corridors (green center area), build cross-regional integrated ecosystems, and enhance ecological potential and connectivity to improve the ecological resilience of the landscape.
Xiangxiang City and Xiangtan County, among others, are in the development (r) stage and are mainly located in subordinate districts and counties around urban agglomerations. At this stage, the economic development of the urban area is in a growth state; the ecological risk value is low; and the potential, connectivity, and resilience values are slowly increasing. It has been shown that the transfer of arable and construction land to ecological land in land use can alleviate the imbalance between supply and demand of ecosystem services to a certain extent [74]. Therefore, urban spatial planning and construction at this stage should uphold the concept of sustainable development; reduce the intensity of building land; promote the implementation of ecological protection measures to improve the ecological potential, connectivity, and resilience; mitigate and adapt to the ecological risks brought about by the uncontrolled expansion of construction land; and promote the coordinated development of the economy and ecology.
Yanling and You counties are in the reorganization (α) stage, with the lowest land use intensity and land use dominated by forest, grassland, and cultivated land. This stage has a high proportion of regional natural ecological space, low ecological risk, high potential, connectivity, and landscape ecological resilience and is an important ecological barrier for CZXUA. Therefore, it is necessary to pay attention to the protection of the current natural ecosystem, and regional spatial planning and construction should not break the existing ecological barriers. It is necessary to set up the ecological red line to control and reduce the interference of human activities, maintain the resilience of the urban ecosystem, and provide a guarantee for economic development.
In the release (Ω) stage, regional economic development declines; ecological risks are high; and potential, connectivity, and resilience are low. Severe turbulence, which could eventually lead to collapse, is experienced in this stage. Regional spatial planning and construction should focus on adapting to ecological risk, adjusting the spatial layout of ecological source patches, optimizing functional nexus links, and increasing the suitability of urban agglomeration of ecological source patches to the environment. In addition, cross-regional cooperation should carry out landscape ecological resilience protection planning to focus on landscape ecological resilience adaptive stage changes and optimize and transform unreasonable regional ecological spaces. This will help to improve urban landscape ecological resilience, meet the realistic needs of resilient urban planning, enable landscape ecological resilience to enter the next round of adaptive cycles and provide a more scientific guide for realizing the gradual restoration of adaptive regeneration of urban landscape ecological resilience.

4.3. Limitations and Recommendations of This Study

This study developed a landscape ecological resilience assessment framework based on three dimensions: “risk-potential-connectivity”. It considered the interrelationships among various indicators and the complexity of ecosystems, thus addressing the theoretical gaps in the dynamic assessment of ecological resilience. This study focused on understanding the spatiotemporal evolution patterns and driving factors of ecological resilience, measuring and analyzing key areas for resilience management, and identifying the different developmental stages of adaptive cycles. This approach can provide scientific support for the targeted management of different ecological restoration areas and offers a fresh perspective for making informed landscape management decisions in other highly urbanized regions. Furthermore, by combining fine-scale grid data with administrative district-level analysis, this approach can provide a more precise evaluation of the spatial heterogeneity and dynamic changes in regional landscape ecological resilience, and provide a basis for the formulation of ecological protection policy.
Comparing the ecological resilience assessment results with the empirical data of the same study area [75], it is found that the ecological resilience indexes are all at a low level, and the spatial distribution as a whole shows the same distribution characteristics of high in the east, low in the west, and high in the south and low in the north, and the western and central parts of the country may become the key areas affecting ecological resilience, confirming the validity of the model. Consistent with the findings of most scholars [15,20,25,28,75], this study further confirms that land use is closely related to ecological resilience and that the influence of human activities on resilience is gradually deepening. However, previous studies primarily focused on land use and landscape patterns, with limited investigation into the underlying mechanisms of ecosystem potential and connectivity—an area that this study addresses.
Despite the innovative nature of this study in terms of the construction of the indicator system and the resilience strategy proposed, there are limitations that must be acknowledged. The timeliness and spatial resolution of the data limited the accurate representation of the actual landscape ecological resilience. Due to the protracted study period, the utilization of data from multiple sources and varying resolutions may result in the amplification of errors following resampling. The implementation of mean or inverse distance weight interpolation to address missing values may lead to the outcomes of the null values being incongruent with the actual situation. The necessity to employ categorical data for the analysis of drivers may obscure the effect size of the factors. GWR modeling could be used in the future to compensate for this shortcoming. In addition, the selected indicators did not encompass all characteristics of ecological resilience. Indeed, the simplification of complex ecosystems by evaluation models can lead to identification results that are not consistent with reality. Future studies should simulate the spatial distribution pattern of ecological resilience in large-scale regions under different scenarios, elucidate the relationship between land use and ecological resilience, and identify the adaptive cycling stage by combining statistical modeling and machine learning methods to capture the dynamic characteristics of resilience at a fine scale.

5. Conclusions

Using the CZXUA as a case study, this study constructed a “Risk-Potential-Connectivity” framework and analyzed the spatial and temporal evolution trend and correlation pattern of resilience as well as its spatial differentiation drivers using exploratory spatial data methodology and Geodetector model measurements. Based on the results of ecological resilience analysis, it is imperative to delineate the developmental phases of various regions within the urban agglomeration from a holistic and dynamic vantage point, as envisaged by the tenets of adaptive cycling. This model can provide a scientific basis for the regional protection strategy under the dynamic changes in urban agglomeration ecosystems. The main conclusions of this study are as follows:
The overall spatial distribution pattern of ecological risk gradually decreased from the center to the periphery, whereas that of the ecological potential and connectivity gradually increased. High-risk, low-potential, and low-connectivity areas were mainly concentrated in the core urban areas, dominated by construction land, with patches spreading radially to the periphery. Low-risk, high-potential, and high-connectivity areas were concentrated in the peripheral districts and counties, dominated by forest and grassland, with patches distributed in the form of slices or strips. The spatial and temporal distributions of the ecological risk, potential, and connectivity grades were dominated by grades II, III, and IV, with an average area accounting for more than 70%. The spatial distributions of risk, potential, and connectivity exhibited an inverse relationship. It is evident that ecological risk, potential, and connectivity interact with each other in the urban ecological complex system.
The average index of landscape ecological resilience from 2000 to 2020 was 0.31, with an overall trend of continuous decline and the center of gravity migrating from northwest to southeast. The spatial and temporal distributions were dominated by grades II and III. Significant differences in the resilience level of each district and county were observed. Low resilience was concentrated in the core urban area, dominated by construction land, and the patches spread to the surrounding area in a radial shape; High resilience was distributed in the surrounding districts and counties, dominated by forests, and the patches were distributed in the form of slices or strips. Ecological resilience had the phenomenon of high and low aggregation distribution, with the overall Moran’s index greater than 0.75. “High-High” agglomeration was distributed in the fringe counties in the form of strips and “Low-Low” agglomeration was distributed in the core urban area in the form of slices or clusters, with the trend of spatial agglomeration and prominence increasing and the spatial distribution having obvious heterogeneity. The expansion of construction land in the core urban area reduced the ecological resilience of the landscape and aggravated the internal ecological risk.
In the spatial variation in landscape ecological resilience, the degree of explanation of each factor varied greatly. Land use intensity had the highest q-value (q = 0.3662) and showed an upward trend. The upward trend of the nighttime lighting index, PM2.5, and traffic pressure index was gradually reinforced. The explanatory power of the factor combination interaction on landscape ecological resilience showed an upward trend and was significantly higher than that of a single factor. The joint effect has an increasing influence on spatial differentiation, and the joint effect between human activities and other factors has a stronger explanatory power on the spatial distribution of resilience than other factors.
The core urban area had higher ecological risk values and lower potential, connectivity, and resilience values, whereas the surrounding districts and counties had lower ecological risk values and higher potential, connectivity, and resilience values. The cycle of landscape ecosystem change in the urban agglomeration was divided into four stages: Furong and Tianxin districts were in the protection stage (K); Xiangxiang and Xiangtan were in the development stage (r); Yanling and You counties in the reorganization stage (α); and no region was in the release stage (Ω). Therefore, urban development should shift from quantitative to qualitative development to improve the quality and stability of ecosystems and increase the ecological resilience of urban system landscapes to resist external risky disturbances.

Author Contributions

H.P.: Conceptualization, Methodology, Software, Formal analysis, Writing—original draft, Writing—review and editing, Visualization. H.L.: Visualization, Writing—review and editing, Formal analysis, Investigation. Y.L.: Conceptualization, Methodology, Visualization. Q.H.: Data curation, Conceptualization. M.Z.: Project administration, Supervision; Writing—review and editing, Investigation. Y.Y.: Funding acquisition, Project administration, Supervision. All authors have read and agreed to the published version of the manuscript.

Funding

This research was funded by the Key Disciplines of the State Forestry Administration of China (No. 21 of Forest Ren Fa, 2016); and the Hunan Province “Double First-Class” Cultivation discipline of China (No. 469 of Xiang Jiao Tong, 2018); National Long-term Research Base for Landscape Architecture in Qingxiu Mountain, Guangxi Nanning (No. 96 of Forestry Science and Technology Development, 2021); Postgraduate Scientific Research Innovation Project of Hunan Province(grant number CX20240712); Central South University of Forestry and Technology 2024 Graduate Student Science and Technology Innovation Fund (grant number 2024CX01009).

Data Availability Statement

The original contributions presented in this study are included in the article. Further inquiries can be directed to the corresponding authors.

Acknowledgments

The authors are grateful for the valuable comments from the anonymous reviewers and editors.

Conflicts of Interest

The authors declare that they have no known competing financial interests or personal relationships that could have appeared to influence the work reported in this paper.

References

  1. Itsukushima, R.; Ohtsuki, K. A century of stream burial due to urbanization in the Tokyo Metropolitan Area. Environ. Earth Sci. 2021, 80, 237. [Google Scholar] [CrossRef]
  2. Lu, Z.; Zhang, M.; Hu, C.; Ma, L.; Chen, E.; Zhang, C.; Xia, G. Spatiotemporal Changes and Influencing Factors of the Coupled Production–Living–Ecological Functions in the Yellow River Basin, China. Land 2024, 13, 1909. [Google Scholar] [CrossRef]
  3. Keyes, A.A.; McLaughlin, J.P.; Barner, A.K.; Dee, L.E. An ecological network approach to predict ecosystem service vulnerability to species losses. Nat. Commun. 2021, 12, 1586. [Google Scholar] [CrossRef]
  4. Holling, C.S. Adaptive Environmental Assessment and Management; John Wiley: Toronoto, ON, USA, 1978. [Google Scholar]
  5. Adger, W.N.; Hughes, T.P.; Folke, C.; Carpenter, S.R.; Rockstrom, J. Social ecological resilience to coastal disasters. Science 2005, 309, 1036–1039. [Google Scholar] [CrossRef]
  6. Holling, C.S. Resilience and stability of ecological systems. Annu. Rev. Ecol. Evol. Syst. 1973, 4, 1–23. [Google Scholar]
  7. Liang, J.; Zhang, M.; Yin, Z.; Niu, K.; Li, Y.; Zhi, K.; Huang, S.; Yang, J.; Xu, M. Tripartite evolutionary game analysis and sim-ulation research on zero-carbon production supervision of marine ranching against a carbon-neutral background. Front. Ecol. Evol. 2023, 11, 1119048. [Google Scholar]
  8. Ostrom, E. Panarchy: Understanding transformations in human and natural systems. Ecol. Econ. 2004, 49, 488–491. [Google Scholar]
  9. Schrenk, H.; Garcia-Perez, C.; Schreiber, N.; Castell, W.Z. QtAC: An R-package for analyzing complex systems development in the framework of the adaptive cycle metaphor. Ecol. Model. 2022, 466, 109860. [Google Scholar] [CrossRef]
  10. Gotts, N.M. Resilience, panarchy, and world-systems analysis. Ecol. Soc. 2007, 12, 181–194. [Google Scholar]
  11. Zhang, M.; Tan, S.; Chen, E.; Li, J. Spatio-temporal characteristics and influencing factors of land disputes in China: Do so-cio-economic factors matter? Ecol. Indic. 2024, 160, 111938. [Google Scholar] [CrossRef]
  12. Zhao, R.; Fang, C.; Liu, J.; Zhang, L. The evaluation and obstacle analysis of urban resilience from the multidimensional perspective in Chinese cities. Sustain. Cities Soc. 2022, 86, 104160. [Google Scholar] [CrossRef]
  13. Zhang, S.; Zhu, H.; Zeng, K.; Zhang, Y.; Jin, Z.; Wang, Y.; Zhang, R.; Jürgen, B.; Liu, M. From city to countryside: Unraveling the long-term complex effects of urbanization on vegetation growth in China. J. Environ. Manag. 2025, 380, 124975. [Google Scholar] [CrossRef]
  14. Liu, L.; Lei, Y.; Zhuang, M.; Ding, S. The impact of climate change on urban resilience in the Beijing-Tianjin-Hebei region. Sci. Total Environ. 2022, 827, 154157. [Google Scholar] [CrossRef] [PubMed]
  15. Ning, X.; Zhang, X.; Zhang, X.; Wang, H.; Zhang, W. A Method for Assessing Urban Ecological Resilience and Identifying Its Critical Distance Belt Based on the “Source-Sink” Theory: A Case Study of Beijing. Remote Sens. 2023, 15, 2502. [Google Scholar] [CrossRef]
  16. Zhang, M.; Chen, E.; Zhang, C.; Liu, C.; Li, J. Multi-Scenario Simulation of Land Use Change and Ecosystem Service Value Based on the Markov–FLUS Model in Ezhou City, China. Sustainability 2024, 16, 6237. [Google Scholar] [CrossRef]
  17. Chao, W.; Yuan, S.; Zhi, J. Urban landscape sustainability in karst mountainous cities: A landscape resilience perspective. Heliyon 2024, 10, e31651. [Google Scholar] [CrossRef]
  18. Cao, Q.; Huang, Y.; Ran, B.; Zeng, G.; Van Rompaey, A.; Shi, M. Coordination Conflicts between Urban Resilience and Urban Land Evolution in Chinese Hilly City of Mianyang. Remote Sens. 2021, 13, 4887. [Google Scholar] [CrossRef]
  19. Wu, X.; Zhang, J.; Geng, X.; Wang, T.; Wang, K.; Liu, S. Increasing green infrastructure-based ecological resilience in urban systems: A perspective from locating ecological and disturbance sources in a resource-based city. Sustain. Cities Soc. 2020, 61, 102354. [Google Scholar] [CrossRef]
  20. Zhang, H.; Liu, Y.; Li, J.; Tian, P.; Zhong, J.; Gong, H. Evaluation and analysis of coastal complex ecological resilience based on multidimensional data: A case study of East China Sea. Ecol. Indic. 2023, 155, 110981. [Google Scholar] [CrossRef]
  21. Lin, Y.; Peng, C.; Chen, P.; Zhang, M. Conflict or synergy? Analysis of economic-social- infrastructure-ecological resilience and their coupling coordination in the Yangtze River economic Belt, China. Ecol. Indic. 2022, 142, 109194. [Google Scholar] [CrossRef]
  22. Wang, K.; Ma, H.; Fang, C. The relationship evolution between urbanization and urban ecological resilience in the Northern Slope Economic Belt of Tianshan Mountains, China. Sustain. Cities Soc. 2023, 97, 104783. [Google Scholar] [CrossRef]
  23. Nathwani, J.; Lu, X.; Wu, C.; Fu, G.; Qin, X. Quantifying security and resilience of Chinese coastal urban ecosystems. Sci. Total Environ. 2019, 672, 51–60. [Google Scholar] [CrossRef] [PubMed]
  24. Rumson, A.G.; Garcia, A.P.; Hallett, S.H. The role of data within coastal resilience assessments: An East Anglia, UK, case study. Ocean Coast. Manag. 2020, 185, 105004. [Google Scholar] [CrossRef]
  25. Wang, S.; Li, Z.; Long, Y.; Yang, L.; Ding, X.; Sun, X.; Chen, T. Impacts of urbanization on the spatiotemporal evolution of ecological resilience in the Plateau Lake Area in Central Yunnan, China. Ecol. Indic. 2024, 160, 111836. [Google Scholar] [CrossRef]
  26. Falk, D.A.; Van Mantgem, P.J.; Keeley, J.E.; Gregg, R.M.; Guiterman, C.H.; Tepley, A.J.; JN Young, D.; Marshall, L.A. Mechanisms of forest resilience. For. Ecol. Manag. 2022, 512, 120129. [Google Scholar] [CrossRef]
  27. Li, B.; Li, X.; Liu, C. Dynamic evolution of the ecological resilience and response under the context of carbon neutrality. Ecosyst. Health Sustain. 2022, 9, 0130. [Google Scholar] [CrossRef]
  28. Zhang, S.; Lei, J.; Tong, Y.; Zhang, X.; Lu, D.; Fan, L.; Duan, Z. Temporal and spatial responses of ecological resilience to climate change and human activities in the economic belt on the northern slope of the Tianshan Mountains, China. J. Arid Land 2023, 15, 1245–1268. [Google Scholar] [CrossRef]
  29. Meng, Z.; He, M.; Li, X.; Li, H.; Tan, Y.; Li, Z.; Wei, Y. Spatio-temporal analysis and driving forces of urban ecosystem resilience based on land use: A case study in the Great Bay Area. Ecol. Indic. 2024, 159, 111769. [Google Scholar] [CrossRef]
  30. Zhang, C.; Zhou, Y.; Yin, S. Interaction mechanisms of urban ecosystem resilience based on pressure-state-response framework: A case study of the Yangtze River Delta. Ecol. Indic. 2024, 166, 112263. [Google Scholar] [CrossRef]
  31. Xu, C.; Huo, X.; Hong, Y.; Yu, C.; De Jong, M.; Cheng, B. How urban greening policy affects urban ecological resilience: Quasi-natural experimental evidence from three megacity clusters in China. J. Clean. Prod. 2024, 452, 142233. [Google Scholar] [CrossRef]
  32. Zhao, R.; Fang, C.; Liu, H.; Liu, X. Evaluating urban ecosystem resilience using the DPSIR framework and the ENA model: A case study of 35 cities in China. Sustain. Cities Soc. 2021, 72, 102997. [Google Scholar] [CrossRef]
  33. Lee, C.; Yan, J.; Li, T. Ecological resilience of city clusters in the middle reaches of Yangtze river. J. Clean. Prod. 2024, 443, 141082. [Google Scholar] [CrossRef]
  34. Huang, J.; Zhong, P.; Zhang, J.; Zhang, L. Spatial-temporal differentiation and driving factors of ecological resilience in the Yellow River Basin, China. Ecol. Indic. 2023, 154, 110763. [Google Scholar] [CrossRef]
  35. Li, H.; Wang, Y.; Zhang, H.; Yin, R.; Liu, C.; Wang, Z.; Fu, F.; Zhao, J. The spatial-temporal evolution and driving mechanism of Urban resilience in the Yellow River Basin cities. J. Clean. Prod. 2024, 447, 141614. [Google Scholar] [CrossRef]
  36. Tong, Y.; Lei, J.; Zhang, S.; Zhang, X.; Rong, T.; Fan, L.; Duan, Z. Analysis of the Spatial and Temporal Variability and Factors Influencing the Ecological Resilience in the Urban Agglomeration on the Northern Slope of Tianshan Mountain. Sustainability 2023, 15, 4828. [Google Scholar] [CrossRef]
  37. Yaermaimaiti, A.; Li, X.; Ge, X.; Liu, C. Analysis of landscape pattern and ecological risk change characteristics in Bosten Lake basin based on optimal scale. Ecol. Indic. 2024, 163, 112120. [Google Scholar] [CrossRef]
  38. Wang, D.; Wang, P.; Chen, G.; Liu, Y. Ecological–social–economic system health diagnosis and sustainable design of high-density cities: An urban agglomeration perspective. Sustain. Cities Soc. 2022, 87, 104177. [Google Scholar] [CrossRef]
  39. Javier, A.B.; Claudio, P.; Guido, S.; Davide, G.; Thomas, E.; Benedetto, R. Modelling the net environmental and economic impacts of urban nature-based solutions by combining ecosystem services, system dynamics and life cycle thinking: An application to urban forests. Ecosyst. Serv. 2023, 60, 101506. [Google Scholar] [CrossRef]
  40. Li, W.; Wang, Y.; Xie, S.; Sun, R.; Cheng, X. Impacts of landscape multifunctionality change on landscape ecological risk in a megacity, China: A case study of Beijing. Ecol. Indic. 2020, 117, 106681. [Google Scholar] [CrossRef]
  41. Yan, Y.; Ju, H.; Zhang, S.; Chen, G. The Construction of Ecological Security Patterns in Coastal Areas Based on Landscape Ecological Risk Assessment—A Case Study of Jiaodong Peninsula, China. Int. J. Environ. Res. Public Health 2021, 18, 12249. [Google Scholar] [CrossRef]
  42. Peng, H.; Lou, H.; Yang, Y.; He, Q.; Liu, Y.; Chen, E.; Zhang, M. Spatial and Temporal Heterogeneity of Human- Air-Ground Coupling Relationships at Fine Scale. Pol. J. Environ. Stud. 2025, 20, 1–18. [Google Scholar] [CrossRef]
  43. Mentaschi, L.; Duveiller, G.; Zulian, G.; Corbane, C.; Pesaresi, M.; Maes, J.; Stocchino, A.; Feyen, L. Global long-term mapping of surface temperature shows intensified intra-city urban heat island extremes. Glob. Environ. Change 2022, 72, 102441. [Google Scholar] [CrossRef]
  44. Jing, P.; Zhang, D.; Ai, Z.; Guo, B. Natural landscape ecological risk assessment based on the three-dimensional framework of pattern-process ecological adaptability cycle: A case in Loess Plateau. Acta Ecol. Sin. 2021, 41, 7026–7036. [Google Scholar] [CrossRef]
  45. Das, M.; Das, A.; Mandal, A. Exploring the factors affecting urban ecological risk: A case from an Indian mega metropolitan region. Geosci. Front. 2022, 14, 101488. [Google Scholar] [CrossRef]
  46. Li, S.; He, W.; Wang, L.; Zhang, Z.; Chen, X.; Lei, T.; Wang, S.; Wang, Z. Optimization of landscape pattern in China Luojiang Xiaoxi basin based on landscape ecological risk assessment. Ecol. Indic. 2023, 146, 109887. [Google Scholar] [CrossRef]
  47. Chen, X.; Yang, Z.; Wang, T.; Han, F. Landscape Ecological Risk and Ecological Security Pattern Construction in World Natural Heritage Sites: A Case Study of Bayinbuluke, Xinjiang, China. ISPRS Int. J. Geo-Inf. 2022, 11, 328. [Google Scholar] [CrossRef]
  48. Li, X.; Li, S.; Zhang, Y.; O’Connor, P.J.; Zhang, L.; Yan, J. Landscape Ecological Risk Assessment under Multiple Indicators. Land 2021, 10, 739. [Google Scholar] [CrossRef]
  49. Zhao, Y.; Tao, Z.; Wang, M.; Chen, Y.; Wu, R.; Guo, L. Landscape Ecological Risk Assessment and Planning Enlightenment of Songhua River Basin Based on Multi-Source Heterogeneous Data Fusion. Water 2022, 14, 4060. [Google Scholar] [CrossRef]
  50. Bai, H.; Weng, L. Ecological security pattern construction and zoning along the China-Laos Railway based on the potential-connectedness-resilience framework. Ecol. Indic. 2023, 146, 109773. [Google Scholar] [CrossRef]
  51. Zhou, Y.; Zhao, X. Spatial relationship between human activity intensities and ecosystem services value in Changsha-Zhuzhou-Xiangtan urban agglomeration. China Environ. Sci. 2024, 44, 2948–2960. [Google Scholar]
  52. Xu, M.; Matsushima, H. Multi-dimensional landscape ecological risk assessment and its drivers in coastal areas. Sci. Total Environ. 2024, 908, 168183. [Google Scholar] [CrossRef] [PubMed]
  53. Peng, J.; Wang, Y.; Wu, J.; Shen, H.; Pan, Y. Research Progress on Evaluation Frameworks of Regional Ecological Sustainability. Chin. Geogr. Sci. 2011, 21, 496–510. [Google Scholar] [CrossRef]
  54. Tian, P.; Li, J.; Cao, L.; Pu, R.; Gong, H.; Liu, Y.; Zhang, H.; Chen, H. Impacts of reclamation derived land use changes on ecosystem services in a typical gulf of eastern China: A case study of Hangzhou bay. Ecol. Indic. 2021, 132, 108259. [Google Scholar] [CrossRef]
  55. Wang, C.; Han, L.; He, Y.; Zhang, Y.; Zhang, M. Analysis of Vegetation Restoration Potential and Its Influencing Factors on the Loess Plateau: Based on the Potential Realization Model and Spatial Dubin Model. Land 2025, 14, 138. [Google Scholar] [CrossRef]
  56. Lei, J.; Li, C.; Yang, W. Ecosystem health assessment and approaches to improve Sichuan Province based on an improved vigor organization resilience model. Ecol. Indic. 2023, 155, 110925. [Google Scholar] [CrossRef]
  57. Pan, Z.; He, J.; Liu, D.; Wang, J.; Guo, X. Ecosystem health assessment based on ecological integrity and ecosystem services demand in the Middle Reaches of the Yangtze River Economic Belt, China. Sci. Total Environ. 2021, 774, 144837. [Google Scholar] [CrossRef]
  58. Wang, Z.; Lin, L.; Zhang, B.; Xu, H.; Xue, J.; Fu, Y.; Zeng, Y.; Li, F. Sustainable urban development based on an adaptive cycle model: A coupled social and ecological land use development model. Ecol. Indic. 2023, 154, 110666. [Google Scholar] [CrossRef]
  59. Finch, D.; Corbacho, D.; Schofield, H.; Davison, S.; Wright, P.G.R.; Broughton, R.K.; Mathews, F. Modelling the functional connectivity of landscapes for greater horseshoe bats Rhinolophus ferrumequinum at a local scale. Landsc. Ecol. 2020, 35, 577–589. [Google Scholar] [CrossRef]
  60. Blazquez, C.S.; Ciudad, C.; Gaston, A.; Simon, M.; Saura, S. Identification of strategic corridors for restoring landscape connectivity: Application to the Iberian lynx. Anim. Conserv. 2019, 22, 210–219. [Google Scholar] [CrossRef]
  61. Mengist, W.; Soromessa, T.; Feyisa, G.L. Landscape change effects on habitat quality in a forest biosphere reserve: Implications for the conservation of native habitats. J. Clean. Prod. 2021, 329, 129778. [Google Scholar] [CrossRef]
  62. Wang, C.; Zhou, S.; Liu, H.; Li, Y. Robustness and its optimization of the habitat network structure for the multi guilds coexistence: A case study of Yancheng coastal wetlands. Acta Ecol. Sin. 2023, 43, 9193–9205. [Google Scholar] [CrossRef]
  63. Xie, J.; Xie, B.; Zhou, K.; Li, J.; Xiao, J.; Liu, C.; Zhang, X. Factors impacting ecological network in Changsha-Zhuzhou-Xiangtan urban agglomeration, China—Based on the perspective of functional performance. Ecol. Indic. 2023, 154, 110771. [Google Scholar] [CrossRef]
  64. Xu, Y.; Duan, J.; Xu, X. Comprehensive measure methods of regional multi-dimensional development and their applications. Acta Geogr. Sin. 2016, 71, 2129–2140. [Google Scholar] [CrossRef]
  65. Sundstrom, S.M.; Allen, C.R. The adaptive cycle: More than a metaphor. Ecol. Complex. 2019, 39, 100767. [Google Scholar] [CrossRef]
  66. Holling, C.S. Resilience of Ecosystems: Local Surprise and Global Change. In Sustainable Development and the Biosphere; Clark, W.C., Munn, R.E., Eds.; Cambridge University Press: Cambridge, UK, 1986. [Google Scholar]
  67. Zhang, M.; Kafy, A.-A.; Ren, B.; Zhang, Y.; Tan, S.; Li, J. Application of the Optimal Parameter Geographic Detector Model in the Identification of Influencing Factors of Ecological Quality in Guangzhou, China. Land 2022, 11, 1303. [Google Scholar] [CrossRef]
  68. Wang, J.; Xu, C. Geodetector: Principle and prospective. Acta Geogr. Sin. 2017, 72, 116–134. [Google Scholar] [CrossRef]
  69. Feng, X.; Xiu, C.; Bai, L.; Zhong, Y.; Wei, Y. Comprehensive evaluation of urban resilience based on the perspective of landscape pattern: A case study of Shenyang city. Cities 2020, 104, 102722. [Google Scholar] [CrossRef]
  70. Hu, C.; Zhang, M.; Huang, G.; Li, Z.; Sun, Y.; Zhao, J. Tracking the Impact of the Land Cover Change on the Spatial-Temporal Distribution of the Thermal Comfort: Insights from the Qinhuai River Basin, China. Sustain. Cities Soc. 2024, 18, 105916. [Google Scholar] [CrossRef]
  71. Sandoval, S.; Escobar-Flores, J.G.; Badar Munir, M. Urbanization and its impacts on land surface temperature and sea surface temperature in a tourist region in Mexico from 1990 to 2020. Remote Sens. Appl. Soc. Environ. 2023, 32, 101046. [Google Scholar] [CrossRef]
  72. Yang, H.; Ning, Q.; Zhou, H.; Lai, N.; Song, Q.; Ji, Q.; Zeng, Z. Digital research on the resilience control of water ecological space under the concept of urban-water coupling. Front. Environ. Sci. 2023, 11, 1270921. [Google Scholar] [CrossRef]
  73. Zhu, H.; Wang, A.; Wang, P.; Hu, C.; Zhang, M. Spatiotemporal Dynamics and Response of Land Surface Temperature and Kernel Normalized Difference Vegetation Index in Yangtze River Economic Belt, China: Multi-Method Analysis. Land 2025, 14, 598. [Google Scholar] [CrossRef]
  74. Kebede, A.S.; Nicholls, R.J.; Allan, A.; Arto, I.; Cazcarro, I.; Fernandes, J.A.; Hill, C.T.; Hutton, C.W.; Kay, S.; Lázár, A.N.; et al. Applying the global RCP–SSP–SPA scenario framework at sub-national scale: A multi-scale and participatory scenario approach. Sci. Total Environ. 2018, 635, 659–672. [Google Scholar] [CrossRef] [PubMed]
  75. Sun, Z.; Wang, S.; Chen, B. Construction of ecological security pattern and assessment of ecological resilience based on ecosystem services: A case study of Changsha-Zhuzhou-Xiangtan urban agglomeration. Acta Ecol. Sin. 2024, 44, 4650–4661. [Google Scholar]
Figure 1. The research framework and processes.
Land 14 00709 g001
Figure 2. Location and elevation of the study area (a) and land use 2000, 2010, and 2020 (b).
Land 14 00709 g002
Figure 3. Spatial and temporal distribution pattern of ecological risk.
Land 14 00709 g003
Figure 4. Spatial and temporal distribution pattern of ecological potential.
Land 14 00709 g004
Figure 5. Spatial and temporal distribution pattern of ecological connectivity.
Land 14 00709 g005
Figure 6. Spatial and temporal distribution pattern of landscape ecological resilience.
Land 14 00709 g006
Figure 7. Distribution and trajectory of landscape ecological resilience centers of gravity (a), the landscape ecological resilience levels of districts and counties (b).
Land 14 00709 g007
Figure 8. Local spatial autocorrelation of landscape ecological resilience.
Land 14 00709 g008
Figure 9. Significance of spatial clustering of landscape ecological resilience.
Land 14 00709 g009
Figure 10. Spatial differentiation factors and interaction detection for landscape ecological resilience.
Land 14 00709 g010
Figure 11. Characteristic values of landscape ecological resilience of districts and counties in urban agglomerations (a); landscape ecological resilience of metropolitan and non-metropolitan areas (b).
Land 14 00709 g011
Figure 12. Dynamic stage of landscape ecosystems adaptation.
Land 14 00709 g012
Figure 13. Landscape ecological resilience of different land use (a), transfer of land use 2000–2010 (b) and 2010–2020 (c).
Land 14 00709 g013
Figure 14. Land-use intensity index by district and county.
Land 14 00709 g014
Table 1. Data and materials.
DatasetData SourceWebsite AddressResolution
Land coverResource and Environment Science and Data Center
(2000, 2010, and 2020)
https://www.resdc.cn (accessed on 5 July 2024)30 m
GDPhttps://www.resdc.cn (accessed on 24 July 2024)1000 m
PrecipitationNational Tibetan Plateau Data Centerhttps://data.tpdc.ac.cn (accessed on 25 August 2024)1000 m
Temperaturehttps://data.tpdc.ac.cn (accessed on 25 August 2024)1000 m
FVChttps://data.tpdc.ac.cn (accessed on 31 July 2024)250 m
PM2.5https://data.tpdc.ac.cn (accessed on 5 July 2024)1000 m
LSTNational Earth System Science Data Centerhttps://www.geodata.cn (accessed on 24 July 2024)1000 m
Soil typehttps://www.geodata.cn (accessed on 26 August 2024)-
Nighttime lighthttps://www.geodata.cn (accessed on 24 July 2024)500 m
Evapotranspirationhttps://www.geodata.cn (accessed on 16 August 2024)1000 m
NPPhttps://www.geodata.cn (accessed on 13 August 2024)500 m
NDVIhttp://www.nesdc.org.cn (accessed on 23 July 2024)30 m
Population densityWorld pophttps://hub.worldpop.org (accessed on 23 July 2024)100 m
Digital elevation modelGeospatial Data Cloudhttp://www.gscloud.cn (accessed on 5 July 2024)30 m
Roadthe National Road Traffic Network vector map of the Peking University Geographic Data Platform and National Catalog Service For Geographic Informationhttps://www.webmap.cn, https://geodata.pku.edu.cn/ (accessed on 5 August 2024)-
Table 2. Integrated Ecological Risk Assessment System.
Criterion LayerIndicatorAttributeCRITIC
Weight
AHP
Weight
WeightDescriptionsReferences
Geographic BasisTerrain location index0.06090.01980.0403 T I = log E E ¯ + 1 × S S ¯ + 1  (1)
TI   is   the   topographic   position   index ;   E   and   S   are   the   elevation   and   slope   at   any   position ,   respectively ;   E ¯   and   S ¯ are the average elevation and slope in the region, respectively.
[44]
Topographic relief0.03240.0360.0342\[44]
Soil type+0.07770.06520.0715Calcareous (rocky) soil and stony soil are 1; tide soil, yellow soil, and yellow-brown soil are 0.8;
rice soil is 0.6; red soil is 0.4; mountain meadow soil and purple soil are 0.2; and other soils are 0.
[45]
Landscape PatternsLandscape disturbance index+0.05900.09180.0754 E = 0.5 × P + 0.3 × F + 0.2 × D  (2)
E is the landscape disturbance index; P is the patch density; F is the landscape segmentation index; D is the landscape separateness index.
[20,46]
Spreading index0.14590.04060.0932\[47]
Shannon diversity index0.12900.03040.0797\[47]
NDVI0.04450.10670.0756\[48]
Human
activities
Population agglomeration pressure+0.03780.05230.0451pd ≥ 1000 people/km2, PDI is 1; otherwise
P D I = 0.333 × log p d + 1  (3)
PDI is population agglomeration pressure; pd is population density.
[49]
Land use pressure+0.07920.04080.0600Construction land, unutilized land, cropland, grassland, water bodies, and forest land are, respectively, 1, 0.9, 0.5, 0.2, 0.1, and 0.[44]
Transportation pressure+0.10760.10770.1076The pressure on the traffic network is assigned with different radius buffers according to different road classes. [50,51]
Economic pressure+0.01870.07080.0448\[20]
Air pollution pressure+0.07800.04360.0608\[42]
Electricity consumption Pressure+0.01480.10170.0582\[48]
Natural
Disasters
Geologic disasters+0.05450.09460.0745Measured by informativeness[52]
Rain and flood disasters+0.02370.06010.0419Measured by hazard factor and environment[52]
Surface thermal environment+0.03630.03810.0372Characterized by surface temperature data[48]
Table 3. Ecological corridor buffer connectivity assignment.
Level 1 Ecological CorridorLevel 2 Ecological CorridorLevel 3 Ecological Corridor
Buffer Distance (km)ConnectivityBuffer Distance (km)ConnectivityBuffer Distance (km)Connectivity
0–110–0.80.80–0.50.5
1–20.50.8–1.60.40.5–10.25
2–30.251.6–2.40.21–1.50.125
>30>2.40>1.50
Disclaimer/Publisher’s Note: The statements, opinions and data contained in all publications are solely those of the individual author(s) and contributor(s) and not of MDPI and/or the editor(s). MDPI and/or the editor(s) disclaim responsibility for any injury to people or property resulting from any ideas, methods, instructions or products referred to in the content.

