Abstract
High-resolution multispectral remote sensing imagery is widely used in critical fields such as coastal zone management and marine engineering. However, obtaining such images at a low cost remains a significant challenge. To address this issue, we propose the MRSRGAN method (multi-scale residual super-resolution generative adversarial network). The method leverages Sentinel-2 and GF-2 imagery, selecting nine typical land cover types in coastal zones, and constructs a small sample dataset containing 5210 images. MRSRGAN extracts the differential features between high-resolution (HR) and low-resolution (LR) images to generate super-resolution images. In our MRSRGAN approach, we design three key modules: the fusion attention-enhanced residual module (FAERM), multi-scale attention fusion (MSAF), and multi-scale feature extraction (MSFE). These modules mitigate gradient vanishing and extract image features at different scales to enhance super-resolution reconstruction. We conducted experiments to verify their effectiveness. The results demonstrate that our approach reduces the Learned Perceptual Image Patch Similarity (LPIPS) by 14.34% and improves the Structural Similarity Index (SSIM) by 11.85%. It effectively improves the issue where the large-scale span of ground objects in remote sensing images makes single-scale convolution insufficient for capturing multi-scale detailed features, thereby improving the restoration effect of image details and significantly enhancing the sharpness of ground object edges.
1. Introduction
In remote sensing research, remote sensing images are widely used in various fields, such as coastal zone change studies [1], environmental monitoring [2], geographic object detection [3], and land use/land cover mapping [4]. These studies typically rely on high-spatial-resolution images to capture surface details and support precise analysis. Particularly in applications within coastal zones, such as coastal erosion monitoring [5], marine habitat mapping [6], and coastal water quality monitoring [7], the importance of high-spatial-resolution images is especially prominent. Sub-meter resolution images can clearly identify subtle features such as small erosion gullies, rock collapses, and vegetation cover changes while also accurately assessing coral coverage, bleaching phenomena, and the degree of habitat fragmentation. This information is crucial for both scientific research and practical applications. The Sentinel-2 satellite provides globally available, open-access multispectral remote sensing images with a spatial resolution of 10 m. However, this resolution is considered mid-to-low and cannot meet the needs of scientific research that requires high-resolution remote sensing images. Although high-resolution remote sensing satellites such as WorldView can provide sub-meter resolution images, they are typically not freely available to the public and come with high acquisition costs. As the demand for low-cost high-resolution multispectral remote sensing image data continues to grow, it is becoming increasingly important to find image processing technologies capable of upscaling low-resolution remote sensing images to higher resolutions.
Image super-resolution technology effectively addresses the above-mentioned issue by generating high-resolution images from low-resolution ones using algorithms [8,9,10]. In recent years, significant progress has been made in deep learning-based image super-resolution techniques. Models such as SRGAN [11], BSRGAN [12], DPSR [13], and other GAN-based enhanced super-resolution models have demonstrated outstanding performance in super-resolution tasks [12,13,14,15,16,17,18]. These methods have achieved remarkable advancements in natural image super-resolution and have also provided important insights for super-resolution research in remote sensing images. Existing single-image remote sensing super-resolution methods primarily include strategies that model degradation to learn the differences between high- and low-resolution remote sensing images [19,20,21,22,23] as well as other super-resolution approaches based on different ideas [24,25,26,27,28,29,30]. In recent years, various innovative algorithm improvements have emerged. Lim et al. proposed the Enhanced Deep Super-Resolution Network (EDSR), which removes unnecessary modules in traditional residual networks [31]. Zhang et al. proposed a Multi-Scale Attention Network (MSAN), which can extract multi-level features of remote sensing images and more accurately describe the structural characteristics of different scenes [32]. Additionally, Zhang et al. introduced a Mixed High-Order Attention Network (MHAN), which consists of a feature extraction network and a high-order attention (HOA) feature refinement network, focusing on feature extraction and detail restoration [33]. These researchers have optimized the algorithms of super-resolution models to varying degrees.
Although these algorithms have improved the super-resolution imaging of remote sensing images, they mainly focus on land-based land cover landscapes, with relatively few studies on coastal zones. Remote sensing images of coastal zones typically contain a variety of characteristic land covers, such as sandy coastal zone, artificial docks, muddy coastal zone, aquaculture areas, and sea waves [34]. Our remote sensing image data includes large areas of aquaculture zones, beaches, muddy coastlines, and piers. The texture features of these land covers are complex and diverse, and a single remote sensing image often covers multiple land covers with significantly different texture details. This makes the super-resolution processing of high-frequency information more challenging [35,36,37].
Therefore, an adaptive method that can accommodate different scenarios is needed to better fit remote sensing images of the coastal areas. We propose a novel MRSRGAN method, with the main contributions including the following:
- (1)
- In our generator, we use a residual network structure, integrating the CBAM attention mechanism into the residual modules. We no longer use the baseline images generated through interpolation operations. Therefore, the final output consists solely of feature maps processed by convolutions and activation functions, with the residual connection part of the interpolated images removed.
- (2)
- To better capture multi-level texture information of the land cover, we have designed two multi-scale modules, MSFE and MSAF. These two modules work in tandem, utilizing convolutional kernels of different scales to extract texture features from multiple levels of land cover and combine them.
2. Data and Methods
Given that our study area was a coastal zone encompassing a diverse range of land cover types, we placed particular emphasis on capturing multi-scale detailed features in our methodological design to ensure that our approach can flexibly adapt to different land cover types. To this end, the MRSRGAN method optimizes the generator design by introducing three innovative modules: the fusion attention mechanism enhanced residual module (FAERM), the multi-scale attention fusion module (MSAF), and the multi-scale feature extraction module (MSFE). In the following sections, this paper will sequentially introduce the sources of experimental data, the overall framework of the MRSRGAN (multi-scale attention fusion residual generative adversarial network) method, the design concepts and implementation processes of the aforementioned three modules, and the loss functions and evaluation metrics.
2.1. Study Area and Data
The study area is located in Weihai City, Shandong Province. The selected remote sensing images cover various land cover types, including embankments, aquaculture areas, beaches, waves, and roads. The data were sourced from Gaofen-2 and Sentinel-2 remote sensing imagery. We selected 5210 images of 256 × 256 pixels from Gaofen-1 imagery, with 95% used for training and 5% for testing, ensuring no overlap between the two sets. The validation set was based on Sentinel-2 remote sensing imagery. The model was trained using a supervised deep learning approach in the form of image pairs. For processing the Gaofen-2 images, a common bicubic downsampling method, frequently used in deep learning-based remote sensing image super-resolution tasks, was applied to generate a suitable dataset for training (Table 1).

Table 1.
The information of used data.
The raw Gaofen-2 and Sentinel-2 remote sensing imagery needed preprocessing before they could be used for dataset creation. The raw data of Gaofen-2 included multispectral (MSS) and panchromatic (PAN) images, with MSS having a resolution of 4 m and PAN having a resolution of 0.8 m. By fusing the MSS and PAN images, an RGB image with a resolution of 0.8 m was obtained. For Sentinel-2, the multispectral visible light bands had a resolution of 10 m, and an RGB image was generated by merging the red, green, and blue bands.
2.2. MRSRGAN Framework Overview
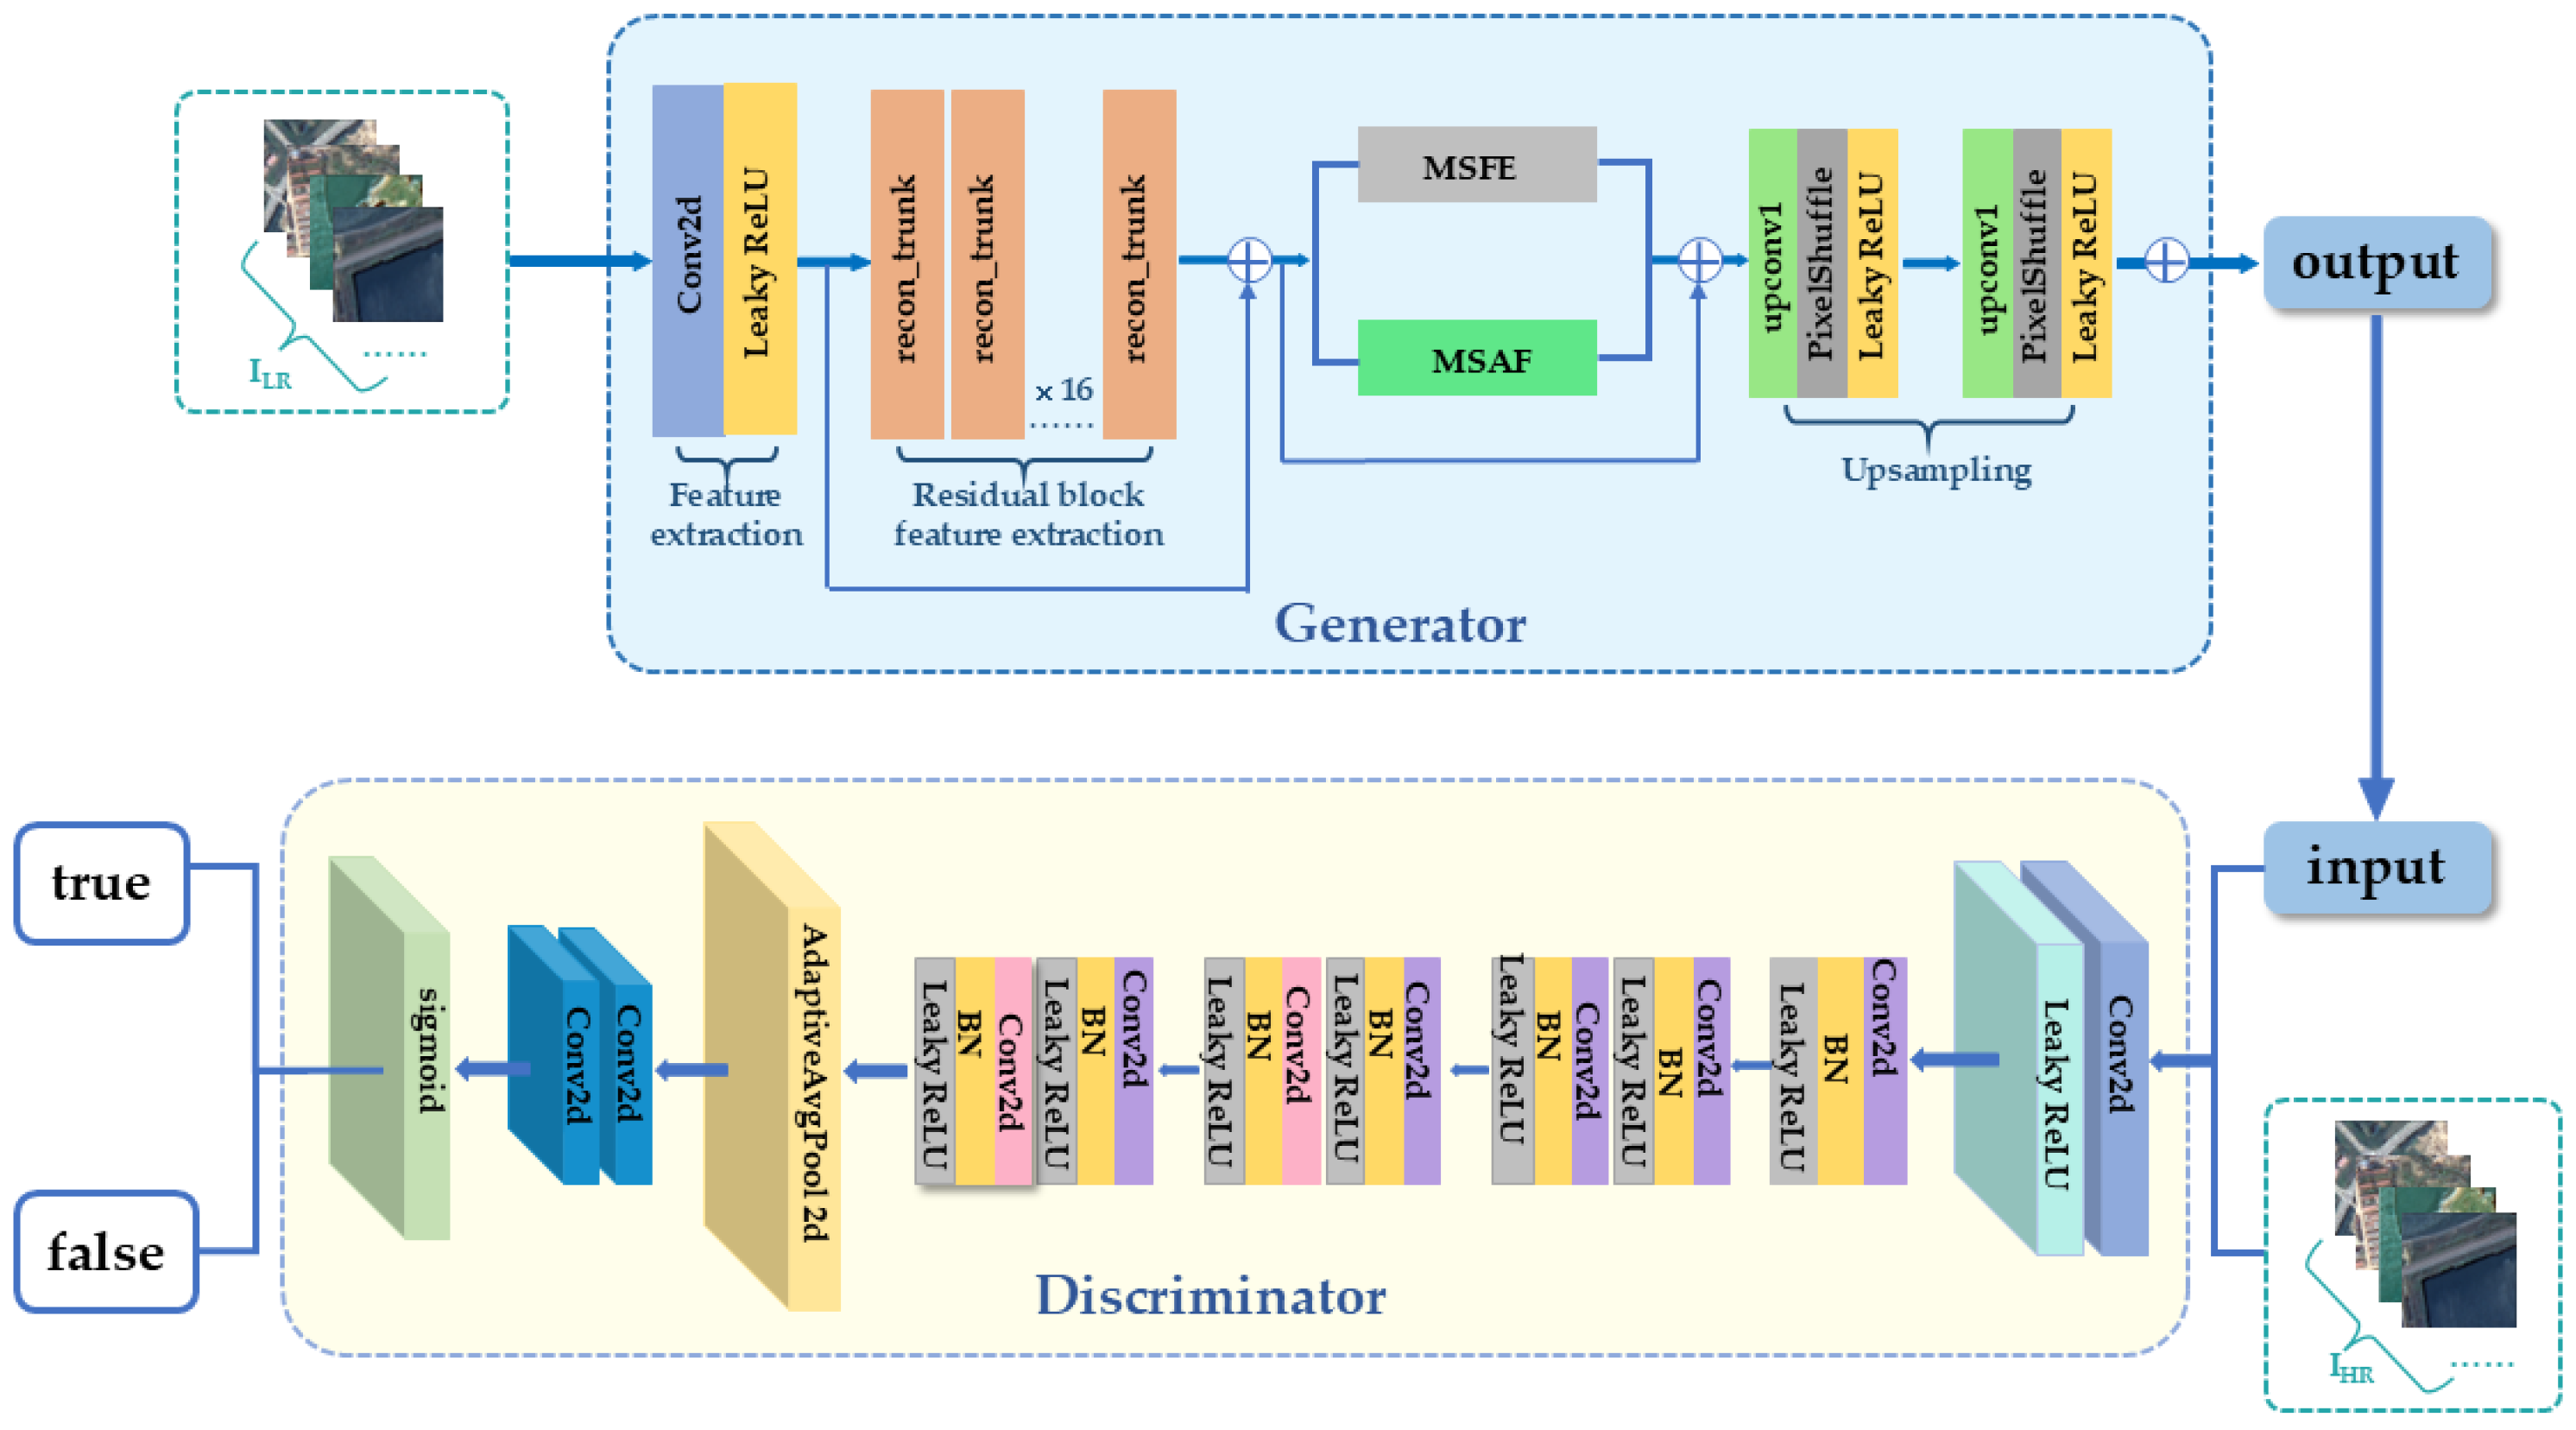
MRSRGAN (multi-scale attention fusion residual GAN) consists of two main components: the generator and the discriminator (as shown in Figure 1). The generator of MRSRGAN employs the Fusion Attention Mechanism Enhanced Residual Module to learn the mapping relationship between low-resolution images and their corresponding high-resolution images. At the same time, it collaboratively uses two multi-scale feature extraction modules to expand the receptive field, allowing for the effective transformation of low-resolution (LR) images into high-resolution (HR) images. The discriminator is used to assess the difference between the generated images and the real images. Through adversarial training, the generator G is continuously optimized to produce more realistic super-resolution images, while the discriminator D progressively enhances its ability to distinguish the authenticity of the images as it receives feedback.

Figure 1.
Structure of MRSRGAN.
In MRSRGAN, the basic principles of the training process can be represented in functional form. We define the generator G and discriminator D with their respective functional principles as follows [8,11]:
represents the parameters of the generator G, and represents the parameters of the discriminator D. denotes the process by which the generator transforms the low-resolution image (ILR) into a super-resolution image (ISR), while represents the output of the discriminator. This adversarial process enables the generator to progressively learn to produce more realistic high-resolution images.
Based on the fundamental architecture of MRSRGAN, we optimized the model to enhance its performance in high-resolution image processing. Specifically, we introduced the fusion attention mechanism enhanced residual module (FAERM), the multi-scale feature fusion module (MSAF), and the multi-scale feature extraction module (MSFE). The key concept behind these improvements was to expand the receptive field, thereby strengthening the model’s ability to extract texture features. In the following sections, we will provide a detailed explanation of the design and functionality of these three modules.
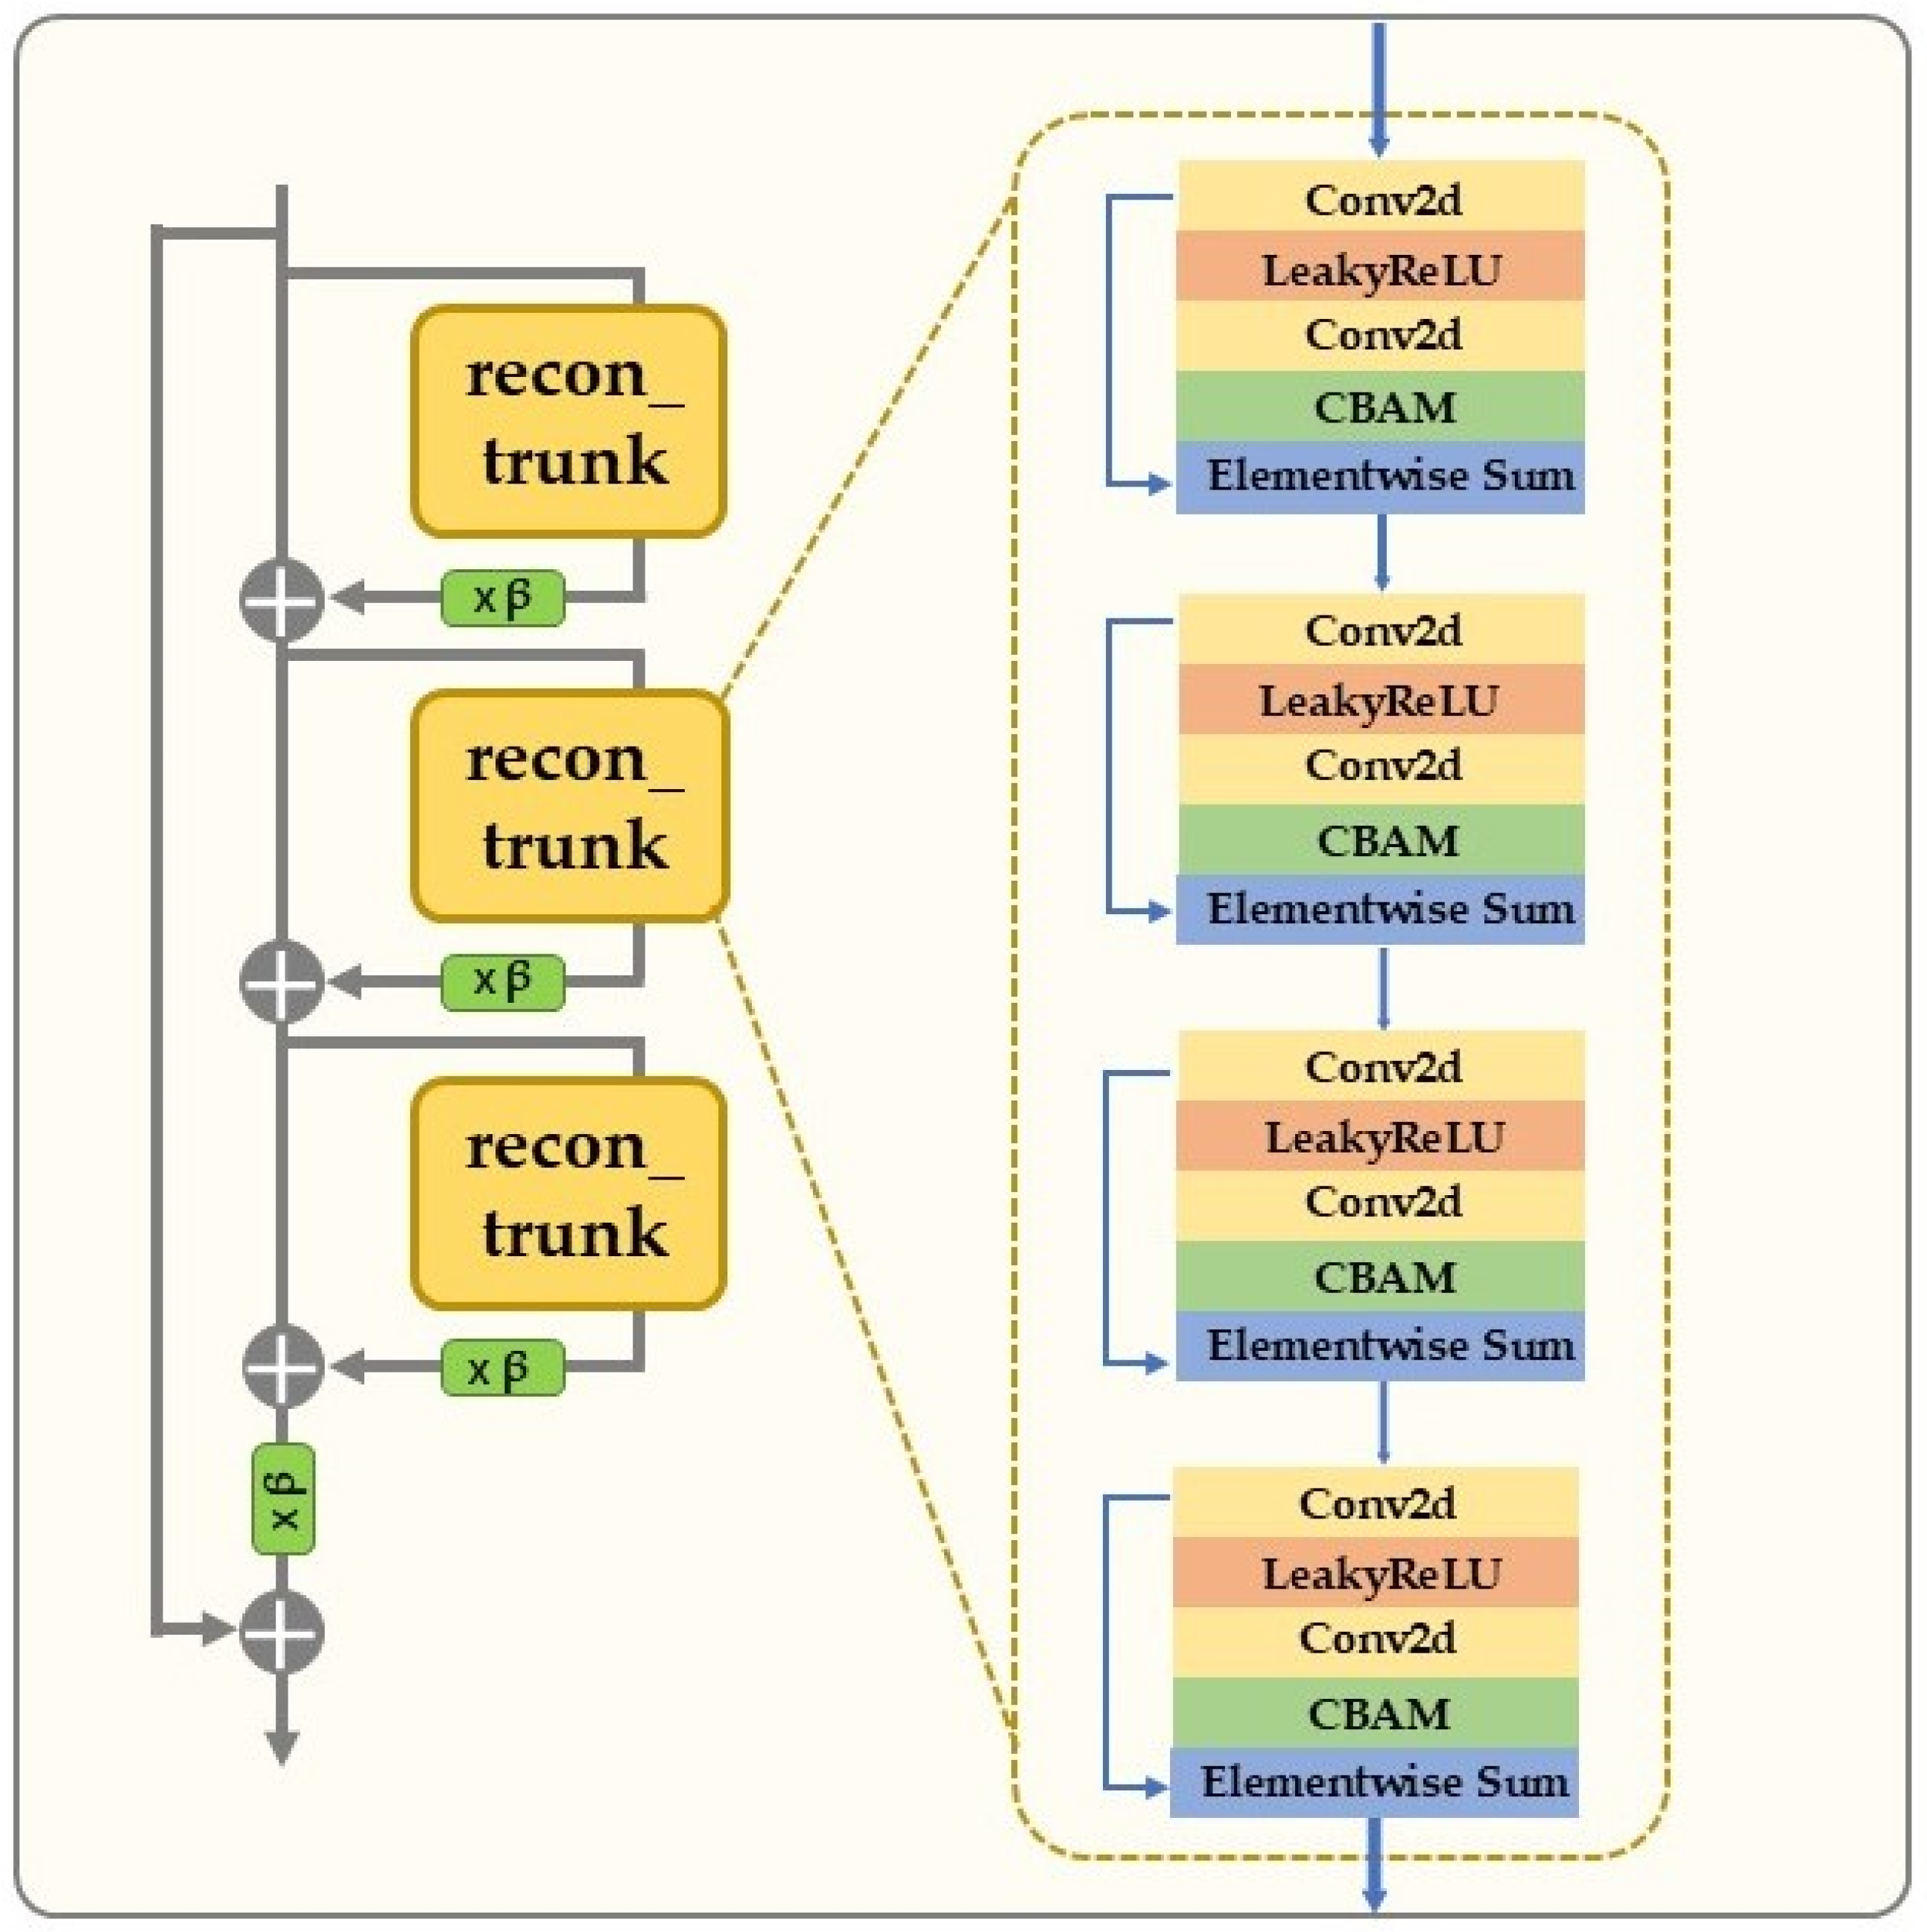
2.2.1. Fusion Attention Mechanism Enhanced Residual Module (FAERM)
To avoid incorrect weight allocation in the feature map due to irrelevant or noisy features, we designed the fusion attention mechanism enhanced residual module (FAERM). This residual module integrates the convolutional block attention module (CBAM), which optimizes the significance of different regions in the feature map by modeling the global feature distribution and applying adaptive weight allocation. This strengthens the representation of important areas while suppressing irrelevant or redundant features. This improvement enhanced both the accuracy and efficiency of feature extraction. At the same time, we retained the efficient information transfer mechanism of the traditional residual module, with its internal connection shown in Figure 2. The computation process for each residual module can be expressed as follows:
and are two convolutional layers, and x is the input.
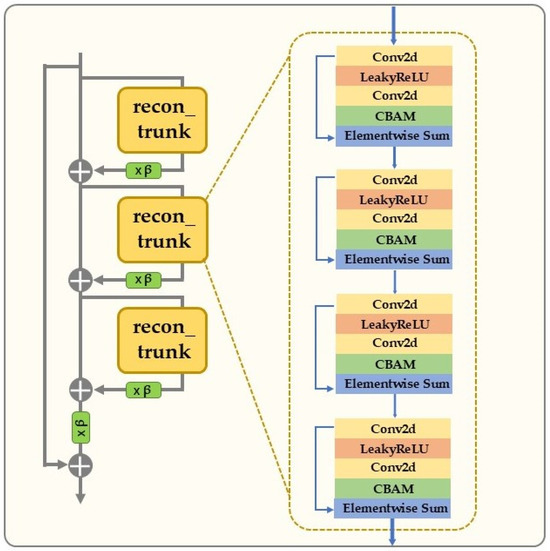
Figure 2.
The algorithmic structure of the fusion attention mechanism enhanced residual module (FAERM).
Figure 2.
The algorithmic structure of the fusion attention mechanism enhanced residual module (FAERM).
2.2.2. Multi-Scale Attention Fusion Module (MSAF)
Our multi-scale attention fusion module (MSAF) was located after the residual module and before the upsampling process. Its purpose was to expand the receptive field and integrate features from different scales, enhancing the model’s ability to perceive spatial information in the image. This module (as shown in Figure 3) utilizes large, medium, and small convolutional kernels to extract spatial features at different scales, which are then concatenated. To further strengthen feature representation, we also applied the convolutional block attention module (CBAM) within the MSAF module to enhance the features from different receptive fields, ultimately achieving effective fusion of multi-scale features. The principle of the entire MSAF module can be represented by the following formula:
Convk(I) represents the multi-scale features obtained by applying convolution operations at different scales to the input image I; Aatt is the weighted matrix calculated through the attention mechanism.
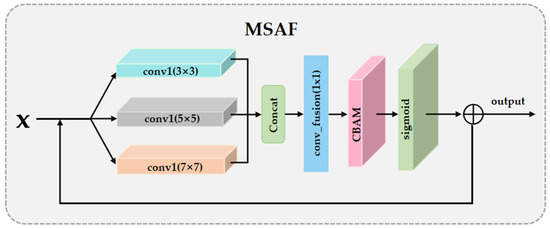
Figure 3.
The algorithmic structure of the multi-scale attention fusion module (MSAF).
Figure 3.
The algorithmic structure of the multi-scale attention fusion module (MSAF).

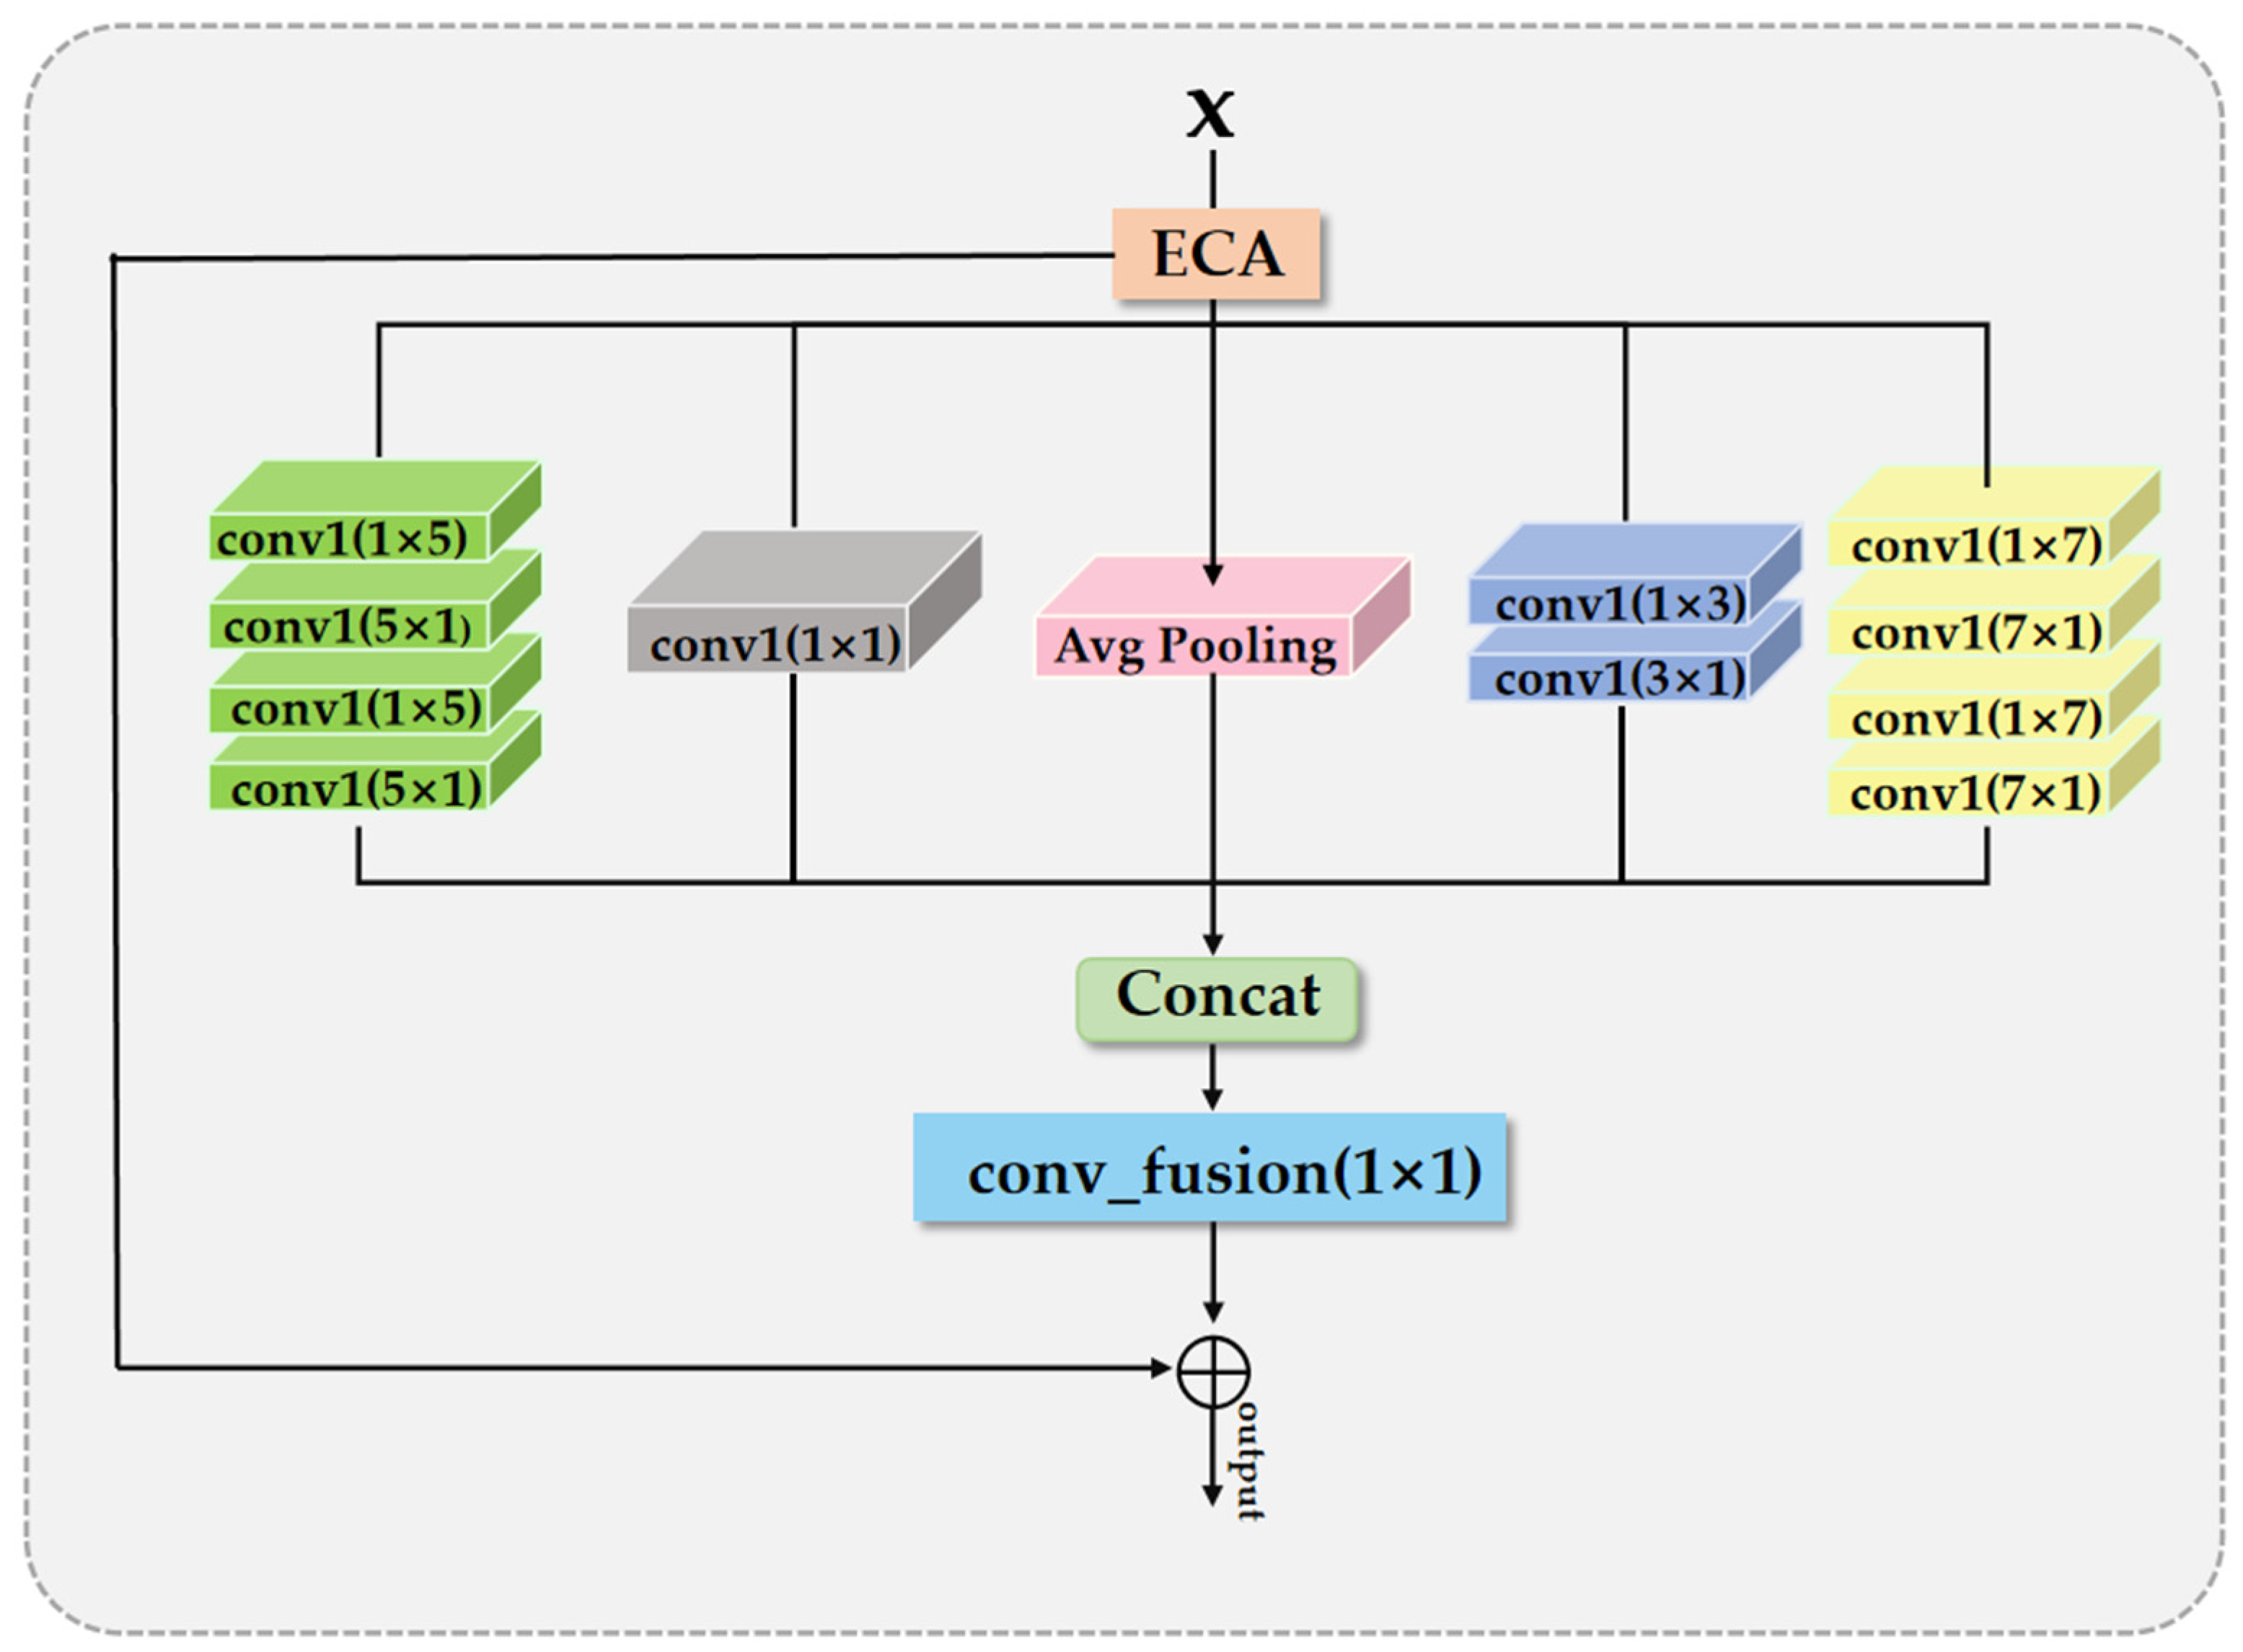
2.2.3. Multi-Scale Feature Extraction Module (MSFE)
The design approach of the multi-scale feature extraction module (MSFE) differs from that of the multi-scale attention fusion module (MSAF). As shown in Figure 4, this module incorporates the efficient channel attention (ECA) mechanism, which assigns adaptive weights to each channel, preserving important channel information and suppressing irrelevant channel information. The MSFE is designed with five branches, each using asymmetric convolutions to extract spatial information from five different receptive field scales. This design allows the network to focus on both large-scale and small-scale features, enhancing its ability to perceive textures, edges, and structures at various levels in the image. When processing complex scenes in remote sensing images, this multi-scale approach can fully leverage valuable spatial information. After obtaining the multi-scale features, they are concatenated to form the final multi-scale feature representation, as shown in the following function:
The variables y1, y2, y3, y4, and y5 represent the features extracted by each branch through different convolution operations at different scales, and Ffinal is the final output after channel attention weighting.
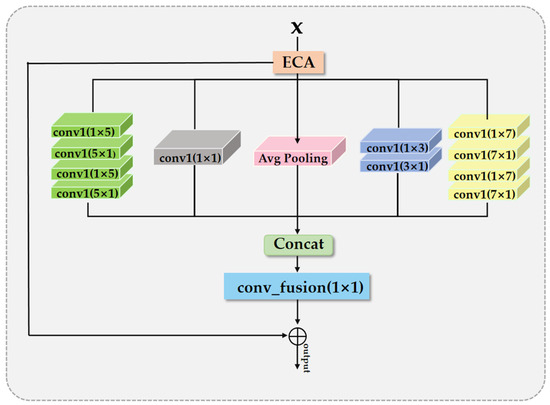
Figure 4.
The algorithmic structure of the multi-scale feature extraction module (MSFE).
Figure 4.
The algorithmic structure of the multi-scale feature extraction module (MSFE).
2.3. Loss Function and Evaluation Metrics
Our model employed four types of loss functions [38]: adversarial loss, perceptual loss, image loss, and total variation loss (TV Loss). Among them, the adversarial loss was used to evaluate the authenticity of the generated images, with the generator being trained to maximize the probability that the image was classified as real by the discriminator. The total variation loss optimized the generation process by smoothing the image and reducing noise, calculating the difference between adjacent pixel values. Perceptual loss focuses on capturing high-level features of the image rather than just pixel-level differences. The individual loss functions are ultimately aggregated to form the overall loss of the model, which is expressed by the following formula:
Among them, λadv, λperceptual, λimage, and λtv are the weight parameters for adversarial loss, perceptual loss, image loss, and total variation loss, respectively. Limage represents the image loss, Ladv represents the adversarial loss, Lperceptual represents the perceptual loss, and Ltv represents the total variation loss.
To further validate the effectiveness of the model, we used Peak Signal-to-Noise Ratio (PSNR) [39] as an important metric for evaluating the quality of the generated images. PSNR quantitatively assesses the performance of the generated image by measuring the pixel error between images, with the calculation based on Mean Squared Error (MSE) and expressed in decibels (dB). The formula for calculating PSNR is as follows:
MAX represents the maximum possible value. I(i,j) denotes the pixel value of the original image at position (i,j), and K(i,j) represents the pixel value of the reconstructed image at the same position. The variables m and n are the width and height, respectively.
In addition to PSNR, we also introduced the Structural Similarity Index (SSIM) [40] as an evaluation metric to quantify the structural similarity of the generated images. SSIM primarily focuses on the preservation of structural information in the image and perceptual quality, particularly in terms of luminance, contrast, and structural features. The formula for calculating SSIM is as follows:
The variables x and y represent the local windows of the two images to be compared, μ denotes their luminance, and C is a constant for stability. The variables σx and σy are the standard deviations, representing the contrast, while σxy is the covariance of the image blocks used to measure the similarity between the two blocks.
LPIPS (Learned Perceptual Image Patch Similarity) [11,41] utilizes a pre-trained deep neural network to measure the perceptual similarity between images. A lower LPIPS score indicates a higher perceptual similarity between two images. The specific calculation formula for LPIPS is as follows:
The variables x and y represent the two input images, denotes the features extracted at layer l using a pre-trained deep neural network, and wl represents the learnable weight parameters.
3. Experiment and Result Analysis
3.1. Experiment Workflow
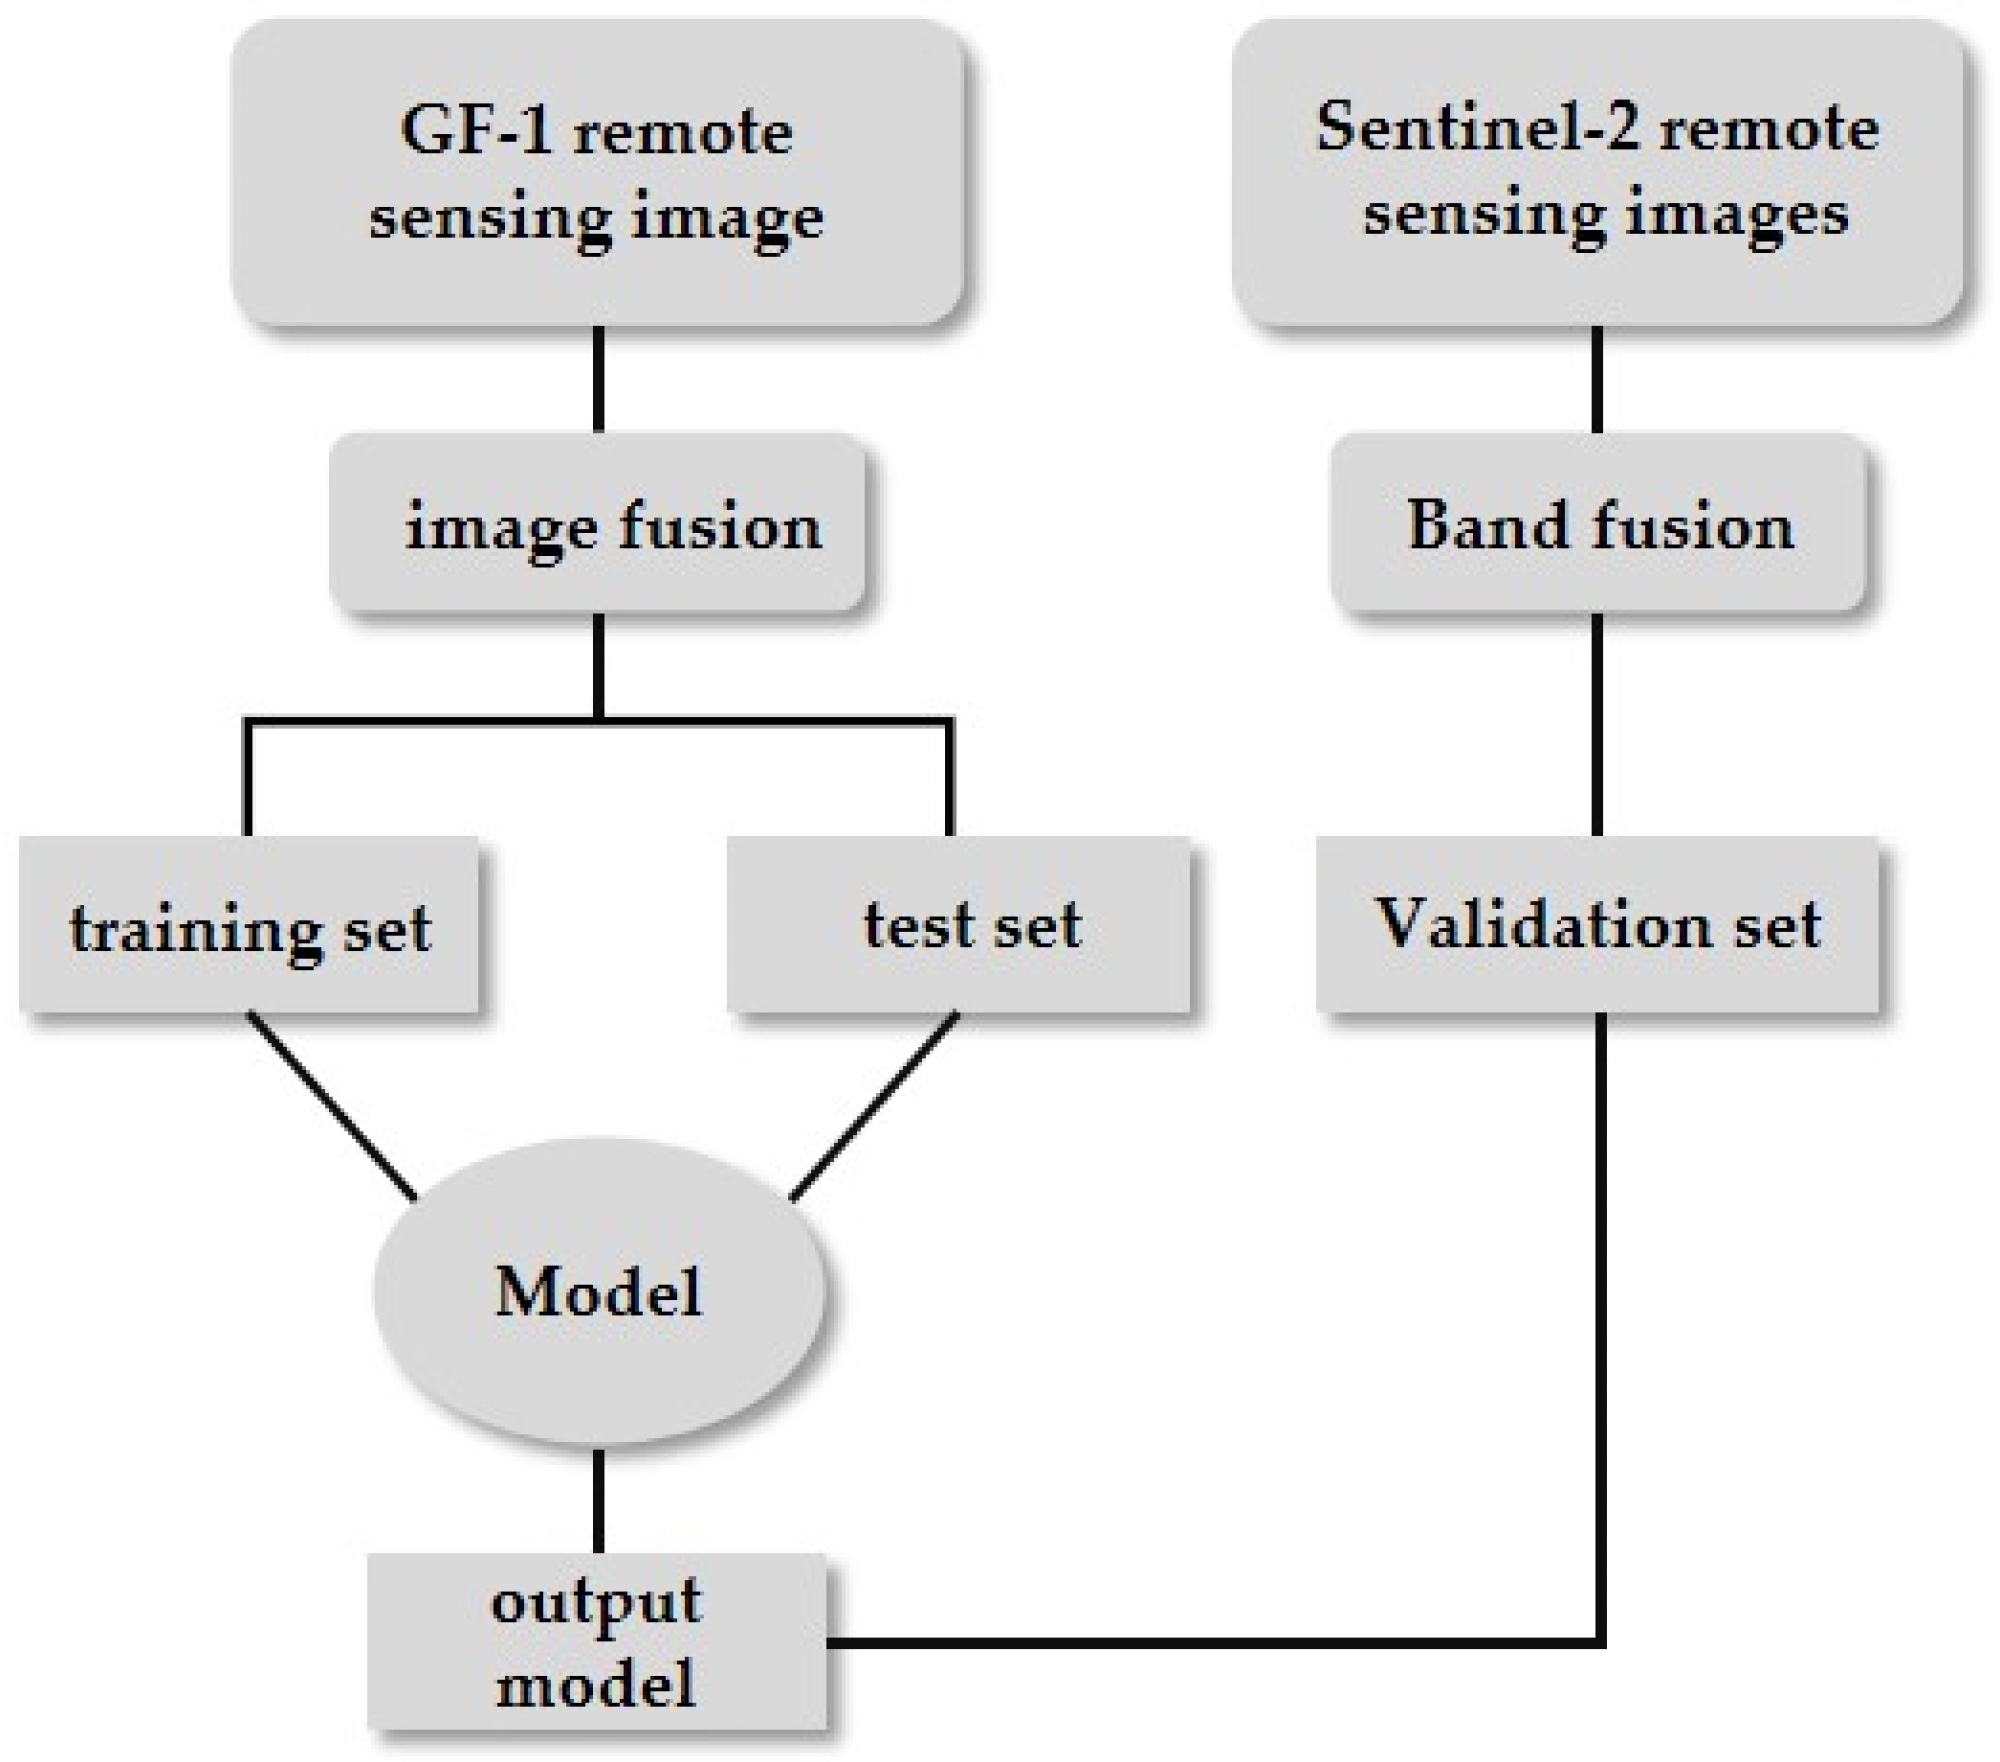
The main datasets we used are from GF-2 and Sentinel-2 (as shown in Figure 5). During the model training phase, high-resolution (HR) images from the GF-2 sensor and their corresponding downsampled low-resolution (LR) images were selected to form training data pairs, which were used to train the model and obtain the best-performing model. To evaluate the model’s performance more comprehensively, we used 279 GF-2 images as the test set and 100 Sentinel-2 images as the validation set, testing and validating the feasibility of the model in enhancing the resolution of remote sensing images.

Figure 5.
Experiment workflow.
3.1.1. Data Preprocessing
Due to the resolution differences between the Gaofen-2 (GF-2) and Sentinel-2 satellite remote sensing images, with resolutions of 0.8 m and 10 m, respectively, the disparity in resolution is too large. Directly inputting these images into the model for training would significantly increase computational complexity and make it difficult to effectively preserve the mapping relationship between high- and low-resolution images. To address this issue, we designed a preprocessing strategy (as shown in Figure 6), in which the GF-2 images are downsampled to 3.2 m using bicubic interpolation, while maintaining the consistency of geographic coordinates. Based on this, the processed images are cropped into 256 × 256 image pairs, generating low-resolution (LR) images for training the MRSRGAN model, which will then generate the corresponding super-resolution (SR) images.
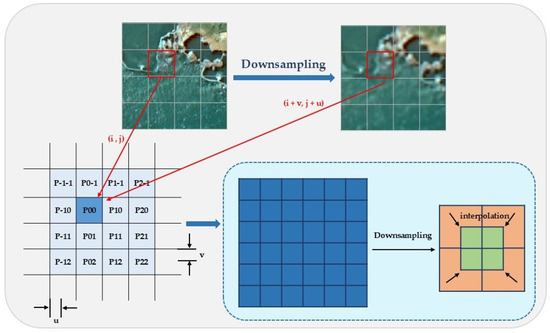
Figure 6.
Data preprocessing.
3.1.2. Settings
To ensure that MRSRGAN can be efficiently trained and achieve good performance, we precisely configured the training environment and parameters during the experiment. The experiment was implemented using the PyTorch 3.7framework on an Ubuntu 18.04.4 Linux system equipped with an NVIDIA RTX A6000 GPU, CUDA 12.2, and cuDNN 8.9.2. Throughout the training process, we continuously adjusted parameter configurations and conducted multiple experimental validations. Ultimately, we determined the optimal training parameter settings: the input image crop size (crop_size) was set to 250, the upscaling factor (upscale_factor) to 4, the number of training epochs (num_epochs) to 500, and the batch size (batch_size) to 64. In terms of optimization strategy, experimental results indicated that the model achieved the best convergence when the initial learning rate was set to 1 × 10⁻³, so this value was adopted as the final configuration. The training process utilized the Adam optimizer for parameter updates, and the data loader’s shuffle option (shuffle = True) was enabled to ensure sufficient randomness in the data distribution for each training epoch, thereby effectively enhancing the model’s feature learning capability and generalization performance.
3.2. Experimental Result Analysis
3.2.1. Comparison and Analysis of Convergence Speed and Performance of MRSRGAN
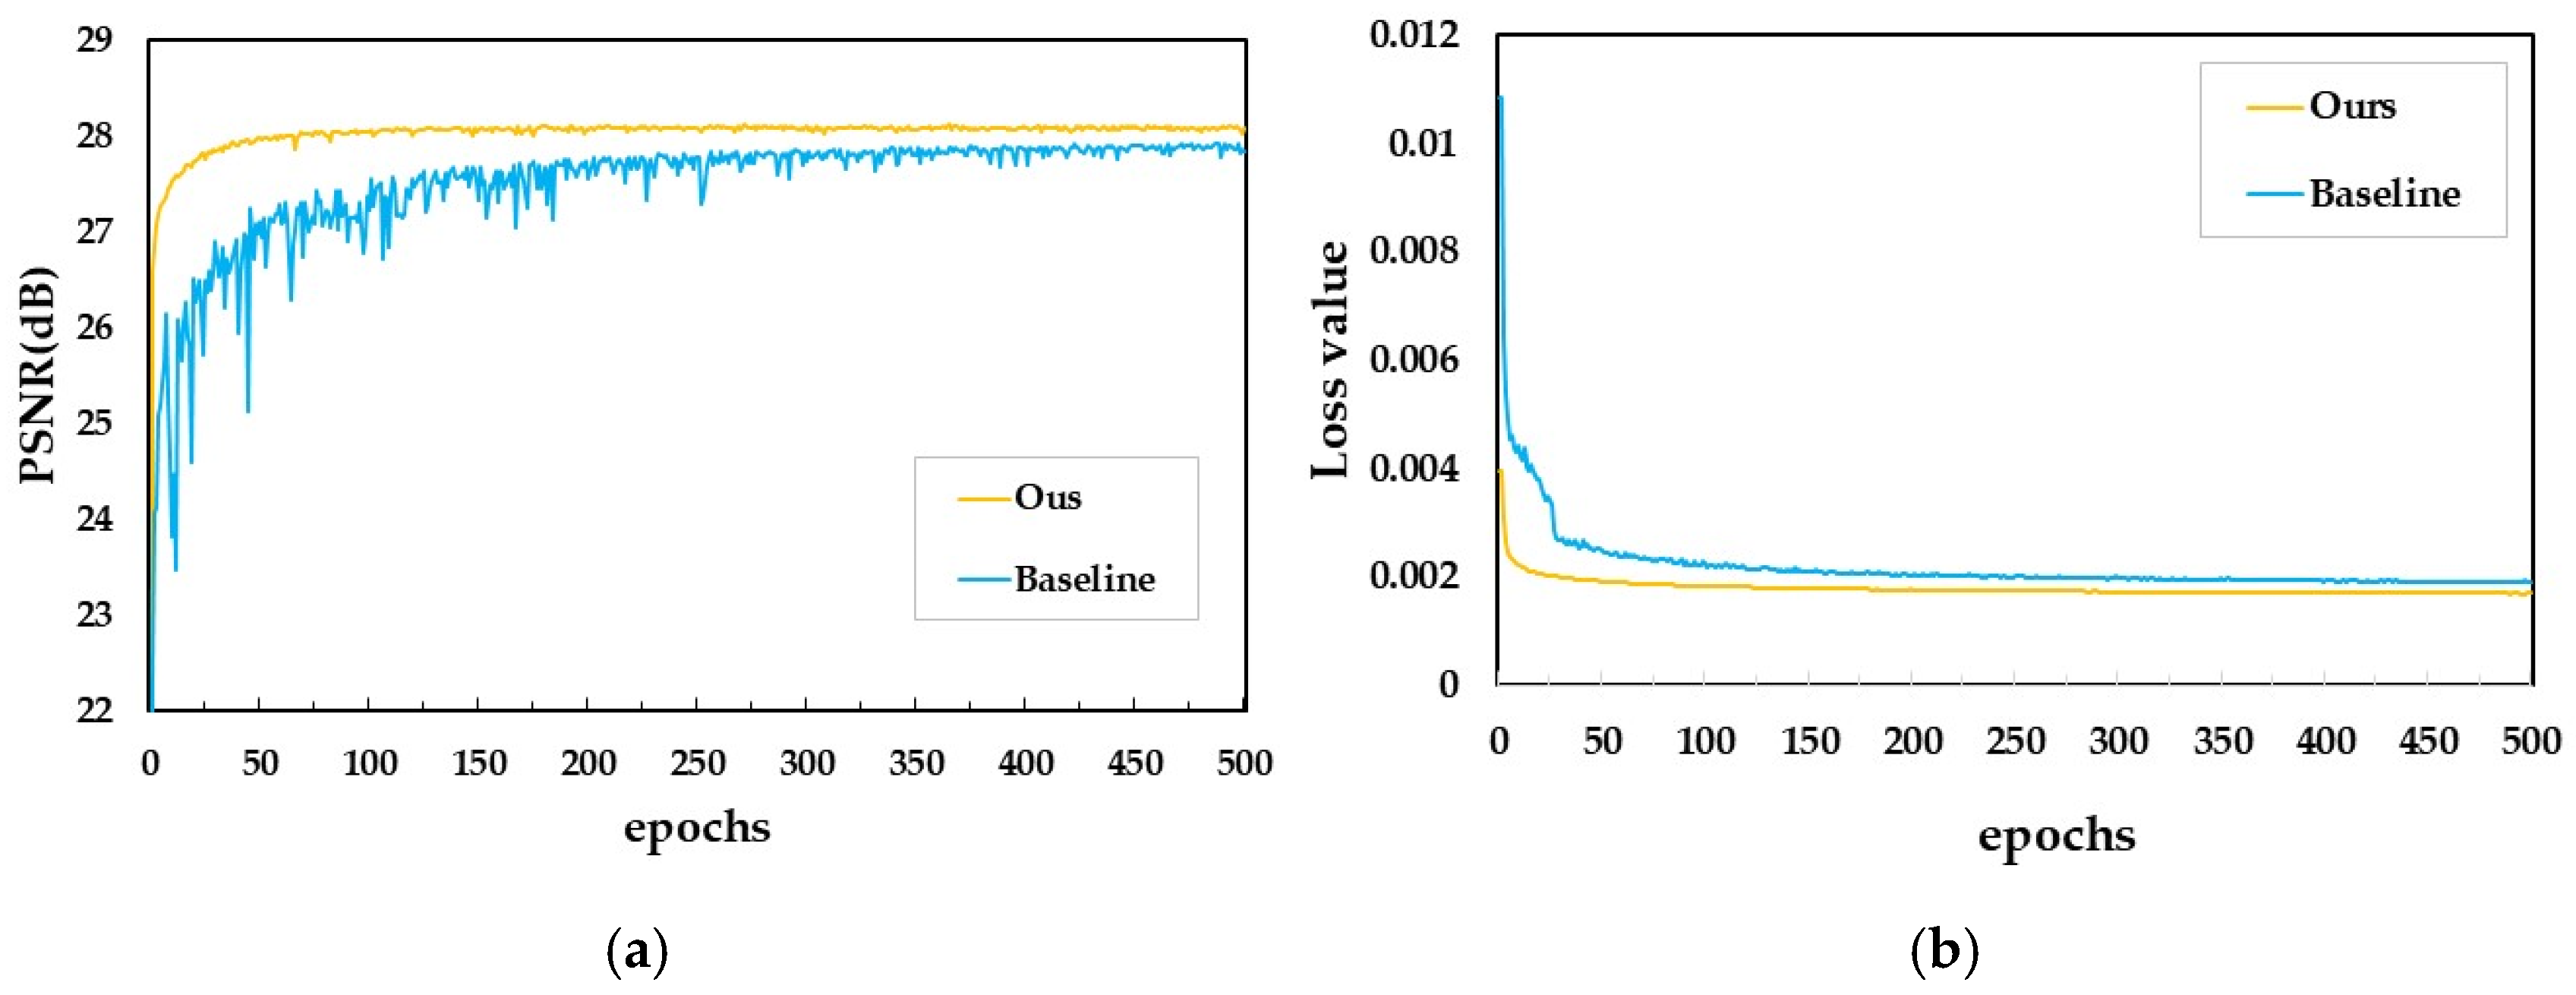
To validate the effectiveness of the modules added to our MRSRGAN method, this paper records and plots the PSNR values and loss function trends during training for both the method without the three added modules and the method with the added modules (as shown in Figure 7 and Table 2). The plots visually demonstrate the convergence behavior of MRSRGAN. The yellow line represents the improved MRSRGAN model, while the blue line represents the baseline SRGAN model. As seen in Figure 7a, the yellow line of MRSRGAN is consistently higher than the blue line of SRGAN, with less oscillation. At the 75th epoch, the PSNR value of MRSRGAN stabilizes, while the SRGAN model exhibits significant oscillation in the early stages of training, gradually stabilizing in the later stages, and only reaching stability around the 300th epoch. This indicates that the improved model not only converges faster but also offers more stable performance, achieving good training results more quickly. Figure 7b further shows that the yellow line of MRSRGAN drops much faster than the blue line of SRGAN, stabilizing by the 50th epoch. In contrast, SRGAN’s loss decreases more slowly, only stabilizing after the 200th epoch. Additionally, as shown in Table 2, the PSNR, SSIM, and LPIPS metrics are significantly improved after adding the three modules. In summary, the results visually demonstrate the performance improvements of MRSRGAN, proving that the model outperforms the original SRGAN in both training result quality and convergence speed.

Figure 7.
(a) Training loss value of baseline and ours; (b) validation PSNR values of baseline and ours.
Table 2.
Performance comparison before and after adding FAERM, MSAF, and MSFE modules.
3.2.2. Comparative Analysis of Performance with Existing Methods
To verify the effectiveness of the generator design in our proposed method, we conducted a series of experiments using a unified remote sensing image dataset containing diverse land cover landscapes. The dataset was separately used for training DPSR [13], BSRGAN [12], SRGAN [38], and the improved MRSRGAN method. A comparative analysis of the results from each method was then performed. To ensure scientific rigor and objectivity in evaluation, Table 3 presents the highest average PSNR and SSIM values achieved by each method during testing. For fairness, the best-performing version of each method during training was selected for testing. The results indicate significant differences among the generated outputs under identical training conditions. BSRGAN performed the worst, with a maximum PSNR of 20.10 dB, SSIM of 0.41, and LPIPS of 0.30. In contrast, the improved MRSRGAN achieved the best performance, reaching a maximum PSNR of 28.93 dB, SSIM of 0.80, and LPIPS of 0.23. Compared to the existing DPSR method, MRSRGAN improved PSNR by 0.52 dB, increased SSIM by 0.02, and reduced LPIPS by 0.06. Compared to the baseline method SRGAN, MRSRGAN achieved a PSNR increase of 0.61 dB, an SSIM improvement of 0.02, and a 10% (0.02) reduction in LPIPS. These results demonstrate that the improved MRSRGAN method exhibits faster convergence, higher reconstruction quality, and superior overall performance in super-resolution tasks, fully validating its advantages.
Table 3.
PSNR, SSIM, and LPIPS results of the same test dataset across different models.
3.2.3. Comparative Analysis of Enhancement Effects on Different Land Cover Types
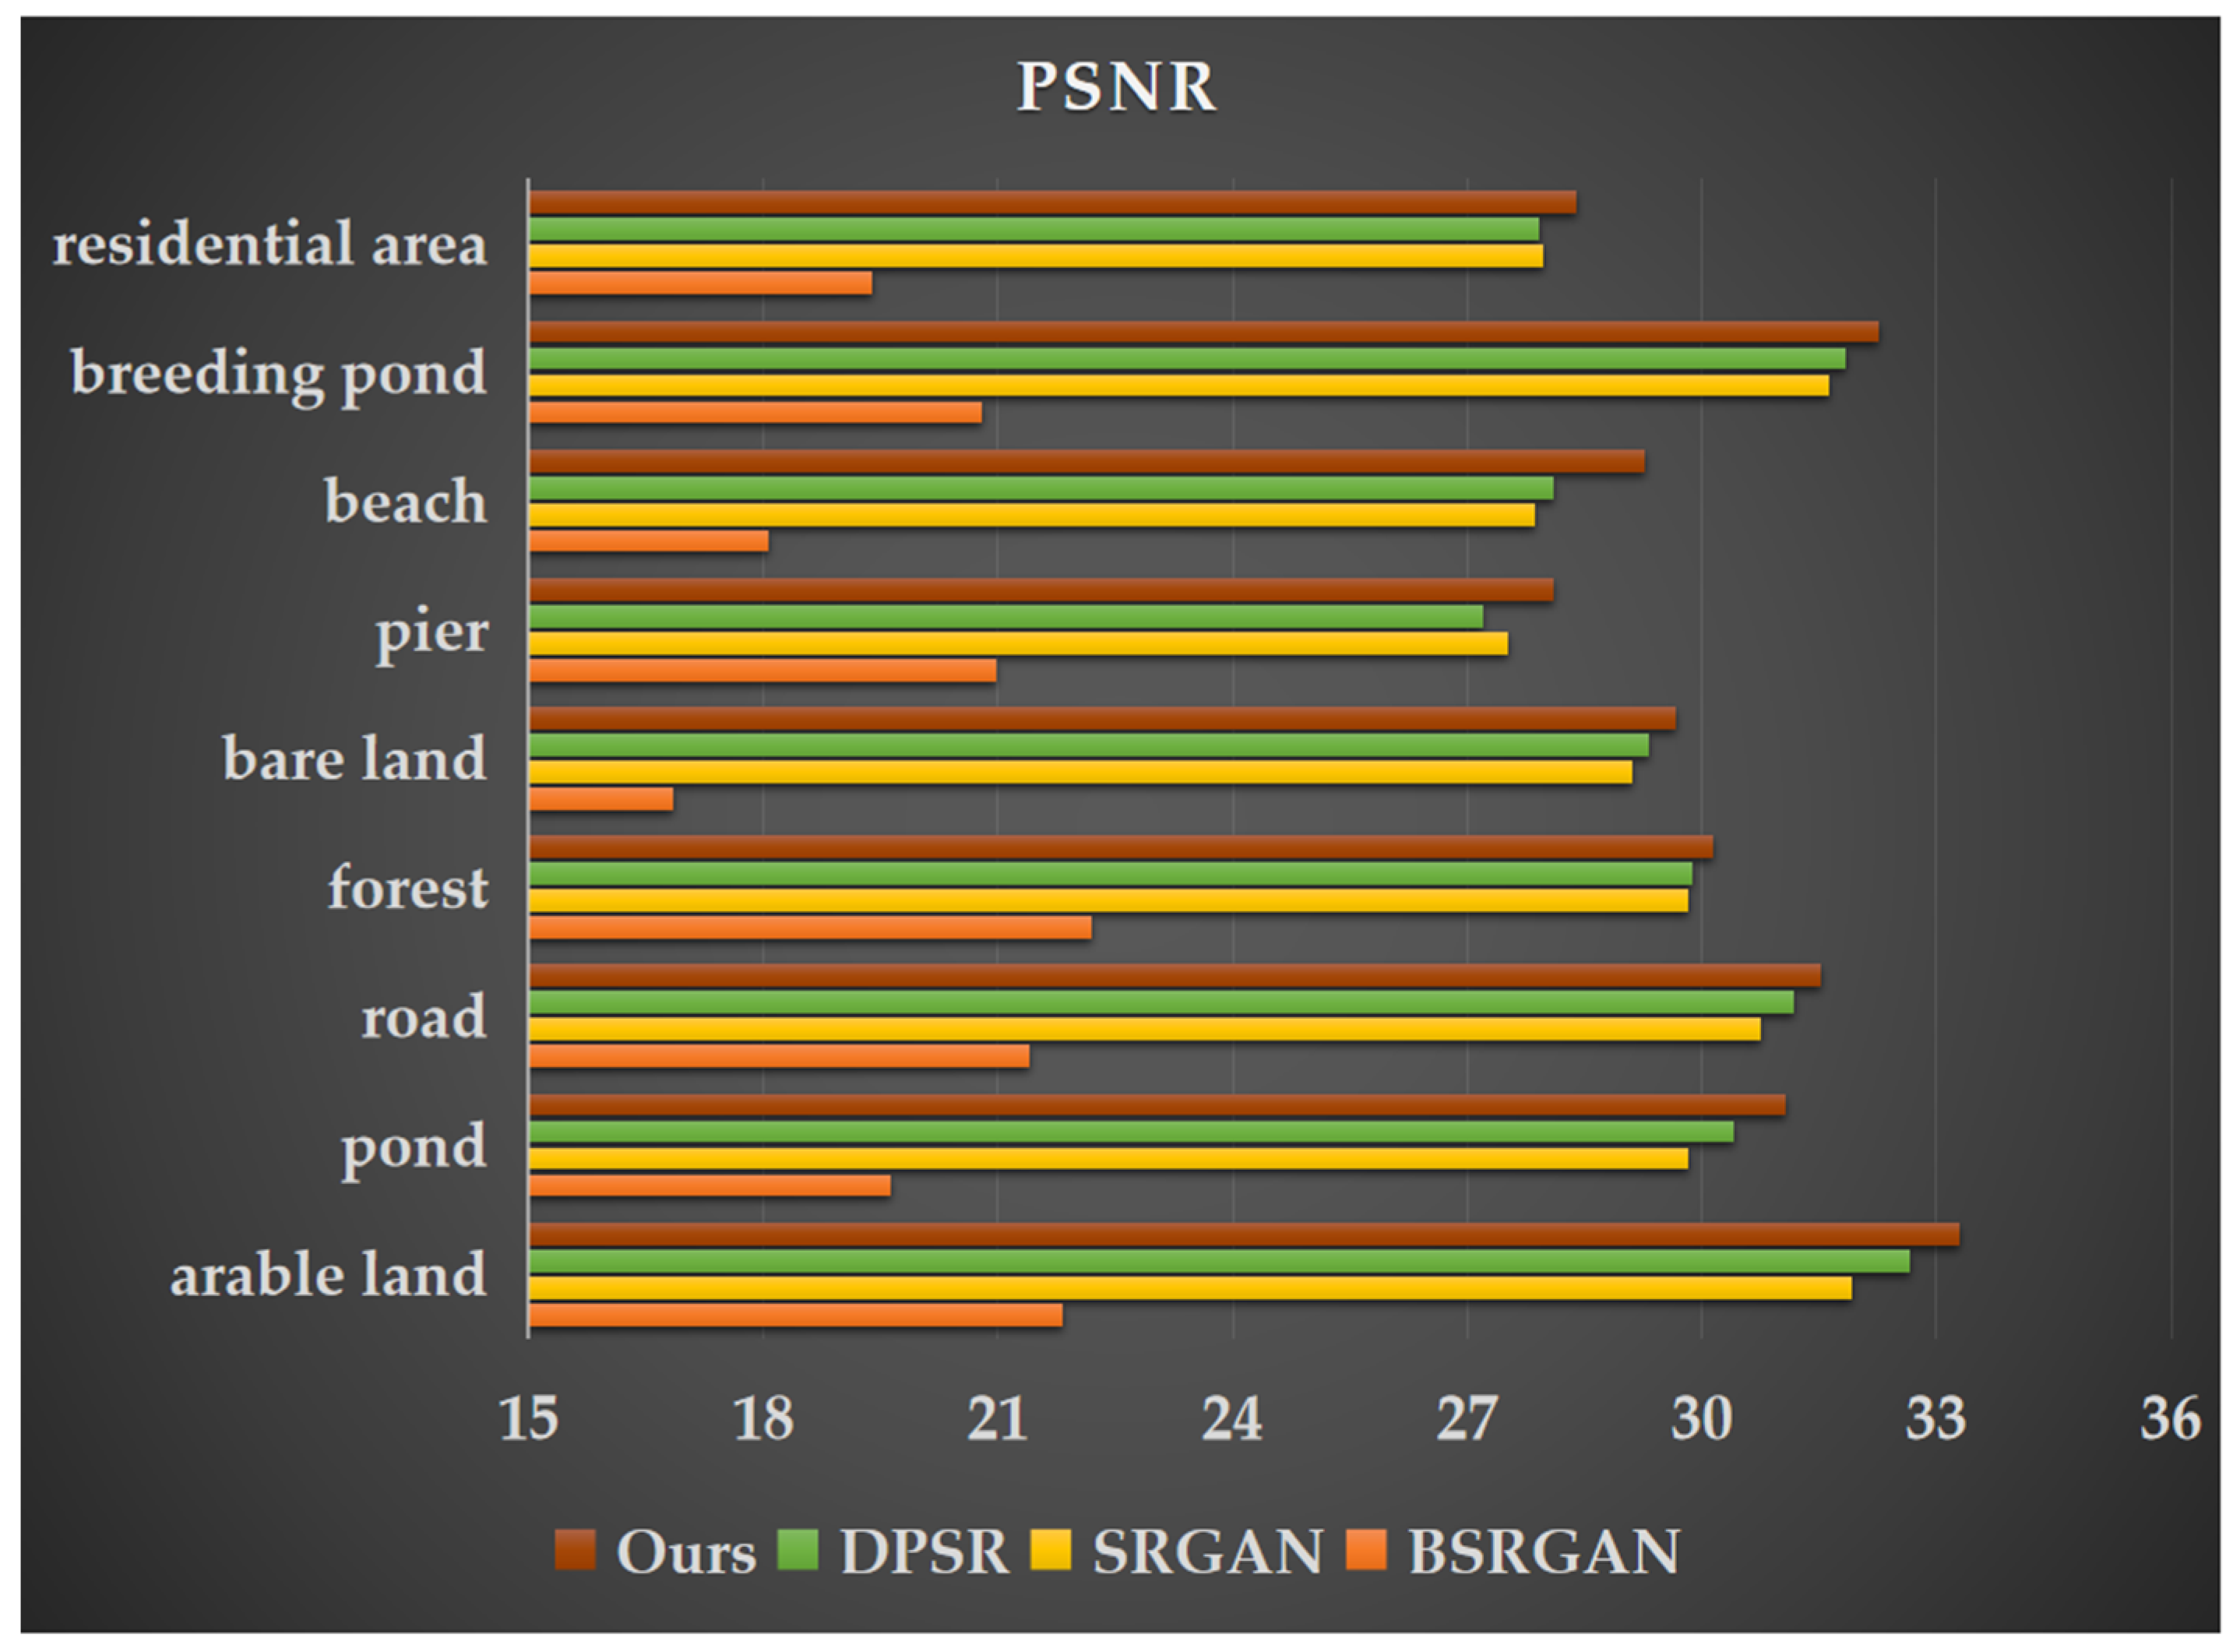
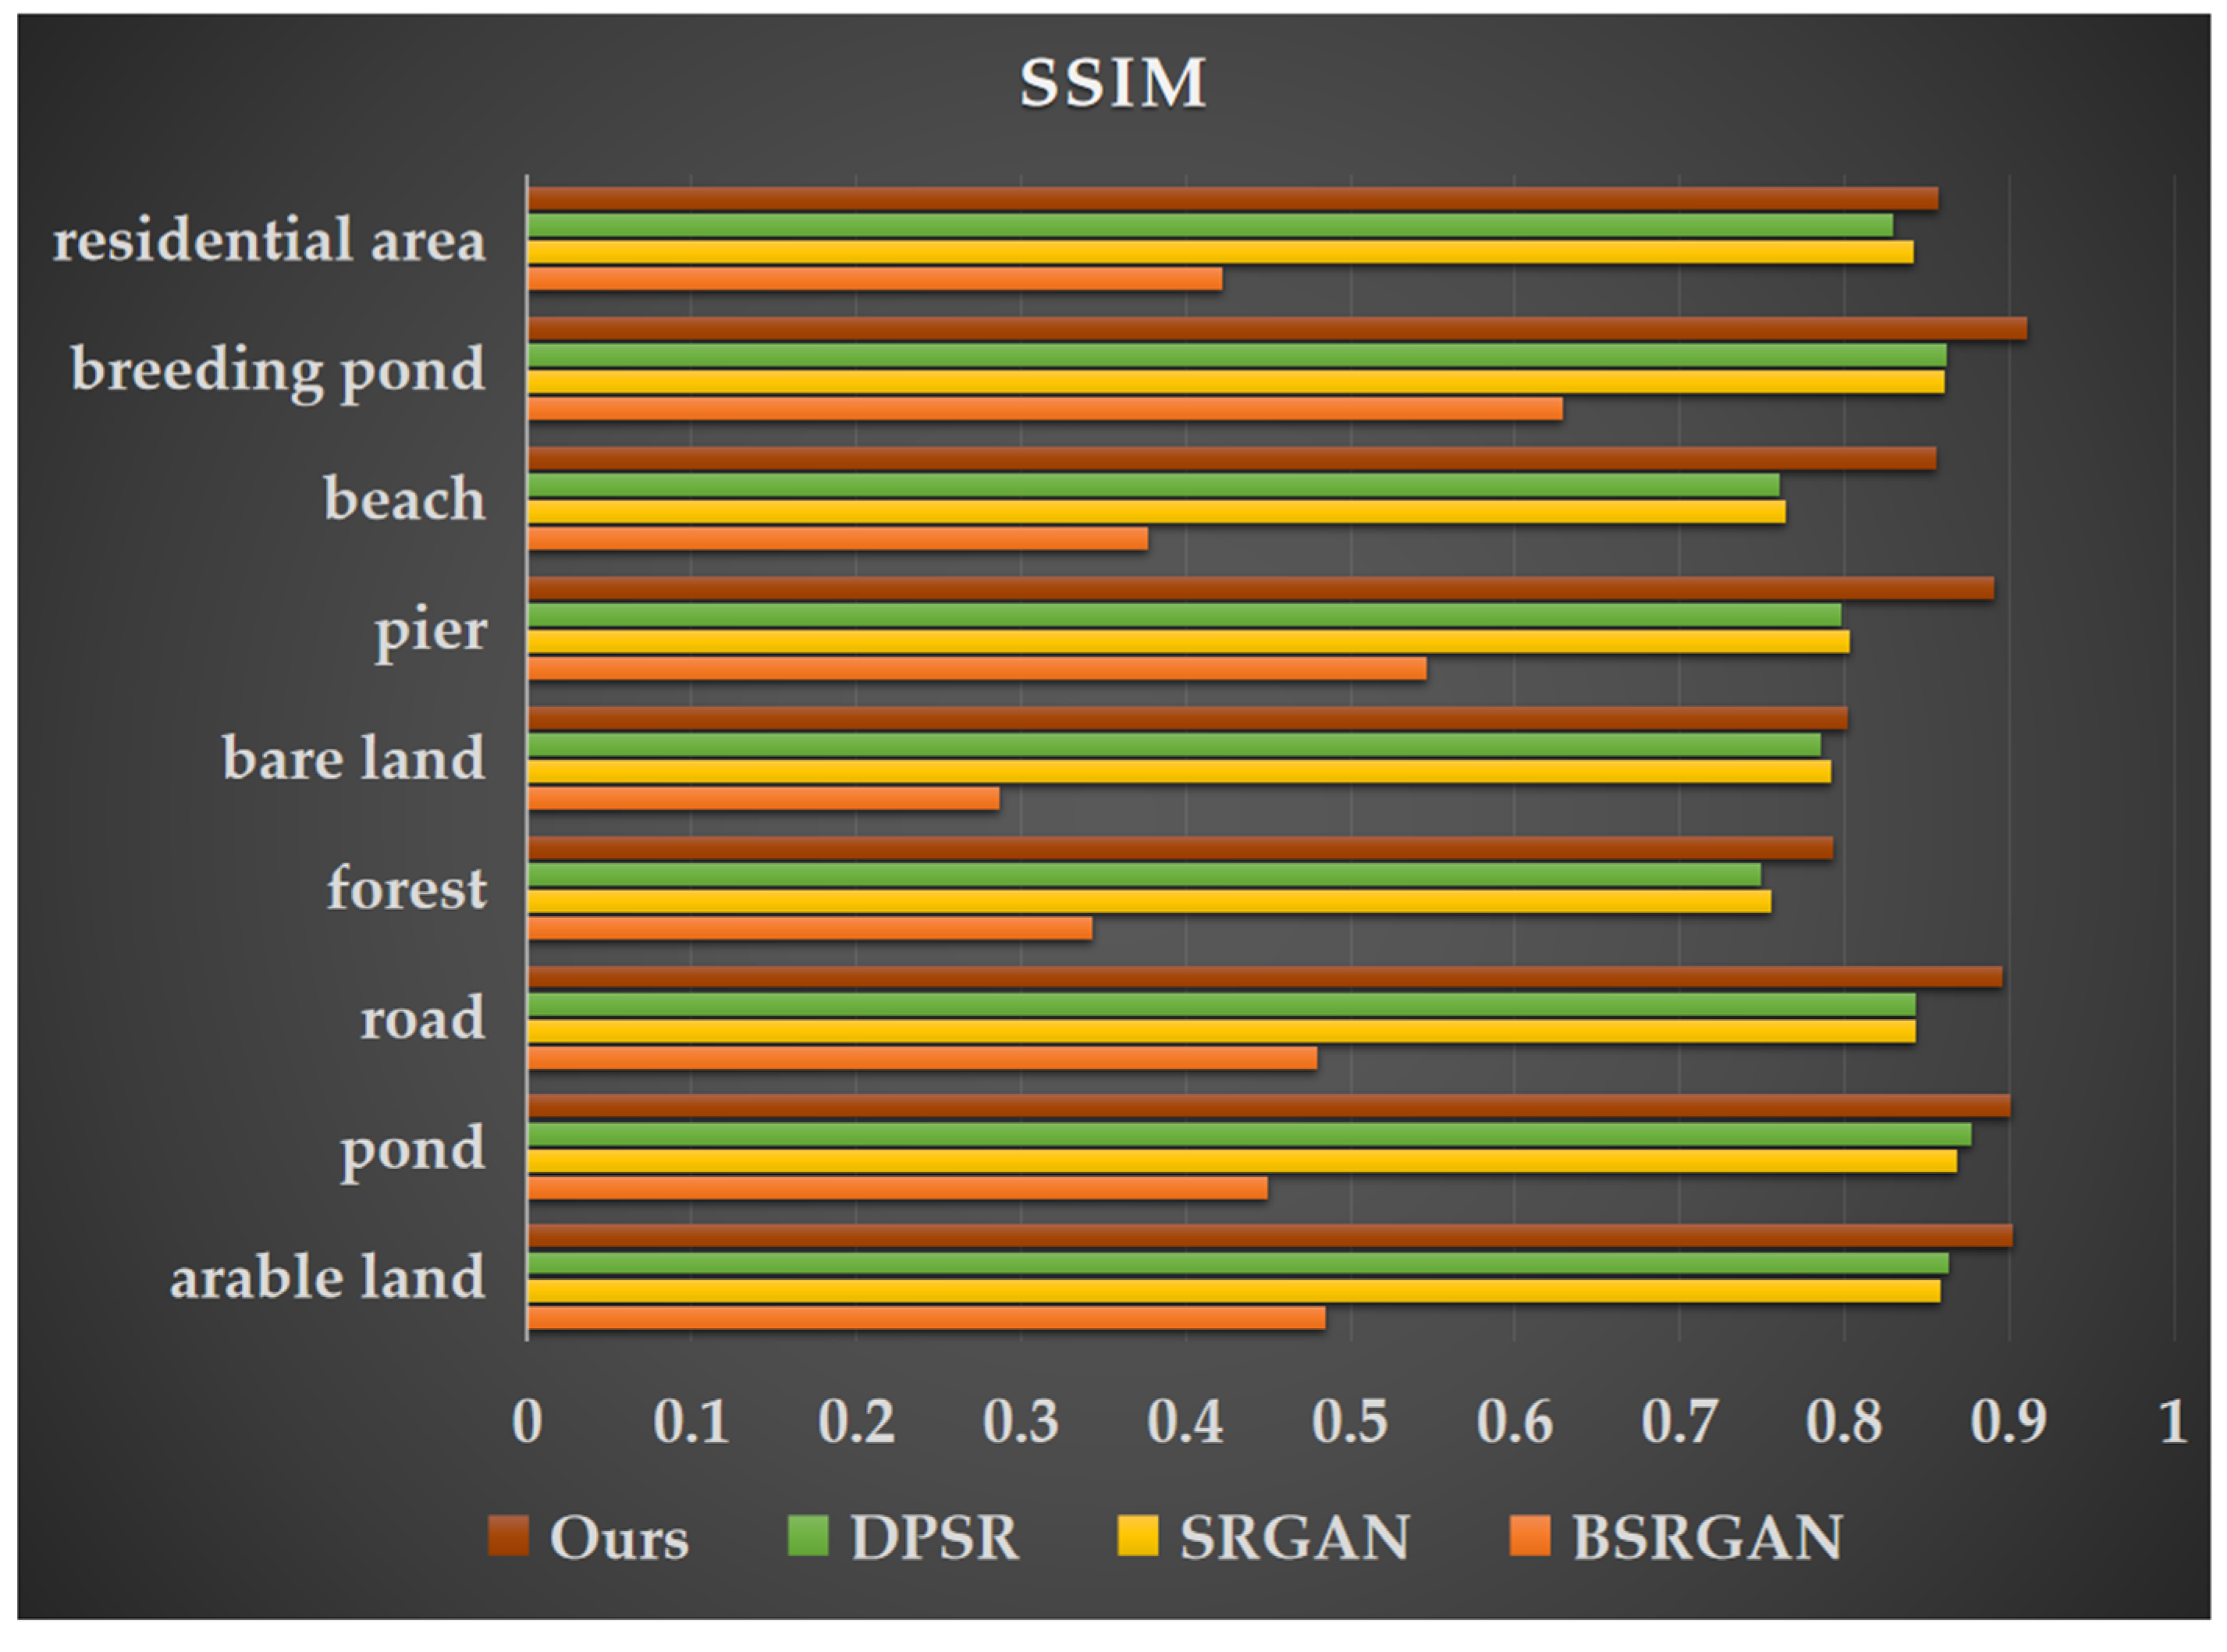
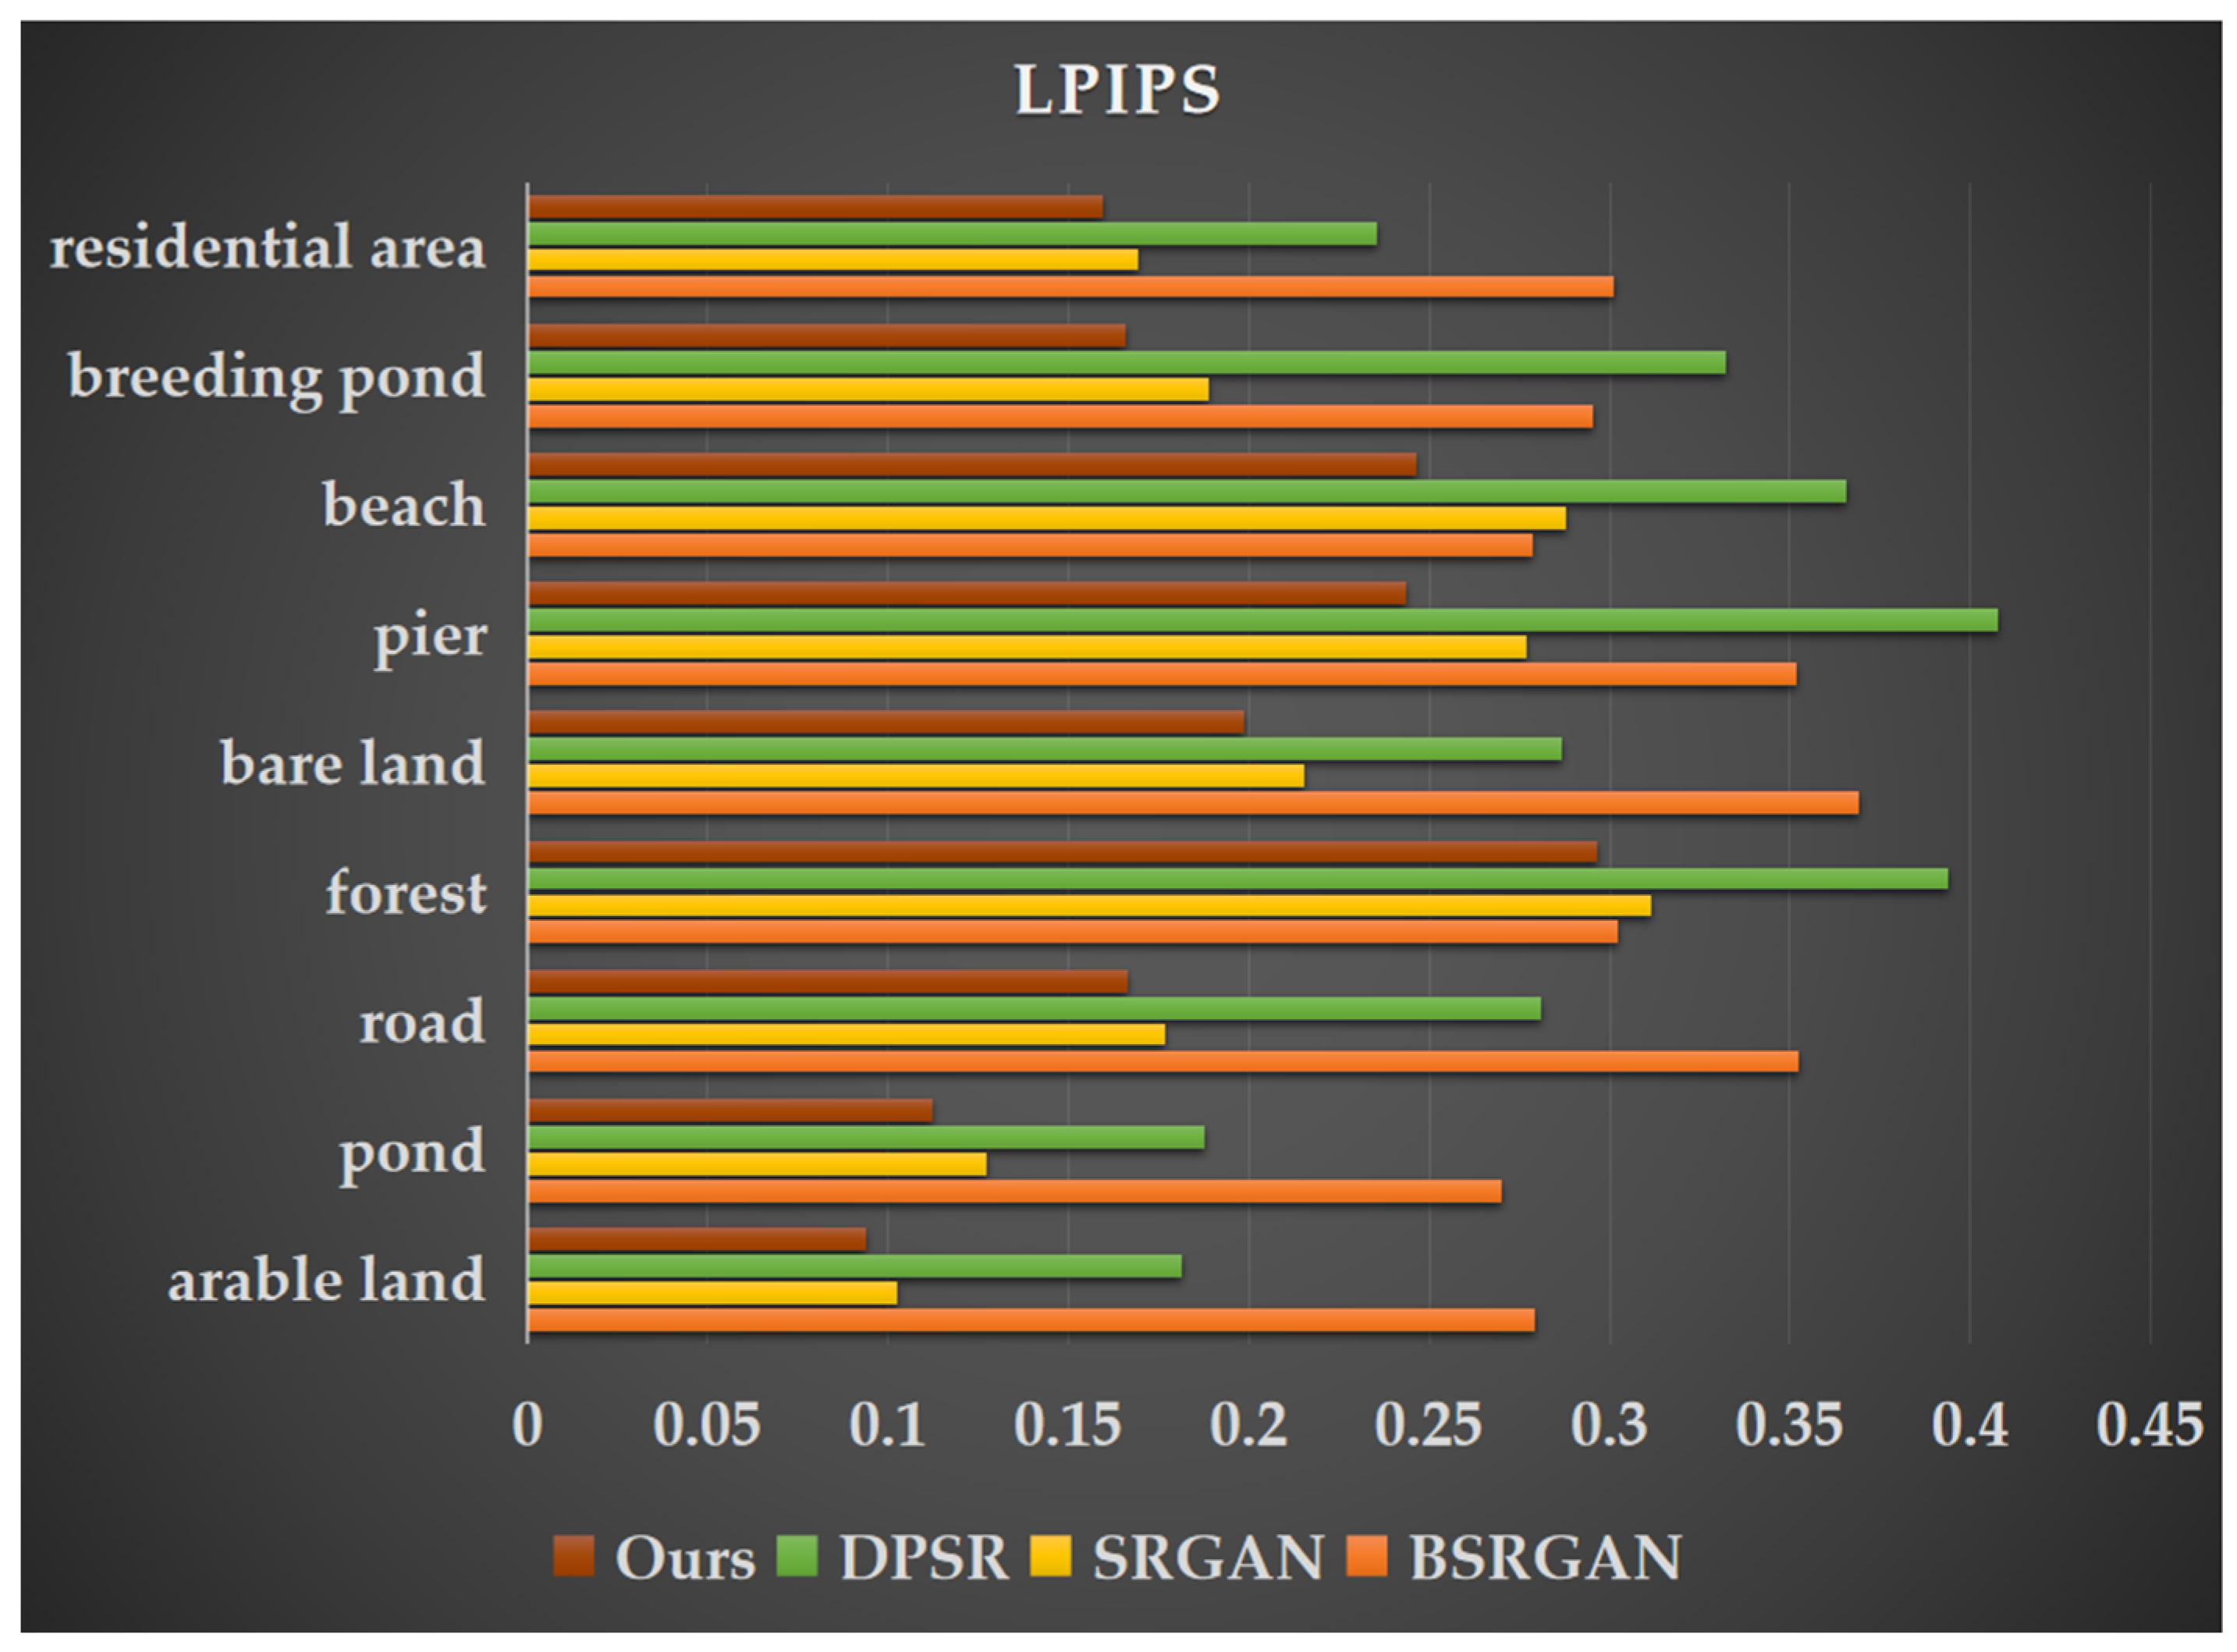
The selected remote sensing images cover a coastal land–sea transition zone with diverse land cover types, including unique landscape features such as beaches, aquaculture ponds, and docks as well as common land cover types like forests, roads, farmland, bare land, residential areas, and ponds. To evaluate the effectiveness of our approach, we conducted comparative experiments by inputting images containing these land cover types into DPSR [13], BSRGAN [12], SRGAN [38], and the improved MRSRGAN model. Table 4 presents the performance evaluation results for nine land cover types: farmland, ponds, roads, forests, bare land, docks, beaches, marine aquaculture ponds, and residential buildings. The experimental results show that MRSRGAN achieved varying degrees of performance improvement across all land cover types. Among them, the enhancement effect for beaches was the most significant. Compared to the best-performing DPSR model, MRSRGAN improved PSNR by 4.18% (1.1731 dB), increased SSIM by 14.34% (0.0949), and reduced LPIPS by 32.56% (0.1191). Additionally, the resolution enhancement for three common coastal land cover types—docks, farmland, and marine aquaculture areas—also showed significant improvements. Compared with the current state-of-the-art methods, PSNR is improved by 2.11% (0.5801 dB), 1.90% (0.62 dB), and 1.32% (0.4202 dB), while SSIM is increased by 11.52% (0.0873), 4.53% (0.0391), and 5.64% (0.0486). Additionally, LPIPS is reduced by 12.16% (0.0337), 8.68% (0.0089), and 12.04% (0.0227). These results indicate that MRSRGAN effectively captures the unique features of coastal landforms (such as docks, aquaculture ponds, and beaches) and enhances texture details. Furthermore, compared to the baseline method SRGAN, MRSRGAN achieves a PSNR improvement ranging from 0.2578 dB to 1.4089 dB across nine types of land cover, demonstrating the significant advantages of our proposed improvements in generating super-resolution images.
Table 4.
PSNR/SSIM/LPIPS values of 8 land cover categories at a ×4 scale.
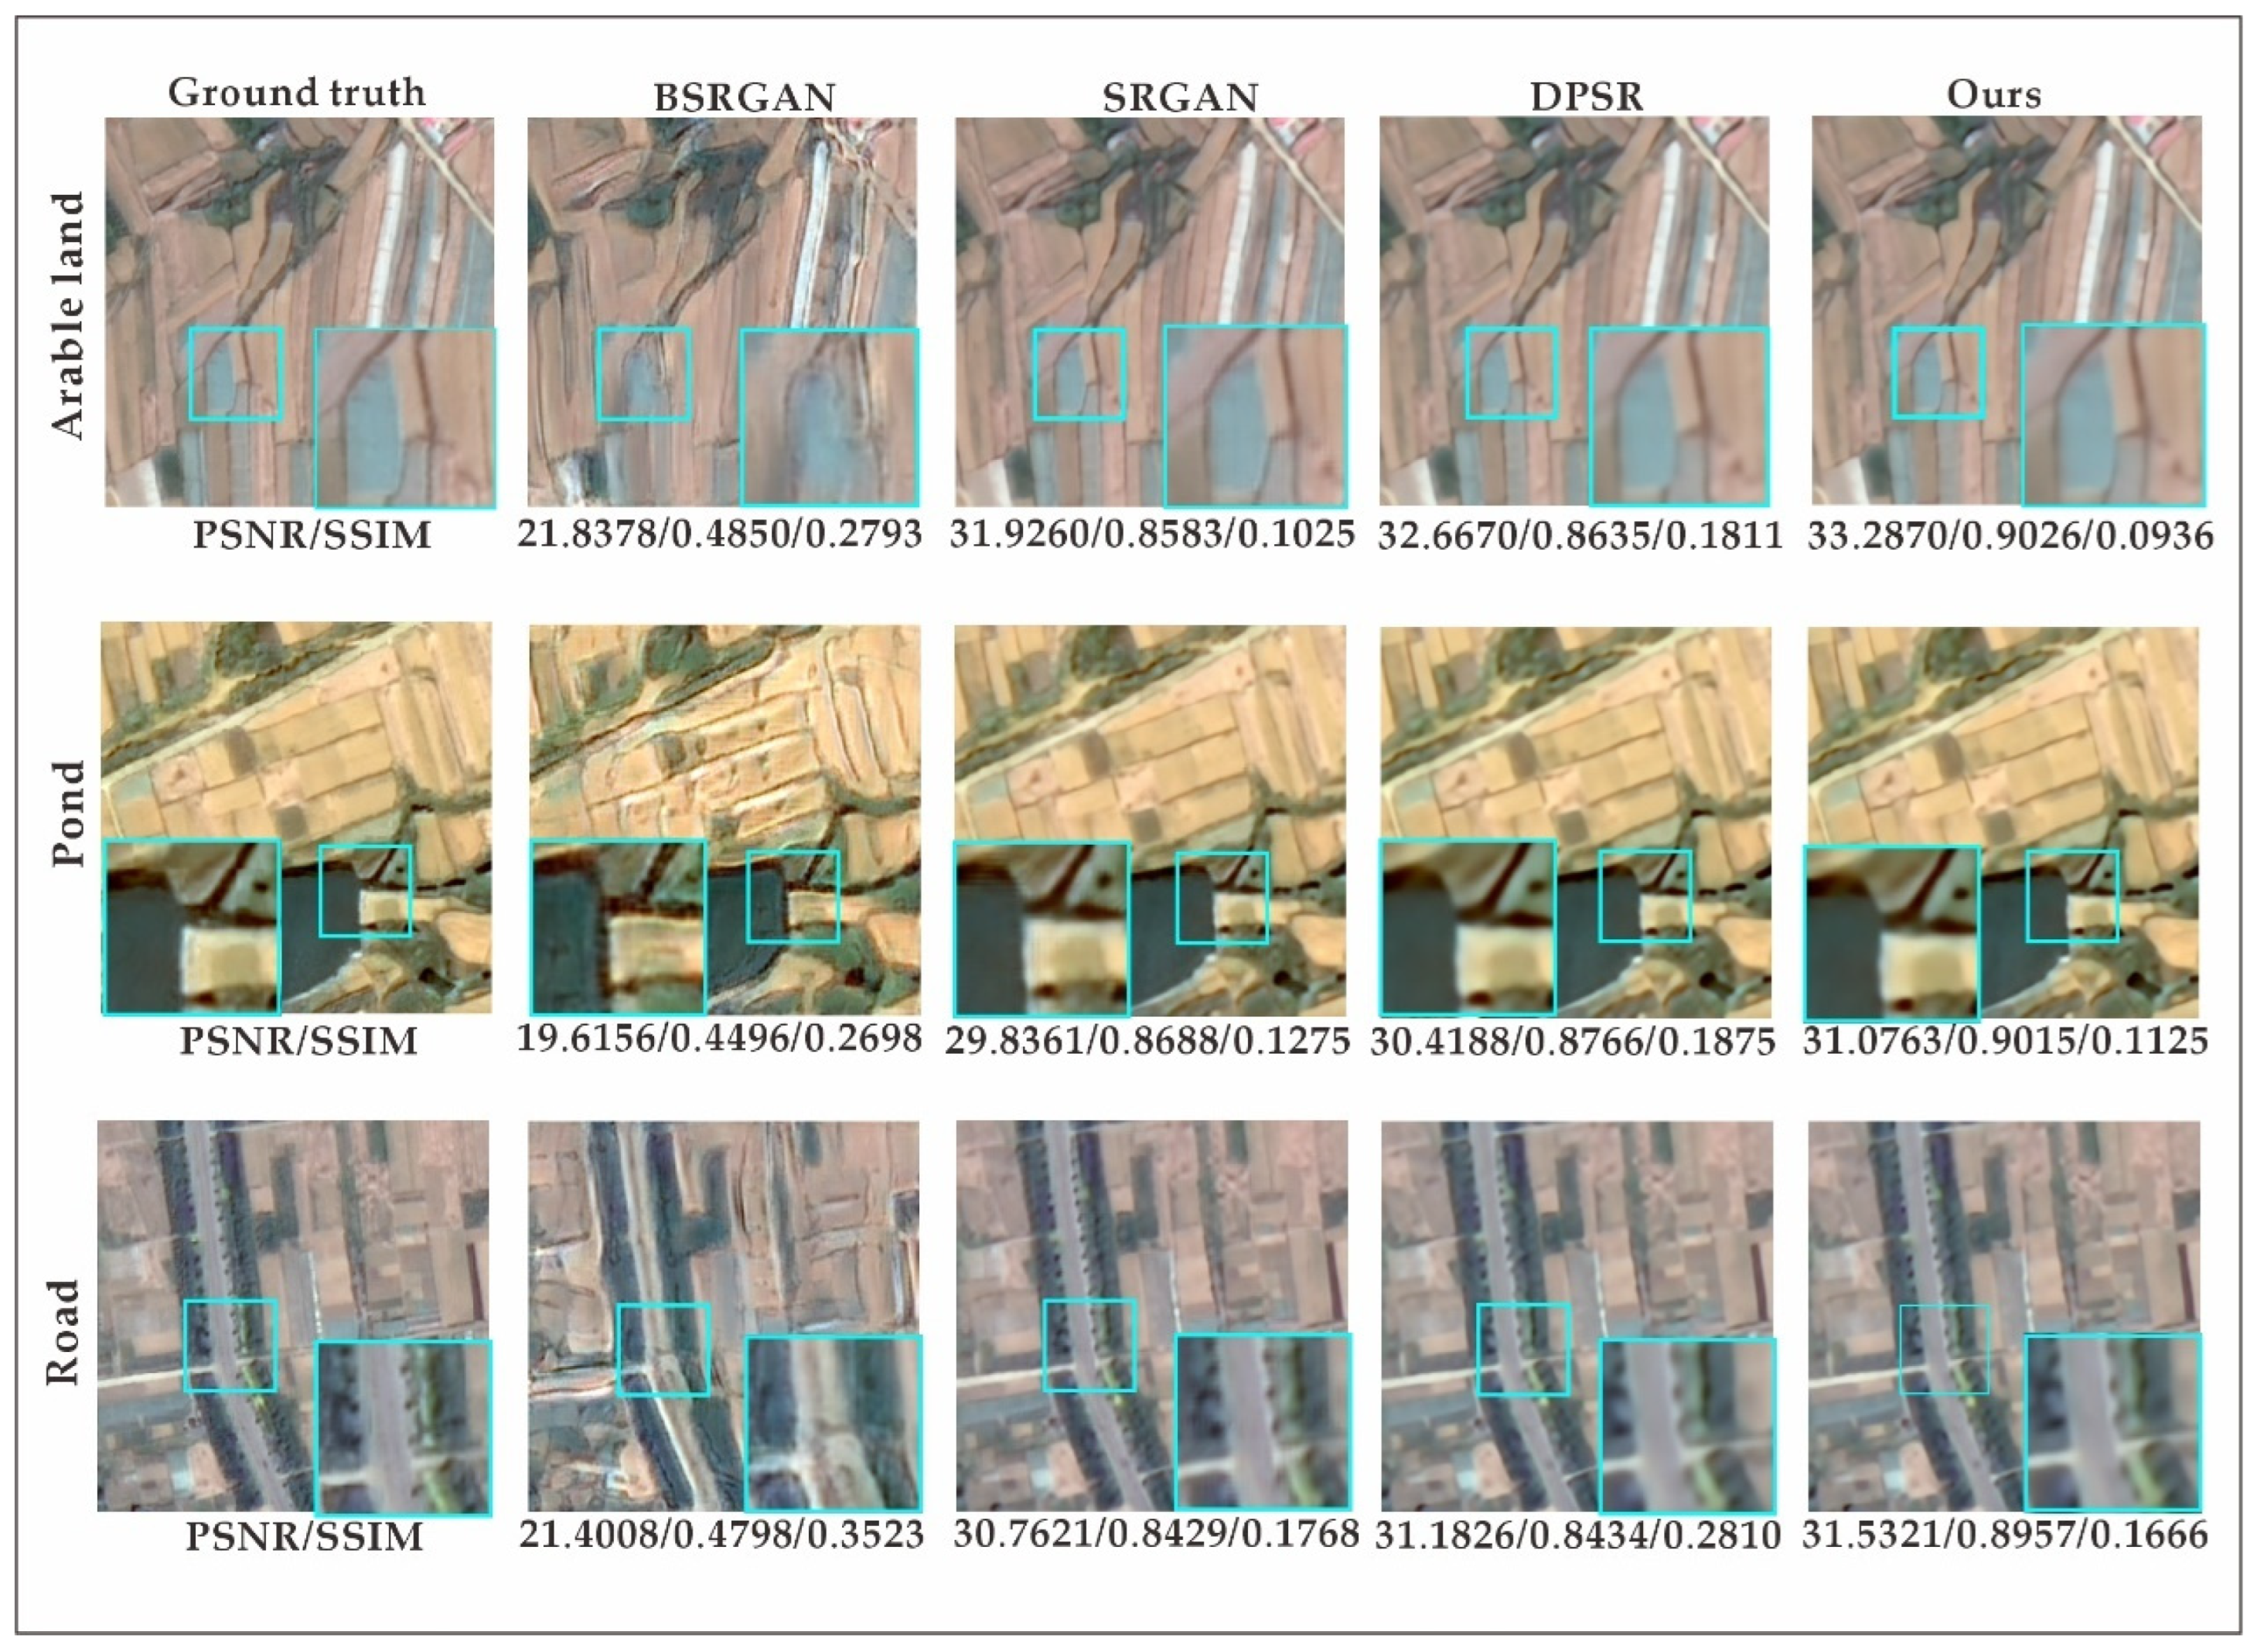
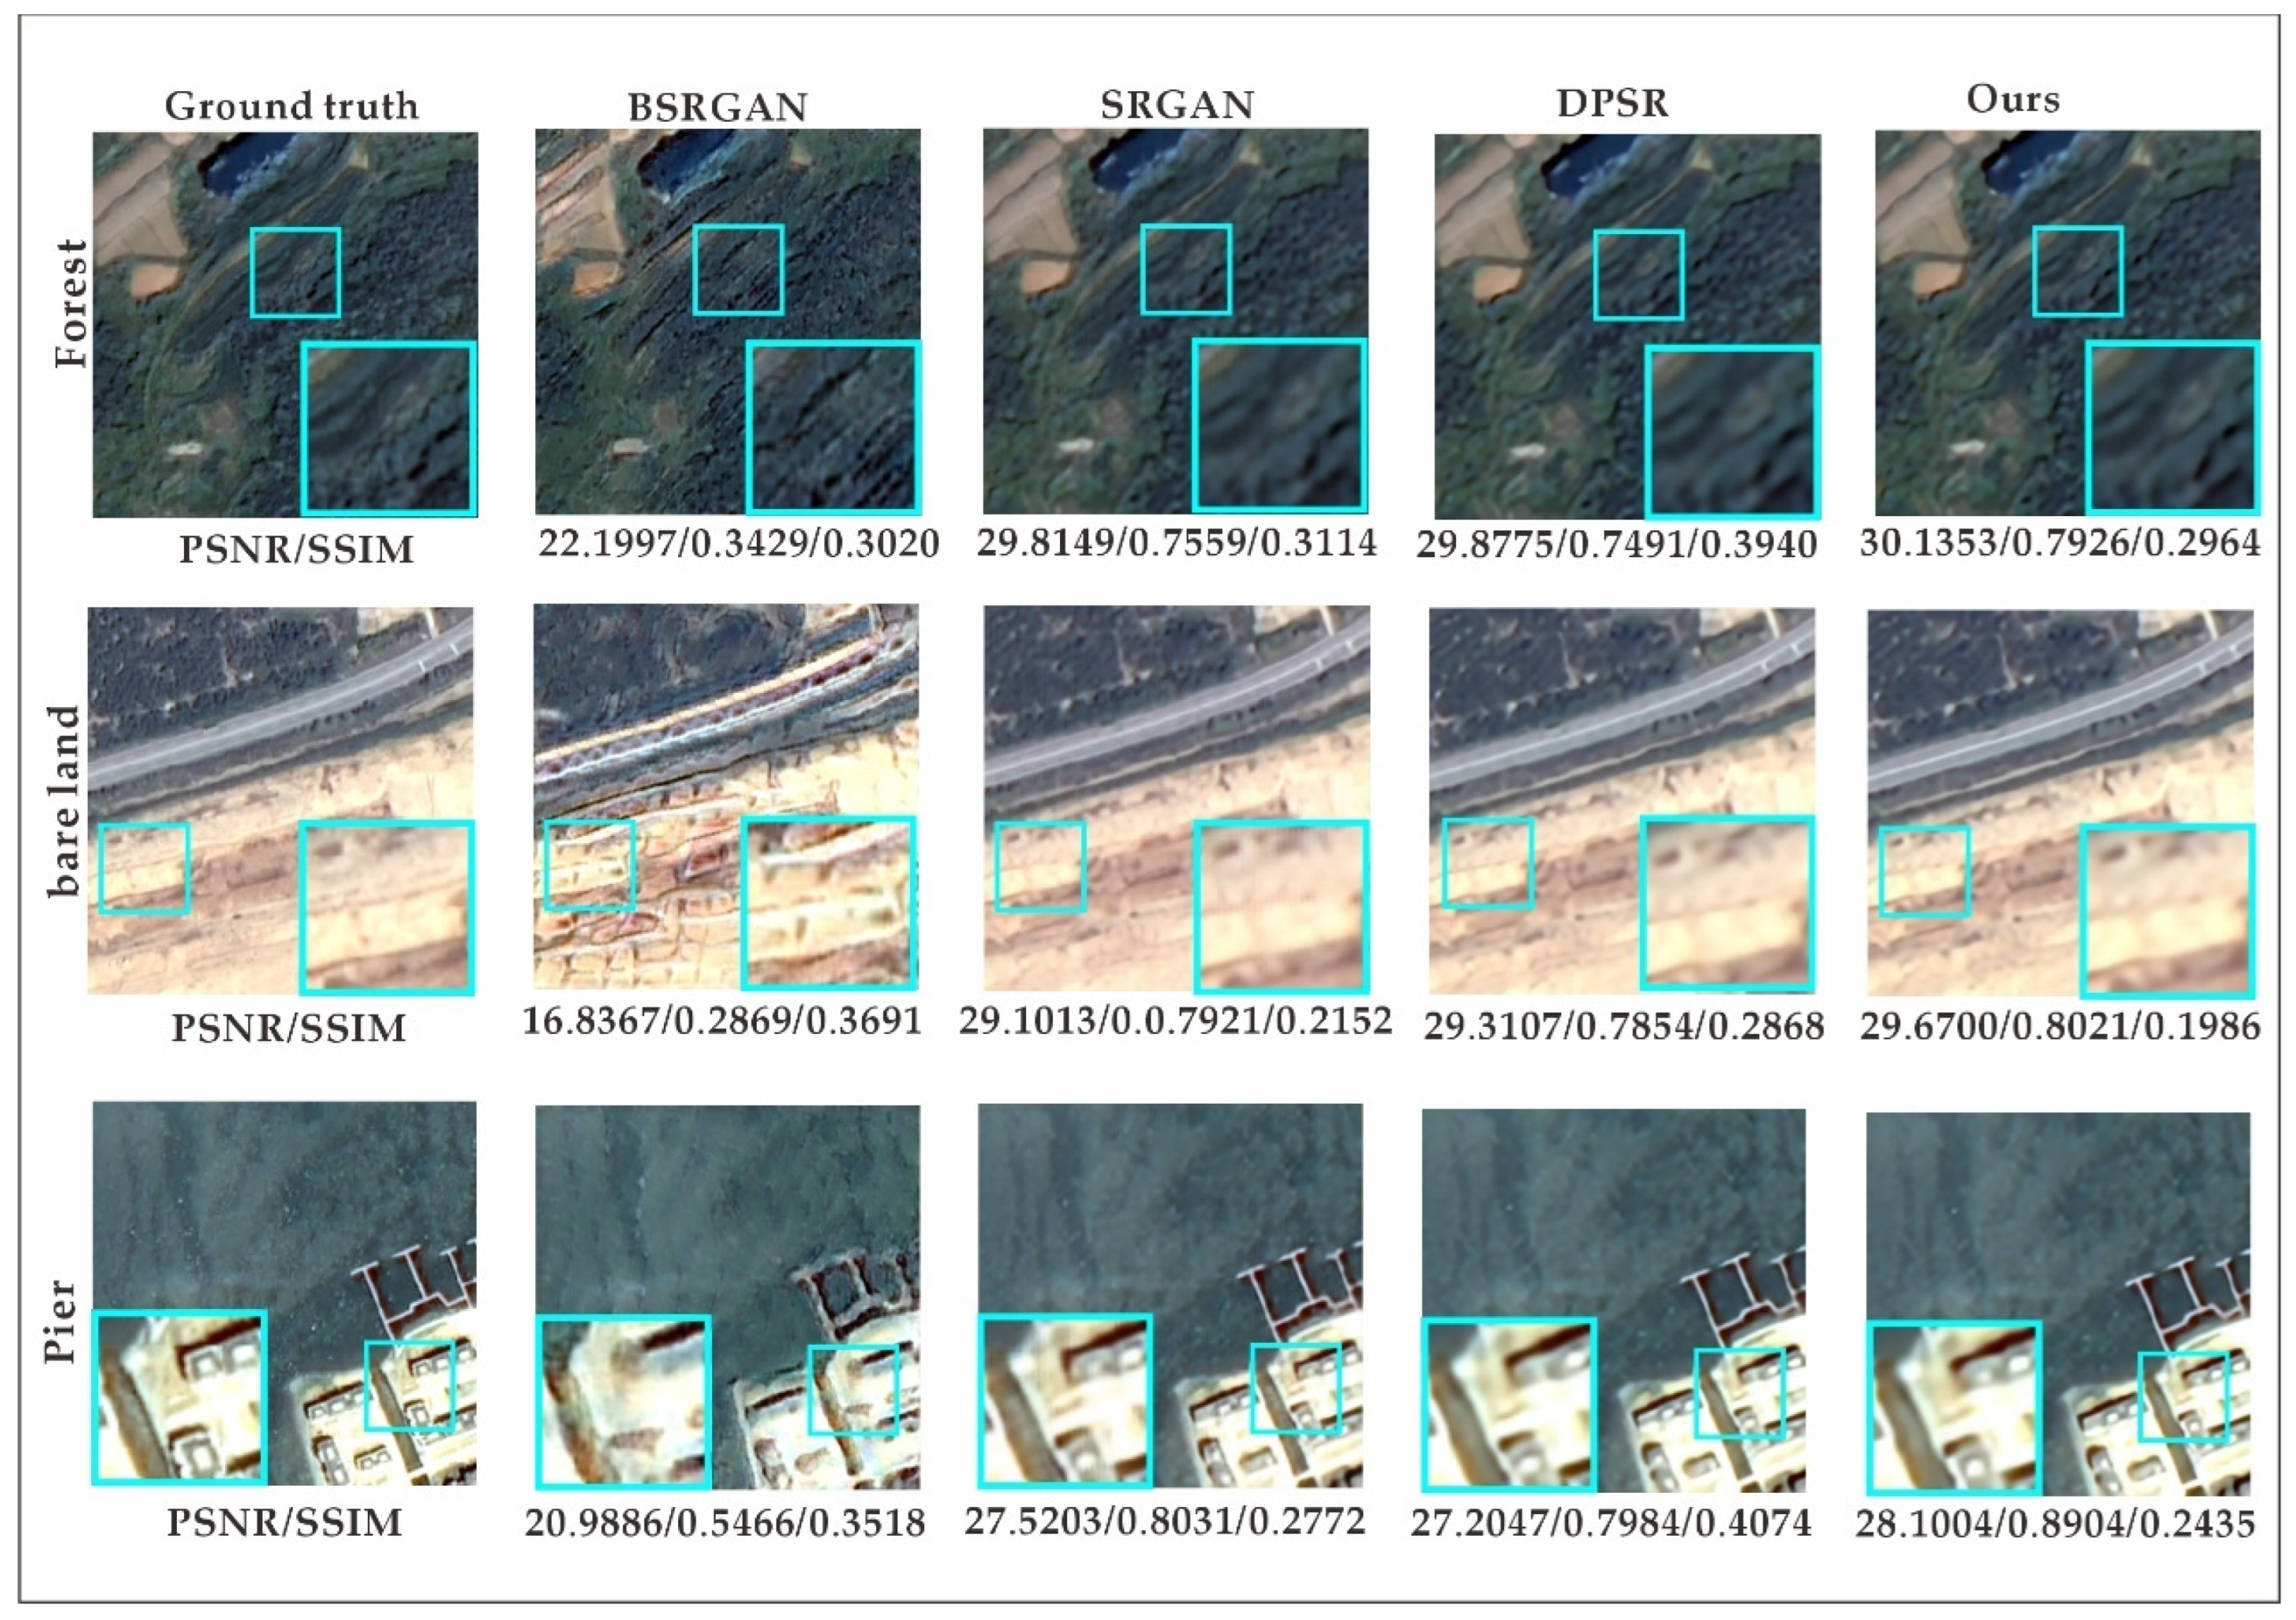
This paper lists images of nine types of land cover landscapes separately (Figure 8, Figure 9 and Figure 10) and compares their visual effects. Due to the influence of human activities, coastal zones not only include natural coastal landscapes such as beaches and bedrock but also artificial coastal landscapes like ports, docks, and aquaculture ponds. Unlike natural coastal landscapes, artificial landscapes contain more intricate texture details. As shown in Figure 11 and Figure 12, the docks and marine aquaculture ponds exhibit a greater variety of colors, with transitional variations and indistinct boundaries along with more diverse light and shadow changes. Their textures are interwoven, which poses challenges for super-resolution reconstruction. In contrast, natural land cover types such as farmland, ponds, and beaches have relatively uniform colors and distinct texture features, making them easier to distinguish and achieving better results in super-resolution tasks. The MRSRGAN method proposed in this paper incorporates a fusion attention mechanism-enhanced residual module and two multi-scale modules. As shown in Figure 8, Figure 9 and Figure 10, our MRSRGAN method achieves promising results. Additionally, Figure 11, Figure 12 and Figure 13 demonstrate an improvement in visual quality. In our experiments, BSRGAN did not achieve satisfactory visual results. The generated super-resolution images appeared blurry, with unclear boundaries and an oil painting effect. SRGAN performed better in restoring fine details, producing clear and smooth lines; however, artifacts were present in the overall color rendering. Compared to these two methods, DPSR achieved relatively better results in terms of PSNR and SSIM metrics (Figure 8, Figure 9 and Figure 10). Visually, its output images had bright and smooth colors, but the reconstruction of line details was less effective. Our improved MRSRGAN achieved the best overall visual performance, effectively enhancing image smoothness while preserving the clarity and continuity of fine details. For complex artificial landscapes such as docks and marine aquaculture ponds, the scene-adaptive approach significantly enhanced edge, texture, and other detailed features in the images, demonstrating the effectiveness of the scene-adaptive strategy.

Figure 8.
Peak Signal-to-Noise Ratio (PSNR) values of super-resolution images generated by four different methods for nine land cover types.

Figure 9.
Structural Similarity Index (SSIM) values of super-resolution images generated by four different methods for nine land cover types.

Figure 10.
Learned Perceptual Image Patch Similarity (LPIPS) values of super-resolution images generated by four different methods for nine land cover types.
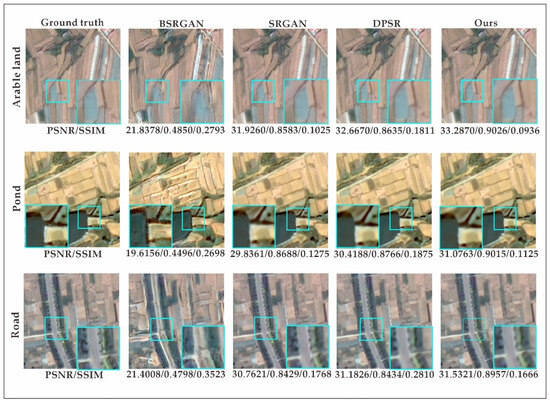
Figure 11.
Reconstruction results of cropland, pond, and road using four models.

Figure 12.
Reconstruction results of woodland, bare land, and dock using four models.
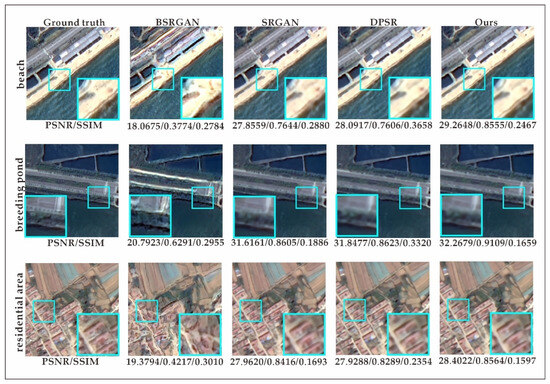
Figure 13.
Reconstruction results of beach, marine aquaculture area, and residential buildings using four models.
3.2.4. Analysis of Sentinel-2 Image Resolution Improvement Effect
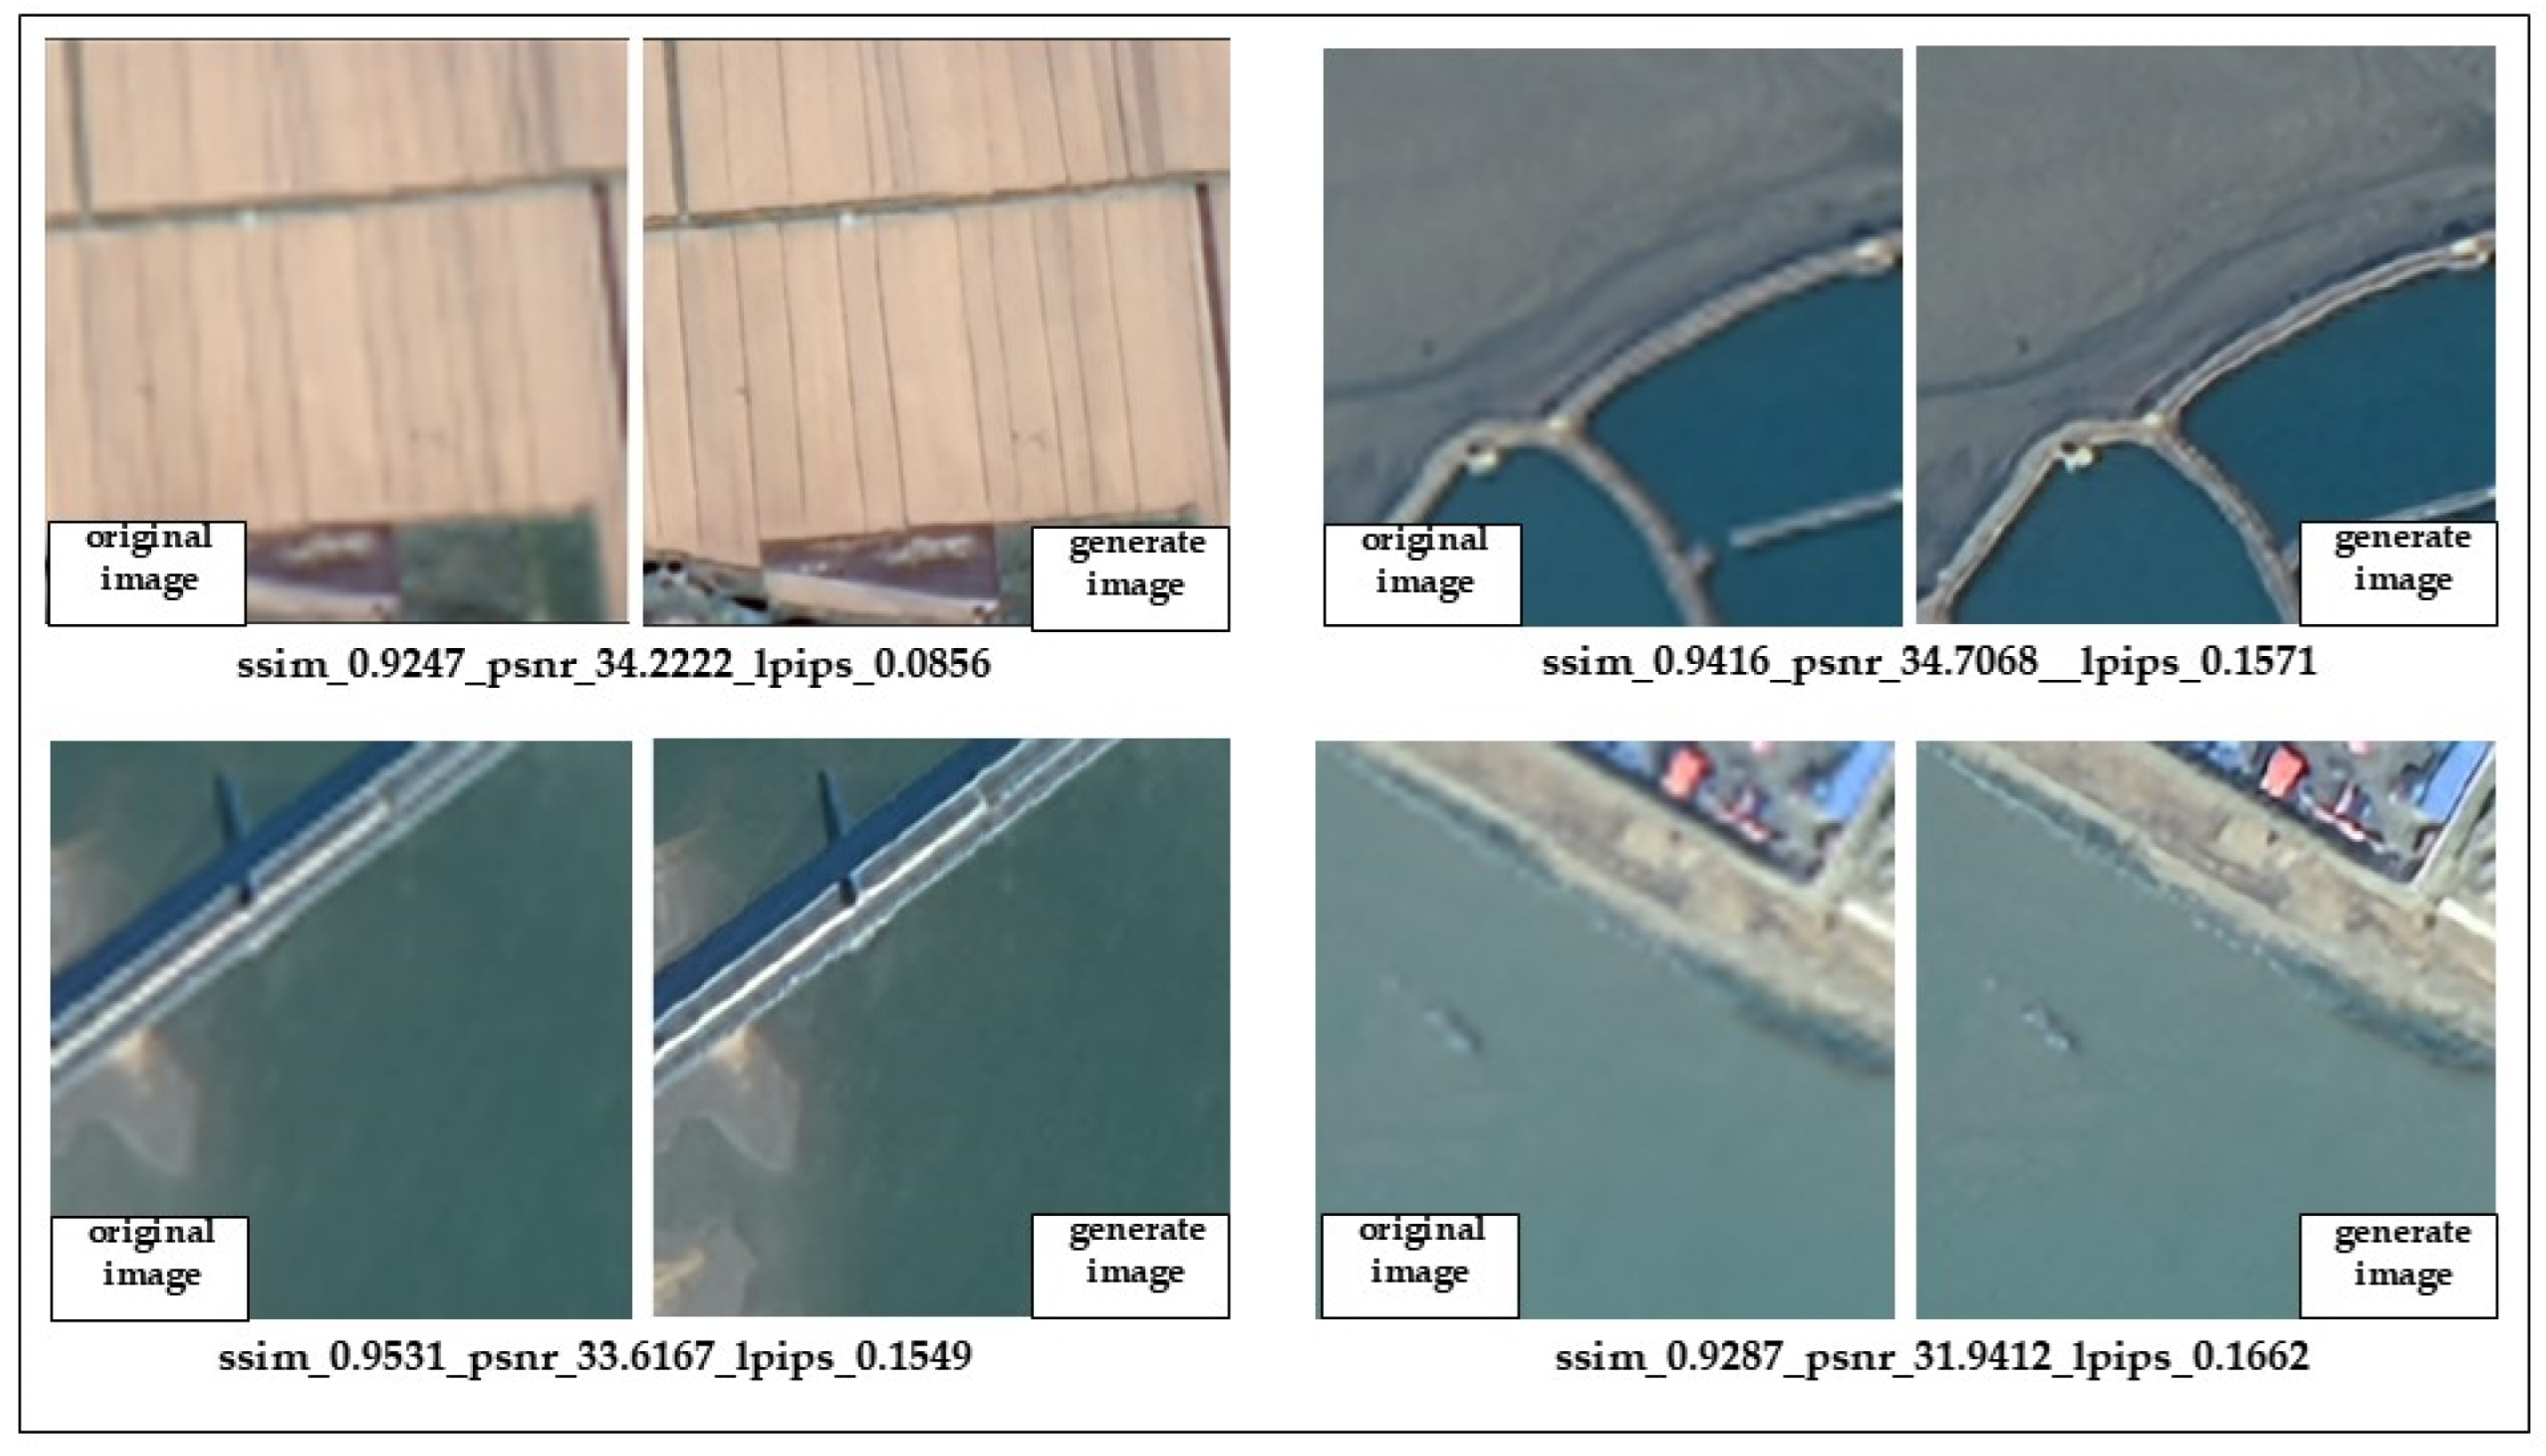
To verify the effectiveness of our method on Sentinel-2 data, we selected remote sensing imagery from the Weihai region as the validation dataset. The images were cropped into 256 × 256 pixel patches and fed into the best-performing MRSRGAN model for validation. As shown in Figure 14 and Figure 15, the left image represents the original low-resolution image, while the right image is the ×4 super-resolution image generated by the model. The computed results indicate that the generated images achieve a PSNR of up to 42.4195 dB, an SSIM of 0.9664, and an LPIPS of 0.1617, demonstrating that our model performs well in processing medium-resolution remote sensing imagery (Sentinel-2). Even across images from different sensors, the model is capable of generating high-resolution images with clear and smooth edges, vivid colors, and minimal artifacts.654
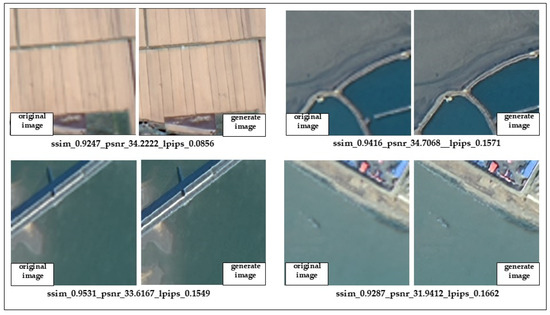
Figure 14.
Resolution enhancement results for Sentinel-2 farmland, marine aquaculture area, road, and buildings.
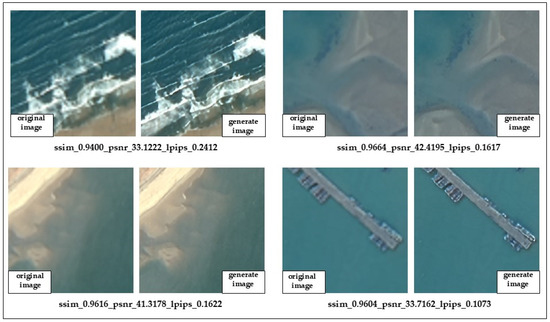
Figure 15.
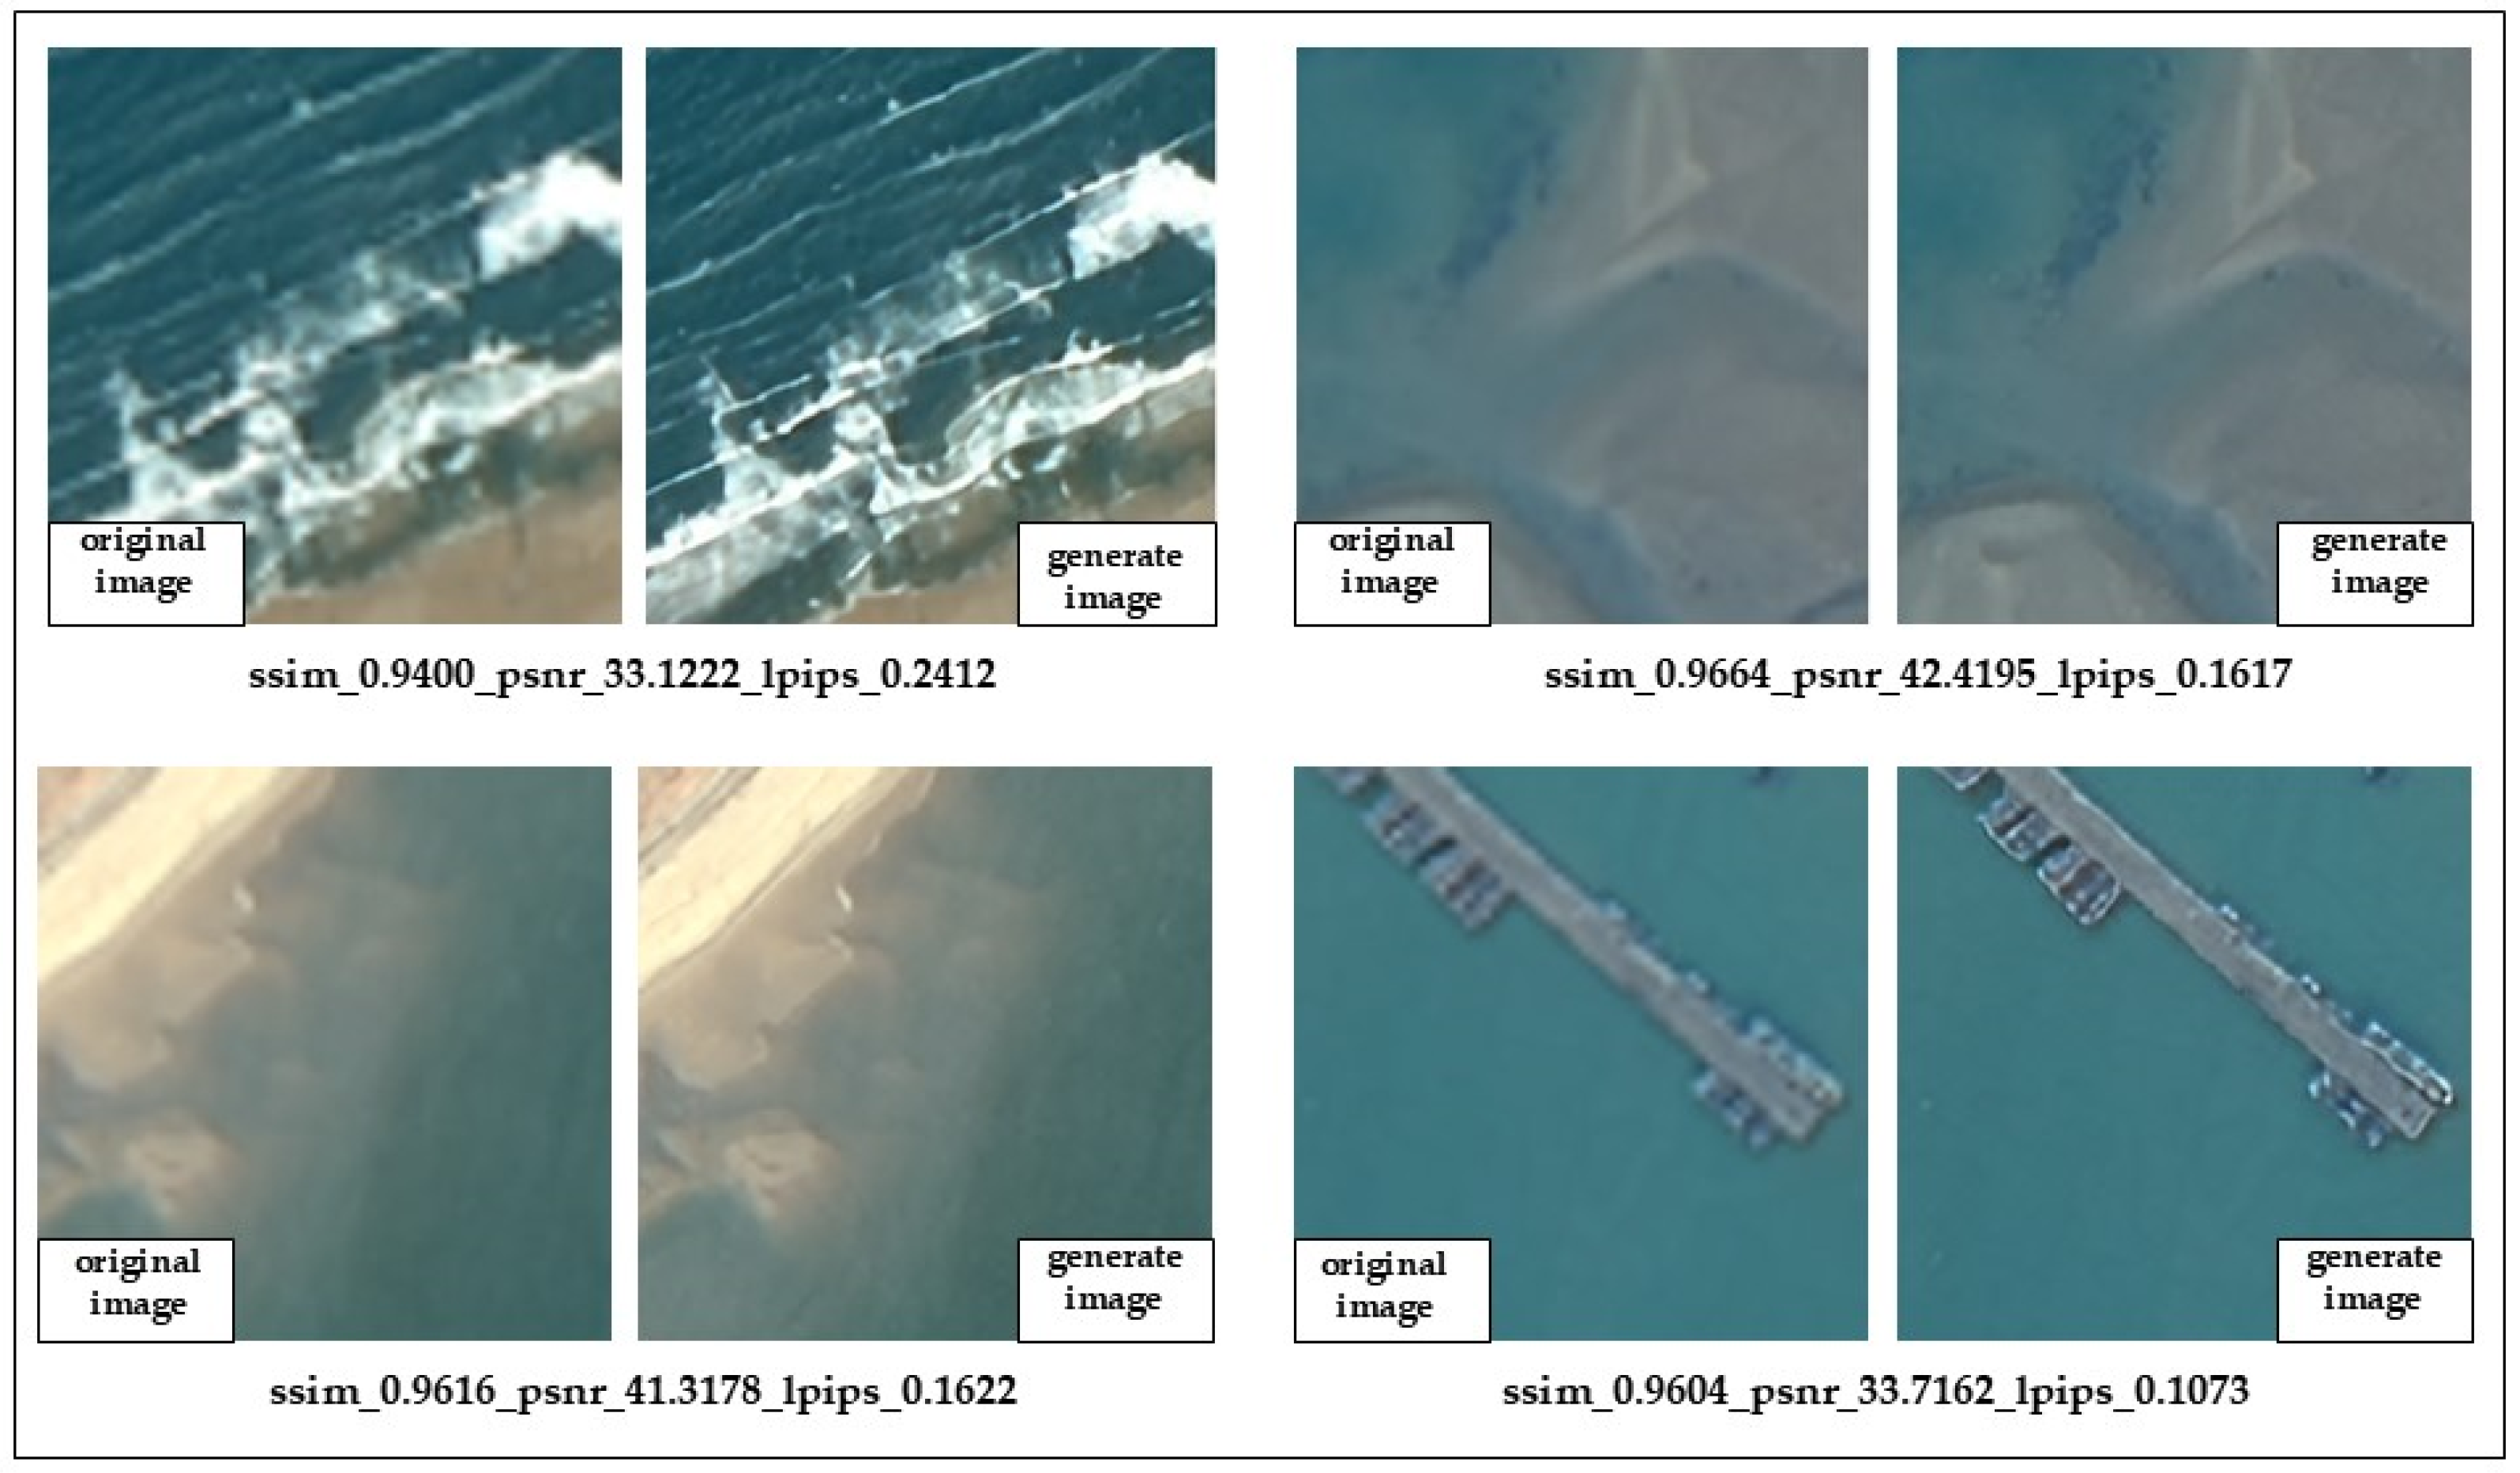
Resolution enhancement results for Sentinel-2 beach, waves, pier, and shoal.
To further validate the performance of our method across different land cover scenarios, we present typical landscapes in coastal transition zones along with the corresponding verification results. We selected various land cover types, including cropland, tidal flats, offshore aquaculture ponds, docks, and beaches. As shown in Table 4, the sharpness restoration was most effective for tidal flats and beaches, with PSNR values of 42.4195 dB and 41.3178 dB, respectively. The corresponding SSIM values were 0.9609, 0.9330, and 0.9419, while the LPIPS values were 0.1617 and 0.1622. According to the study by Alain Horé et al. [36], when PSNR values exceed 30 and SSIM values are above 0.9, the generated images are of high quality. This indicates that our method effectively enhances the clarity of fine texture details while preserving the original structure and brightness when processing images of coastal transition zones.
4. Conclusions
- (1)
- This paper presents a novel method, MRSRGAN, specifically designed to enhance the super-resolution performance of remote sensing images. The method incorporates a fusion attention mechanism enhanced residual module in the generator, and additionally, it utilizes a multi-scale attention fusion module (MSAF) and a multi-scale feature extraction module (MSFE). These components enable more accurate capture of multi-level features in remote sensing images, effectively improving feature representation, particularly with significant improvements in land cover texture details. Experimental results show that the MRSRGAN method outperforms three traditional methods, DPSR, SRGAN, and BSRGAN, in terms of performance.
- (2)
- The MRSRGAN method demonstrates significant advantages in super-resolution tasks for the typical nine types of land cover landscapes selected in this study, including natural and artificial features such as docks, marine aquaculture ponds, and beaches in the coastal zone. Specifically, compared to existing methods, MRSRGAN achieves improvements in the PSNR metric ranging from 0.2578 to 1.4089 dB, a maximum reduction of 14.34% in the Learned Perceptual Image Patch Similarity (LPIPS), and a maximum increase of 11.85% in structural similarity (SSIM). Notably, typical features such as beaches, docks, and marine aquaculture ponds show especially good performance in resolution enhancement, significantly improving the image detail representation.
- (3)
- The results show that our MRSRGAN method can effectively improve the resolution of Sentinel-2 images and exhibit strong cross-sensor adaptability. This result shows that our method not only has a good resolution improvement effect under a single data source but also can achieve significant resolution improvement when applied to remote sensing images of different sensors, so it has good practical value and promotion potential. In summary, the method proposed in this paper has achieved ideal results in improving the quality of remote sensing images, multi-level feature expression, and detail capture; verifying the effectiveness of the model in super-resolution improvement tasks; and providing technical support for the wider application of remote sensing images. However, there are still several areas in this study that require further exploration. In terms of model performance optimization, it is necessary to systematically evaluate its sensitivity to changes in dataset distribution to enhance stability in practical applications. At the system integration level, the focus should be on studying the deep integration scheme of this method with real-time coastal monitoring systems, exploring its applicability in dynamic monitoring scenarios.
Author Contributions
D.L.: Writing—original draft, Methodology, Investigation, Data curation. X.L.: Writing—review and editing, Supervision, Funding acquisition, Conceptualization. Z.Z.: Writing—review and editing. X.Q.: Data curation, Investigation. J.C.: Data curation. All authors have read and agreed to the published version of the manuscript.
Funding
This study is supported by the National Key Research and Development Program of China (2022YFC3003803), Zhejiang Provincial Project (330000210130313013006).
Data Availability Statement
The data presented in this study are available on request from the corresponding author due to the fact that the research project is not yet completed.
Conflicts of Interest
The authors declare that they have no known competing financial interests or personal relationships that could have appeared to influence the work reported in this paper.
References
- Tsai, Y.-L.S. Nation-scale multidecadal shoreline extraction and coastal spatio-temporal change monitoring using cross-mission remote sensing data. Ocean Coast. Manag. 2024, 253, 107136. [Google Scholar] [CrossRef]
- Zhang, R.; Zhang, H.; Ning, X.; Huang, X.; Wang, J.; Cui, W. Global-aware siamese network for change detection on remote sensing images. ISPRS J. Photogramm. Remote Sens. 2023, 199, 61–72. [Google Scholar] [CrossRef]
- Feng, H.; Li, Q.; Wang, W.; Bashir, A.K.; Singh, A.K.; Xu, J.; Fang, K. Security of target recognition for UAV forestry remote sensing based on multi-source data fusion transformer framework. Inf. Fusion 2024, 112, 102555. [Google Scholar] [CrossRef]
- Darem, A.A.; Alhashmi, A.A.; Almadani, A.M.; Alanazi, A.K.; Sutantra, G.A. Development of a map for land use and land cover classification of the Northern Border Region using remote sensing and GIS. Egypt. J. Remote Sens. Space Sci. 2023, 26, 341–350. [Google Scholar] [CrossRef]
- Angnuureng, D.B.; Brempong, K.E.; Jayson-Quashigah, P.N.; Dada, O.A.; Akuoko, S.G.I.; Frimpomaa, J.; Mattah, P.A.; Almar, R. Satellite, Drone and Video Camera Multi-Platform Monitoring of Coastal Erosion at an Engineered Pocket Beach: A Showcase for Coastal Management at Elmina Bay, Ghana (West Africa). Reg. Stud. Mar. Sci. 2022, 53, 102437. [Google Scholar] [CrossRef]
- Da Silveira, C.B.L.; Strenzel, G.M.R.; Maida, M.; Gaspar, A.L.B.; Ferreira, B.P. Coral Reef Mapping with Remote Sensing and Machine Learning: A Nurture and Nature Analysis in Marine Protected Areas. Remote Sens. 2021, 13, 2907. [Google Scholar] [CrossRef]
- Adjovu, G.E.; Stephen, H.; James, D.; Ahmad, S. Overview of the Application of Remote Sensing in Effective Monitoring of Water Quality Parameters. Remote Sens. 2023, 15, 1938. [Google Scholar] [CrossRef]
- Dong, R.; Zhang, L.; Fu, H. RRSGAN: Reference-Based Super-Resolution for Remote Sensing Image. IEEE Trans. Geosci. Remote Sens. 2022, 60, 1–17. [Google Scholar] [CrossRef]
- Chen, H.; He, X.; Qing, L.; Wu, Y.; Ren, C.; Zhu, C. Real-World Single Image Super-Resolution: A Brief Review. arXiv 2024, arXiv:2103.02368. Available online: http://arxiv.org/abs/2103.02368 (accessed on 26 March 2025).
- Yang, W.; Zhang, X.; Tian, Y.; Wang, W.; Xue, J.-H. Deep Learning for Single Image Super-Resolution: A Brief Review. IEEE Trans. Multimed. 2019, 21, 3106–3121. [Google Scholar] [CrossRef]
- Ledig, C.; Theis, L.; Huszár, F.; Caballero, J.; Cunningham, A.; Acosta, A.; Aitken, A.; Tejani, A.; Totz, J.; Wang, Z.; et al. Photo-Realistic Single Image Super-Resolution Using a Generative Adversarial Network. In Proceedings of the 2017 IEEE Conference on Computer Vision and Pattern Recognition (CVPR), Honolulu, HI, USA, 21–26 July 2017; pp. 105–114. [Google Scholar] [CrossRef]
- Zhang, K.; Liang, J.; Van Gool, L.; Timofte, R. Designing a Practical Degradation Model for Deep Blind Image Super-Resolution. In Proceedings of the 2021 IEEE/CVF International Conference on Computer Vision (ICCV), Montreal, QC, Canada, 10–17 October 2021; pp. 4771–4780. [Google Scholar] [CrossRef]
- Zhang, K.; Zuo, W.; Zhang, L. Deep Plug-And-Play Super-Resolution for Arbitrary Blur Kernels. In Proceedings of the 2019 IEEE/CVF Conference on Computer Vision and Pattern Recognition (CVPR), Long Beach, CA, USA, 16–20 June 2019; pp. 1671–1681. [Google Scholar] [CrossRef]
- Wang, B.; Zhang, Y.; Feng, Y.; Xie, B.; Mei, S. Attention-Enhanced Generative Adversarial Network for Hyperspectral Imagery Spatial Super-Resolution. Remote Sens. 2023, 15, 3644. [Google Scholar] [CrossRef]
- Wang, X.; Yu, K.; Wu, S.; Gu, J.; Liu, Y.; Dong, C.; Qiao, Y.; Loy, C.C. ESRGAN: Enhanced Super-Resolution Generative Adversarial Networks. In Computer Vision—ECCV 2018 Workshops; Leal-Taixé, L., Roth, S., Eds.; Lecture Notes in Computer Science; Springer International Publishing: Cham, Switzerland, 2019; Volume 11133, pp. 63–79. [Google Scholar] [CrossRef]
- Tu, Z.; Yang, X.; He, X.; Yan, J.; Xu, T. RGTGAN: Reference-Based Gradient-Assisted Texture-Enhancement GAN for Remote Sensing Super-Resolution. IEEE Trans. Geosci. Remote Sens. 2024, 62, 1–21. [Google Scholar] [CrossRef]
- Yue, X.; Liu, D.; Wang, L.; Benediktsson, J.A.; Meng, L.; Deng, L. IESRGAN: Enhanced U-Net Structured Generative Adversarial Network for Remote Sensing Image Super-Resolution Reconstruction. Remote Sens. 2023, 15, 3490. [Google Scholar] [CrossRef]
- Xu, Y.; Luo, W.; Hu, A.; Xie, Z.; Xie, X.; Tao, L. TE-SAGAN: An Improved Generative Adversarial Network for Remote Sensing Super-Resolution Images. Remote Sens. 2022, 14, 2425. [Google Scholar] [CrossRef]
- Xiao, Y.; Yuan, Q.; Jiang, K.; He, J.; Wang, Y.; Zhang, L. From Degrade to Upgrade: Learning a Self-Supervised Degradation Guided Adaptive Network for Blind Remote Sensing Image Super-Resolution. Inf. Fusion 2023, 96, 297–311. [Google Scholar] [CrossRef]
- Shao, W.-Z.; Ge, Q.; Wang, L.-Q.; Lin, Y.-Z.; Deng, H.-S.; Li, H.-B. Nonparametric Blind Super-Resolution Using Adaptive Heavy-Tailed Priors. J. Math. Imaging Vis. 2019, 61, 885–917. [Google Scholar] [CrossRef]
- Luo, Z.; Huang, Y.; Li, S.; Wang, L.; Tan, T. End-to-End Alternating Optimization for Real-World Blind Super Resolution. Int. J. Comput. Vis. 2023, 131, 3152–3169. [Google Scholar] [CrossRef]
- Zhang, Q.; Zheng, B.; Li, Z.; Liu, Y.; Zhu, Z.; Slabaugh, G.; Yuan, S. Non-Local Degradation Modeling for Spatially Adaptive Single Image Super-Resolution. Neural Netw. 2024, 175, 106293. [Google Scholar] [CrossRef]
- Yang, S.; Xie, L.; Ran, X.; Lei, J.; Qian, X. Pragmatic Degradation Learning for Scene Text Image Super-Resolution with Data-Training Strategy. Knowl.-Based Syst. 2024, 285, 111349. [Google Scholar] [CrossRef]
- Chen, Q.; Shao, Q. Single Image Super-Resolution Based on Trainable Feature Matching Attention Network. Pattern Recognit. 2024, 149, 110289. [Google Scholar] [CrossRef]
- Xiong, Y.; Guo, S.; Chen, J.; Deng, X.; Sun, L.; Zheng, X.; Xu, W. Improved SRGAN for Remote Sensing Image Super-Resolution Across Locations and Sensors. Remote Sens. 2020, 12, 1263. [Google Scholar] [CrossRef]
- Abbas, R.; Gu, N. Improving Deep Learning-Based Image Super-Resolution with Residual Learning and Perceptual Loss Using SRGAN Model. Soft Comput. 2023, 27, 16041–16057. [Google Scholar] [CrossRef]
- Wang, Z.; Zhao, Y.; Chen, J. Multi-Scale Fast Fourier Transform Based Attention Network for Remote-Sensing Image Super-Resolution. IEEE J. Sel. Top. Appl. Earth Obs. Remote Sens. 2023, 16, 2728–2740. [Google Scholar] [CrossRef]
- Cong, S.; Cui, K.; Yang, Y.; Wang, X.; Luo, H.; Zhang, Y.; Yao, X. DDASR: Domain-Distance Adapted Super-Resolution Reconstruction of MR Brain Images. In Proceedings of the 2024 IEEE International Conference on Systems, Man, and Cybernetics (SMC), Kuching, Malaysia, 6–10 October 2024; pp. 2535–2542. [Google Scholar] [CrossRef]
- Yang, M.-C.; Wang, Y.-C.F. A Self-Learning Approach to Single Image Super-Resolution. IEEE Trans. Multimedia 2013, 15, 498–508. [Google Scholar] [CrossRef]
- Li, J.; Wu, J.; Deng, H.; Liu, J. A Self-Learning Image Super-Resolution Method via Sparse Representation and Non-Local Similarity. Neurocomputing 2016, 184, 196–206. [Google Scholar] [CrossRef]
- Lim, B.; Son, S.; Kim, H.; Nah, S.; Lee, K.M. Enhanced Deep Residual Networks for Single Image Super-Resolution. In Proceedings of the 2017 IEEE Conference on Computer Vision and Pattern Recognition Workshops (CVPRW), Honolulu, HI, USA, 21–26 July 2017; pp. 1132–1140. [Google Scholar] [CrossRef]
- Zhang, S.; Yuan, Q.; Li, J.; Sun, J.; Zhang, X. Scene-Adaptive Remote Sensing Image Super-Resolution Using a Multiscale Attention Network. IEEE Trans. Geosci. Remote Sens. 2020, 58, 4764–4779. [Google Scholar] [CrossRef]
- Zhang, D.; Shao, J.; Li, X.; Shen, H.T. Remote Sensing Image Super-Resolution via Mixed High-Order Attention Network. IEEE Trans. Geosci. Remote Sens. 2021, 59, 5183–5196. [Google Scholar] [CrossRef]
- Wang, Y.; Liao, J.; Ye, Y.; Fan, J. Long-Term Human Expansion and the Environmental Impacts on the Coastal Zone of China. Front. Mar. Sci. 2022, 9, 1033466. [Google Scholar] [CrossRef]
- Wang, C.; Zhang, X.; Yang, W.; Wang, G.; Li, X.; Wang, J. MSWAGAN: Multi-Spectral Remote Sensing Image Super-Resolution Based on Multi-Scale Window Attention Transformer. IEEE Trans. Geosci. Remote Sens. 2024, 62, 5404715. [Google Scholar] [CrossRef]
- Wang, X.; Wu, Y.; Ming, Y.; Lv, H. Remote Sensing Imagery Super-Resolution Based on Adaptive Multi-Scale Feature Fusion Network. Sensors 2020, 20, 1142. [Google Scholar] [CrossRef]
- Zhu, F.; Wang, C.; Zhu, B.; Sun, C.; Qi, C. An Improved Generative Adversarial Networks for Remote Sensing Image Super-Resolution Reconstruction via Multi-Scale Residual Block. Egypt. J. Remote Sens. Space Sci. 2023, 26, 151–160. [Google Scholar] [CrossRef]
- Lucas, A.; López-Tapia, S.; Molina, R.; Katsaggelos, A.K. Generative Adversarial Networks and Perceptual Losses for Video Super-Resolution. IEEE Trans. Image Process. 2019, 28, 3312–3327. [Google Scholar] [CrossRef]
- Hore, A.; Ziou, D. Image Quality Metrics: PSNR vs. SSIM. In Proceedings of the 2010 20th International Conference on Pattern Recognition, Istanbul, Turkey, 23–26 August 2010; pp. 2366–2369. [Google Scholar] [CrossRef]
- Channappayya, S.S.; Bovik, A.C.; Heath, R.W. Rate Bounds on SSIM Index of Quantized Images. IEEE Trans. Image Process. 2008, 17, 1624–1639. [Google Scholar] [CrossRef] [PubMed]
- Zhang, R.; Isola, P.; Efros, A.A.; Shechtman, E.; Wang, O. The Unreasonable Effectiveness of Deep Features as a Perceptual Metric. In Proceedings of the 2018 IEEE/CVF Conference on Computer Vision and Pattern Recognition, Salt Lake City, UT, USA, 18–23 June 2018; pp. 586–595. [Google Scholar] [CrossRef]


Disclaimer/Publisher’s Note: The statements, opinions and data contained in all publications are solely those of the individual author(s) and contributor(s) and not of MDPI and/or the editor(s). MDPI and/or the editor(s) disclaim responsibility for any injury to people or property resulting from any ideas, methods, instructions or products referred to in the content. |
© 2025 by the authors. Licensee MDPI, Basel, Switzerland. This article is an open access article distributed under the terms and conditions of the Creative Commons Attribution (CC BY) license (https://creativecommons.org/licenses/by/4.0/).