
Coastal Subsidence in Cape Canaveral, FL, and Surrounding Areas: Shallow Subsidence Induced by Natural and Anthropogenic Processes


Abstract
:1. Introduction
2. Geological Setting
3. Data
4. Methods
4.1. Multi-Temporal InSAR Data Analysis
4.2. Post-Processing of the GNSS Data
4.3. Leveling Data Analysis
5. Results
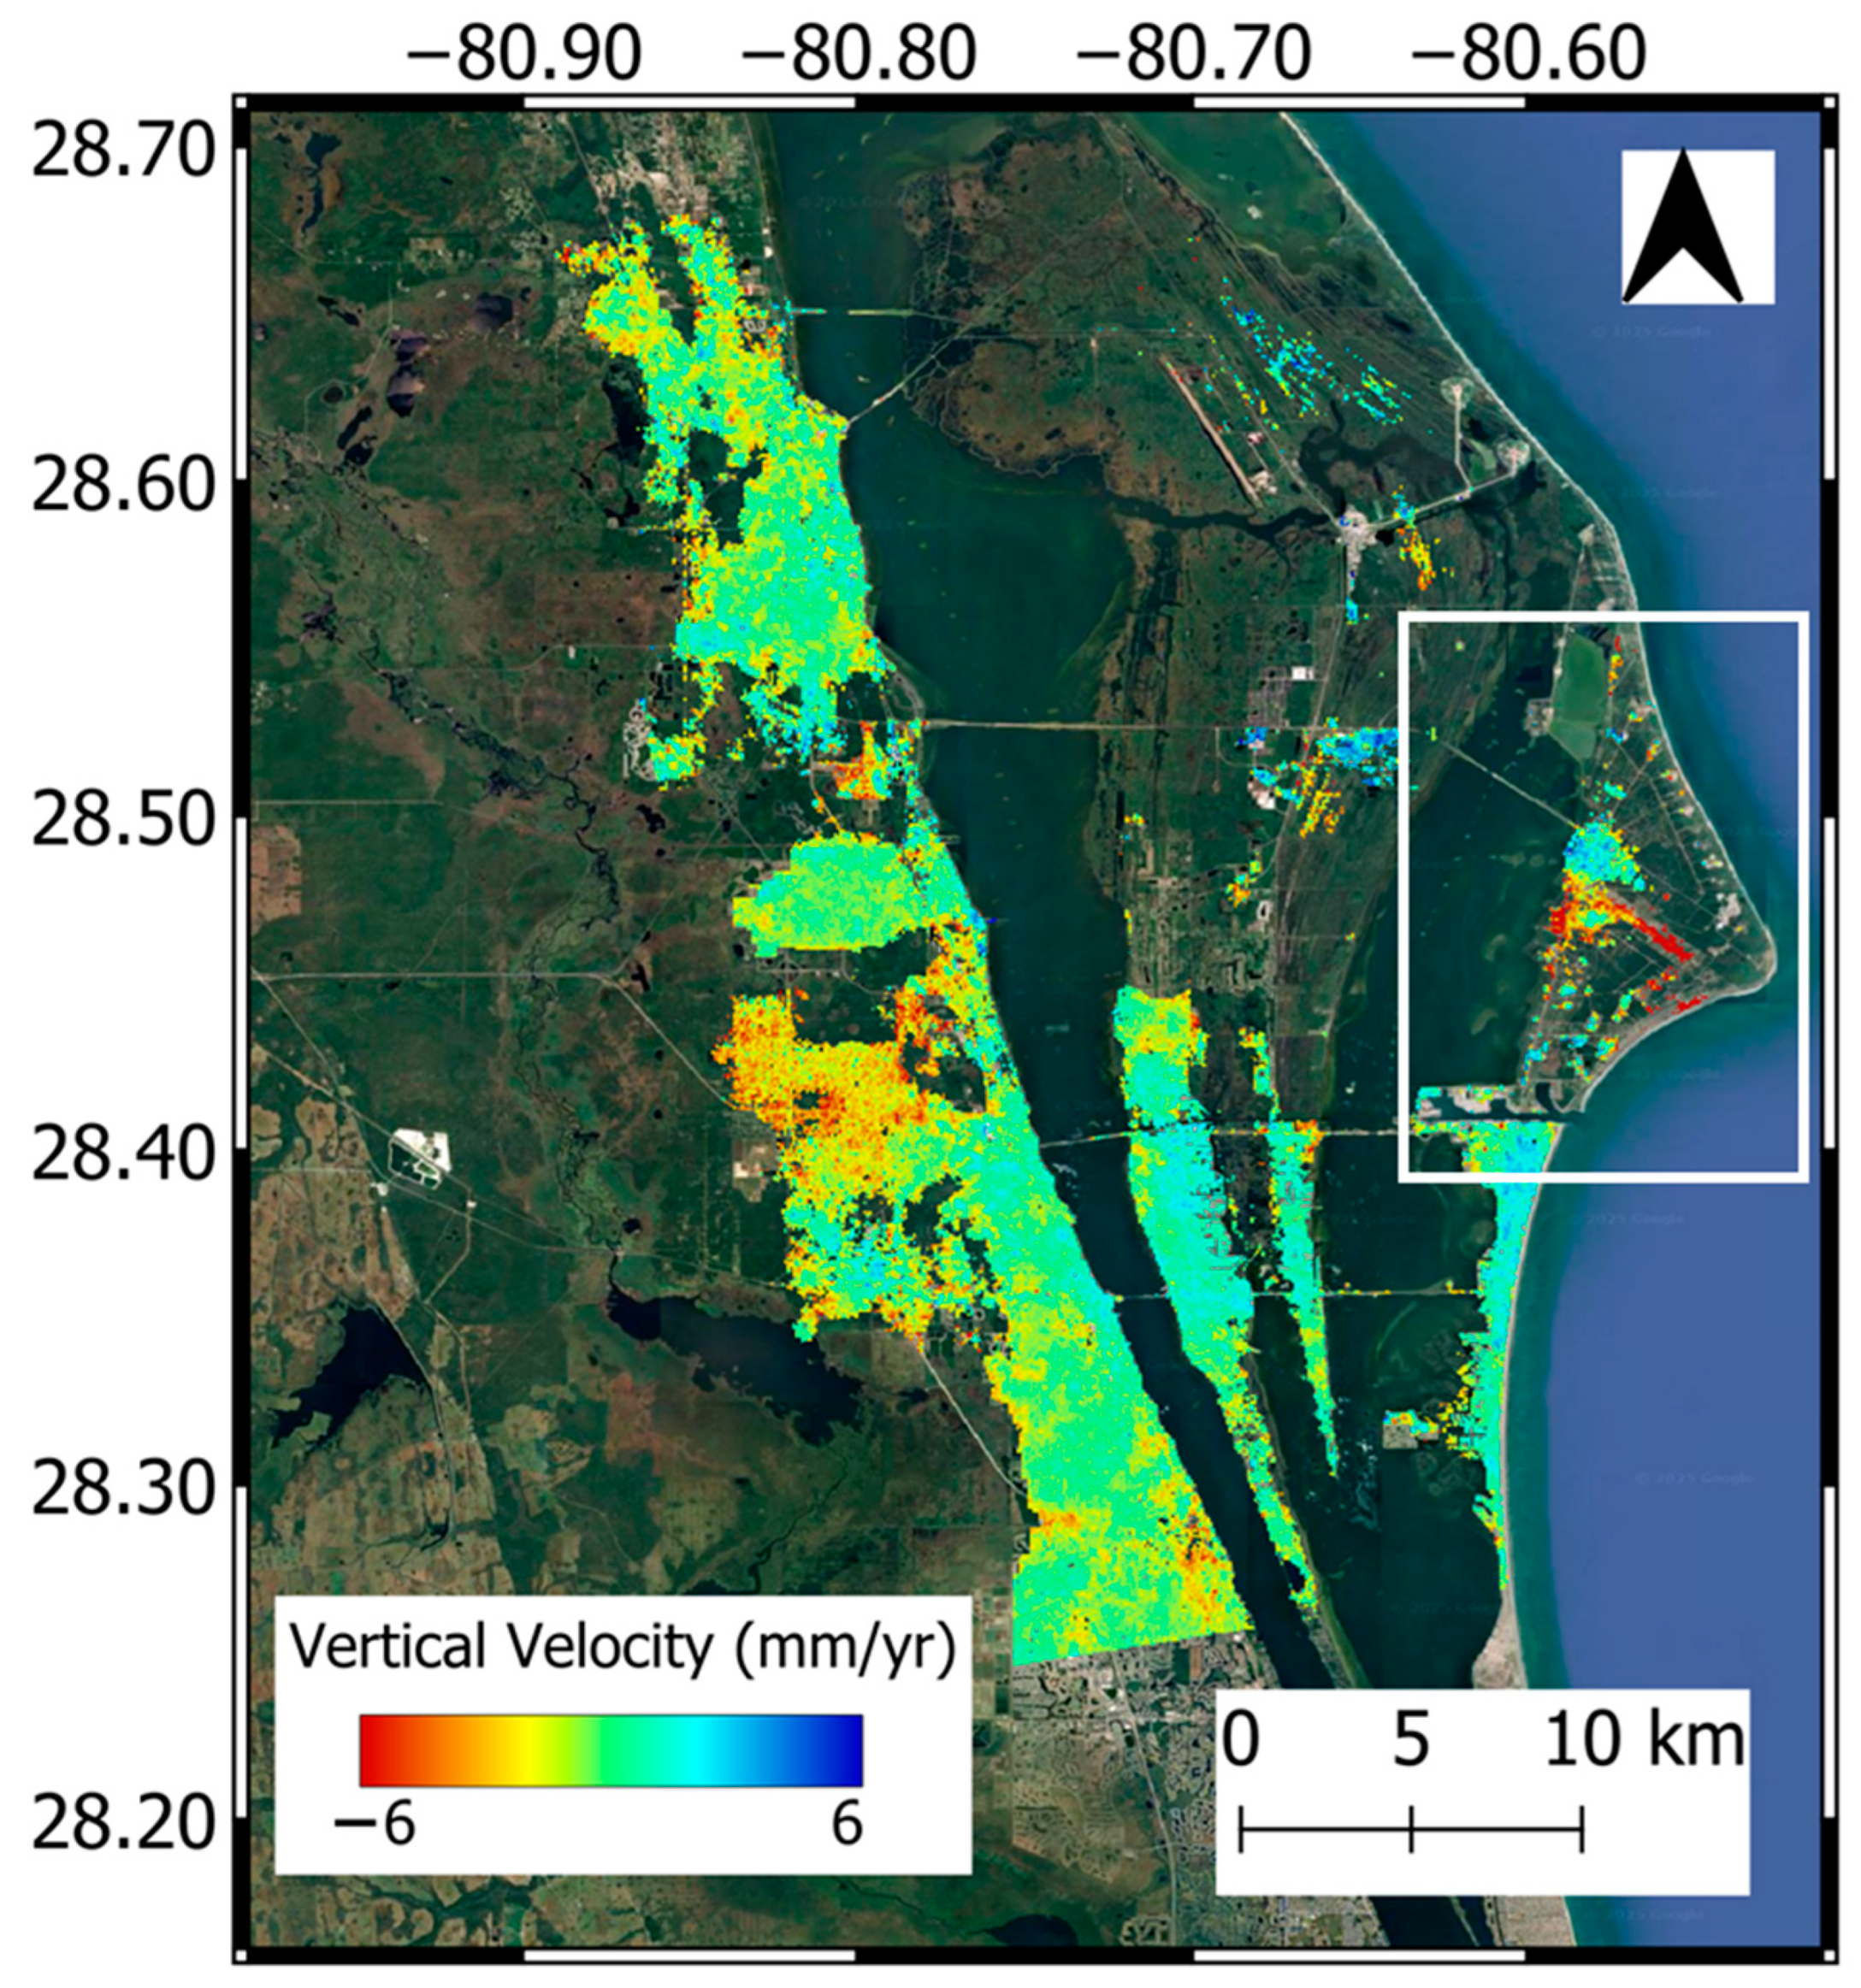
5.1. InSAR
5.2. GNSS and Precise Leveling
6. Discussion
6.1. Long-Term Subsidence in Cape Canaveral
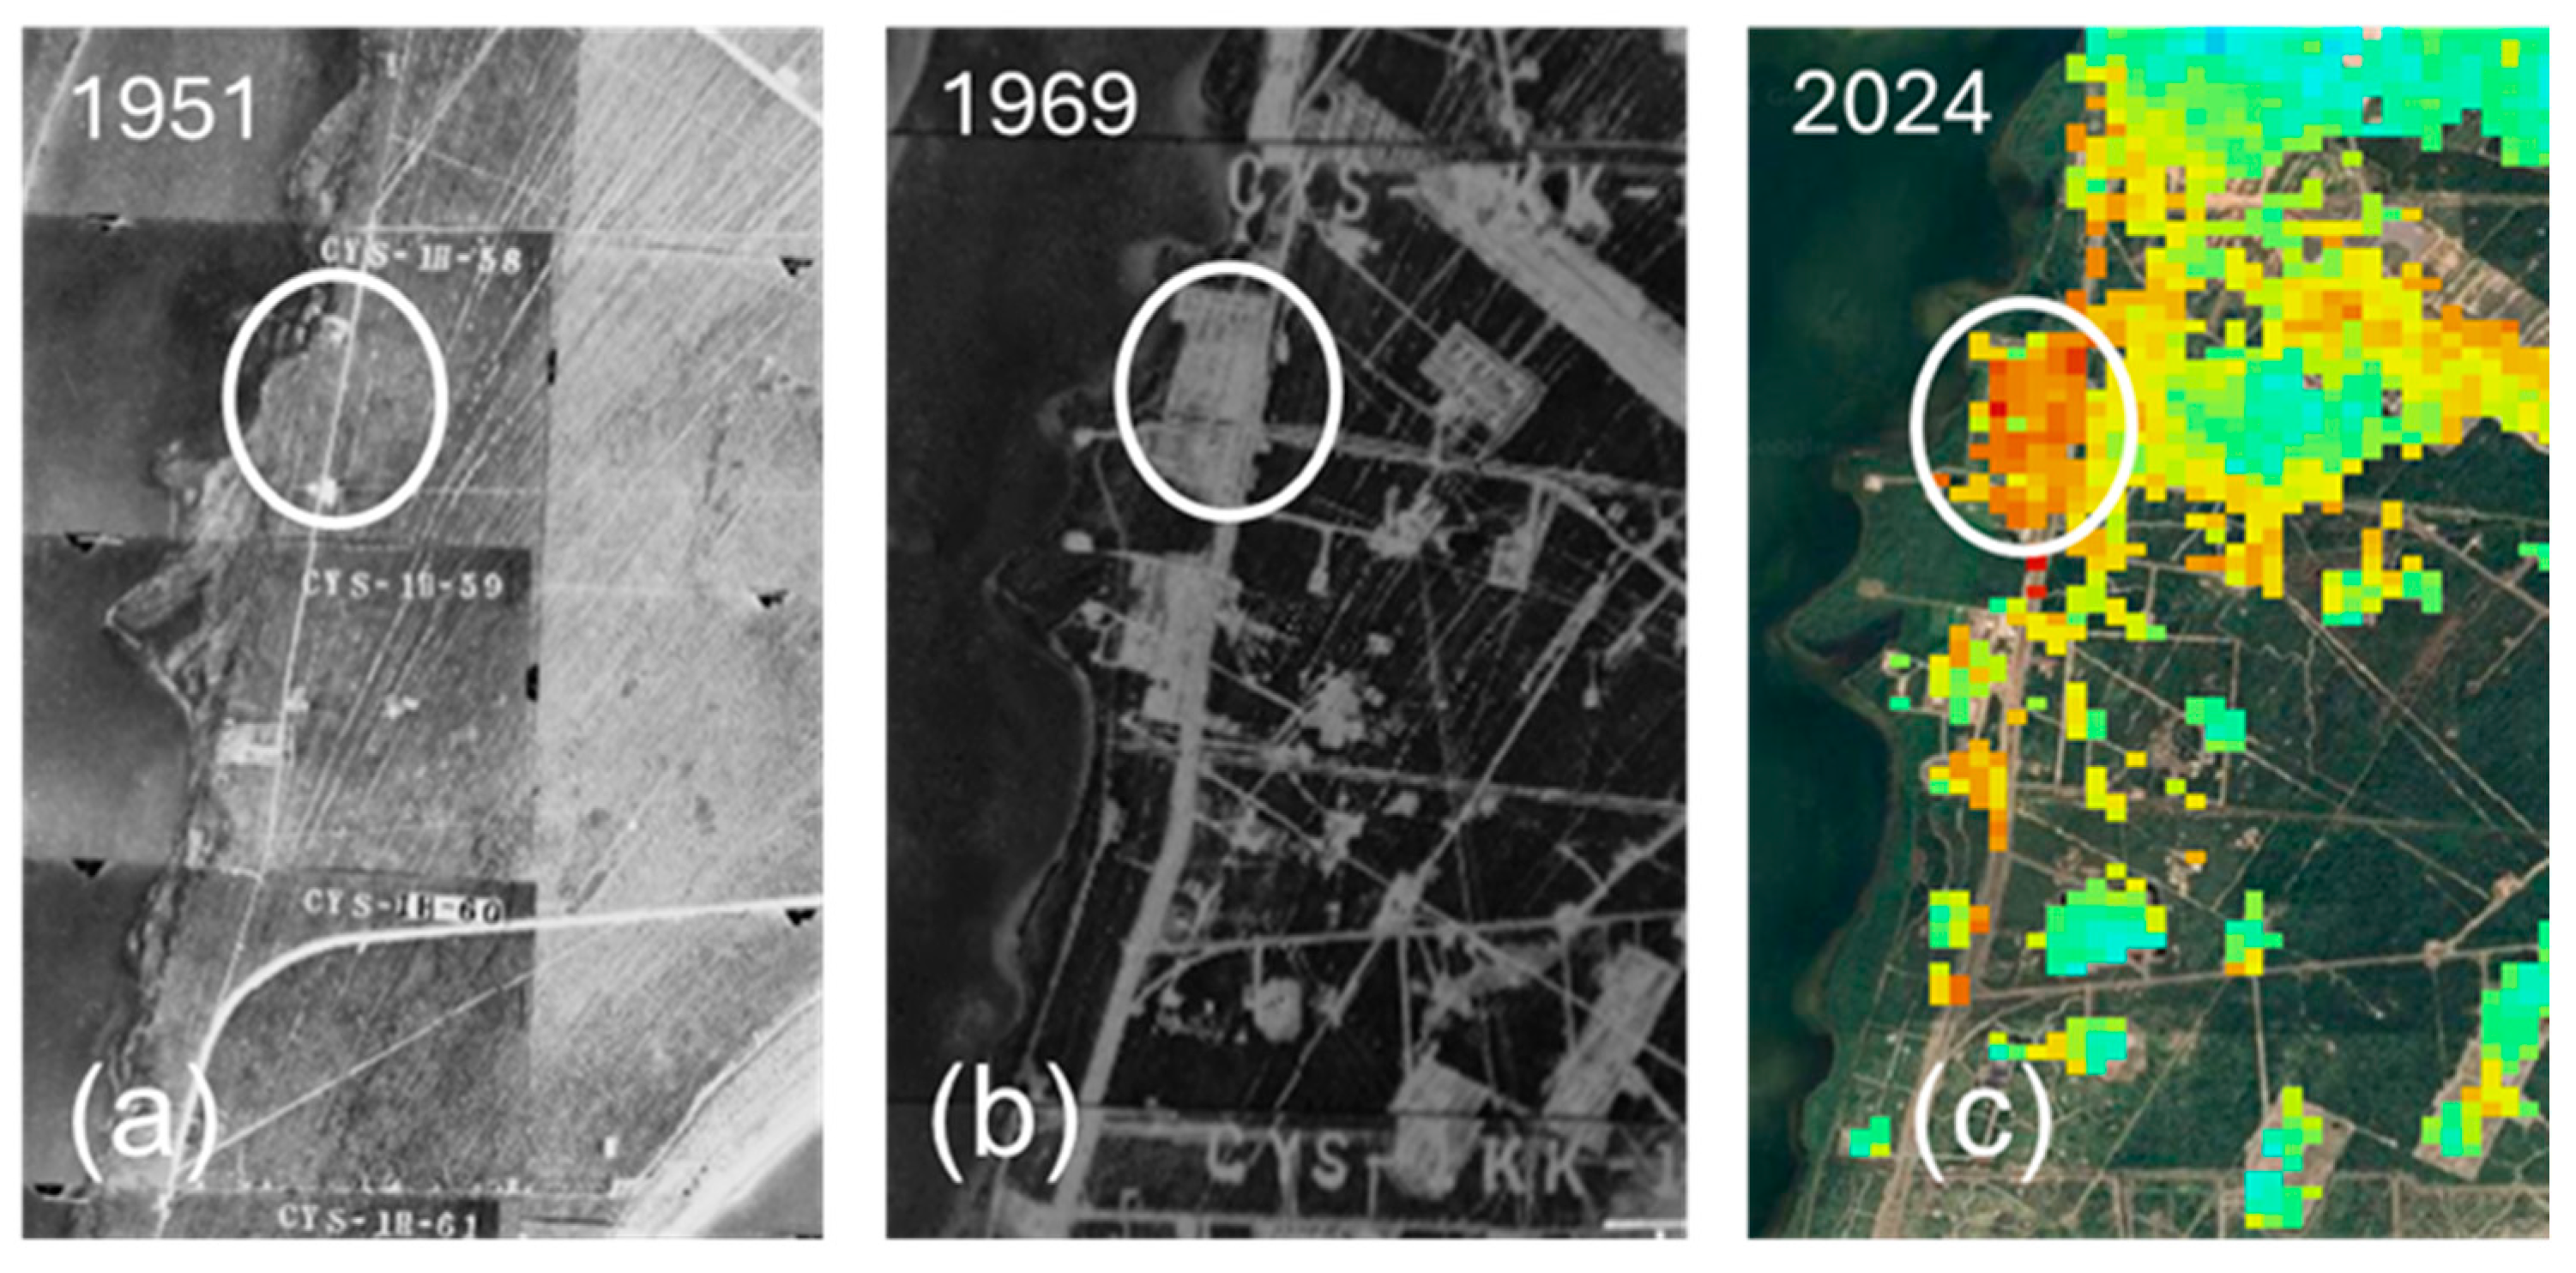
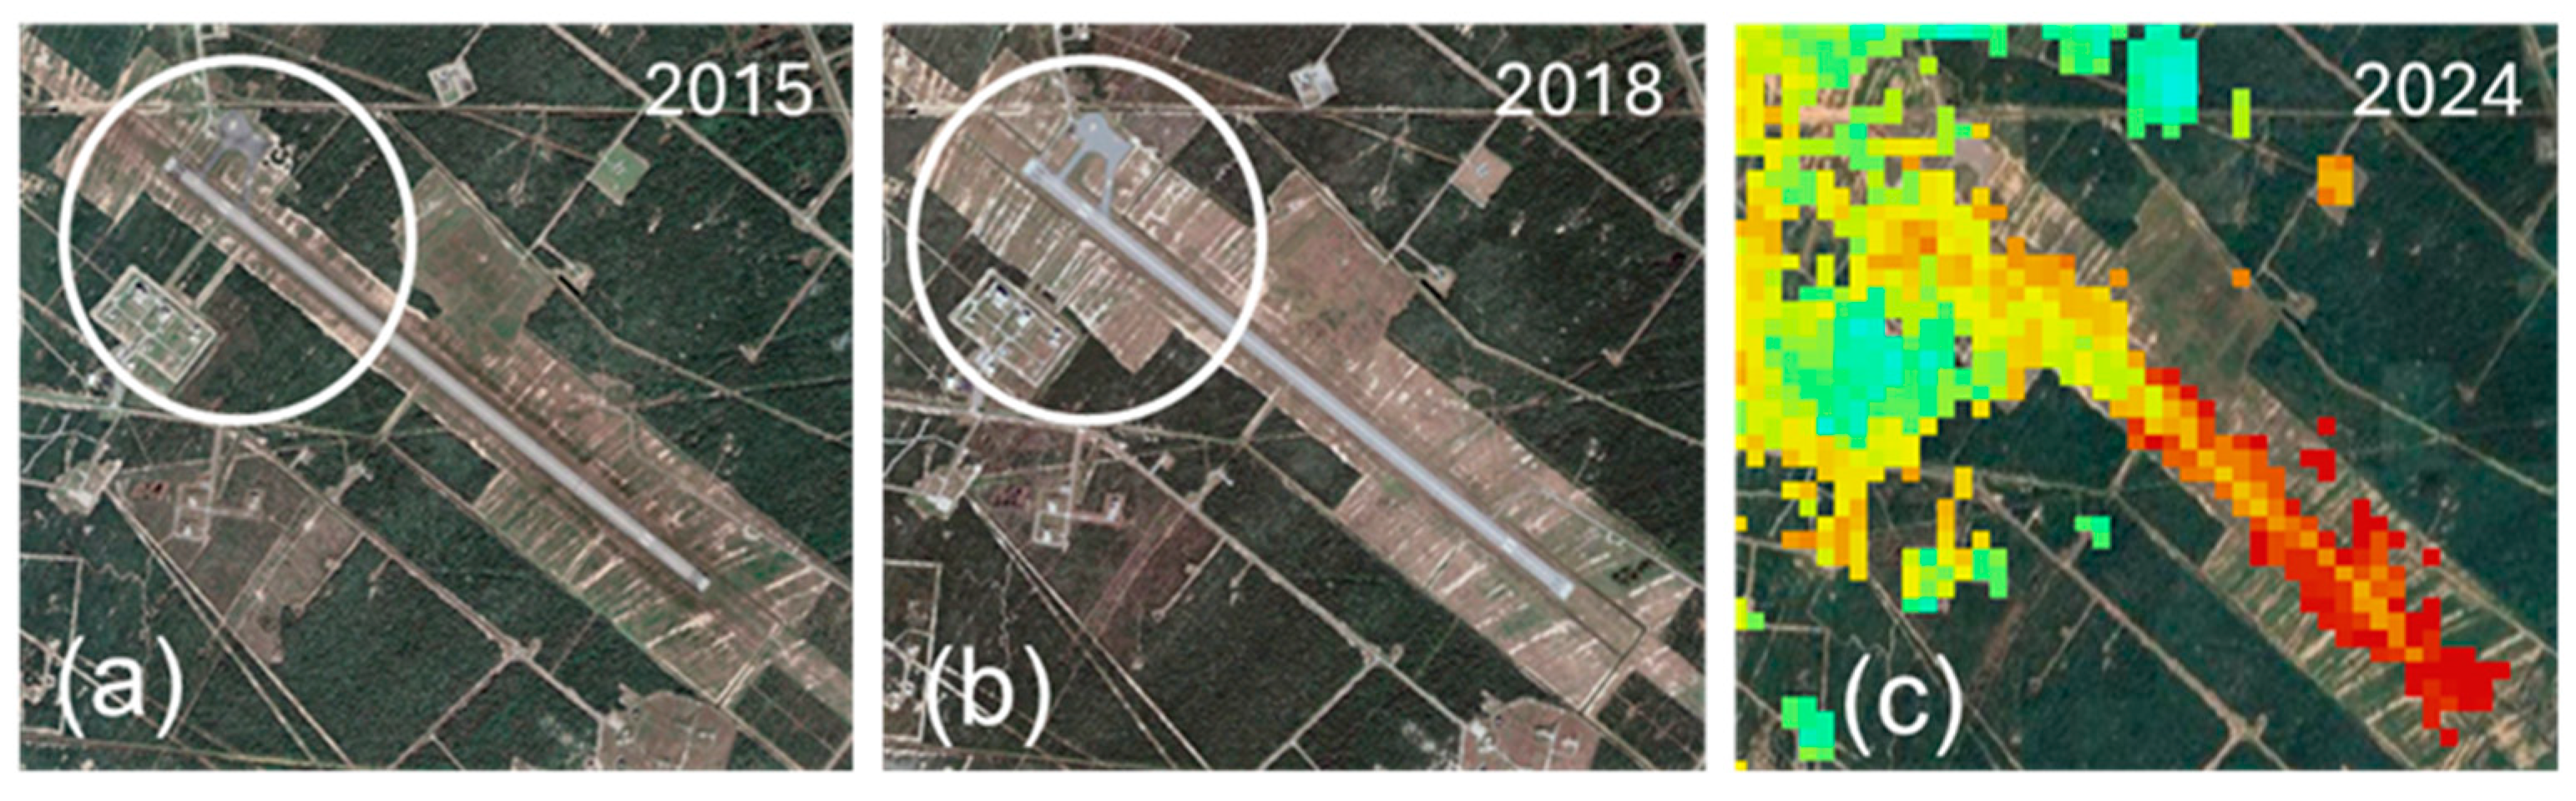
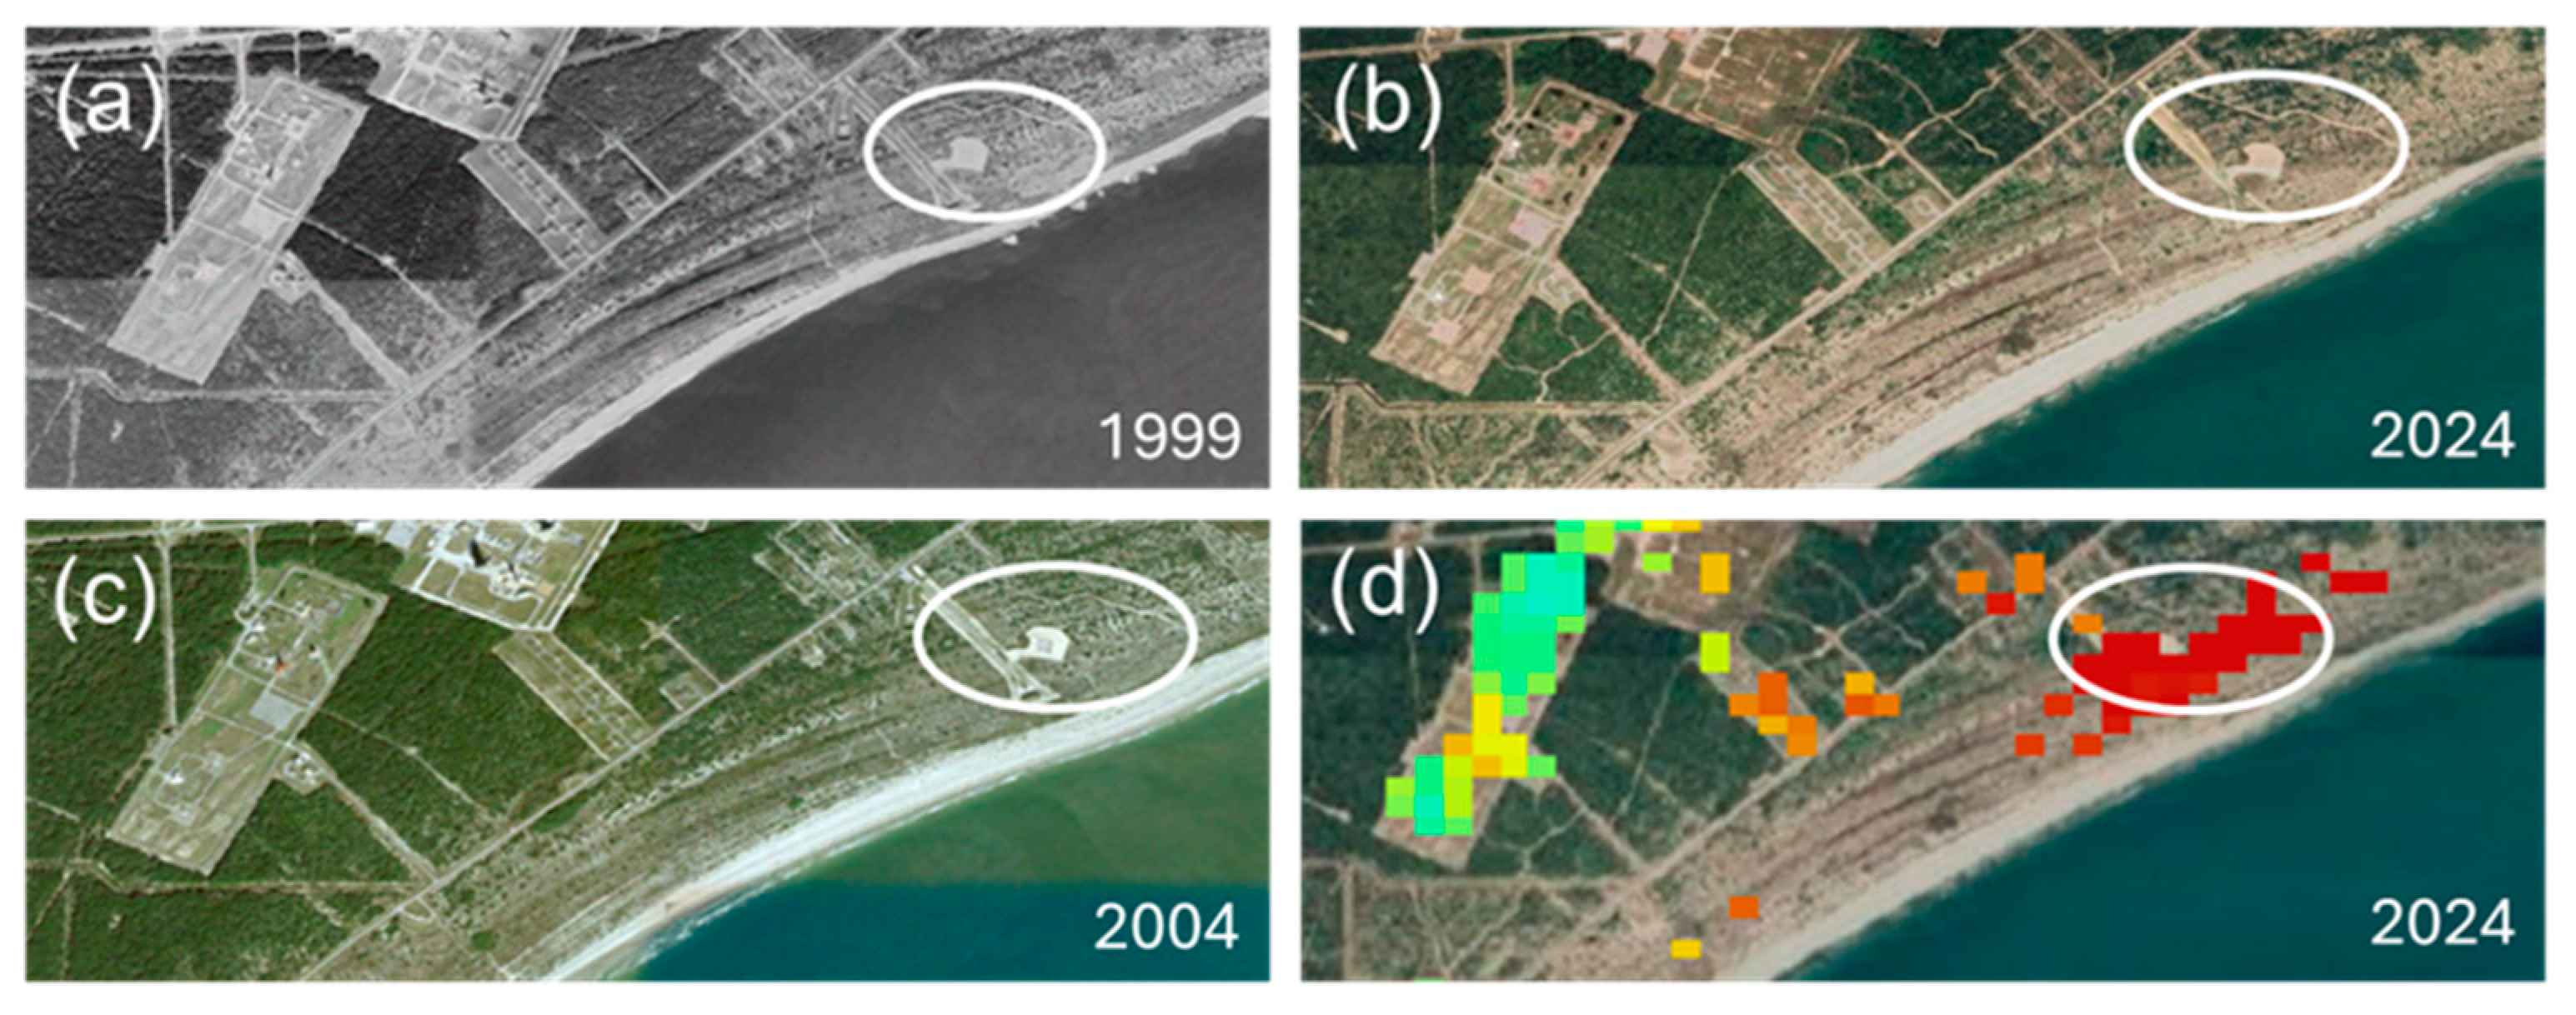
6.2. Localized Subsiding Areas and Apparent Stable Infrastructures—Observations and Explanations
6.3. Temporal Variations Based on the GNSS and Precise Leveling
6.4. InSAR and GNSS Comparison
6.5. Comparison with Previous Studies
6.6. Future Work
6.7. Implications for Flooding Hazard in Cape Canaveral
7. Conclusions
Supplementary Materials
Author Contributions
Funding
Data Availability Statement
Acknowledgments
Conflicts of Interest
References
- Cape Canaveral Spaceport Master Plan (January 2017). Available online: https://downloads.ctfassets.net/8fes9s91xvz7/31k2dKMJtmw2ii6e6EiiC0/223396395230e4bf2f7eda44251389e0/2017-01-26-_-ccs-master-plan_final.pdf (accessed on 18 January 2025).
- Nelson, A.R.; Shennan, I.; Long, A.J. Identifying Coseismic Subsidence in Tidal-wetland Stratigraphic Sequences at the Cascadia Subduction Zone of Western North America. J. Geophys. Res. 1996, 101, 6115–6135. [Google Scholar] [CrossRef]
- Peltier, W.R. Global Glacial Isostasy and the Surface of the ICE-Age Earth: The ICE-5G (VM2) Model and Grace. Annu. Rev. Earth Planet. Sci. 2004, 32, 111–149. [Google Scholar] [CrossRef]
- Zoccarato, C.; Minderhoud, P.S.; Teatini, P. The Role of Sedimentation and Natural Compaction in a Prograding Delta: Insights from the Mega Mekong Delta, Vietnam. Sci. Rep. 2018, 8, 11437. [Google Scholar] [CrossRef] [PubMed]
- Chang, C.; Mallman, E.; Zoback, M. Time-Dependent Subsidence Associated with Drainage-Induced Compaction in Gulf of Mexico Shales Bounding a Severely Depleted Gas Reservoir. AAPG Bull. 2014, 98, 1145–1159. [Google Scholar] [CrossRef]
- Chaussard, E.; Bürgmann, R.; Shirzaei, M.; Fielding, E.J.; Baker, B. Predictability of Hydraulic Head Changes and Basin-Wide Aquifer and Fault Characterization from InSAR-Derived Ground Deformation. J. Geophys. Res. Solid Earth 2014, 119, 6572–6590. [Google Scholar] [CrossRef]
- Minderhoud, P.S.J.; Coumou, L.; Erban, L.E.; Middelkoop, H.; Stouthamer, E.; Addink, E.A. The Relation between Land Use and Subsidence in the Vietnamese Mekong Delta. Sci. Total Environ. 2018, 634, 715–726. [Google Scholar] [CrossRef] [PubMed]
- Candela, T.; Koster, K. The Many Faces of Anthropogenic Subsidence. Science 2022, 376, 1381–1382. [Google Scholar] [CrossRef]
- Holdahl, S.R.; Morrison, N.L. Regional Investigations of Vertical Crustal Movements in the US, Using Precise Relevelings and Mareograph Data. Tectonophysics 1974, 23, 373–390. [Google Scholar] [CrossRef]
- Hicks, S.D. Vertical Crustal Movements from Sea Level Measurements along the East Coast of the United States. J. Geophys. Res. 1972, 77, 5930–5934. [Google Scholar] [CrossRef]
- Brown, L.D.; Oliver, J.E. Vertical Crustal Movements from Leveling Data and Their Relation to Geologic Structure in the Eastern United States. Rev. Geophys. 1976, 14, 13–35. [Google Scholar] [CrossRef]
- Brown, L.D. Recent Vertical Crustal Movement along the East Coast of the United States. Tectonophysics 1978, 44, 205–231. [Google Scholar] [CrossRef]
- Ferretti, A.; Savio, G.; Barzaghi, R.; Borghi, A.; Musazzi, S.; Novali, F.; Prati, C.; Rocca, F. Submillimeter Accuracy of InSAR Time Series: Experimental Validation. IEEE Trans. Geosci. Remote Sens. 2007, 45, 1142–1153. [Google Scholar] [CrossRef]
- Bekaert, D.P.S.; Hamlington, B.D.; Buzzanga, B.; Jones, C.E. Spaceborne Synthetic Aperture Radar Survey of Subsidence in Hampton Roads, Virginia (USA). Sci. Rep. 2017, 7, 14752. [Google Scholar] [CrossRef]
- Buzzanga, B.; Bekaert, D.P.S.; Hamlington, B.D.; Kopp, R.E.; Govorcin, M.; Miller, K.G. Localized Uplift, Widespread Subsidence, and Implications for Sea Level Rise in the New York City Metropolitan Area. Sci. Adv. 2023, 9, eadi8259. [Google Scholar] [CrossRef]
- Fiaschi, S.; Wdowinski, S. Local Land Subsidence in Miami Beach (FL) and Norfolk (VA) and Its Contribution to Flooding Hazard in Coastal Communities along the US Atlantic Coast. Ocean Coast. Manag. 2020, 187, 105078. [Google Scholar] [CrossRef]
- Ohenhen, L.O.; Shirzaei, M.; Ojha, C.; Kirwan, M.L. Hidden Vulnerability of US Atlantic Coast to Sea-Level Rise Due to Vertical Land Motion. Nat. Commun. 2023, 14, 2038. [Google Scholar] [CrossRef]
- Engelhart, S.E.; Horton, B.P.; Douglas, B.C.; Peltier, W.R.; Törnqvist, T.E. Spatial Variability of Late Holocene and 20th Century Sea-Level Rise along the Atlantic Coast of the United States. Geology 2009, 37, 1115–1118. [Google Scholar] [CrossRef]
- Engelhart, S.E.; Horton, B.P. Holocene Sea Level Database for the Atlantic Coast of the United States. Quat. Sci. Rev. 2012, 54, 12–25. [Google Scholar] [CrossRef]
- Kemp, A.C.; Bernhardt, C.E.; Horton, B.P.; Kopp, R.E.; Vane, C.H.; Peltier, W.R.; Hawkes, A.D.; Donnelly, J.P.; Parnell, A.C.; Cahill, N. Late Holocene Sea- and Land-Level Change on the U.S. Southeastern Atlantic Coast. Mar. Geol. 2014, 357, 90–100. [Google Scholar] [CrossRef]
- Davis, G.H. Land Subsidence and Sea Level Rise on the Atlantic Coastal Plain of the United States. Environ. Geol. Water Sci. 1987, 10, 67–80. [Google Scholar] [CrossRef]
- Adams, P.N. Geomorphic Origin of Merritt Island-Cape Canaveral, Florida, USA: A Paleodelta of the Reversed St. Johns River? Geomorphology 2018, 306, 102–107. [Google Scholar]
- Rodrigues, K.; Stapor, F.W.; Rink, W.J.; Dunbar, J.S.; Doran, G. A 5700-Year-Old Beach-Ridge Set at Cape Canaveral, Florida, and Its Implication for Holocene Sea-Level History in the Southeastern USA. Holocene 2022, 32, 40–56. [Google Scholar] [CrossRef]
- Duncan, B.W.; Boyle, S.; Breininger, D.R.; Schmalzer, P.A. Coupling Past Management Practice and Historic Landscape Change on John F. Kennedy Space Center, Florida. Landsc. Ecol. 1999, 14, 291–309. [Google Scholar] [CrossRef]
- Kautz, R.S. Land Use and Land Cover Trends in Florida 1936–1995. Fla. Sci. 1998, 61, 171–187. [Google Scholar]
- Kautz, R.; Stys, B.; Kawula, R. Florida Vegetation 2003 and Land Use Change between 1985–89 and 2003. Florida Scientist 2007, 70, 12–23. [Google Scholar]
- Thiéblemont, R.; Le Cozannet, G.; Nicholls, R.J.; Rohmer, J.; Wöppelmann, G.; Raucoules, D.; de Michele, M.; Toimil, A.; Lincke, D. Assessing Current Coastal Subsidence at Continental Scale: Insights from Europe Using the European Ground Motion Service. Earth’s Future 2024, 12, e2024EF004523. [Google Scholar] [CrossRef]
- Green, J.; Williams, C.; Green, R.; Hebets, C.; Evans, G.; Ladle, M.; Hall, N.; Duffey, B. Text to Accompany Geologic Map of the USGS Cape Canaveral 30 × 60 Minute Quadrangle, Central Florida; Open-File Report 112; Florida Geological Survey: Tallahassee, FL, USA, 2023; p. 28. Available online: https://publicfiles.dep.state.fl.us/fgs/fgs_publications/statemap/high_res/ofms115_cape_canaveral/ofr_112_cape_canaveral_published.pdf (accessed on 18 January 2025).
- White, W.A. Geomorphology of the Florida Peninsula; Geological Bulletin 51; Bureau of Geology: Socorro, NM, USA, 1970; p. 186. Available online: https://ufdc.ufl.edu/uf00000149/00001/images/0 (accessed on 18 January 2025).
- Brooks, H.K. Geology of Cape Canaveral. In Space Age Geology; Southeastern Geological Society: Tallahassee, FL, USA, 1972; pp. 35–44. Available online: https://segs.org/wp-content/uploads/2017/08/SEGS-Guidebook-16.pdf (accessed on 18 January 2025).
- White, W.A. Some Geomorphic Features of Central Peninsular Florida; Geological Bulletin 41; Florida Geological Survey: Tallahassee, FL, USA, 1958; p. 105. Available online: https://publicfiles.dep.state.fl.us/fgs/fgs_publications/b/b41.pdf (accessed on 18 January 2025).
- Stapor, F.W.; May, J.P. The Cellular Nature of Littoral Drift along the Northeast Florida Coast. Mar. Geol. 1983, 51, 217–237. [Google Scholar] [CrossRef]
- Scott, T.M.; Campbell, K.M.; Rupert, F.R.; Arthur, J.A.; Green, R.C.; Means, G.H.; Missimer, T.M.; Lloyd, J.M.; Duncan, J.G. Geologic Map of Florida; Florida Geological Survey Map Series 146, Scale 1:750,000; FGS Publications: Tallahassee, FL, USA, 2001. [Google Scholar] [CrossRef]
- Green, R.; Williams, C.; Green, J.; Hebets, C.; Evans, G.; Ladle, M.; Hall, N.; Duffer, B. Geologic Cross-Section for the USGS Cape Canaveral 30-30 Minute Quadrangle, Central Florida [Geologic]; Florida Geological Survey: Tallahassee, FL, USA, 2023; Available online: https://publicfiles.dep.state.fl.us/fgs/fgs_publications/statemap/high_res/ofms115_cape_canaveral/ofms_115_cc_plate_2_published.pdf (accessed on 18 January 2025).
- NASA Earthdata. Earth Science Data Systems, N. ASF DAAC. Available online: https://www.earthdata.nasa.gov/centers/asf-daac (accessed on 18 January 2025).
- Nevada Geodetic Laboratory. The MAGNET GPS Network. Available online: http://geodesy.unr.edu/magnet.php (accessed on 18 January 2025).
- Blewitt, G.; Kreemer, C.; Hammond, W.C.; Gazeaux, J. MIDAS Robust Trend Estimator for Accurate GPS Station Velocities without Step Detection. J. Geophys. Res. Solid Earth 2016, 121, 2054–2068. [Google Scholar] [CrossRef] [PubMed]
- Altamimi, Z.; Rebischung, P.; Métivier, L.; Collilieux, X. ITRF2014: A New Release of the International Terrestrial Reference Frame Modeling Nonlinear Station Motions. J. Geophys. Res. Solid Earth 2016, 121, 6109–6131. [Google Scholar] [CrossRef]
- NGS Map. Available online: https://geodesy.noaa.gov/datasheets/ngs_map/ (accessed on 18 January 2025).
- Rosen, P.A.; Gurrola, E.; Sacco, G.F.; Zebker, H. The InSAR Scientific Computing Environment. In Proceedings of the EUSAR 2012, 9th European Conference on Synthetic Aperture Radar, Nuremberg, Germany, 23–26 April 2012; pp. 730–733. [Google Scholar]
- European Space Agency. Copernicus Global Digital Elevation Model. Distributed by OpenTopography; European Space Agency: Paris, France, 2024. [Google Scholar] [CrossRef]
- Yunjun, Z.; Fattahi, H.; Amelung, F. Small Baseline InSAR Time Series Analysis: Unwrapping Error Correction and Noise Reduction. Comput. Geosci. 2019, 133, 104331. [Google Scholar]
- Hersbach, H.; Bell, B.; Berrisford, P.; Hirahara, S.; Horányi, A.; Muñoz-Sabater, J.; Nicolas, J.; Peubey, C.; Radu, R.; Schepers, D.; et al. The ERA5 Global Reanalysis. Q. J. R. Meteorol. Soc. 2020, 146, 1999–2049. [Google Scholar] [CrossRef]
- Jolivet, R.; Agram, P.S.; Lin, N.Y.; Simons, M.; Doin, M.-P.; Peltzer, G.; Li, Z. Improving InSAR Geodesy Using Global Atmospheric Models. J. Geophys. Res. Solid Earth 2014, 119, 2324–2341. [Google Scholar] [CrossRef]
- Fattahi, H.; Amelung, F. DEM Error Correction in InSAR Time Series. IEEE Trans. Geosci. Remote Sens. 2013, 51, 4249–4259. [Google Scholar] [CrossRef]
- Gornitz, V.; Seeber, L. Vertical Crustal Movements along the East Coast, North America, from Historic and Late Holocene Sea Level Data. Tectonophysics 1990, 178, 127–150. [Google Scholar] [CrossRef]
- Schumacher, M.; King, M.A.; Rougier, J.; Sha, Z.; Khan, S.A.; Bamber, J.L. A New Global GPS Data Set for Testing and Improving Modelled GIA Uplift Rates. Geophys. J. Int. 2018, 214, 2164–2176. [Google Scholar] [CrossRef]
- Horton, B.P.; Engelhart, S.E.; Hill, D.F.; Kemp, A.C.; Nikitina, D.; Miller, K.G.; Peltier, W.R. Influence of Tidal-range Change and Sediment Compaction on Holocene Relative Sea-level Change in New Jersey, USA. J. Quat. Sci. 2013, 28, 403–411. [Google Scholar] [CrossRef]
- Verberne, M.; Koster, K.; Fokker, P.A. Multi-Data Settlement Prediction along a Road Section Integrating InSAR and Coastal Subsurface Information with Data Assimilation. Front. Earth Sci. 2024, 11, 1323874. [Google Scholar] [CrossRef]
- Day, J.W.; Kemp, G.P.; Reed, D.J.; Cahoon, D.R.; Boumans, R.M.; Suhayda, J.M.; Gambrell, R. Vegetation Death and Rapid Loss of Surface Elevation in Two Contrasting Mississippi Delta Salt Marshes: The Role of Sedimentation, Autocompaction and Sea-Level Rise. Ecol. Eng. 2011, 37, 229–240. [Google Scholar] [CrossRef]
- Hooijer, A.; Page, S.; Jauhiainen, J.; Lee, W.A.; Lu, X.X.; Idris, A.; Anshari, G. Subsidence and Carbon Loss in Drained Tropical Peatlands. Biogeosciences 2012, 9, 1053–1071. [Google Scholar] [CrossRef]
- Ikkala, L.; Ronkanen, A.-K.; Utriainen, O.; Kløve, B.; Marttila, H. Peatland Subsidence Enhances Cultivated Lowland Flood Risk. Soil Tillage Res. 2021, 212, 105078. [Google Scholar] [CrossRef]
- Koster, K.; Stafleu, J.; Stouthamer, E. Differential Subsidence in the Urbanised Coastal-Deltaic Plain of the Netherlands. Neth. J. Geosci. 2018, 97, 215–227. [Google Scholar] [CrossRef]
- An, B.; Jiang, Y.; Wang, C.; Shen, P.; Song, T.; Hu, C.; Liu, K. Ground Infrastructure Monitoring in Coastal Areas Using Time-Series inSAR Technology: The Case Study of Pudong International Airport, Shanghai. Int. J. Digit. Earth 2023, 16, 355–374. [Google Scholar] [CrossRef]
- Dai, K.; Shi, X.; Gou, J.; Hu, L.; Chen, M.; Zhao, L.; Dong, X.; Li, Z. Diagnosing Subsidence Geohazard at Beijing Capital International Airport, from High-Resolution SAR Interferometry. Sustainability 2020, 12, 2269. [Google Scholar] [CrossRef]
- Ciampalini, A.; Solari, L.; Giannecchini, R.; Galanti, Y.; Moretti, S. Evaluation of Subsidence Induced by Long-Lasting Buildings Load Using InSAR Technique and Geotechnical Data: The Case Study of a Freight Terminal (Tuscany, Italy). Int. J. Appl. Earth Obs. Geoinf. 2019, 82, 101925. [Google Scholar] [CrossRef]
- NASA. Vehicle Assembly Building Prepared for Future. Available online: https://web.archive.org/web/20160929213425/http://www.nasa.gov/content/vehicle-assembly-building-prepared-for-another-50-years-of-service (accessed on 18 January 2025).
- Ohenhen, L.O.; Shirzaei, M.; Ojha, C.; Sherpa, S.F.; Nicholls, R.J. Disappearing Cities on US Coasts. Nature 2024, 627, 108–115. [Google Scholar] [CrossRef]
- Dangendorf, S.; Hay, C.; Calafat, F.M.; Marcos, M.; Piecuch, C.G.; Berk, K.; Jensen, J. Persistent Acceleration in Global Sea-Level Rise since the 1960s. Nat. Clim. Change 2019, 9, 705–710. [Google Scholar] [CrossRef]
- Frederikse, T.; Landerer, F.; Caron, L.; Adhikari, S.; Parkes, D.; Humphrey, V.W.; Dangendorf, S.; Hogarth, P.; Zanna, L.; Cheng, L.; et al. The Causes of Sea-Level Rise since 1900. Nature 2020, 584, 393–397. [Google Scholar] [CrossRef] [PubMed]
- Dangendorf, S.; Hendricks, N.; Sun, Q.; Klinck, J.; Ezer, T.; Frederikse, T.; Calafat, F.M.; Wahl, T.; Törnqvist, T.E. Acceleration of U.S. Southeast and Gulf Coast Sea-Level Rise Amplified by Internal Climate Variability. Nat. Commun. 2023, 14, 1935. [Google Scholar] [CrossRef]
- Sea Level Trends—NOAA Tides & Currents. Available online: https://tidesandcurrents.noaa.gov/sltrends/sltrends_station.shtml?id=8721604#tabmeantrend (accessed on 18 January 2025).
- Parkinson, R.W.; Wdowinski, S. A Unified Conceptual Model of Coastal Response to Accelerating Sea Level Rise, Florida, U.S.A. Sci. Total Environ. 2023, 892, 164448. [Google Scholar] [CrossRef]
- Resilient Cape Canaveral 2019. Available online: https://cms3.revize.com/revize/capecanaveral/document_center/Documents/Community%20Development/cocc_resilient_cape_canaveral_20190730.pdf (accessed on 18 January 2025).
- Resilient Cape Canaveral Action Plan. 2021. Available online: https://cms3.revize.com/revize/capecanaveral/document_center/Documents/Community%20Development/cocc_ced_sustain_resilient_cc_action_plan20210621.pdf (accessed on 18 January 2025).
- Florida Climate Center. Sea Level Rise. Available online: https://climatecenter.fsu.edu/topics/sea-level-rise (accessed on 21 January 2025).


| Years | 1950–1970 | 1999–2006 | 1998–2019 | 2016–2024 |
|---|---|---|---|---|
| Method | Leveling | Leveling | GNSS | InSAR |
| Cape Canaveral | −5 to −6 | −1 to −2 | −2.5 to −2.7 | −9 to 3 |
| Merritt Island | −3 to 3 | |||
| Peninsular Mainland | −0.8 to 0.1 (2004–2024) | −5 to 3 |
| Station | GNSS | InSAR | ||
|---|---|---|---|---|
| VLM (mm/yr) | Years | VLM (mm/yr) | Years | |
| CCV5 | −2.49 ± 0.32 | August 1998–September 2019 | −3.86 ± 0.33 | July 2016–June 2024 |
| CCV6 | −2.68 ± 0.78 | August 1998–September 2019 | −3.86 ± 0.33 | July 2016–June 2024 |
| TTVL | 0.10 ± 0.15 | July 2017–September 2024 | −1.15 ± 0.44 | July 2016–June 2024 |
| COKO | −0.81 ± 0.10 | February 2004–December 2009 | −1.58 ± 0.45 | July 2016–June 2024 |
Disclaimer/Publisher’s Note: The statements, opinions and data contained in all publications are solely those of the individual author(s) and contributor(s) and not of MDPI and/or the editor(s). MDPI and/or the editor(s) disclaim responsibility for any injury to people or property resulting from any ideas, methods, instructions or products referred to in the content. |
© 2025 by the authors. Licensee MDPI, Basel, Switzerland. This article is an open access article distributed under the terms and conditions of the Creative Commons Attribution (CC BY) license (https://creativecommons.org/licenses/by/4.0/).
Share and Cite
Sharma, A.; Wdowinski, S.; Parkinson, R.W. Coastal Subsidence in Cape Canaveral, FL, and Surrounding Areas: Shallow Subsidence Induced by Natural and Anthropogenic Processes. Land 2025, 14, 735. https://doi.org/10.3390/land14040735
Sharma A, Wdowinski S, Parkinson RW. Coastal Subsidence in Cape Canaveral, FL, and Surrounding Areas: Shallow Subsidence Induced by Natural and Anthropogenic Processes. Land. 2025; 14(4):735. https://doi.org/10.3390/land14040735
Chicago/Turabian StyleSharma, Anurag, Shimon Wdowinski, and Randall W. Parkinson. 2025. "Coastal Subsidence in Cape Canaveral, FL, and Surrounding Areas: Shallow Subsidence Induced by Natural and Anthropogenic Processes" Land 14, no. 4: 735. https://doi.org/10.3390/land14040735
APA StyleSharma, A., Wdowinski, S., & Parkinson, R. W. (2025). Coastal Subsidence in Cape Canaveral, FL, and Surrounding Areas: Shallow Subsidence Induced by Natural and Anthropogenic Processes. Land, 14(4), 735. https://doi.org/10.3390/land14040735