Article

Spatial and Temporal Analysis of Habitat Quality in the Yellow River Basin Based on Land-Use Transition and Its Driving Forces

1
School of Economics and Management, China University of Geosciences (Beijing), Beijing 100083, China
2
Key Laboratory of Coupling Process and Effect of Natural Resources Elements, Beijing 100055, China
3
Integrated Natural Resources Survey Center, China Geological Survey, Beijing 100055, China
4
Key Laboratory of Water Management and Water Security for Yellow River Basin, Ministry of Water Resources (Under Construction), Zhengzhou 450003, China
5
Xi’an Center of Mineral Resources Survey, China Geological Survey, Xi’an 710100, China
*
Author to whom correspondence should be addressed.
Land 2025, 14(4), 759; https://doi.org/10.3390/land14040759
Submission received: 25 February 2025 / Revised: 26 March 2025 / Accepted: 27 March 2025 / Published: 2 April 2025

Abstract

:
Land-use transition has diverse influences on habitat quality. At present, land-use patterns and habitat quality in the ecologically fragile Yellow River Basin are undergoing significant change. However, the relationship between land-use transition and habitat quality and the driving factors of habitat quality dynamics across the whole basin remain unclear. In this study, we utilized a land-use transition matrix and an InVEST model to analyze the dynamics of land use, habitat quality, and the relationship between the two in the Yellow River Basin from 2005 to 2020. The driving factors of habitat quality dynamics were explored with a spatial econometric model. The results showed the following: (1) The areas of farmland and grassland accounted for more than 70%, but decreased by 14,600 km2 and 2500 km2, respectively. The areas of forest and construction land increased by 1800 km2 and 16,900 km2, respectively. (2) The habitat quality showed a trend of decrease-then-increase. The areas of low value (0–0.2) were the largest, accounting for about 50% of the total area; the regions of relatively high (0.6–0.8) and high value (0.8–1) were small and scattered in the mountainous forest area, accounting for about 10%. (3) The habitat quality was the lowest in the land categorized as transitioning to construction, and highest in unchanged forest and in the land characterized as transitioning to forest. The coupling coordination degree of land-use degree and habitat quality showed a steady upward trend. (4) The growth rate in the value added by secondary industries, GDP per capita, population density, ecological-protection policy score, average annual temperature, and average annual precipitation were the primary factors affecting habitat quality. This study fills the gap in the analysis of the relationship between land-use transition and habitat quality across the whole Yellow River Basin; the work assists in the understanding of the ecological effects of land-use transition in the region and provides suggestions for the development of other densely populated and ecologically fragile areas.

1. Introduction

Since the 20th century, the transformation of the economy and society has led to continuous changes in the mode and intensity of the exploitation and utilization of land resources. Land-use patterns have changed significantly on a global scale, triggering problems such as resource constraints, landscape fragmentation, environmental pollution, and human–land conflicts [1,2,3,4]. The publication of the World Conservation Strategy in the 1980s made people aware of the seriousness of environmental pollution caused by resource exploitation. According to the Intergovernmental Science-Policy Platform on Biodiversity and Ecosystem Services (IPBES), the annual loss in ecosystem services due to land degradation exceeds 10% of the total global value, and the overall trend is not encouraging [5,6,7]. This shows that land-use transition greatly affects habitat quality. Against this background, countries pay close attention to the problems caused by high-intensity land use. They continuously promote land-use transition and improve agricultural and industrial technologies in the context of economic and social transformation, which helps to improve land-use efficiency and contributes to improving the quality of regional habitats [8,9,10]. Habitat quality refers to the ability of a natural geographic environment within a region to provide support for the sustainable development of individuals and society [11,12,13], which is a guarantee of sustainable development [14]. Land-use transition and habitat quality protection on this basis have become key paths towards the alleviation of human–land conflicts, improving the ecological environment, and achieving high-quality development.
Academic research on land-use transition and habitat quality has made progress (Figure 1). With regard to land-use transition, the British scholar Grainger [15] proposed the concept of land-use transition based on the concept of forest transition by Walker [16] and Mather [17]. Grainger defined land-use transition as the evolution of land-use patterns in spatial and non-spatial structures within a specific region. This concept was introduced into China by Long Hualou at the beginning of the 21st century and defined as “regional land use patterns corresponding to the stage of regional socio-economic development” [18,19,20]. Since then, scholars have conducted extensive studies on the concept [21], process [22,23], driving mechanism [24], and economic and environmental effects [25,26,27] associated with land-use transition. For example, Ge et al. defined land-use transition as the process in which regional land is transitioned from one form (including explicit form and recessive form) to another in a specific process of social and economic change. They also pointed out that recessive form involves multiple attributes such as land quality, property rights, and management mode [21]. By using transition amplitude, transition duration, and the Lorentz curve, Qu et al. measured the law of construction land transition in the middle reaches of the Yangtze River Economic Belt from 1990 to 2015; the results showed that the main source of construction land had changed from farmland to forest [23]. Biggs et al. explored the impacts of land access, water availability, amenity migration, and government policies on land-use transition in the western US [24]. Yuan et al. conducted a study on the spatio-temporal evolution of carbon storage driven by land-use transition in the Yiluo River Basin in the middle section of the Yellow River; the results showed that the carbon sequestration capacity was on a downward trend from 1990 to 2020 [25].
With regard to habitat quality, on the spatial scale of research objects, scholars have measured the habitat quality associated with countries [28,29], river basins [30,31,32], metropolitan areas [33], individual cities [34], and typical ecological reserves [35,36,37]. In terms of research methodology, the IDRISI model [38], the InVEST model [39,40,41], the SoLVES model [42], and the establishment of an evaluation index system [43] are common tactics. Among them, the InVEST model is widely used because it can realize the spatial expression of the ecosystem service function. For example, Zheng et al. used the InVEST model to explore the spatio-temporal dynamics of habitat quality in the Yellow River Basin and Yangtze River Basin from 2005 to 2018 under the background of urbanization and industrialization. The authors confirmed the trend of landscape fragmentation and habitat degradation in the study area. They also verified that the economically developed coastal and urban agglomerations had lower habitat quality [39]. Sun et al. analyzed habitat quality and its driving factors in the Shandong Province of China in the past 40 years with the InVEST model and put forward suggestions based on the situation of the study area [40]. Zhang et al. analyzed the spatio-temporal dynamic characteristics of habitat quality in Hainan Tropical Rainforest National Park (HTRNP) and nine surrounding cities and counties in China with the InVEST model. In combination with determination of the landscape pattern, the authors systematically analyzed the ecological status of the study area [41]. In terms of factors affecting habitat quality, scholars have conducted significant research on socio-economic factors, such as GDP, population density, traffic, and location [44,45]. Natural factors such as land-use patterns, climate, elevation, and slope were also fully considered [46,47]. For example, Sallustio et al. explored habitat quality in Italy using the InVEST model and confirmed that habitat quality increased where the level of protection was higher [29]. With the help of continuous change detection and classification (CCDC) algorithms, Zhang et al. explored the impacts of dominant tree species on ecosystem assessment in the Three Gorges Reservoir area in China [35]. Shiksha et al. explored the impacts of population, internal migration, and development projects on land use in Bagmati Basin, Nepal, and then explored the effects of land-use transition on ecological environment, using the InVEST model [45].
The Yellow River Basin is an important ecological barrier and economic development belt in China, occupying an important position in the strategic layout of China’s ecological civilization and modernization. However, the level of development within the basin varies greatly, with the upstream region both lagging with respect to economic development and demonstrating ecological fragility, while the middle and lower regions are economically developed and densely populated [48,49]. Rapid urbanization and industrialization have brought about environmental pollution, declining biodiversity, and other problems, making human–land conflicts and ecological problems prominent within the basin. The Communist Party of China and the State Council issued the Outline of Ecological Conservation and High-quality Development Plan for the Yellow River Basin in 2021, which put forward requirements for strengthening the water conservation capacity in the upstream region, soil and water conservation capacity in the midstream region, and wetland protection capacity in the downstream region [50]. The Yellow River Protection Law adopted in 2022 re-emphasized these guidelines for land use within the control area of the Yellow River mainstreams and tributaries and strengthened the protection of biodiversity. Under the guidance of a series of policies, many cities have promulgated land-use and environment-related policies to promote high-quality regional development [51,52,53].
Habitat quality measurement based on land use has become a key focus in academic research. The current study focuses on the dynamics and driving factors of habitat quality based on land-use transition. On the whole, scholars mainly conduct research on regions with developed economies and complete sets of statistical data. Moreover, land-use transition and habitat quality are affected by national policies and economic development. But current research is inclined towards assessments of the natural factors [29,34,54,55,56]. Therefore, the innovation of this paper mainly lies in the following: Firstly, the impact of land-use transition on habitat quality was fully considered. We explored how the transitions in farmland, forest, and grassland impact on habitat quality, filling the gap in the study of the relationship between land-use transition and habitat quality in the Yellow River Basin. Secondly, the Yellow River Basin spans three major regions in China, and the distribution of economic development, population, natural resources, and environmental factors is unbalanced. Therefore, we explored the dynamics of land-use transition and habitat quality across the whole basin to provide suggestions for high-quality development. Thirdly, in the selection of driving factors, the influence of policy factors was fully considered. Referring to Tian [57], we collected policies mentioning the ecological environment from PKULAW (https://www.pkulaw.com/, accessed on 27 July to 15 August 2024) and municipal governments and summed their associated scores to measure the impacts of policy promulgations. Due to the large number of resource-based cities in the Yellow River Basin, we selected sulfur dioxide (SO2) emissions initiatives as a representative policy implementation. Finally, as the first law of geography states, “The closer the distance, the greater the correlation”. So, we fully considered the spatial correlations among driving factors and utilized a spatial econometric model to measure how and to what extent natural, socio-economic, and policy factors affected habitat quality.
This paper takes 62 cities in the Yellow River Basin as its research object. The analysis considered land-use transition in the basin from 2005 to 2020, the spatio-temporal dynamics of habitat quality, and the relationship between the two, as measured with the habitat quality module of the InVEST model. An evaluation index system with three dimensions, including nature, social economy, and policy score, was constructed to explore the factors driving habitat quality change with respect to the spatial econometric model. The objectives of this study were to (1) map and identify the spatio-temporal characteristics of land-use transition and habitat quality change in the Yellow River Basin from 2005 to 2020; (2) investigate how land-use transition, natural factors, socio-economic factors, and government policies impact habitat quality; and (3) provide suggestions for promoting land-use transition and improving habitat quality.

2. Materials and Methods

2.1. Overview of the Study Area

The Yellow River is called the Mother River of China, located at 32–42° N, 96–119° E (Figure 2). It originates from the BaYanKaLa Mountains on the Qinghai–Tibet Plateau in the west and crosses three steps of the terrain from west to east, including the Qinghai–Tibet Plateau, Inner Mongolia Plateau, Loess Plateau, Qilian Mountains, Helan Mountains, Taihang Mountains, and the North China Plain. The Yellow River flows through Qinghai, Sichuan, Gansu, Ningxia, Inner Mongolia, Shaanxi, Shanxi, Henan, and Shandong. It flows into the Bohai Sea in Kenli County of Shandong Province, with a total mainstream length of 5464 km. The geographic spatial span of the basin is large, and given the influences of monsoons and atmospheric circulation, the temperature and precipitation in different areas vary greatly. The average annual temperature at the northern foot of the BaYanKaLa Mountains is −4 °C, while that of the Yellow River Delta at its estuary is 14 °C. The annual precipitation in most areas is 200–600 mm, but the precipitation in Ningxia, Gansu, and other places is less than 150 mm. The upstream region is rich in hydropower resources, and the midstream and downstream regions are rich in mineral resources, which occupy an important position in the national resource reservation and development.
The Guiding Opinions on Promoting the Development of the Yangtze River Economic Belt by Relying on the Golden Waterway, issued in 2014, included Sichuan Province in the national strategy of the Yangtze River Economic Belt [58]. The Yellow River flows through the Aba Tibetan and Qiang Autonomous Prefectures and the Tibetan Autonomous Prefecture of Garzê in Sichuan in the upstream, which therefore have a relatively small impact on the development of the basin. In addition, the upstream Yushu Tibetan Autonomous Prefecture, Golog Tibetan Autonomous Prefecture, Hainan Tibetan Autonomous Prefecture, Huangnan Tibetan Autonomous Prefecture, Gannan Tibetan Autonomous Prefecture, and Alxa League lack social and economic data and are temporarily not included in the scope of research. Therefore, this paper takes 62 cities in the remaining eight provinces as its research object to explore the characteristics associated with land-use transition, habitat quality, and their relationship, ranging from 2005 to 2020.

2.2. Data Sources and Processing

The data sources in this paper are shown below (Table 1). These are mainly divided into three parts: The first part encompasses land-use data for four periods from 2005 to 2020, and administrative district data for the study area. Land-use data are sourced from the Resource and Environment Science Data Platform of the Chinese Academy of Sciences (https://www.resdc.cn/DOI/, accessed on 28 July 2024). This study focuses on the impact of land-use transition on habitat quality. Real-world experience and academic research have proved that land-use transition is not significant in such a short period of time in China [32,34,59], so a five-year interval is selected. The administrative district data are sourced from the National Platform for Common GeoSpatial Information Service (https://www.tianditu.gov.cn/, accessed on 5 to 7 July 2024). The map of the study area is based on the standard map service website GS (2024) 0650 of the Ministry of Natural Resources, and the boundaries of the base map have not been modified. In light of the research needs, land-use data were reclassified into six categories, including farmland, forest, grassland, water area, construction land, and unused land, according to Liu Jiyuan’s [60] classification standard. Second, referring to the research of Liu and Li et al. [61,62,63], this paper explored the factors affecting habitat quality from three dimensions: nature, socio-economic factors, and policy. Socio-economic data are derived from the Municipal Statistical Yearbook and Bulletin, and the natural indicators are from the same source as the land use data. Third, considering that land-use transition in regions with low levels of market-based economic development shows an obvious policy-based orientation, the impacts of ecological-protection policies on habitat quality are measured. Policy data are collected from the municipal government websites and PKULAW (https://www.pkulaw.com/, accessed on 27 July to 15 August 2024).

2.3. Research Framework

Habitat quality is an important index to consider when evaluating the carrying capacity of regional ecosystems, and land use is one of the most important factors affecting habitat quality [64]. The overview of the research idea is as follows (Figure 3): The first step is data preparation and processing. The datasets were downloaded from the websites shown above (Table 1). All of the raster data were clipped according to the research area, the resolution was converted to 1 km, and the coordinate system was unified as WGS_1984_UTM_Zone_49N. The analyses of the social and economic data utilized dimensionless processing. Secondly, the land-use transition of 62 cities from 2005 to 2020 was calculated using a land-use transition matrix. Thirdly, the InVEST model was utilized to assess the habitat quality in the study area, and the relationship between these two considerations was explored. Finally, the spatial econometric model was used to measure the driving factors of habitat quality dynamics. The results are visualized with the ArcGIS10.8 software.

2.4. Research Methodology

2.4.1. Land-Use Transition Matrix

The measurement of land-use transition is achieved using a land-use transition matrix, which is derived from the quantitative analysis of system states and state transition in systems analysis [65]. The expression is given below:
A i j = A 11 A 12 A 1 n A 21 A 22 A 2 n A n 1 A n 2 A n n
In the formula, i and j are land-use types, A i j is the probability that type i is converted to type j, and n is the number of land-use types.

2.4.2. Land-Use Degree

With the deepening of land utilization and exploitation, scholars pay extensive attention to the evaluation of land-use degree. At present, the relatively mature method is to divide land-use types into 4 categories and assign grading indices [66,67] (Table 2). The formula is as follows:
L j = 100   ×   i = 1 n A i × C i
In the formula, L j is the comprehensive index of land-use degree, A i is the grade i land-use degree classification index, C i is the proportion of the grade i land-use degree classification area, and n is the number of land-use degree classifications.
Table 2. Classification of land-use degree for different land-use types.
Land-Use TypesUnused LandForest, Grassland, and Water AreaFarmlandConstruction Land
1234

2.4.3. The InVEST Model

The habitat quality module of the InVEST model is based on land-use data, and the module’s level of influence is associated with threat sources [68]. It assumes that areas with high habitat quality host higher levels of biodiversity, and vice versa [69]. This module contains four functions, namely, relative impact of threat sources, sensitivity to threat sources, distance between raster and threat sources, and unit protection level. In addition to the conventional threat source of construction land, we fully considered the threat of farmland. The area of farmland in the middle and lower reaches of the Yellow River Basin is large. The farmland is less capable of maintaining biodiversity than are the forest and grassland, and the extensive use of pesticides and mulch film in the development of modern agriculture has caused greater harm to the ecological environment. In addition, combined with the reality of the Yellow River Basin, there are vast amounts of unused land in the upper and middle reaches. The bare surface also poses a threat to the habitat quality. Therefore, on the basis of its aim to fully consider the actual situation of the study area, this paper identifies 5 threat factors: farmland, rural settlements, urban construction land, other construction land, and unused land. Lastly, we determined the parameters of the threat source factor and the parameters of the sensitivity table based on considerations of the current development status of the study area, the user manual of the InVEST model, and related studies [59,70,71,72,73] (Table 3 and Table 4).

2.4.4. Coupling Coordination Degree Model

Coupling degree is an index used to analyze the degree of interaction between two or more elements, and coupling coordination degree is a model used to analyze the coordination between elements on the basis of a coupling degree calculation. Referring to relevant studies, the coupling coordination degree is divided into 6 levels [74,75] (Table 5). The formula is as follows:
C = 2 f x g ( x ) f x + g ( x )
T = αf (x) + βg (x)
D = C × T
In the formula, C is the coupling degree of land-use degree and habitat quality, f (x) is the land-use degree, and g (x) is the habitat quality. T is the comprehensive coordination index of land-use degree and habitat quality. Considering that land-use degree and habitat quality are equally important, we set α = β = 0.5. D is the coupling coordination degree of land-use degree and habitat quality, which ranges from 0 to 1.
Table 5. Evaluation standard for the coupling coordination degree between land-use degree and habitat quality.
Coupling Coordination DegreeTypeCoupling Coordination DegreeType
0 ≤ D < 0.2Severe disorder0.5 ≤ D < 0.6Primary coupling coordination
0.2 ≤ D < 0.4Moderate disorder0.6 ≤ D < 0.8Medium coupling coordination
0.4 ≤ D < 0.5Mild disorder0.8 ≤ D ≤ 1High coupling coordination

2.4.5. Principles and Selection of Driver Models

Variables with high collinearity were excluded using the correlation analysis of the SPSS27.0 software, and 11 variables were retained after the exclusion of elevation, slope, and river network density. To overcome the influence of spatial correlation [76], ordinary least squares regression (OLS) was performed first. OLS was directly used when there was no spatial correlation; otherwise, a spatial econometric model was used. The spatial correlation test was conducted in STATA17.0. The Moran’s I was 0.678, indicating a significant spatial correlation and requiring the use of spatial econometric model. The following three models were used in this study [77]:
(1)
Spatial Error Model (SEM)
This model assumes that perturbations in one space affect other spaces through spatial effects, and is expressed in the following:
Y = X β + ε
ε = φ W ε + μ
In the formula, Y is the dependent variable, X is the independent variable, β is the regression residual coefficients, ε is the error term influenced by adjacent region, φ is the spatial error term coefficient, W is the spatial matrix, and   μ is the random error vector of a normal distribution.
(2)
Spatial Lag Model (SLM)
This model assumes that a variable is affected by its own explanatory variable and variables in other spaces, and is expressed in the following equation:
Y = ρ W Y + X β + ε
In the formula, ρ is the coefficient of the spatial lag term, and the other coefficients are the same as in Formulas (6) and (7).
(3)
Spatial Durbin Model (SDM)
This model considers the spatial correlation for both the independent and dependent variables. When the SEM and SLM both pass the significance test, the SDM can be utilized for analysis [78]. The expression is as follows:
Y = ρ W Y + X β + W X ¯ γ + ε
In the formula, X ¯ is the matrix of explanatory variables, γ is the parameter vector, and the other coefficients are the same as in Formulas (6) and (7).
The Wald test and LR test in this paper show that the SDM will not degenerate into SEM or SLM. Therefore, the analysis is carried out utilizing the SDM.

2.4.6. Quantitative Model of Policies

Policy is the product of socio-economic development, and socio-economic development is an important factor determining the content of policies [79]. With the increasing number of land policies, scholars have begun to explore and improve the methods of policy quantification. This study, referring to Tian [57], determined that the cities that have promulgated ecological-protection policies are given 1 point; if the policies are promulgated by the municipal People’s Congress, the city is given 2 points.

3. Results

3.1. Spatial and Temporal Evolution of Land Use

The land use in the Yellow River Basin from 2005 to 2020 is described as follows (Figure 4 and Table 6). Farmland, forest, and grassland are the main land-use types in the region. Farmland is intensively distributed in the downstream region of Henan and Shandong, and also in the midstream region near Shaanxi and Shanxi. Forest is mainly distributed in the Qilian Mountains in northern Qinghai, the northern foothills of the Tsinling Mountains in southern Shaanxi, the Luliang Mountains in western Shanxi, and the Taihang Mountains in the east. Grassland has the widest distribution area and is mainly distributed in the midstream and upstream regions, including southeastern Gansu, the Inner Mongolia Autonomous Region, the Loess Plateau, etc. The water area does not change significantly. Construction land is concentrated in the midstream and downstream regions, and the area increased. Unused land is mainly distributed in Wuwei City in the north of Gansu, and Bayannur City and Ordos City in Inner Mongolia.
The land-use transition in the study area from 2005 to 2020 is described as follows (Figure 5 and Table 7), with the most obvious transitions being associated with farmland, forest, grassland, and construction land. The transition area of grassland is the largest, and transitions into and out of these designations mainly occur in farmland and forest. The area transitioning out of grassland is larger than the area transitioning in. The transition area of farmland is the second largest, and the area of transitioning out is larger than that of transitioning in. The direction of transitioning out is greatest in forest, grassland, and construction land. The transition area of forest ranks third, with the transition-in area slightly larger than the transition-out. The area of the land transitioning into construction land is larger than the area transitioning out; this mainly occurs in Shanxi, Henan, and Shandong Provinces.

3.2. Habitat Quality Assessment

Based on the Equal Interval Classification of the ArcGIS10.8 software, the habitat quality of the study area from 2005 to 2020 was classified into five grades: low (0–0.2), relatively low (0.2–0.4), medium (0.4–0.6), relatively high (0.6–0.8), and high (0.8–1.0).
From the perspective of temporal evolution trends, the habitat quality first declined and then increased (Table 8). From 2005 to 2015, the habitat quality declined continuously. The area of relatively-low and low value was dominant, with the combination of the two accounting for greater than 60% of the total, while the area of relatively-high and high value accounted for only about 10%, indicating that the habitat quality was generally not ideal during this period. From 2015 to 2020, the habitat quality increased, and the area of relatively-low and low value decreased. The area of medium, relatively-high, and high value showed an increasing trend, among which the medium-value zones increased most obviously.
From the perspective of spatial evolution trends, the spatial differentiation of habitat quality was obvious. The area of relatively-low and low value of habitat quality was always the largest, while the area of relatively-high and high value zones was small and fragmented (Figure 6). Habitat quality was highest in the south, and the high-value area was mainly distributed in Qinghai near the Qilian Mountains, southern Gansu, and the Tsinling Mountains in Shaanxi. In addition, the habitat quality is high in the vicinity of the Yinshan Mountains in Inner Mongolia in the north, the Luliang Mountains, and the Taihang Mountains in Shanxi in the east. The area with a low value was distributed in eastern Gansu, Bayannur, and Ordos in southwestern Inner Mongolia, northern Ningxia, and downstream of North China Plain, among which the unused land in eastern Gansu, Bayannur, and Ordos in Inner Mongolia is widely distributed; some typical regions include the Tengger Desert, Ulanbuh Desert, Mu Us Desert, and Kubuqi Desert, which have low vegetation coverage. Habitat quality was the lowest in northern Ningxia and downstream of North China Plain.

3.3. Analysis of Relationship Between Land Use and Habitat Quality

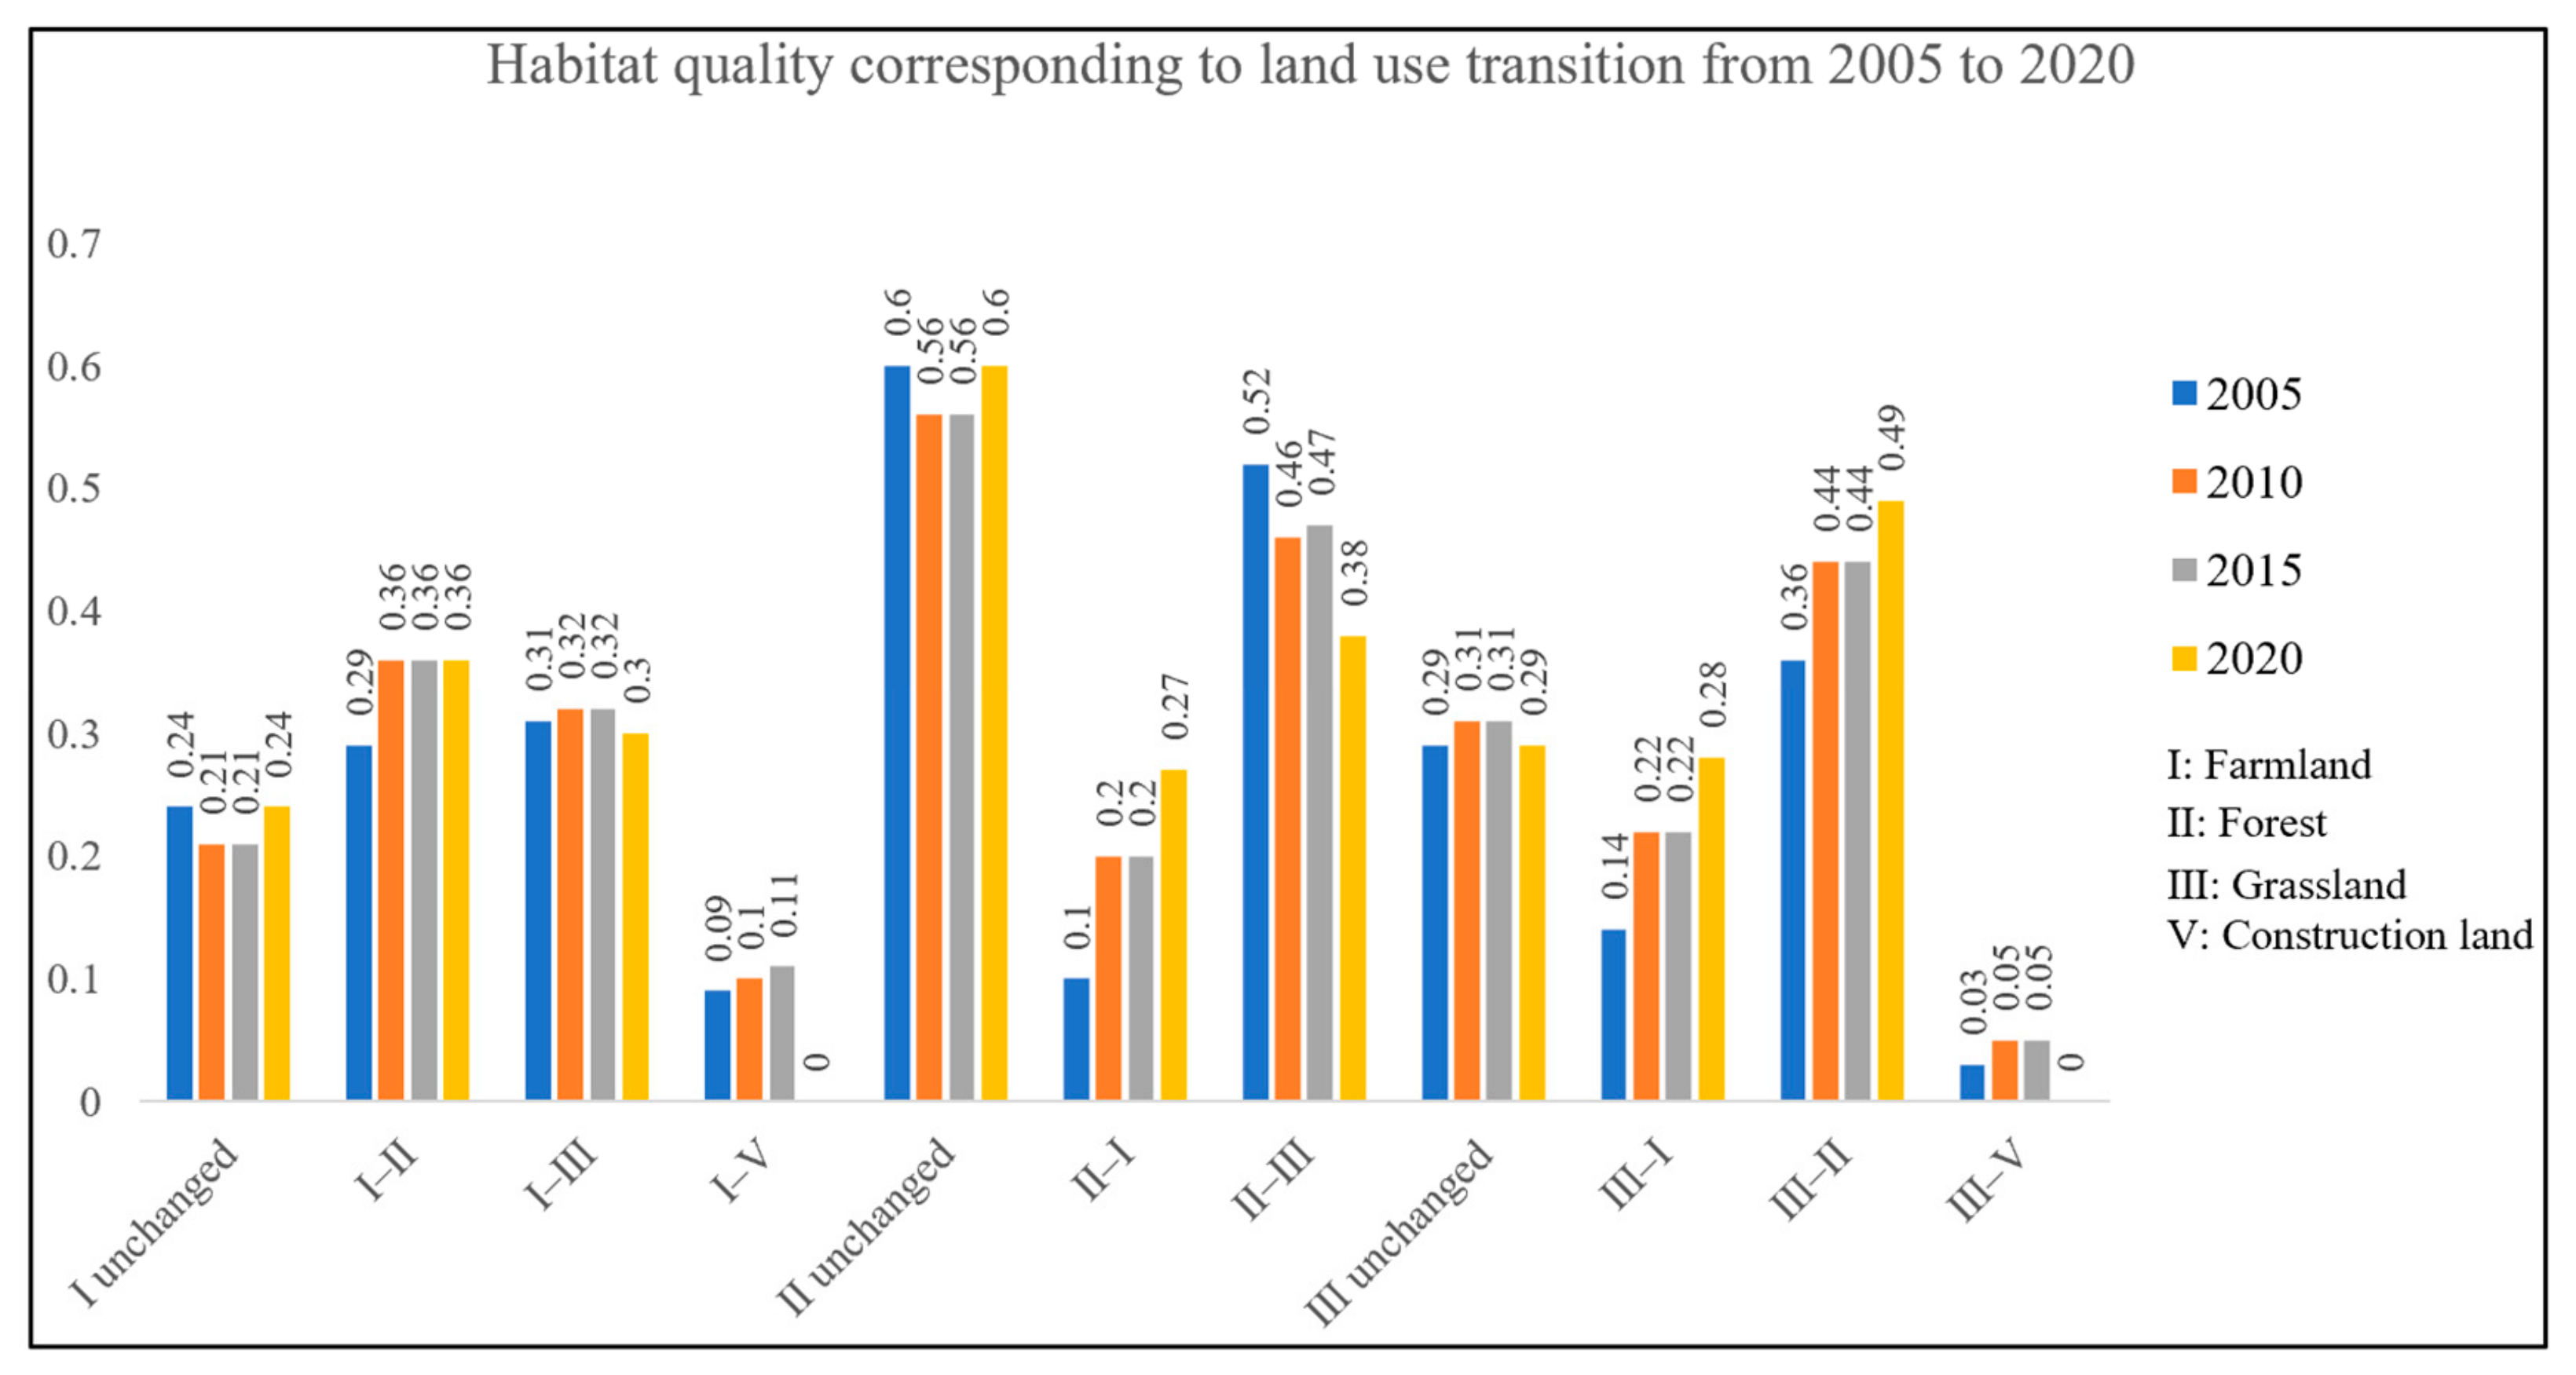
3.3.1. Habitat Quality Analysis Based on Land-Use Transition

To clarify the impact of land-use transition on habitat quality, before analyzing the specific factors affecting habitat quality, we first explored the impact of land-use transition. In this study, the habitat quality of land not characterized by transition was used as the background value, and the habitat quality of land associated with transition was compared with it to explore the impact of land-use transition on habitat quality. In the process of rapid urbanization and industrialization, construction land and industrial and mining land in the Yellow River Basin showed a disorderly expansion in the early 21st century. Land-use efficiency can influence habitat quality. This paper measured the habitat quality in correspondence with the transition occurring among the four major land-use types from 2005 to 2020 (Figure 7).
The habitat quality was always the highest when forest remained unchanged, or when other land-use types transitioned into forest. In this case, a habitat quality score above 0.56 was maintained, which was the highest level associated with these transitions. The transition to grassland also improved the habitat quality. It can be seen that the transition of farmland and forest to grassland could bring different degrees of improvement in the habitat quality. Habitat quality was at its third highest when farmland remained unchanged or other land-use types transitioned into it, which may be related to the carrying capacity that farmland itself has. Habitat quality was always the lowest during transitions to construction land.

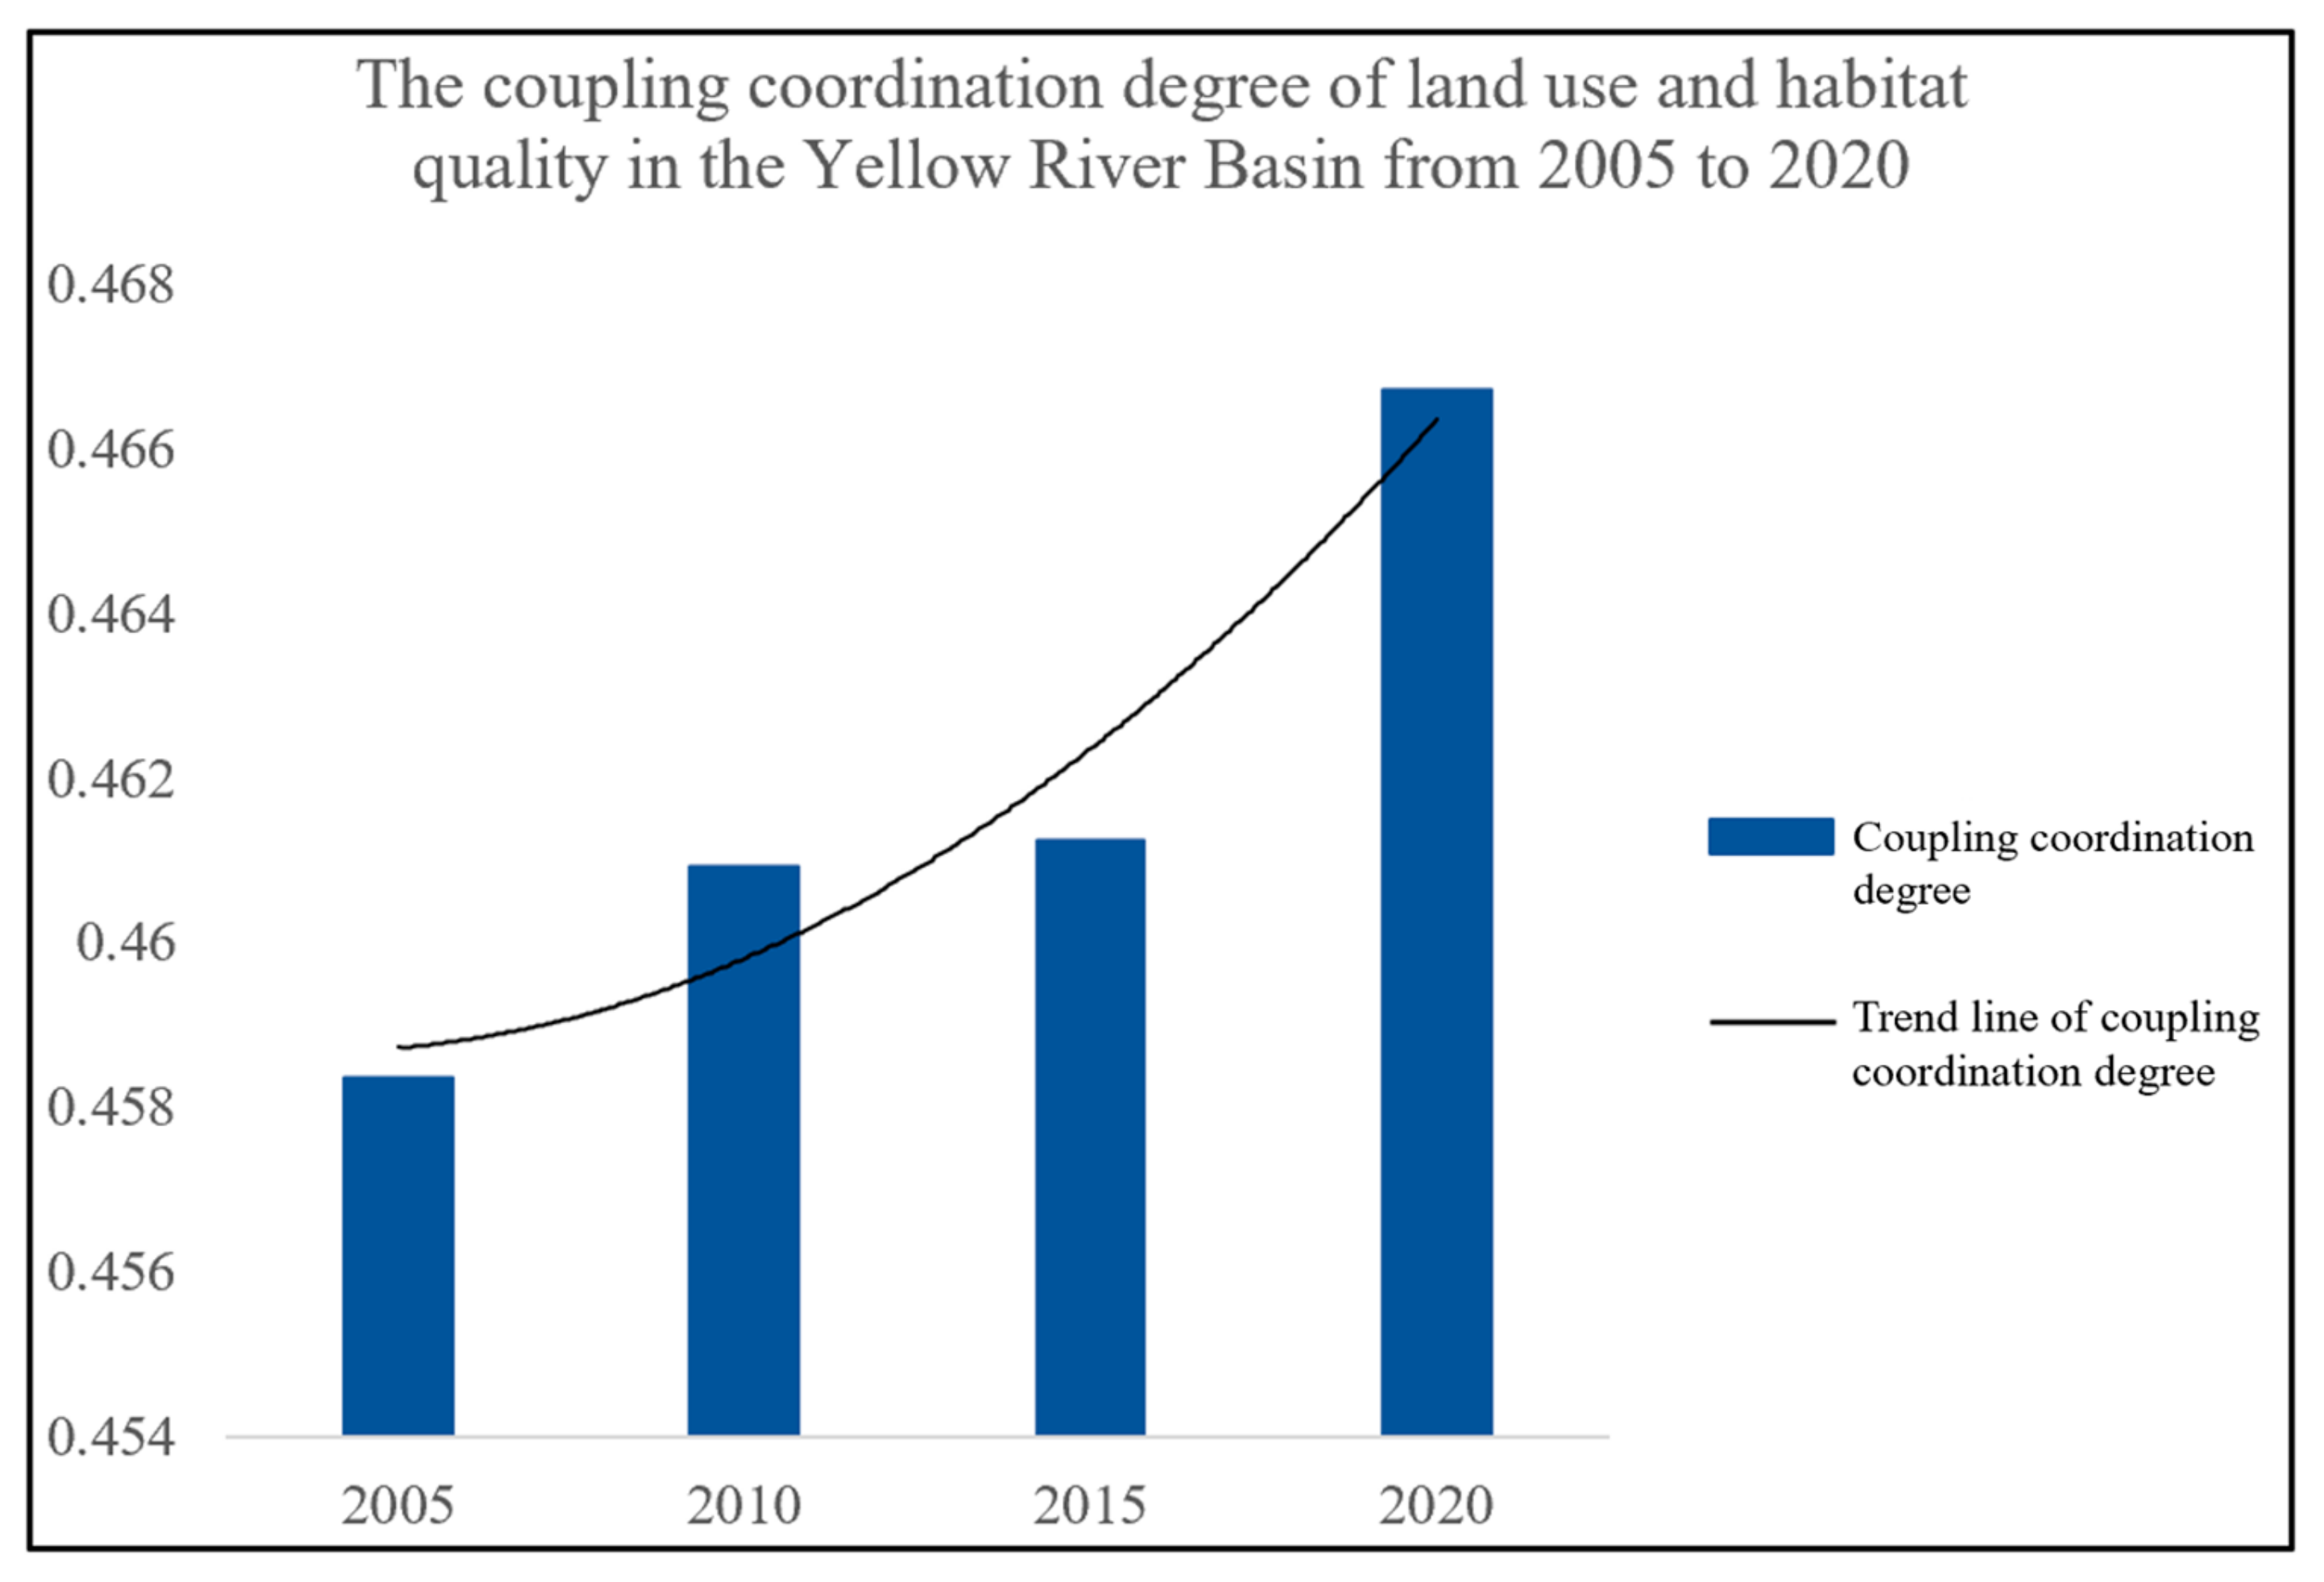
3.3.2. Coupling Coordination Degree Between Land-Use Degree and Habitat Quality

In terms of the temporal dimension, the coupling coordination degree of land-use degree and habitat quality in the region showed a steady upward trend from 2005 to 2020, but the overall level was in a disorderly state and did not reach the primary coupling coordination state (Figure 8).
In terms of spatial dimension, the coupling coordination degree determined for the land-use degree and habitat quality from 2005 to 2020 did not change much, but did show significant spatial heterogeneity; namely, it was high in the south and low in the north (Figure 9). During the study period, the coupling coordination degree between the two was low in Inner Mongolia and other places in the north, while high in southern Gansu, south-central Shaanxi and south-central Shanxi; in particular, the coupling coordination degree of Luoyang city was always the highest. These values were 0.574, 0.576, 0.575, and 0.579, respectively. Meanwhile, the coupling coordination degree of Binzhou City on the Shandong Peninsula had the fastest growth rate; this value increased by 22.79% during the study period.

3.4. Analysis of Driving Factors of Habitat Quality Differentiation

To overcome the influence of collinearity on the results, this paper first conducted a collinearity test on the variables with the SPSS27.0 software. We eliminated the variables with collinearity |r| ≥ 0.75. Finally, 10 variables, excluding elevation, slope, and river network density, were retained (Table 9).
The driving effects of specific variables on habitat quality are as follows: The habitat quality correlated significantly with the growth rate of the value added by secondary industry, GDP per capita, population density, ecological-protection policy score, average annual temperature, and average annual precipitation (Table 10). The growth rate of the value added by secondary industry, GDP per capita, and average annual temperature correlated negatively with habitat quality. The negative impact of the growth rate of the value added by secondary industry and GDP per capita on habitat quality may be described as follows: First, there are many resource-based cities in the Yellow River Basin, and the industrial structure is not reasonably constructed. The value added by secondary industry accounts for a relatively large proportion of the whole. However, resource-based industries, which mainly focus on resource exploitation and consumption, bring serious environmental problems. Secondly, the increase in GDP per capita indicates the aggregate economic growth to some extent. Economic development not only means the exploitation and consumption of resources, but also shows the environmental problems caused by resource utilization. In the Yellow River Basin, where resource-based industries play an important role, emissions of sulfur dioxide (SO2) are not completely treated, which can negatively impact habitat quality. With the increasing trend towards global warming, the melting of the permafrost layer at the river’s source, the wilting of large areas of forest, and the destruction of ecosystems will burden the habitat quality. Population density, ecological-protection policy score, and average annual precipitation are positively related to habitat quality. In theory, human activities have a negative impact on habitat quality, but the study in this paper shows that population density has a positive impact on habitat quality. The reason for this may lie in the following considerations: based on the available data, most of the city samples selected in this paper have a high level of economic development. In the process of economic development, the comprehensive quality of the residents is improved, so the population density may become a positive factor; this, however, needs to be further verified. The cities in the basin have promulgated and implemented ecological-protection policies in the context of the deepening of systemic political reform and socio-economic restructuring, which has played a prominent role in improving the ecological environment. Increasing levels of precipitation provide sufficient water for species to grow in the basin and ensures biodiversity. Especially for arid and semi-arid areas, adequate precipitation also improves the atmospheric environment and enhances habitat quality.

4. Discussion

4.1. The Impact of Land-Use Transition on Habitat Quality in the Yellow River Basin

Land-use transition in the Yellow River Basin is a key issue concerning ecological protection and high-quality development. Habitat quality is affected by habitat suitability. Since the habitat suitability values of forest, grassland and water areas are higher than values associated with construction land and unused land, the temporal and spatial distributions of habitat quality in the region are highly correlated with the land-use pattern. The habitat quality was higher in the central and southern part of the study area, which was characterized by mountains. Mountain areas have high rates of forest and grassland coverage, which function better in purifying air and maintaining biodiversity [80,81,82]. In contrast, the habitat quality was lower in the northwestern and eastern parts, which were mainly covered by unused land and construction land, respectively. The expansion of construction lands destroyed the original ecosystem and threatened biodiversity, and also meant that the development of the industrial and mining industries contributed to air and water pollution. From 2005 to 2020, land use in the basin underwent significant transition, and the total area of the forest, grassland and water areas slightly increased, so the habitat quality improved. However, it should also be noted that with the rapid social and economic development, especially the accelerated development of the Strategy for Large-scale Development of Western China and The Rise of Central China strategy, the rapid economic development of the study area led to a continuous increase in construction land. So, the improvement in habitat quality was not significant. This is consistent with the research results of Chen et al. on urban expansion and habitat quality change in the Shanghai Pilot Free-Trade Zone [83]. The relationship between land-use transition and habitat quality showed that the transition to construction land always corresponded to the lowest habitat quality. The habitat quality of farmland transitioning to construction land fluctuated between 0.09 and 0, and the habitat quality of forest transitioning to construction land fluctuated between 0.03 and 0, which were both lower than the habitat quality of farmland and forest. The construction land area increased by 1500 km2, 5000 km2, and 10,400 km2 in 2005–2010, 2010–2015, and 2015–2020, respectively, suggesting that the accelerated process of urbanization from 2005 to 2020 and the decline in habitat quality caused by construction land expansion should be paid attention to in the context of future continuous economic development. In particular, the midstream and upstream regions were densely populated, with prominent human–land conflicts and a high degree of land exploitation. Thus, the relatively-high and high value areas of habitat quality were fragmented, and the degree of fragmentation increased with economic and social development. This is consistent with the research of Du et al. on the landscape of the Yellow River Basin [84].
The analysis of driving factors of habitat quality showed that growth rate of value added by secondary industry, GDP per capita, population density, ecological-protection policy score, average annual temperature, and average annual precipitation were the main variables affecting habitat quality. Relevant studies have shown that natural factors such as temperature and precipitation have a significant impact on habitat quality. Under the influence of global warming trends, both temperature and precipitation in the Yellow River Basin showed a fluctuating upward trend. The rising temperature caused the melting of glaciers and the wilting of vegetation in the source area, while increasing precipitation might improve the atmospheric environment, provide sufficient water for biological growth, and maintain biodiversity [85,86]. The growth rate of the value added by secondary industry and GDP per capita correlated negatively with habitat quality. Socio-economic conditions reflecting economic development and urbanization expansion have a significant negative impact on habitat quality. According to the Petty–Clark Theorem, the development trend of industrial structure is “one-two-three”, implying that the continuous expansion of construction land will directly or indirectly occupy forest and grassland and lead to a decline in habitat quality [87,88,89]. Population density and habitat quality were correlated positively. This may be because the improvements of the overall quality of the residents have gradually offset the negative impact of overpopulation. In addition, this may also be related to the continuously low population-growth rate observed in the Yellow River Basin since the beginning of the 21st century [90,91,92]. The ecological protection policy score was correlated positively with habitat quality. Since the 18th National Congress of the Communist Party of China, China has strengthened institutional safeguards in order to implement certain policies which have effectively protected the natural ecological environment and improved regional habitat quality [93]. With the passage of time, the influence of socio-economic factors on habitat quality became more significant. Notably, local policies have been gradually strengthened with the deepening reform of the national political system. These policies have a significant positive impact on the improvement in habitat quality. Relevant studies have also strongly proved the impact of policy constraints on improvements in habitat quality [94,95]. Therefore, it is of great necessity to rationally plan land use and adjust socio-economic development with the guidance of policy constraints.

4.2. Suggestions for Optimizing Future Land Use in the Yellow River Basin

The Outline of Ecological Conservation and High-quality Development Plan for the Yellow River Basin and the Yellow River Protection Law put forward higher requirements for ensuring food security and improving the ecological environment. These initiatives clearly stipulated the demarcation of permanent basic farmland, red lines of ecological protection and urban development boundaries, and the optimization of territorial spatial layout. So, the future development and protection of the Yellow River Basin is a comprehensive process. By the end of 2023, the total population of the eight provinces reached 340 million. A sufficient population will provide sufficient talent and a workforce for economic development. However, with an aging population and the disappearance of demographic dividends, excessive population density also places pressure on regional development. Meanwhile, as an “energy basin” in China, the Yellow River Basin has 75 resource-based cities in eight provinces, accounting for 28.63% of the total number in China. Highly energy-consuming and highly polluting industrial projects have resulted in serious environmental pollution and geological hazards. The contradictions among resource exploitation, economic development, and ecological protection have become more prominent [96,97]. To improve the habitat quality in the basin, it is necessary to standardize the resource-based industries and achieve industrial transformation and green development.
Facing the new requirements of economic development, the Yellow River Basin and other densely populated regions should accelerate land-use transition and improve habitat quality. Firstly, in terms of quantity and the spatial structure of land use, the development should be based on national spatial planning. It is necessary to promote the intensive use of land and rationally control the area of construction land. There are many resource-based cities in the Yellow River Basin, and the development of cities requires certain amounts of urban construction land, industrial and mining land, and transportation land. To improve the habitat quality, it is of great importance to guide and regulate the scale of urbanization according to the resource endowments and environmental carrying capacity. There are several super-large cities in the Yellow River Basin. To achieve reasonable public-service supply, a suitable population density and city size can be achieved by evacuation [98]. This requires the renewal of household registration policies, house purchase policies, and education policies. Controlling the scale of construction land is not to prohibit the expansion, but to revitalize the stock, strictly control the increment, and optimize the urban spatial layout and functional form. Secondly, appropriate areas of farmland, forest, and grassland should be ensured. Avoid “occupying high-quality farmland and supplementing poor-quality land” in farmland occupancy and complementary balancing. Support high-quality development based on aspects of factor allocation, zoning control, and strategic direction [99]. In addition, the analysis of habitat quality based on land-use transition showed that the habitat quality of forest and grassland converted to farmland did not decrease. So, there is no need to worry too much about the decline of habitat quality caused by the transition of forest and grassland to farmland. In the context of severe global food security problems, especially given the rapid economic development of countries in the world, the occupation of high-quality farmland by construction land leads to farmland fragmentation, farmland degradation, and other problems; these have caused severe food security problems. Countries should promote agricultural production technology and promote the integration of agricultural land [100]. For example, with the aim of realizing agricultural mechanization, regionalization, and specialization, the United States has established a legal regime defined by the Agricultural Adjustment Act. By taking soil quality and land mass into consideration, the scope of farmland protection has been demarcated, and measures have been taken to deal with the threats faced by the agricultural sector [101]. In the context of the reduction of farmland, the Chinese government has repeatedly emphasized the optimization of territorial spatial planning to ensure high-quality economic development while maintaining the “red line” of farmland and ecological protection [102,103,104,105]. Meanwhile, existing farmland should be gradually converted into high-quality farmland in an orderly manner to increase grain production per unit area and ensure food security within the region and the country. Thirdly, in terms of land-use functions, attention should be paid to the comprehensive use of land to improve the land-use efficiency and exert the functions of economic development, social support, and ecological maintenance. Fourthly, based on the history and reality of development, it can be seen that socio-economic factors have a stronger impact on land-use transition than does physical geography. Countries and regions with unreasonable industrial structures should convert their industrial structure to increase the economic output per unit area. Finally, the implementation of ecological-protection policies played a prominent role in the improvement in habitat quality. Therefore, countries should give full play to the guiding and constraining roles of laws and policies to ensure food security and the protection of ecology and the environment while ensuring high-quality economic development in their future development. With the ecological and food issues being faced by the world, all countries in the world should form joint efforts to promote the sustainable development of our earth. However, it should also be realized that collaborative governance is faced with problems caused by the unequal status of various subjects, different goals, and multiple centers of management. Therefore, to achieve effective collaborative governance, it is necessary to first establish a standardized decision-making mechanism, an effective communication mechanism, an open information-sharing mechanism, and a scientific supervision mechanism.

5. Conclusions

Based on the land-use transition matrix and the InVEST model, we quantitatively analyzed the temporal and spatial characteristics of land-use transition, habitat quality dynamics, and the relationship between them in the Yellow River Basin from 2005 to 2020. The results showed the following: (1) The areas of farmland and grassland decreased continuously, and the area of forest and water area increased slightly. The construction land area increased significantly during the study period. (2) Habitat quality first decreased and then increased, and the increased area was mainly in mountainous forest regions. With the economic and social transformation and the promulgation and implementation of ecological-protection policies, the habitat quality also improved. (3) The relationship between land-use transition and habitat quality showed that the habitat quality values associated with unchanged forest and the transition to forest were the highest, while habitat quality associated with the transition to construction land was always the lowest. Additionally, the coupling coordination degree of land-use degree and habitat quality showed a steady upward trend. (4) The results of spatial econometric analysis showed that the main factors affecting habitat quality included the growth rate of the value added by secondary industry, GDP per capita, population density, ecological-protection policy score, average annual temperature, and average annual precipitation.
The significance of this paper lies in the following: Firstly, the Outline of Ecological Conservation and High-quality Development Plan for the Yellow River Basin stipulated that the Yellow River Basin should be the subject of strengthened ecological protection and management to ensure the long-term stability of the region. The Outline of the National Land Plan (2016–2030) also defined the classification and protection of land, with the Yellow River Basin mostly divided into environmental quality maintenance areas and the lower reaches mostly divided into high-quality farmland maintenance areas. Therefore, while remaining committed to improving the habitat quality, we combined these national strategies to provide data references to determine which trends farmland, forest, grassland and construction land should follow. Secondly, against the background of multiple contradictory factors such as economic modernization, food security, and ecological environmental protection, which are commonly faced by all countries in the world, this paper set parameters based on the actual situation of the Yellow River Basin. Specifically, we fully considered the impact of farmland and unused land on habitat quality. Therefore, subsequent studies should also consider the natural and socio-economic conditions of specific regions. In this manner, the methods and ideas of this study can be applied to other regions. Thirdly, it can be found from the literature review that most studies on the relationship between land-use transition and habitat quality in the Yellow River Basin have focused on a single province, city, or city cluster, while this paper filled this gap by exploring the dynamics of habitat quality by taking the whole Yellow River Basin as study area, which helped to grasp the ecological and environmental status of this important river. Fourthly, as opposed to previous studies that only focused on the spatio-temporal dynamics of land-use transition and habitat quality, this study explored the dynamics of habitat quality brought about by specific land-use transition on this basis. This made apparent the impacts of human activities and land-use transition on habitat quality in the Yellow River Basin. Researchers can learn from the ideas of this study and subsequently explore habitat quality in other regions. Finally, scholars should carefully select appropriate research units and resolutions based on data availability.
Different land use types correspond to different functions and habitat quality determinations. Firstly, this paper is mainly based on the primary land class of each area, so a subsequent study could carry out a more detailed study on the secondary land class to accurately grasp the relationship between each land-use type and habitat quality. Secondly, the study area of this paper is large, and the threat sources and sensitivity tables were based on the actual situation of the study area, the InVEST user guidance manual, and previous research. Thirdly, the climate-related variables in this study comprised average values determined every five years, and which do not reflect the impact of extreme climate events; this needs to be taken into account in subsequent studies. On the one hand, extreme climate events can be regarded as a threat source for habitat quality, and parameters might be set according to the situation and related studies in the study area. On the other hand, when considering the factors that affect habitat quality, the frequency of extreme climate events and their economic losses are taken into account in each region. Finally, the impact of population density on habitat quality needs to be further verified. Subsequent studies can refine the administrative units of the study area to explore the impact of population density on habitat quality in counties of the Yellow River Basin. Researchers can also analyze the effects of population density on habitat quality in the upper, middle, and lower reaches of the Yellow River. So, follow-up research can be improved with respect to these aspects.

Author Contributions

Writing—original draft preparation, Y.X.; data curation, Y.X.; writing—review and editing, Y.X., X.L. and H.L.; methodology, X.L.; resources, X.L.; supervision, L.Z.; conceptualization; L.Z. and P.Z.; software, P.Z.; investigation, P.Z.; validation, H.L.; formal analysis, H.L.; funding acquisition, R.L.; project administration, C.W.; visualization, B.W. All authors have read and agreed to the published version of the manuscript.

Funding

This research was funded by Research Fund of Key Laboratory of Water Management and Water Security for Yellow River Basin, Ministry of Water Resources (under construction) (Grant NO. 2023-SYSJJ-09); Geological Survey Project of China Geological Survey (DD20230112, DD20230514).

Data Availability Statement

Data will be made available on request.

Acknowledgments

We would like to express our sincere gratitude to all the editors and reviewers for their valuable reviews.

Conflicts of Interest

The authors declare no conflicts of interest.

References

  1. Turner, B.L., II; Kasperson, R.E.; Meyer, W.B.; Dow, K.M.; Golding, D.; Kasperson, J.X.; Mitchell, R.C.; Ratick, S.J. Two types of global environmental change. Glob. Environ. Chang. 1990, 1, 14–22. [Google Scholar] [CrossRef]
  2. Guo, Z.; Zhang, L.; Li, Y. Increased dependence of humans on ecosystem services and biodiversity. PLoS ONE 2010, 5, e13113. [Google Scholar] [CrossRef] [PubMed]
  3. Li, Y.; Zhang, Y.; Li, X. Insight into Carbon Emissions in Economically Developed Regions Based on Land Use Transitions: A Case Study of the Yangtze River Delta, China. Land 2024, 13, 1968. [Google Scholar] [CrossRef]
  4. Basu, T.; Das, A. Urbanization induced changes in land use dynamics and its nexus to ecosystem service values: A spatiotemporal investigation to promote sustainable urban growth. Land Use Policy 2024, 144, 107239. [Google Scholar] [CrossRef]
  5. Montanarella, L.; Scholes, R.; Brainich, A. Intergovernmental Science-Policy Platform on Biodiversity and Ecosystem Services. The IPBES Assessment Report on Land Degradation and Restoration; IPBES Secretariat: Bonn, Germany, 2018. [Google Scholar]
  6. Yim, J.; Kwon, B.; Nam, J.; Hwang, J.; Choi, K.; Khim, J. Analysis of forty years long changes in coastal land use and land cover of the Yellow Sea: The gains or losses in ecosystem services. Environ. Pollut. 2018, 241, 74–84. [Google Scholar] [CrossRef]
  7. Hailu, T.; Assefa, E.; Zeleke, T. Urban expansion induced land use changes and its effect on ecosystem services in Addis Ababa, Ethiopia. Front. Environ. Sci. 2024, 12, 1454556. [Google Scholar] [CrossRef]
  8. Sarkar, D.; Kar, S.K.; Chattopadhyay, A.; Shikha; Rakshit, A.; Tripathi, V.K.; Dubey, P.K.; Abhilash, P.C. Low input sustainable agriculture: A viable climate-smart option for boosting food production in a warming world. Ecol. Indic. 2020, 8, 106412. [Google Scholar] [CrossRef]
  9. Xiao, L.; Qu, L.; Sun, P.; Yu, W.; Peng, W. Green Transition of Cultivated Land Use in the Yellow River Basin: A Perspective of Green Utilization Efficiency Evaluation. Land 2020, 9, 475. [Google Scholar] [CrossRef]
  10. Chen, W.; Zhao, R.; Lu, H. Response of ecological environment quality to land use transition based on dryland oasis ecological index (DOEI) in dryland: A case study of oasis concentration area in Middle Heihe River, China. Ecol. Indic. 2024, 165, 112214. [Google Scholar] [CrossRef]
  11. Hillard, E.M.; Nielsen, C.K.; Groninger, J.W. Swamp rabbits as indicators of wildlife habitat quality in bottomland hardwood forest ecosystems. Ecol. Indic. 2017, 79, 47–53. [Google Scholar] [CrossRef]
  12. Shi, G.; Chen, C.; Cao, Q.; Zhang, J.; Xu, J.; Chen, Y.; Wang, Y.; Liu, J. Spatiotemporal Dynamics and Prediction of Habitat Quality Based on Land Use and Cover Change in Jiangsu, China. Remote Sens. 2024, 16, 4158. [Google Scholar] [CrossRef]
  13. Huang, C.; Cheng, X.; Zhang, Z. Future Land Use and Habitat Quality Dynamics: Spatio-Temporal Analysis and Simulation in the Taihu Lake Basin. Sustainability 2024, 16, 7793. [Google Scholar] [CrossRef]
  14. Xu, B.; Liu, C.; Dong, Y.; Zhu, G.; Zhang, Y.; Lu, Z.; Zou, S. Evaluation of habitat quality in Lanzhou based on the InVEST model. Desert China 2021, 41, 120–129. [Google Scholar]
  15. Grainger, A. The Future Role of the Tropical Rain Forests in the World Forest Economy; University of Oxford: Oxford, UK, 1986. [Google Scholar]
  16. Walker, R.T. Land use transition and deforestation in developing countries. Geogr. Anal. 1987, 19, 18–30. [Google Scholar] [CrossRef]
  17. Mather, A.S. Global Forest Resources; Belhaven Press: Belhaven, Scotland, 1990. [Google Scholar] [CrossRef]
  18. Long, H.; Li, X. Analysis of regional land use transformation—Taking the sample belt along the Yangtze River as an example. J. Nat. Resour. 2002, 02, 144–149. [Google Scholar]
  19. Long, H.; Tu, S. Land use transition and rural vitalization. China Land Sci. 2018, 32, 1–6. [Google Scholar] [CrossRef]
  20. Long, H. Explanation of land use transition. China Land Sci. 2022, 36, 1–7. [Google Scholar] [CrossRef]
  21. Ge, D.; Long, H.; Tu, S.; Zhang, Y. Research on the coupled relationship between land use transformation and grain yield in the Yellow Huaihai region. J. Agric. Resour. Environ. 2017, 34, 319–327. [Google Scholar] [CrossRef]
  22. Syaban, A.S.N.; Appiah-Opoku, S. Unveiling the complexities of land use transition in Indonesia’s new capital City IKN Nusantara: A multidimensional conflict analysis. Land 2024, 13, 606. [Google Scholar] [CrossRef]
  23. Qu, S.; Hu, S.; Tong, L.; Li, Q. Spatial and temporal characteristics of urban construction land transformation in the middle reaches of the Yangtze River economic belt. Resour. Sci. 2017, 39, 240–251. [Google Scholar] [CrossRef]
  24. Biggs, B. Drivers and constraints of land use transitions on western grasslands: Insights from a California mountain ranching community. Landsc. Ecol. 2022, 37, 1185–1205. [Google Scholar] [CrossRef]
  25. Yuan, J.; Liu, X.; Li, H.; Xing, L.; Luo, X. Characteristics of spatial and temporal differentiation of carbon stocks in different land use types in the Yiluo River Basin in the middle reaches of the Yellow River from 1990 to 2050. Mod. Geol. 2024, 38, 559–573. [Google Scholar] [CrossRef]
  26. Fu, Y.; Liu, X.; Sun, X.; Liu, J.; Zheng, Y.; Zhang, Z.; Lai, M.; Xiong, M. Spatial and temporal changes of ecosystem carbon stocks driven by land use in the Northwest Inland Desert Resource Region over the past 30 years. Geol. Bull. 2024, 43, 451–462. [Google Scholar]
  27. Kumar, G.P.; Sreejith, K.S.; Dwarakish, G.S. The influence of land use and land cover transitions on hydrology in a tropical river basin of Southwest India. Water Conserv. Sci. Eng. 2024, 9, 64. [Google Scholar] [CrossRef]
  28. Chen, C.; Liu, J.; Bi, L. Spatial and Temporal Changes of Habitat Quality and Its Influential Factors in China Based on the InVEST Model. Forests 2023, 14, 374. [Google Scholar] [CrossRef]
  29. Sallustio, L.; De Toni, A.; Strollo, A.; Di Febbraro, M.; Gissi, E.; Casella, L.; Geneletti, D.; Munafò, M.; Vizzarri, M.; Marchetti, M. Assessing habitat quality in relation to the spatial distribution of protected areas in Italy. J. Environ. Manag. 2017, 201, 129–137. [Google Scholar] [CrossRef] [PubMed]
  30. Shiferaw, H.; Alamirew, T.; Kassawmar, T.; Zeleke, G. Evaluating ecosystems services values due to land use transformation in the Gojeb watershed, Southwest Ethiopia. Environ. Syst. Res. 2021, 10, 22. [Google Scholar] [CrossRef]
  31. Aneseyee, B.A.; Noszczyk, T.; Soromessa, T.; Elias, E. The. InVEST habitat quality model associated with land use/cover changes: A qualitative case study of the Winike Watershed in the Omo-Gibe basin, Southwest Ethiopia. Remote Sens. 2020, 12, 1103. [Google Scholar] [CrossRef]
  32. Wang, J.; Yan, Y.; Wang, J.; Ying, L.; Tang, Q. Characteristics and prediction of spatial and temporal evolution of habitat quality in the Minjiang River Basin. J. Ecol. 2021, 41, 5837–5848. [Google Scholar] [CrossRef]
  33. Liu, Y.; Wang, Q.; Liao, Y. Dynamic evolution of coupled ecological and socio-economic systems in the Chengdu metropolitan area, multi-scenario simulation and its policy implications. J. Nat. Resour. 2023, 38, 2599–2618. [Google Scholar] [CrossRef]
  34. Zhang, X.; Li, H.; Yang, X.; Wu, G.; Tan, J. Simulation of Spatial and Temporal Dynamics in Habitat Quality amid Rapid Urbanization based on Random Forest Algorithm: A Lingui District, Guilin City Case Study. E3S Web. Conf. 2025, 617, 03003. [Google Scholar] [CrossRef]
  35. Zhang, W.; Liu, X.; Xu, B.; Liu, J.; Li, H.; Zhao, X.; Luo, X.; Wang, R.; Xing, L.; Wang, C.; et al. Remote Sensing Classification and Mapping of Forest Dominant Tree Species in the Three Gorges Reservoir Area of China Based on Sample Migration and Machine Learning. Remote Sens. 2024, 16, 2547. [Google Scholar] [CrossRef]
  36. Du, X.; Chen, Y.; Wang, Z. Unveiling the Secrets: How Landscape Patterns Shape Habitat Quality in Northeast China Tiger and Leopard National Park. Forests 2024, 15, 1889. [Google Scholar] [CrossRef]
  37. Paramesha, M.; Ganesan, R.; Jayalakshmi, K.; Madhura, N. Assessing Habitat Quality of Forest-Corridors through NDVI Analysis in Dry Tropical Forests of South India: Implications for Conservation. Remote Sens. 2015, 7, 1619–1639. [Google Scholar] [CrossRef]
  38. Dai, L.; Li, S.; Bernard, J.L.; Wu, J.; Yu, D. The influence of land use change on the spatial-temporal variability of habitat quality between 1990 and 2010 in Northeast China. J. For. Res. 2019, 30, 2227–2236. [Google Scholar] [CrossRef]
  39. Zheng, L.; Wang, Y.; Li, J. Quantifying the spatial impact of landscape fragmentation on habitat quality: A multi-temporal dimensional comparison between the Yangtze River Economic Belt and Yellow River Basin of China. Land. Use. Pol. 2023, 125, 106463. [Google Scholar] [CrossRef]
  40. Sun, X.; Shan, R.; Luan, Q.; Zhang, Y.; Chen, Z. Spatial (mis)matches between biodiversity and habitat quality under multi-scenarios: A case study in Shandong Province, Eastern China. Land 2024, 13, 2215. [Google Scholar] [CrossRef]
  41. Zhang, Q.; Zhu, L.; Fu, H. Spatiotemporal Correlation Analysis of landscape pattern and habitat quality in and around China’s Tropical Rainforest National Park. Forests 2024, 15, 2070. [Google Scholar] [CrossRef]
  42. Benson, C.S.; Darius, J.S.; Jessica, M.C. An application of Social Values for Ecosystem Services (SolVES) to three national forests in Colorado and Wyoming. Ecol. Indic. 2014, 36, 68–79. [Google Scholar] [CrossRef]
  43. Sun, G.; Lu, H.; Yu, M.; Yan, X.; Zheng, X. Ecological vulnerability spatial-time distribution and driving forces analysis in the economic belt on the northern slope of Tianshan Mountaions. Southwest. China. J. Agric. Sci. 2022, 35, 2161–2170. [Google Scholar] [CrossRef]
  44. Jiang, Y.; He, J.; Zhai, D.; Hu, C.; Yu, L. Analysis of the evolution of watershed habitat quality and its drivers under the influence of the human footprint. Front. Environ. Sci. 2024, 12, 1431295. [Google Scholar] [CrossRef]
  45. Shiksha, B.; Sanghyup, L.; Yongchul, S.; Younghun, J. An Assessment of Environmental Impacts on the Ecosystem Services: Study on the Bagmati Basin of Nepal. Sustainability 2020, 12, 8186. [Google Scholar] [CrossRef]
  46. Zhang, X.; Zhou, J.; Li, M. Analysis on spatial and temporal changes of regional habitat quality based on the spatial pattern reconstruction of land use. Acta. Geogr. Sin. 2020, 75, 160–178. [Google Scholar] [CrossRef]
  47. Zheng, Y.; Zhang, P.; Tang, F.; Zhao, L.; Zhao, X. The effects of land use change on habitat quality in Changli county based on InVEST model. Chin. J. Agric. Resour. Reg. Plan. 2018, 39, 121–128. [Google Scholar]
  48. Wang, H.; Xu, Y.; Li, C. Coupling coordination and spatio-temporal pattern evolution between ecological protection and high-quality development in the Yellow River Basin. Heliyon 2023, 9, e21089. [Google Scholar] [CrossRef]
  49. Guo, B.; Xu, M.; Zhang, R.; Luo, W. A new monitoring index for ecological vulnerability and its application in the Yellow River Basin, China from 2000 to 2022. J. Arid Land 2024, 16, 1163–1182. [Google Scholar] [CrossRef]
  50. Zuo, Q.; Fei, X.; Li, D. Special planning ideas and connect framework of water conservancy for ecological conservation and high-quality development of the Yellow River Basin. Yellow River 2020, 42, 21–25. [Google Scholar] [CrossRef]
  51. Sun, Y. Yellow River Protection Law: The fundamental guarantee for ecological protection and high-quality development of the Yellow River Basin. Environ. Prot. 2022, 50, 39–43. [Google Scholar] [CrossRef]
  52. Xu, X.; Zhang, D.; Zhang, Y.; Yao, S.; Zhang, J. Evaluating the vegetation restoration potential achievement of ecological projects: A case study of Yan’an, China. Land Use Policy 2020, 90, 104293. [Google Scholar] [CrossRef]
  53. Tang, Y.; Tang, J.; Yu, X.; Qin, L.; Wang, J.; Hou, X.; Chen, D. Land ecological protection polices improve ecosystem services: A case study of Lishui, China. Front. Environ. Sci. 2022, 10, 973524. [Google Scholar] [CrossRef]
  54. Kang, Q.; Pan, W.; Li, Y. Land use transformation and its impact on habitat quality in Nanjing from perspective of production-living-ecological space. Acta Agric. Jiangxi 2022, 34, 128–137. [Google Scholar] [CrossRef]
  55. Chen, M.; Bai, Z.; Wang, Q.; Shi, Z. Habitat Quality Effect and Driving Mechanism of Land Use Transitions: A Case Study of Henan Water Source Area of the Middle Route of the South-to-North Water Transfer Project. Land 2021, 10, 796. [Google Scholar] [CrossRef]
  56. Tatenda, D.; Tongayi, M.; Wasserman, R.J.; Madzivanzira, T.C.; Tamuka, N.; Cuthbert, R.N. Land use effects on water quality, habitat, and macroinvertebrate and diatom communities in African highland streams. Sci. Total Environ. 2022, 846, 157346. [Google Scholar] [CrossRef]
  57. Tian, J. The Process, Mechanism and Optimization of Regional Land Use Transition Under the Guidance of Policy: A Case Study of Three Provinces of Northeast China. Ph.D. Thesis, Jilin Univeristy, Jilin, China, 2020. [Google Scholar] [CrossRef]
  58. The State Council of the People’s Republic of China. Guiding Opinions on Promoting the Development of the Yangtze River Economic Belt by Relying on the Golden Waterway. 2014. Available online: https://www.gov.cn/zhengce/content/2014-09/25/content_9092.htm (accessed on 27 February 2025).
  59. Guo, F.; Liu, X.; Zhang, W.; Xing, L.; Wang, R. Evolution of the spatial and temporal patterns of habitat quality ad analysis of the driving forces in Yellow River Basin (Henan Section) from 2000 to 2040. Geoscience 2024, 38, 599–611. [Google Scholar] [CrossRef]
  60. Liu, J. Macro-Scale Survey and Dynamic Study of Natural Resources and Environment of China by Remote Sensing; Chian Science and Technology Press: Beijing, China, 1996. [Google Scholar]
  61. Liu, X.; Liu, X.; Jiang, D. Regionalization of Natural Resources in China from a Global Perspective; China Science Publishing: Beijing, China, 2023. [Google Scholar]
  62. Li, J.; Zhang, C.; Zhu, S. Relative contributions of climate and land-use change to ecosystem services in arid inland basins. J. Clean. Prod. 2021, 298, 126844. [Google Scholar] [CrossRef]
  63. Ouyang, X.; Tang, L.; Wei, X.; Li, Y. Spatial interaction between urbanization and ecosystem services in Chinese urban agglomerations. Land. Use. Pol. 2021, 109, 105587. [Google Scholar] [CrossRef]
  64. Newbold, T.; Hudson, L.N.; Hill, S.L.L.; Contu, S.; Lysenko, I. Global effects of land use on local terrestrial biodiversity. Nature 2015, 520, 45–50. [Google Scholar] [CrossRef]
  65. Yang, Q.; Duan, X.; Wang, L.; Jin, Z. Land use transformation based on ecological-production-living spaces and associated eco-environment effects: A case study in the Yangtze River Delta. Sci. Geogr. Sin. 2018, 38, 97–106. [Google Scholar] [CrossRef]
  66. Zhuang, D.; Liu, J. Study on the model of regional differentiation of land use degree in China. J. Nat. Resour. 1997, 12, 10–16. [Google Scholar]
  67. Li, C.; Liu, L.; Qiu, B.; Nie, C.; Ning, L.; Li, Y.; Wang, H.; Liu, X.; Yang, S. Sptaial-temporal change and driving factors of land use/cover in Anhui province. J. Nanjing For. Univ. Nat. Sci. Ed. 2023, 47, 213–223. [Google Scholar]
  68. Zhang, M.; Zhang, F.; Li, X. Evaluation of habitat quality based on InVEST model: A case study of Tongzhou district of Beijing, China. Landsc. Archit. 2020, 27, 95–99. [Google Scholar] [CrossRef]
  69. Marta, T.; Sergi, S.; Becky, C.K.; Lisa, M.; Guy, Z. Model development for the assessment of terrestrial and aquatic habitat quality in conservation planning. Sci. Total. Environ. 2016, 540, 63–70. [Google Scholar] [CrossRef]
  70. Richard, S.; Rebecca, C.K.; Spencer, A.W.; Anne, G. InVEST User’s Guide; The Natural Capital Project, Stanford University: Stanford, CA, USA; University of Minnesota: Minneapolis, MN, USA; The Nature Conservancy: Arlington County, VA, USA; World Wildlife Fund: Gland, Switzerland, 2018. [Google Scholar] [CrossRef]
  71. Sun, J.; Han, M.; Kong, F.; Wei, F. A coupling study of habitat quality and urbanization in the lower Yellow River. J. Shandong Univ. Nat. Sci. 2024, 59, 110–125. [Google Scholar]
  72. Tang, J. Urban Expansion’s Effects on Habitat Quality and Spatial Optimization in Densely Populated Areas of the Yellow River Basin. Master’s Thesis, Lanzhou Jiaotong University, Lanzhou, China, 2021. [Google Scholar] [CrossRef]
  73. Chen, Y.; Zhang, F.; Lin, J. Projecting Future land use evolution and its effect on spatiotemporal patterns of habitat quality in China. Appl. Sci. 2025, 15, 1042. [Google Scholar] [CrossRef]
  74. Gan, H.; Feng, J.; Zhao, Z.; Ma, L.; Di, S.; Wen, Y. Identifying the Response of Ecological Well-Being to Ecosystem Services of Urban Green Space Using the Coupling Coordination Degree Model: A Case Study of Beijing, China, 2015–2023. Forests 2024, 15, 1494. [Google Scholar] [CrossRef]
  75. Hao, Z.; Wen, Q.; Shi, L.; Wu, X.; Ding, J. Spatial network analysis of coupling coordination between social economy and eco-environment in the Yellow River Basin urban agglomerations. Econ. Geogr. 2023, 43, 181–191. [Google Scholar] [CrossRef]
  76. Pu, J.; Chen, S.; Du, F. Factors influencing recessive transformation of land use in Fujian Province during 2000. Bull. Soil. Water. Conserv. 2023, 43, 402–411. [Google Scholar] [CrossRef]
  77. Wang, C.; Zhang, X.; Pezhman, G.; Liu, Q.; Ming, K.L. The impact of regional financial development on economic growth in Beijing–Tianjin–Hebei region: A spatial econometric analysis. Phys. A 2019, 521, 635–648. [Google Scholar] [CrossRef]
  78. Li, D. Research on The Impact of Digital Economy on Real Economy: Based on Spatial Econometric Model. Master’s Thesis, Shanxi University of Finance and Economics, Shanxi, China, 2023. [Google Scholar]
  79. Michael, H.; Ramesh, M. Studying Public Policy: Policy Cycles and Policy Subsystems; SDX Joint Publishing Company: Beijing, China, 2006; pp. 182–190. [Google Scholar]
  80. Li, J.; Li, S.; Wang, X.; Xu, G.; Peng, J. Spatio-temporal variations and multi-scenario simulation of landscape ecological risk in the drylands of the Yellow River Basin. Sci. Rep. 2024, 14, 22672. [Google Scholar] [CrossRef]
  81. Yimuranzi, A.; Alimujiang, K.; Liang, H.; Zhang, X.; Zhao, Y.; Wei, B. Evaluation of ecological space and ecological quality changes in urban agglomeration on the northern slope of the Tianshan Mountains. Ecol. Indi. 2023, 146, 109896. [Google Scholar] [CrossRef]
  82. Sun, X.; Jiang, Z.; Liu, F.; Zhang, D. Monitoring spatio-temporal dynamics of habitat quality in Nansihu Lake basin, eastern China, from 1980 to 2015. Ecol. Indi. 2019, 102, 716–723. [Google Scholar] [CrossRef]
  83. Chen, L.; Wei, Q.; Fu, Q.; Feng, D. Spatiotemporal Evolution Analysis of Habitat Quality under High-Speed Urbanization: A Case Study of Urban Core Area of China Lin-Gang Free Trade Zone (2002–2019). Land 2021, 10, 167. [Google Scholar] [CrossRef]
  84. Du, W.; Li, X.; Song, J.; Meng, C.; Wang, Z. Analysis and prediction of landscape ecological risk in Yellow River Basin. Bull. Soil. Water. Conserv. 2022, 42, 105–113. [Google Scholar] [CrossRef]
  85. Liu, Y.; Tang, X.; Sun, Z.; Zhang, J.; Wang, G.; Jin, J.; Wang, G. Spatiotemporal precipitation variability and potential drivers during 1961–2015 over the Yellow River Basin, China. Weather 2019, 74, S32–S39. [Google Scholar] [CrossRef]
  86. Gu, T.; Guan, X.; Gao, Z.; Huang, X.; Guo, S. Correlation analysis of evapotranspiration with air temperature, precipitation, and wind speed over the Yellow River Basin. J. Meteorol. Environ. 2022, 38, 48–56. [Google Scholar] [CrossRef]
  87. Chen, Y.; Zhao, L. Exploring the relation between the industrial structure and the eco-environment based on an integrated approach: A case study of Beijing, China. Ecol. Indi. 2019, 103, 83–93. [Google Scholar] [CrossRef]
  88. Liang, B.; Zhang, Y. Study on the application of environmental impact assessment in municipal infrastructure construction. Sichuan Water Power 2020, 39, 66–70+75. [Google Scholar]
  89. Liao, L.; Ma, E.; Long, H.; Peng, X. Land Use Transition and Its Ecosystem Resilience Response in China during 1990–2020. Land 2022, 12, 141. [Google Scholar] [CrossRef]
  90. Shi, L.; Wang, Y. Evolution characteristics and driving factors of negative decoupled rural residential land and resident population in the Yellow River Basin. Land Use Policy 2021, 109, 105685. [Google Scholar] [CrossRef]
  91. Liu, T.; Peng, R.; Zhuo, Y.; Cao, G. China’s changing population distribution and influencing factors: Insights from the 2020 census data. Acta. Geogr. Sin. 2022, 77, 381–394. [Google Scholar] [CrossRef]
  92. Cao, X.; Ci, F. Study on the Coupling Development of Industry, City and Population in the Yellow River Basin from the Perspective of Green Economy. Sustainability 2023, 15, 10029. [Google Scholar] [CrossRef]
  93. Zhang, Y.; Sai, N.; Zhao, M. Policy reward and punishment mechanism and local government selective implementation: A comparative case study in the field of environmental protection. Expand. Horiz. 2024, 5, 99–108. [Google Scholar]
  94. Abdo, J.; Griffin, S.; Kemp, A.; Coupland, G. Has a dedicated biodiversity offsets policy improved the environmental and social compensation outcomes of development in Australia? In Environment, Development and Sustainability; Springer: Berlin/Heidelberg, Germany, 2024; prepublish; pp. 1–26. [Google Scholar] [CrossRef]
  95. Manu, K.; Asongu, A. The impact of environmental policy, technological innovations, and digitalisation: Does context matter in natural resource management in Sub-Sahara Africa? Extr. Ind. Soc. 2025, 22, 101608. [Google Scholar] [CrossRef]
  96. Sun, X.; Zhang, H.; Mahmood, A.; Xue, C. Analysis of influencing factors of carbon emissions in resource-based cities in the Yellow River basin under carbon neutrality target. Environ. Sci. Pollut. Res. 2021, 29, 23847–23860. [Google Scholar] [CrossRef]
  97. Cui, Y.; Li, L.; Lei, Y.; Wu, S. The performance and influencing factors of high-quality development of resource-based cities in the Yellow River basin under reducing pollution and carbon emissions constraints. Resour Pol. 2024, 88, 104488. [Google Scholar] [CrossRef]
  98. Guan, J.; Zhang, J. From “control” to “maching”: Policy rethinking and policy direction in urban scale governance. Admin. Law. 2023, 11, 68–78. [Google Scholar]
  99. Qu, Y.; Wang, S.; Tian, Y.; Jiang, G.; Zhou, T.; Meng, L. Territorial spatial planning for regional high-quality development—An analytical framework for the identification, mediation and transmission of potential land utilization conflicts in the Yellow River Delta. Land Use Policy 2023, 125, 106462. [Google Scholar] [CrossRef]
  100. Damien, N.; Timo, D. Farmland Fragmentation, Farmland Consolidation and Food Security: Relationships, Research Lapses and Future Perspectives. Land 2021, 10, 129. [Google Scholar] [CrossRef]
  101. Daniels, T.L. Assessing the Performance of Farmland Preservation in America’s Farmland Preservation Heartland: A Policy Review. Soc. Nat. Resour. 2020, 33, 758–768. [Google Scholar] [CrossRef]
  102. Yi, J.; Ou, M.; Guo, J. Land use planning in the era of territorial spatial planning: Historical contribution and mission of the times. J. Nanjing. Agri. Univ. Soc. Sci. Ed. 2022, 22, 146–158. [Google Scholar] [CrossRef]
  103. Li, Q.; Zhu, T.; Zhang, J.; Shang, Y. On the modern territorial spatial governance system from the perspective of ecological civilization. Urban Dev. Stu. 2024, 31, 15–22. [Google Scholar]
  104. Zhang, P.; Chang, M. Study on the influence of urban expansion on cultivated land utilization intensity in China. J. Phys. Conf. Ser. 2021, 1802, 042058. [Google Scholar] [CrossRef]
  105. Li, J.; Deng, X.D.; Karen, C.S. Multi-level modeling of urban expansion and cultivated land conversion for urban hotspot counties in China. Landsc. Urban. Plan. 2012, 108, 131–139. [Google Scholar] [CrossRef]
Figure 1. Research status and deficiencies.
Land 14 00759 g001
Figure 2. Overview map of the study area.
Land 14 00759 g002
Figure 3. Research idea diagram.
Land 14 00759 g003
Figure 4. Distribution of land-use types in the Yellow River Basin from 2005 to 2020.
Land 14 00759 g004
Figure 5. Land-use transition map of the Yellow River Basin from 2005 to 2020.
Land 14 00759 g005
Figure 6. Spatial distribution pattern of habitat quality in the Yellow River Basin from 2005 to 2020.
Land 14 00759 g006
Figure 7. Changes in habitat quality corresponding to land-use transition in the Yellow River Basin from 2005 to 2020.
Land 14 00759 g007
Figure 8. Trend of coupling coordination degree determined between land-use degree and habitat quality in the Yellow River Basin from 2005 to 2020.
Land 14 00759 g008
Figure 9. Spatial distribution of coupling coordination degree of land-use degree and habitat quality in the Yellow River Basin from 2005 to 2020.
Land 14 00759 g009
Table 1. Data sources.
Data TypeNameResolutionData Sources
Physical geographic dataAdministrative boundaries-National Platform for Common GeoSpatial Information Service (https://www.tianditu.gov.cn/, accessed on 5 to 7 July 2024)
Land-use data1 kmResource and Environment Science Data Platform of the Chinese Academy of Sciences
(https://www.resdc.cn/DOI/, accessed on 28 July 2024)
Population density500 m
Average annual temperature1 km
Average annual precipitation1 km
Altitude30 m
Slope30 m
River network density1 kmNational Geographic Information Resources Catalogue Service System
(https://www.webmap.cn/, accessed on 30 July 2024)
Socio-economic dataGrowth rate of value added by primary industry-Municipal Statistical Yearbook from 2006 to 2021
Municipal Statistical Bulletin from 2005 to 2020
Growth rate of value added by secondary sector-
Per capita fiscal revenue-
GDP per capita-
Road area per capita-
Greening coverage in built-up areas-
Sulfur dioxide (SO2) emissions-
Policy dataEcological-protection policy score-PKULAW
(https://www.pkulaw.com/, accessed on 27 July to 15 August 2024)
Table 3. Parameters of threat factors.
Threat Source FactorsMaximum Impact Distance (km)WeightAttenuation Type
Farmland50.6Exponential decay
Rural settlements80.8Exponential decay
Urban construction land101.0Exponential decay
Other construction land90.9Exponential decay
Unused land40.4Linear attenuation
Table 4. Habitat suitability and sensitivity to threat sources of different land-use types.
Land-Use TypeHabitat SuitabilitySensitivity
FarmlandRural SettlementsUrban Construction LandOther Construction LandUnused Land
Farmland0.500.50.70.60.4
Forest0.90.60.70.70.80.2
Grassland0.850.70.50.60.70.5
Water area10.50.70.70.60.5
Construction land000000
Unused land0.50.20.40.60.50
Table 6. Area (104 km2) and proportion (%) of different land types in the Yellow River Basin.
Land-Use Type2005201020152020
AreaPercentageAreaPercentageAreaPercentageAreaPercentage
Farmland35.2735.6335.0935.4534.8335.1933.8134.16
Forest13.0113.1413.0613.1913.0713.2013.1913.33
Grassland36.6737.0536.7237.1036.6036.9836.4236.80
Water area1.661.671.671.691.711.731.951.97
Construction land4.304.344.454.504.955.005.996.05
Unused land8.078.157.998.077.827.907.627.70
Table 7. Land-use transition matrix for the Yellow River Basin from 2005 to 2020 (104 km2).
Year2020
TypeFarmlandForestGrasslandWater AreaConstruction LandUnused LandCumulative Transition-Out
2005Farmland23.251.786.980.573.060.3312.72
Forest1.708.022.860.060.190.094.90
Grassland6.713.0224.410.340.711.7612.54
Water area0.470.050.320.500.100.081.02
Construction land1.850.080.360.211.110.042.54
Unused land0.440.131.910.150.135.212.76
Cumulative transition-in11.175.0612.431.334.192.30
Table 8. Proportions of different habitat quality levels in the Yellow River Basin from 2005 to 2020 (%).
Habitat Quality RatingHabitat Quality IndexPercentage of Different Classes of Habitat Quality by Year
2005201020152020
Low0–0.247.6750.0650.0847.03
Relatively low0.2–0.421.5422.1822.1421.32
Medium0.4–0.620.4617.7517.7621.08
Relatively high0.6–0.84.824.614.624.85
High0.8–15.515.415.405.72
Table 9. Collinearity test for the variables.
VariantX1X2X3X4X5X6X7X8X9X10X11X12X13X14
X11.00
X20.471.00
X30.270.141.00
X40.550.130.421.00
X5−0.38−0.140.130.531.00
X6−0.470.200.270.510.361.00
X7−0.420.250.170.090.100.041.00
X8−0.52−0.330.00−0.25−0.30−0.24−0.261.00
X9−0.670.030.230.710.510.550.18−0.311.00
X10−0.05−0.240.130.120.310.33−0.040.100.221.00
X110.16−0.08−0.020.110.570.36−0.06−0.220.150.761.00
X120.040.26−0.07−0.76−0.19−0.350.390.00−0.13−0.48−0.401.00
X130.140.35−0.12−0.18−0.34−0.840.170.18−0.06−0.92−0.72−0.771.00
X140.290.100.00−0.220.200.070.06−0.18−0.270.630.77−0.16−0.491.00
Table 10. Driving factors associated with habitat quality evolution in the Yellow River Basin from 2005 to 2020.
VariablesMain
X1: Growth rate of value added by the primary industry−0.0667
(0.0439)
X2: Growth rate of value added by secondary industry−0.176 ***
(0.0481)
X3: Per capita fiscal revenue−0.0006
(0.0007)
X4: GDP per capita−0.0098 ***
(0.0003)
X5: Population density0.0014 ***
(0.0042)
X6: Road area per capita−0.0900
(0.0900)
X7: Ecological-protection policy score0.0489 **
(0.0221)
X8: Sulphur dioxide (SO2) emissions−0.0057
(0.0038)
X9: Greening coverage in construction areas0.0644
(0.0765)
X10: Average annual temperature−0.0187 ***
(0.0062)
X11: Average annual precipitation0.0019 ***
(0.0042)
R20.688
Note: ** and *** indicate significance at the 10 percent, 5 percent, and 1 percent confidence levels, respectively.
Disclaimer/Publisher’s Note: The statements, opinions and data contained in all publications are solely those of the individual author(s) and contributor(s) and not of MDPI and/or the editor(s). MDPI and/or the editor(s) disclaim responsibility for any injury to people or property resulting from any ideas, methods, instructions or products referred to in the content.

