
Evaluation of Land Suitability for Construction in the Turpan–Hami Region Based on the Integration of the MaxEnt Model and Regional Planning


Abstract
:1. Introduction
2. Materials and Methods
2.1. Study Area
2.2. Construction of the Evaluation Index System
2.3. Method
2.3.1. Suitability Evaluation Model and Method
2.3.2. Suitability Level Transformation Analysis
2.3.3. Analysis of Suitability Geospatial Change Trends
3. Results
3.1. Analysis of Model Performance and Suitability Driving Factors
3.2. Spatiotemporal Characteristics of Construction Land Suitability
3.3. Geospatial Trend Analysis of Suitability Changes
4. Discussion
4.1. Geospatial Trend Analysis of Suitability Development
4.2. Suitability Driving Mechanisms and Policy Implications
4.3. Future Research Directions
5. Conclusions
Author Contributions
Funding
Data Availability Statement
Conflicts of Interest
References
- Nkonya, E.M.; Karsenty, A.; Souza, C., Jr.; Shah, M.; von Braun, J.; Galford, G.; Park, S. Sustainable Land Use for the 21st Century. 2012. Available online: https://cgspace.cgiar.org/server/api/core/bitstreams/6ebfb567-bb52-4261-80a8-097767ecb182/content (accessed on 2 April 2025).
- Sun, M.; Wang, J.; He, K. Analysis on the urban land resources carrying capacity during urbanization—A case study of Chinese YRD. Appl. Geogr. 2020, 116, 102170. [Google Scholar]
- Wu, Y.; Zhang, X.; Shen, L. The impact of urbanization policy on land use change: A scenario analysis. Cities 2011, 28, 147–159. [Google Scholar] [CrossRef]
- Yeh, K. China’s economic growth: Recent trends and prospects. In Rand-Publications-Mr-All Series; 2001; pp. 69–98. Available online: https://www.rand.org/content/dam/rand/pubs/monograph_reports/2006/MR1300.pdf#page=79 (accessed on 18 June 2024).
- Luo, W.; Bai, H.; Jing, Q.; Liu, T.; Xu, H. Urbanization-induced ecological degradation in Midwestern China: An analysis based on an improved ecological footprint model. Resour. Conserv. Recycl. 2018, 137, 113–125. [Google Scholar] [CrossRef]
- de Macedo, L.S.V.; Picavet, M.E.B.; de Oliveira, J.A.P.; Shih, W.-Y. Urban green and blue infrastructure: A critical analysis of research on developing countries. J. Clean. Prod. 2021, 313, 127898. [Google Scholar] [CrossRef]
- Zhang, Z.; Li, J. Spatial suitability and multi-scenarios for land use: Simulation and policy insights from the production-living-ecological perspective. Land Use Policy 2022, 119, 106219. [Google Scholar]
- Wilkerson, M.L.; Mitchell, M.G.; Shanahan, D.; Wilson, K.A.; Ives, C.D.; Lovelock, C.E.; Rhodes, J.R. The role of socio-economic factors in planning and managing urban ecosystem services. Ecosyst. Serv. 2018, 31, 102–110. [Google Scholar]
- Ye, B.; Zheng, X.; Luo, H.; Shen, J.; Ji, F.; Lin, X. Coordinated Delineation of “Three Districts and Three Lines”: Anatomy of the Phenomenon, Technical Logic and Nanjing’s Experience. Available online: https://upforum.wupen.org/Assets/userfiles/files/issues/2024/2024-03/2024-04/7-%E8%8B%B1%E8%AF%AD.pdf (accessed on 1 April 2025).
- Zang, Z.; Zou, X.; Xi, X.; Zhang, Y.; Zheng, D.; Sun, C. Quantitative characterization and comprehensive evaluation of regional water resources using the Three Red Lines method. J. Geogr. Sci. 2016, 26, 397–414. [Google Scholar]
- Yi, J.; Yi, D.; Tang, Y.; Guo, J.; Ou, M.; Cheng, X. Building a More Secure Territory Spatial Pattern in China: An Analysis Based on Human-Environment Interactions. Land 2023, 12, 2137. [Google Scholar] [CrossRef]
- Peng, J.; Du, Y.; Liu, Y.; Hu, X. How to assess urban development potential in mountain areas? An approach of ecological carrying capacity in the view of coupled human and natural systems. Ecol. Indic. 2016, 60, 1017–1030. [Google Scholar]
- Opdam, P.; Steingröver, E.; Van Rooij, S. Ecological networks: A spatial concept for multi-actor planning of sustainable landscapes. Landsc. Urban Plan. 2006, 75, 322–332. [Google Scholar]
- Phang, W.K.; Hamid, M.H.b.A.; Jelip, J.; Mudin, R.N.b.; Chuang, T.-W.; Lau, Y.L.; Fong, M.Y. Predicting Plasmodium knowlesi transmission risk across Peninsular Malaysia using machine learning-based ecological niche modeling approaches. Front. Microbiol. 2023, 14, 1126418. [Google Scholar]
- Sari, F.; Yalcin, M. Investigation of the importance of criteria in potential wind farm sites via machine learning algorithms. J. Clean. Prod. 2024, 435, 140575. [Google Scholar]
- Harte, J.; Newman, E.A. Maximum information entropy: A foundation for ecological theory. Trends Ecol. Evol. 2014, 29, 384–389. [Google Scholar] [PubMed]
- Phillips, S.J.; Dudík, M. Modeling of species distributions with Maxent: New extensions and a comprehensive evaluation. Ecography 2008, 31, 161–175. [Google Scholar]
- Merow, C.; Smith, M.J.; Silander, J.A., Jr. A practical guide to MaxEnt for modeling species’ distributions: What it does, and why inputs and settings matter. Ecography 2013, 36, 1058–1069. [Google Scholar]
- Radosavljevic, A.; Anderson, R.P. Making better Maxent models of species distributions: Complexity, overfitting and evaluation. J. Biogeogr. 2014, 41, 629–643. [Google Scholar]
- Akpoti, K.; Kabo-bah, A.T.; Zwart, S.J. Agricultural land suitability analysis: State-of-the-art and outlooks for integration of climate change analysis. Agric. Syst. 2019, 173, 172–208. [Google Scholar]
- Elith, J.; Phillips, S.J.; Hastie, T.; Dudík, M.; Chee, Y.E.; Yates, C.J. A statistical explanation of MaxEnt for ecologists. Divers. Distrib. 2011, 17, 43–57. [Google Scholar]
- Wang, Y.; Chao, B.; Dong, P.; Zhang, D.; Yu, W.; Hu, W.; Ma, Z.; Chen, G.; Liu, Z.; Chen, B. Simulating spatial change of mangrove habitat under the impact of coastal land use: Coupling MaxEnt and Dyna-CLUE models. Sci. Total Environ. 2021, 788, 147914. [Google Scholar]
- Toth, C.; Jóźków, G. Remote sensing platforms and sensors: A survey. ISPRS J. Photogramm. Remote Sens. 2016, 115, 22–36. [Google Scholar]
- Kumar, G.; Nath, V.; Mandal, U.; Sena, D.R.; Pongener, A.; Ranjan, R.; Madhu, M. Climate and soil suitability zonation for Litchi (Litchi chinensis) in India using geo-science tool-based analytical hierarchy process. Egypt. J. Remote Sens. Space Sci. 2023, 26, 581–594. [Google Scholar]
- Zheng, X.; Zhang, W.; Deng, H.; Zhang, H. County-Level Poverty Evaluation Using Machine Learning, Nighttime Light, and Geospatial Data. Remote Sens. 2024, 16, 962. [Google Scholar] [CrossRef]
- Sakti, A.D.; Anggraini, T.S.; Ihsan, K.T.N.; Misra, P.; Trang, N.T.Q.; Pradhan, B.; Wenten, I.G.; Hadi, P.O.; Wikantika, K. Multi-air pollution risk assessment in Southeast Asia region using integrated remote sensing and socio-economic data products. Sci. Total Environ. 2023, 854, 158825. [Google Scholar] [CrossRef]
- Zhang, Z.; Gong, J.; Li, J.; Yang, J.; Chen, G.; Ren, Y.; Plaza, A. Comparative study of construction land development suitability assessment: Insights from multiple models and driving forces. Environ. Impact Assess. Rev. 2024, 107, 107574. [Google Scholar]
- Chrisman, N.R. The accuracy of map overlays: A reassessment. Landsc. Urban Plan. 1987, 14, 427–439. [Google Scholar] [CrossRef]
- Kang, L.; Jia, Y.; Zhang, S. Spatiotemporal distribution and driving forces of ecological service value in the Chinese section of the “Silk Road Economic Belt”. Ecol. Indic. 2022, 141, 109074. [Google Scholar]
- Xia, J.; Zhang, Y.; Xiong, L.; He, S.; Wang, L.; Yu, Z. Opportunities and challenges of the Sponge City construction related to urban water issues in China. Sci. China Earth Sci. 2017, 60, 652–658. [Google Scholar] [CrossRef]
- Liu, Z.; Wang, J.; Ding, J.; Xie, X. Analysis of spatial–temporal evolution trends and influential factors of desert-oasis thermal environment in typical arid zone: The case of Turpan–Hami region. Ecol. Indic. 2023, 154, 110747. [Google Scholar] [CrossRef]
- Han, S.; Zhang, J.; Zhou, Y.; Bai, S.; Huang, L.; Wang, C.; Huang, W. Formation and accumulation of lower Jurassic tight gas sands field in Kekeya area of Tuha Basin, northwestern China. J. Nat. Gas Sci. Eng. 2016, 29, 101–109. [Google Scholar] [CrossRef]
- Kou, Y.; Chen, S.; Zhou, K.; Qiu, Z.; He, J.; Shi, X.; Zhou, X.; Zhang, Q. Spatiotemporal Patterns and Coupling Coordination Analysis of Multiscale Social–Economic–Ecological Effects in Ecologically Vulnerable Areas Based on Multi-Source Data: A Case Study of the Tuha Region, Xinjiang Province. Land 2024, 13, 282. [Google Scholar] [CrossRef]
- Ustaoglu, E.; Aydınoglu, A. Suitability evaluation of urban construction land in Pendik district of Istanbul, Turkey. Land Use Policy 2020, 99, 104783. [Google Scholar] [CrossRef]
- Zhou, H.; Na, X.; Li, L.; Ning, X.; Bai, Y.; Wu, X.; Zang, S. Suitability evaluation of the rural settlements in a farming-pastoral ecotone area based on machine learning maximum entropy. Ecol. Indic. 2023, 154, 110794. [Google Scholar] [CrossRef]
- Warren, D.L.; Seifert, S.N. Ecological niche modeling in Maxent: The importance of model complexity and the performance of model selection criteria. Ecol. Appl. 2011, 21, 335–342. [Google Scholar] [CrossRef] [PubMed]
- Bradie, J.; Leung, B. A quantitative synthesis of the importance of variables used in MaxEnt species distribution models. J. Biogeogr. 2017, 44, 1344–1361. [Google Scholar] [CrossRef]
- Gong, J.; Chen, W.; Liu, Y.; Wang, J. The intensity change of urban development land: Implications for the city master plan of Guangzhou, China. Land Use Policy 2014, 40, 91–100. [Google Scholar] [CrossRef]
- Wang, T.-C.; Lee, H.-D. Developing a fuzzy TOPSIS approach based on subjective weights and objective weights. Expert Syst. Appl. 2009, 36, 8980–8985. [Google Scholar] [CrossRef]
- Yackulic, C.B.; Chandler, R.; Zipkin, E.F.; Royle, J.A.; Nichols, J.D.; Campbell Grant, E.H.; Veran, S. Presence-only modelling using MAXENT: When can we trust the inferences? Methods Ecol. Evol. 2013, 4, 236–243. [Google Scholar] [CrossRef]
- Fernández, I.C.; Morales, N.S. One-class land-cover classification using MaxEnt: The effect of modelling parameterization on classification accuracy. PeerJ 2019, 7, e7016. [Google Scholar] [CrossRef]
- Zhang, H.; Li, H.; Zhang, J.; Wang, J.; Wang, G.; Shan, Y.; Zheng, H. Simulation of wetland distribution in the Yellow River Basin based on an improved Markov-FLUS model. Environ. Res. Lett. 2024, 19, 104001. [Google Scholar] [CrossRef]
- Xu, K.; Kong, C.; Li, J.; Zhang, L.; Wu, C. Suitability evaluation of urban construction land based on geo-environmental factors of Hangzhou, China. Comput. Geosci. 2011, 37, 992–1002. [Google Scholar]
- Xu, Y.; Wang, T.; Liu, W.; Zhang, R.; Hu, Y.; Gao, W.; Chen, Y. Rural system sustainability evaluation based on emergy analysis: An empirical study of 321 villages in China. J. Clean. Prod. 2023, 389, 136088. [Google Scholar]
- Yang, Y.; Bao, W.; Liu, Y. Coupling coordination analysis of rural production-living-ecological space in the Beijing-Tianjin-Hebei region. Ecol. Indic. 2020, 117, 106512. [Google Scholar]
- Huang, Z.; He, C.; Zhu, S. Do China’s economic development zones improve land use efficiency? The effects of selection, factor accumulation and agglomeration. Landsc. Urban Plan. 2017, 162, 145–156. [Google Scholar] [CrossRef]
- Townsend Peterson, A.; Papeş, M.; Eaton, M. Transferability and model evaluation in ecological niche modeling: A comparison of GARP and Maxent. Ecography 2007, 30, 550–560. [Google Scholar]
- Xie, Y.; Liu, C.; Chang, S.; Jiang, B. Urban sustainability: Integrating socioeconomic and environmental data for multi-objective assessment. Sustainability 2022, 14, 9142. [Google Scholar] [CrossRef]
- Li, Z.; Liu, Y.; Zeng, H. Application of the MaxEnt model in improving the accuracy of ecological red line identification: A case study of Zhanjiang, China. Ecol. Indic. 2022, 137, 108767. [Google Scholar]
- Zhao, Z.; Yang, K. Suitability matching evaluation of the low-carbon regional integrated energy system based on the “resource-demand” balance. Sustain. Energy Technol. Assess. 2024, 72, 104099. [Google Scholar]
- Reinhardt, J.; Liersch, S.; Abdeladhim, M.A.; Diallo, M.; Dickens, C.; Fournet, S.; Hattermann, F.F.; Kabaseke, C.; Muhumuza, M.; Mul, M.L. Systematic evaluation of scenario assessments supporting sustainable integrated natural resources management. Ecol. Soc. 2018, 23, 5. [Google Scholar] [CrossRef]
- Rahman, M.M.; Szabó, G. Multi-objective urban land use optimization using spatial data: A systematic review. Sustain. Cities Soc. 2021, 74, 103214. [Google Scholar] [CrossRef]
- Chun, B.; Guldmann, J.-M. Spatial statistical analysis and simulation of the urban heat island in high-density central cities. Landsc. Urban Plan. 2014, 125, 76–88. [Google Scholar]
- Koc, K.; Ekmekcioğlu, Ö.; Özger, M. An integrated framework for the comprehensive evaluation of low impact development strategies. J. Environ. Manag. 2021, 294, 113023. [Google Scholar]


| Index | Data Source |
|---|---|
| Elevation | NASA (SRTM dataset) |
| Slope | SRTM data calculations |
| GDP | Geographic Data Sharing Infrastructure, Global Resources Data Cloud (www.gis5g.com (accessed on 8 January 2024)) |
| Population Density | GEE (WorldPop) |
| NDVI | MOD13Q1 v006 dataset |
| FVC | Geographic Data Sharing Infrastructure, Global Resources Data Cloud (www.gis5g.com (accessed on 8 January 2024)) |
| LAI | Geographic Data Sharing Infrastructure, Global Resources Data Cloud (www.gis5g.com (accessed on 8 January 2024)) |
| Soil Particle Size Distribution | Data from the Second Soil Census |
| Soil Bulk Density | Data from the Second Soil Census |
| Soil Depth | Data from the Second Soil Census |
| Land Use | Geographic Data Sharing Infrastructure, Global Resources Data Cloud (www.gis5g.com (accessed on 8 January 2024)) |
| Road Density | Geographic Data Sharing Infrastructure, Global Resources Data Cloud (www.gis5g.com (accessed on 8 January 2024)) |
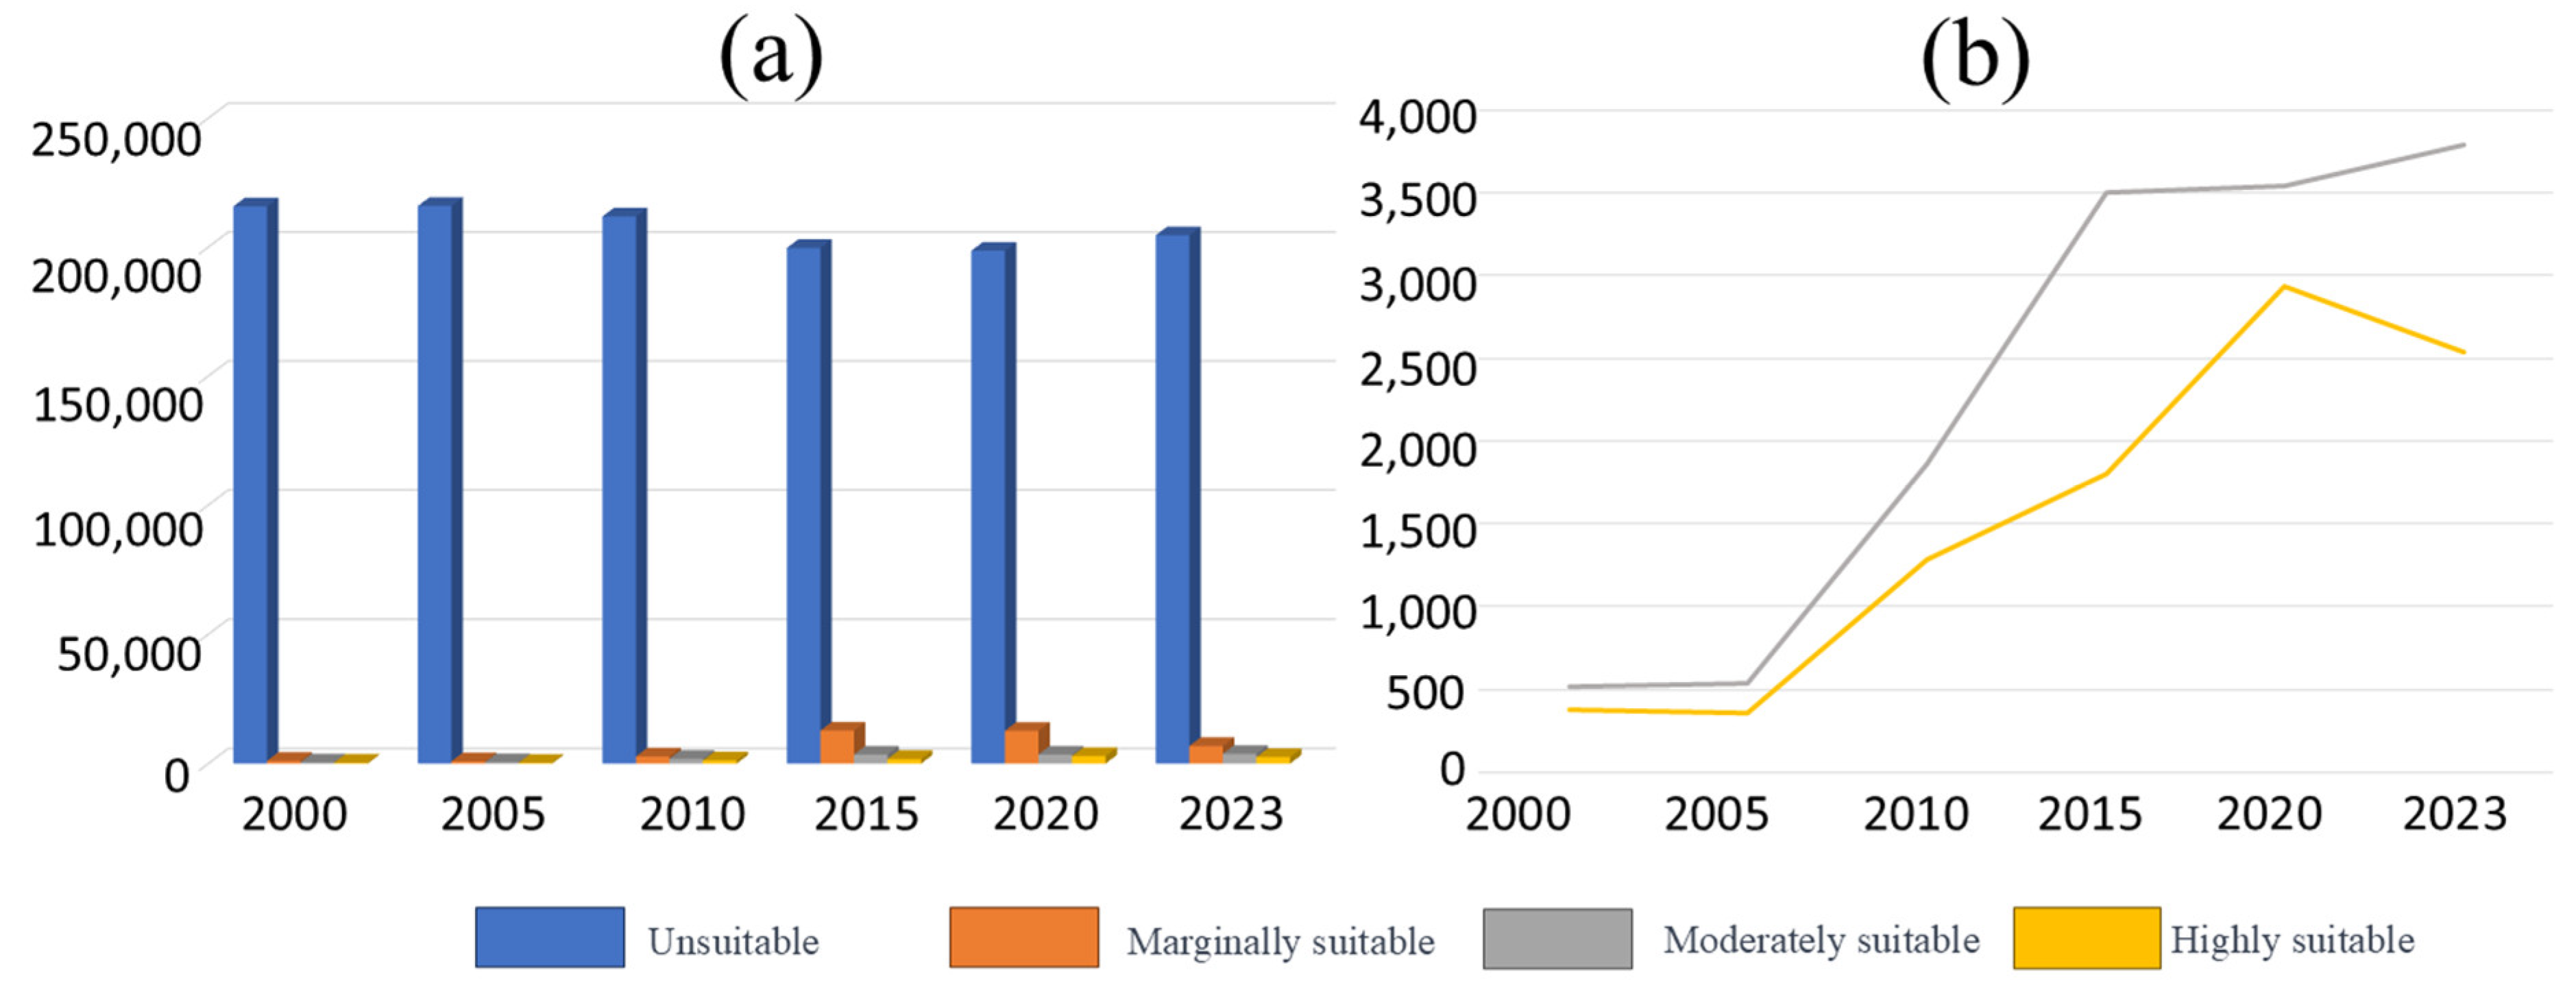
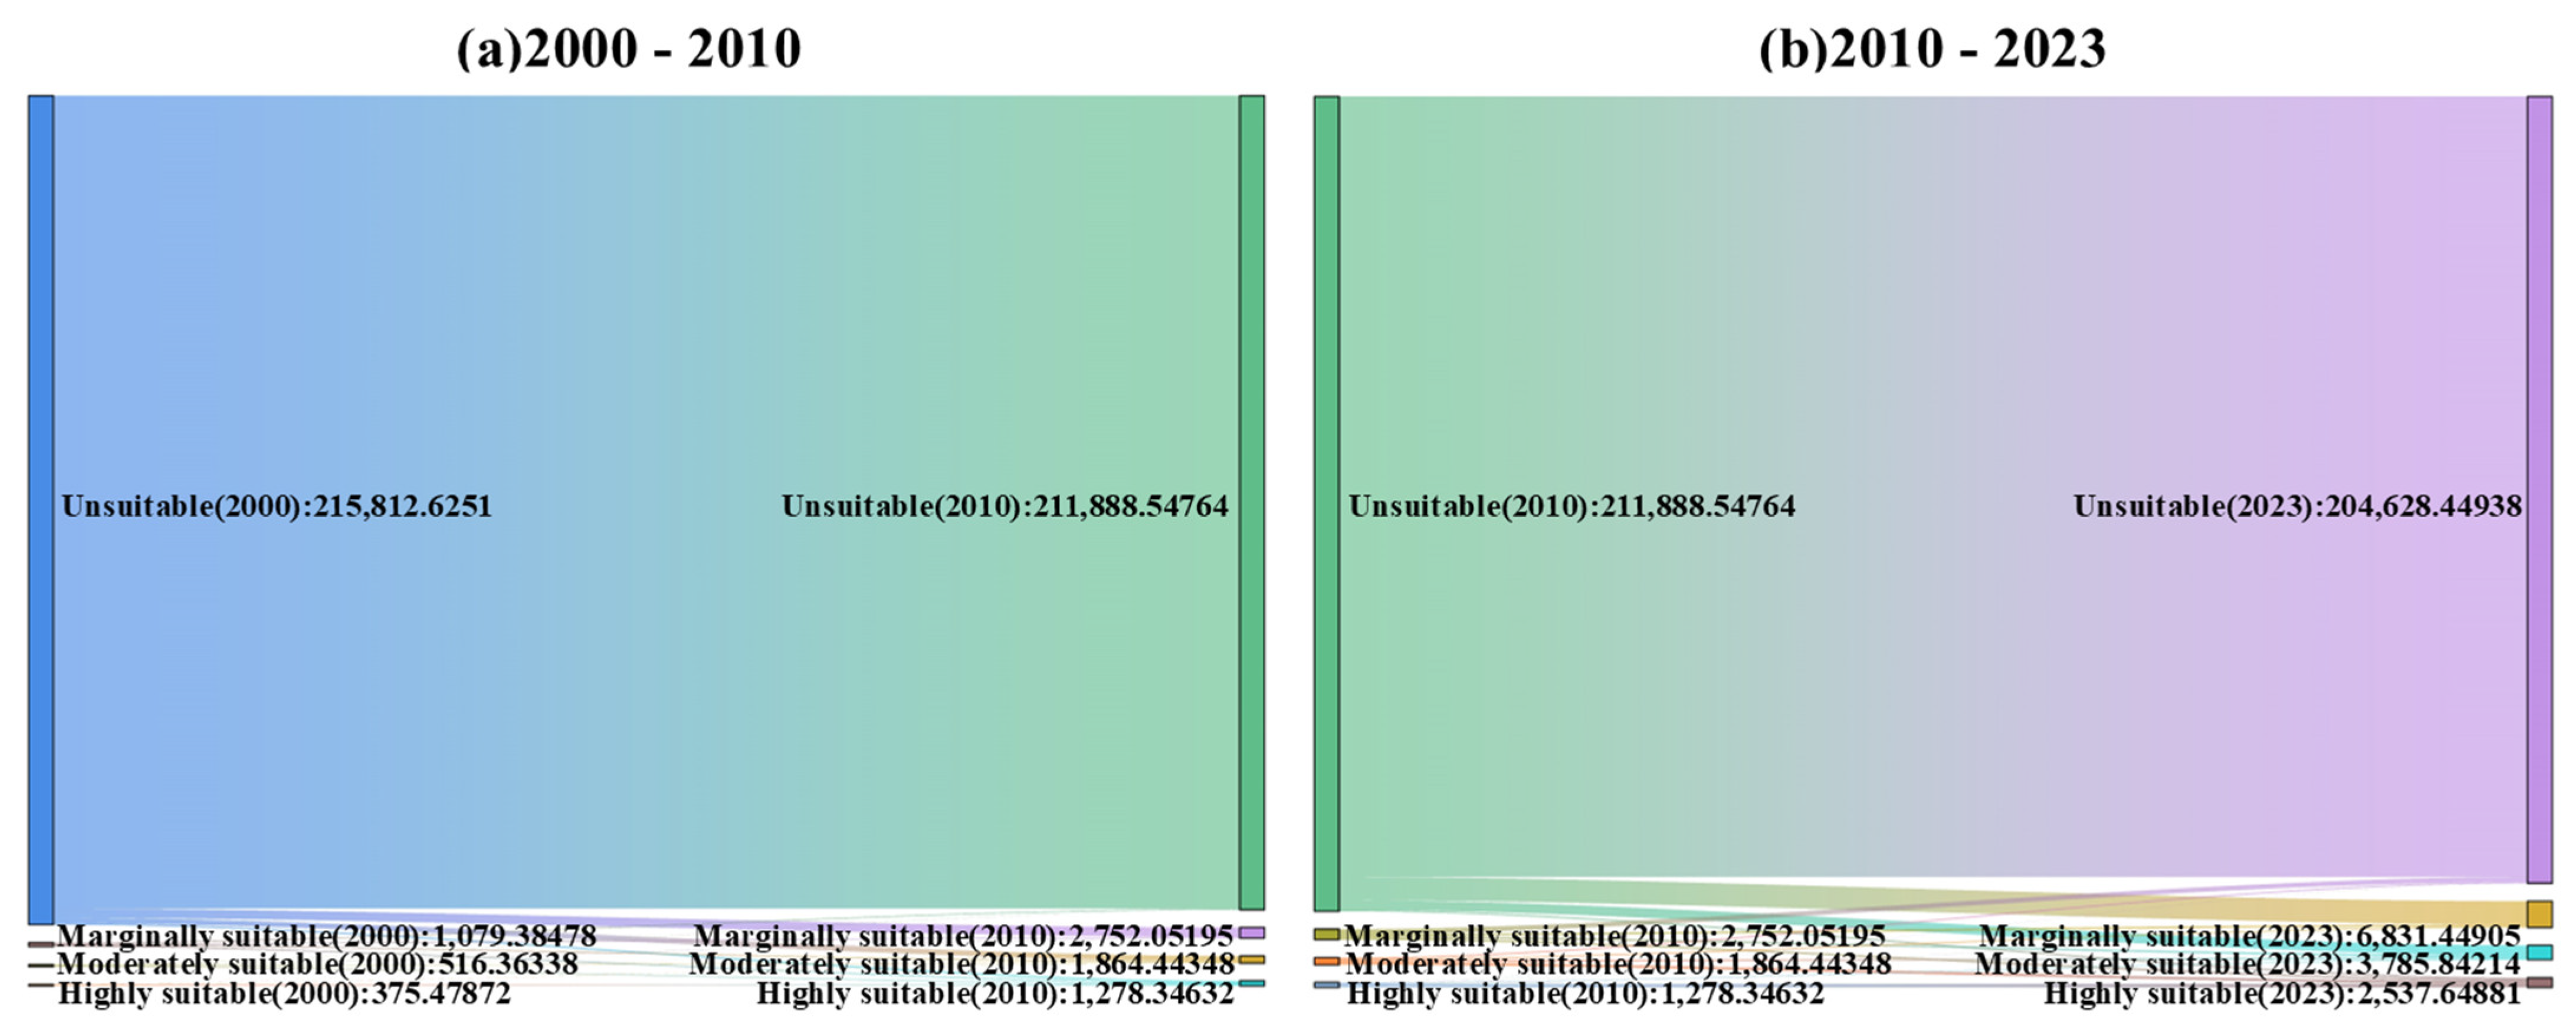
| Suitability Level | 2010 | 2005 | 2010 | 2015 | 2020 | 2023 |
|---|---|---|---|---|---|---|
| Highly suitable | 375.5 | 354.2 | 211,888.5 | 199,697.2 | 198,593.1 | 204,628.4 |
| Moderately suitable | 516.4 | 537.9 | 1864.4 | 3503.5 | 3545.4 | 3785.8 |
| Marginally suitable | 1079.4 | 918.3 | 2752.1 | 12,779.7 | 12,710.4 | 6831.4 |
| Unsuitable | 215,812.2 | 215,972.1 | 211,888.5 | 199,697.2 | 198,593.1 | 204,628.4 |
| Total | 217,783.4 | 217,783.4 | 217,783.4 | 217,783.4 | 217,783.4 | 217,783.4 |
Disclaimer/Publisher’s Note: The statements, opinions and data contained in all publications are solely those of the individual author(s) and contributor(s) and not of MDPI and/or the editor(s). MDPI and/or the editor(s) disclaim responsibility for any injury to people or property resulting from any ideas, methods, instructions or products referred to in the content. |
© 2025 by the authors. Licensee MDPI, Basel, Switzerland. This article is an open access article distributed under the terms and conditions of the Creative Commons Attribution (CC BY) license (https://creativecommons.org/licenses/by/4.0/).
Share and Cite
Zhang, G.; Zhang, L.; Samat, A.; Wu, Y.; Cao, W.; Luo, K. Evaluation of Land Suitability for Construction in the Turpan–Hami Region Based on the Integration of the MaxEnt Model and Regional Planning. Land 2025, 14, 775. https://doi.org/10.3390/land14040775
Zhang G, Zhang L, Samat A, Wu Y, Cao W, Luo K. Evaluation of Land Suitability for Construction in the Turpan–Hami Region Based on the Integration of the MaxEnt Model and Regional Planning. Land. 2025; 14(4):775. https://doi.org/10.3390/land14040775
Chicago/Turabian StyleZhang, Guangpeng, Li Zhang, Alim Samat, Yin Wu, Wa Cao, and Kaiyue Luo. 2025. "Evaluation of Land Suitability for Construction in the Turpan–Hami Region Based on the Integration of the MaxEnt Model and Regional Planning" Land 14, no. 4: 775. https://doi.org/10.3390/land14040775
APA StyleZhang, G., Zhang, L., Samat, A., Wu, Y., Cao, W., & Luo, K. (2025). Evaluation of Land Suitability for Construction in the Turpan–Hami Region Based on the Integration of the MaxEnt Model and Regional Planning. Land, 14(4), 775. https://doi.org/10.3390/land14040775