

Risk Assessment of Yellow Muddy Water in High-Construction-Intensity Cities Based on the GIS Analytic Hierarchy Process Method: A Case Study of Guangzhou City


 and
and
Abstract
:1. Introduction
2. Materials and Methods
2.1. Study Area
2.2. Data Sources
2.3. Methodology
2.4. Evaluation Indicators
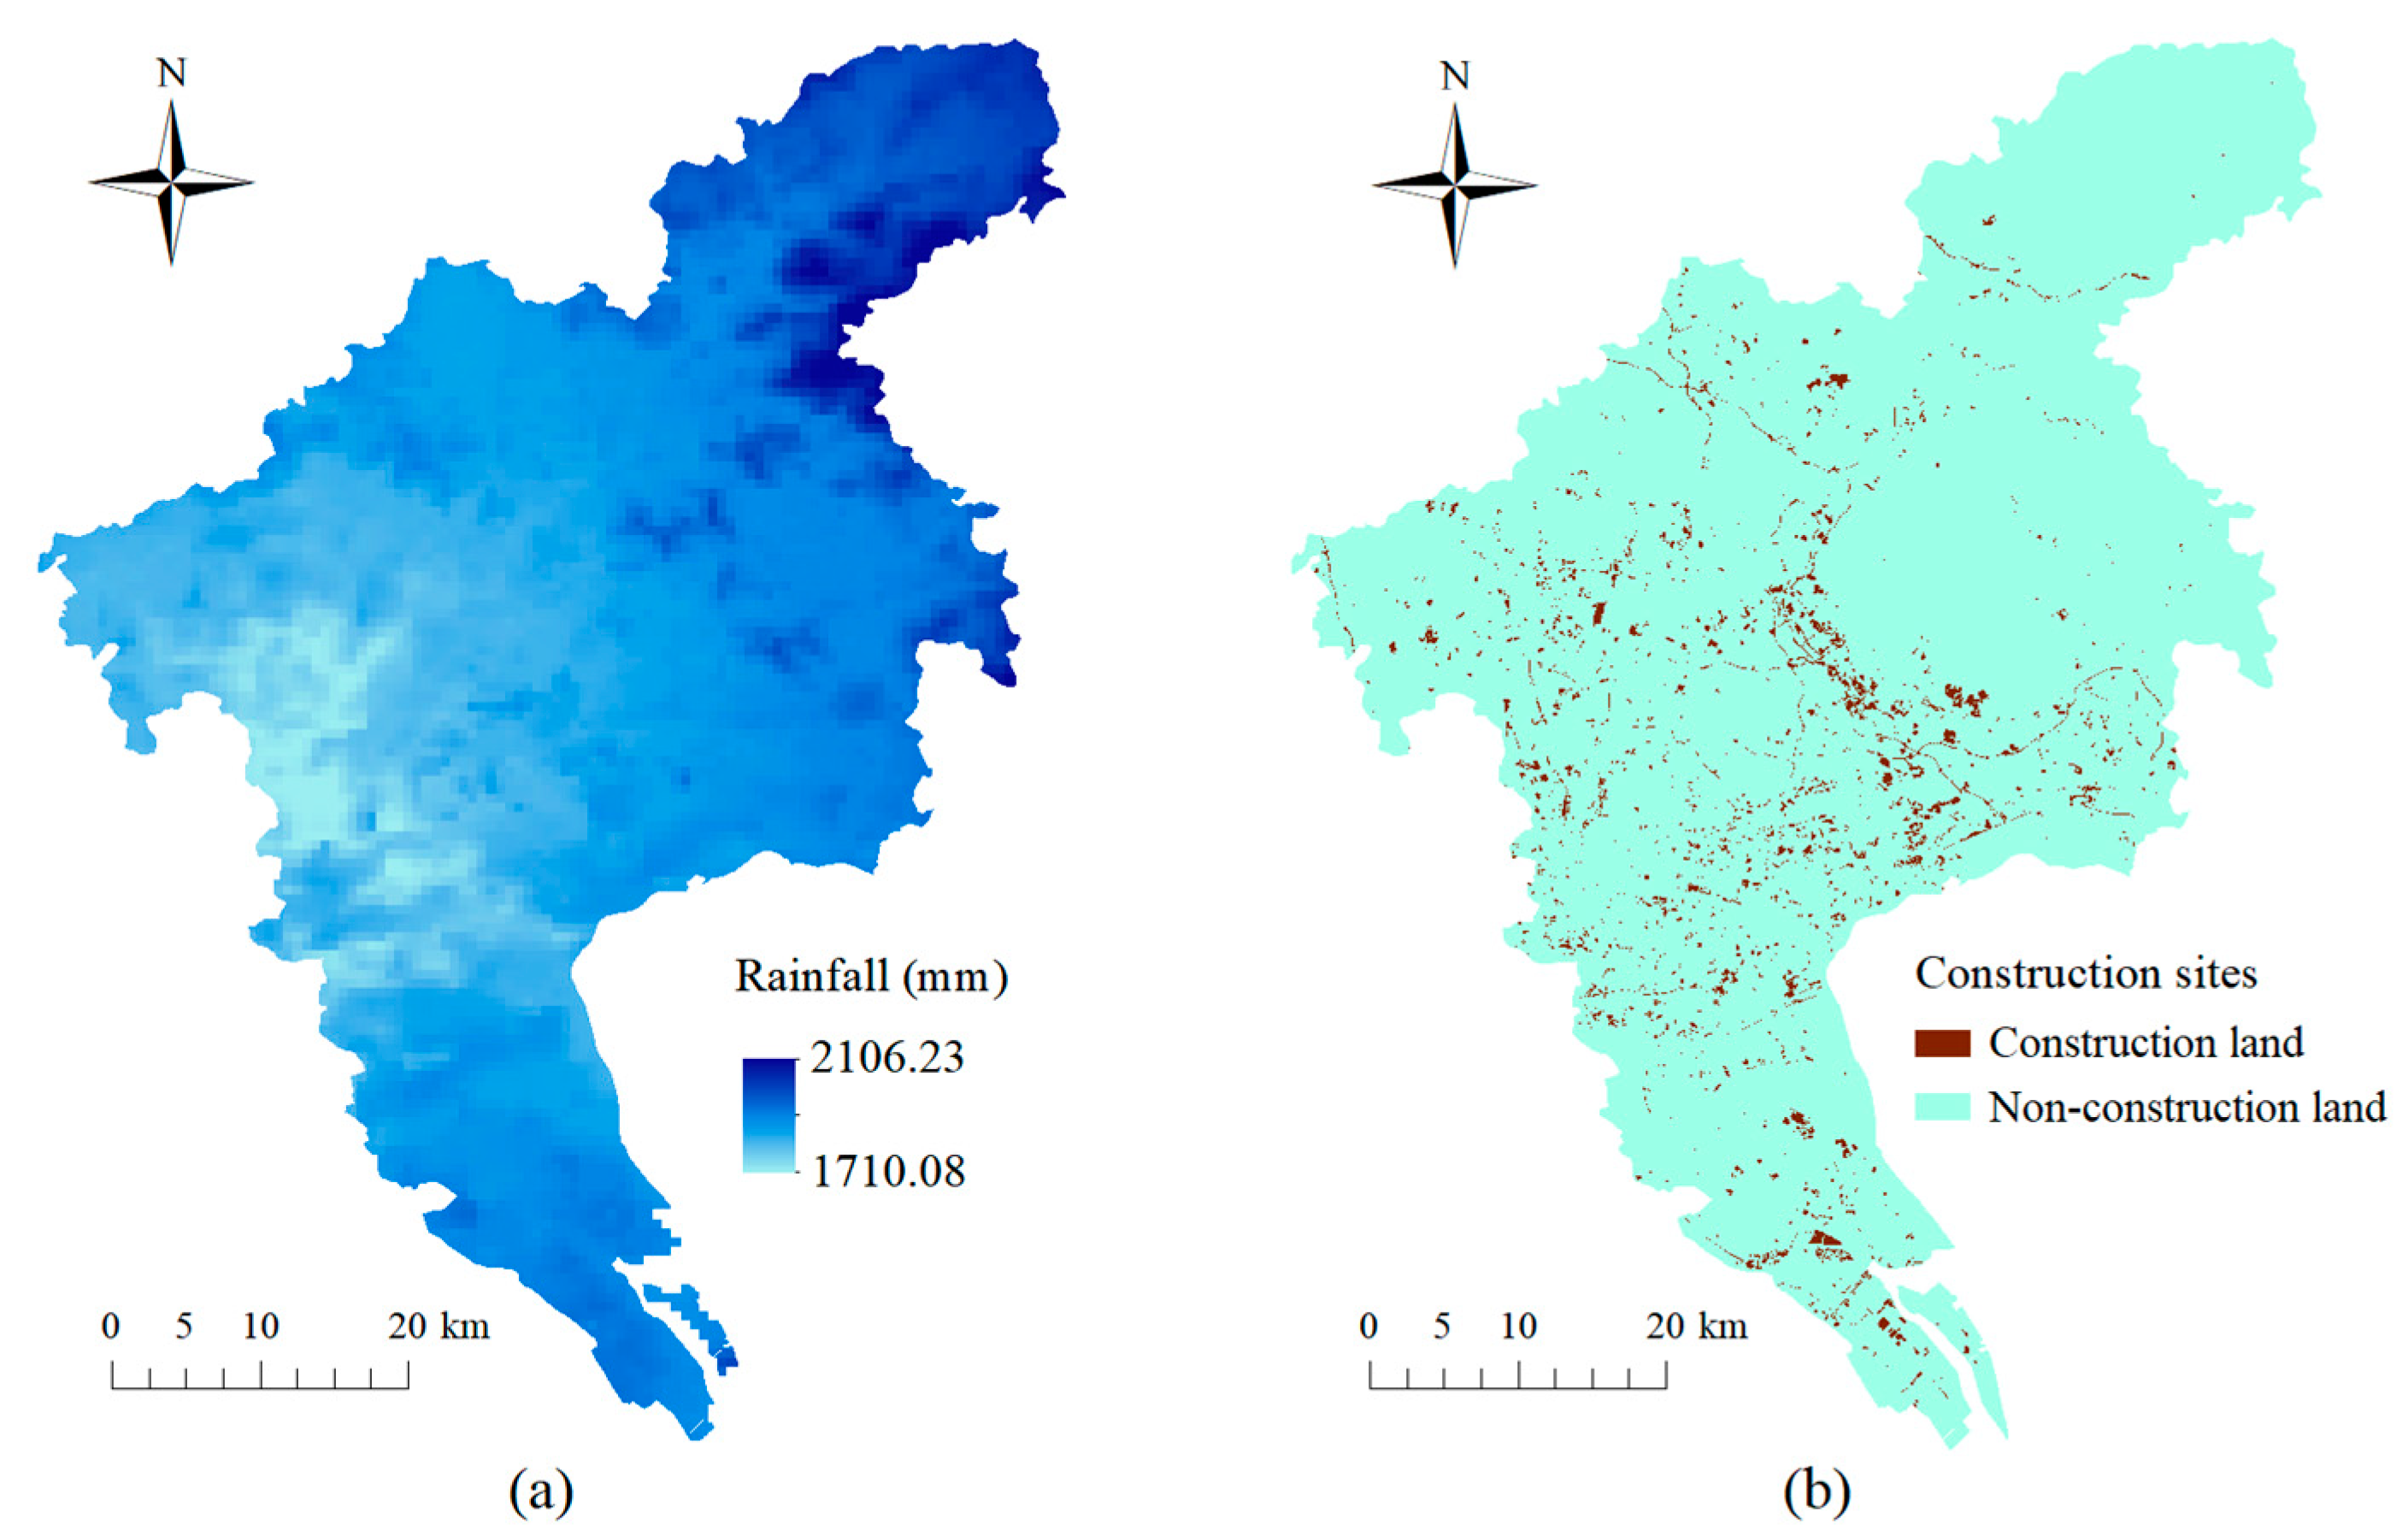
2.4.1. Hazard
- (1)
- Rainfall
- (2)
- Construction site
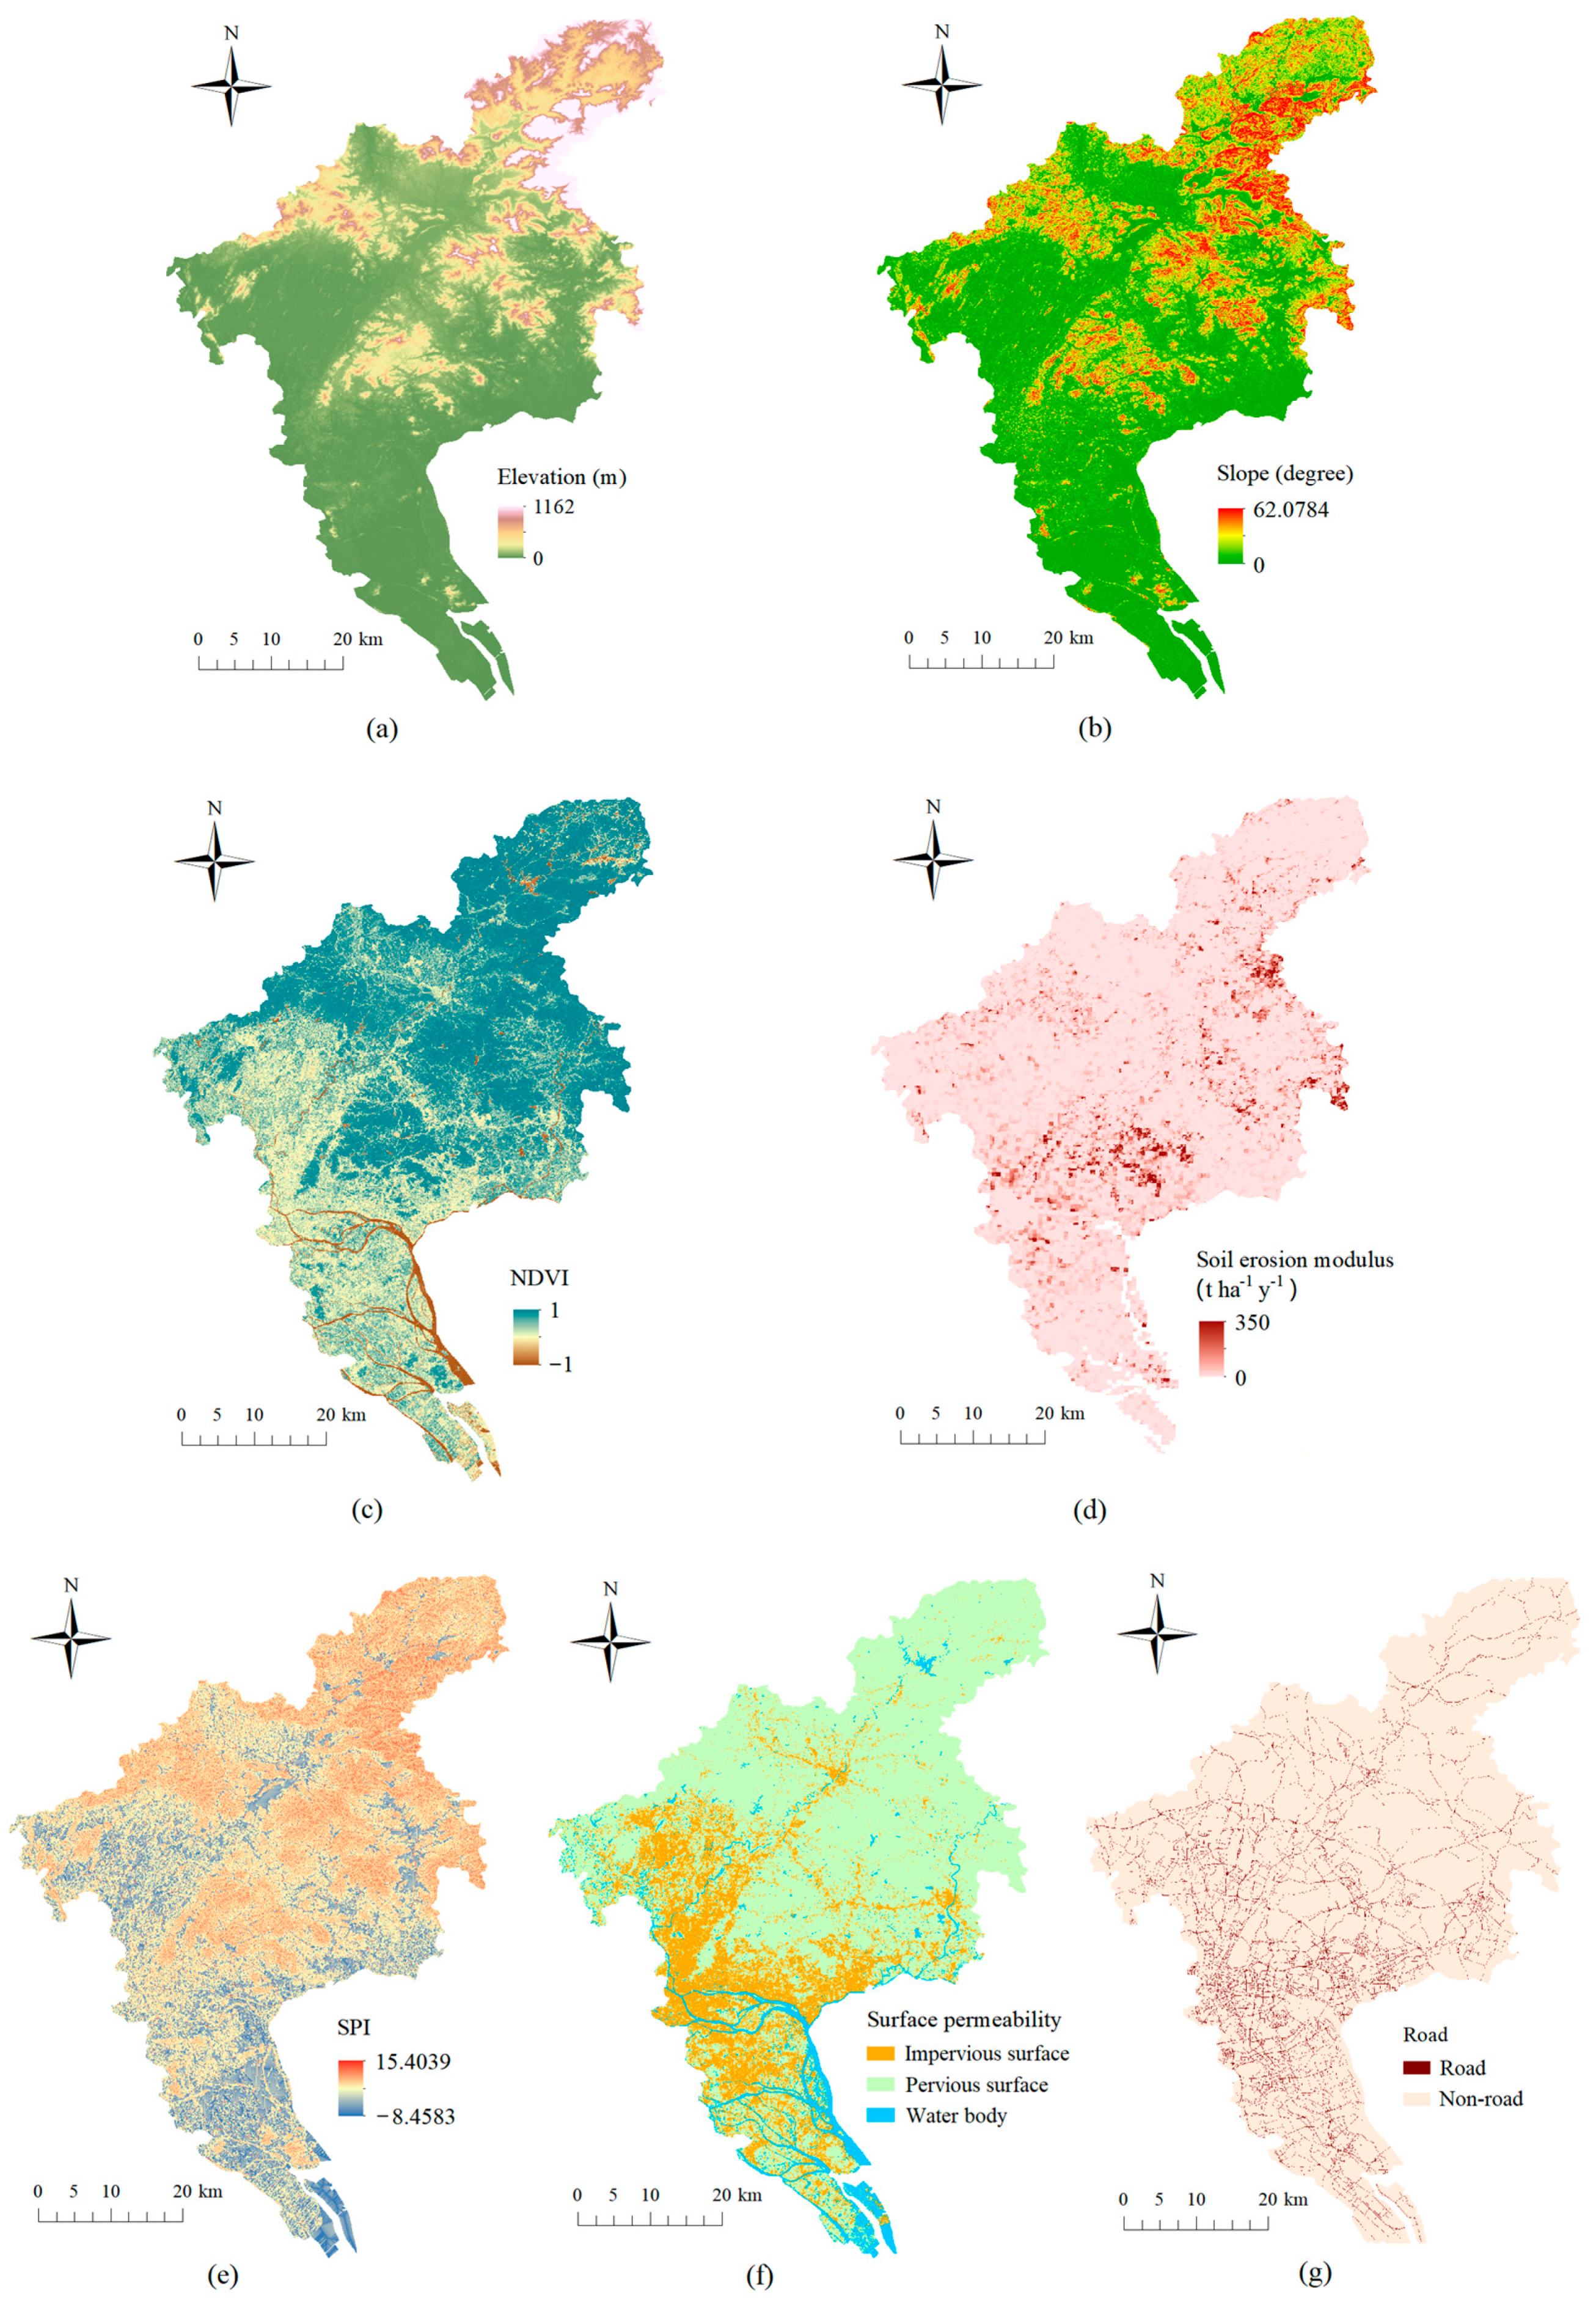
2.4.2. Exposure
- (1)
- Elevation
- (2)
- Slope
- (3)
- NDVI
- (4)
- Soil erosion modulus
- (5)
- SPI
- (6)
- Surface permeability
- (7)
- Road
2.4.3. Vulnerability
- (1)
- Population
- (2)
- GDP
2.5. Weighting
2.5.1. Establish AHP Comparison Matrix
2.5.2. Calculate the Weight
2.5.3. Consistency Check
2.6. Yellow Muddy Water Risk
2.6.1. Standardisation of Evaluation Indicators
2.6.2. Risk Degree
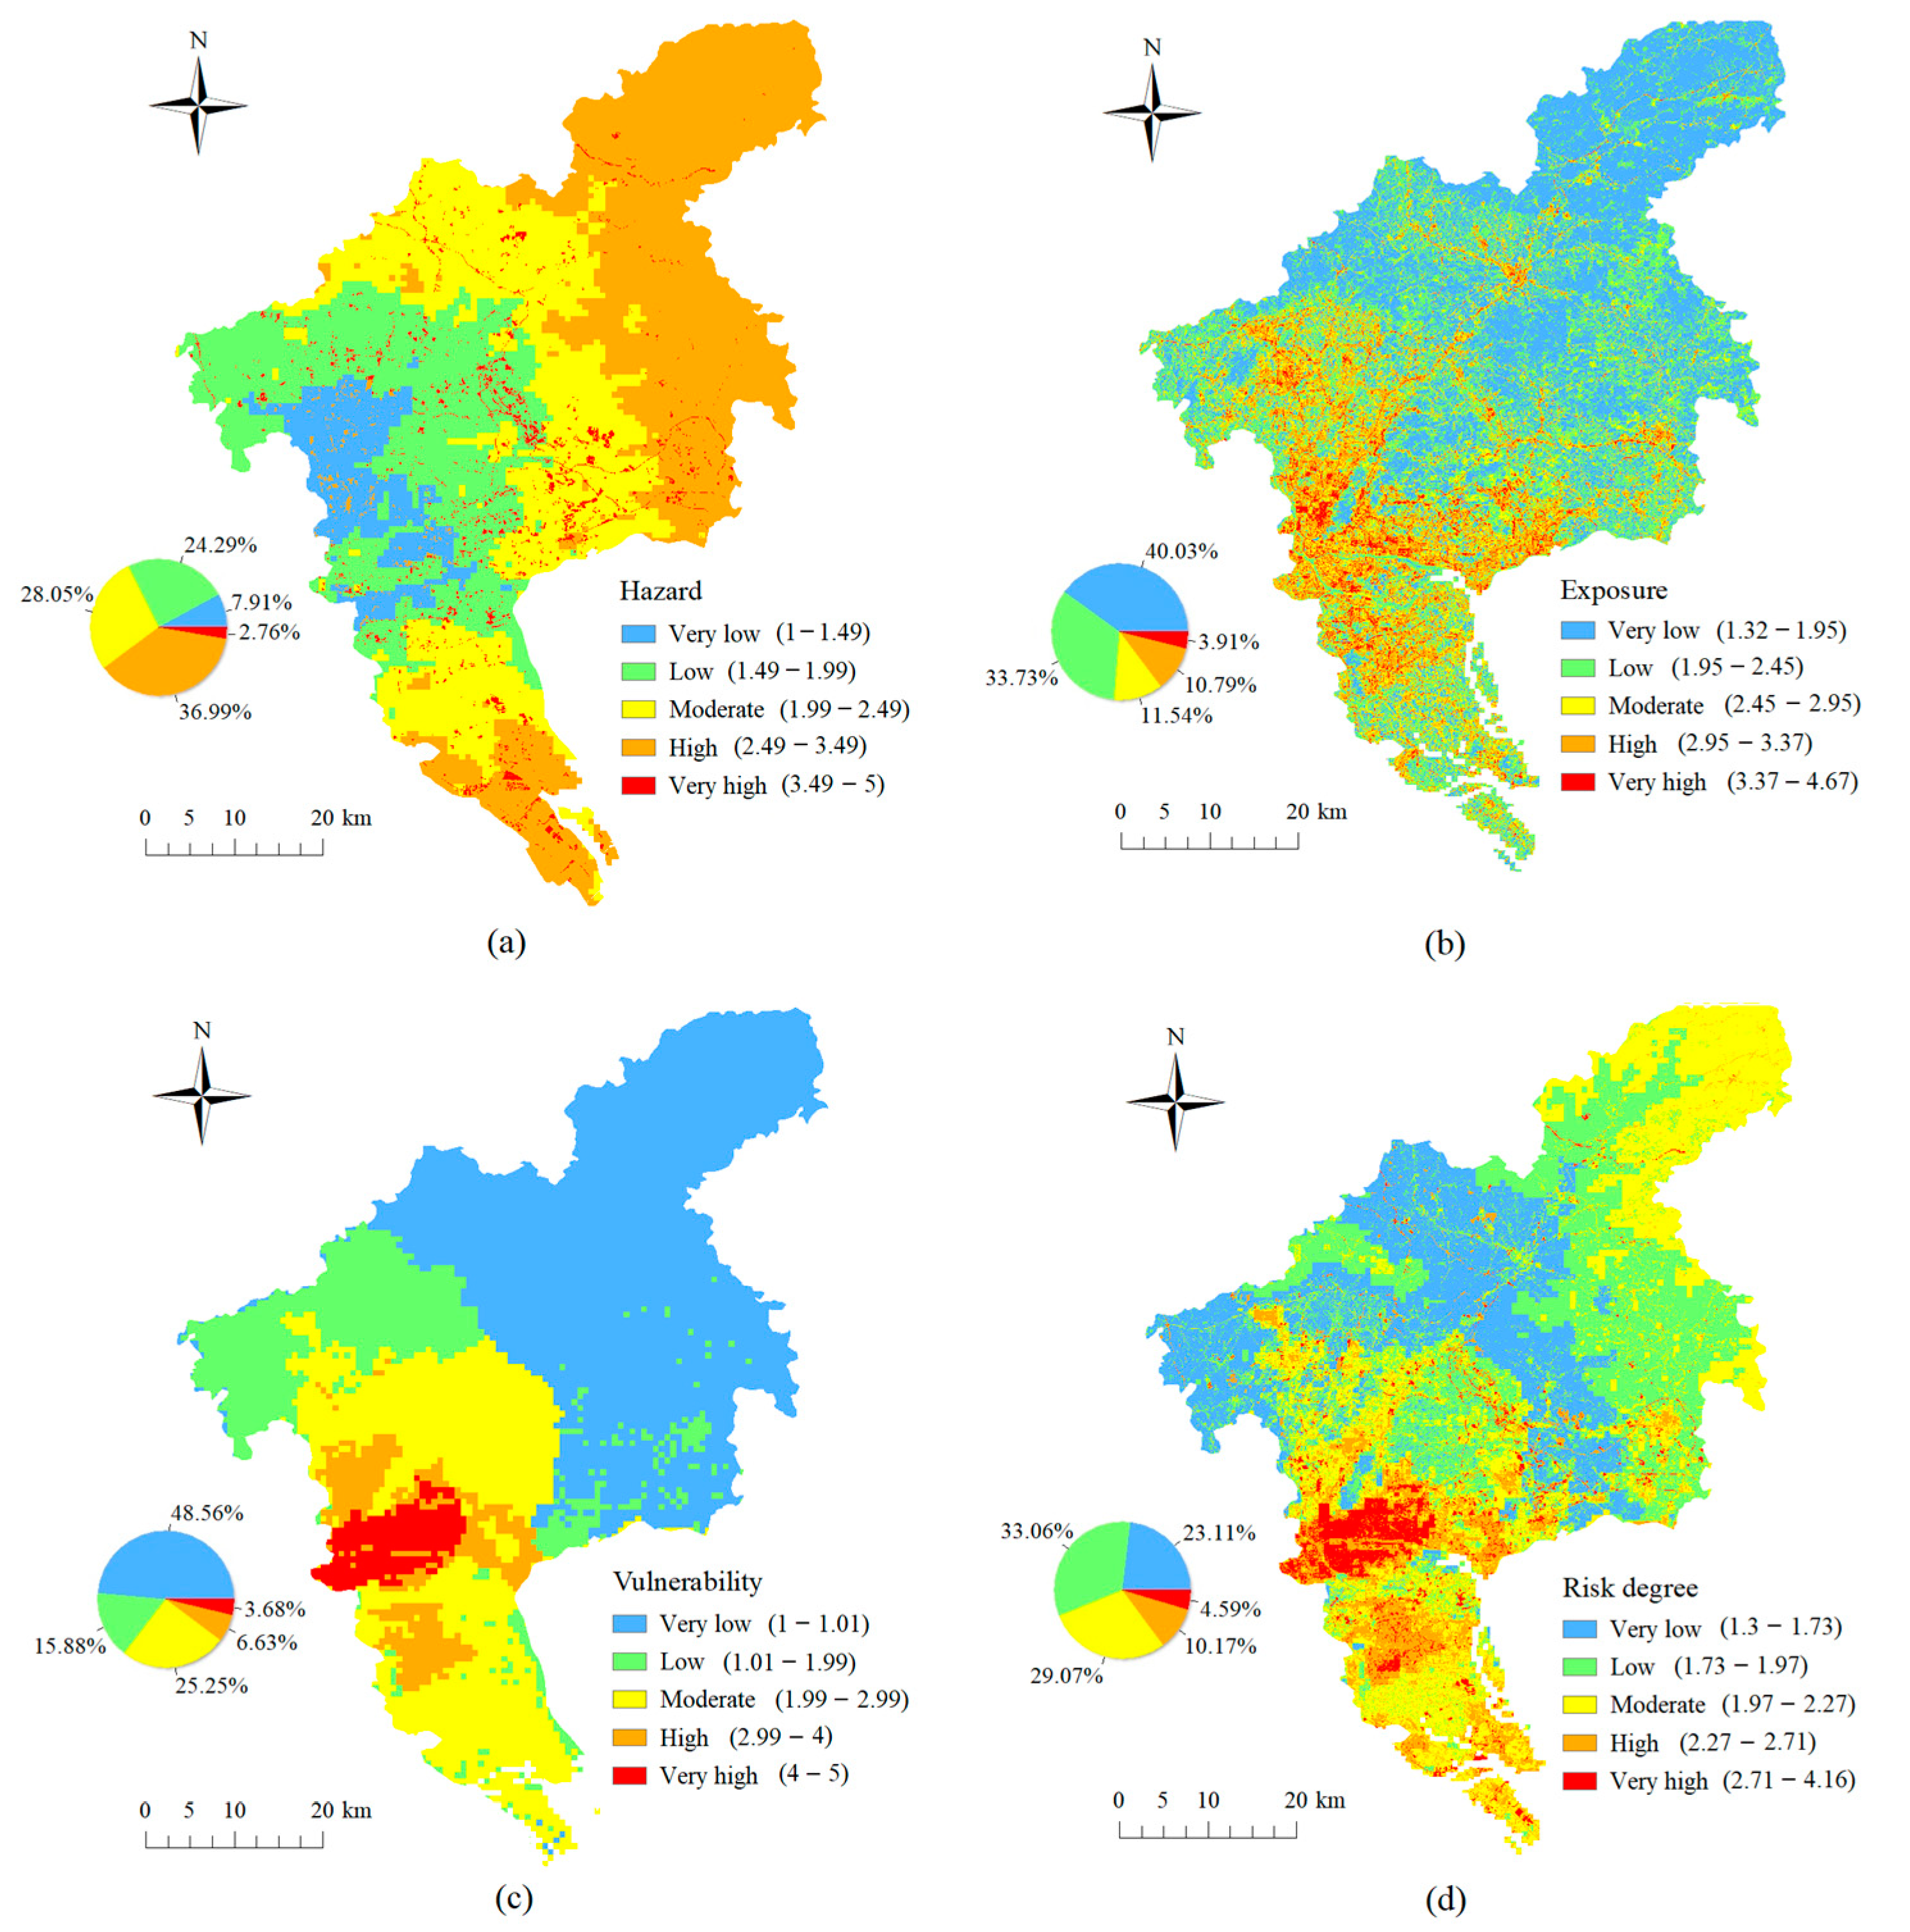
3. Results
3.1. Assessment Results
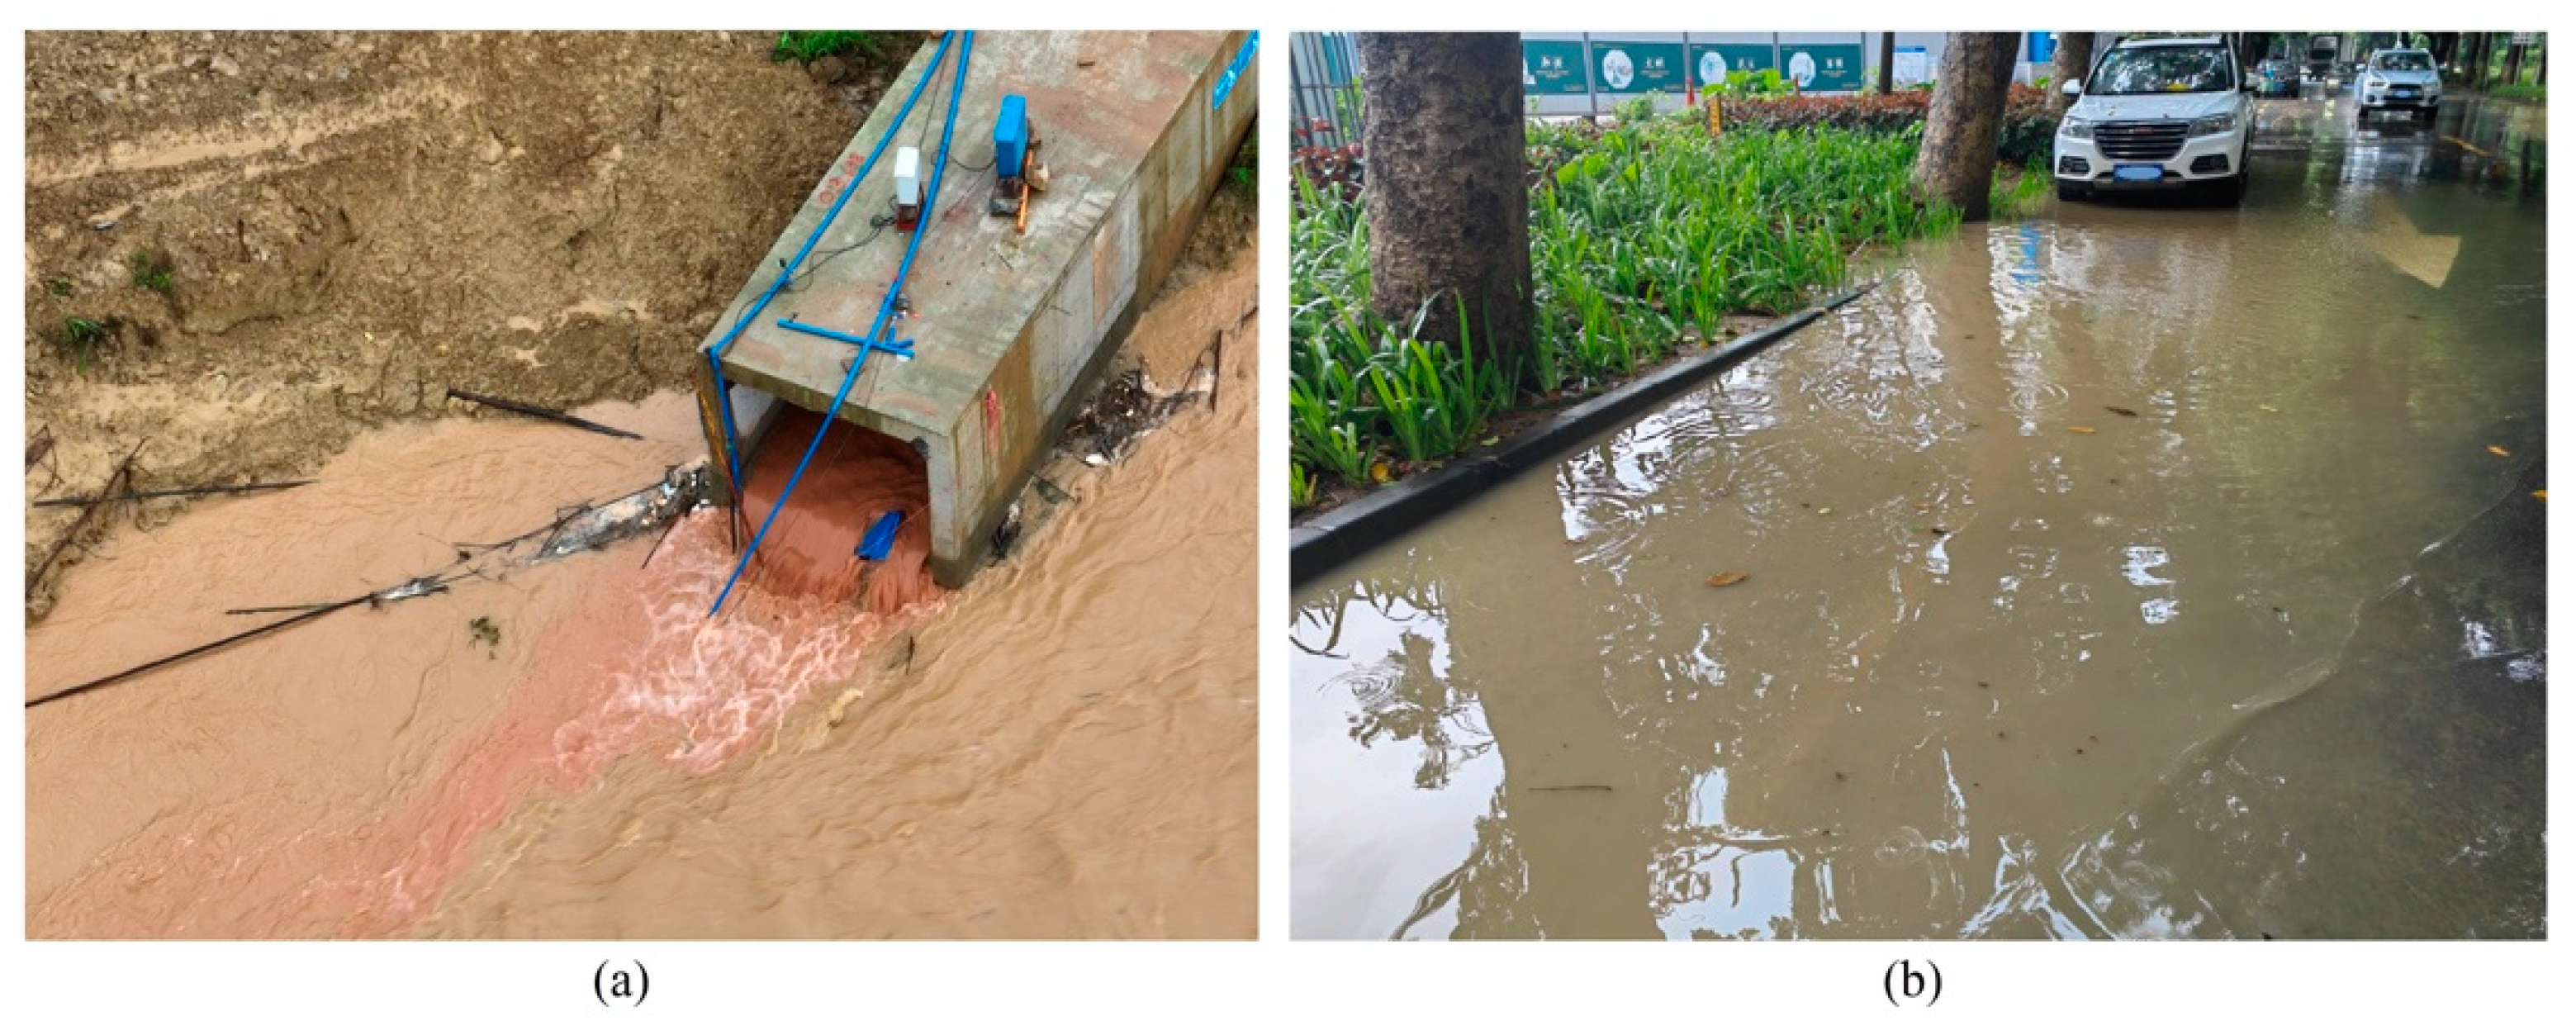
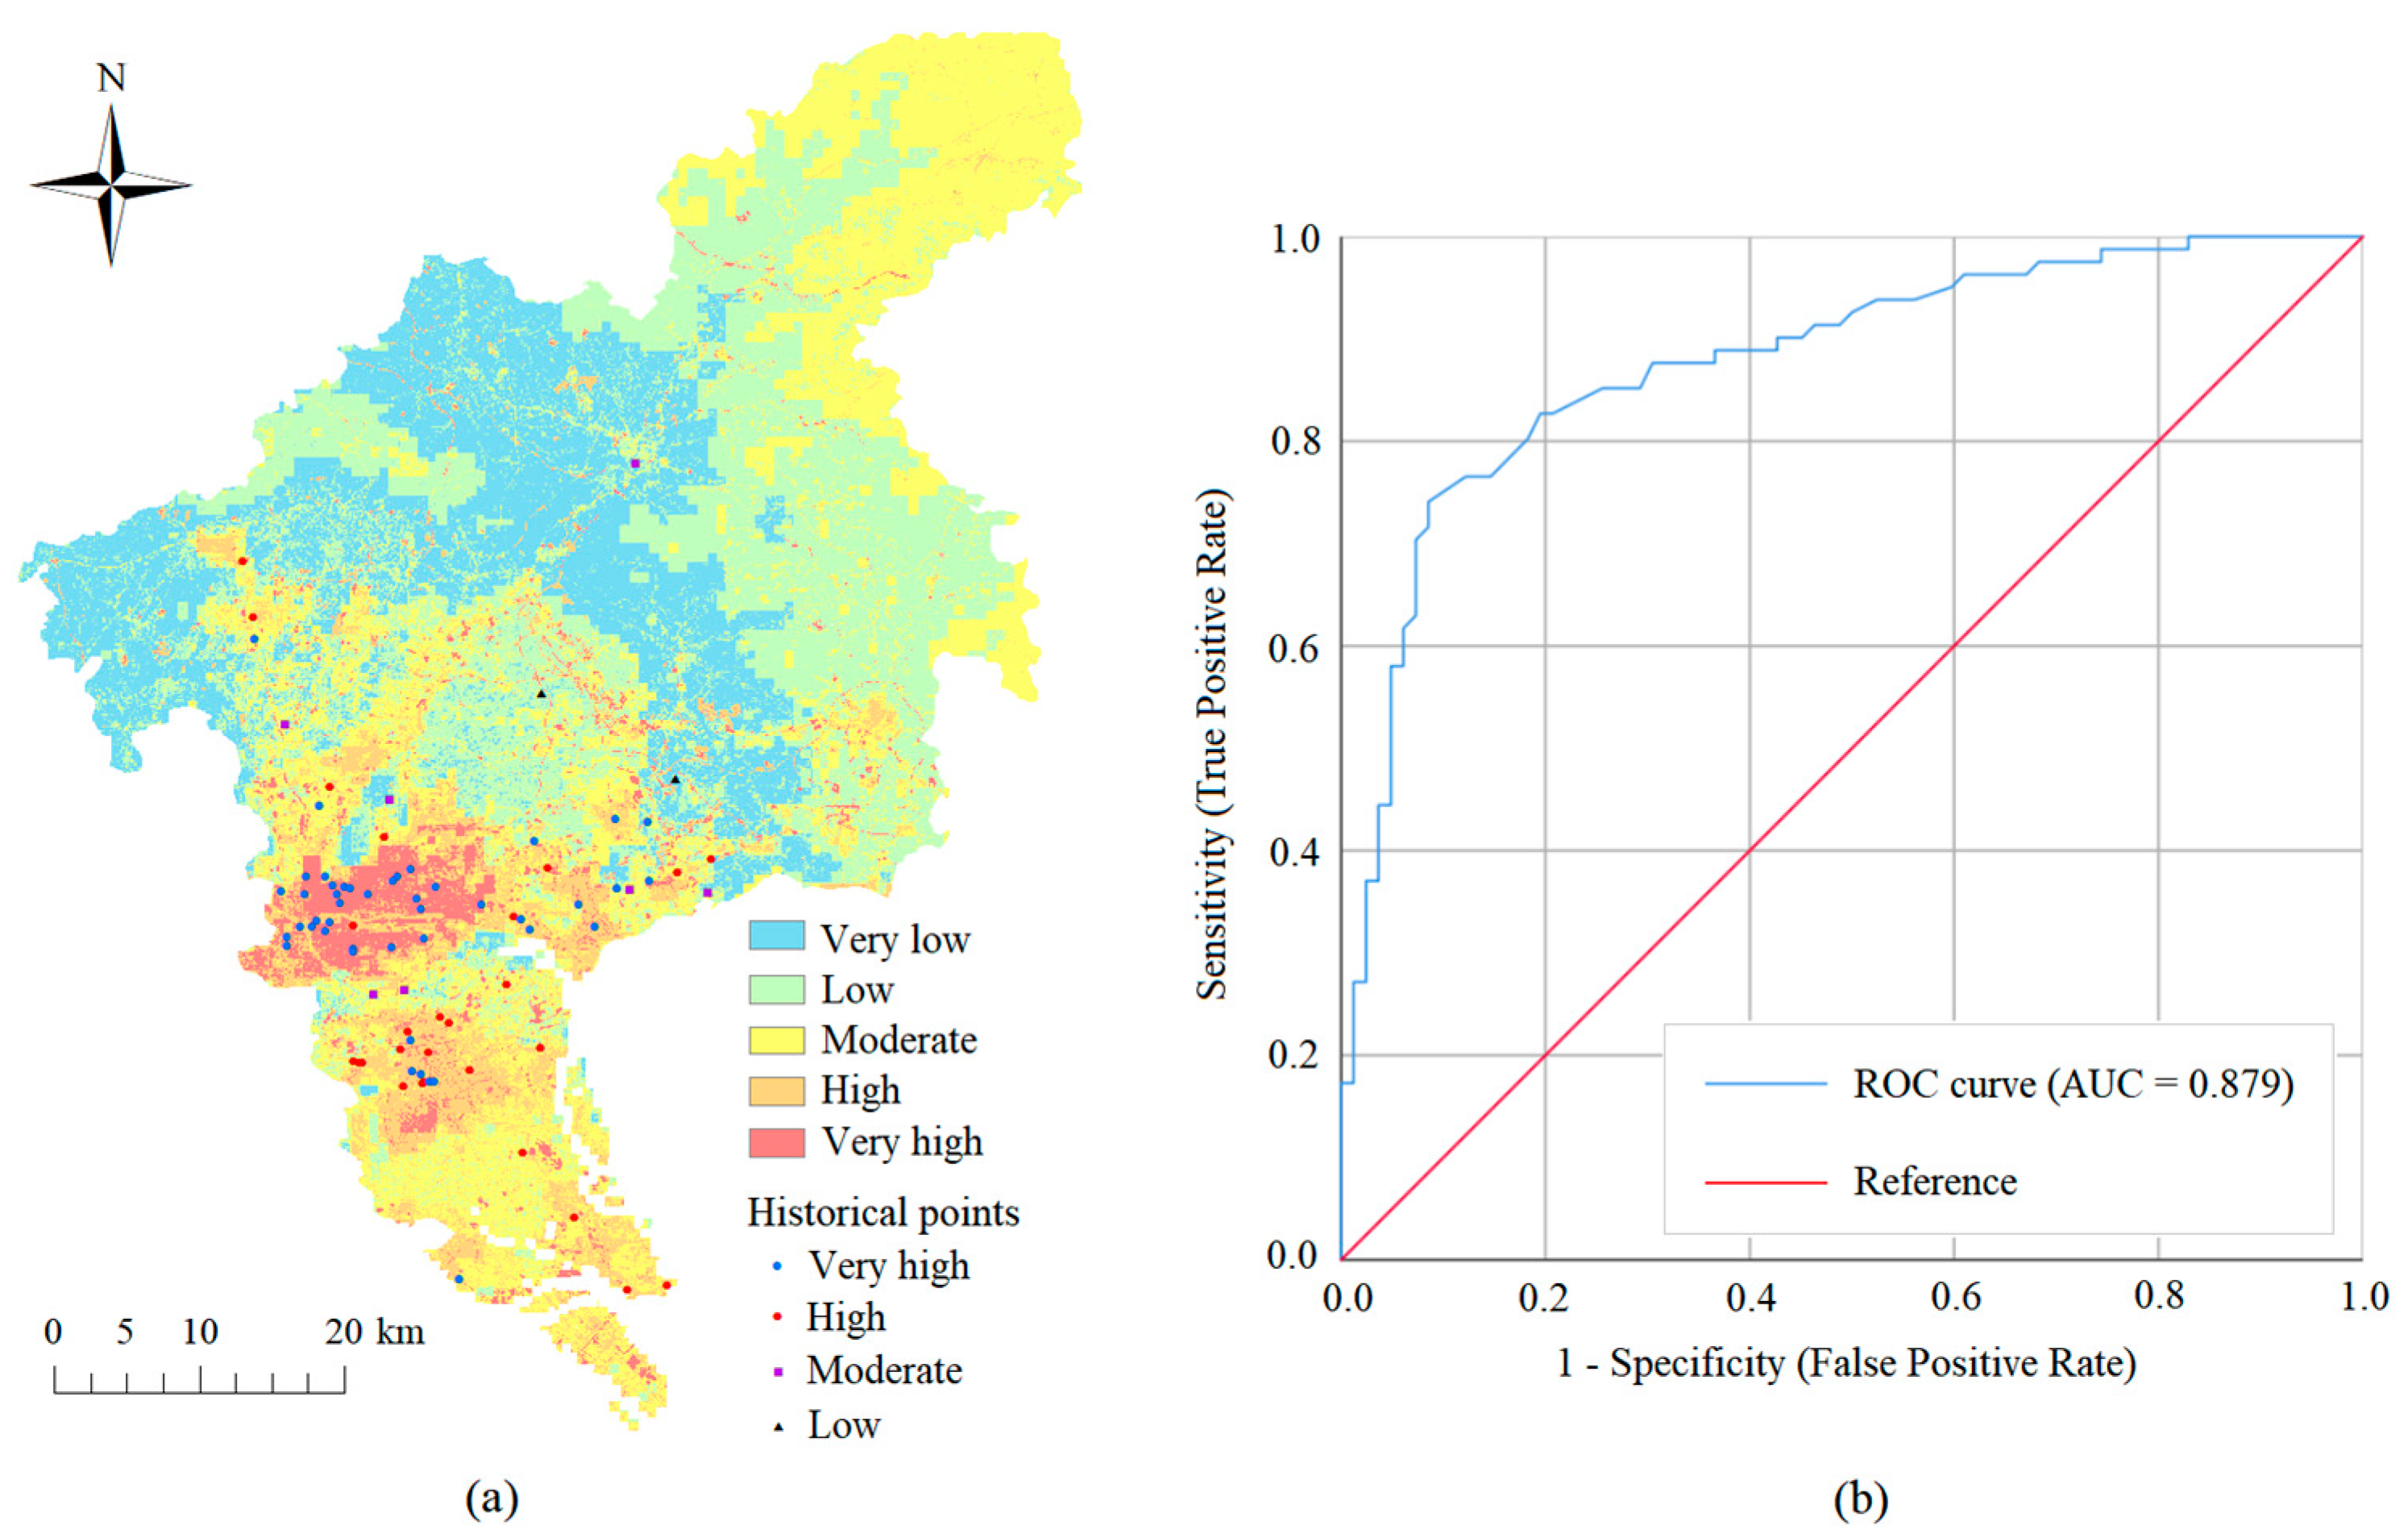
3.2. Validation
4. Discussion
4.1. Disaster Characteristics
4.2. Prevention and Control Measures
5. Conclusions
Author Contributions
Funding
Data Availability Statement
Conflicts of Interest
References
- Yin, Y.; Peng, S.; Ding, X. Multi-scale response relationship between water quality of rivers entering lakes from different pollution source areas and land use intensity: A case study of the three lakes in central Yunnan. Environ. Sci. Pollut. Res. 2024, 31, 11010–11025. [Google Scholar] [CrossRef]
- Huang, Z.; Han, L.; Zeng, L.; Xiao, W.; Tian, Y. Effects of land use patterns on stream water quality: A case study of a small-scale watershed in the Three Gorges Reservoir Area, China. Environ. Sci. Pollut. Res. 2016, 23, 3943–3955. [Google Scholar] [CrossRef]
- Shi, P.; Zhang, Y.; Li, Z.; Li, P.; Xu, G. Influence of land use and land cover patterns on seasonal water quality at multi-spatial scales. Catena 2017, 151, 182–190. [Google Scholar] [CrossRef]
- Nachappa, T.G.; Piralilou, S.T.; Gholamnia, K.; Ghorbanzadeh, O.; Rahmati, O.; Blaschke, T. Flood susceptibility mapping with machine learning, multi-criteria decision analysis and ensemble using Dempster Shafer Theory. J. Hydrol. 2020, 590, 125275. [Google Scholar] [CrossRef]
- Peng, J.; Zhang, J. Urban flooding risk assessment based on GIS-game theory combination weight: A case study of Zhengzhou City. Int. J. Disaster Risk Reduct. 2022, 77, 103080. [Google Scholar] [CrossRef]
- Yan, Y.; Wang, G.; Wu, H.; Gu, G.; Nanding, N. Characteristics of precipitation and floods during typhoons in Guangdong Province. Remote Sens. 2022, 14, 1945. [Google Scholar] [CrossRef]
- Zheng, Q.; Shen, S.L.; Zhou, A.; Lyu, H.M. Inundation risk assessment based on G-DEMATEL-AHP and its application to Zhengzhou flooding disaster. Sustain. Cities Soc. 2022, 86, 104138. [Google Scholar] [CrossRef]
- Amen, A.R.M.; Mustafa, A.; Kareem, D.A.; Hameed, H.M.; Mirza, A.A.; Szydlowski, M.; Saleem, B.K.M. Mapping of flood-prone areas utilizing GIS techniques and remote sensing: A case study of Duhok, Kurdistan Region of Iraq. Remote Sens. 2023, 15, 1102. [Google Scholar] [CrossRef]
- Sado-Inamura, Y.; Fukushi, K. Empirical analysis of flood risk perception using historical data in Tokyo. Land Use Policy 2019, 82, 13–29. [Google Scholar] [CrossRef]
- Xu, H.; Ma, C.; Lian, J.; Xu, K.; Chaima, E. Urban flooding risk assessment based on an integrated k-means cluster algorithm and improved entropy weight method in the region of Haikou, China. J. Hydrol. 2018, 563, 975–986. [Google Scholar] [CrossRef]
- Shrestha, B.B.; Kawasaki, A. Quantitative assessment of flood risk with evaluation of the effectiveness of dam operation for flood control: A case of the Bago River Basin of Myanmar. Int. J. Disaster Risk Reduct. 2020, 50, 101707. [Google Scholar] [CrossRef]
- Zhou, Q.; Su, J.; Arnbjerg-Nielsen, K.; Ren, Y.; Luo, J.; Ye, Z.; Feng, J. A GIS-based hydrological modeling approach for rapid urban flood hazard assessment. Water 2021, 13, 1483. [Google Scholar] [CrossRef]
- Pham, B.T.; Luu, C.; Phong, T.V.; Nguyen, H.D.; Le, H.V.; Tran, T.Q.; Ta, H.T.; Prakash, I. Flood risk assessment using hybrid artificial intelligence models integrated with multi-criteria decision analysis in Quang Nam Province, Vietnam. J. Hydrol. 2021, 592, 125815. [Google Scholar] [CrossRef]
- Toosi, A.S.; Calbimonte, G.H.; Nouri, H.; Alaghmand, S. River basin-scale flood hazard assessment using a modified multi-criteria decision analysis approach: A case study. J. Hydrol. 2019, 574, 660–671. [Google Scholar] [CrossRef]
- Saaty, T.L. Decision-making with the AHP: Why is the principal eigenvector necessary. Eur. J. Oper. Res. 2003, 145, 85–91. [Google Scholar] [CrossRef]
- Saaty, T.L. Decision making with the analytic hierarchy process. Int. J. Serv. Sci. 2008, 1, 83–98. [Google Scholar] [CrossRef]
- Bhuyan, M.J.; Deka, N.; Saikia, A. Micro-spatial flood risk assessment in Nagaon district, Assam (India) using GIS-based multi-criteria decision analysis (MCDA) and analytical hierarchy process (AHP). Risk Anal. 2024, 44, 817–832. [Google Scholar] [CrossRef]
- Chang, D.Y. Applications of the extent analysis method on fuzzy AHP. Eur. J. Oper. Res. 1996, 95, 649–655. [Google Scholar] [CrossRef]
- Liu, Y.; Eckert, C.M.; Earl, C. A review of fuzzy AHP methods for decision-making with subjective judgements. Expert Syst. Appl. 2020, 161, 113738. [Google Scholar] [CrossRef]
- Aslan, V. Determination of Van Basin Groundwater Potential by GIS Based, AHP and Fuzzy-AHP Methods. J. Agric. Sci. 2024, 30, 47–60. [Google Scholar] [CrossRef]
- Sipahi, S.; Timor, M. The analytic hierarchy process and analytic network process: An overview of applications. Manag. Decis. 2010, 48, 775–808. [Google Scholar] [CrossRef]
- Asadabadi, M.R.; Chang, E.; Saberi, M. Are MCDM methods useful? A critical review of analytic hierarchy process (AHP) and analytic network process (ANP). Cogent Eng. 2019, 6, 1623153. [Google Scholar] [CrossRef]
- Lyu, H.M.; Yin, Z.Y.; Zhou, A.; Shen, S.L. Sensitivity analysis of typhoon-induced floods in coastal cities using improved ANP-GIS. Int. J. Disaster Risk Reduct. 2024, 104, 104344. [Google Scholar] [CrossRef]
- Mani, P.; Allen, S.; Kotlarski, S.; Stoffel, M. Climate sensitivity of natural hazards processes in mountain regions: A fuzzy logic approach. Geomorphology 2024, 461, 109329. [Google Scholar] [CrossRef]
- Oleng, M.; Ozdemir, Z.; Pilakoutas, K. Co-seismic and rainfall-triggered landslide hazard susceptibility assessment for Uganda derived using fuzzy logic and geospatial modelling techniques. Nat. Hazards 2024, 120, 14049–14082. [Google Scholar] [CrossRef]
- Xu, B. Prediction of environmental pollution hazard index of water conservancy system based on fuzzy logic. Int. J. Thermofluids 2024, 21, 100549. [Google Scholar] [CrossRef]
- Basheer, I.A.; Hajmeer, M. Artificial neural networks: Fundamentals, computing, design, and application. J. Microbiol. Methods 2000, 43, 3–31. [Google Scholar] [CrossRef]
- Guha, S.; Jana, R.K.; Sanyal, M.K. Artificial neural network approaches for disaster management: A literature review. Int. J. Disaster Risk Reduct. 2022, 81, 103276. [Google Scholar] [CrossRef]
- Ibrahim, M.; Mohamed, A.G. Risks assessment in the construction of infrastructure projects using artificial neural networks. Int. J. Constr. Manag. 2024, 24, 361–373. [Google Scholar] [CrossRef]
- Zhou, J.; Tan, S.; Li, J.; Xu, J.; Wang, C.; Ye, H. Landslide susceptibility assessment using the analytic hierarchy process (AHP): A case study of a construction site for photovoltaic power generation in Yunxian County, Southwest China. Sustainability 2023, 15, 5281. [Google Scholar] [CrossRef]
- Sari, F. Forest fire susceptibility mapping via multi-criteria decision analysis techniques for Mugla, Turkey: A comparative analysis of VIKOR and TOPSIS. For. Ecol. Manag. 2021, 480, 118644. [Google Scholar] [CrossRef]
- Sivrikaya, F.; Küçük, O. Modeling forest fire risk based on GIS-based analytical hierarchy process and statistical analysis in Mediterranean region. Ecol. Inform. 2022, 68, 101537. [Google Scholar] [CrossRef]
- Abdelkarim, A.; Gaber, A.F.D.; Youssef, A.M.; Pradhan, B. Flood hazard assessment of the urban area of Tabuk City, Kingdom of Saudi Arabia by integrating spatial-based hydrologic and hydrodynamic modeling. Sensors 2019, 19, 1024. [Google Scholar] [CrossRef]
- Ghorbanzadeh, O.; Kamran, K.V.; Blaschke, T.; Aryal, J.; Naboureh, A.; Einali, J.; Bian, J. Spatial prediction of wildfire susceptibility using field survey GPS data and machine learning approaches. Fire 2019, 2, 43. [Google Scholar] [CrossRef]
- Costache, R.; Pham, Q.B.; Sharifi, E.; Linh, N.T.T.; Abba, S.I.; Vojtek, M.; Vojteková, J.; Nhi, P.T.T.; Khoi, D.N. Flash-flood susceptibility assessment using multi-criteria decision making and machine learning supported by remote sensing and GIS techniques. Remote Sens. 2019, 12, 106. [Google Scholar] [CrossRef]
- Panchal, S.; Shrivastava, A.K. Landslide hazard assessment using analytic hierarchy process (AHP): A case study of National Highway 5 in India. Ain Shams Eng. J. 2022, 13, 101626. [Google Scholar] [CrossRef]
- Zarei, A.R.; Moghimi, M.M.; Koohi, E. Sensitivity assessment to the occurrence of different types of droughts using GIS and AHP techniques. Water Resour. Manag. 2021, 35, 3593–3615. [Google Scholar] [CrossRef]
- Lu, S.; Huang, J.; Wu, J. Multi-Dimensional Urban Flooding Impact Assessment Leveraging Social Media Data: A Case Study of the 2020 Guangzhou Rainstorm. Water 2023, 15, 4296. [Google Scholar] [CrossRef]
- Lin, W.; Sun, Y.; Nijhuis, S.; Wang, Z. Scenario-based flood risk assessment for urbanizing deltas using future land-use simulation (FLUS): Guangzhou Metropolitan Area as a case study. Sci. Total Environ. 2020, 739, 139899. [Google Scholar] [CrossRef]
- Wang, G.; Liu, L.; Shi, P.; Zhang, G.; Liu, J. Flood risk assessment of metro system using improved trapezoidal fuzzy AHP: A case study of Guangzhou. Remote Sens. 2021, 13, 5154. [Google Scholar] [CrossRef]
- Di Risio, M.; Bruschi, A.; Lisi, I.; Pesarino, V.; Pasquali, D. Comparative analysis of coastal flooding vulnerability and hazard assessment at national scale. J. Mar. Sci. Eng. 2017, 5, 51. [Google Scholar] [CrossRef]
- Zhang, H.; Wu, C.; Chen, W.; Huang, G. Assessing the impact of climate change on the waterlogging risk in coastal cities: A case study of Guangzhou, South China. J. Hydrometeorol. 2017, 18, 1549–1562. [Google Scholar] [CrossRef]
- Zhang, Z.; Xu, W.; Li, L.; Huang, J.; Deng, L.; Wang, Q. Effects of temporal conservation measures on water erosion processes of disturbed soil accumulation in construction projects. J. Clean. Prod. 2021, 319, 128612. [Google Scholar] [CrossRef]
- Cheriyan, D.; Choi, J. A review of research on particulate matter pollution in the construction industry. J Cleaner Prod. 2020, 254, 120077. [Google Scholar] [CrossRef]
- Chen, J.; Li, Q.; Wang, H.; Deng, M. A machine learning ensemble approach based on random forest and radial basis function neural network for risk evaluation of regional flood disaster: A case study of the Yangtze River Delta, China. Int. J. Environ. Res. Public Health 2020, 17, 49. [Google Scholar] [CrossRef]
- Stevaux, J.C.; Macedo, H.D.; Assine, M.L.; Silva, A. Changing fluvial styles and backwater flooding along the Upper Paraguay River plains in the Brazilian Pantanal wetland. Geomorphology 2020, 350, 106906. [Google Scholar] [CrossRef]
- Zhang, Q.; Wu, Z.; Tarolli, P. Investigating the role of green infrastructure on urban waterlogging: Evidence from metropolitan coastal cities. Remote Sens. 2021, 13, 2341. [Google Scholar] [CrossRef]
- Yang, X.; You, X.Y.; Ji, M.; Nima, C. Influence factors and prediction of stormwater runoff of urban green space in Tianjin, China: Laboratory experiment and quantitative theory model. Water Sci. Technol. 2013, 67, 869–876. [Google Scholar] [CrossRef]
- Liu, W.; Chen, W.; Peng, C. Assessing the effectiveness of green infrastructures on urban flooding reduction: A community scale study. Ecol. Modell. 2014, 291, 6–14. [Google Scholar] [CrossRef]
- Richards, P.J.; Farrell, C.; Tom, M.; Williams, N.S.G.; Fletcher, T.D. Vegetable raingardens can produce food and reduce stormwater runoff. Urban For. Urban Green. 2015, 14, 646–654. [Google Scholar] [CrossRef]
- Carlson, T.N.; Ripley, D.A. On the relation between NDVI, fractional vegetation cover, and leaf area index. Remote Sens. Environ. 1997, 62, 241–252. [Google Scholar] [CrossRef]
- Pettorelli, N.; Vik, J.O.; Mysterud, A.; Gaillard, J.M.; Tucker, C.J.; Stenseth, N.C. Using the satellite-derived NDVI to assess ecological responses to environmental change. Trends Ecol. Evol. 2005, 20, 503–510. [Google Scholar] [CrossRef]
- Huang, S.; Tang, L.; Hupy, J.P.; Wang, Y.; Shao, G. A commentary review on the use of normalized difference vegetation index (NDVI) in the era of popular remote sensing. J. For. Res. 2021, 32, 1–6. [Google Scholar] [CrossRef]
- Chen, Y.; Liu, R.; Barrett, D.; Gao, L.; Zhou, M.; Renzullo, L.; Emelyanova, I. A spatial assessment framework for evaluating flood risk under extreme climates. Sci. Total Environ. 2015, 538, 512–523. [Google Scholar] [CrossRef]
- Ghosal, K.; Bhattacharya, S.D. A review of RUSLE model. J. Indian Soc. Remote Sens. 2020, 48, 689–707. [Google Scholar] [CrossRef]
- Mhiret, D.A.; Dagnew, D.C.; Assefa, T.T.; Tilahun, S.A.; Zaitchik, B.F.; Steenhuis, T.S. Erosion hotspot identification in the sub-humid Ethiopian highlands. Ecohydrol. Hydrobiol. 2019, 19, 146–154. [Google Scholar] [CrossRef]
- Benito, G.; Rico, M.; Sánchez-Moya, Y.; Sopeña, A.; Thorndycraft, V.R.; Barriendos, M. The impact of late Holocene climatic variability and land use change on the flood hydrology of the Guadalentín River, southeast Spain. Glob. Planet. Change 2010, 70, 53–63. [Google Scholar] [CrossRef]
- Huang, H.; Chen, X.; Zhu, Z.; Xie, Y.; Liu, L.; Wang, X.W.; Wang, X.N.; Liu, K. The changing pattern of urban flooding in Guangzhou, China. Sci. Total Environ. 2018, 622, 394–401. [Google Scholar] [CrossRef]
- Choo, K.S.; Kang, D.H.; Kim, B.S. Impact assessment of urban flood on traffic disruption using rainfall–depth–vehicle speed relationship. Water 2020, 12, 926. [Google Scholar] [CrossRef]
- Kasmalkar, I.G.; Serafin, K.A.; Miao, Y.F.; Bick, I.A.; Ortolano, L.; Ouyang, D.; Suckale, J. When floods hit the road: Resilience to flood-related traffic disruption in the San Francisco Bay Area and beyond. Sci. Adv. 2020, 6, eaba2423. [Google Scholar] [CrossRef]
- He, H.; Li, R.; Pei, J.; Bilodeau, J.P.; Huang, G. Current overview of impact analysis and risk assessment of urban pluvial flood on road traffic. Sustain. Cities Soc. 2023, 99, 104993. [Google Scholar] [CrossRef]
- Münzel, T.; Hahad, O.; Daiber, A.; Landrigan, P.J. Soil and water pollution and human health: What should cardiologists worry about? Cardiovasc. Res. 2023, 119, 440–449. [Google Scholar] [CrossRef]
- Amoatey, P.; Baawain, M.S. Effects of pollution on freshwater aquatic organisms. Water Environ. Res. 2019, 91, 1272–1287. [Google Scholar] [CrossRef]
- Pandiyan, J.; Mahboob, S.; Govindarajan, M.; Al-Ghanim, K.A.; Ahmed, Z.; Al-Mulhm, N.; Jagadheesan, R.; Krishnappa, K. An assessment of level of heavy metals pollution in the water, sediment and aquatic organisms: A perspective of tackling environmental threats for food security. Saudi J. Biol. Sci. 2021, 28, 1218–1225. [Google Scholar] [CrossRef]
- Liu, J.; Cao, Z.; Li, X.; Wang, W.; Hou, J.; Li, D.; Ma, Y. Modelling urban flooding integrated with flow and sediment transport in drainage networks. Sci. Total Environ. 2022, 850, 158027. [Google Scholar] [CrossRef]
- Qin, Y.; Rong, L.; Qie, Z.; Li, T. Refined urban disaster vulnerability assessment based on elements at risk: A case study of Dalian, China. Sustain. Cities Soc. 2023, 99, 104978. [Google Scholar] [CrossRef]
- Bin, L.; Xu, K.; Pan, H.; Zhuang, Y.; Shen, R. Urban flood risk assessment characterizing the relationship among hazard, exposure, and vulnerability. Environ. Sci. Pollut. Res. 2023, 30, 86463–86477. [Google Scholar] [CrossRef]
- Ignatieva, M.; Mofrad, F. Understanding urban green spaces typology’s contribution to comprehensive green infrastructure planning: A study of Canberra, the national capital of Australia. Land 2023, 12, 950. [Google Scholar] [CrossRef]
- Wang, X.; Yang, J.; Li, X. Study on characteristics and microscopic mechanism of composite environment-friendly dust suppressant for urban construction site soil fugitive dust based on response surface methodology optimization. Environ. Sci. Pollut. Res. 2023, 30, 41954–41969. [Google Scholar] [CrossRef]
- Sun, J.; Wu, X.; Wang, G.; He, J.; Li, W. The governance and optimization of urban flooding in dense urban areas utilizing deep tunnel drainage systems: A case study of Guangzhou, China. Water 2024, 16, 2429. [Google Scholar] [CrossRef]
- Reddy, B.V.V. Sustainable materials for low carbon buildings. Int. J. Low-Carbon Technol. 2009, 4, 175–181. [Google Scholar] [CrossRef]


| Data Type | Description | Source |
|---|---|---|
| Digital elevation model (DEM) | ASTER GDEM (30 m resolution) ASTGTM_N23E113 (14 July 2010) | Geospatial Data Cloud (http://www.gscloud.cn/, accessed on 1 July 2024) |
| Satellite imagery | Landsat 8 OLI_TIRS satellite (30 m resolution) LC81220432021339LGN00 (12 December 2021) LC81220442021339LGN00 (5 December 2021) | Geospatial Data Cloud (http://www.gscloud.cn/, accessed on 1 July 2024) |
| Precipitation data | 2022 annual precipitation data in China (1 km resolution) | National Earth System Science Data Center (https://www.geodata.cn/, accessed on 1 July 2024) |
| Soil data | 2015 soil erosion modulus in China (250 m resolution) | Resource and Environmental Science Data Platform (https://www.resdc.cn/, accessed on 1 July 2024) |
| Land use land cover data | 2020 global land cover fine classification data (30 m resolution) | Earth big data science engineering data sharing service system (https://data.casearth.cn/, accessed on 1 July 2024) |
| Road network data | Various levels of road network data (vector data) | Open Street Map (https://openstreetmap.us/, accessed on 1 July 2024) |
| Construction site image data | 2023 research area construction disturbance image data manually drawn using a visual interpretation method (vector data) | Soil and Water Conservation Monitoring Center of Pearl River Basin |
| Population data | 2020 China population spatial distribution kilometre grid dataset (1 km resolution) | Resource and Environmental Science Data Platform (https://www.resdc.cn/, accessed on 2 July 2024) |
| Gross Domestic Product (GDP) data | 2020 China GDP spatial distribution kilometre grid dataset (1 km resolution) | Resource and Environmental Science Data Platform (https://www.resdc.cn/, accessed on 2 July 2024) |
| Importance Scale | Definition |
|---|---|
| 1 | Equal importance |
| 3 | Moderate importance |
| 5 | Essential importance |
| 7 | Demonstrated importance |
| 9 | Extreme importance |
| 2, 4, 6, 8 | Intermediate value |
| Evaluation Criteria | Hazard | Exposure | Vulnerability | Weight Value (%) |
|---|---|---|---|---|
| Hazard | 1 | 2 | 1 | 41.26 |
| Exposure | 1/2 | 1 | 1 | 25.992 |
| Vulnerability | 1 | 1 | 1 | 32.748 |
| Hazard Evaluation Index | Rainfall | Construction Site | Weight Value (%) |
|---|---|---|---|
| Rainfall | 1 | 1 | 50 |
| Construction site | 1 | 1 | 50 |
| Exposure Evaluation Index | Elevation | Slope | NDVI | Soil Erosion Modulus | SPI | Surface Permeability | Road | Weight Value (%) |
|---|---|---|---|---|---|---|---|---|
| Elevation | 1 | 1/2 | 1/2 | 1/3 | 1/2 | 1/3 | 1/3 | 5.744 |
| Slope | 2 | 1 | 1/2 | 1/3 | 1/2 | 1/3 | 1/3 | 7.002 |
| NDVI | 2 | 2 | 1 | 1/3 | 2 | 1/2 | 1/2 | 11.683 |
| Soil erosion modulus | 3 | 3 | 3 | 1 | 2 | 1/2 | 1/2 | 17.956 |
| SPI | 2 | 2 | 1/2 | 1/2 | 1 | 1/3 | 1/3 | 9.045 |
| Surface permeability | 3 | 3 | 2 | 2 | 3 | 1 | 2 | 26.682 |
| Road | 3 | 3 | 2 | 2 | 3 | 1/2 | 1 | 21.888 |
| Vulnerability Evaluation Index | People | GDP | Weight Value (%) |
|---|---|---|---|
| People | 1 | 1 | 50 |
| GDP | 1 | 1 | 50 |
| Number of Criteria (n) | 1 | 2 | 3 | 4 | 5 | 6 | 7 | 8 | 9 | 10 |
|---|---|---|---|---|---|---|---|---|---|---|
| RI | 0.00 | 0.00 | 0.58 | 0.90 | 1.12 | 1.24 | 1.32 | 1.41 | 1.45 | 1.49 |
| Evaluation Indicators | Attribute | Unit | Class Ranges | Class | Class Ratings |
|---|---|---|---|---|---|
| Rainfall | Positive | mm | 1710~1780 | Very low | 1 |
| 1780~1832 | Low | 2 | |||
| 1832~1878 | Moderate | 3 | |||
| 1878~1945 | High | 4 | |||
| 1945~2106 | Very high | 5 | |||
| Construction sites | Positive | Non-construction land | Very low | 1 | |
| Construction land | Very high | 5 | |||
| Elevation | Negative | m | 620~1162 | Very low | 1 |
| 373~620 | Low | 2 | |||
| 209~373 | Moderate | 3 | |||
| 78~209 | High | 4 | |||
| 0~78 | Very high | 5 | |||
| Slope | Negative | degree | 24.34~62.08 | Very low | 1 |
| 16.07~24.34 | Low | 2 | |||
| 9.25~16.07 | Moderate | 3 | |||
| 3.41~9.25 | High | 4 | |||
| 0~3.41 | Very high | 5 | |||
| NDVI | Negative | 0.70~1 | Very low | 1 | |
| 0.47~−0.70 | Low | 2 | |||
| 0.22~0.47 | Moderate | 3 | |||
| −0.23~0.22 | High | 4 | |||
| −1~−0.23 | Very high | 5 | |||
| Soil erosion modulus | Positive | t ha−1 y−1 | 0~19.14 | Very low | 1 |
| 19.14~61.52 | Low | 2 | |||
| 61.52~129.88 | Moderate | 3 | |||
| 129.88~233.79 | High | 4 | |||
| 233.79~350 | Very high | 5 | |||
| SPI | Positive | −8.46~−3.05 | Very low | 1 | |
| −3.05~0.68 | Low | 2 | |||
| 0.68~2.54 | Moderate | 3 | |||
| 2.54~5.06 | High | 4 | |||
| 5.06~15.40 | Very high | 5 | |||
| Surface permeability | Negative | Waterbody | Very low | 1 | |
| Pervious surface | Low | 2 | |||
| Impervious surface | Very high | 5 | |||
| Road | Positive | Non-road | Very low | 1 | |
| Road | High | 4 | |||
| Population | Positive | persons | 0~1105 | Very low | 1 |
| 1105~2943 | Low | 2 | |||
| 2943~6649 | Moderate | 3 | |||
| 6649~15,690 | High | 4 | |||
| 15,690~35,070 | Very high | 5 | |||
| GDP | Positive | 10,000 RMB | 0~25,716 | Very low | 1 |
| 25,716~94,389 | Low | 2 | |||
| 94,389~209,393 | Moderate | 3 | |||
| 209,393~407,706 | High | 4 | |||
| 407,706~1,140,174 | Very high | 5 |
Disclaimer/Publisher’s Note: The statements, opinions and data contained in all publications are solely those of the individual author(s) and contributor(s) and not of MDPI and/or the editor(s). MDPI and/or the editor(s) disclaim responsibility for any injury to people or property resulting from any ideas, methods, instructions or products referred to in the content. |
© 2025 by the authors. Licensee MDPI, Basel, Switzerland. This article is an open access article distributed under the terms and conditions of the Creative Commons Attribution (CC BY) license (https://creativecommons.org/licenses/by/4.0/).
Share and Cite
Jia, X.; Jiang, X.; Huang, J.; Li, L.; Liu, B.; Yu, S. Risk Assessment of Yellow Muddy Water in High-Construction-Intensity Cities Based on the GIS Analytic Hierarchy Process Method: A Case Study of Guangzhou City. Land 2025, 14, 779. https://doi.org/10.3390/land14040779
Jia X, Jiang X, Huang J, Li L, Liu B, Yu S. Risk Assessment of Yellow Muddy Water in High-Construction-Intensity Cities Based on the GIS Analytic Hierarchy Process Method: A Case Study of Guangzhou City. Land. 2025; 14(4):779. https://doi.org/10.3390/land14040779
Chicago/Turabian StyleJia, Xichun, Xuebing Jiang, Jun Huang, Le Li, Bingjun Liu, and Shunchao Yu. 2025. "Risk Assessment of Yellow Muddy Water in High-Construction-Intensity Cities Based on the GIS Analytic Hierarchy Process Method: A Case Study of Guangzhou City" Land 14, no. 4: 779. https://doi.org/10.3390/land14040779
APA StyleJia, X., Jiang, X., Huang, J., Li, L., Liu, B., & Yu, S. (2025). Risk Assessment of Yellow Muddy Water in High-Construction-Intensity Cities Based on the GIS Analytic Hierarchy Process Method: A Case Study of Guangzhou City. Land, 14(4), 779. https://doi.org/10.3390/land14040779