Article

Exploring the Emotional Geography of Kaunas City Center: A Mixed-Method Approach to Understanding Place Identity

by
Indre Grazuleviciute-Vileniske
*,
Marius Ivaskevicius
,
Ausra Mlinkauskiene
,
Kestutis Zaleckis
and
Ingrida Povilaitiene
Faculty of Civil Engineering and Architecture, Kaunas University of Technology, 51367 Kaunas, Lithuania
*
Author to whom correspondence should be addressed.
Land 2025, 14(4), 783; https://doi.org/10.3390/land14040783
Submission received: 14 March 2025 / Revised: 1 April 2025 / Accepted: 3 April 2025 / Published: 5 April 2025

Abstract

:
Traditional urban analysis and planning often neglect intangible emotional responses, leaving a gap in comprehending and addressing appropriately how urban spaces are experienced by individuals and communities. However, in contemporary urban research, emotional dimensions have increasingly been recognized as integral to understanding place and its identity, although the methods for systematically mapping these emotions and addressing both their qualitative and quantitative aspects remain under development. In order to address this research gap, this study presents an analysis of the emotional geography of Kaunas city (Lithuania) center using a mixed-method approach combining qualitative and quantitative methods to examine public narratives collected from social media posts and comments and open-ended responses from a sociological survey of local residents. A qualitative approach, grounded in the classification of emotions by Plutchik, was applied in order to categorize emotional expressions. Simultaneously, a quantitative sentiment analysis using the NLTK VADER tool was performed in order to assess the polarity of emotions and classify them into Positive, Negative, or Neutral within the collected narratives. The social media posts and comments were then georeferenced and mapped using Geographic Information Systems (GISs), while survey data were manually linked to specific locations. This allowed for the creation of emotion maps that highlight emotional hotspots and spatial sentiment trends within Kaunas city center. The results reveal how varying emotional responses are geographically connected to different areas, providing insights into both emotional responses to qualities of physical space and activities directly and indirectly linked to this space. Furthermore, the study demonstrates the potential of emotional mapping as a tool for urban planning, place-making, and sustainable development.

1. Introduction

There has been growing interest in understanding the emotional dimensions of places in recent years, as researchers increasingly recognize that places not only are tangible physical entities, but also have intangible and subjective qualities and are deeply intertwined with human emotions and experiences. The prevailing consensus in urban studies suggests that every place has the capacity to evoke emotions, which, in turn, shape the way individuals and communities perceive and interact with their surroundings [1]. Places can be experienced as attractive, engaging, or nostalgic, but they may also be perceived as monotonous, unsettling, or even threatening [2]. As emotional, subjective, and intangible aspects of place play a crucial role in shaping human attachment and engagement with urban environments, their integration into place analysis and urban management becomes increasingly important [3]. Consequently, recent research has increasingly recognized the importance of emotions in shaping urban experiences, driving advancements in methodologies for analyzing and visualizing the emotional dimensions of place. Approaches, such as tracking technologies, real-time data collection, physiological sensing [4], analysis of user-generated content including sentiment analysis and analysis of emotions [5,6], and integration of emotions and place identity into geographic information science [7,8], have become valuable tools for urban planners aiming to better capture and interpret intangible aspects of urban environments. However, despite the growing recognition of emotional dimensions in urban studies and the availability of diverse methods, integrated methods allowing for the quantitative and qualitative analysis and spatial visualization of emotional responses to urban environments remain limited.
The study of emotions in relation to place, here referred to as emotional analysis of place, is an interdisciplinary approach that employs both qualitative and quantitative methods to examine how individuals and communities emotionally engage with specific locations [8]. Emotional mapping, a methodological approach within this domain, involves identifying, categorizing, and visually representing emotional responses associated with specific geographic locations. The resulting emotion maps provide spatial insights into how people emotionally connect with different areas, enabling researchers to explore the intricate relationship between emotions, perception, and place-based experiences [9]. Mapping emotions is particularly valuable not only in social sciences and geography, but also in urban studies (Figure 1), as it allows for the analysis of the ways in which individuals develop emotional bonds with places, fostering a deeper understanding of urban environments and their human dimensions.
The relevance of emotional analysis of place extends beyond academic inquiry, offering practical applications for urban planning and management. By incorporating emotional data into spatial planning, this approach can reveal hidden and intangible values embedded within places, including historical narratives, symbolic meanings, and collective memories that conventional urban analysis often overlooks [8,10]. According to Hawthorne [10], knowledge about emotional attachment of community stakeholders can inform and influence future management of landscape at various scales. Emotional analysis contributes to understanding place identity by capturing how individuals and communities emotionally relate to their environment, thus enriching the interpretation of urban spaces beyond their physical attributes. The concept of genius loci [11], or the spirit of place, is deeply rooted in emotional perception, as the unique character of a location is often reflected in the sentiments it evokes. Recognizing these affective dimensions allows planners and policymakers to better preserve and transform urban spaces in alignment with the lived experiences of residents.
Beyond its theoretical implications, emotional analysis may also serve as a valuable tool in sustainable urban regeneration, particularly in historic and underutilized areas. By identifying locations associated with strong positive or negative emotions, urban planners can prioritize interventions that address community concerns, mitigate negative perceptions, and strengthen social cohesion. Moreover, in contemporary urban development, especially within human-centered approaches to smart cities, the role of emotions is becoming increasingly prominent as a means of fostering a more inclusive and responsive urban experience [6]. Emotionally informed urban strategies can contribute to participatory planning by integrating perspectives of local communities, ensuring that development projects align with the experiences and emotional attachments of residents [9]. Furthermore, emotion maps can serve as critical tools for communities to voice concerns about urban transformation and to resist unwanted redevelopment projects by demonstrating profound place attachment [8]. In this way, emotional analysis has the potential to become an important component of socially sustainable urban planning.
Figure 1. Potential contributions of emotional analysis of place and emotion mapping to urban planning and management. Scheme by the authors based on Grazuleviciute-Vileniske and Zmejauskaite [12].
Land 14 00783 g001
In the context of urban regeneration, particularly in depopulated and neglected areas, understanding emotional responses to place is of crucial relevance for developing strategies that respect intangible and tangible heritage while fostering social well-being and a sense of belonging. This study aims to analyze the emotional geography of Kaunas city center using a mixed-method approach, with the goal of exploring how emotional geography can contribute to a deeper understanding of place identity in a historic urban environment. This research is guided by the following research questions: How do emotional experiences and sentiments expressed by residents and visitors spatially correlate with specific urban spaces within Kaunas city center? Which urban elements or conditions primarily contribute to the formation of emotional hotspots and sentiment clusters in the historic urban environment of Kaunas? And how can integrated emotion and sentiment mapping methodologies benefit urban planning and contribute to urban sustainability and heritage preservation and management? This study innovatively integrates qualitative classifications of emotions and quantitative sentiment analysis within a geographic information system (GIS), offering a comprehensive method to spatially analyze and visualize emotional responses in urban environments, thus offering the possibility to include affective dimensions into urban planning, heritage conservation, and community engagement, and ultimately fostering a more nuanced and human-centered approach to place-making.

2. Literature Review

Understanding the emotional dimensions of place first requires a clear conceptualization of its two fundamental components: place and emotion. Before engaging in literature analysis, it is essential to define these key terms. The concept of place has been widely explored in human geography and urban studies, often in contrast to space. Following the seminal work of Tuan [13], space is understood as the objective, physical, and geographical environment, whereas place emerges through the infusion of human experience, memory, and meaning. A space becomes a place when it is imbued with social, cultural, and emotional significance, gaining what scholars have described as a distinct “personality” or emotional resonance [14]. This transformation from an abstract spatial entity to a meaningful place is central to understanding how individuals and communities relate to their environment.
Emotions, in turn, are complex psychological states that arise in response to stimuli and are expressed through subjective experiences, physiological responses, and behavioral reactions. While no universal definition of emotion exists, it is commonly understood as an innate and cognitive response to stimuli that are perceived as beneficial or harmful [5]. Unlike neutral information processing, emotional responses are shaped by personal experiences, contextual factors, and social interactions. In the context of urban environments, emotions are not merely individual experiences, but are deeply intertwined with the physical and social surroundings. Emotional geographies emphasize this reciprocal relationship, recognizing that emotions both are shaped by place and actively contribute to shaping place itself [9]. As individuals navigate the city, their emotional experiences influence perceptions of urban spaces, determining whether a location is experienced as welcoming, vibrant, monotonous, or unsettling.
A clear distinction must also be made between emotion and sentiment, as these terms, while related, describe different phenomena. Sentiments refer to evaluative emotional attitudes or opinions that are often expressed in language, particularly in written or spoken text. Unlike emotions, which encompass a broad spectrum of physiological and psychological responses, sentiments are characterized by their polarity. The strength and polarity of sentiment are typically measured quantitatively, ranging from values such as −1 (negative) to +1 (positive) or classified into categorical groups (positive, negative, neutral) [15]. Consequently, sentiment analysis, a computational method for extracting and classifying sentiments from text, allows researchers to systematically assess whether expressions of emotion carry positive, negative, or neutral connotations. The concept of urban sentiment, which reflects how people perceive the city environment and urban events, serves as a direct indicator of quality of life and contributes to the formation of an identity of the city [15].

2.1. Quantitative Literature Review

In order to understand the state of research and relevance of the topic, a quantitative and qualitative analysis of literature was performed. The quantitative review of literature on the topic of emotion and sentiment analysis of place was conducted in the Web of Science scientific literature database [16]. The search using the keyword combination, “emotion and sentiment analysis of place”, provided 301 search results. Meanwhile, the search using the keywords, “sentiment analysis of place”, provided 1332 results, and “emotion analysis of place” provided 9508 results This demonstrates substantial interest of the research community in place-related emotion and sentiment analysis; however, research integrating sentiment and emotion analysis of place is limited. The results of the search, “emotion and sentiment analysis of place”, are distributed between 2000 and the present day. The trend of growth in the number of publications is visible, especially from 2021. For comparison, it is possible to note that between 2000 and 2014, fewer than 10 publications were published per year; meanwhile, 42 publications were published in 2021, 43 in 2022, 50 in 2023, and 52 in 2024. The majority of publications—243—are journal articles. The following research areas have the highest number of publications on emotion and sentiment analysis of place: Computer Science (105 publications), Engineering (45), Social Sciences (25), Environmental Sciences Ecology (15), and Psychology (15). Meanwhile, the field of Architecture has 4 publications, and Urban Studies has 3. This may indicate the untapped potential of integrated emotion and sentiment analysis of place for architecture and urbanism. The most relevant journals in research on emotion and sentiment analysis of place are the Journal of Medical Internet Research (8 publications), IEEE Access (7), and Applied Sciences Basel (5). The fact that there is no clearly predominant journal for the publication of these types of studies indicates their interdisciplinary nature. The distribution search results, according to their relevance to the UN sustainable development goals, is the following: Goal 03: Good Health And Well Being—73 publications; Goal 11: Sustainable Cities And Communities—50 publications; and Goal 04: Quality Education—17 publications. This demonstrates the potential contribution of research in the field of emotion and sentiment analysis of place to urban and social sustainability. The most cited publication in this field of research (335 citations in total) is a comparative literature review by H. H. Do et al. [17] on the application of deep learning for aspect-based sentiment analysis. The second most cited publication, with 227 total citations, is directly related to the topic under analysis: the study by L. Mitchell et al. [18] on the links between geographic location and happiness that analyzes sentiment expressed in Twitter posts. By combining sentiment scores from tweets with demographic and objective characteristics of different places, the authors reveal how emotional expression correlates with factors such as income, education, and geographic features. This research demonstrates the potential of social media data for mapping subjective well-being across spatial contexts.
The bibliometric analysis of the results of the search in the Web of Science scientific literature database using the keyword combination, “emotion and sentiment analysis of place”, was performed using VOSviewer software version 1.6.20. The graph generated using VOSviewer [19] (Figure 2) highlights four distinct clusters of frequently co-occurring terms in publications related to emotion and sentiment analysis of place. The two predominant clusters (green and red) are larger and more densely connected, reflecting key thematic areas in this research domain.
The largest green cluster, which could be identified as the sentiment analysis and data processing cluster, centered on terms like “sentiment analysis”, “dataset”, “classification”, “accuracy”, etc. It likely represents studies focusing on computational methods for sentiment analysis. These publications emphasize machine learning techniques, natural language processing, and the evaluation of models for analyzing textual data, particularly in the context of user-generated content. The red cluster, which could be identified as theoretical and qualitative approaches, includes terms such as “theory”, “practice”, “narrative”, “concept”, “meaning”, etc. It appears to focus on the theoretical and conceptual aspects of place and qualitative methods in emotion and sentiment analysis. This cluster represents research that explores place attachment, cultural identity, and emotional meaning through discourse and narrative analysis. The blue cluster could be identified as a social media and public sentiment cluster, and is centered on terms such as “twitter”, “social media”, “public sentiment”, etc. It reflects research that leverages large-scale data from social media platforms to study public sentiment about places, often in response to specific events or crises. The yellow cluster could be identified as emotional states and intensity, and includes terms like “fear”, “joy”, “sadness”, “intensity”, “reaction”, etc. It indicates studies focused on emotional states and their intensity in relation to places. This cluster likely represents work dealing with the classification of emotions and their spatial expression, as well as studies on how emotions influence public perception of urban spaces.
The graph demonstrates that the field is highly interdisciplinary, with clear distinctions between methodological approaches like quantitative sentiment analysis, qualitative identification of emotions, and qualitative discourse analysis. The strong connectivity within the clusters indicates robust co-occurrence of terms, suggesting that research in this field often involves a combination of emotion classification, sentiment polarity analysis, and place-based studies.

2.2. Qualitative Literature Review

The emotional relationship between individuals and their environments has long been a focus in urban studies. The founders of the field, such as Park, Burgess, McKenzie, and Lynch, have historically emphasized that an individual’s emotional experience of a city is shaped by the interplay of cultural, social, and physical dimensions [4]. The qualitative analysis of literature in this field traces the origins of emotional analysis of place and the practice of mapping emotions to earlier theoretical and methodological perspectives. Caquard and Griffin [9] and Stals et al. [6] identify the roots of these approaches in the Situationist movement of the 1950s, which emerged as a response to the institutionalized and top-down perspectives of urban planners of that era. The Situationists, particularly through the practice of so-called drifting, sought to explore and document the psychological and emotional landscapes of cities by moving through urban spaces and mapping their subjective experiences.
Early psychogeographic explorations laid the foundation for later developments in emotion mapping. This notion of drifting to document emotional data has since evolved, with scholars and artists expanding upon these early methods using new technologies. Nold, for instance, pioneered the use of GPS tracking and biometric sensing to create visually expressive emotional cartographies of urban spaces in the early 2000s [6]. As technology advanced, so, too, did the possibilities for capturing and visualizing the emotional dimensions of place, enabling researchers to develop more comprehensive approaches to urban emotional analysis.
An analysis of literature allowed for the identification of two predominant trends in the studies of emotional analysis of place. The first trend has been driven by advances in tracking technologies, real-time data collection, and physiological sensing, which have enabled empirical investigations into the complex interactions between space and emotion. The proliferation of GPS-enabled devices, wearable biometric sensors, and real-time survey techniques has allowed researchers to collect dynamic emotional data as individuals navigate urban environments [4]. This approach has been used to study urban stress, environmental influences on well-being, and emotional responses to various urban conditions.
The second trend, which is particularly relevant to this study, involves the growing use of textual data for analyzing place-related emotions. The increasing availability of digital content, combined with advances in computational linguistics and content analysis methods, has enabled researchers to extract and classify emotions from written texts. These textual sources, ranging from social media posts to survey responses and historical narratives, offer valuable insights into public perceptions of place. Emotion maps generated through this approach have been used to visualize stress hotspots in commercial districts, emotional responses to environmental factors such as air pollution and noise, and people’s emotional reactions to different types of urban spaces, including restaurants, museums, and public parks [6]. By linking textual expressions of emotion to geographic locations through a GIS, this method allows for a spatialized understanding of how places are experienced emotionally.
Within the broader field of textual analysis, the analysis of literature allowed for the distinction of two major methodological approaches: sentiment analysis and emotional analysis. Sentiment analysis is a computational technique that quantifies textual expressions of sentiment by assigning numerical polarity scores to written content, which are usually categorized as positive, negative, or neutral. Social media and other types of user-generated content serve as valuable sources for sentiment analysis, allowing researchers to systematically assess public attitudes toward specific places. Sentiment scores derived from text data have been widely used as indicators of customer satisfaction, public sentiment toward urban policies, and collective attitudes toward different environments [5]. Mohammad [20] and Sathya et al. [21] have provided comprehensive reviews of sentiment analysis methodologies, noting that while this approach has been widely adopted in fields such as computer science, business, and marketing, its applications in urban studies are also gaining attention, as was demonstrated by the quantitative literature review. Given that sentiments are often tied to specific locations, sentiment analysis offers significant potential for urban research and place-making strategies. However, sentiment analysis often simplifies emotions into binary or scalar values, which may overlook the complexity and depth of human emotional experiences.
In contrast, emotional analysis seeks to capture the complexity of human emotions beyond simple positive or negative classifications. Unlike sentiment analysis, which focuses on polarity, emotional analysis categorizes emotions into more nuanced typologies, often drawing upon psychological and linguistic frameworks. Researchers such as Misue and Taguchi [22] have attempted to model emotions using multidimensional frameworks that account for variations in intensity, expression, and situational context. Plutchik [23] provides one of the most widely used models for understanding emotions, proposing a circumplex structure that organizes primary emotions into pairs of opposites (e.g., joy vs. sadness). This framework highlights the interconnected nature of emotions and their capacity to blend into secondary emotional states, offering a more sophisticated tool for analyzing textual expressions of place-based emotions. The classification of emotions within the Plutchik [23] model allows researchers to systematically interpret written texts including descriptions of urban spaces, uncovering deeper insights into how individuals experience and perceive their surroundings.
While sentiment analysis and emotional analysis are often treated as distinct methodologies, they can be integrated within a single study to provide a more comprehensive understanding of the emotional landscape of a place [8]. Sentiment analysis offers a broad, quantifiable measure of public attitudes, while emotional analysis provides a more detailed and qualitative exploration of affective states. Together, these approaches enable a richer interpretation of how people emotionally engage with urban environments.
A key component of both sentiment and emotional analysis is spatial representation, as geographic information systems (GISs) allow for the visualization of emotions through emotion maps. These maps provide a spatialized view of how different locations are associated with specific emotional responses, helping urban planners and policymakers identify areas that evoke strong positive or negative feelings. Emotion maps have been successfully utilized in studies examining social media content, survey responses, and other texts, where geotagged data enable the spatial analysis of public sentiment [5,8].
The analysis of recent literature shows that contemporary emotional mapping offers significant advantages for understanding complex urban dynamics. By merging human-centered qualitative insights with quantitative data analytics, emotional maps can systematically reveal how different urban spaces impact an urban population’s well-being and sense of place [24]. Such approaches enable planners to identify so-called emotional hotspots and discern patterns of public sentiment across the city. For example, emotion maps of London and San Francisco have revealed how varying districts and places of interest evoke distinct collective feelings at different times [25]. These visualizations of urban emotions also enhance participatory planning. By displaying community perceptions in an intuitive spatial format, they turn citizens into active contributors rather than passive users of city spaces [8,26]. For example, collaborative mapping in Curitiba, Brazil, pinpointed specific environmental and mobility conditions that triggered strongly positive or negative emotions, insights that city officials can use for targeted interventions to improve urban experiences [27]. This data-driven emotional insight can likewise guide sustainable development and even inform heritage conservation strategies; studies in historic districts show that preserving cultural elements of the built environment fosters emotional attachment of residents and strengthens place identity [28]. Nevertheless, some methodological gaps remain. Researchers caution that the proliferation of sensor-derived data on emotions in urban environments has outpaced our ability to interpret it, thus revealing the need to better integrate qualitative context with quantitative sentiment analysis [29]. As a result, many current emotion-mapping efforts rely on one approach or the other and, thus, offer only partial insights rather than providing planners with an integrated spatial understanding of community sentiment and place identity.

3. Materials and Methods

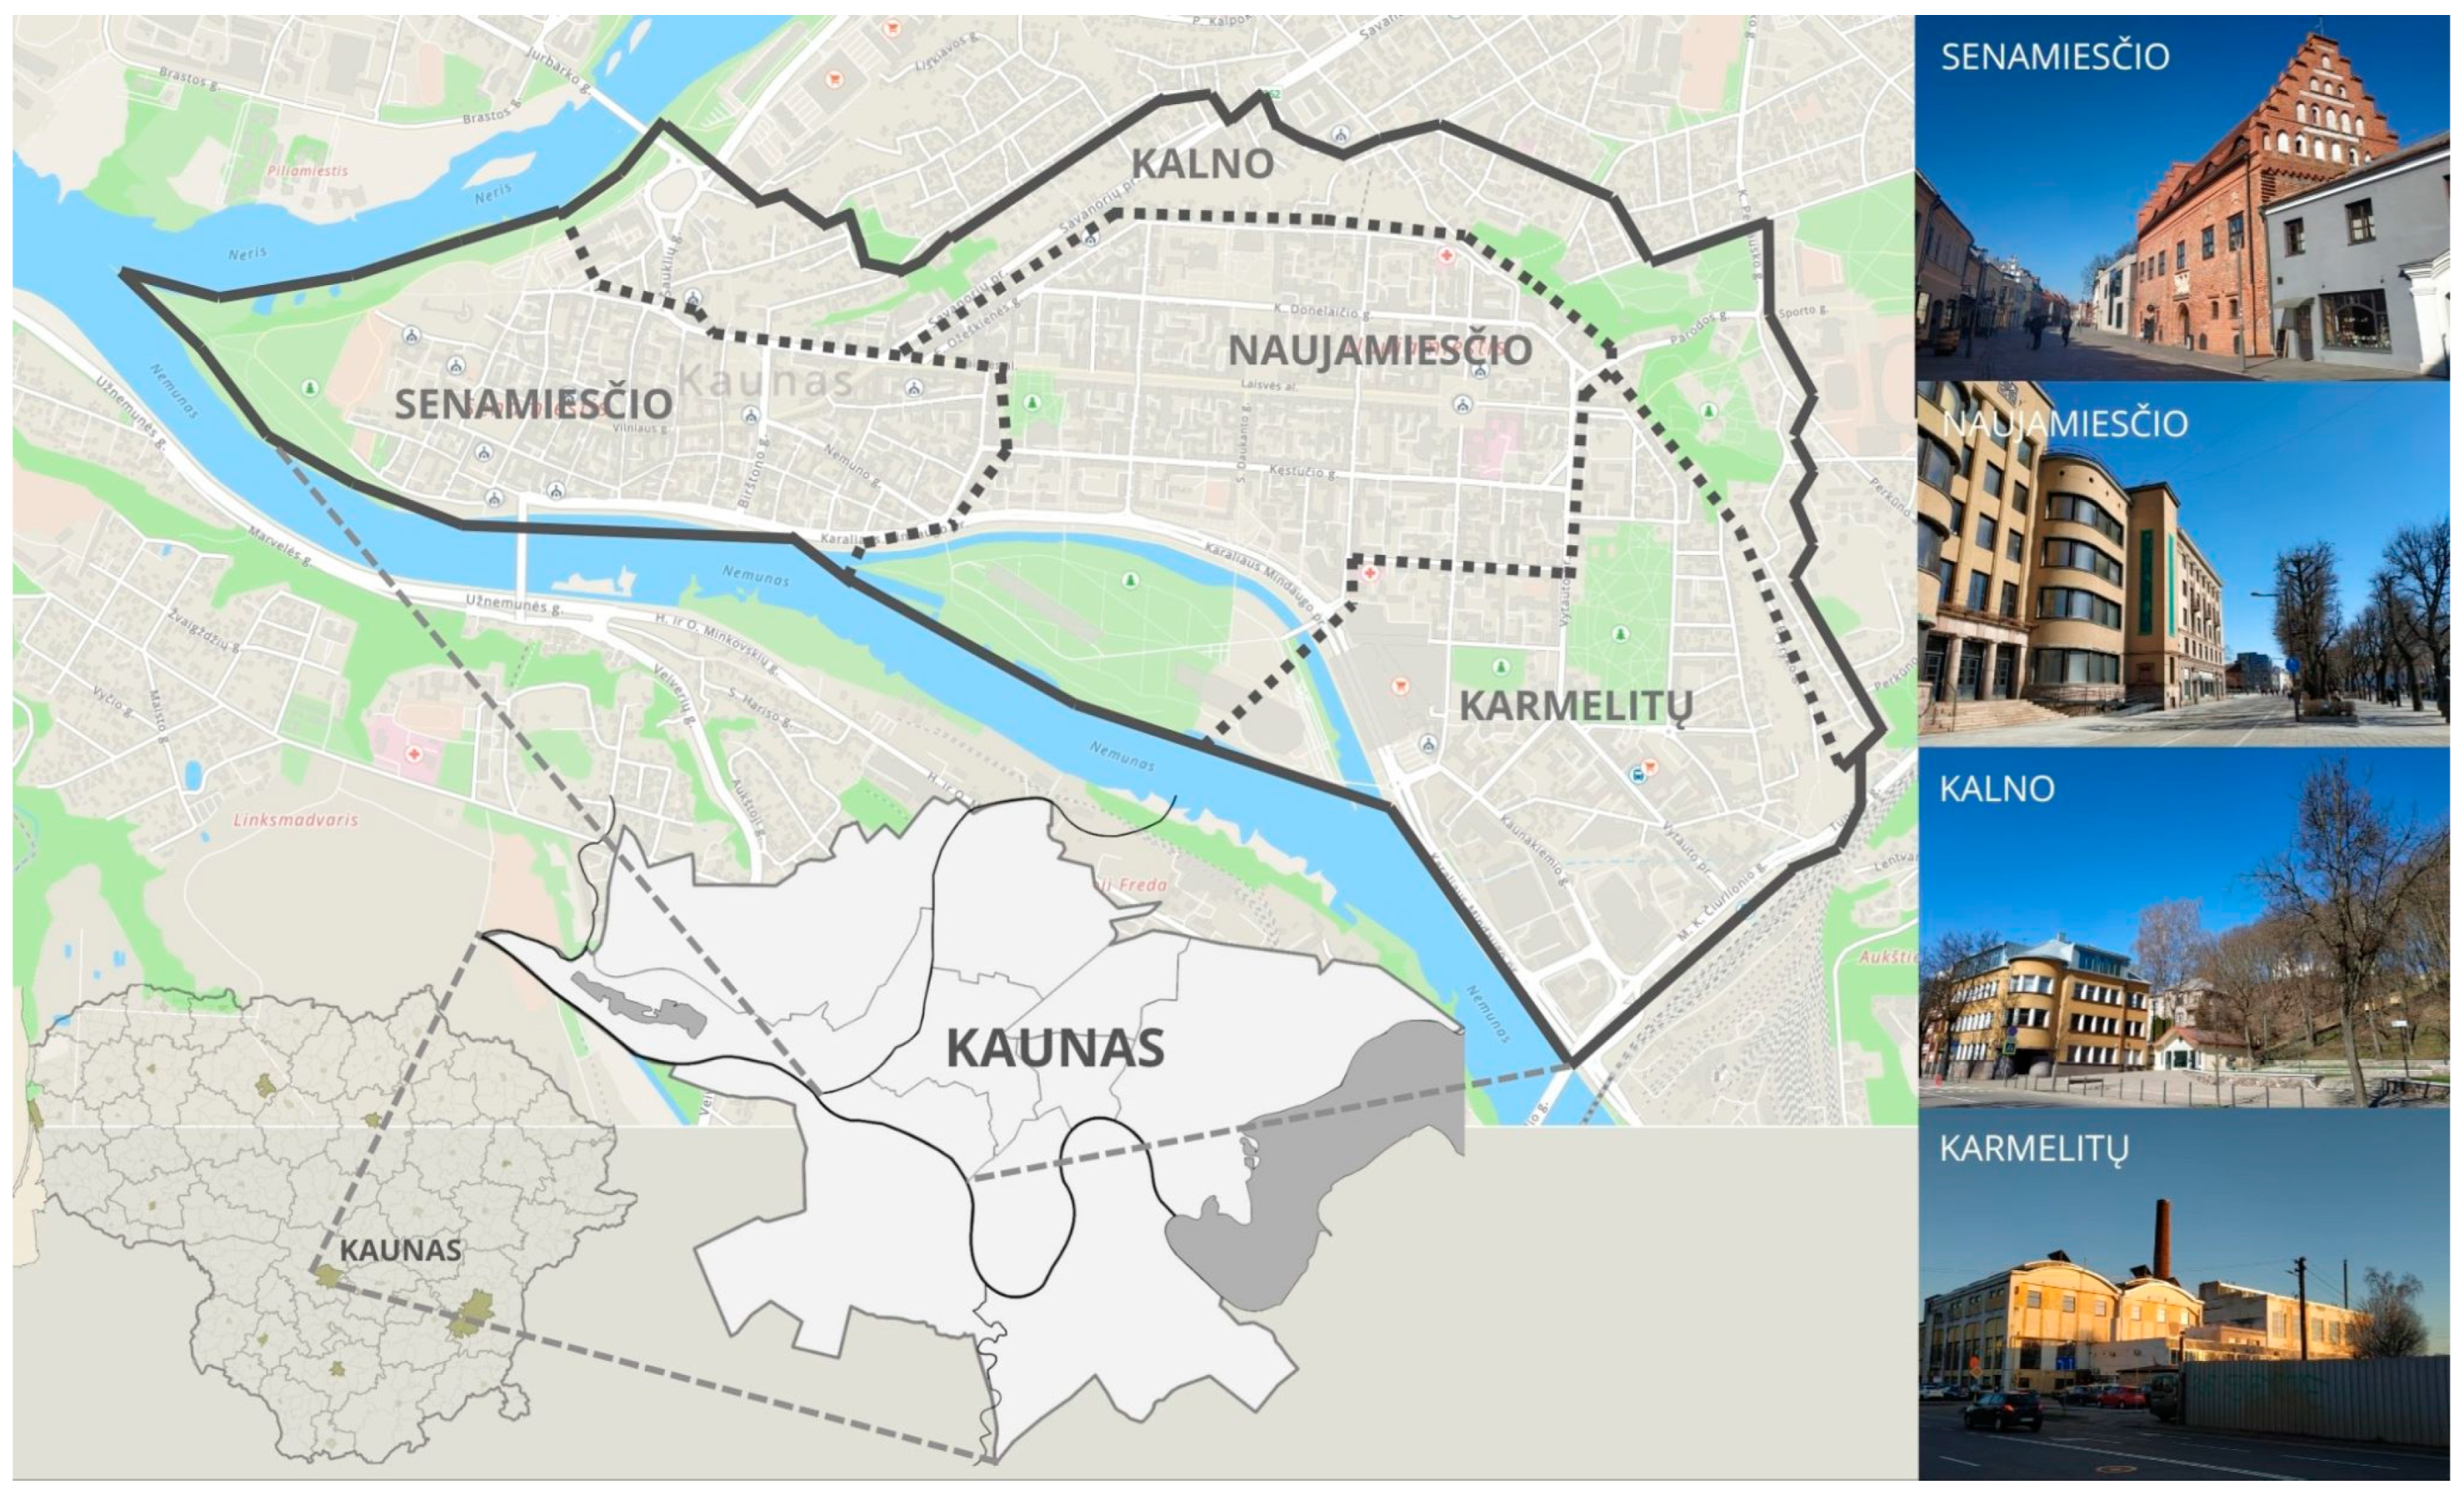
3.1. Case Study Area

The case study area—Centras Eldership (lit. seniūnija), informally known as Kaunas city center (Figure 3)—is a focus area of an ongoing research project that was selected due to such characteristics as the concentration of interwar architecture, where urban transformations during the Soviet era affected the historical architecture and the urban fabric. After Lithuania became independent, the area became a location of intense business development, which further accelerated the physical and functional changes to the historic buildings [30].
Centras Eldership is situated in the heart of Kaunas, Lithuania, encompassing both the historic Old Town and the New Town. It is officially subdivided into four smaller administrational units: the Senamiesčio, Naujamiesčio, Karmelitų, and Kalno sub-elderships (lit. seniūnaitijos—the lowest-level administrative-territorial unit in Lithuania). Covering an area of 4.58 square kilometers, it serves as a central hub for cultural, educational, and commercial activities. This area is home to major Lithuanian universities; to landmarks such as Laisvės Avenue, the longest pedestrian street in Europe, Medieval Kaunas Castle, Kaunas Cathedral Basilica, and other Gothic and Baroque churches; and to prominent examples of architecture from different periods, including interwar-period modernism recently added to the UNESCO World Heritage List. In addition to rich architectural heritage, the area also features several parks, including Santaka Park at the confluence of the Nemunas and Neris rivers. Centras Eldership is a vibrant area that blends historical significance with modern urban life, making it a focal point for both locals and tourists. This is one of the most densely inhabited neighborhoods in Kaunas, with more than 14,000 residents; however, the trend of decline in the population permanently living in the area is visible. According to the 2001 Lithuanian population census, at that time, Centras Eldership had 19,349 (the total number of Kaunas City Municipality residents was 378,943 at that time); meanwhile, according to the 2021 Lithuanian population census, this number declined to 14,356 (the total number of Kaunas City Municipality residents was 298,753 at that time). Meanwhile, according to census data, in the period between 2011 and 2021, the number of Centras Eldership residents declined by 2.5 percent [32]. It is estimated that currently, Kaunas City Municipality has 303,978 residents. Even if the total number of Kaunas City Municipality residents starts to grow, mainly due to migration, the movement of residents to suburbs continues [33]. These trends justify the interest in the emotional landscape of Kaunas city center as a way to understand potential viability and livability factors in this area.

3.2. Data

The dataset used for the emotional and sentiment analysis of Kaunas city center integrates two distinct, although complementary, sources: publicly available Facebook posts and comments geotagged within the city center, and responses from an online sociological survey. Together, these datasets provide a multifaceted perspective on the emotional landscape of the area, encompassing both explicit reactions to the built environment and broader expressions of sentiment that may not be directly tied to the physical urban fabric. While some Facebook discussions and posts are directly associated with the spatial and social realities of Kaunas city center, others engage in general topics, commercial promotions, and discussions about specific goods and services. This inclusion of both clearly place-related and more indirectly associated textual data allows for a more nuanced exploration of emotional expressions within the urban context. By incorporating both tangible and intangible dimensions of place, the dataset acknowledges the complexity of urban emotional experiences, where emotions may be triggered not only by direct spatial interactions, but also by narratives, services, and virtual engagements related to the city center.
The first dataset, composed of Facebook posts and comments, provides a useful lens through which public emotional expressions can be analyzed. According to the researchers, social media platforms serve as dynamic arenas for the articulation of opinions, emotions, and place-based experiences, making them a relevant source for urban sentiment analysis [15]. This dataset includes 1335 posts and comments retrieved from public Facebook pages geotagged within Kaunas city center. Posts and comments were retrieved in June 2018. To ensure comprehensive coverage, the selection process focused on the ten longest posts or comments from each page, capturing more detailed and potentially emotion-rich content. Many of these pages are affiliated with commercial enterprises, cultural institutions, and service providers, reflecting the central role of business and public life in shaping the digital discourse about Kaunas city center. Although not all comments and discussions are explicitly related to the physical and social environment of the city center, social media analytics remains a valuable tool for capturing urban sentiment, as people frequently share experiences, opinions, and emotions about their surroundings, even when the primary topic of discussion is not explicitly spatial [5]. Given that emotions influence consumer behavior, travel motivations, and overall experiences of place [5], analyzing this dataset allows for insights into how emotional expressions—both directly and indirectly tied to the urban fabric—shape the broader perception of Kaunas city center.
The second dataset consists of responses collected through an online sociological survey, providing a more targeted, yet smaller-scale, perspective on the emotional dynamics of the city center. The survey was conducted between December 2023 and March 2024. The sociological survey, “Sense of place of Kaunas city central part inhabitants in relation to the immovable cultural heritage”, was approved by the Kaunas University of Technology Research Ethics Committee, Minutes No. M4-2023-14. A total of 61 respondents participated in the survey, offering qualitative insights into their perceptions and experiences of Kaunas. Of these, 39 respondents provided open-ended comments suitable for analysis about the city in general, while 27 shared reflections on their specific neighborhoods. Notably, 12 comments were explicitly related to Kaunas city center, making them particularly significant for this research despite their small quantity. Unlike the Facebook dataset, which reflects publicly shared sentiments and discussions that may be shaped by commercial and social interactions, the survey data capture personal, lived experiences, offering a more direct and localized understanding of emotions tied to the physical and social characteristics of the city center.
Together, these datasets present two distinct, but intersecting layers of the emotional landscape of Kaunas city center. This dual-layered approach contributes to the robustness of the emotional analysis, enabling an exploration of both overarching trends and localized emotional nuances. The temporal gap between the datasets—Facebook comments collected in 2018 and sociological survey responses obtained from 2023–2024—reflects practical constraints associated with data availability and methodological considerations. While acknowledging the potential impact of urban changes within this five-year interval, the study leverages the datasets as complementary sources. It is important to note that this study serves as a pilot exploration into the possibilities of emotional analysis and mapping using written textual data, incorporating both qualitative and quantitative approaches.

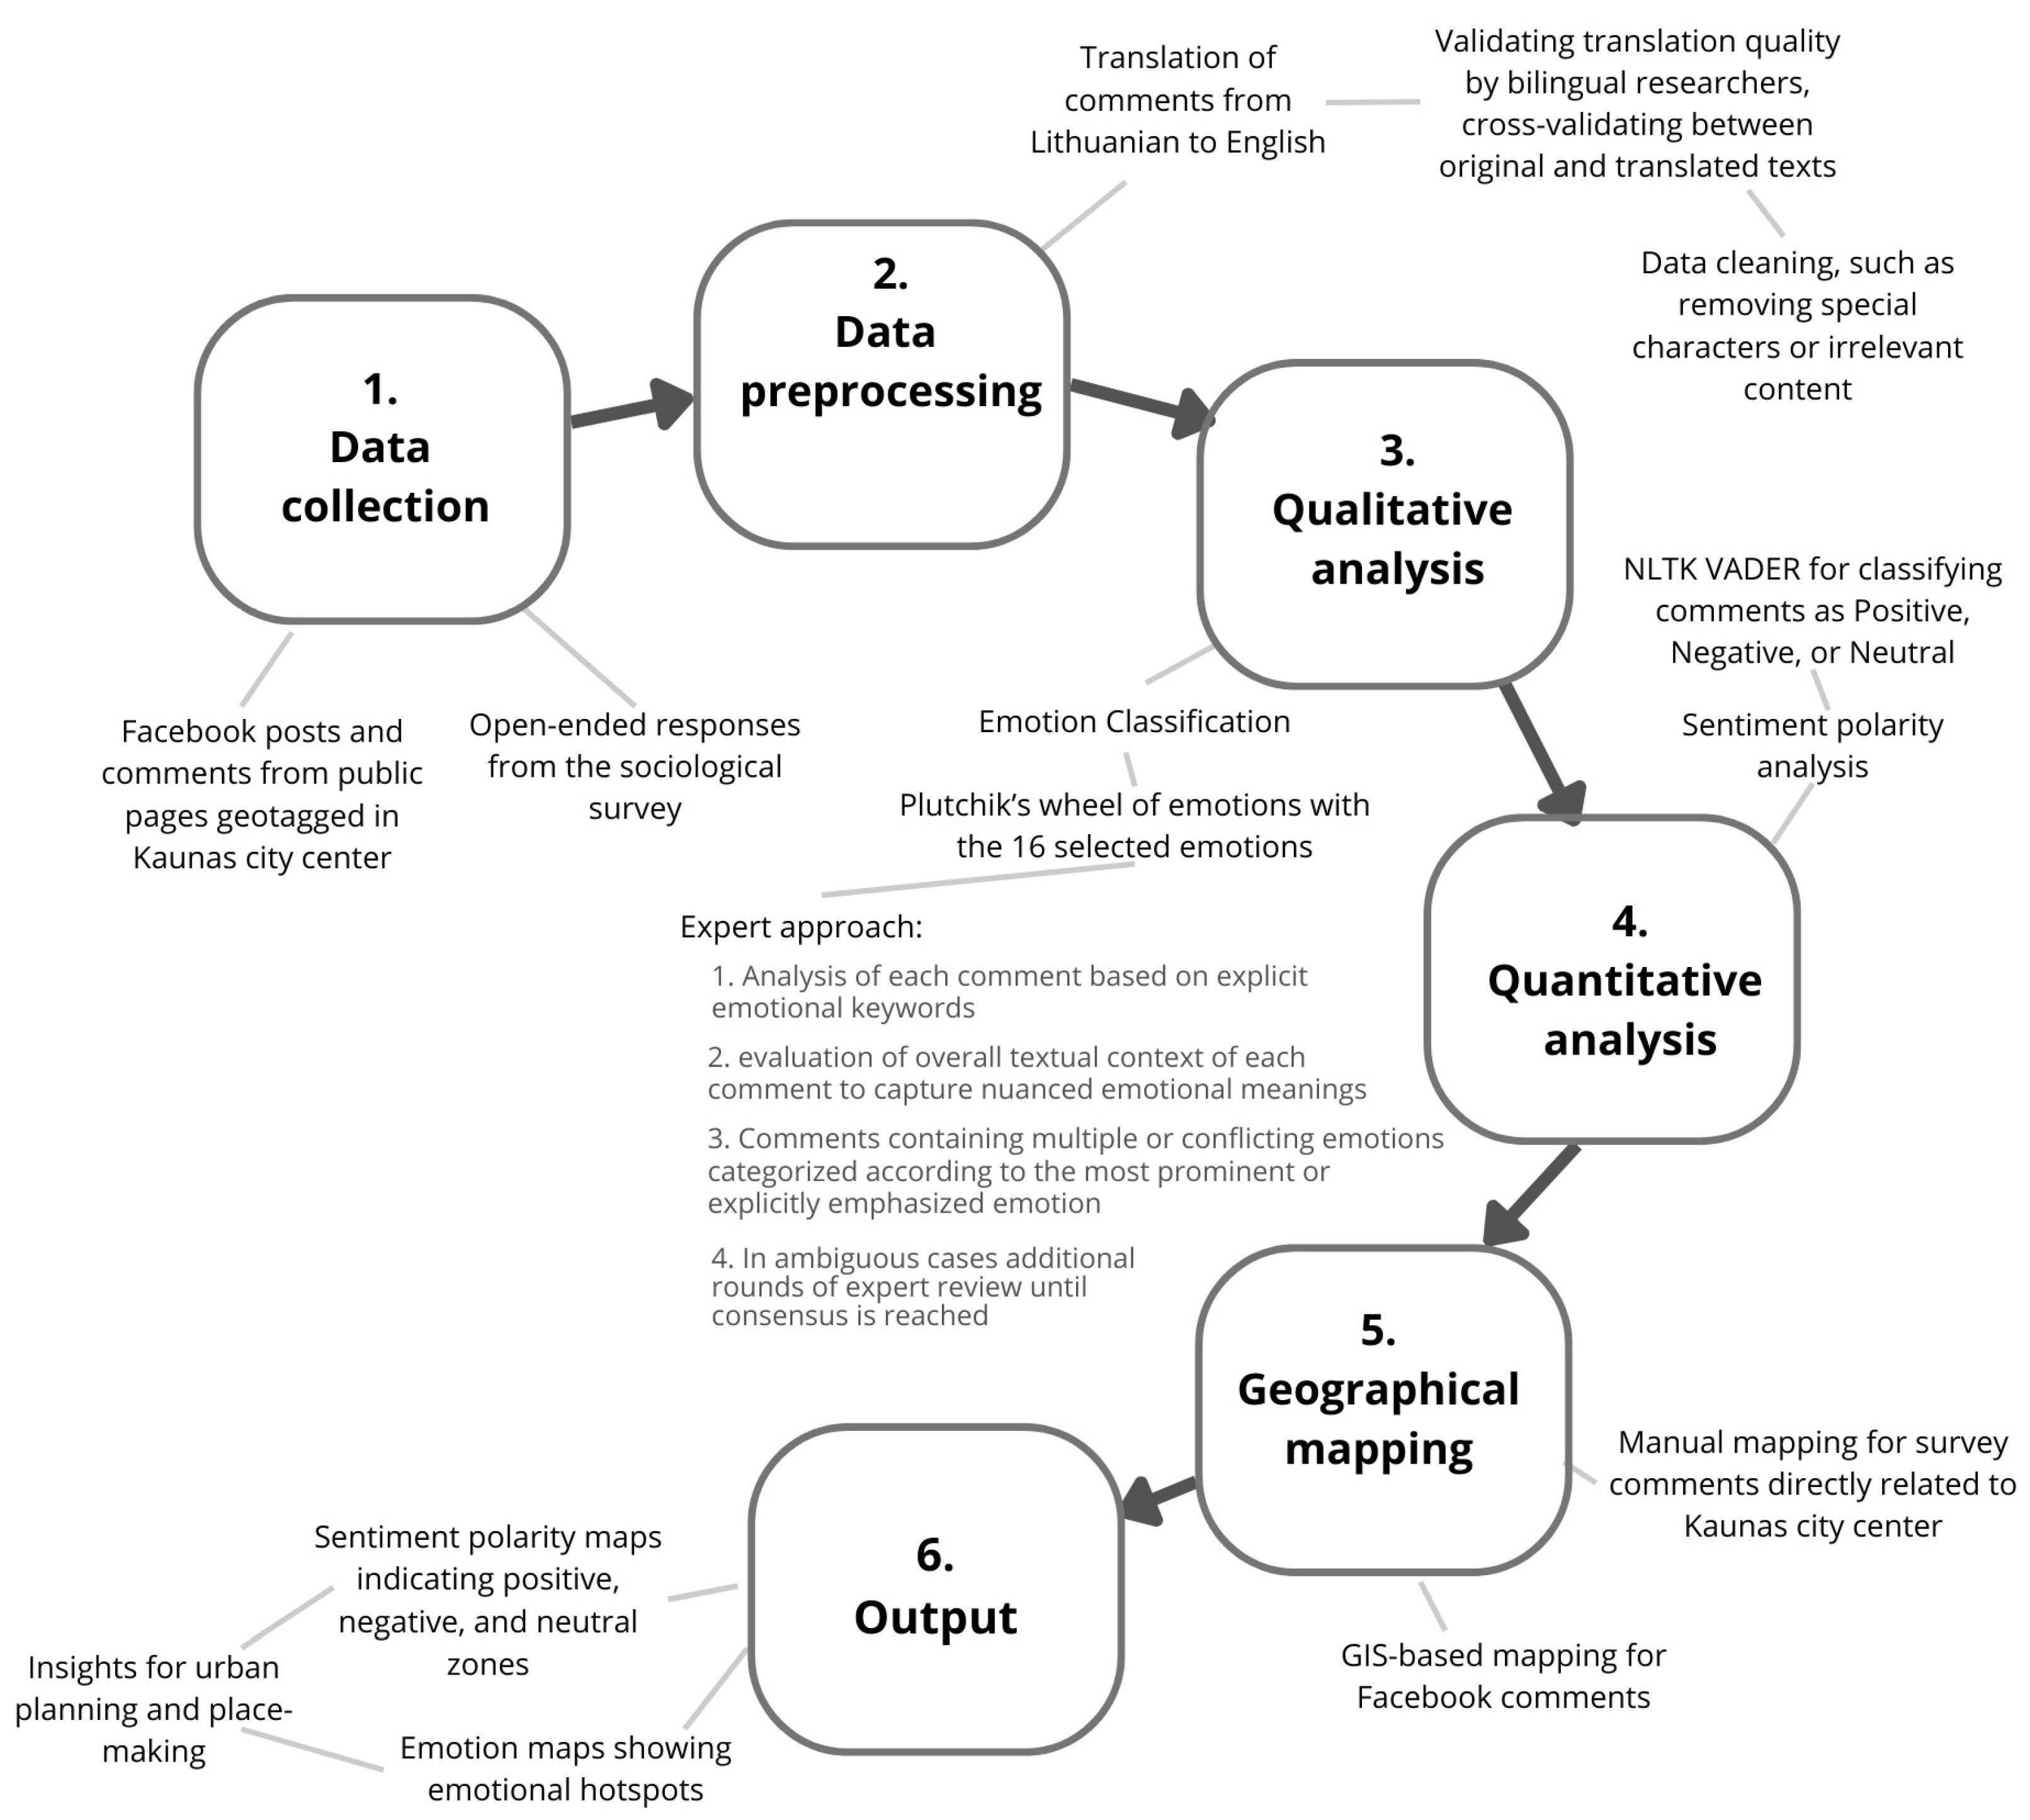
3.3. Research Methodology

According to Merschdorf and Blaschke [7], the complexity and multi-faceted nature of a place make it difficult to quantify various aspects and require multidisciplinary research approaches. Thus, the methodology for analyzing the content of social media posts, comments, and open-ended responses from the sociological survey applied in this research combines both qualitative and quantitative methods and can be identified as a mixed-method approach. Such an approach was selected based on previous research [8], aiming for a more comprehensive understanding of the emotional landscape of Kaunas city center by capturing both specific emotional categories and overall sentiment polarity. After the data were collected, the analysis involved several sequential steps (Figure 4). First, all the original comments, which were written in Lithuanian, were translated into English to enable accurate processing using natural language processing tools, as most sentiment analysis tools are optimized for English-language texts. It is necessary to note that as Lithuanian comments were translated into English for sentiment analysis, potential nuances in emotional expression, such as cultural metaphors and colloquial slang, might be partially lost or altered, potentially influencing the accuracy of the VADER sentiment analysis. This issue was addressed by involving bilingual researchers in validating translation quality and cross-validating between original and translated texts. For the qualitative analysis, the classification of emotions by Plutchik [23] was employed. In this study, sixteen specific emotions from the wheel of emotions by Plutchik [23] were selected for analysis: Serenity, Interest, Annoyance, Boredom, Pensiveness, Distraction, Apprehension, Acceptance, Joy, Anticipation, Anger, Disgust, Sadness, Surprise, Fear, and Trust (Table 1). These emotions were chosen because they represent a balanced range of both positive and negative emotional states, as well as intermediate emotional tones, ensuring that the analysis captures subtle differences in emotional expression. The selection also reflects emotional states commonly encountered in urban environments, where experiences can range from joy and interest in vibrant public spaces to annoyance and fear in less favorable conditions [8]. The written comments from Facebook pages and the sociological survey were examined, and each comment was manually assigned an emotional label based on the selected categories using an expert approach. The classification process partially relied on a keyword-matching technique, wherein specific emotional cues in the text were identified and linked to their corresponding categories, although the general moods and possible connotations of the comments were also considered. This approach provided insights into the types of emotions experienced by individuals. In the emotional classification process, each comment was analyzed based on explicit emotional keywords derived from Plutchik’s model [23], supplemented by the evaluation of the overall textual context to capture nuanced emotional meanings. Comments containing multiple or conflicting emotions were categorized according to the most prominent or explicitly emphasized emotion, with ambiguous cases undergoing additional rounds of expert review until consensus was reached.
Following the qualitative classification, a quantitative sentiment analysis was conducted to assess the polarity of emotions: whether they were positive, negative, or neutral. This step aimed to provide a higher-level view of the overall sentiment trends across the dataset. To perform this analysis, the NLTK VADER sentiment analyzer was selected due to its proven accuracy and alignment with similar research studies [5]. VADER (Valence Aware Dictionary and sEntiment Reasoner) is particularly well-suited for social media content, as it accounts for context, intensity, and negations when assigning sentiment scores to individual sentences. Each translated comment was processed using VADER to determine its sentiment polarity, categorized as Positive, Negative, or Neutral, based on the compound sentiment score generated by the tool.
By aligning the identified emotions with specific geographic locations in the subsequent step, the methodology also facilitated the creation of emotion maps, which visually represent emotional patterns and hotspots within Kaunas city center.
Although a five-year interval separates the Facebook comments and the sociological survey data used in this research, this pilot application primarily aims to demonstrate the applicability of an integrated methodological approach of combining qualitative emotional classification and quantitative sentiment analysis for mapping emotions spatially. The temporal gap inevitably limits direct comparability between the two datasets regarding specific emotional experiences linked to potentially changing urban conditions. However, larger time intervals separating analyzed datasets allow for the identification of persistent emotional patterns associated with enduring urban features. This methodological approach emphasizes spatial emotional consistency, thus allowing meaningful integration and comparative interpretation despite temporal differences.

4. Results

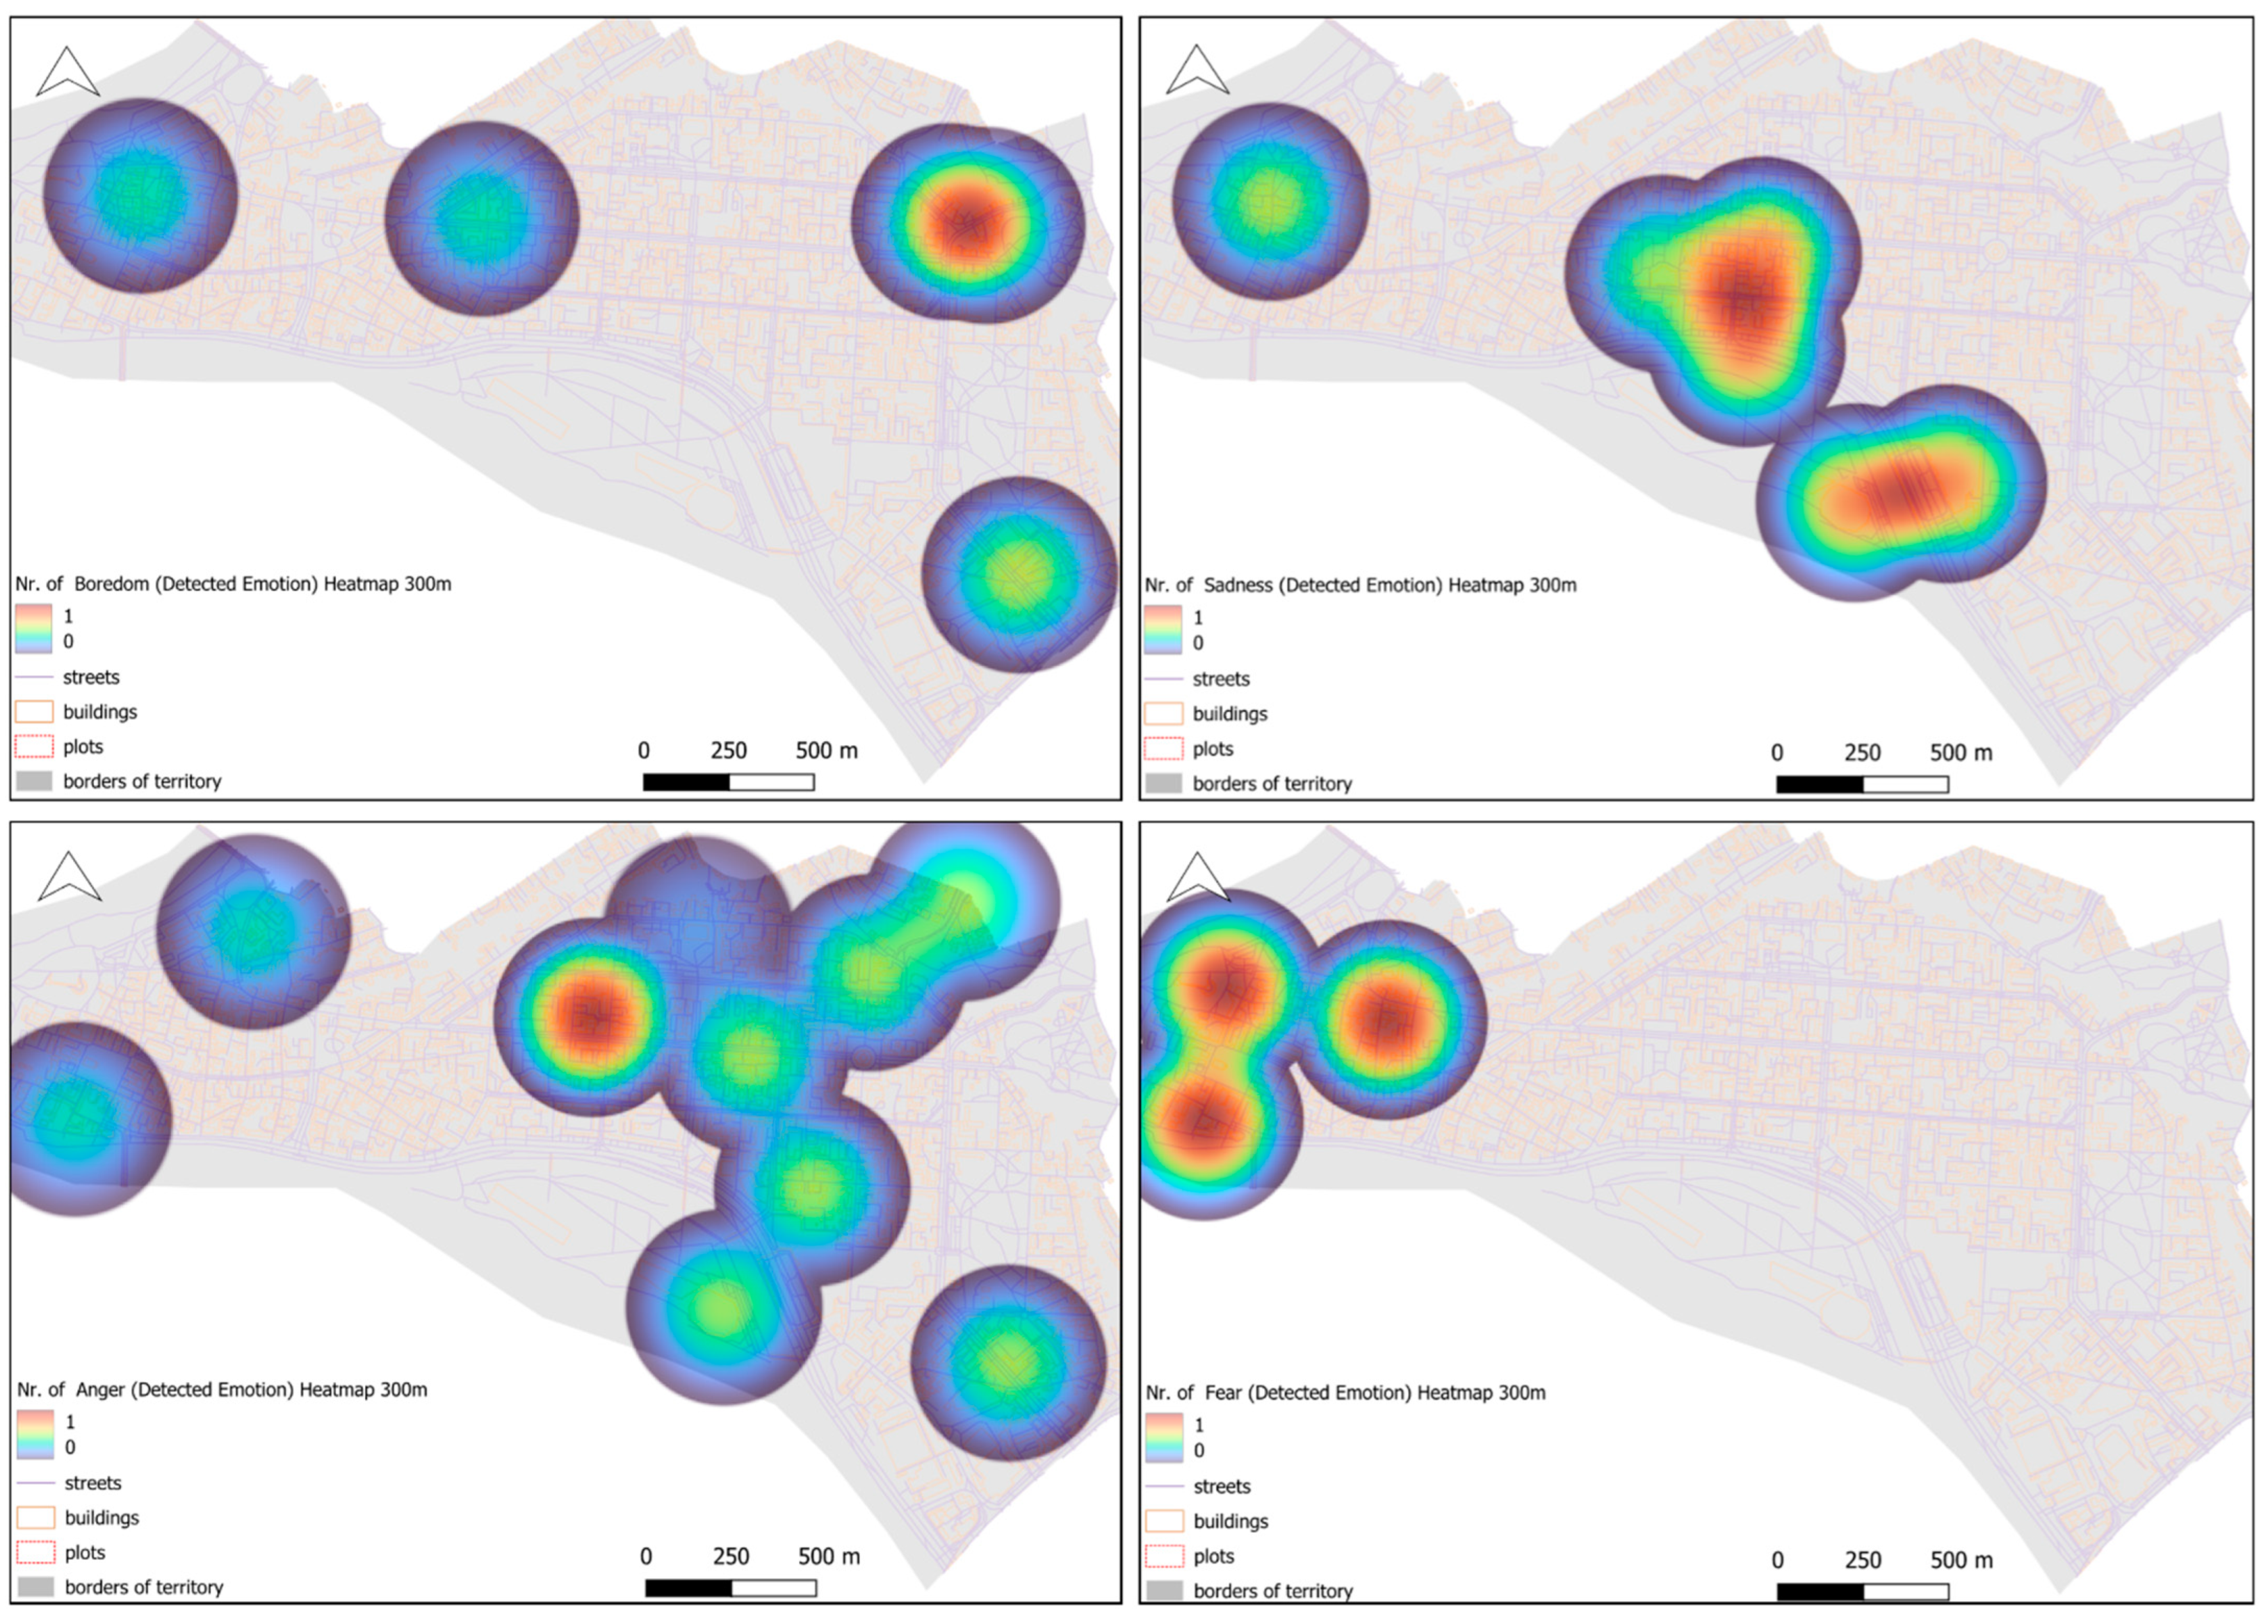
4.1. Analysis of Facebook Comments

The emotional and sentiment analysis of Facebook posts and comments reveals some insights into the emotional landscape related to Kaunas city center. Using the Plutchik classification [23], all 16 distinct emotions selected for this analysis were identified among the comments, highlighting a diverse range of emotional responses. The most frequently observed emotion was Interest, with 1102 instances (82.55%), revealing a high level of curiosity and engagement in the analyzed posts and comments. Positive emotions such as Joy (102 instances, 7.64%), Acceptance (32 instances, 2.40%), Serenity (24 instances, 1.80%), Trust (14 instances, 1.05%), Anticipation (8 instances, 0.60%), and Surprise (1 instance, 0.07%) collectively accounted for 9.29% of the total emotions. Negative and relatively negative emotions were infrequent within the analyzed comments, with Anger (12 instances, 0.90%), Fear (3 instances, 0.22%), Sadness (6 instances, 0.45%), Disgust (1 instance, 0.07%), and Pensiveness (11 instances, 0.82%) together making up just 1.65% of all emotions. Additionally, neutral and mixed emotions, such as Apprehension (8 instances, 0.60%), Boredom (5 instances, 0.37%), and Distraction (4 instances, 0.30%), were also minimally represented. From this perspective, the emotional landscape that emerged from the analysis of Facebook posts and comments is predominantly positive, with Interest overwhelmingly dominating as the primary emotional response.
Sentiment analysis with NLTK Vader further validates these findings. Among the comments, Positive sentiment was dominant, with 1152 instances (86.29%), followed by Negative sentiment, with 92 instances (6.89%), and Neutral sentiment, with 91 instances (6.82%). This significant positivity mirrors the high prevalence of positive emotions observed in Plutchik’s classification. A comparison of Plutchik’s emotional categories with NLTK Vader sentiment polarity shows a strong correlation. Positive emotions such as Joy, Trust, and Anticipation align closely with positive sentiment polarity, while negative emotions like Anger and Fear correspond with negative sentiment polarity. Interest, the most dominant emotion, primarily aligns with positive sentiment, but also shows some overlap with neutral and negative sentiments. In the emotional analysis, we generally consider Interest as a positive emotion, or a feeling of curiosity and engagement, prompting exploration or learning in response to new stimuli; however, in theory, Interest could be approached with positive, negative, or neutral sentiment. The analysis of correlations between emotion analysis and sentiment analysis revealed that in the majority of cases (942 of 1102), Interest was associated with positive sentiment, which proves the positive nature of this emotion in this research.
The spatial distribution analysis of types of emotions and sentiment polarity within Kaunas city center based on the results of analysis of Facebook posts and comments provides a more nuanced understanding of how different areas can be linked with specific emotional responses among individuals. The emotion and sentiment heatmaps were generated using GIS-based Kernel Density Estimation (KDE), where each mapped point representing geotagged emotional data contributes to identifying clusters of emotional intensity across the study area. Areas with higher concentrations of similar emotional responses thus appear as prominent hotspots on the map. The maps of emotion distribution (Figure 5 and Figure 6) and sentiment polarity (Figure 7) provide visuals of the links between urban form, social interactions in virtual space, and individual perceptions, revealing patterns of emotional engagement and their potential links with urban environments. The distribution of emotions across Kaunas city center, derived from qualitative analysis based on the Plutchik [23] classification, reveals an emotional landscape with clear spatial distribution patterns. Interest emerges as the most widely distributed and intense emotion, as it is visible in both the heatmap and the number of emotions per dot, forming extensive hotspots throughout the area under analysis. It is remarkable that the clustering of Interest overlaps with the main pedestrian movement thoroughfares—Vilnius Street in Old Town and Laisves Avenue in New Town. These commercially active streets and arteries of visitor movement can definitely be considered places of interest. Meanwhile, the concentration of second most widespread emotion, Joy, appears prominently in specific clusters just partially corresponding to the main pedestrian movement arteries, but also correlating with the riverside, Nemunas river island, locations around prominent public spaces, pedestrian-friendly and entertainment spaces, and historical sites and shopping centers. The distribution of Serenity was also analyzed, expecting that this emotion would correlate with areas with green spaces or quieter enclaves within the city center. However, this hypothesis was not confirmed, although it is necessary to note that the distribution of Serenity is less correlated with the main pedestrian movement arteries and concentrations of commercial activities. It is peculiar that emotional hotspots, even if originating from interactions in the virtual space, align well with key urban features and functions.
The spatial distribution of negative and mixed emotions such as Anger, Fear, Sadness, and Boredom in Kaunas city center (Figure 6) contrasts notably with the distribution of positive emotions, like Joy and Interest. Negative emotions appear as localized, discrete clusters rather than widespread patterns, indicating specific, spatially confined areas of dissatisfaction or discomfort. Unlike the extensive emotional hotspots of Joy and Interest along prominent pedestrian routes and culturally significant spaces, the distributions of negative and mixed emotions are more fragmented.
The spatial sentiment polarity analysis, conducted using NLTK Vader data, complements the distribution of emotions analysis by offering a quantitative assessment of the prevailing sentiment within the city center. The results indicate that positive sentiment dominates, forming widespread clusters that overlap with areas of historical and cultural significance, commercial activities, and pedestrian zones. The concentration of positive sentiment suggests that Kaunas city center correlates with an overall favorable experience in the virtual space.
Neutral sentiment is distributed more evenly across the city center, often appearing in areas with less distinctive urban character and locations where comments reflect descriptive rather than affective content. The presence of neutral sentiment also correlates with the main pedestrian movement arteries in the city center. The more scattered nature of the distribution of negative sentiment suggests that dissatisfaction is not widespread, but localized, reflecting individual concerns.
A comparative assessment of emotion and sentiment polarity distribution maps reveals significant correlations between qualitative emotional classification and quantitative sentiment analysis. Areas of high Interest and Joy largely correspond with positive sentiment clusters, reinforcing the correlation between engaging urban environments and positive experiences.

4.2. Analysis of Sociological Survey Comments

Analyzing the comments related to the city of Kaunas in general, 6 different emotions from 16 selected emotions from Plutchik’s classification [23] were identified. Among these, the most prevalent emotion was Interest, observed in 19 instances, which constitutes 48.72% of all comments analyzed. Another prominent emotion was Joy, appearing in 16 instances or 41.02%. Other types of emotions—Sadness, Trust, Anger, and Pensiveness—were identified one time each.
Analyzing the comments related to the center of Kaunas, three types of emotions were detected, with Joy being the most frequent. This emotion was observed in six instances, making up 50% of the total. Emotions such as Interest and Annoyance appeared in four and two instances, respectively.
Overall, the predominant emotions in both datasets are positive. For the comments related to Kaunas city, predominantly positive emotions like Interest, Joy, and Trust collectively accounted for 92.3% of all instances, significantly outweighing negative emotions such as Anger and Pensiveness. Similarly, in the comments related to the center of Kaunas, positive emotions constituted 83.33%, compared to 16.7% for negative emotions. The emotional landscape of Kaunas city, as reflected by these findings, suggests a community that harbors a generally favorable sentiment towards the city. The strong presence of positive emotions like Interest and Joy points to a sense of attachment and satisfaction among the respondents. In contrast, the center of Kaunas shows a slightly different emotional profile, with Joy dominating, potentially reflecting localized factors such as pride in the historical or cultural significance of the area.
The sentiment polarity analysis of the dataset related to Kaunas city in general, using NLTK Vader, revealed that 58.97% of the comments reflected positive sentiment, indicating a generally optimistic view of the city. Negative sentiments accounted for 7.69%, while neutral sentiments made up 33.33% of the total.
The results of the analysis of the comments related to the center of Kaunas exhibited a similar trend, with 66.66% of comments classified as positive. However, the proportion of negative sentiments was slightly higher at 16.66%, and neutral sentiments accounted for 16.66%, as well. This distribution suggests that while the overall perception of the center remains positive, there are pockets of ambivalence and dissatisfaction among the respondents.
The predominance of positive sentiment in both datasets highlights a sense of satisfaction and optimism among residents regarding their city and its center. However, the higher proportion of negative and neutral sentiments in the center may reflect localized concerns or a more critical view of specific aspects of the neighborhood.
The sentiment and emotion analyses for Kaunas city and its center reveal several parallels and distinctions (Figure 8). Both areas exhibit a dominant presence of positive emotions and sentiments, reflecting an overall favorable perception. The correlation between emotions and sentiment polarity is also consistent across the datasets, with positive emotions aligning strongly with positive sentiment polarity and negative emotions with negative polarity. However, the center of Kaunas demonstrates a slightly more nuanced emotional profile, with a higher percentage of neutral and negative sentiments compared to the city overall.
The analyses of both the Facebook data and sociological survey responses reveal strong similarities, particularly the dominance of positive emotions, Interest and Joy, highlighting consistent emotional appreciation for Kaunas city center across different data sources. However, a nuanced difference emerged: Facebook comments predominantly emphasized curiosity and engagement (Interest), whereas survey responses more explicitly expressed pride and satisfaction (Joy). Additionally, the survey data indicated slightly more localized negative emotions, such as Annoyance, reflecting specific resident concerns that are less visible in the broader Facebook sentiment. Thus, while both datasets confirm overall positivity, the survey captures subtler emotional nuances, presumably tied to daily experiences and perceptions.

5. Discussion and Conclusions

This research highlights the significance of emotional geography in better understanding place identity, offering a methodological approach that bridges qualitative human experiences with quantitative spatial analysis. By examining emotions reflected in social media posts and sociological survey answers using Plutchik’s [23] classification and VADER sentiment analysis, and subsequently georeferencing these emotions and sentiment polarity through a GIS, this study provides a framework for capturing the affective dimension of urban spaces.
The analysis of Facebook comments provides valuable insights into the emotional geography of Kaunas city center, revealing a landscape predominantly shaped by curiosity and engagement, with Interest emerging as the most prevalent emotion. Existing studies also revealed Interest as a key sentiment when people talk about urban change and heritage sites [34]. Positive emotions such as Joy and Serenity are concentrated in key pedestrian areas, cultural landmarks, and recreational spaces, while negative emotions remain marginal. Such a positivity dominance has been observed in other emotional mapping studies, as well [8,35,36]. For example, participatory emotional mapping in a Philadelphia neighborhood found Joy to be the single most-mentioned emotion [35]. However, an important difference is that in the Philadelphia case, a transitional brownfield area was analyzed; here, the total volume of negative emotions like Sadness, Anger, and Disgust far exceeded positive emotions [35]. In the analysis of the Kaunas center, negative emotions remain marginal; this difference highlights the importance of context within analysis. Thus, the results of this study complement the literature by showing that beyond Joy, curiosity-driven engagement is a defining emotional tone of the Kaunas center. The sentiment polarity analysis using NLTK Vader further supports these findings, indicating an overwhelming dominance of positive sentiment, with neutral and negative sentiments being significantly lower. Such polarity distributions mirror findings in many social media-based urban sentiment mappings [36]. However, exceptions exist: A recent study of Shanghai youth on the Weibo platform found that the overall sentiment tended to be negative [37]. The spatial distribution of emotions and sentiments highlights the alignment between emotional hotspots and key urban functions, particularly along main pedestrian thoroughfares and commercial arteries and focal points, reinforcing the connection between urban form and emotional engagement. These findings resonate strongly with other studies that map urban emotions. For example, Aman et al. [38] analyzed geotagged posts in US cities and found that pedestrian-friendly infrastructure and green amenities positively influence sentiment [38]. Interestingly, while Joy aligns with cultural and entertainment spaces, Serenity does not consistently correspond to the expected green areas, suggesting that perceptions of tranquility are influenced by more complex factors. This suggests that perceptions of tranquility depend on more complex factors than just the presence of greenery. Other studies confirm this nuance. Wang et al. [39] found that visible green space generally reduces expressions of negative emotions on social media [39], supporting the intuition that parks and trees calm people. However, they also noted that this effect can vary by context and time [39]. Similarly, a mixed-method study in Camden reported that emotional responses to different parks were highly variable—parks were not uniformly positive or serene, and disinvestment and safety concerns in some green spaces led to less positive emotions [40].
The emotional hotspots revealed by the analysis of Facebook comments were visualized through GIS mapping in this study, just as hotspot analysis has been used in other research to statistically identify clusters of high sentiment [38]. Notably, our study found that negative emotions were not only rare, but spatially scattered, suggesting that negative emotional responses to urban spaces are highly case-specific [40]. Recent GIS-based emotion mapping frameworks explicitly linking sentiments of people with urban design elements call for planners to consider public emotion as a layer of city analysis [38]. The findings of this study support such calls: The alignment of positive and engaged emotions with walkable, activity-rich areas support the assumption that human-centered design contributes to emotional well-being [38].
The analysis of sociological survey comments highlights a strong prevalence of positive emotions and sentiments, reflecting a generally favorable perception of Kaunas city and its center. Joy and Interest dominate, suggesting that residents and visitors find the city engaging and culturally enriching. In the broader city context, Interest is particularly strong, indicating curiosity and attachment, while in the city center, Joy prevails, presumably linked to historical and cultural pride. This difference may indicate that citywide sentiment includes forward-looking curiosity (people thinking about the future, opportunities for their city, and their general attachment), whereas the center, the historic heart of the city, evokes immediate feelings of joy and enjoyment. A comparable distinction was observed in a recent study of urban park perceptions: Users’ emotional responses differed by location, with some sites sparking more excitement and interest and others, more contentment [40]. However, the presence of Annoyance and a slightly higher share of negative sentiments in the center points to localized concerns. Sentiment polarity analysis supports these trends, with positivity prevailing, although with more neutral and negative sentiments in the center than in the city overall. This phenomenon, pockets of negativity, has been documented in other emotional geography studies; existing studies, for instance, show how a single location could trigger contrasting emotions [35]. This is consistent with the idea that dense urban cores concentrate not only enjoyment, but also critical attention, as people are more likely to comment on issues where they care the most.
A previous emotional mapping and sentiment analysis study in the Lithuanian context also demonstrated the dominance of Interest and positive emotions [8]. This analysis was conducted in Žemieji Šančiai, a predominantly low-rise historic Kaunas residential district with industrial inclusions. Emotion maps were created by analyzing textual entries from residents and visitors on interactive online platforms, spatially localizing their emotions. These maps reveal the types and polarity of emotions, highlighting the places most strongly associated with emotional experiences and reactions to heritage, public spaces, and natural areas. Positive emotions related to experiences in public spaces were mostly concentrated in recreational and commercial areas [8].

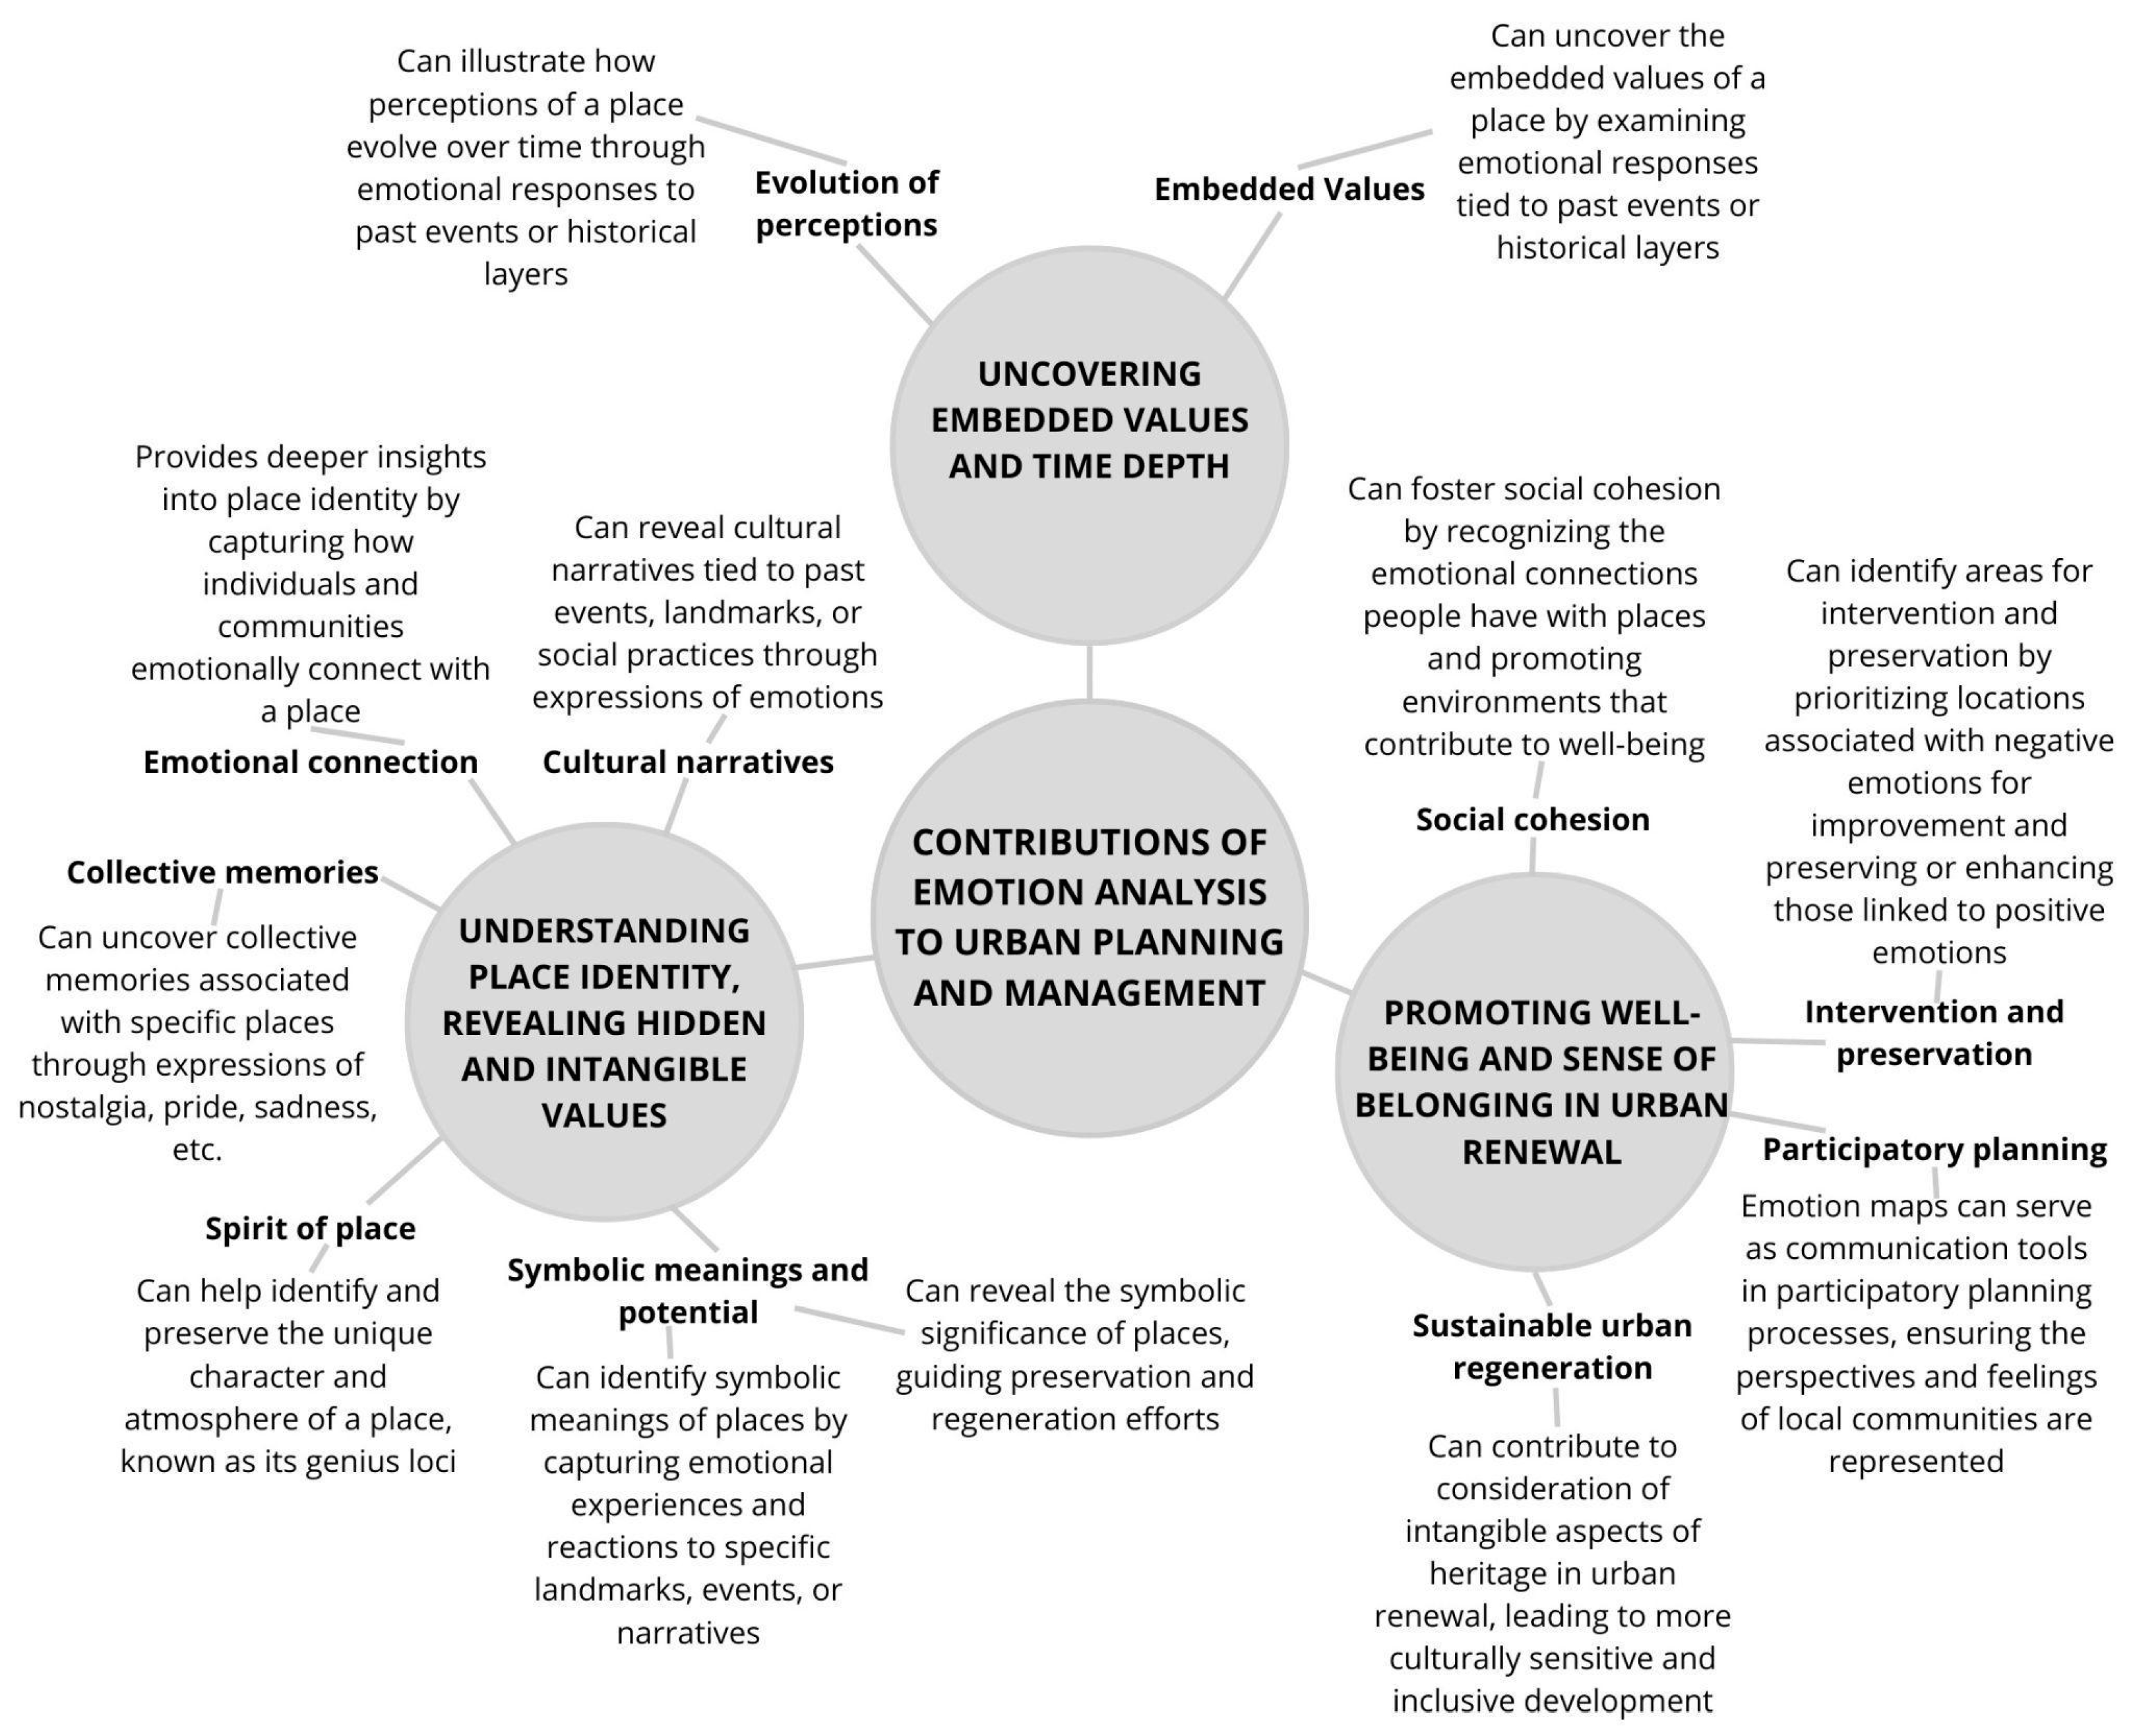
5.1. Theoretical Significance

The study is grounded in Tuan’s concept of Place, advancing it through a quantitative lens. While Tuan emphasizes the experiential and personal dimensions of place attachment, this study operationalizes these concepts through empirical data, making them more tangible and analyzable. In doing so, the study also intersects with Benjamin’s notion of Secular Pilgrimage [41], providing a means to map emotional movement through urban environments. The ability to identify and analyze spatial patterns of emotional responses offers a new way to study how people “journey” through cities, experiencing and assigning meaning to their various spaces.
Beyond its philosophical and theoretical implications, this research also extends into applied urban studies. The results contribute to Environmental Psychology and theories of preferred environments by demonstrating how certain urban spaces evoke specific emotions. In line with Gehl’s “Cities for People” idea [42], the study presents a potential background for a design tool for urban planning, capable of predicting emotional responses to different spatial configurations and urban design solutions. This predictive capacity is particularly relevant in increasingly multicultural cities, where diverse social groups may interpret and experience urban spaces differently.
Furthermore, the study contributes to Marcus’s framework of urban capitals (spatial, social, economic, and ecological) [43] by adding emotional dimensions and creating a background for proposing the addition of a fifth dimension—emotional capital. Emotional capital, in this context, might refer to the cumulative affective value embedded in urban environments, influencing social cohesion, well-being, and overall urban livability. This addition highlights the necessity of integrating emotional responses into urban analysis alongside more traditional spatial and economic indicators.

5.2. Practical Significance

From the practical perspective, the presented research demonstrates an alternative to traditional sociological surveys, as it more often focuses on subjective, emotional aspects of interaction with urban environment, as proven by such examples as an analysis of Tweets for neighborhood comparisons in Tartu [44]; a study emphasizing public satisfaction as the ultimate goal and an important determinant of urban regeneration plans [45]; a study in Barcelona exploring regularities in the relation between public sentiment and urban environments [46]; etc. In this context, the presented research contributes to the growing the critical mass of similar investigations, bringing it closer to more empathic urban design as an important asset for the social and cultural dimensions of sustainable urban development [47]. Several potential applications in the fields of heritage preservation and management, architectural analysis, and urban planning are mentioned below. For example, emotional analysis can contribute to a better understanding of collective memory and significance of place, and making appropriate heritage decisions, as studies demonstrate [48] that even buildings and other urban environment features that are not officially protected as heritage may hold strong memory and social significance potential. Without considering this potential through sociological or emotional analysis studies, it can easily be erased. Emotional analysis of place, especially based on geotagged social media content, can also be applied to better understand media content related to architecture [49]. Psychological acceptance of new architectural trends, such as green, sustainable architecture [50], developed in historic settings, for example, could be approached through emotional analysis of place, as well. From the urban planning and management perspective, emotional analysis could be applied to identify walkability drivers [51], perceptive safety, inclusivity [52], attractiveness of public spaces, etc. For example, areas identified as emotional hotspots with predominantly positive responses can serve as focal points for urban renewal or cultural tourism planning by prioritizing pedestrian accessibility, developing public spaces with culturally meaningful amenities, organizing regular social or cultural events, etc. Such strategic interventions not only preserve existing emotional connections, but also amplify the vitality of the area. In the case of the Kaunas center, while the overall emotional landscape is positive, urban renewal strategies should address concerns about urbanization and loss of community. Urban vitality is the dynamic energy that makes a city feel alive and exciting, fostering social connections, cultural activities, economic opportunities, and a sense of community. A vibrant urban environment encourages outdoor activities, fosters social interaction, and creates spaces that are both functional and pleasant. To achieve this, there is a need to create mixed-use buildings, incorporate spaces for cultural events, festivals, and recreational activities into the urban fabric, and facilitate community participation and co-creation. In addition, in order to improve urban design and planning, it would be valuable to explore how areas with positive emotions, such as those clustered around cultural and natural spaces, can be further promoted through initiatives such as cultural tourism and urban regeneration. This could become a mandatory part of specific planning documents.

5.3. Methodological Limitations

Despite its contributions, the study has certain limitations. For example, social media data, while abundant and accessible, do not fully represent the entire spectrum of urban populations. The data are skewed toward active social media users, whose demographic characteristics may differ from those less engaged in digital spaces. Additionally, the study focuses on the most attractive areas of Kaunas, meaning that the emotional landscape of the city’s periphery, or less-frequented spaces, remains unexplored. Future research should aim for a broader, more inclusive dataset that captures emotional expressions across different social groups and urban contexts. The temporal gap between the analyzed datasets, which may reflect varying urban contexts and emotional dynamics due to changes in urban form, usage patterns, or social perceptions over time, can be seen as a limitation of this study, as well. Thus, future research should ideally minimize such gaps or explicitly address temporal changes to improve the reliability and applicability of comparative emotional geography analyses. A limitation also arises from translating Lithuanian comments into English prior to analysis, as linguistic subtleties, slang, and culturally specific expressions could be distorted, leading to less precise emotional interpretation. As validating translation quality and cross-validating between original and translated texts manually is time-consuming, future studies could improve accuracy by utilizing sentiment analysis tools specifically adapted to the Lithuanian language.

5.4. Future Directions

To further develop this line of research, it would be valuable to integrate additional aspects of place, particularly its social and cultural dimensions. Combining emotional geography with ethnographic studies, participatory mapping, or qualitative interviews could deepen the understanding of how cultural narratives, historical contexts, and community interactions shape the emotional fabric of urban spaces. Additionally, incorporating real-time data sources, such as mobile sensing and physiological response analysis (e.g., the application of biometric data for an investigation of emotions in public spaces in Vilnius [53]), could refine the granularity of emotional mapping and provide even richer insights for urban planning and policy-making. By expanding the study in these directions, it is possible to move closer to a holistic understanding of the urban experience—one that captures not only the functional and aesthetic qualities of a city, but also the deeply felt, emotionally charged interactions that define place identity.

Author Contributions

Conceptualization, A.M., I.G.-V. and K.Z.; methodology, I.G.-V. and M.I.; software, M.I.; validation, M.I. and K.Z.; investigation, I.G.-V.; resources, M.I. and I.P.; data curation, M.I.; writing—original draft preparation, I.G.-V.; writing—review and editing, I.G.-V., A.M., K.Z., M.I. and I.P.; visualization, M.I.; supervision, A.M.; project administration, A.M.; funding acquisition, A.M. All authors have read and agreed to the published version of the manuscript.

Funding

This research was funded by Joint Programming Initiative on Cultural Heritage and Global Change under research project “Heritage in Depopulated European Areas (HerInDep)”, project number: S-JPIKP-23-1, https://www.heritageresearch-hub.eu/project/herindep/ (accessed on 5 March 2025).

Data Availability Statement

The original contributions presented in this study are included in the article material. Further inquiries can be directed to the corresponding author.

Conflicts of Interest

The authors declare no conflicts of interest. The funders had no role in the design of the study; in the collection, analyses, or interpretation of data; in the writing of the manuscript; or in the decision to publish the results.

References

  1. Mody, R.N.; Willis, K.S.; Kerstein, R. WiMo: Location-Based Emotion Tagging. In Proceedings of the 8th International Conference on Mobile and Ubiquitous Multimedia (MUM 2009), Cambridge, UK, 22–25 November 2009; ACM: New York, NY, USA, 2009; pp. 1–4. [Google Scholar]
  2. Korpela, K. Children’s Environment. In Handbook of Environmental Psychology; Bechtel, R.B., Churchman, A., Eds.; John Wiley & Sons: New York, NY, USA, 2002; pp. 363–373. [Google Scholar]
  3. Manzo, L.C. Beyond House and Haven: Toward a Revisioning of Emotional Relationships with Places. J. Environ. Psychol. 2003, 23, 47–61. [Google Scholar] [CrossRef]
  4. Shoval, N.; Schvimer, Y.; Tamir, M. Tracking Technologies and Urban Analysis: Adding the Emotional Dimension. Cities 2018, 72, 34–42. [Google Scholar] [CrossRef]
  5. Park, S.B.; Kim, H.J.; Ok, C.M. Linking Emotion and Place on Twitter at Disneyland. J. Travel Tour. Mark. 2018, 35, 664–677. [Google Scholar] [CrossRef]
  6. Stals, S.; Smyth, M.; Mival, O. Capturing, Exploring, and Sharing People’s Emotional Bond with Places in the City Using Emotion Maps. Airea Arts Interdiscip. Res. 2018, 1, 47–62. [Google Scholar] [CrossRef]
  7. Merschdorf, H.; Blaschke, T. Revisiting the Role of Place in Geographic Information Science. ISPRS Int. J. Geo-Inf. 2018, 7, 364. [Google Scholar] [CrossRef]
  8. Zaleckis, K.; Jankauskaite-Jureviciene, L.; Vitkuviene, J.; Grazuleviciute-Vileniske, I.; Karvelyte-Balbieriene, V. Integration of Collective Knowledge into Simulative Urban Modeling. In Proceedings of the Annual Conference of the European Association for Architectural Education, Madrid, Spain, 31 August–2 September 2022; Springer Nature: Cham, Switzerland, 2022; pp. 214–230. [Google Scholar]
  9. Caquard, S.; Griffin, A. Mapping Emotional Cartography. Cartogr. Perspect. 2018, 91, 4–16. [Google Scholar] [CrossRef]
  10. Hawthorne, T.L.; Toohy, K.R.; Yang, B.; Graham, L.; Lorenzo, E.M.; Torres, H.; Walters, L.J. Mapping Emotional Attachment as a Measure of Sense of Place to Identify Coastal Restoration Priority Areas. Appl. Geogr. 2022, 138, 102608. [Google Scholar] [CrossRef]
  11. Norberg-Schulz, C. Genius Loci: Towards a Phenomenology of Architecture; Rizzoli International Publishers: New York, NY, USA, 1980. [Google Scholar]
  12. Grazuleviciute-Vileniske, I.; Zmejauskaite, D. ‘Archeology’ of Hidden Values of Underutilized Historic Industrial Sites in Context of Urban Regeneration and Nature-Based Solutions. Buildings 2025, 15, 205. [Google Scholar] [CrossRef]
  13. Tuan, Y.F. Space and Place: The Perspective of Experience; Reprint ed.; University of Minnesota Press: Minneapolis, MN, USA, 2001. [Google Scholar]
  14. Selten, M.; van der Zandt, F. Space vs. Place. Available online: http://geography.ruhosting.nl/geography/index.php?title=Space_vs._place&oldid=5653 (accessed on 20 April 2022).
  15. Gao, Y.; Chen, Y.; Mu, L.; Gong, S.; Zhang, P.; Liu, Y. Measuring Urban Sentiments from Social Media Data: A Dual-Polarity Metric Approach. J. Geogr. Syst. 2022, 24, 199–221. [Google Scholar] [CrossRef]
  16. Web of Science. 2024. Available online: https://www.webofscience.com/wos/woscc/basic-search (accessed on 20 November 2024).
  17. Do, H.H.; Prasad, P.W.; Maag, A.; Alsadoon, A. Deep Learning for Aspect-Based Sentiment Analysis: A Comparative Review. Expert Syst. Appl. 2019, 118, 272–299. [Google Scholar] [CrossRef]
  18. Mitchell, L.; Frank, M.R.; Harris, K.D.; Dodds, P.S.; Danforth, C.M. The Geography of Happiness: Connecting Twitter Sentiment and Expression, Demographics, and Objective Characteristics of Place. PLoS ONE 2013, 8, e64417. [Google Scholar] [CrossRef]
  19. VOSviewer. 2024. Available online: https://www.vosviewer.com/ (accessed on 15 January 2025).
  20. Mohammad, S.M. Challenges in Sentiment Analysis. In A Practical Guide to Sentiment Analysis; Springer: Cham, Switzerland, 2017; pp. 61–83. [Google Scholar] [CrossRef]
  21. Sathya, V.; Venkataramanan, A.; Tiwari, A. Ascertaining Public Opinion through Sentiment Analysis. In Proceedings of the 3rd International Conference on Computing Methodologies and Communication (ICCMC 2019), Erode, India, 27–29 March 2019; IEEE: New York, NY, USA, 2019; pp. 1139–1143. [Google Scholar] [CrossRef]
  22. Misue, K.; Taguchi, K. Development of Emotion-Weather Maps. Procedia Comput. Sci. 2015, 60, 292–301. [Google Scholar] [CrossRef]
  23. Plutchik, R. The Nature of Emotions: Human Emotions Have Deep Evolutionary Roots, a Fact That May Explain Their Complexity and Provide Tools for Clinical Practice. Am. Sci. 2001, 89, 344–350. [Google Scholar]
  24. Murgante, B.; Mazzarelli, G.; van der Laag Yamu, C.H.; Annunziata, A. Mapping Emotional Landscapes: Understanding the Interplay of Emotions and the Built Environment in Potenza, Italy. In Proceedings of the International Conference on Computational Science and Its Applications (ICCSA 2024), Hanoi, Vietnam, 1–4 July 2024; Springer Nature: Cham, Switzerland, 2024; pp. 202–217. [Google Scholar] [CrossRef]
  25. Siriaraya, P.; Zhang, Y.; Kawai, Y.; Jeszenszky, P.; Jatowt, A. A City-Wide Examination of Fine-Grained Human Emotions through Social Media Analysis. PLoS ONE 2023, 18, e0279749. [Google Scholar] [CrossRef]
  26. Piga, B.E.A.; Rainisio, N.; Stancato, G.; Boffi, M. Mapping the In-Motion Emotional Urban Experiences: An Evidence-Based Method. Sustainability 2023, 15, 7963. [Google Scholar] [CrossRef]
  27. Camara, G.S.; Camboim, S.P.; Bravo, J.V.M. Collaborative Emotional Mapping as a Tool for Urban Mobility Planning. Bol. Ciênc. Geod. 2021, 27, e2021011. [Google Scholar] [CrossRef]
  28. Albeyboni, B.; Raswol, L. The Impact of Historic Built Environment on Residents’ Emotional Experiences: Duhok as a Case Study. J. Umm Al-Qura Univ. Eng. Archit. 2025, 16, 162–171. [Google Scholar] [CrossRef]
  29. Pykett, J.; Chrisinger, B.W.; Kyriakou, K.; Osborne, T.; Resch, B.; Stathi, A.; Whittaker, A.C. Urban Emotion Sensing beyond ‘Affective Capture’: Advancing Critical Interdisciplinary Methods. Int. J. Environ. Res. Public Health 2020, 17, 9003. [Google Scholar] [CrossRef]
  30. Heritage in Depopulated European Areas (HerInDep). JPI CH Cultural Heritage, Society and Ethics. 2022. Available online: https://herindep.fhs.cuni.cz/FHSH-1.html (accessed on 10 March 2025).
  31. Kaunas City Center Map. 2025. Available online: https://maps.lt/map?b=topo&bl=false&c=2662280.2%2C7340837.8&r=0&s=36111.909643 (accessed on 15 January 2025).
  32. Population and Housing Census. Official Statistics Portal. 2024. Available online: https://osp.stat.gov.lt/gyventoju-ir-bustu-surasymai1 (accessed on 15 January 2025).
  33. Kauno Gyventojų Skaičius. 2025. Available online: https://www.kaunasiloveyou.lt/kauno-gyventoju-skaicius-2021-m/ (accessed on 15 January 2025).
  34. Liu, M.; Shibuya, Y.; Sekimoto, Y. Emotions, Behaviors and Places: Mapping Sentiments with Behaviors in Japanese Tweets. Cities 2024, 155, 105449. [Google Scholar] [CrossRef]
  35. Meenar, M.R.; Mandarano, L.A. Using Photovoice and Emotional Maps to Understand Transitional Urban Neighborhoods. Cities 2021, 118, 103353. [Google Scholar] [CrossRef]
  36. Jiang, J.; Thomason, J.; Barbieri, F.; Ferrara, E. Geolocated Social Media Posts Are Happier: Understanding the Characteristics of Check-in Posts on Twitter. In Proceedings of the 15th ACM Web Science Conference 2023, Austin, TX, USA, 30 April–1 May 2023; ACM: New York, NY, USA, 2023; pp. 136–146. [Google Scholar] [CrossRef]
  37. Duan, S.; Shen, Z.; Luo, X. Exploring the Relationship between Urban Youth Sentiment and the Built Environment Using Machine Learning and Weibo Comments. Int. J. Environ. Res. Public Health 2022, 19, 4794. [Google Scholar] [CrossRef] [PubMed]
  38. Aman, J.; Matisziw, T.C. Urban Sentiment Mapping Using Language and Vision Models in Spatial Analysis. Front. Comput. Sci. 2025, 7, 1504523. [Google Scholar] [CrossRef]
  39. Wang, R.; Browning, M.H.; Qin, X.; He, J.; Wu, W.; Yao, Y.; Liu, Y. Visible Green Space Predicts Emotion: Evidence from Social Media and Street View Data. Appl. Geogr. 2022, 148, 102803. [Google Scholar] [CrossRef]
  40. Meenar, M.; Pánek, J.; Kitson, J.; York, A. Mapping the Emotional Landscapes of Parks in Post-Industrial Communities Enduring Environmental Injustices: Potential Implications for Biophilic City Planning. Cities 2025, 158, 105692. [Google Scholar] [CrossRef]
  41. Benjamin, W. The Arcades Project; Tiedemann, R., Ed.; Eiland, H.; McLaughlin, K., Translators; Belknap Press: New York, NY, USA, 2002; p. 1088. ISBN 0-674-00802-2. [Google Scholar]
  42. Gehl, J. Cities for People; Island Press: Washington, DC, USA; Covelo, CA, USA; London, UK, 2010; p. 284. [Google Scholar]
  43. Marcus, L. The Theoretical Underpinnings for a Theory of Spatial Capital. In Proceedings of the 11th International Space Syntax Symposium, Instituto Superior Técnico, Lisbon, Portugal, 3–7 July 2017; Available online: https://www.researchgate.net/publication/318679763_The_theoretical_underpinnings_for_a_theory_of_spatial_capital (accessed on 25 February 2025).
  44. Hess, D.B.; Iacobucci, E.; Väiko, A. Network Connections and Neighbourhood Perception: Using Social Media Postings to Capture Attitudes among Twitter Users in Estonia. Archit. Urban Plan. 2017, 13, 67–78. [Google Scholar] [CrossRef]
  45. Chen, K.; Wei, G. Public Sentiment Analysis on Urban Regeneration: A Massive Data Study Based on Sentiment Knowledge Enhanced Pre-Training and Latent Dirichlet Allocation. PLoS ONE 2023, 18, e0285175. [Google Scholar] [CrossRef]
  46. Yang, L.; Duarte, C. Quantifying the Relationship between Public Sentiment and Urban Environment in Barcelona. Cities 2022, 130, 103977. [Google Scholar] [CrossRef]
  47. Sandman, H.; Levänen, J.; Savela, N. Using Empathic Design as a Tool for Urban Sustainability in Low-Resource Settings. Sustainability 2018, 10, 2493. [Google Scholar] [CrossRef]
  48. Tousi, E.; Karadoulama, K.; Papaioannou, I.; Patsea, A.; Skrepi, A.; Spentza, E.; Zafeiropoulos, G. Issues of Urban Conservation and Collective Memory. The Case of the Asia Minor Post-Refugee Urban Neighbourhood Germanika at Nikea, Piraeus, Greece. J. Sustain. Archit. Civ. Eng. 2023, 33, 30–44. [Google Scholar] [CrossRef]
  49. Parneta, M.; Habrel, M.; Kovalchuk, V. Justification of the Media-Linguistic Approach to the Formation of Architecture and Development of Urban Spaces. J. Sustain. Archit. Civ. Eng. 2023, 33, 72–82. [Google Scholar] [CrossRef]
  50. Daugėlaitė, A. Psychological Acceptance of Sustainable Architecture in Lithuania: A Qualitative Study. J. Sustain. Archit. Civ. Eng. 2023, 32, 41–57. [Google Scholar] [CrossRef]
  51. Domeneghini, J.; Macke, J.; Sarate, J.A. Walkability Drivers for Sustainable Cities: A Pedestrian Behavior Survey. J. Sustain. Archit. Civ. Eng. 2022, 30, 65–77. [Google Scholar] [CrossRef]
  52. Mela, A.; Tousi, E. Safe and Inclusive Urban Public Spaces: A Gendered Perspective. The Case of Attica’s Public Spaces During the COVID-19 Pandemic in Greece. J. Sustain. Archit. Civ. Eng. 2023, 33, 5–14. [Google Scholar] [CrossRef]
  53. Kaklauskas, A.; Bardauskiene, D.; Cerkauskiene, R.; Ubarte, I.; Raslanas, S.; Radvile, E.; Kaklauskaite, U.; Kaklauskiene, L. Emotions Analysis in Public Spaces for Urban Planning. Land Use Policy 2021, 107, 105458. [Google Scholar] [CrossRef]
Figure 2. Graphical analysis, using VOSviewer [19] software, of the use of terms generated from the bibliometric search results in the Web of Science scientific literature database [16] using the keyword combination, “emotion and sentiment analysis of place”. The graph demonstrates four distinct, although closely integrated, clusters of use of terms. This analysis highlights a growing interest in using advanced computational tools (green cluster) alongside theoretical frameworks (red cluster) to better understand how people emotionally engage with places.
Land 14 00783 g002
Figure 3. Case study area: Kaunas Center Eldership [31] and sub-elderships Senamiesčio, Naujamiesčio, Karmelitų, and Kalno located within it. Figure and photographs by the authors.
Land 14 00783 g003
Figure 4. Sequence of research methodology. Figure by the authors.
Land 14 00783 g004
Figure 5. Results of the emotion analysis of Facebook posts and comments distributed on the map of Kaunas Center Eldership: distribution of Interest, Joy, and Serenity. Colors in the heatmaps represent the density of emotional responses, with warmer colors (red, orange) indicating areas of higher emotional intensity and cooler colors (blue, green) indicating lower intensity. Figures by the authors.
Land 14 00783 g005
Figure 6. Results of the emotion analysis of Facebook posts and comments distributed on the map of Kaunas Center Eldership: distribution of Boredom, Sadness, Anger, and Fear. Colors in the heatmaps represent the density of emotional responses, with warmer colors (red, orange) indicating areas of higher emotional intensity and cooler colors (blue, green) indicating lower intensity. Figures by the author.
Land 14 00783 g006
Figure 7. Results of the sentiment polarity analysis of Facebook posts and comments distributed on the map of Kaunas Center Eldership. Colors in the heatmaps represent the density of emotional responses, with warmer colors (red, orange) indicating areas of higher emotional intensity and cooler colors (blue, green) indicating lower intensity. Figures by the authors.
Land 14 00783 g007
Figure 8. Results of the sentiment polarity and emotion analysis of sociological survey comments distributed on the map of Kaunas Center Eldership [31] and sub-elderships Senamiesčio, Naujamiesčio, Karmelitų, and Kalno located within it. The circle in the figure marks the territory of Kaunas Center Eldership—the focus of the analysis. The arrows point to the rest of territory of Kaunas and the results of it’s emotion analysis. Figure by the authors.
Land 14 00783 g008
Table 1. The 16 types of emotions selected for the qualitative analysis of data from Plutchik’s classification of emotions [23].
EmotionDescription
SerenityA state of calmness and peacefulness, often experienced after fulfilling needs or in safe and comforting situations.
InterestA feeling of curiosity and engagement, prompting exploration or learning in response to new stimuli.
AnnoyanceA mild feeling of irritation or displeasure caused by minor disturbances or interruptions.
BoredomA state of disinterest and lack of engagement, often resulting from monotonous or unstimulating conditions.
PensivenessA contemplative and reflective emotional state, often associated with subtle sadness or nostalgia.
DistractionA feeling of being pulled away from focus, typically by competing or unexpected stimuli.
ApprehensionA state of uneasy anticipation, often related to perceived future risks or uncertainties.
AcceptanceA positive emotion tied to recognizing, welcoming, or integrating people, situations, or truths.
JoyA feeling of happiness and contentment, typically arising from fulfilling experiences or successes.
AnticipationA feeling of excitement or eagerness regarding an expected event or outcome.
AngerA strong emotional response to perceived harm, injustice, or frustration, often motivating action.
DisgustA reaction to something perceived as unpleasant, offensive, or harmful, prompting withdrawal or rejection.
SadnessA feeling of loss or sorrow, often in response to perceived failures, setbacks, or emotional pain.
SurpriseAn immediate reaction to an unexpected event, which can be either positive or negative depending on the context.
FearAn emotion triggered by perceived threats or danger, leading to heightened alertness and defensive behaviors.
TrustA sense of reliance and confidence in someone or something, fostering cooperation and social bonding.
Disclaimer/Publisher’s Note: The statements, opinions and data contained in all publications are solely those of the individual author(s) and contributor(s) and not of MDPI and/or the editor(s). MDPI and/or the editor(s) disclaim responsibility for any injury to people or property resulting from any ideas, methods, instructions or products referred to in the content.

