Article

Using Multi-Scenario Analyses to Determine the Driving Factors of Land Use in Inland River Basins in Arid Northwest China

1
Key Laboratory of Agricultural Soil and Water Engineering in Arid and Semiarid Areas, Ministry of Education, Northwest A&F University, Yangling 712100, China
2
College of Resources and Environment, Xinjiang Agricultural University, Urumuqi 830052, China
*
Authors to whom correspondence should be addressed.
Land 2025, 14(4), 787; https://doi.org/10.3390/land14040787 (registering DOI)
Submission received: 25 February 2025 / Revised: 22 March 2025 / Accepted: 2 April 2025 / Published: 6 April 2025
(This article belongs to the Section Land Use, Impact Assessment and Sustainability)

Abstract

:
Global challenges such as climate change, ecological imbalance, and resource scarcity are closely related with land-use change. Arid land, which is 41% of the global land area, has fragile ecology and limited water resources. To ensure food security, ecological resilience, and sustainable use of land resources, there is a need for multi-scenario analysis of land-use change in arid regions. To carry this out, multiple spatial analysis techniques and land change indicators were used to analyze spatial land-use change in a typical inland river basin in arid Northwest China—the Tailan River Basin (TRB). Then, the PLUS model was used to analyze, in a certain time period (1980–2060), land-use change in the same basin. The scenarios used included the Natural Increase Scenario (NIS), Food Security Scenario (FSS), Economic Development Scenario (EDS), Water Protection Scenario (WPS), Ecological Protection Scenario (EPS), and Balanced Eco-economy Scenario (BES). The results show that for the period of 1980–2020, land-use change in the TRB was mainly driven by changes in cultivated land, grassland, forest land, and built-up land. For this period, there was a substantial increase in cultivated land (865.56 km2) and a significant decrease in forest land (197.44 km2) and grassland (773.55 km2) in the study area. There was a notable spatial shift in land use in the period of 1990–2010. The overall accuracy (OA) of the PLUS model was more than 90%, with a Kappa value of 85% and a Figure of Merit (FOM) of 0.18. The most pronounced expansion in cultivated land area in the 2020–2060 period was for the FSS (661.49 km2). This led to an increase in grain production and agricultural productivity in the region. The most significant increase in built-up area was under the EDS (61.7 km2), contributing to economic development and population growth. While the conversion of grassland area into other forms of land use was the smallest under the BES (606.08 km2), built-up area increased by 55.82 km2. This presented an ideal scenario under which ecological conservation was in balance with economic development. This was the most sustainable land management strategy with a harmonized balance across humans and the ecology in the TRB study area. This strategy may provide policymakers with a realistic land-use option with the potential to offer an acceptable policy solution to land use.

1. Introduction

About 75% of the earth’s terrestrial surface has been altered by human activity [1], impacting 72% of non-permafrost regions [2] and exacerbating global warming [3]. Unreasonable utilization not only triggers global challenges such as food security, climate change [4], and biodiversity loss [5], but also leads to frequent extreme weather events, soil erosion [6], and decreased hydrological resilience [7]. Not only are the earth’s external layers, such as the atmosphere, biosphere, and hydrosphere, strongly affected by land-use change [8], but the carbon cycle process is also disturbed, ultimately affecting food security and animal migration [9]. When people come to realize that land-use change is a key factor affecting climate change goals, it will become the starting point of research on global challenges [10]. It is therefore important to understand the quantitative and qualitative processes of land-use change by evaluating the space-time dynamics of the change in order to address the global challenges triggered by it. However, reducing uncertainty in reconstructing long-sequence space-time processes and refining simulations of the processes of land-use change remain challenging.
Arid regions account for 41% of the Earth’s land area and support 38% of the global population [11]. Arid ecosystems are extremely fragile and therefore sensitive to human activity and climate change [12]. These ecosystems are characterized by low annual precipitation, high potential evapotranspiration, sparse vegetation, and nutrient-poor soils [13]. In recent years, the population in China’s arid regions has grown by 39.61%, and the area of cultivated land has increased by 25.87%. It is one of the regions with the most significant land-use change in the world [14]. Arid Northwest China is characterized by a complex mountain–oasis–desert ecosystem consisting mainly of halophytic and xerophytic shrub and herbaceous vegetation [15,16]. Generally, arid regions are challenged with water scarcity and fragile water ecosystems [17,18]. Water systems in these regions generally originate mainly from mountain runoff and are used up in the plains [19]. This pattern of water generation in the mountains and consumption in plain oases deprives the plain deserts of water. Typical river basins are surrounded by oasis plains that are densely populated and have developed agriculture [20]. While rational allocation of land-use resources in such areas can drive economic development, it can also protect the ecology [21]. However, complex eco-climatic feedback processes in fragile arid ecological environments challenge the rational use of land resources in these regions [22]. It is therefore crucial that the conversion of land from one type of use into another in typical river basins is analyzed over historical periods to determine future land use in a sustainable manner.
Land-Use and Land-Cover Change (LULC) models are increasingly being used to predict the conversion of land from one type of use to another. LULC models can be divided into empirical statistical (e.g., Logistic Regression—LR model; System Dynamics—SD model; and Markov Chain—MC model), spatial (e.g., CLUE-S), and coupled models (e.g., FLUS) models. Coupled models combine the advantages of top-down empirical statistical models and bottom-up spatial models by considering both LULC area and spatial distribution [23], and they are therefore more widely used in evaluating land-use conflicts [24], assessing ecosystem service impacts [25], quantifying soil erosion dynamics [26], and analyzing landslide susceptibility [27,28]. The Patch-generating Land Use Simulation (PLUS) model is a typical coupled model. By integrating a land expansion analysis module with cellular automata, it not only accurately analyzes the factors driving changes in various land classes, but also simulates the growth of the patches [29]. Research shows that PLUS outperforms other models for accurate simulation and more realistically captures the spatial characteristics of land-use change [30]. Scenario analysis assumes that a certain phenomenon or trend can continue into the future under a given set of conditions [31]. Scenario analysis has been used in natural sciences [32], social sciences [33], and a range of other disciplines. Land-use change does not evolve in a single direction and is influenced by natural changes, social developments, and local/national/regional planning. These and many more other factors make the changes in land use highly uncertain. The combined use of multiple scenarios and simulation models can provide a time-driven guide to complex future development strategies [34]. Thus, multi-scenario-coupled models not only show the evolution trend of land use, but also provide theoretical support for land management.
Compared with other regions, the fragile ecosystems in arid areas exhibit heightened sensitivity to land system feedback, necessitating greater attention to land use changes in these regions. However, current studies on land-use change in arid areas have primarily focused on ecological assessments [35], carbon stock evaluations [14], and soil erosion monitoring [36], with limited exploration of future land projections and scenario-based evolution under diverse development requirements. Scherzinger et al. demonstrated that sustainable land management enhances ecological–economic multifunctionality under both current and projected climatic conditions [37]. Therefore, systematically quantifying land evolution processes, clarifying land change trajectories, and exploring sustainable land governance frameworks are crucial for achieving socio-economic–ecological synergies in arid regions. These approaches constitute key strategies for ensuring food security and ecological resilience in drylands while also providing pathways for coordinated development integrating food production, ecological conservation, and comprehensive sustainability in global arid zones.
In this study, a total of six land-use change scenarios were used in the PLUS model to determine future trends in a land in the arid northwest TRB study area. The scenarios included the Natural Increase Scenario (NIS), Food Security Scenario (FSS), Economic Development Scenario (EDS), Water Resources Protection Scenario (WPS), Ecological Protection Scenario (EPS), and Balanced Ecology–Economy Scenario (BES). The objectives of the study were to (i) quantify the spatial changes in land use in the TRB for the 1980–2020 historical period using the GIS platform; (ii) predict land change in the TRB using model-driven multi-scenario simulation; and (iii) use the long-term impact of land-use change on the TRB to determine the order of significance of driving factors of land-use change. Additionally, (iv) based on six scenarios, this framework recommends the most promising land-use scenario for sustainable land management and socio-economic development strategies in the study area. This will be the basis for coordinated food production, ecological protection, and land use in the TRB study area and beyond.

2. Materials and Methods
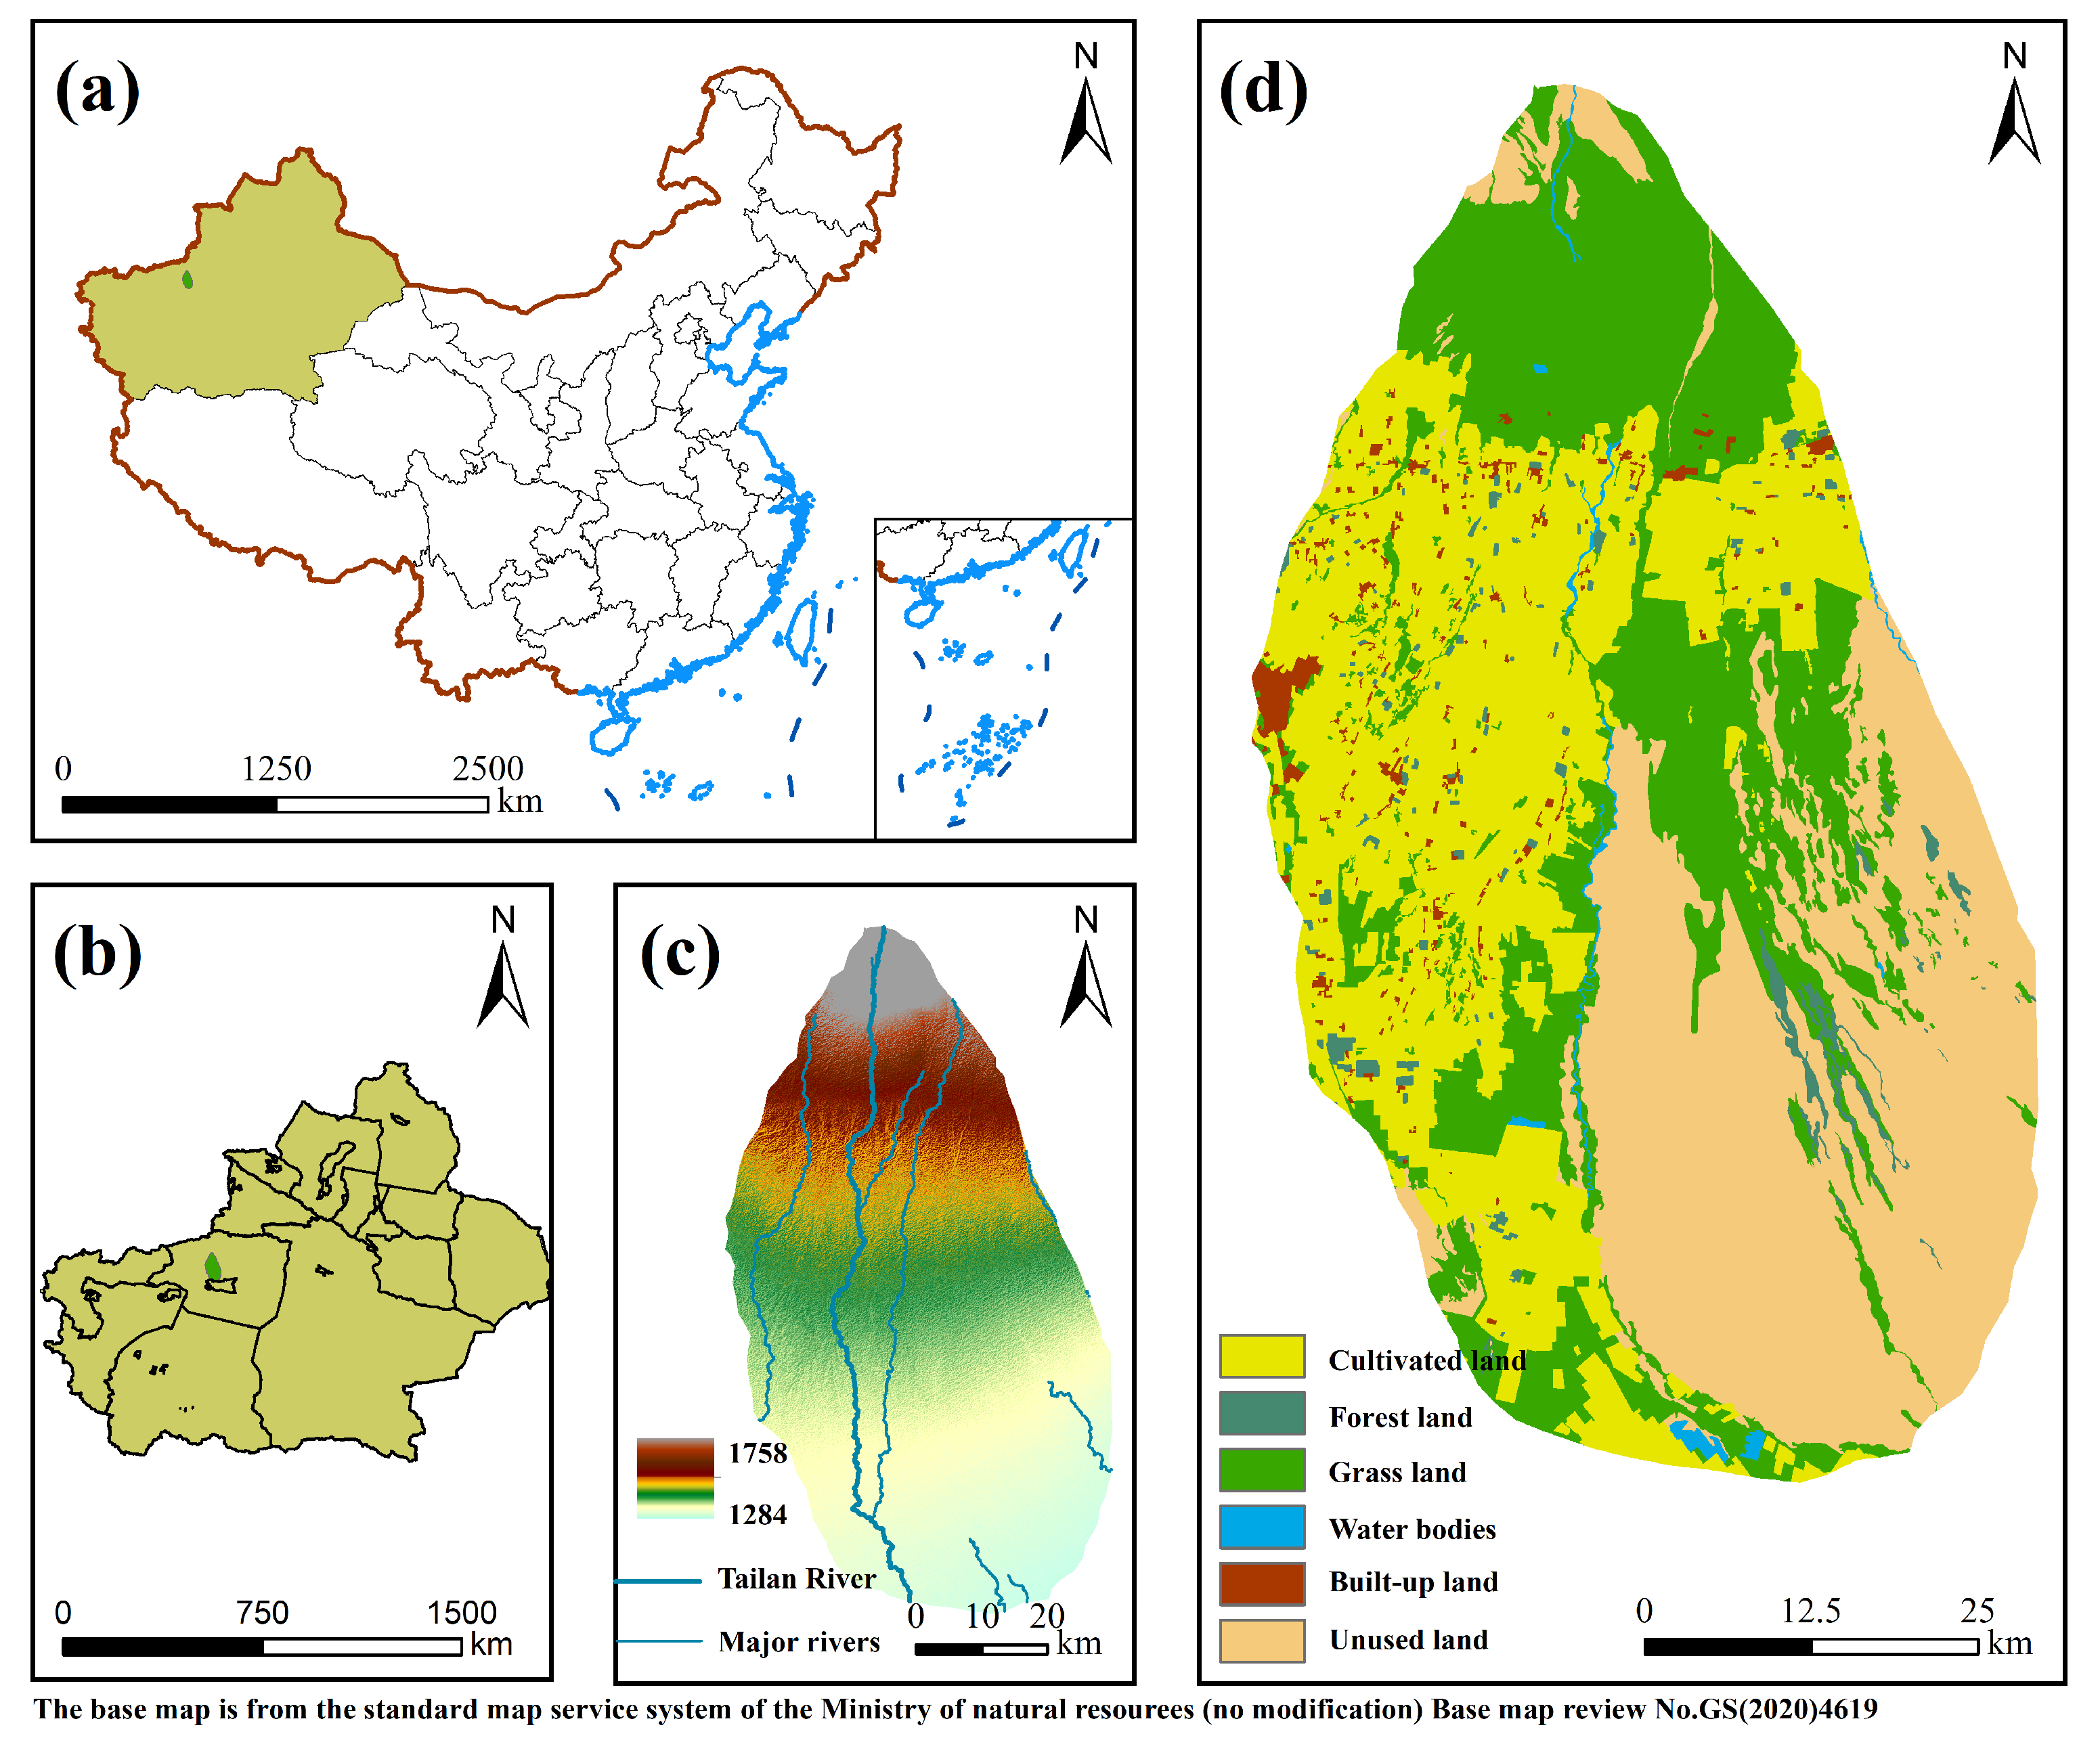
2.1. Study Area

The Tailan River originates from the southern foot of the Tuomuer Peak of Tianshan Mountains, formed from the convergence of two tributary rivers—the Keqike Tailan and Qiongtai Tailan rivers. The Tailan River flows from north to south over a total length of 90 km and is therefore considered an independent water system. The river is mainly replenished by meltwater from ice and snow with an average annual runoff of 7.766 × 10⁸ m3. The Tailan River Basin (TRB) covers an area of 4218 km2 (Figure 1), with a north–south sloping terrain and landform consisting of gravelly, alluvial, and fine-soil plains. It is located in the arid region of the northern temperate zone, characterized by an arid continental climate of dry conditions of low precipitation and high evaporation. The details of the study area in terms of average annual values are given in Table 1.

2.2. Data Collection and Processing

A set of data was collected—the data were needed to drive the PLUS model and were the factor driving the Land Expansion Analysis Strategy (LEAS). The LULC data were obtained from the Remote Sensing Database provided by the Chinese Academy of Sciences Resources and Environmental Science Data Center (RESDC). This database covers the period of 1980–2020 and has a spatial resolution of 30 m with an overall accuracy of 95% [38]. This database was constructed on Landsat MSS, TM/ETM, and Landsat 8 satellite remote sensing images using the interactive visual interpretation approach. It categorizes land resources and use attributes into cultivated land, forest land, grassland, water body, construction land, and unused land [39].
Secondly, 13 datasets were selected, including meteorological, vegetation, topographic, and socio-economic data, for the driving factors. The details of each of these data are available in Table S1. Due to inconsistency in the spatial resolutions and coordinate systems of the data, bilinear interpolation was performed to harmonize the spatial resolution to 30 m on the Krasovsky_1940_Albers coordinate system.

2.3. Land-Use Dynamics

The Single Land Use Dynamic Degree (SLUDD) and the Comprehensive Land Use Dynamic Degree (CLUDD) measure the rate of change in individual land-use types and all the land-use types in a given area, respectively. This reveals the dynamics of land-use conversion and assesses the overall trend of change in regional land resources and related values [40]. The SLUDD and CLUDD are quantified as follows:
S L U D D j = L A j , t b L A j , t a L A j , t 1 × 1 t b t a × 100 %
C L U D D j = j = 1 n L A j , t a L A j , t j = 1 n L A j , t a × 1 t b t a × 100 %
where SLUDD(j) is the dynamic degree of individual land use j; CLUDD(j) is the combined dynamic degree; LA (j, ta) and LA (j, tb) are the areas of land use j at the start (ta) and end (tb) of the study period, respectively; LA (j, Δt) is the stable area of land use j during the study; and LA (j, tb) − LA (j, Δt) is the transitional area. n is the total count of LULC classes.

2.4. Comprehensive Index

The basis for quantitative land use lies in land use limits. The upper limit is the maximum sustainable capacity of land resources, beyond which further utilization is impossible, and the lower limit is the starting point for the human exploitation and development of land resources [41]. Based on this, land use intensity is classified into the categories shown in Table S2, with its formula being as follows:
L a = i = 1 M A j × C j × 100
where Aj is the land-use degree classification index; Cj is the percent area for class j; La is the extensive index of land-use degree; and M is the classified index of land-use degree level values.

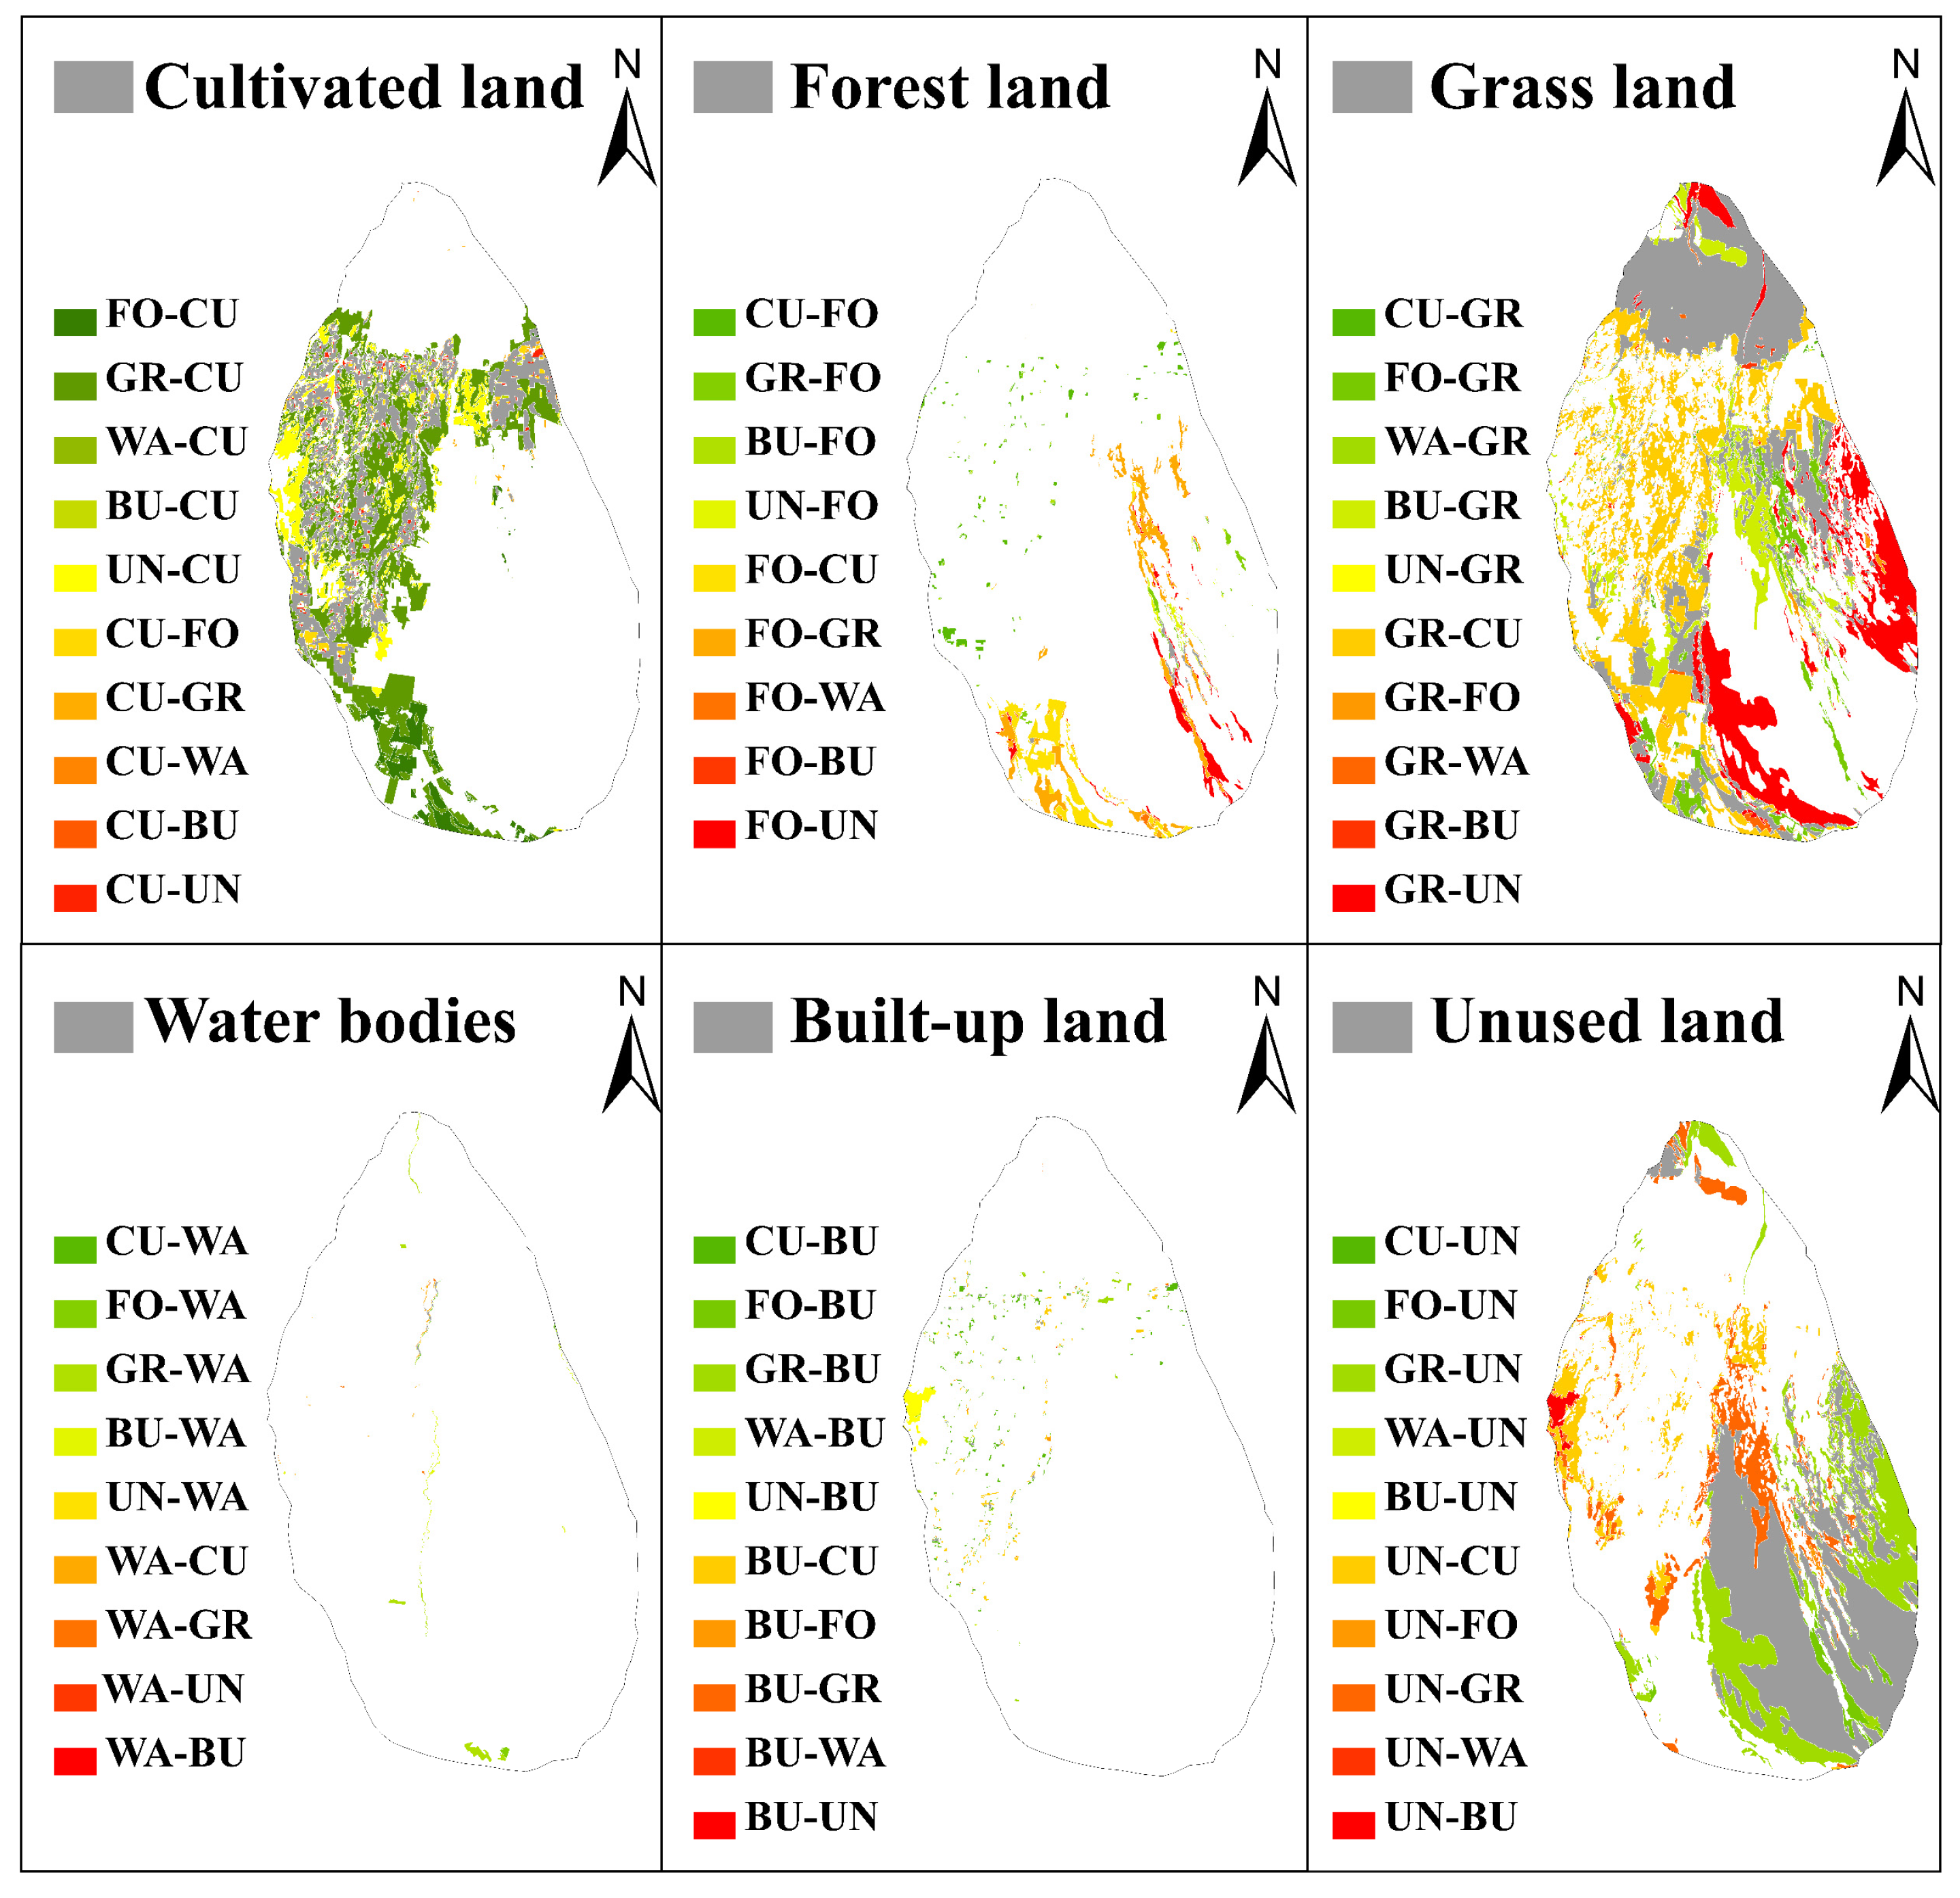
2.5. Land-Use Shift Matrix

The land-use transition matrix is a tool for quantifying changes in land-use types. It can visually and comprehensively describe the changes in land structure and transformation trends [42] and quantify the retention and change in area among different land types. It is given as follows [43]:
P p q = P 11 P 12 P 1 n P 21 P 22 P 2 n P n 1 P n 2 P n n
where P is the area of various LULC classes; p and q are the areas of LULC classes at the start and end of the study period, respectively; and n is the total number of LULC classes. Each row and column of the matrix signify the outgoing and incoming regions, respectively.

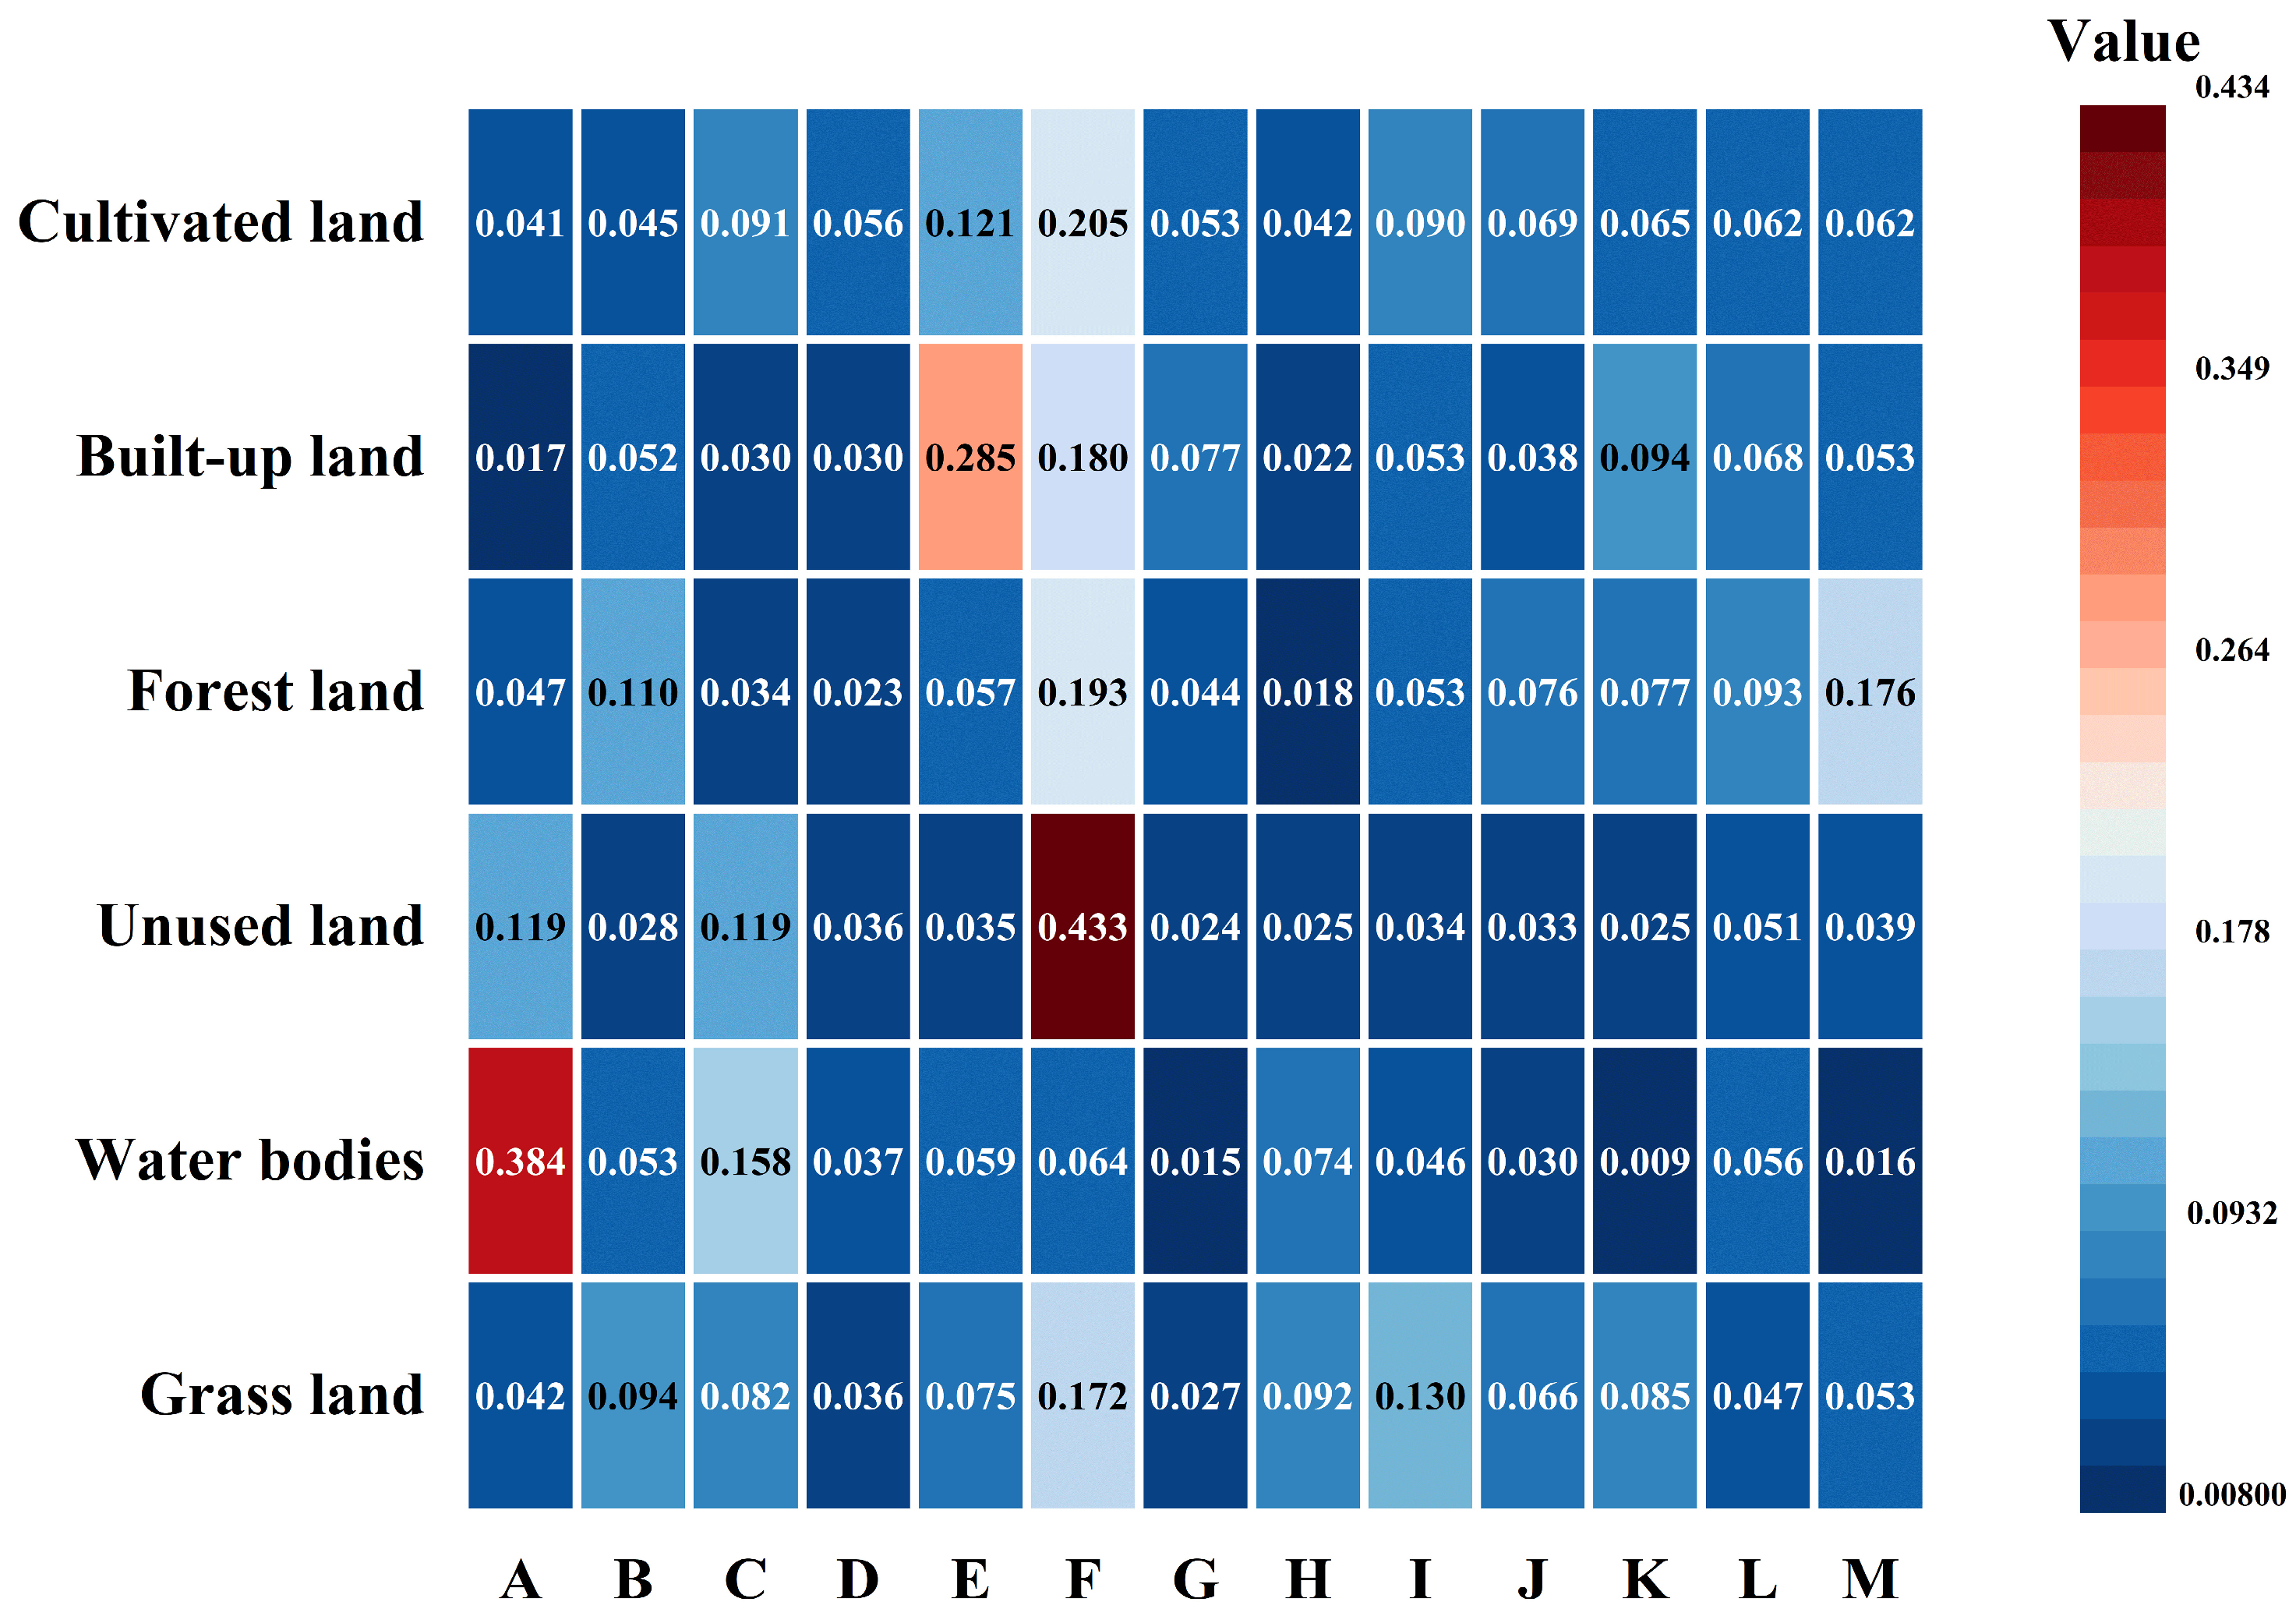
2.6. Spatial Analysis

The Standard Deviational Ellipse (SDE) method exposits the developmental trajectory of long-term sequence data and is a quantitative analysis technique for allocation traits and progress trends of geographic elements. SDE is characterized by its major axis ( x ), indicating the main direction of spatial distribution, and the minor axis ( y ), signifying the extent of deviation from the centroid. The azimuth angle of the ellipse specifies the primary direction of the geographic element distribution, while the centroid marks the primary position of the spatial assignment. This method demonstrates the degree of dispersion and dynamic evolution trends of geographical phenomena, calculated as follows [44]:
S D E x = i = 1 m x i X ¯ 2 m S D E y = i = 1 m y i Y ¯ 2 m
where SDEx and SDEy are the longitudinal and latitudinal coordinates of the centroid for a certain land-use type, respectively; xi and yi are the longitudinal and latitudinal coordinates of patch i for that land-use type; X and Y are the average central coordinates of all patches of that land-use type; and m is the total number of land-use patches.
σ x = i = 1 n x ~ i cos θ y ~ i sin θ 2 n σ y = i = 1 n x ~ i sin θ y ~ i cos θ 2 n
where σ x and σ y are the standard deviations along the major axis ( x ) and minor axis ( x ), respectively; x ~ i and y ~ i are the coordinate deviations of each land patch location from the average center; and θ is the azimuth angle of the ellipse.

2.7. Simulation Parameter Setting

PLUS is a cellular automata (CA) model that integrates a rule-mining framework of the Land Expansion Analysis Strategy (LEAS) based on the Competitive Artificial Resilient Strategy (CARS). The LEAS module utilizes the random forest algorithm to explore relationships across multiple driving factors and various LULC types in the initial and final stages of land-use change, thereby determining the development potential for each LULC type [45]. The CARS module includes a roulette wheel competition mechanism for random seed generation and threshold descending rules, allowing for the development of new patches under growth probability constraints.
The Random Forest Classification (RFC) algorithm built into PLUS was used to explore the relationship between the growth of various land-use types and multiple driving factors as follows [29]:
p j , k d x = n = 1 M I h n x = d M
where d is divided into 1 or 0, with 1 meaning that there is a transformation from other land-use types to land-use type k and 0 meaning no such transformation occurs; x is a vector composed of multiple driving factors; I (∙) is the indicator function of the decision tree set; hn( x ) is the predicted type of the nth decision tree for vector x ; and M is the total number of decision trees.
In this study, the LEAS was used to compute the probability of land-use development in the TRB study area. To ensure there was a balance between model precision and computational efficiency after several trials, the sampling rate and number of decision trees in the random forest algorithm were adjusted to 0.2 and 60, respectively. Following this, a combination of the conversion matrix for six land-use types and neighborhood weights were used in the CARS module to simulate land-use patterns under various scenarios for the period of 2030–2060.

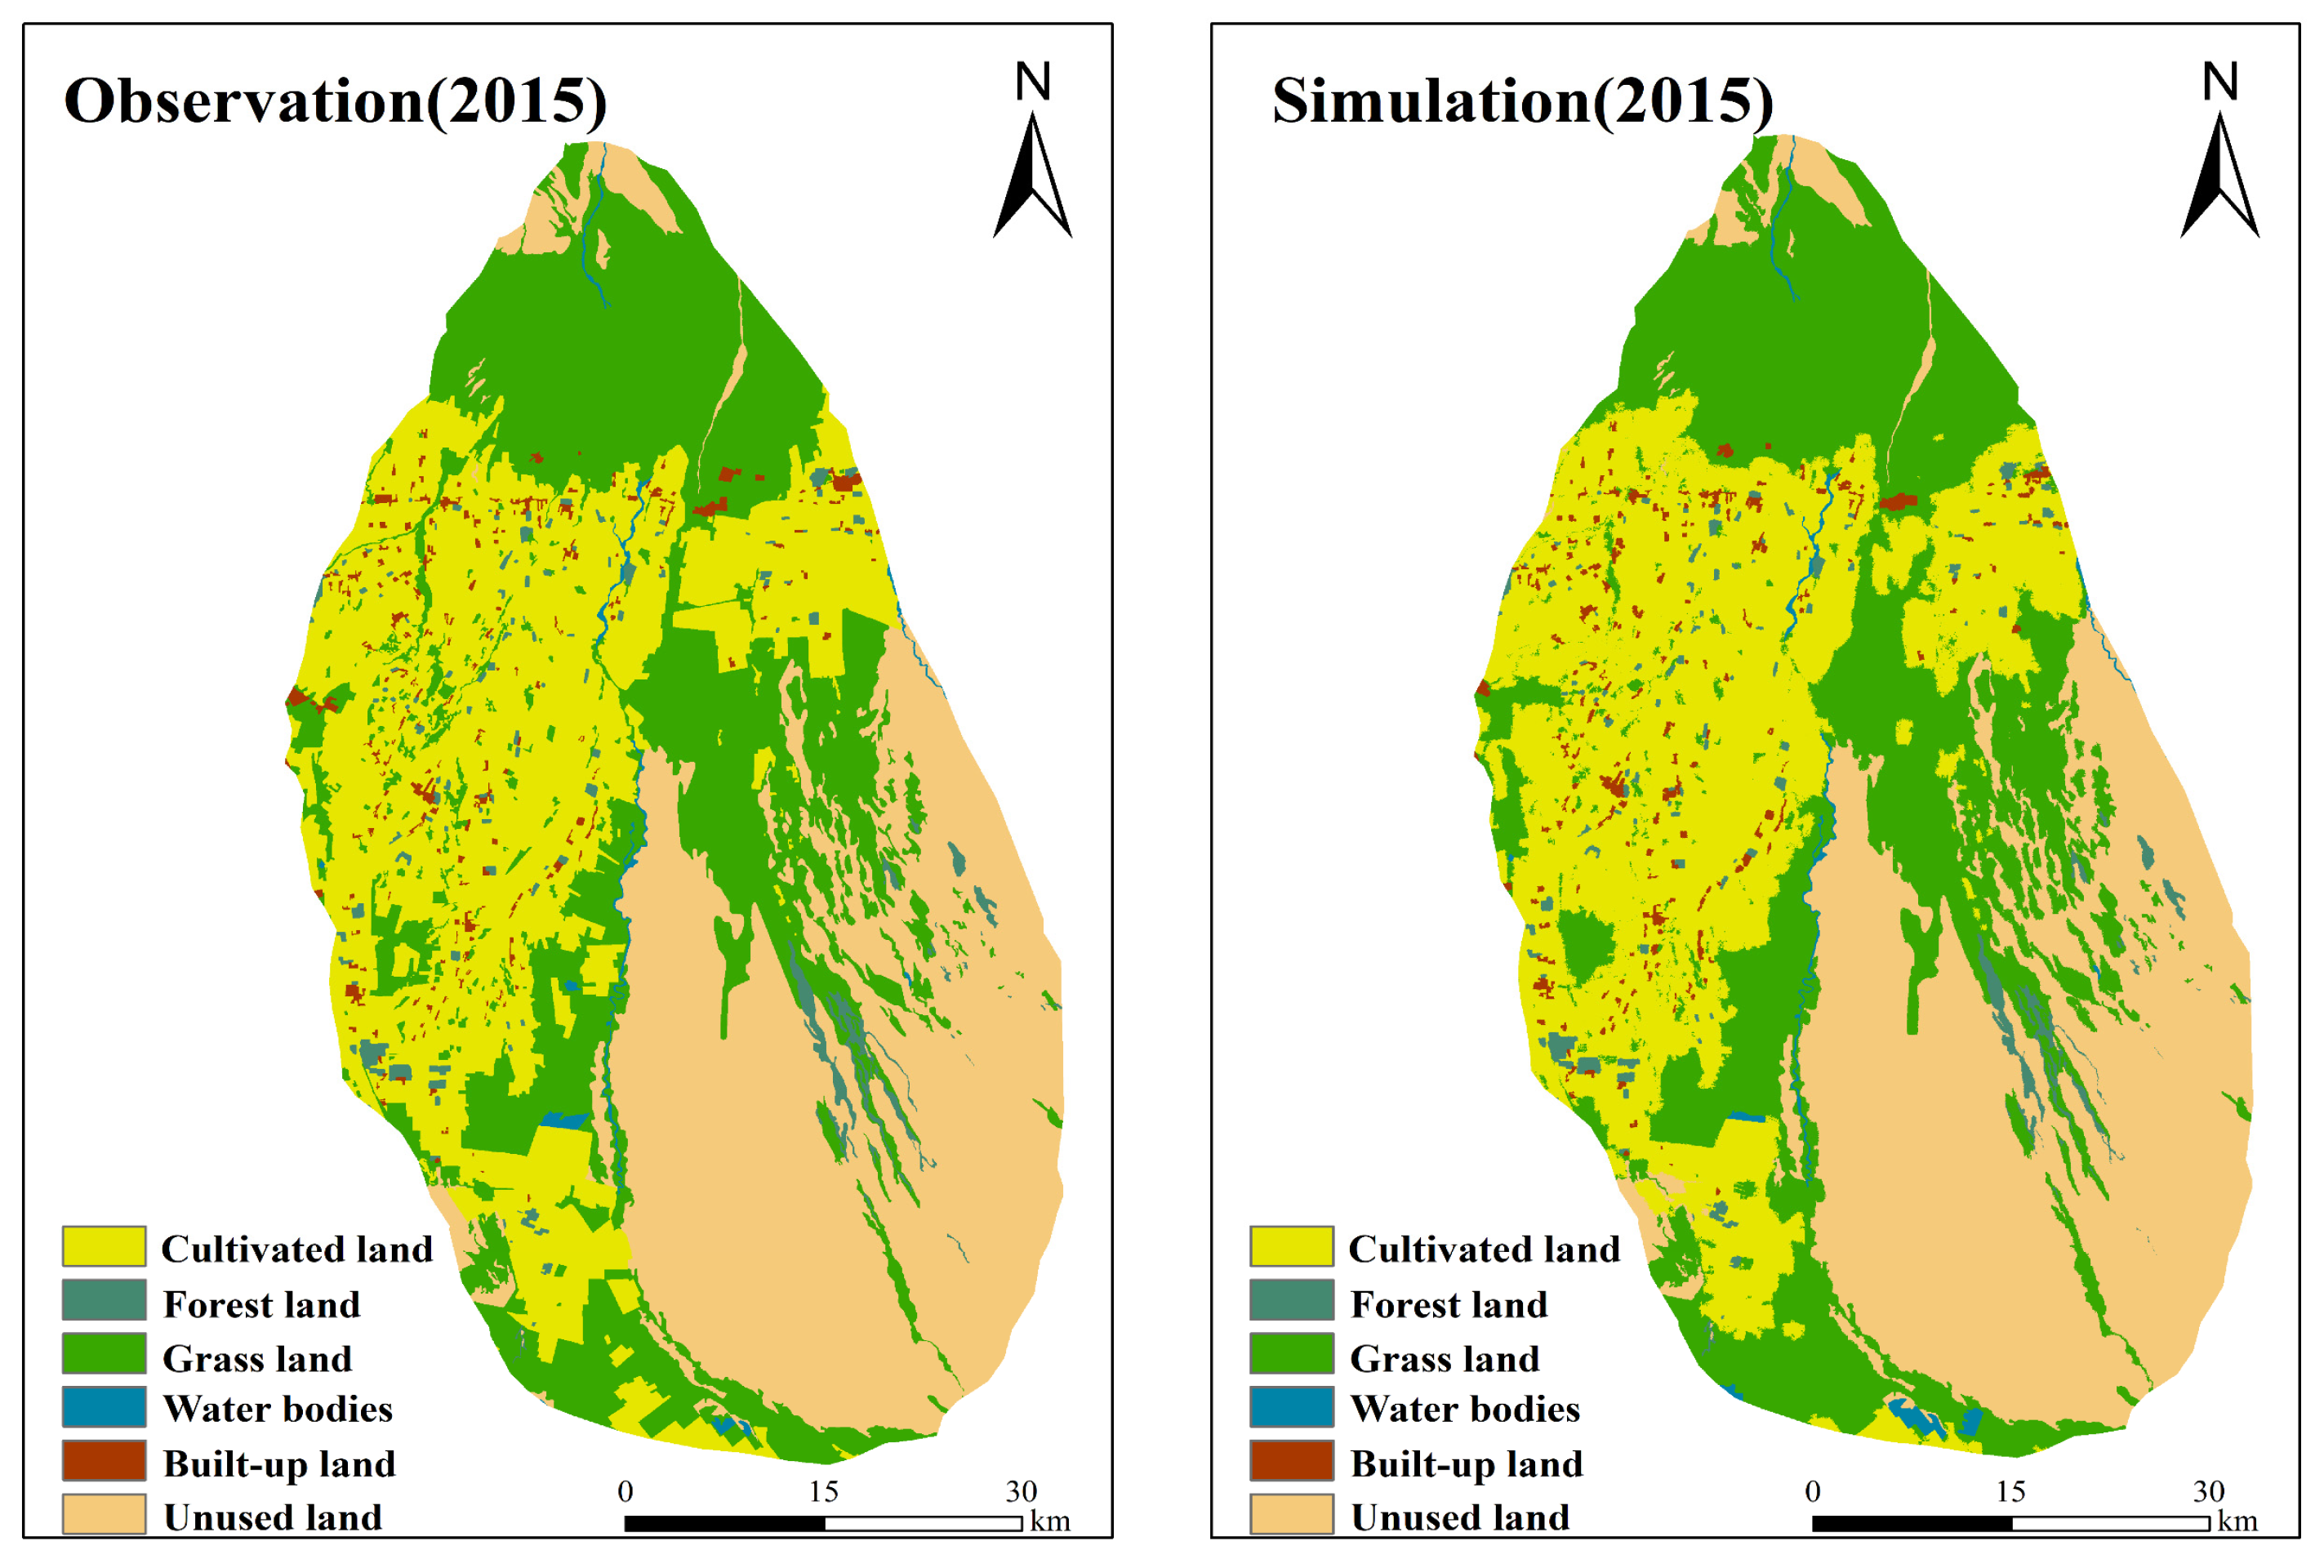
2.8. Model Validation

To verify the accuracy of simulation, this study used the Figure of Merit (FOM), Kappa Coefficient (KC), and overall accuracy (OA) as evaluation indicators. In order to make the verification results universally applicable in the TRB study area, the simulated results for 2015 (derived from 2005 and 2010 data) and 2020 (derived from 2000 and 2010 data) were compared with ground-truth data. This method effectively tested the predictive ability and stability of the model for different time periods. The OA [46] is expressed as follows:
O A = k = 1 n O A k N
where OA is the probability of agreement between actual and simulated results for randomly sampled LULC; OAk is the number of samples correctly classified for the kth land-use type; and n and N are the number of LULC types and the number of samples, respectively.
The Kappa index [47] is a measure of the accuracy of classification of a remote sensing image, expressed as follows:
K a p p a = P a P b 1 P b
where Pa is the ratio of correct simulations, and Pb is the expected ratio of simulations.
The FoM value assesses the comparison of two maps, measuring the consistency of transitions [48], and it is expressed as follows:
F O M = B A + B + C + D
where A is an area of error due to observed change predicted as persistence; B is an area of accuracy due to observed change predicted as change; C is an area of error due to observed change predicted as change to an incorrect category; and D is an area of error due to observed persistence predicted as change.

2.9. Multi-Scenario Setting

Given the complex eco-hydrological feedback processes in the TRB study area, the fragile ecological environment, and accelerated population growth and urbanization, land-use simulation in the area is influenced by multiple factors. Thus, by taking the totality of relevant historical policies and regional development plans in the TRB, a multi-scenario PLUS model was set up for a sustainable land management strategy in the region. The aim of the strategy was to reduce uncertainties in land-use options in the basin and draw phasic changes with time. Table S3 provides a detailed description of the six scenarios considered in this study. Based on LULC maps for 2010 and 2020, future required areas were calculated using the Markov chain method.

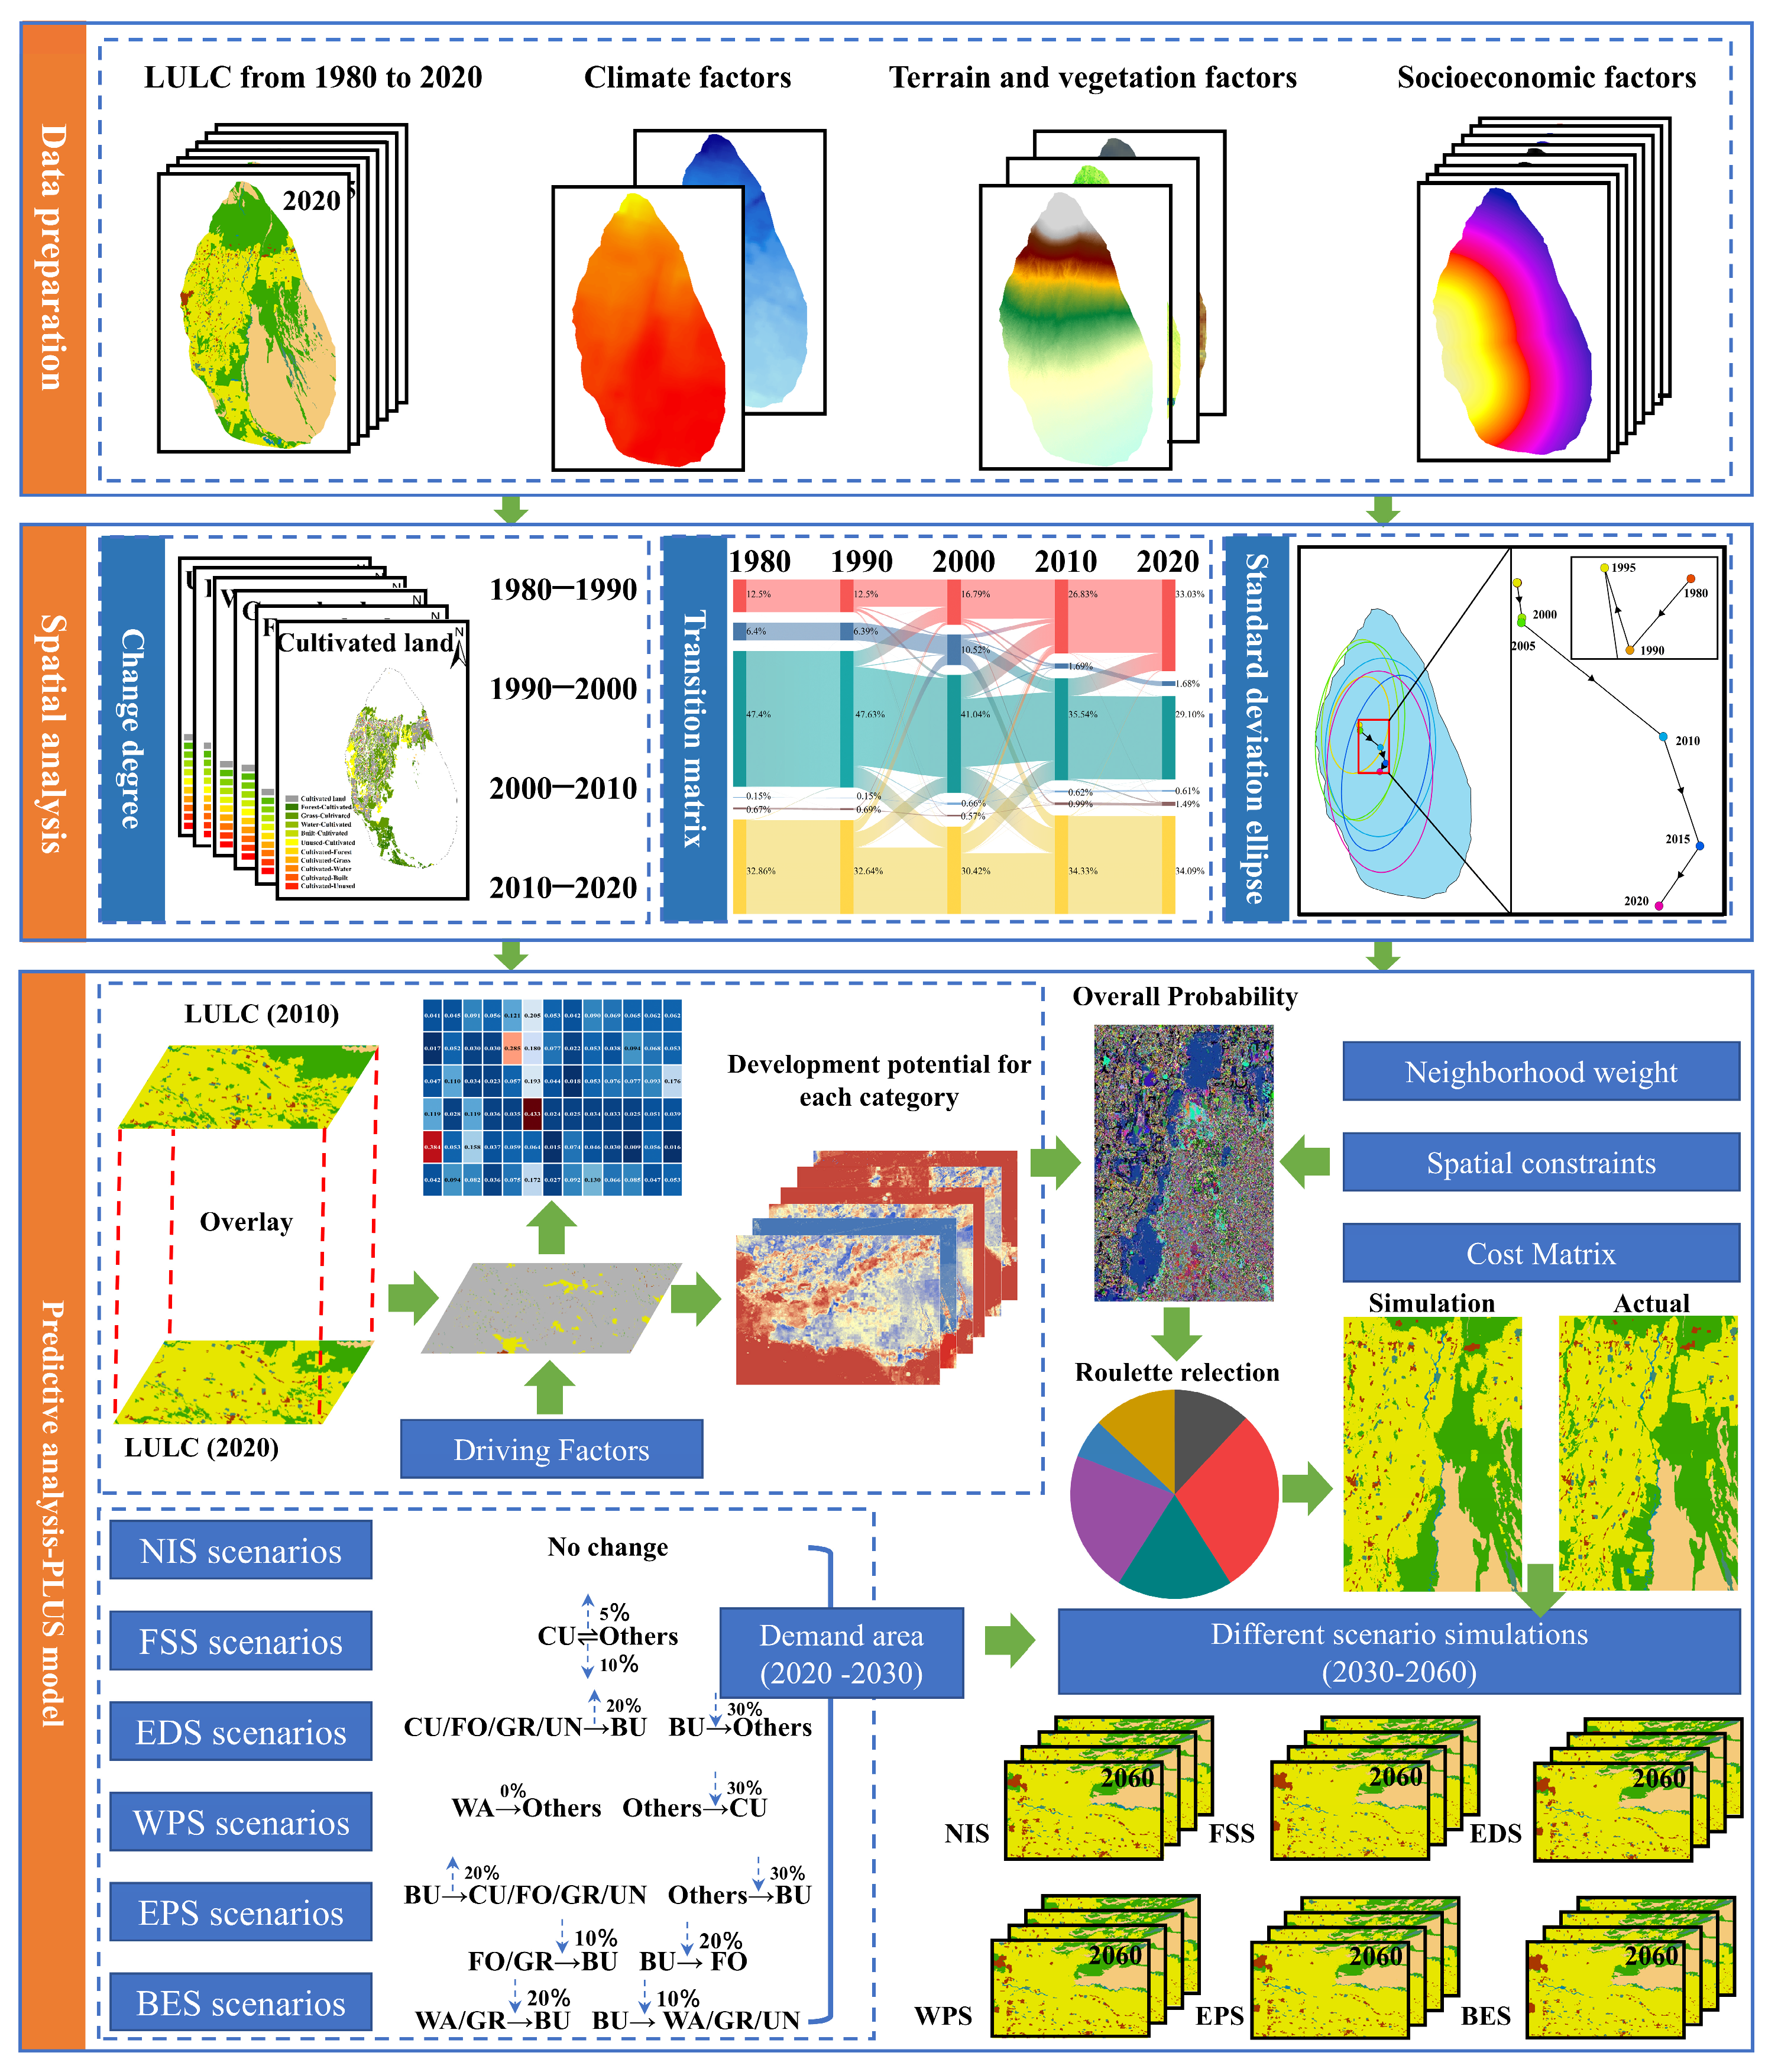
2.10. Overall Framework

The general structure of this study is illustrated in Figure 2, with the specific steps being as follows:
(i)
Using a range of land-use change indicators and historical land-use data, the quantitative changes and spatial distribution of six land-use types in the TRB were determined for the 1980–2020 period.
(ii)
The transition matrix method was used to analyze the dynamics of land-use change for six land types in the TRB for the 1980–2020 period.
(iii)
The standard deviation ellipse method was used to analyze the spatial centroid shift in different land-use types in the TRB for the 1980–2020 period.
(iv)
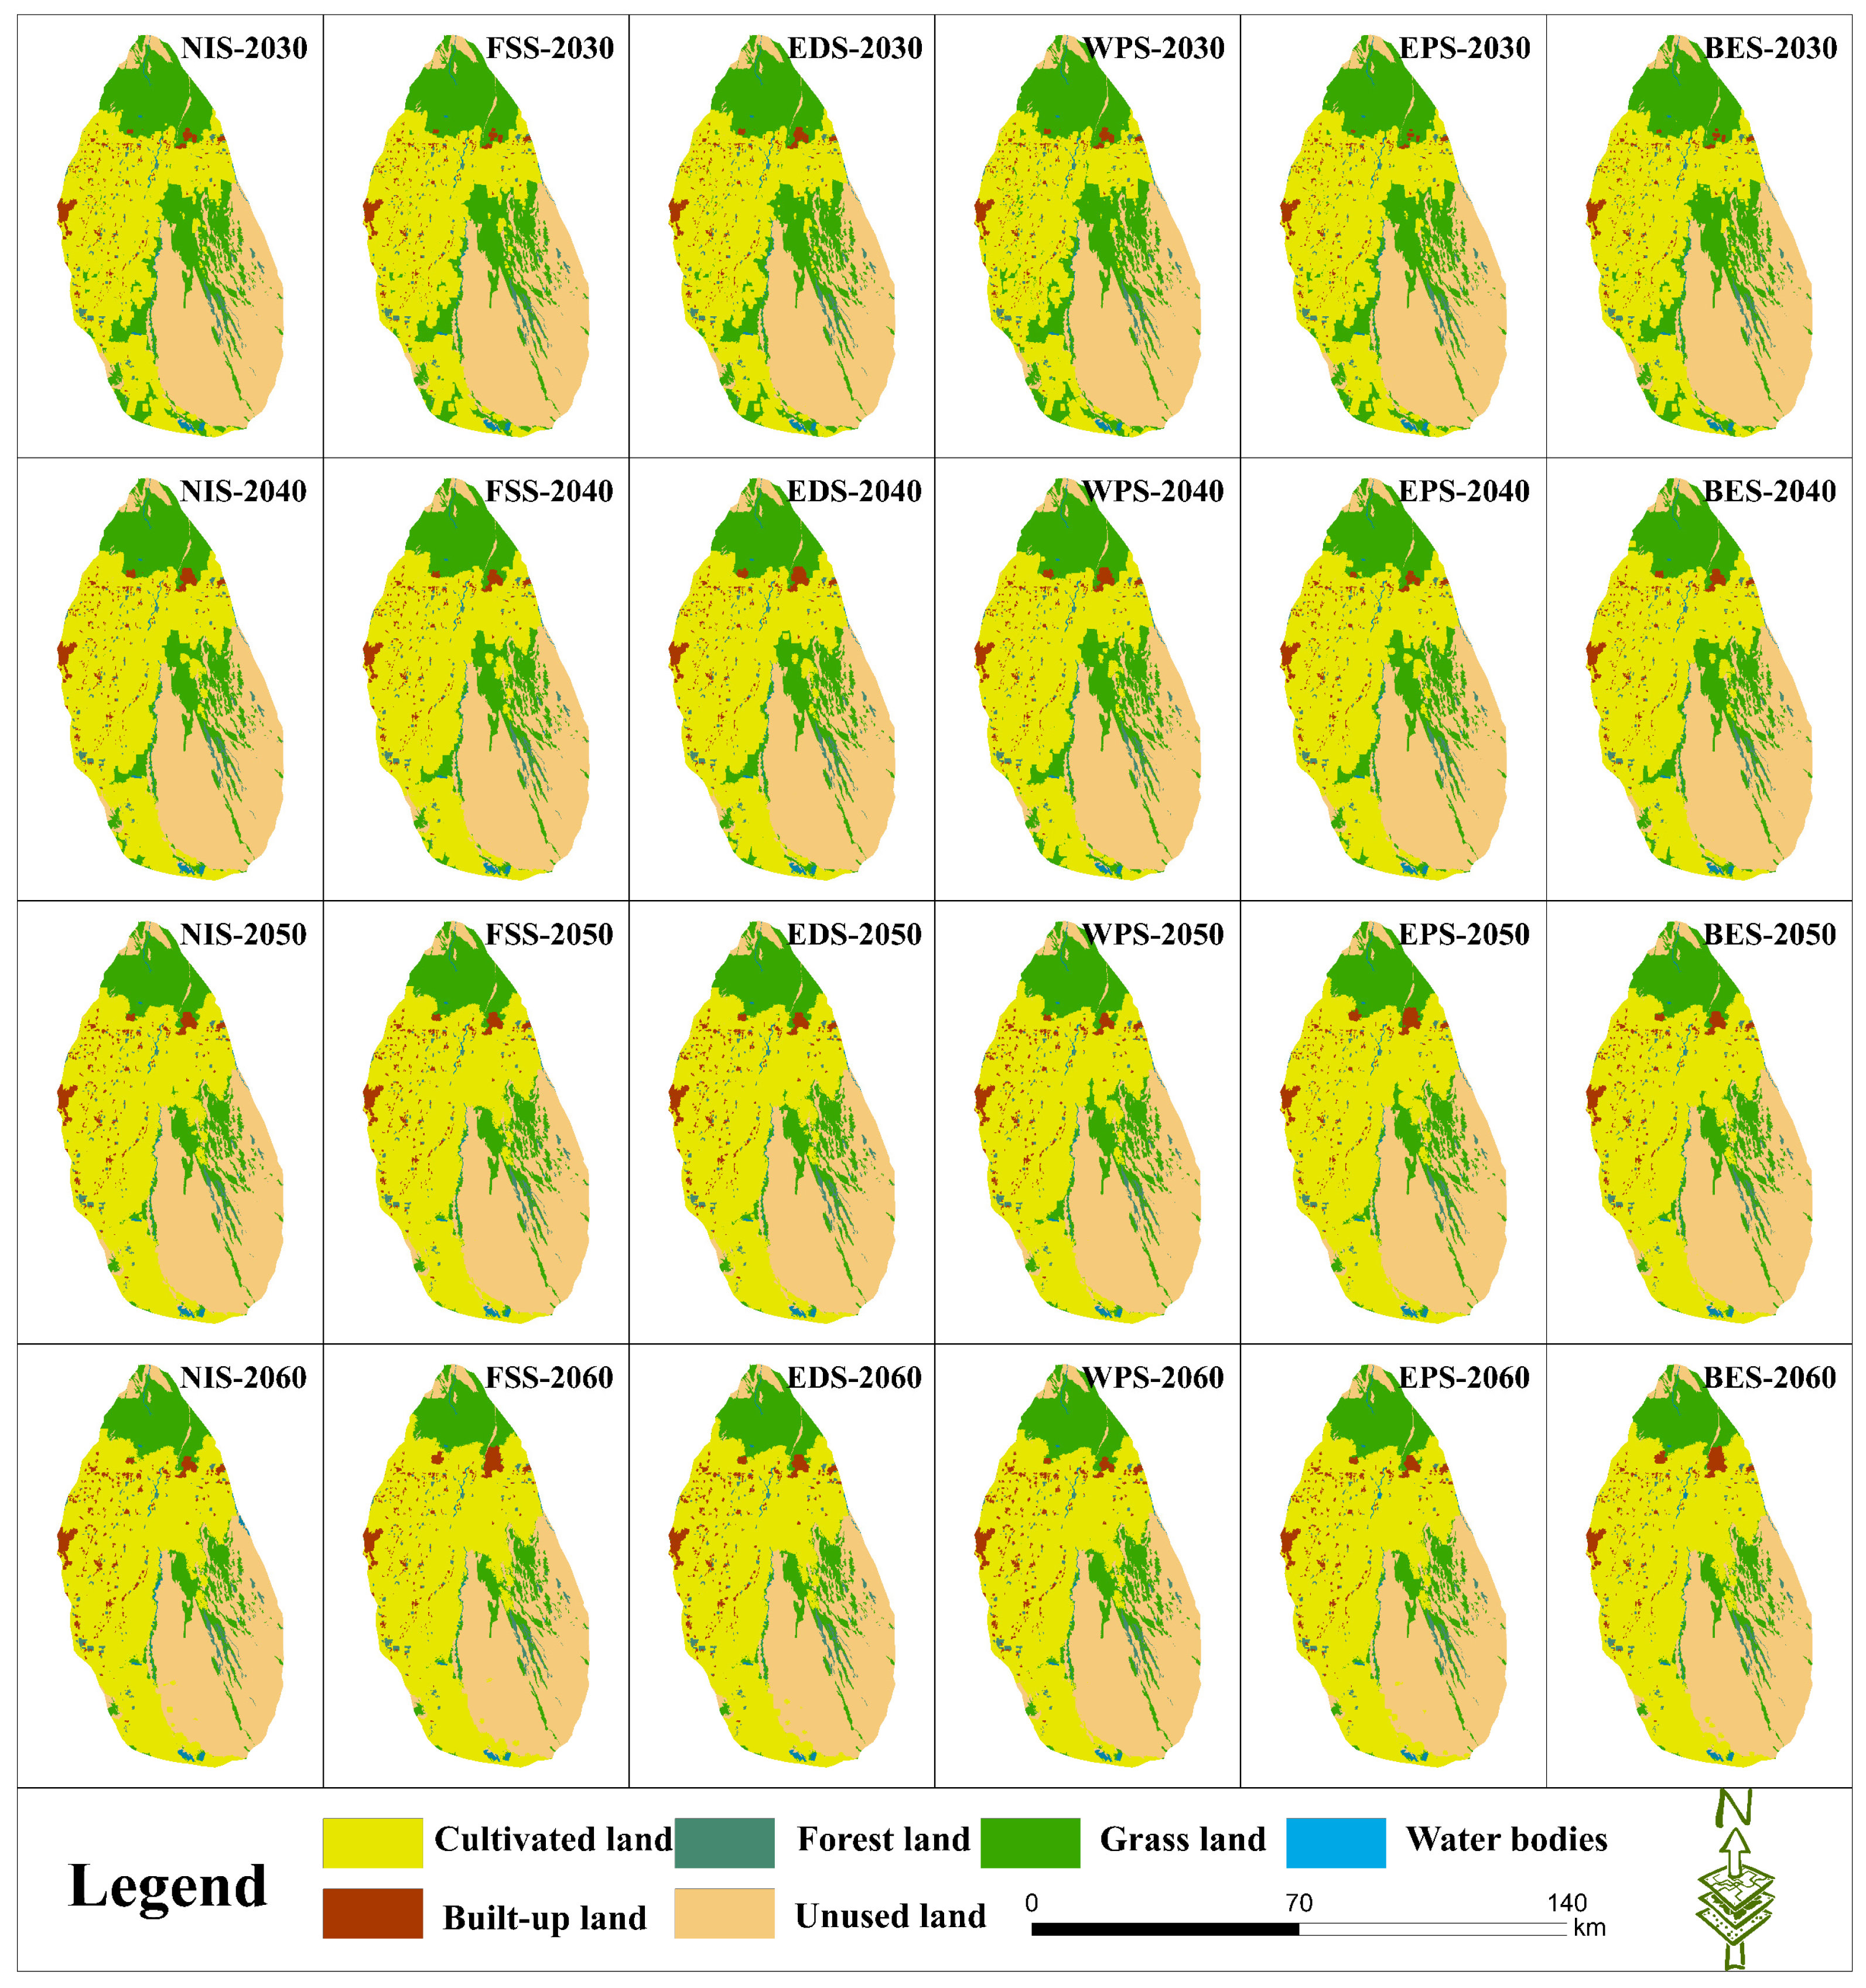
The conversion of one type of land use into another was predicted for the TRB for the 2020–2060 period using multi-scenario conditions (NIS/FSS/EDS/WPS/EPS/BES) in the PLUS model. Also, the processes of land-use change in the TRB was analyzed for the 2020–2060 period using the methods detailed in Equations (1)–(3).
(v)
Based on the land-use change situation in the TRB for the 2020–2060 period, the impact of driving factors on land-use conversion was analyzed.
(vi)
Based on the above steps, a multi-scenario model based on a nexus of humans, ecology, and types of land use was used to construct a sustainable land development strategy to guide sustainable land management in the study area and beyond.

3. Results

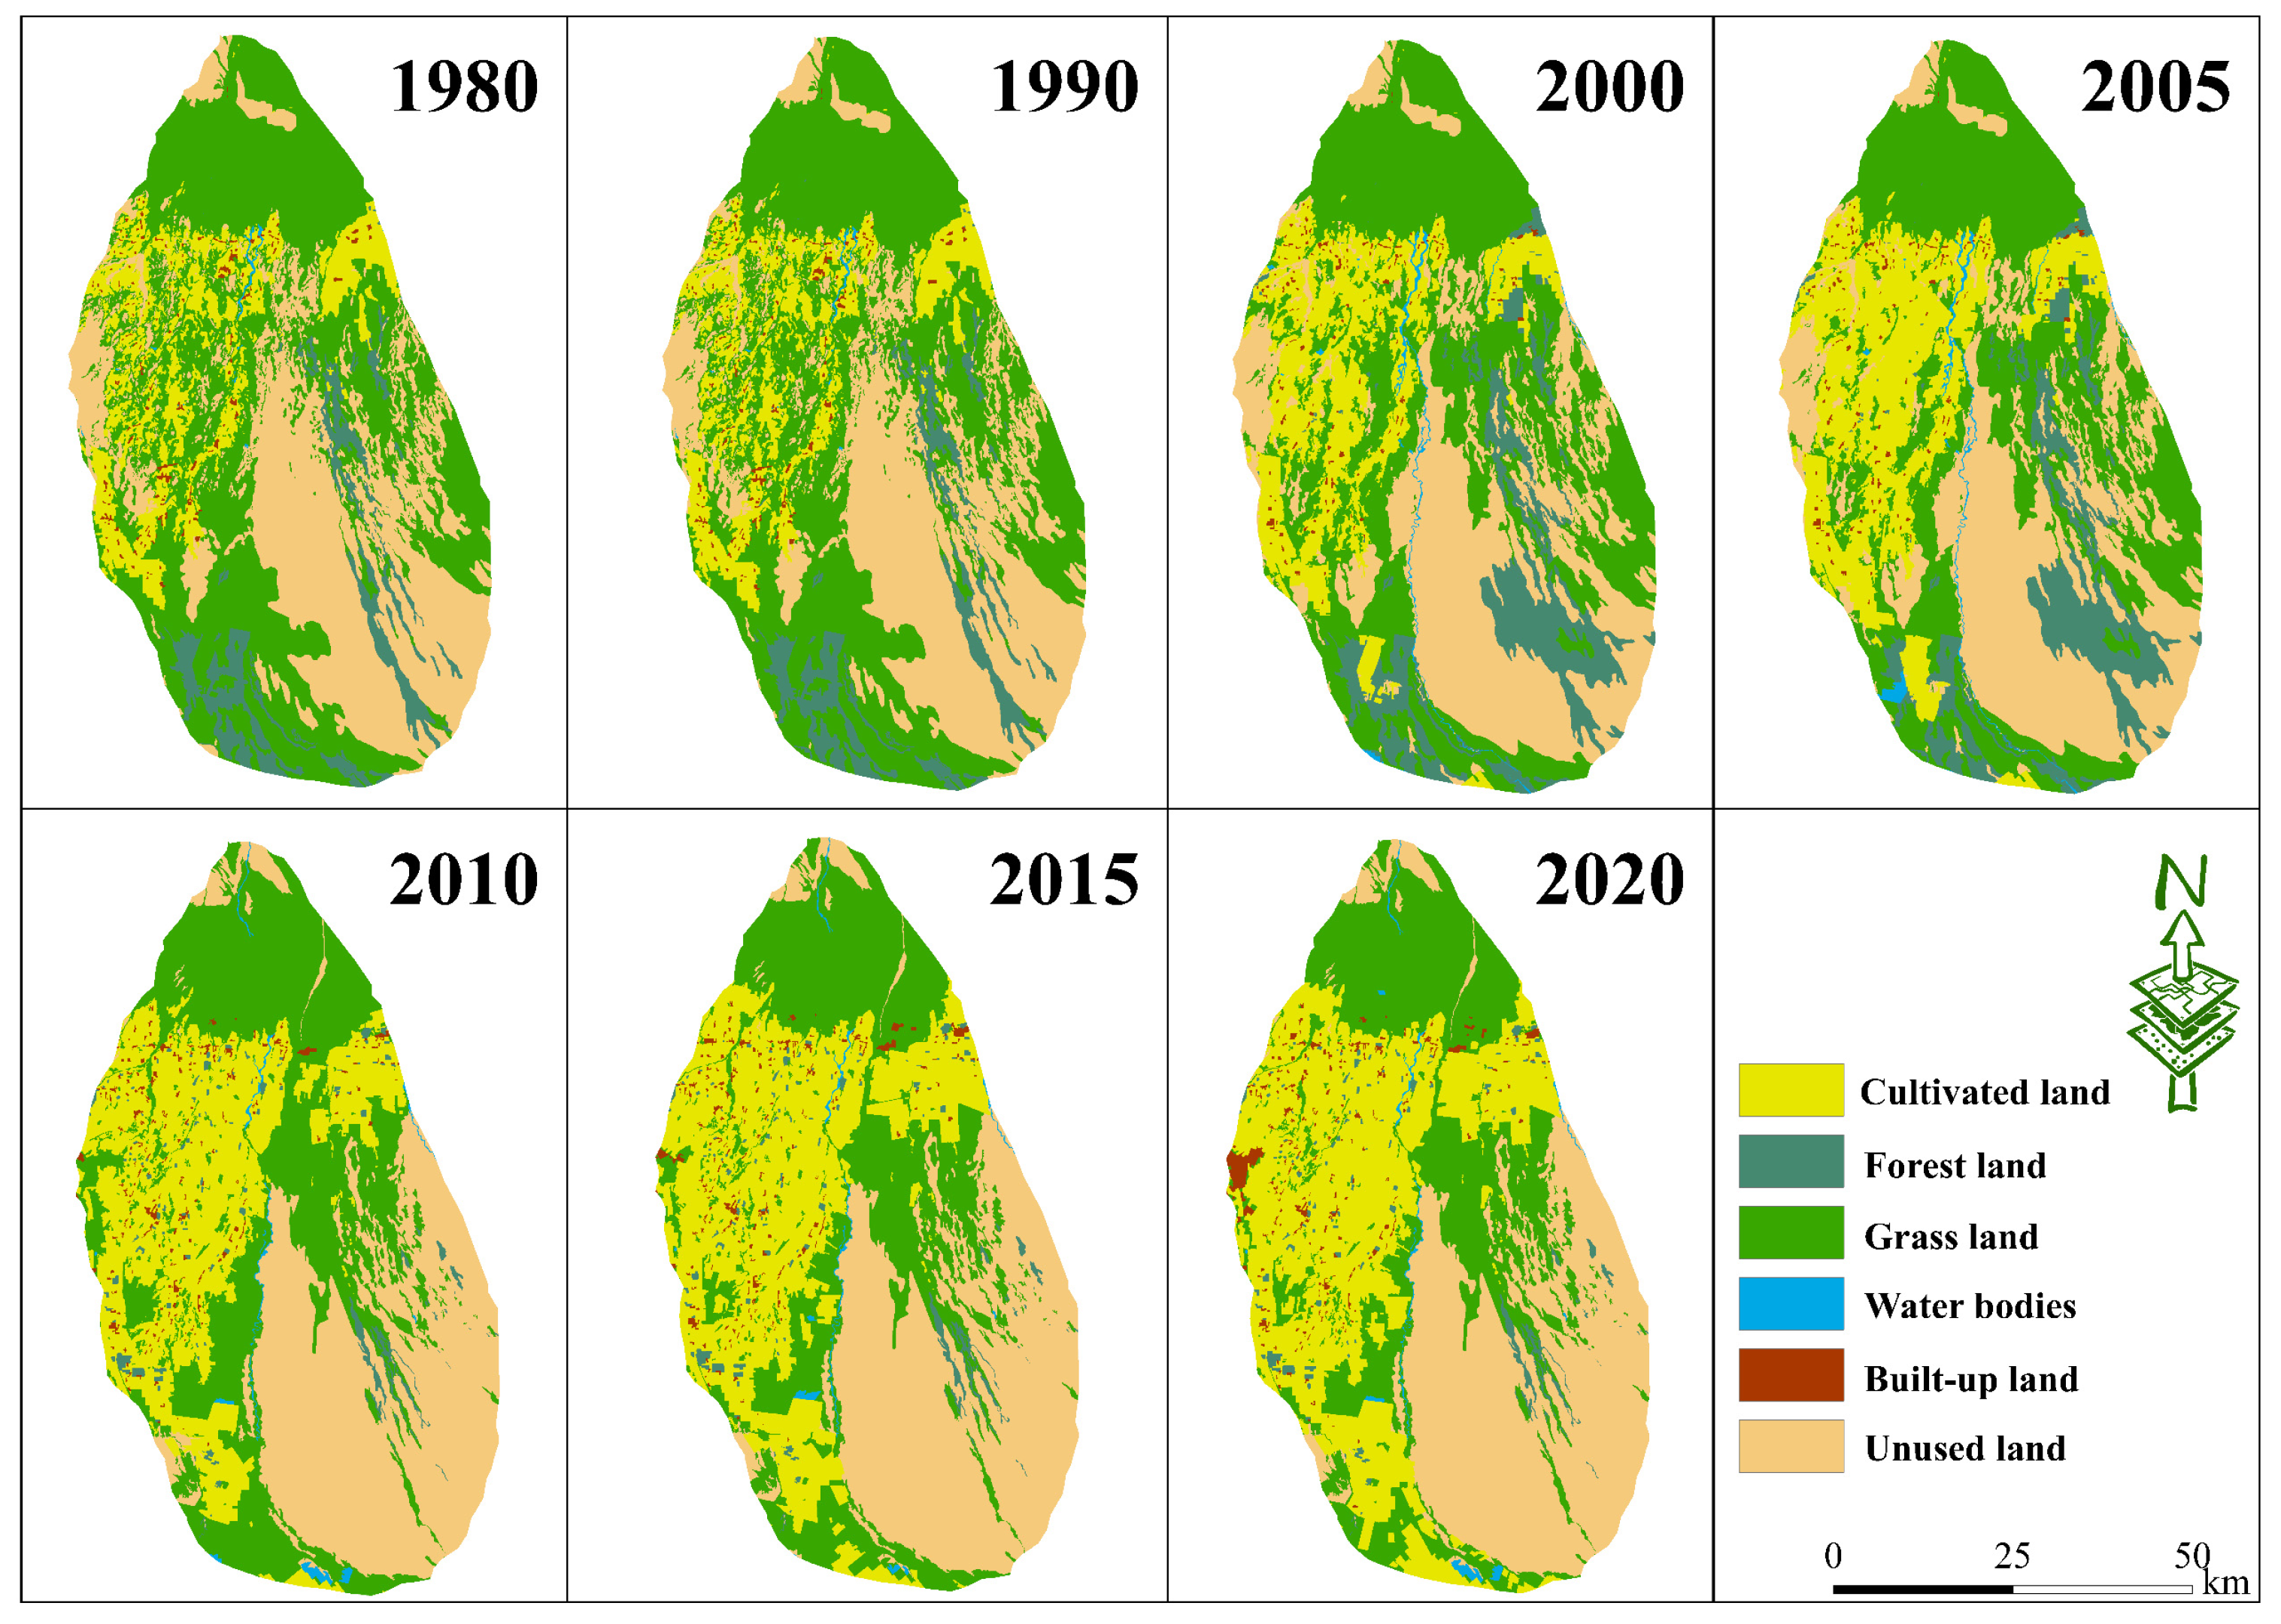
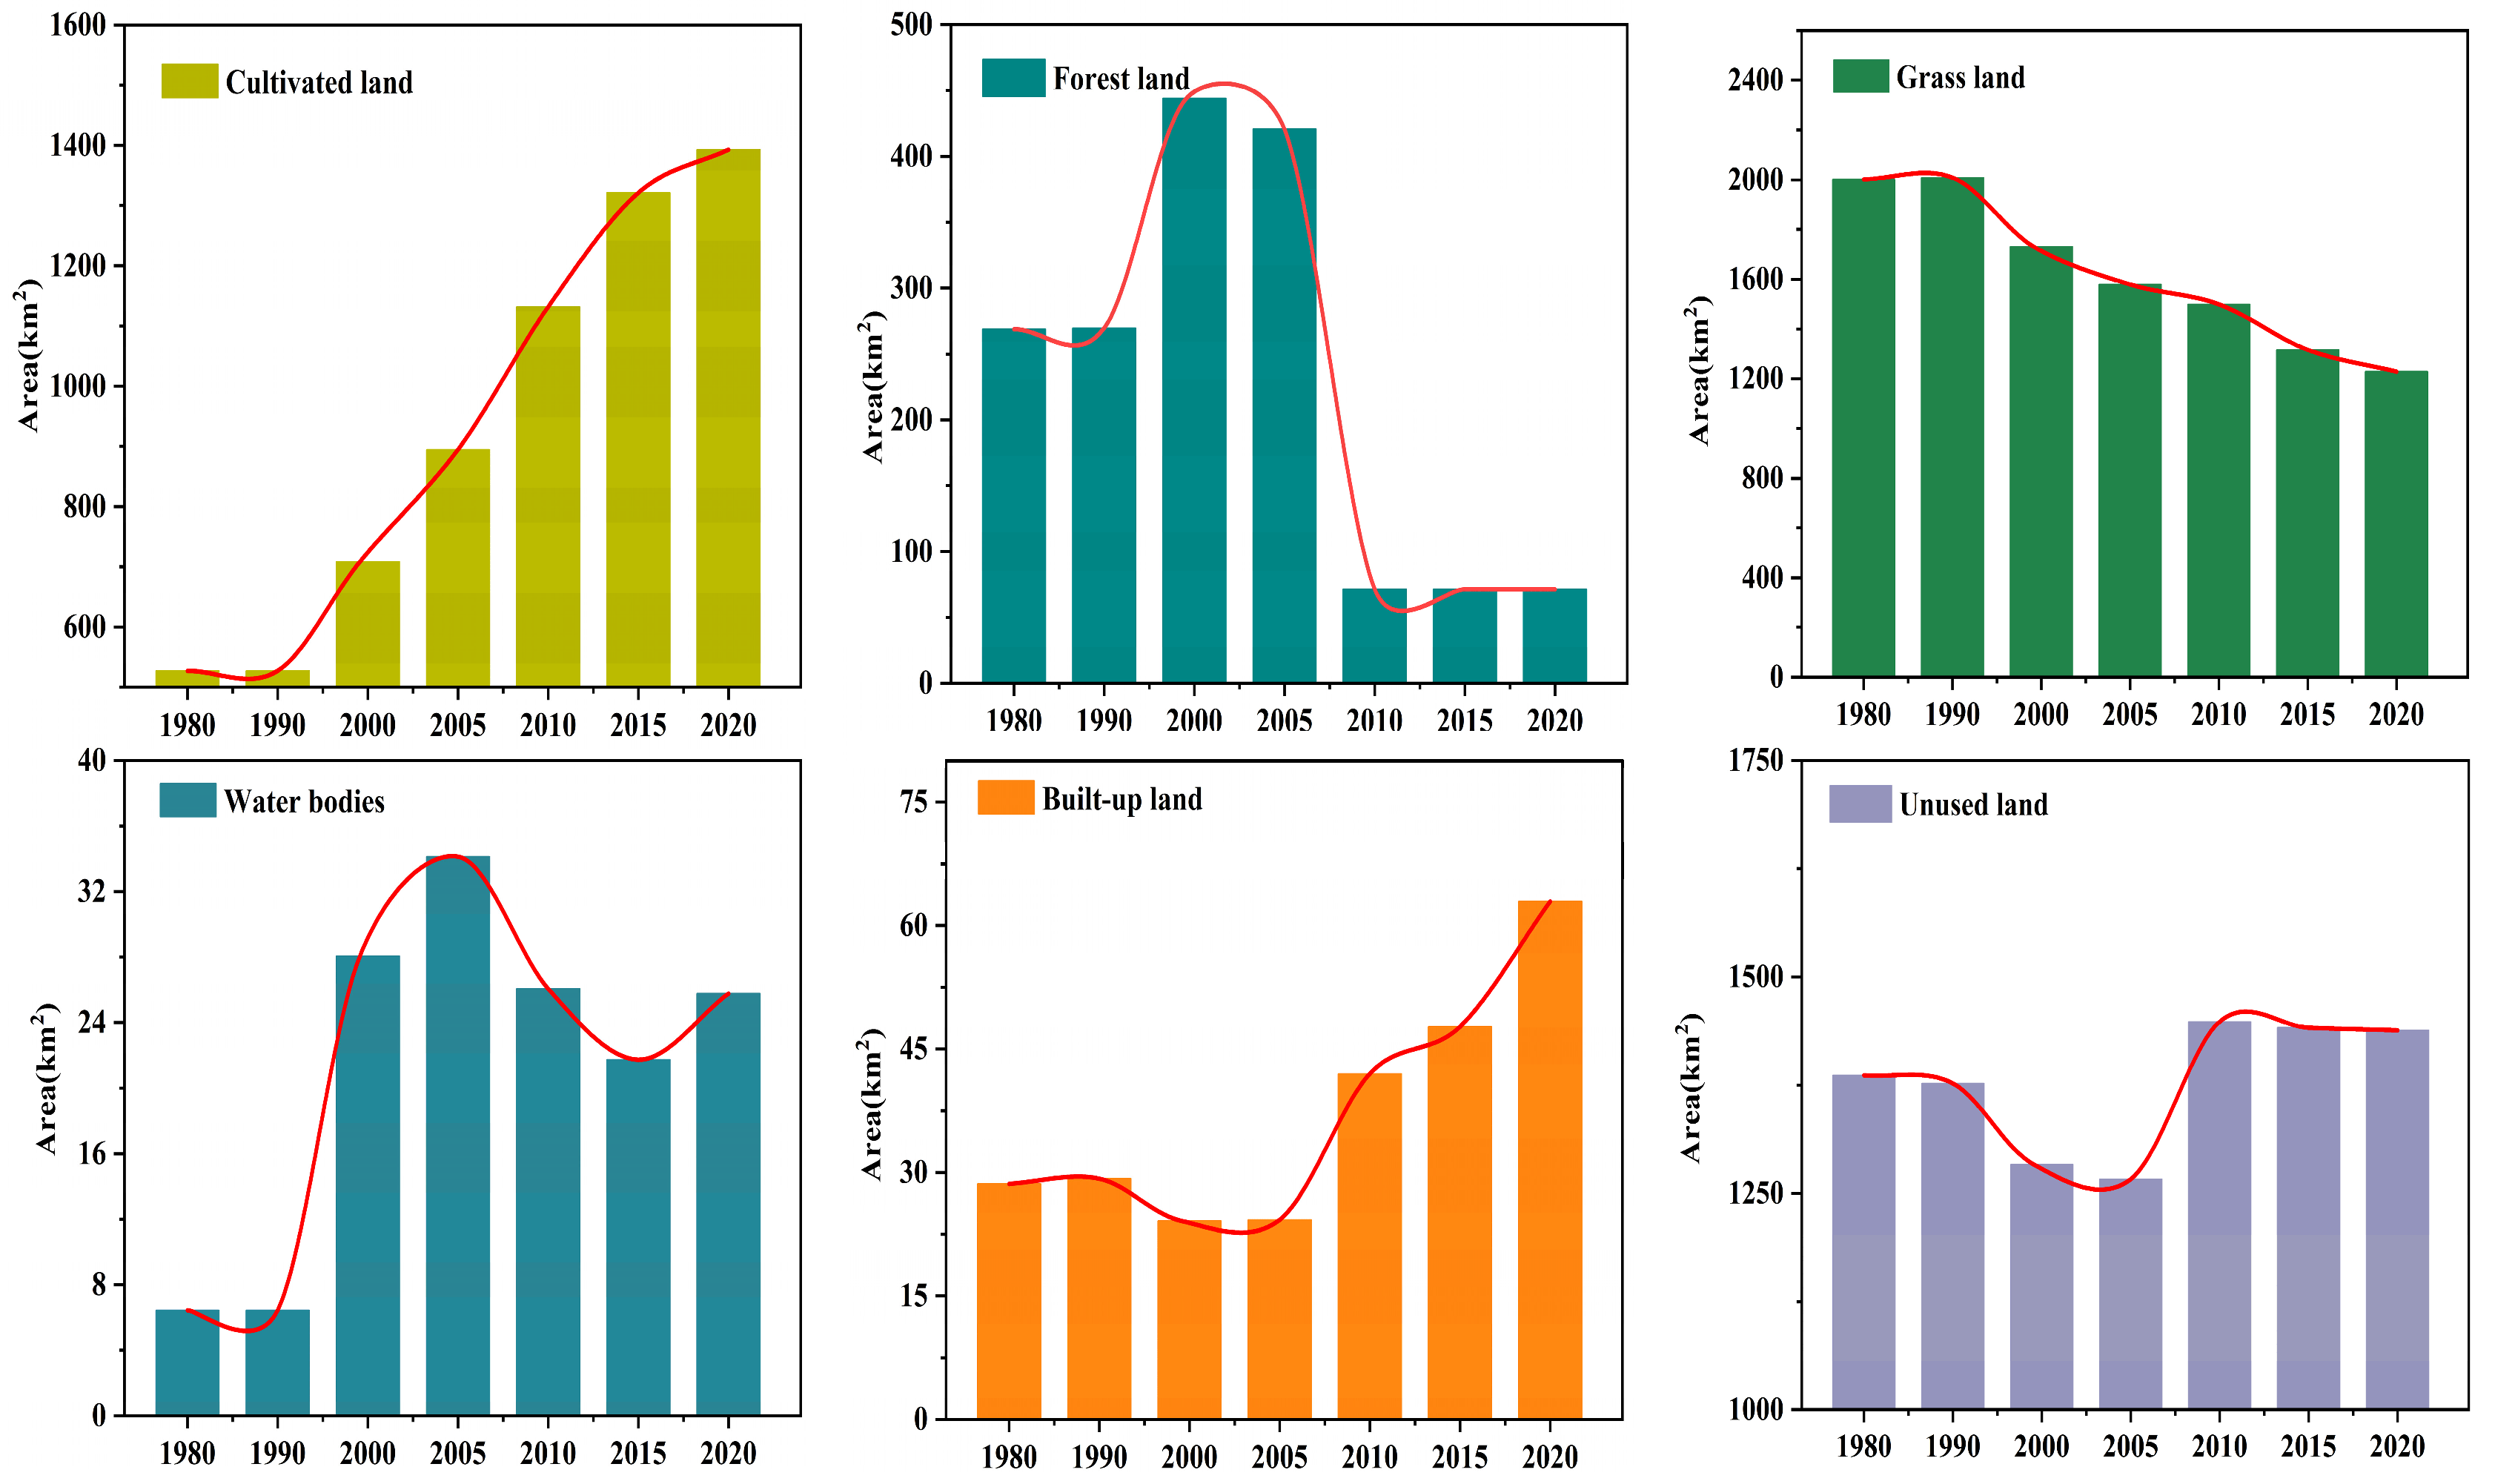
3.1. Land-Use Change and Spatial Distribution

For the period of 1980–2020, differences were detected in spatial distribution and quantitative change in the six land-use types in the TRB. Among these, cultivated land occurred mostly in the central and western parts of the basin. Forest land occurred in the southeast, grassland in the north, and rivers flowed through the basin from the north to south. Built-up land occurred in the west, and unused land in the southeast of the basin (Figure 3). The amount of change in the six land-use types in the 1980–2020 period (Figure 4) indicates that the basin was dominantly covered by cultivated land, followed by grassland and unused land, together accounting for 92% of the study area. Of these, the area of cultivated land increased from 12.5% in 1980 to 33.03% in 2020, and that of forest land increased before 2000 and then rapidly decreased thereafter, dropping from 6.37% in 1980 to 1.68% in 2020. Grassland continuously decreased, falling from 47.44% to 29.10% in the 1980–2020 period. There was an initial rapid increase in water body (from 0.15 to 0.61%), followed by a more gradual decrease. Built-up land changed little before 2005 but rapidly increased thereafter (from 0.67 to 1.49%). Unused land had little overall change, increasing from 32.86% in 1980 to 34.09% 2020.
Table 2 shows that for the 1980–2020 period, the CLUDD and SLUDD varied for the six land-use types in the TRB, with the most change occurring in the 2000–2010 period for the SLUDD. The highest decline was seen in forest land, and the highest increase was seen in built-up land. The CLUDD continuously increased before 2010 and then declined thereafter, with the highest change being seen in the 2000–2010 period. Compared with the CLUDD and SLUDD, the land-use index increased annually (Table 3), with a marginal increase in the 1980–1990 period (1.81) and a rapid increase (2.02) in 2020. This indicates that land use in the basin continuously improved with increasing socio-economic development.

3.2. Land-Use Dynamics in the 1980–2020 Period

The spatial shifts in the six land-use types in the 1980–2020 period (Figure 5) showed that the greatest expansion in cultivated land occurred in the southwest of the TRB. Conversely, the most contractions of forest and grassland occurred in the south and southeast regions of the study area. There was increasing grassland in the central area of the basin, then changes in water bodies expanded minimally around the Tailan River, and built-up land significantly increased in the west of the basin. The area of unused land reduced due partly to conversion into other forms of land use in the western area, with a slight expansion in the southeast of the study area.
Based on this, a detailed analysis of the direction of land-use shift in the study area was conducted (Figure 6). It suggested that for the 1980–1990 period, there was no substantial shift in any of the land-use types. Only a small area of unused land was converted into forest and grassland. For the period of 1990–2000, there was rapid expansion in cultivated land, forests, and water bodies. For the same period, a substantial decline was noted for grassland. Some 221.7, 11.65, and 13.13 km2 of grassland were converted into cultivated land, forests, and water bodies, respectively. While there was a minimal change in built-up land, the unused land area dropped by 93.74 km2, with most of it being converted into forest and grassland. For the 2000–2010 period, the area of cultivated land further expanded to 423.65 km2. Forest and grassland continued to decline, with most of the loss in forest area being converted to grassland (175.59 km2) and unused land (185.71 km2). Most of the loss of grassland was converted to cultivated land (330.29 km2) and unused land (365.99 km2). Water bodies remained relatively stable, and there was a significant increase in built-up land, including the conversion of 27.36 km2 of cultivated land to built-up land. In the 2010–2020 period, the area of cultivated land increased by 261.07 km2 compared with 2010, which was at a slower rate than the previous period. Forest land, water bodies, and unused land did not change significantly during this period. Grassland dropped by 271.40 km2, with 257.78 km2 being converted to cultivated land. Built-up land further expanded to 62.91 km2, including the conversion of 17.63 km2 of grassland to built-up land.

3.3. A Spatial Centroid Shift in the 1980–2020 Period

To show the degree of dispersion and evolution dynamics of geographical phenomena in TRB, centroid and spatial location analyses were performed for the period of 1980–2020 (Figure S1). The centroid of cultivated land occurred in the western part of the TRB, stretching from the northwest to the southeast. The centroid of forest was in the southeastern region of the basin, spanning from the southeast to the west. Then, the centroid of grassland was in the central region of the TRB, with a shift from the northeast to southwest. The centroid of land under water was in the southeastern part of the TRB, covering the northwest to the southeast region. Also, the centroid of built-up land occurred in the west, moving from the southwest to the northeast. For unused land, the centroid was in the central part of the basin, spanning from the northwest to southeast.
On this basis, the spatial dynamics of the different land types in the 1980–2020 period were further analyzed using the SDE and centroid migration methods (Figure S2). It showed a pronounced directional trend in the expansion of cultivated land, characterized by an increasing spatial dispersion. The directionality of grasslands was relatively stable, and that of forests did not change significantly. However, the degree of dispersion of forests gradually increased. While the directionality of water bodies gradually strengthened, that of water bodies gradually weakened. Also, while the degree of dispersion of forests remained relatively stable, that of water bodies gradually increased. The directionality of unused lands strengthened, and its degree of dispersion remained relatively stable.

3.4. PLUS Model Drivers and Simulation Accuracy

In this study, the degrees of contribution of the various driving factors of the six land-use types were determined (Figure 7). The results suggest that human activity has had a significant impact on cultivated land, forest land, and grassland. The aridity index also showed significant enhanced forest land and grassland expansion in the study area. The DEM and rainfall substantially contributed to the expansion in water bodies too. Nighttime light was the other factor with a significant effect on both cultivated and built-up land. The expansion in unused land was driven significantly by the population and socio-economic factors. Additionally, the interactions of the various factors also influenced the contribution of driving factors to the land-use change in the study area. The increase in population increased household economic demand, which in turn affected the GDP and nightlight index. This influenced the land area under cultivated crops, infrastructure, and unused land. Rainfall and temperature altered the overall water vapor flux of vegetation and land into the atmosphere, eventually changing the aridity index in the study area. Meteorological factors further influenced the volume of water in the rivers and then changed the area of land under water bodies in the study area.
Leveraging the PLUS model, land use in the TRB was simulated for 2015 and 2020. The simulations were based on actual land-use maps for 2000, 2005, and 2015 using a total of 13 driving factors. The PLUS model’s precision was assessed by comparing the actual land uses in 2015 and 2020 and the predicted ones (Figure 8). The findings show consistency between the actual and simulated maps with high simulation accuracy (Table 4). In summary, the PLUS model was highly reliable and adept at mirroring LULC transformations in the basin study area. Thus, the PLUS model was used to predict the alterations in the various land types under the six scenarios (NDS, FSS, EDS, WPS, EPS, and BES) spanning the period of 2030–2060.

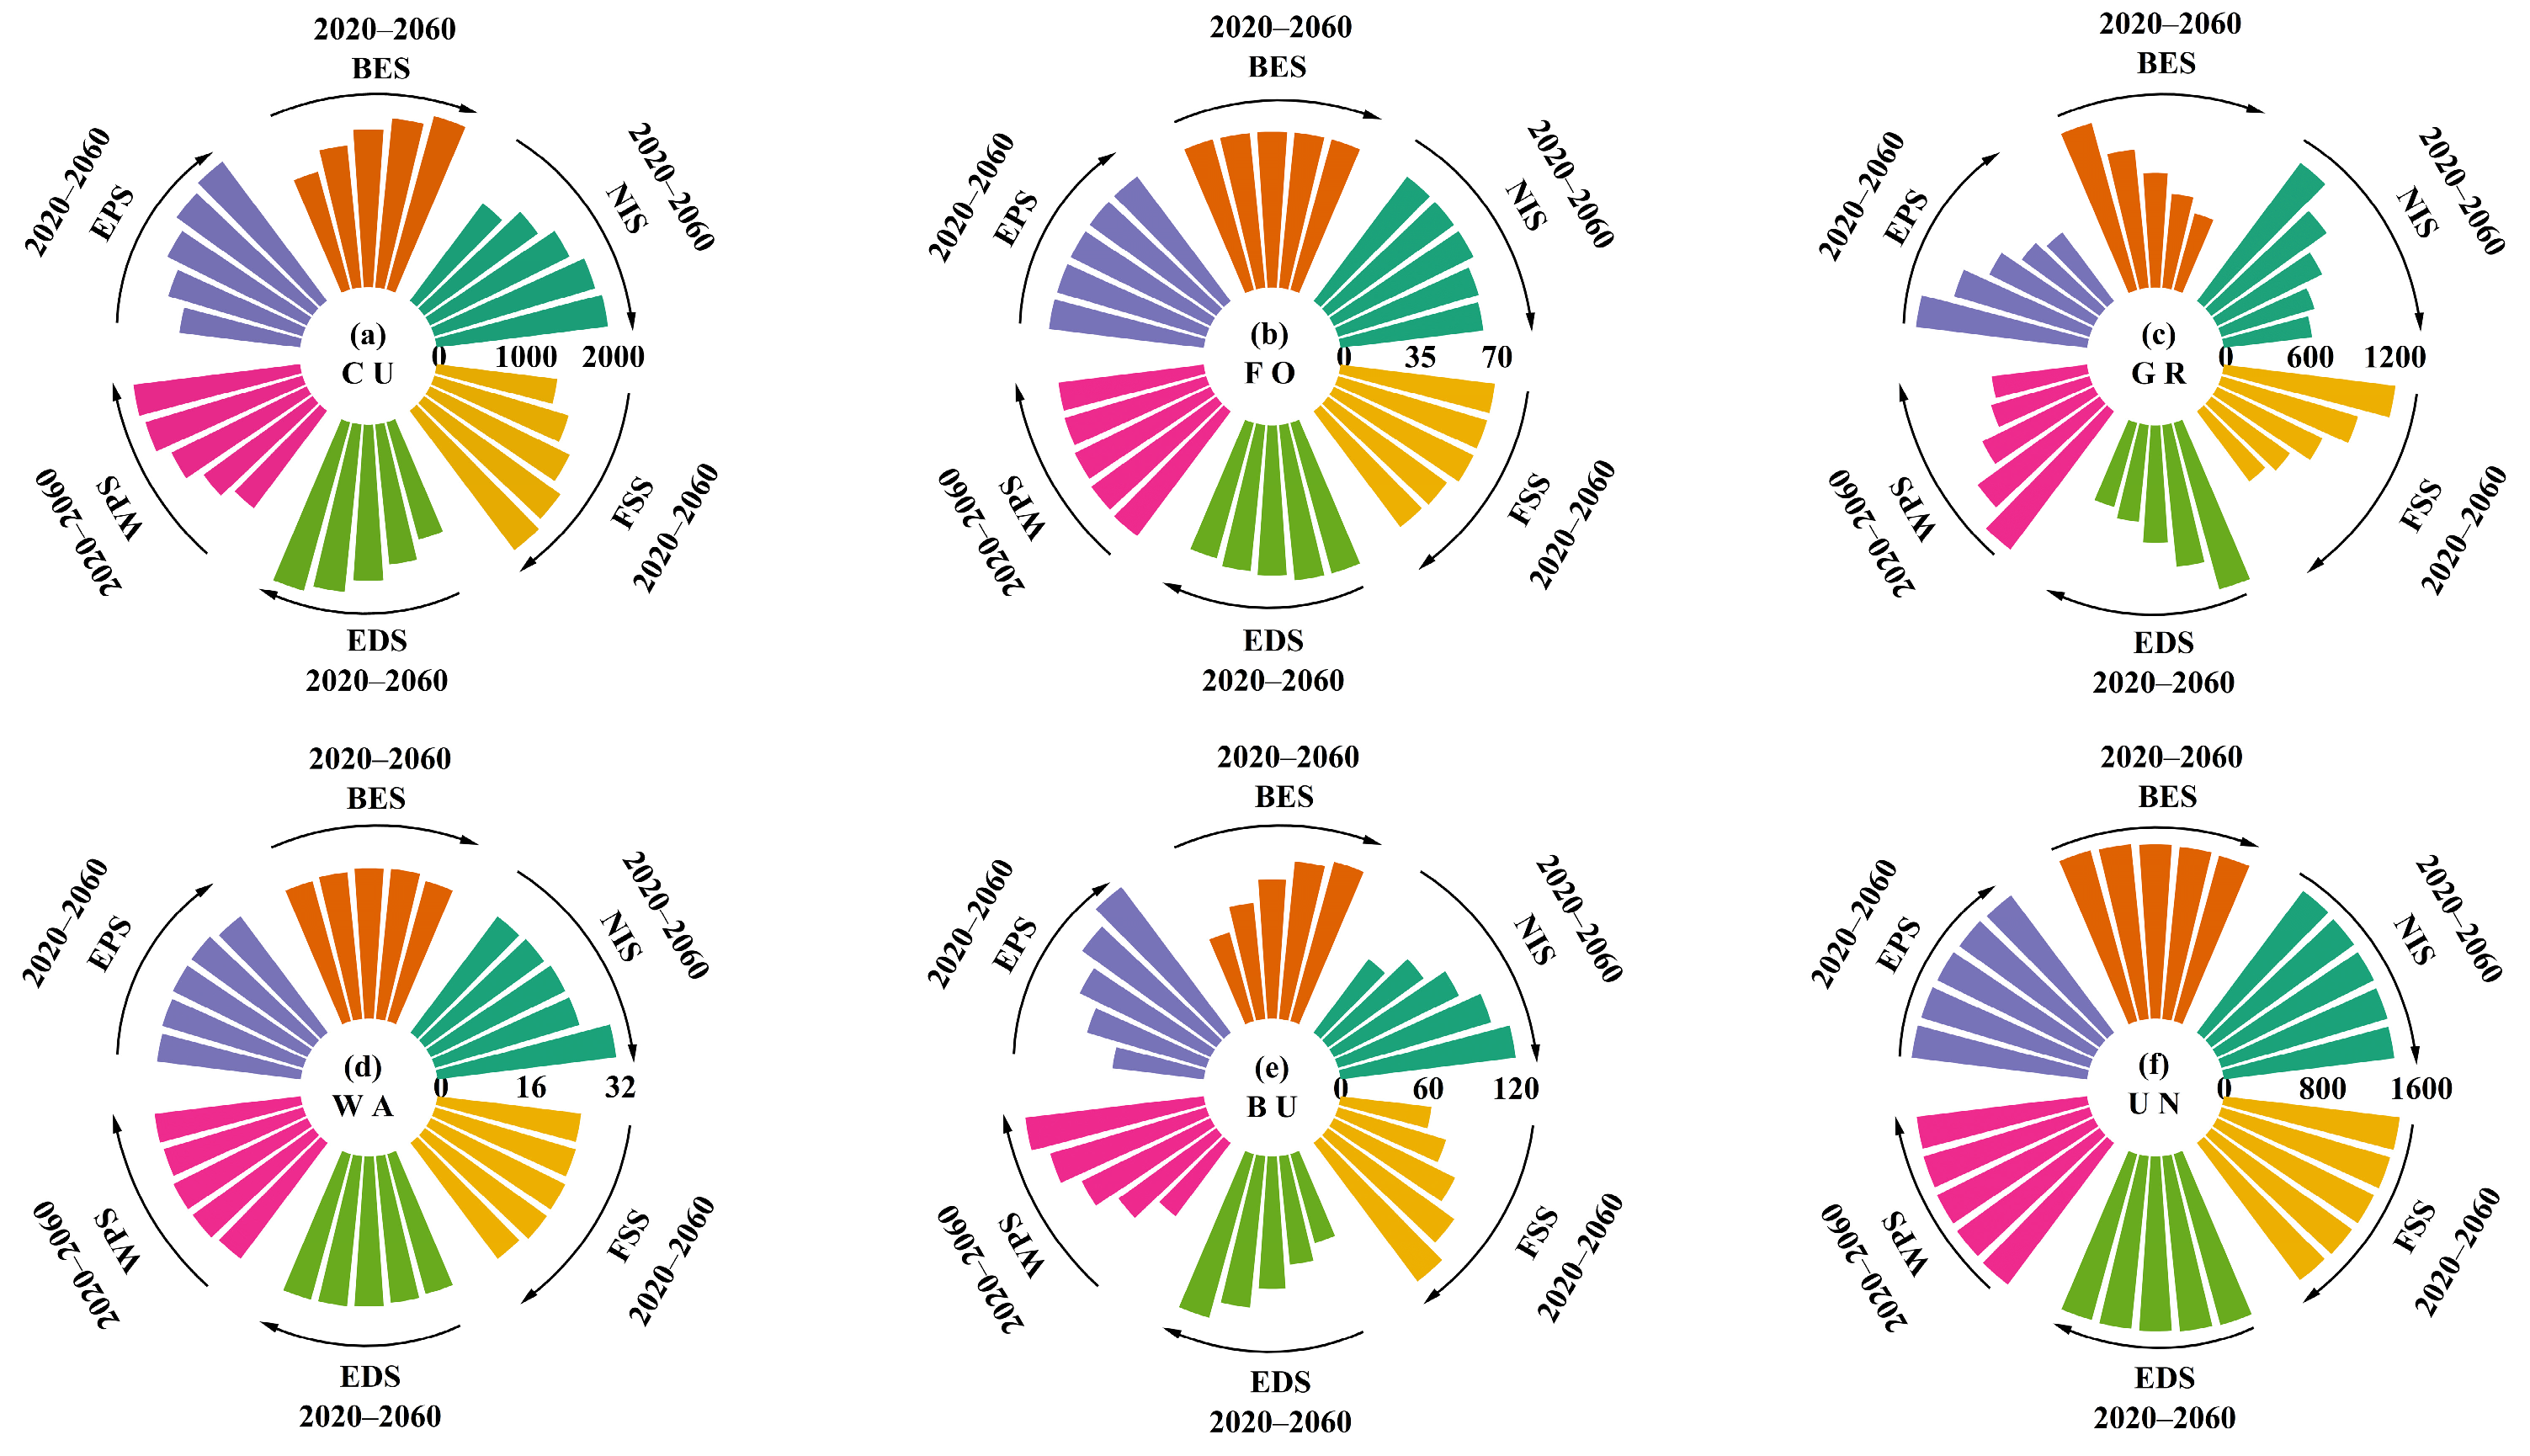
3.5. The 2020–2060 Multi-Scenario Simulation

The PLUS model’s simulation showed that the land-use changes under the six scenarios for the period of 2030–2060 were similar in spatial pattern (Figure 9). Cultivated land predominantly existed in the central and western regions of the basin, with grasslands mainly in the northern region. Built-up land occurred in clusters, with dense patches in both the western and northeastern areas of the basin. In contrast, only minor changes were observed in forest land, water bodies, and unused land.
For the 2020–2060 period, both forest and unused land areas declined, with little decadal change (<3%) in water bodies. Therefore, this analysis was focused on cultivated land, grassland, and construction land. For the 2020–2030 period, there was an increasing trend in cultivated land under the six scenario simulations, with the highest growth rate (16.96%) being seen under the FSS and the slowest (10.46%) being seen under the WPS. There was a significant decline in grassland, with the highest rate of decline (19.59%) being seen under the FSS and the slowest (12.72%) under the WPS. There was explosive growth in construction land, with the highest growth rate (35.17%) being seen under the EDS and the slowest (18.45%) under the EPS. The growth rate of cultivated land in the 2030–2040 period was smaller than that in the 2020–2030 period. It was the highest (12.05%) under the WPS, and that for each of the other scenarios did not exceed 10.85%. There was a high rate of decline in the area under grassland, which exceeded 17% for all six scenarios. The growth rate of construction land slowed compared with the decade before, which was about 17%. For the 2040–2050 period, cultivated land grew in trend, which later dropped to about 8%. For grassland, the decay rate under all six scenarios was 17%. But for construction land, the growth rate further dropped to about 13%. The growth rate of cultivated land further declined in the 2050–2060 period, with the highest (6%) being seen under the FSS and the lowest (2.53%) under the WPS. Additionally, the rate of decay of grassland varied significantly, with the highest (16.19%) being seen under the FSS and the lowest (6.49%) under the WPS. Construction land further decreased, with the highest drop (11.48%) being seen under the EPS and the least drop (4.29%) under the FSS.
In summary, the spatial distributions (Figure 9) and quantitative changes (Figure 10) in the six land-use types in the TRB in the 2020–2060 period suggested that across the six scenarios, there was an overall increase in cultivated land, which increased from 33.03% to 47%. The forest area slowly dwindled, dropping from 1.68 to 1.60%. Also, the grassland area dropped. decreasing from 29.10 to 15%. Additionally, while the area of the basin that was water was relatively constant, that under built-up land increased from 1.49 to 2.8%. Unused land remained largely unchanged, decreasing only by 1.05%—from 34.09 to 33.04%. As Table S4 shows, the SLUDD and CLUDD for the six land-use types in the basin area in the 2020–2060 period varied under each scenario. While the SLUDD declined in every decade under all six scenarios, the CLUDD increased (Table S5).

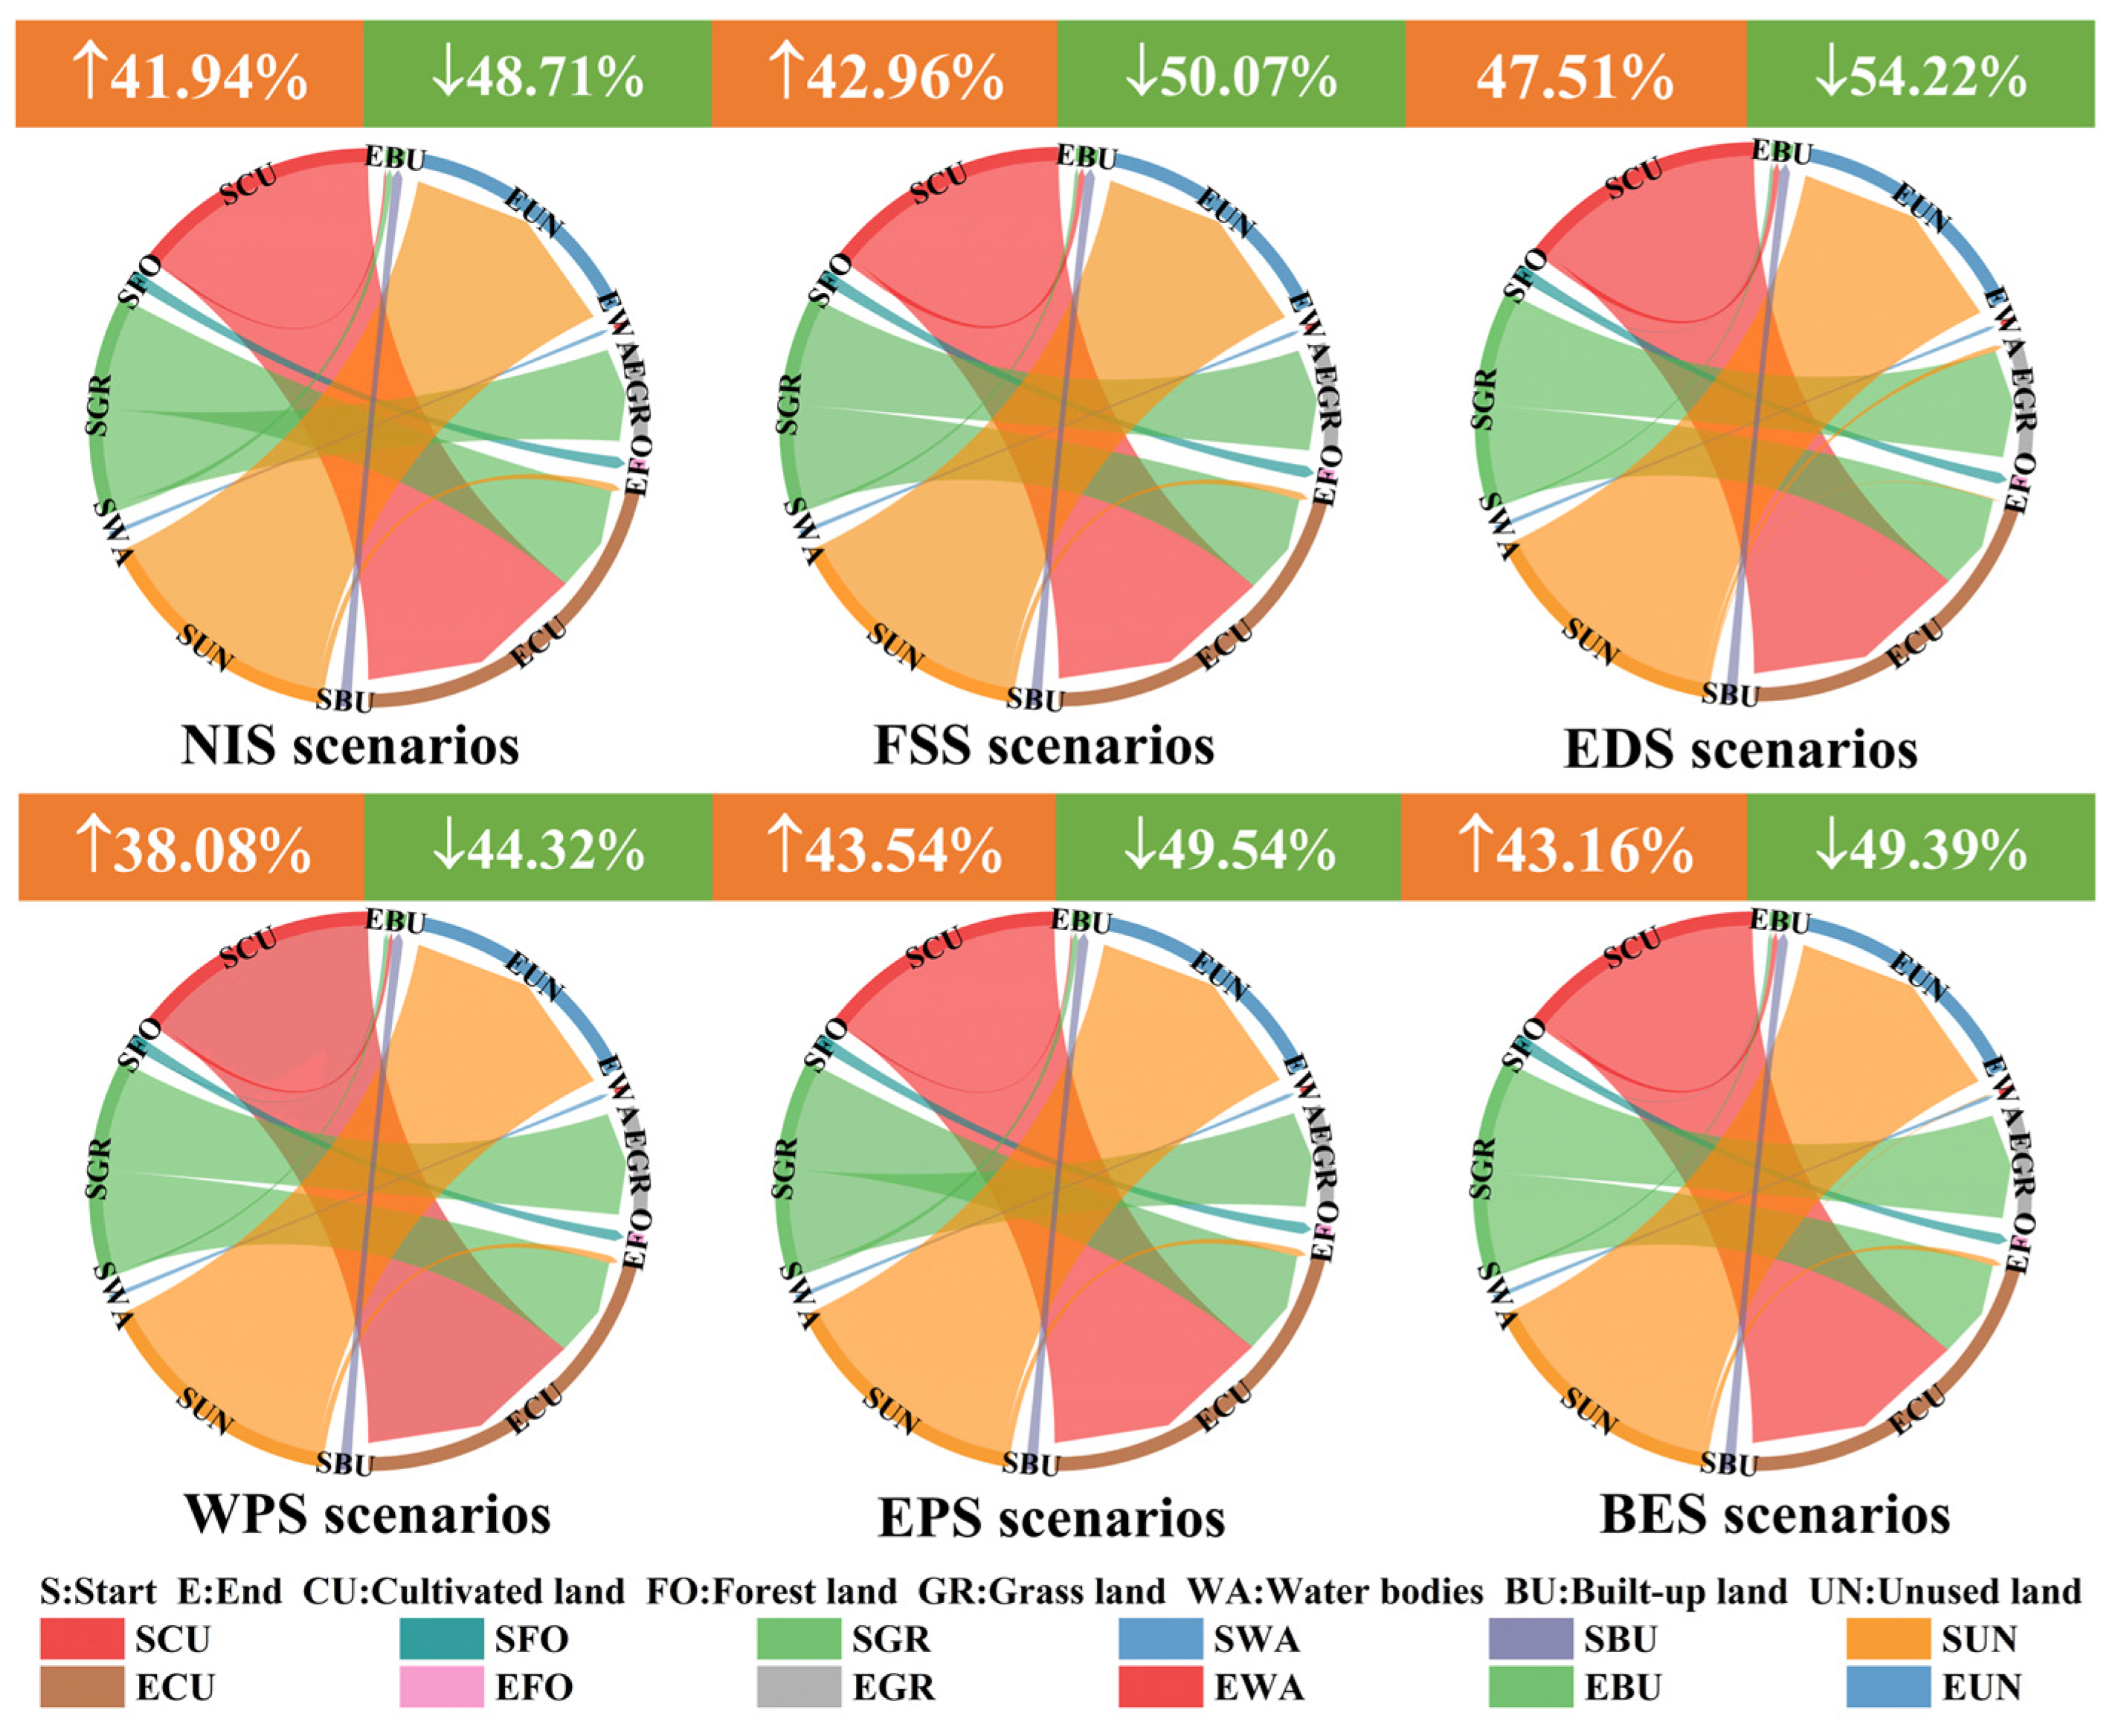
3.6. Space-Time Fabric of Land Use

In the multi-scenario prediction for the 2020–2060 period, the conversion dynamics were the highest for cultivated land and grassland. The characteristics of the change are more accurately depicted in percentages (Figure 11). Under the NIS, cultivated land increased by 41.94% in 2060, and forest land decreased by 48.71%. Of this, 579.98 km2 of forest land was converted into cultivated land. The expansion of built-up land was huge, with 34.32, 5.36, and 18.54% being taken from cultivated land, forest land, and grassland, respectively. For the FSS, cultivated land increased by 47.51%, while forest land decreased by 54.22%. This was the highest change under the FSS. For the EDS, cultivated land increased to 42.96%, and forest land dropped by 50.07%. Additionally, under the WPS, cultivated land increased by 38.08% as forest land dropped by 44.32%. These were the least land-use conversions under all land-use scenarios. For the EPS, cultivated land increased by 43.54%, and forest land decreased by 49.54%. Similarly, for the BES, cultivated land increased by 43.16%, and forest land decreased by 49.39%.
The spatial shifts in land use in the 2020–2060 period under multi-scenario conditions are plotted in Figure S3. Under all six scenarios, arable land demonstrated northward displacement. Specifically, northeastward shifts dominated in the FSS and EPS, while the WPS exhibited a distinct northwestward migration pattern. Forests shifted northwest, which were relatively minor under the FSS and EPS. Grasslands shifted northeast, and water bodies shifted westward under the NIS and EPS. Built-up land shifted north, with a northeast shift being observed under the FSS and BES. Unused land shifted south under all six scenarios, with a southeast shift being observed under the WPS and BES.

4. Discussion

4.1. Historical Land-Use Dynamics

LUCC is subject to the dual impact of human activity and natural environmental variations [49]. For the historical period, the area of cultivated land continuously increased by 865.56 km2, driven by the “1.8 billion Acre Arable Land Red Line” policy proposed by the Chinese government in 2006. As one of the main grain-producing areas in Northwest China, ensuring food security is also a regional responsibility. Moreover, the expansion in cultivated land is related to the increasing population. Forest land increased prior to 2000, followed by a rapid decline (197.44 km2). The growth phase of forest land was closely related with the control of desertification and oasis projects in Northwest China. The development of forest land was also influenced by the “1.8 billion Acre Arable Land Red Line”. This policy restricted arable land conversion, resulting in the partial conversion of forest land into cultivated land to ensure food production. Additionally, the climatic conditions in the region such as drought, winds, and sand and the vast variations in these climatic conditions influenced the survival rate and growth of trees. Similarly to forest land, the continuous decline in grassland (by 773.55 km2) was driven by local policy, while climate change and scarce water resources in the basin affected the expansion in grassland area. The area under water bodies did not significantly change during the period, but also did not noticeably decrease. With worsening global warming and glacier melt acceleration, it was difficult to maintain the existing area under water bodies [3]. Under the “Western Development” strategy, the area of built-up land continued to increase at the rate of 34.3 km2, which further increased after 2000. The area of unused land continuously decreased, contrarily. Since unused land in the region was primarily saline-alkali soils, the reduction in saline-alkali soils also indicated the intensification of local efforts to protect the ecosystem.
Besides being driven by policies, other factors behind land-use change are also very important. These include human activity (population, GDP, nightlight index, etc.), which very much influenced the evolution processes of the land-use types. For example, an increase in population increased food demand, thereby influencing the area of cultivated land. Similarly, demand for construction land increased, further squeezing out the area under forest and grassland. Meteorological, vegetation, and terrain data affected the direction and area of growth of forest and grass. Regions with dense precipitation and low evaporation had vigorous vegetation growth. Rainfall and rivers converged in the low plains, thereby enhancing the growth of grass and forest. Rainfall also influenced the area under water in the basin. This was consistent with the governing policy. These factors had potential impacts on the ecosystem—increasing population, economic growth, industrial development, urbanization and waste generation challenged the carrying capacity of ecosystem. With the deepening of El Niño, the regional meteorological environment will change [50]. Since the TRB is in the arid region, the ecosystem is inherently fragile. Changes in meteorological conditions could affect the ecosystem by several folds [51].
The change in LUCC that was due to human activity was expressed through the shift in the centroids of the various land-use types [52]. The shift in the centroid clarified the historical dynamics of land use. Next, the reasons for the shift were provided after further analysis showed the centroid shifts under the multi-scenario simulation. It offered historical evidence and future evolution and showed on which basis sustainable land management policy can be drawn. The shifts in the centroids of the six land-use types over time were not significant prior to 1990, but became more pronounced in the 1990–2010 period and then stabilized in the 2010–2020 period. This is tied to local economic development, policy direction, and climate change, among other factors. In space, however, the centroids of land-use types shifted towards the southeast of the basin, except for forest land, grassland, and built-up land. While forest land and built-up land shifted towards the north of the basin, grassland moved southwards. While there was a southeastern shift in arable land due to the directional expansion, there was a southern decrease in forest land and better water conditions in the north, making it more conducive for forest growth. The northward shift in built-up land was due to road construction and population density. Built-up land in the TRB was both dense and scattered in distribution, with an overall northwest occurrence in the basin. The changes in the centroids of the six land-use types indicated the combined effect of natural environmental factors (e.g., aridity and extreme weather events) and human activity (e.g., local policy and livable environment).

4.2. Future Land-Use Dynamics

The main purpose of simulating future land sustainability for development is to support socio-economic development with a minimal effect on the ecosystem [53]. Analyzing historical changes in land use and exploring future land-use options are important ways of achieving this goal. The PLUS model was highly accurate at the validation stage, making it reliable for the subsequent multi-scenario runs. The simulation showed that for the 2020–2060 period, both arable and construction lands increased. Forest land slightly decreased, and the change in water bodies was insignificant, too. Additionally, grassland and unused land continuously decreased. The increase in arable land was fastest under the FSS, expanding to 661.5 km2 in 2060. The increase in the area and rate of construction land were fastest under the EDS, covering an area of 61.7 km2 in 2060. Compared with the NIS, the WPS had the smallest increase in arable land (598.07 km2), slowing the conversion rate of grassland to arable land. Compared with the NIS, the expansion rates of both built-up and arable lands slowed down under the EPS. This reduced the impact of human activity on the ecosystem, which further slowed the conversion rate of grassland. Compared with the EPS, the expansion rate of arable land and the contraction rate of grassland further slowed down under the BES. However, there was a rapid increase in built-up land. Compared with the EDS, EPS, and BES, the grassland area contracted by 606.08 km2, and built-up land expanded by 55.82 km2 under the BES.
In summary, the FSS increased food production by promoting agricultural productivity. Additionally, the WPS hindered the expansion rate of arable land and the contraction rate of grassland, which were conducive for water conservation. While the EDS supported economic growth, the EPS enhanced ecological restoration. The most ideal scenario for balanced ecological protection and economic development was the BES.

4.3. Land Use Sustainability Strategy

A sustainable development strategy of land use in the TRB study area could be to consider the impacts of natural changes in eco-environment and socio-economic growth. The eco-environment of the TRB is inherently fragile, with scarce water resources. Tianshan Mountains can influence the direction of the wind in the basin and thereby increase the frequency of extreme weather events such as sandstorms. This can, in turn, disrupt the normal dynamics of cultivated land, forest land, and grassland in the region. Desert erosion can also cause land degradation and increased salinization, posing further threats to the ecology and biodiversity of TRB. Furthermore, urbanization can reshape the socio-economic and spatial structures of rural areas [53,54], making them susceptible to environmental stress from intensified soil erosion and land degradation [55]. Hence, a sustainable development strategy where humans, the ecosystem, and the land are in total harmony can be the most plausible land-use option. This strategy can be determined by screening out for the scenario with the least uncertainty in land use for the 2020–2060 period.
In terms of food security, the FSS was the most ideal strategy for ensuring food production and optimizing agricultural productivity. Under this scenario, there was a full expansion in cultivated land resources (increasing by 661.5 km2) and further consolidation of original conditions. This significantly enhanced the potential for agricultural development in the TRB study area. However, soil salinization was widespread in the TRB, and the soils usually had poor structure and permeability, which exacerbated the scarcity of water resources in the basin [56]. Therefore, the dense cultivation land-use model under the FSS not only significantly improved agricultural water-use efficiency, but also enhanced the ability of agricultural systems to resist natural disasters. This was particularly key for sustainable agricultural development in the TRB study area.
There were many challenges regarding water resources in the TRB, with large inter-annual flow variations and pronounced spring droughts and summer floods. This exacerbated the existing scarcity of water resources in the basin. The WPS effectively controlled the rate of expansion of cultivated land (increasing by 598.07 km2) and slowed down the trend in grassland degradation (reducing by 543.8 km2). This measure not only reduced the demand for water resources for agricultural irrigation, but also enhanced grassland vegetation, soil moisture, soil water storage, and water scarcity.
There was a mutual enhancement in economic development and ecological protection. The EDS freed up land for economic enhancement and city development and expansion, favoring the continuous expansion in built-up land. The EPS focused on ecological protection, effectively curbing land fragmentation, preserving the ecosystem, reducing environmental degradation, and strengthening ecological resilience. With population growth and socio-economic development, however, striking a harmonious coexistence of the economy and ecology was an inevitable option. The BES focused on ecological and environmental governance while ensuring economic development. It moderately regulated the growth rate of cultivated and built-up lands and then reduced grassland degradation by 606.08 km2. Thus, it was recommended for policymakers to be flexible in choosing which plan to follow for future development. For economic development, the EDS provided a strategic guide. Regarding staying committed to ecological restoration and protection, the EPS was more instructive. And for a balanced economy and ecology, the BES was a more comprehensive and integrated scenario.
In spite of the constraints of quantity and space, land management policies and regulations also had a significant impact on the pattern of land conversion [57]. There was a need to strengthen and improve related policies, the regulatory framework, and supervision and to build a more scientific basis for land use in the TRB study area. Furthermore, establishing a long-term mechanism for the consolidation of sustainable land use was required to reduce land degradation, improve soil structure, and enhance soil fertility.

4.4. Potential Limitations

(1) The diversity and complexity of the land–ecology–water system increased uncertainties in the regional simulation. The typical inland river basin in arid China is characterized by water scarcity, a variable climate, and an ecosystem of mountains, oases, and deserts. It was difficult to obtain data on the driving factors for the modeling period, especially seamless long-term data. The lack of historical data (on meteorological variables and the population) may have induced uncertainty in the simulation. However, with the strengthening of governance, support from national policies, and increased local data collection efforts by local governments, the uncertainties will be resolved with time.
(2) The simulation of static driving factors to test the actual evolution of the land was another limitation. With increasing human activity, the dynamism of model simulation became important. Global challenges with ecological balance, environmental pollution, and resource shortage affect land use. In this study, however, only static driving factors were considered, inducing errors in the actual evolution process of land use. The use of dynamic data in multi-scenario simulations was key for an accurate prediction of land resources.
Here, the choice was made to use policy-driven multi-scenario conditions to simulate the effect of land-use change and the static driving factors on the actual evolution of land use in the TRB study area. Although land-use had changed over and over again, a more suitable scenario was determined for strategic planning and future land-use policies.
(3) The urgent need for a strategy of sustainable development with humans in harmony with the ecology and land use was another limitation. With an increasing population in the arid region, balancing human activity with the ecology and the economy was urgent. The TRB region not only needed a continuous increase in cultivated land area to ensure food security, but also protected forests and grasslands to ensure the ecological sustainability of the desert oasis. There was still a large area of unused land in the basin region (under saline-alkali and desert soils), which needed improvement. There was therefore a need to enhance soil and water conservation in the forest lands and grasslands. This was more so needed for soil and water conservation along the banks of the Tailan River. Strengthening the management of desertification and saline-alkali soils will increase the overall usable land area and thereby enhance land use efficiency in the basin.

5. Conclusions

The TRB study area is in the complex arid eco-hydrological feedback region with a fragile ecological environment where there is also regional population growth and the intensification of urbanization. Therefore, analyzing land use will deepen existing knowledge on the trend in land-use change and, therefore, the impact of land use on the ecology and the economy of the region. Here, multi-scenario land use was simulated to guide policy decisions for food security, ecological resilience, and sustainable growth. The main conclusions of the study include the following:
(1)
In the 1980–2020 period, there were significant changes in the areas of cultivated land, grassland, forest land, and built-up land. In this period, the cultivated land area increased, while the areas of forest and grassland shrunk. Obvious shifts in the six land-use types were evident in the 1990–2010 period. The spatial distribution, area of change, and types of land use indicated that land use in the basin was influenced by human activity and climate change, but policy direction had the most impact on land use in the TRB study area.
(2)
An accuracy analysis of the validation simulation showed that the OA of the PLUS model was above 90%, the Kappa was above 85%, and the FOM was above 0.18, all indicating a highly accurate simulation. Under the predicted multi-scenario land use, the areas of cultivated and construction lands increased. Grassland, forest land, and unused land declined from one year to the other, while there was little change in water bodies. This indicated that protecting cultivated land and ensuring food security will be the main focus of regional development in the study area up to 2060. The FSS had the highest increase in cultivated land and the most noticeable decline in grassland. And the BES struck the most balance between ecological conservation and economic development. The six scenarios predicted the development pathways for the TRB, with the TRB deserving the most attention because of its degrees of ecological protection, agricultural productivity, socio-economic growth and sustainable development, and harmonious balance of the economy, ecology, and land.
(3)
A multi-scenario strategy for sustainable development with humans in a harmonious balance with ecology and land use was established in this study. The aim was to determine the most viable land-use option to guide policies and sustainable development well into 2060. This was achieved through the simulation of six land-use scenarios and the recommendation of the most plausible one along with policy tools to actualize it.
(4)
The following conclusions can be made based on the results: (i) Food security was the main focus of development in the TRB study area and the subregion. Thus, it was necessary to strengthen protection and management and improve the yield of cultivated land in the study area. (ii) While developing the agricultural economy, attention on ecological protection was also needed. This was because of the fragile arid ecology of the TRB, which needed the preservation of forest and grassland resources. (iii) There was a need to implement multi-scenario land management strategies to balance the various development efforts in a coordinated way in the TRB study area and beyond.

Supplementary Materials

The following supporting information can be downloaded at https://www.mdpi.com/article/10.3390/land14040787/s1. References [58,59,60,61] are cited in the Supplementary Material.

Author Contributions

Conceptualization, Y.Y., Y.W., W.W., D.C. and X.H.; Data Curation, Y.Y.; Formal Analysis, Y.Y., Y.W. and D.C.; Funding Acquisition, P.J. and X.H.; Methodology, P.J., Y.W. and W.W.; Project Administration, P.J., D.C. and X.H.; Resources, D.C. and X.H.; Supervision, P.J., W.W. and X.H.; Writing—Original Draft, Y.Y.; Writing—Review and Editing, D.C. and X.H. All authors have read and agreed to the published version of the manuscript.

Funding

This work was funded by the Major Science and Technology Project of Xinjiang Autonomous Region (2023A02002-1), and Key Research and Development Plan of Shaanxi Province (2023-YBNY-270).

Data Availability Statement

The raw data supporting the conclusions of this article will be made available by the authors on request.

Conflicts of Interest

The authors declare no conflict of interest.

References

  1. van der Esch, S.; Sewell, A.; Bakkenes, M.; Berkhout, E.; Doelman, J.C.; Stehfest, E.; Langhans, C.; Bouwman, A.; Berkhout, E.; Fleskens, L.; et al. The Global Potential for Land Restoration: Scenarios for the Global Land Outlook 2; PBL Netherlands Environmental Assessment Agency: The Hague, The Netherlands, 2022; Available online: https://www.unccd.int/resources/reports/global-potential-land-restoration (accessed on 1 January 2024).
  2. Song, X.P.; Hansen, M.C.; Stehman, S.V.; Potapov, P.V.; Tyukavina, A.; Vermote, E.F.; Townshend, J.R. Global land change from 1982 to 2016. Nature 2018, 560, 639–643. [Google Scholar] [CrossRef] [PubMed]
  3. Intergovernmental Panel on Climate Change (IPCC). Climate Change and Land: An IPCC Special Report on Climate Change, Desertification, Land Degradation, Sustainable Land Management, Food Security, and Greenhouse Gas Fluxes in Terrestrial Ecosystems. 2019. 874p. Available online: https://www.ipcc.ch/srccl/ (accessed on 10 April 2024).
  4. Luo, K.; Zhang, X. Increasing urban flood risk in China over recent 40 years induced by LUCC. Landsc. Urban Plan. 2022, 219, 104317. [Google Scholar] [CrossRef]
  5. Boakes, E.H.; Dalin, C.; Etard, A.; Newbold, T. Impacts of the global food system on terrestrial biodiversity from land use and climate change. Nat. Commun. 2024, 15, 5750. [Google Scholar] [CrossRef] [PubMed]
  6. Chi, W.; Zhao, Y.; Kuang, W.; He, H. Impacts of anthropogenic land use/cover changes on soil wind erosion in China. Sci. Total Environ. 2019, 668, 204–215. [Google Scholar] [CrossRef]
  7. Huffaker, R.; Campo-Bescós, M.Á.; Luquin, E.; Sarasibar, J.C.; Muñoz-Carpena, R. Hydrological records can be used to reconstruct the resilience of watersheds to climatic extremes. Commun. Earth Environ. 2024, 5, 19. [Google Scholar] [CrossRef]
  8. Findell, K.L.; Berg, A.; Gentine, P.; Krasting, J.P.; Lintner, B.R.; Malyshev, S.; Santanello, J.J.A.; Shevliakova, E. The impact of anthropogenic land use and land cover change on regional climate extremes. Nat. Commun. 2017, 8, 989. [Google Scholar] [CrossRef]
  9. King, A.C.; Bauska, T.K.; Brook, E.J.; Kalk, M.; Nehrbass-Ahles, C.; Wolff, E.W.; Strawson, I.; Rhodes, R.H.; Osman, M.B. Reconciling ice core CO2 and land-use change following New World-Old World contact. Nat. Commun. 2024, 15, 1735. [Google Scholar] [CrossRef]
  10. Winkler, K.; Fuchs, R.; Rounsevell, M.; Herold, M. Global land use changes are four times greater than previously estimated. Nat. Commun. 2021, 12, 2501. [Google Scholar] [CrossRef]
  11. Li, C.; Fu, B.; Wang, S.; Stringer, L.C.; Wang, Y.; Li, Z.; Liu, Y.; Zhou, W. Drivers and impacts of changes in China’s drylands. Nat. Rev. Earth Environ. 2021, 2, 858–873. [Google Scholar] [CrossRef]
  12. Huang, K.; Xia, J.; Wang, Y.; Ahlström, A.; Chen, J.; Cook, R.B.; Cui, E.; Fang, Y.; Fisher, J.B.; Huntzinger, D.N.; et al. Enhanced peak growth of global vegetation and its key mechanisms. Nat. Ecol. Evol. 2018, 2, 1897–1905. [Google Scholar] [CrossRef]
  13. Li, L.; Wang, L.; Qi, Z. The spatiotemporal variation of farmland uses transition and its critical influential factors in coordinated urban-rural regions: A case of Chongqing in western China. Sustain. Cities Soc. 2021, 70, 102921. [Google Scholar] [CrossRef]
  14. Zhu, G.; Qiu, D.; Zhang, Z.; Sang, L.; Liu, Y.; Wang, L.; Zhao, K.; Ma, H.; Xu, Y.; Wan, Q. Land-use changes lead to a decrease in carbon storage in arid region, China. Ecol. Indic. 2021, 127, 107770. [Google Scholar] [CrossRef]
  15. Chen, Y.; Zhang, X.; Fang, G.; Li, Z.; Wang, F.; Qin, J.; Sun, F. Potential risks and challenges of climate change in the arid region of northwestern China. Reg. Sustain. 2020, 1, 20–30. [Google Scholar] [CrossRef]
  16. Xue, J.; Gui, D.; Zhao, Y.; Lei, J.; Feng, X.; Zeng, F.; Zhou, J.; Mao, D. Quantification of environmental flow requirements to support ecosystem services of oasis areas: A case study in Tarim Basin, Northwest China. Water 2015, 7, 5657–5675. [Google Scholar] [CrossRef]
  17. Liu, X.; Tang, Q.; Zhao, Y.; Wang, P. Persistent water scarcity due to high irrigation demand in arid China: A case study in the north slope of the Tianshan Mountains. Earth’s Future 2024, 12, e2024EF005070. [Google Scholar] [CrossRef]
  18. Azadi, Y.; Yaghoubi, J.; Gholizadeh, H.; Gholamrezai, S.; Rahimi-Feyzabad, F. Social barriers to water scarcity adaptation: A grounded theory exploration in arid and semi-arid regions. Agr. Water. Manag. 2025, 309, 109338. [Google Scholar] [CrossRef]
  19. Liu, C.; Chen, Y.; Huang, W.; Fang, G.; Li, Z.; Zhu, C.; Liu, Y. Climate warming positively affects hydrological connectivity of typical inland river in arid Central Asia. Npj. Clim. Atmos. Sci. 2024, 7, 250. [Google Scholar] [CrossRef]
  20. Zhang, Z.; Hu, H.; Tian, F.; Yao, X.; Sivapalan, M. Groundwater dynamics under water-saving irrigation and implications for sustainable water management in an oasis: Tarim River basin of western China. Hydrol. Earth Syst. Sci. 2014, 18, 3951–3967. [Google Scholar] [CrossRef]
  21. Jiang, H.; Xu, X.; Wang, L.; Zhang, T. Integrating ecosystem service values and economic benefits for sustainable land use management in semi-arid regions in northern China. Sustainability 2021, 13, 10431. [Google Scholar] [CrossRef]
  22. Hou, Y.; Chen, Y.; Ding, J.; Li, Z.; Li, Y.; Sun, F. Ecological Impacts of land use change in the Arid Tarim river Basin of China. Remote Sens. 2022, 14, 1894. [Google Scholar] [CrossRef]
  23. Domingo, D.; Palka, G.; Hersperger, A.M. Effect of zoning plans on urban land use change: A multi-scenario simulation for supporting sustainable urban growth. Sustain. Cities Soc. 2021, 69, 102833. [Google Scholar] [CrossRef]
  24. Fan, X.; Cheng, Y.; Li, Y. Multi-Scenario Land Use Simulation and Land Use Conflict Assessment Based on the CLUMondo Model: A Case Study of Liyang, China. Land 2023, 12, 917. [Google Scholar] [CrossRef]
  25. Zhao, Y.; Wang, M.; Lan, T.; Xu, Z.; Wu, J.; Liu, Q.; Peng, J. Distinguishing the effects of land use policies on ecosystem services and their trade-offs based on multi-scenario simulations. Appl. Geogr. 2023, 151, 102864. [Google Scholar] [CrossRef]
  26. Qiao, X.; Li, Z.; Lin, J.; Wang, H.; Zheng, S.; Yang, S. Assessing current and future soil erosion under changing land use based on InVEST and FLUS models in the Yihe River Basin, North China. Int. Soil Water Conserv. Res. 2024, 12, 298–312. [Google Scholar] [CrossRef]
  27. Hürlimann, M.; Guo, Z.; Puig-Polo, C.; Medina, V. Impacts of future climate and land cover changes on landslide susceptibility: Regional scale modelling in the Val d’Aran region (Pyrenees, Spain). Landslides 2022, 19, 99–118. [Google Scholar] [CrossRef]
  28. Guo, Z.; Ferrer, J.V.; Hürlimann, M.; Medina, V.; Puig-Polo, C.; Yin, K.; Huang, D. Shallow landslide susceptibility assessment under future climate and land cover changes: A case study from southwest China. Geosci. Front. 2023, 14, 101542. [Google Scholar] [CrossRef]
  29. Liang, X.; Guan, Q.; Clarke, K.C.; Liu, S.; Wang, B.; Yao, Y. Understanding the drivers of sustainable land expansion using a patch-generating land use simulation (PLUS) model: A case study in Wuhan, China. Comput. Environ. Urban Syst. 2021, 85, 101569. [Google Scholar] [CrossRef]
  30. Gao, L.; Tao, F.; Liu, R.; Wang, Z.; Leng, H.; Zhou, T. Multi-scenario simulation and ecological risk analysis of land use based on the PLUS model: A case study of Nanjing. Sustain. Cities Soc. 2022, 85, 104055. [Google Scholar] [CrossRef]
  31. Zhao, F.; Hu, Z.; Zhao, X. Multi-scenario prediction and path optimization of industrial carbon unlocking in China. J. Clean. Prod. 2023, 421, 138534. [Google Scholar] [CrossRef]
  32. Wang, X.C.; Wang, J.T.; Zhang, C.H. Deterministic full-scenario analysis for maximum credible earthquake hazards. Nat. Commun. 2023, 14, 6600. [Google Scholar] [CrossRef]
  33. Sætra, H.S. Science fiction, sustainability, and scenario use: Comprehensive scenarios for improved strategy development and innovation. Technovation 2024, 132, 102976. [Google Scholar] [CrossRef]
  34. Basu, T.; Das, A.; Das, K.; Pereira, P. Urban expansion induced loss of natural vegetation cover and ecosystem service values: A scenario-based study in the siliguri municipal corporation (Gateway of North-East India). Land Use Policy 2023, 132, 106838. [Google Scholar] [CrossRef]
  35. Tariq, A.; Sardans, J.; Zeng, F.; Graciano, C.; Hughes, A.C.; Farré-Armengol, G.; Peñuelas, J. Impact of aridity rise and arid lands expansion on carbon-storing capacity, biodiversity loss, and ecosystem services. Glob. Change Biol. 2024, 30, e17292. [Google Scholar] [CrossRef]
  36. Moghadam, B.K.; Jabarifar, M.; Bagheri, M.; Shahbazi, E. Effects of land use change on soil splash erosion in the semi-arid region of Iran. Geoderma 2015, 241, 210–220. [Google Scholar] [CrossRef]
  37. Scherzinger, F.; Schädler, M.; Reitz, T.; Yin, R.; Auge, H.; Merbach, I.; Roscher, C.; Harpole, W.S.; Blagodatskaya, E.; Siebert, J.; et al. Sustainable land management enhances ecological and economic multifunctionality under ambient and future climate. Nat. Commun. 2024, 15, 4930. [Google Scholar] [CrossRef] [PubMed]
  38. Liu, J.; Kuang, W.; Zhang, Z.; Xu, X.; Qin, Y.; Ning, J.; Zhou, W.; Zhang, S.; Li, R.; Yan, C.; et al. Spatiotemporal characteristics, patterns, and causes of land-use changes in China since the late 1980s. J. Geogr. Sci. 2014, 24, 195–210. [Google Scholar] [CrossRef]
  39. Zhuang, D.; Liu, J.; Liu, M. Research activities on land-use/cover change in the past ten years in China using space technology. Chin. Geogr. Sci. 1999, 9, 330–334. [Google Scholar] [CrossRef]
  40. Xiong, L.; Li, R. Assessing and decoupling ecosystem services evolution in karst areas: A multi-model approach to support land management decision-making. J. Environ. Manag. 2024, 350, 119632. [Google Scholar] [CrossRef]
  41. Liu, H.; Zheng, M.; Liu, J.; Zheng, X. Sustainable land use in the trans-provincial marginal areas in China. Resour. Conserv. Recycl. 2020, 157, 104783. [Google Scholar] [CrossRef]
  42. Chang, X.; Xing, Y.; Wang, J.; Yang, H.; Gong, W. Effects of land use and cover change (LUCC) on terrestrial carbon stocks in China between 2000 and 2018. Resour. Conserv. Recycl. 2022, 182, 106333. [Google Scholar] [CrossRef]
  43. Yu, B.; Zang, Y.; Wu, C.; Zhao, Z. Spatiotemporal dynamics of wetlands and their future multi-scenario simulation in the Yellow River Delta, China. J. Environ. Manag. 2024, 353, 120193. [Google Scholar] [CrossRef]
  44. Chen, A.; Yang, X.; Guo, J.; Zhang, M.; Xing, X.; Yang, D.; Xu, B.; Jiang, L. Dynamic of land use, landscape, and their impact on ecological quality in the northern sand-prevention belt of China. J. Environ. Manag. 2022, 317, 115351. [Google Scholar] [CrossRef]
  45. Shi, Q.; Gu, C.J.; Xiao, C. Multiple scenarios analysis on land use simulation by coupling socioeconomic and ecological sustainability in Shanghai, China. Sustain. Cities Soc. 2023, 95, 104578. [Google Scholar] [CrossRef]
  46. Congalton, R.G. A review of assessing the accuracy of classifications of remotely sensed data. Remote Sens. Environ. 1991, 37, 35–46. [Google Scholar] [CrossRef]
  47. Zhang, Y.; Li, Y.; Lv, J.; Wang, J.; Wu, Y. Scenario simulation of ecological risk based on land use/cover change-A case study of the Jinghe county, China. Ecol. Indic. 2021, 131, 108176. [Google Scholar] [CrossRef]
  48. Liu, X.; Liang, X.; Li, X.; Xu, X.; Ou, J.; Chen, Y.; Li, S.; Wang, S.; Pei, F. A future land use simulation model (FLUS) for simulating multiple land use scenarios by coupling human and natural effects. Landsc. Urban Plan. 2017, 168, 94–116. [Google Scholar] [CrossRef]
  49. Yang, H.; Zhong, X.; Deng, S.; Xu, H. Assessment of the impact of LUCC on NPP and its influencing factors in the Yangtze River basin, China. Catena 2021, 206, 105542. [Google Scholar] [CrossRef]
  50. Todmal, R.S. Intensity, frequency and coverage of hydro-meteorological droughts and agriculture in the semi-arid basins of Maharashtra (India). Clim. Change 2024, 177, 140. [Google Scholar] [CrossRef]
  51. Zhou, Y.; Li, Y.; Li, W.; Li, F.; Xin, Q. Ecological responses to climate change and human activities in the arid and semi-arid regions of Xinjiang in China. Remote Sens. 2022, 14, 3911. [Google Scholar] [CrossRef]
  52. Wei, H.; Xiong, L.; Tang, G.; Strobl, J.; Xue, K. Spatial-temporal variation of land use and land cover change in the glacial affected area of the Tianshan Mountains. Catena 2021, 202, 105256. [Google Scholar] [CrossRef]
  53. Liu, Z. Rural land sustainability development planning and use by considering land multifunction values: A case study of analysis and simulation. Land Use Policy 2025, 150, 107455. [Google Scholar] [CrossRef]
  54. Feng, Y.; He, S.; Li, G. Interaction between urbanization and the eco-environment in the Pan-Third Pole region. Sci. Total Environ. 2021, 789, 148011. [Google Scholar] [CrossRef]
  55. Chen, X.; Yu, L.; Du, Z.; Xu, Y.; Zhao, J.; Zhao, H.; Zhao, G.; Peng, D.; Gong, P. Distribution of ecological restoration projects associated with land use and land cover change in China and their ecological impacts. Sci. Total Environ. 2022, 825, 153938. [Google Scholar] [CrossRef]
  56. Zeng, T.; Li, Y.; Ma, L.; Kong, L.; Zhang, J.; Abuduwaili, J. Unveiling Latent interaction mechanisms influencing the spatial pattern of soil salinity in arid Oases: Insights from integrated modeling. Catena 2025, 250, 108769. [Google Scholar] [CrossRef]
  57. Long, H.; Qu, Y. Land use transitions and land management: A mutual feedback perspective. Land Use policy 2018, 74, 111–120. [Google Scholar] [CrossRef]
  58. López, E.; Bocco, G.; Mendoza, M.; Duhau, E. Predicting land-cover and land-use change in the urban fringe: A case in Morelia city, Mexico. Landsc. Urban. Plann. 2001, 55, 271–285. [Google Scholar] [CrossRef]
  59. Liu, X.; Liu, Y.; Wang, Y.; Liu, Z. Evaluating potential impacts of land use changes on water supply-demand under multiple development scenarios in dryland region. J. Hydrol. 2022, 610, 127811. [Google Scholar] [CrossRef]
  60. Nie, W.; Xu, B.; Yang, F.; Shi, Y.; Liu, B.; Wu, R.; Lin, W.; Pei, H.; Bao, Z. Simulating future land use by coupling ecological security patterns and multiple scenarios. Sci. Total. Environ. 2023, 859, 160262. [Google Scholar] [CrossRef]
  61. Kulaixi, Z.; Chen, Y.; Li, Y.; Wang, C. Dynamic Evolution and Scenario Simulation of Ecosystem Services under the Impact of Land-Use Change in an Arid Inland River Basin in Xinjiang, China. Remote Sens. 2023, 15, 2476. [Google Scholar] [CrossRef]
Figure 1. A geographical overview of the Tailan River Basin (TRB). (a) The geographical location of the TRB in China. (b) The geographical location of the TRB in provincial administrative divisions (Xinjiang Uygur autonomous region). (c) A digital elevation model (DEM) in the TRB. (d) A detailed figure of land use in the TRB.
Land 14 00787 g001
Figure 2. An infograph depicting the overall framework of the study (In the six scenarios, upward-pointing arrows denote an increase in probability, downward-pointing arrows indicate a decrease in probability).
Land 14 00787 g002
Figure 3. Spatial distribution of various land-use types in Tailan River Basin (TRB) for period of 1980–2020.
Land 14 00787 g003
Figure 4. Trends of change in the area of land-use types in the Tailan River Basin (TRB) for the period of 1980–2020 (Red line delineates transition trends across distinct land-use types).
Land 14 00787 g004
Figure 5. Changes in land transfer across different land-use types in Tailan River Basin (TRB) for period of 1980–2020. Note: CU is cultivated land; FO is forest land; GR is grass land; WA is water bodies; BU is built-up land; and UN is unused land.
Land 14 00787 g005
Figure 6. Transitions in the various land-use types in the Tailan River Basin (TRB) for the period of 1980–2020.
Land 14 00787 g006
Figure 7. The measure of intensity of the impacts of the driving factors on land-use change in the Tailan River Basin (TRB) study area. (Colors closer to red indicate higher value levels. A: Digital Elevation Model. B: Drought Index. C: Gross Domestic Product. D: Normalized Difference Vegetation Index. E: Nighttime Lights. F: Population. G: Distance to Railway. H: Precipitation. I: Distance to Primary Road. J: Distance to Secondary Road. K: Distance to Township Road. L: Distance to Residential Areas. M: Temperature).
Land 14 00787 g007
Figure 8. Comparison of observed (left) and PLUS-simulated (right) land use in Tailan River Basin (TRB) in 2015.
Land 14 00787 g008
Figure 9. Simulated future land-use patterns in the 2030–2060 period in the Tailan River Basin (TRB) under the NDS, FSS, EDS, WPS, EPS, and BES. Note: NIS is natural increase scenario; FSS is food security scenario; EDS is economic development scenario; WPS is water resources protection scenario; EPS is ecological protection scenario; and BES is balanced ecology–economy scenario.
Land 14 00787 g009
Figure 10. Changes in the areas of land under the various land-use types under the six simulated land-use scenarios for the 2020–2060 period. Note: CU is cultivated land; FO is forest land; GR is grassland; WA is water body; BU is built-up land; and UN is unused land.
Land 14 00787 g010
Figure 11. Land transfer regarding land use under the NDS, FSS, EDS, WPS, EPS, and BES in the 2020–2060 period in the Tailan River Basin (TRB) study area. Note: NIS is natural increase scenario; FSS is food security scenario; EDS is economic development scenario; WPS is water resources protection scenario; EPS is ecological protection scenario; and BES is balanced ecology-economy scenario (Upward-pointing arrows denote increases in cultivated land area, Downward-pointing arrows indicate decreases in grassland area).
Land 14 00787 g011
Table 1. Climate characteristics of Tailan River Basin (TRB) study area. Meteorological indicator.
Characteristic Value
Annual Average Precipitation177.7 mm
Annual Average Evaporation2912 mm
Annual Average Temperature8.6 °C
Annual Average Wind Speed1.25 m/s
Table 2. Changes in SLUDD and CLUDD for different land-use types in Tailan River Basin (TRB) for 1980–2020 period.
IndicatorLand Category1980–19901990–20002000–20102010–20201980–2020
SLUDDCultivated land0.003.435.982.3116.43
Forest land0.036.48−8.40−0.03−7.36
Grassland0.04−1.38−1.34−1.81−3.87
Water bodies0.0033.52−0.71−0.1229.97
Built-up land0.22−1.777.435.0112.02
Unused land−0.07−0.681.29−0.070.37
CLUDD0.020.891.440.672.30
Table 3. Comprehensive degree of land use index for multi-scenario land use in Tailan River Basin (TRB) for period of 1980–2020.
YearDegree of Land Use Index
19801.81
19901.81
20001.88
20101.94
20202.02
Table 4. The accuracy of the PLUS model’s simulation for the validation period.
Simulation TimeOAKappaFOM
20200.900.850.25
20150.920.880.18
Disclaimer/Publisher’s Note: The statements, opinions and data contained in all publications are solely those of the individual author(s) and contributor(s) and not of MDPI and/or the editor(s). MDPI and/or the editor(s) disclaim responsibility for any injury to people or property resulting from any ideas, methods, instructions or products referred to in the content.

