Article

The Coupling Coordination Relationship Between Urbanization and Ecosystem Health in the Yellow River Basin: A Spatial Heterogeneity Perspective

1
College of Resources and Environment, Henan Agricultural University, Zhengzhou 450002, China
2
Henan Engineering Research Center of Land Consolidation and Ecological Restoration, Zhengzhou 450016, China
3
Postdoctoral Station of Crop Science, Henan Agricultural University, Zhengzhou 450002, China
4
School of Environment Science and Spatial Informatics, China University of Mining and Technology, Xuzhou 221116, China
*
Author to whom correspondence should be addressed.
Land 2025, 14(4), 801; https://doi.org/10.3390/land14040801
Submission received: 5 March 2025 / Revised: 1 April 2025 / Accepted: 2 April 2025 / Published: 8 April 2025

Abstract

:
Understanding the socioecological nexus between urbanization and ecosystem health (EH) is crucial for formulating sustainable development policies. While prior research has focused on this topic, critical gaps persist in characterizing distributional polarization and decomposing inequality drivers within coupled human–environment systems—particularly in China’s Yellow River Basin (YRB), a strategic region undergoing concurrent ecological restoration and urbanization. The integration of the kernel density estimation and Theil index establishes a robust analytical framework to effectively overcome spatial heterogeneity limitations in regional disparity research. Therefore, this study combines the coupling coordination degree (CCD), nonparametric kernel density estimation, and Theil decomposition to examine the complex interactions between urbanization and the ecosystem health index (EHI) across 538 county-level units from the perspective of spatial heterogeneity. The key findings reveal the following: (1) Urbanization exhibited phased enhancement yet maintained elementary developmental stages overall, with a distinct spatial gradient descending from the eastern/central riparian counties to the western hinterlands. (2) The EHI showed a marginal upward trend, yet 80.29% of the counties persisted in the suboptimal ecological health categories (EHI-1 to EHI-3), with gains concentrated in high-vegetation mountainous areas (45.72%) versus declines in economically developed areas. (3) The CCD evolved from a mild imbalance (II-1) to low coordination (III-1) but with significant special differences—the midstream and downstream CCD improved markedly, while the upstream counties remained the weakest. (4) Intragroup disparities, particularly among the counties in the middle reaches, were the primary drivers of CCD disequilibrium across the YRB, contributing 87.9% to the overall inequality. In contrast, the downstream regions exhibited significant improvements in the coordination levels, accompanied by the emergence of distinct “multi-polarization” patterns. The findings provide refined and differentiated decision-making references for effectively narrowing the gap in coordinated development in the YRB.

1. Introduction

Against the backdrop of rapid global urbanization, the intricate relationship between urbanization and ecosystems has emerged as a critical area of interdisciplinary research and policy-making [1,2,3,4]. Urbanization, as a central driver of socioeconomic development, has catalyzed population agglomeration, industrial restructuring, and the extensive construction of infrastructure, thereby significantly elevating human living standards and fostering economic prosperity [5,6,7]. However, this transformative process has also imposed profound and multifaceted impacts on the structural reorganization and functional alteration of ecological processes. For instance, population agglomeration and industrialization increase the demand for ecosystem products (e.g., food and water) and waste generation [3,4]. Excessive groundwater extraction, driven by industrial and domestic water use, combined with external water diversion and hydrological infrastructure development, disrupts hydrological cycles. Urban sprawl encroaches on wetlands, forests, and farmlands, altering the ecosystem composition and compromising supporting and regulating services [8,9,10,11]. Ecosystem health, in turn, either facilitates or constrains urbanization [12,13]. Healthy ecosystems provide critical urban resources (e.g., arable land, potable water, and clean air) and enhance livability through aesthetic and recreational values [9]. Conversely, ecosystem degradation reduces environmental quality, diminishes regional competitiveness, and increases disaster risks [10], thereby impeding sustainable urban development.
In response to these pressing issues, a growing body of research has focused on unraveling the complex interplay between urbanization and eco-environmental systems to inform practical strategies for mitigating development conflicts. Scholars have employed diverse methodologies, including spatial analysis, ecosystem service valuation, and coupled human–environment systems modeling, to investigate this relationship across national, provincial, and municipal scales. For example, urban expansion can degrade essential ecosystem services and cause biodiversity loss [14] and induce a negative impact on the local ecosystem health and land spatial layout in developed city areas [15]. Whereas, in some large areas (e.g., provincial scales), although significant negative spatial correlations have occurred between natural ecosystems and urbanization, these correlations have diminished over time [16]. Moreover, Theodorou et al. [17] also demonstrated the dual impacts of urbanization on the diversity of flying insects and the potential enhancement of pollination services. Currently, with the rapid development of 3S technology (remote sensing, Geographic Information Systems, and Global Positioning Systems), scholars have increasingly utilized high-resolution visualization techniques (e.g., digital imagery and nighttime light data) to explore the interactive coupling effects of natural ecosystems and urbanization at micro-grid spatial levels [18,19], which provides valuable insights into the fine-grained dynamics of human–environment interactions, enabling more precise assessments of ecological impacts and urban growth patterns. For example, Xiong and Yang [4] integrated remote sensing data, GDP statistics, and population density metrics to reveal the spatiotemporal evolution characteristics of human activity intensity and natural ecosystems in the middle reaches of Yangtze River urban agglomerations. As the basic administrative unit for policy implementation in China, counties serve a pivotal role in translating national strategic frameworks—notably, the Rural Revitalization Strategy and the Ecological Conservation Redline Policy—into localized governance mechanisms. This granular scale of analysis enables the detection of critical spatial heterogeneities in land use intensity, industrial layout, and ecosystem resilience that are often obscured in provincial/municipal-level assessments. Empirical evidence from northwest China’s ecologically fragile zones demonstrates distinct trade-offs between land use and water resource conservation [9]. Moreover, socioeconomic drivers exert significant negative impacts on ecosystem resilience and stability [10], whereas research on the provincial scale has severely weakened these negative spatial correlations, and has even diminished them over time [16]. These findings underscore the necessity for context-specific governance frameworks that calibrate county urbanization pathways with ecological carrying capacities. However, an in-depth analysis of subsystem interactions at the county level remains inadequately addressed [20,21]. Furthermore, although the coupling coordination degree (CCD), system dynamics model, and linear regression analysis have been used to assess urbanization–ecosystem alignment, prevailing applications oversimplify interaction mechanisms through equilibrium assumptions, failing to capture complex spatiotemporal patterns of subsystem interactions. This limitation hinders the development of targeted policies to reconcile ecological conservation with sustainable urban development [21,22,23,24].
Ecosystem health (EH), a comprehensive framework that integrates ecological integrity, resilience, and the sustainability of ecosystem services, has emerged as a pivotal tool for assessing the functionality and stability of ecosystems under intensifying anthropogenic pressures [25,26,27]. Recent research has increasingly emphasized the importance of quantifying ecosystem health to guide sustainable management practices, particularly in regions experiencing rapid urbanization and environmental degradation [4,7,11,12,28,29,30]. Widely used assessment methods and indicator systems for EH include the PSR (Pressure–State–Response) model and its extensions, such as the DPSR (Driving–Pressure–State–Response), DPSIR (Driver–Pressure–State–Impact–Response), and DFSR (Driving–Force–State–Response) models, as well as alternative approaches like VOR (Vigor–Organization–Resilience), VORS (Vigor–Organization–Resilience–Services), and MBSR (Maintain–Bearing–Service–Resilience). These frameworks have significantly advanced the conceptual understanding of ecosystem health and provided critical insights for the maintenance and restoration of specific ecosystems. However, these methods often exhibit limitations: they either overly emphasize human–environment interactions (e.g., PSR, DPSR, and DFSR), thereby failing to fully capture the ecological integrity and health status of natural ecosystems [31], or they focus excessively on the natural characteristics of ecosystems (e.g., VOR), neglecting the diverse services ecosystems provide to humans from a human–ecosystem interaction perspective [32,33]. The VORS model addresses these shortcomings by integrating both the natural aspects of the environment and its capacity to meet legitimate human needs through the inclusion of ecosystem services as a distinct dimension [34,35]. Furthermore, given that specific landscape types can exert either positive or negative spillover effects on adjacent ecosystems, incorporating spatial adjacency effects is critical for achieving a more precise and comprehensive quantification of ecosystem health [32,36,37].
Against this backdrop, this study aims to address the critical need for understanding the coupling coordination between ecosystem health and urbanization in the Yellow River Basin (YRB), a region of strategic importance for China’s ecological security and high-quality development. By focusing on the county scale, this research provides a granular perspective on the spatial heterogeneity and driving mechanisms of ecosystem health–urbanization interactions. This study’s innovation lies in its integration of multi-source data and advanced spatial analysis techniques to (1) evaluate the spatiotemporal evolution characteristics of ecosystem health and urbanization at the county level; (2) quantify the coupling coordination degree (CCD) between these two systems; and (3) identify the sources and evolutionary trajectories of spatial disparities in ecosystem health–urbanization coordination across the YRB. These contributions not only advance the theoretical understanding of ecosystem health–urbanization interactions but also identify leverage points for policy intervention, offering actionable insights for achieving sustainable urbanization in ecologically fragile regions.

2. Study Area and Data Sources
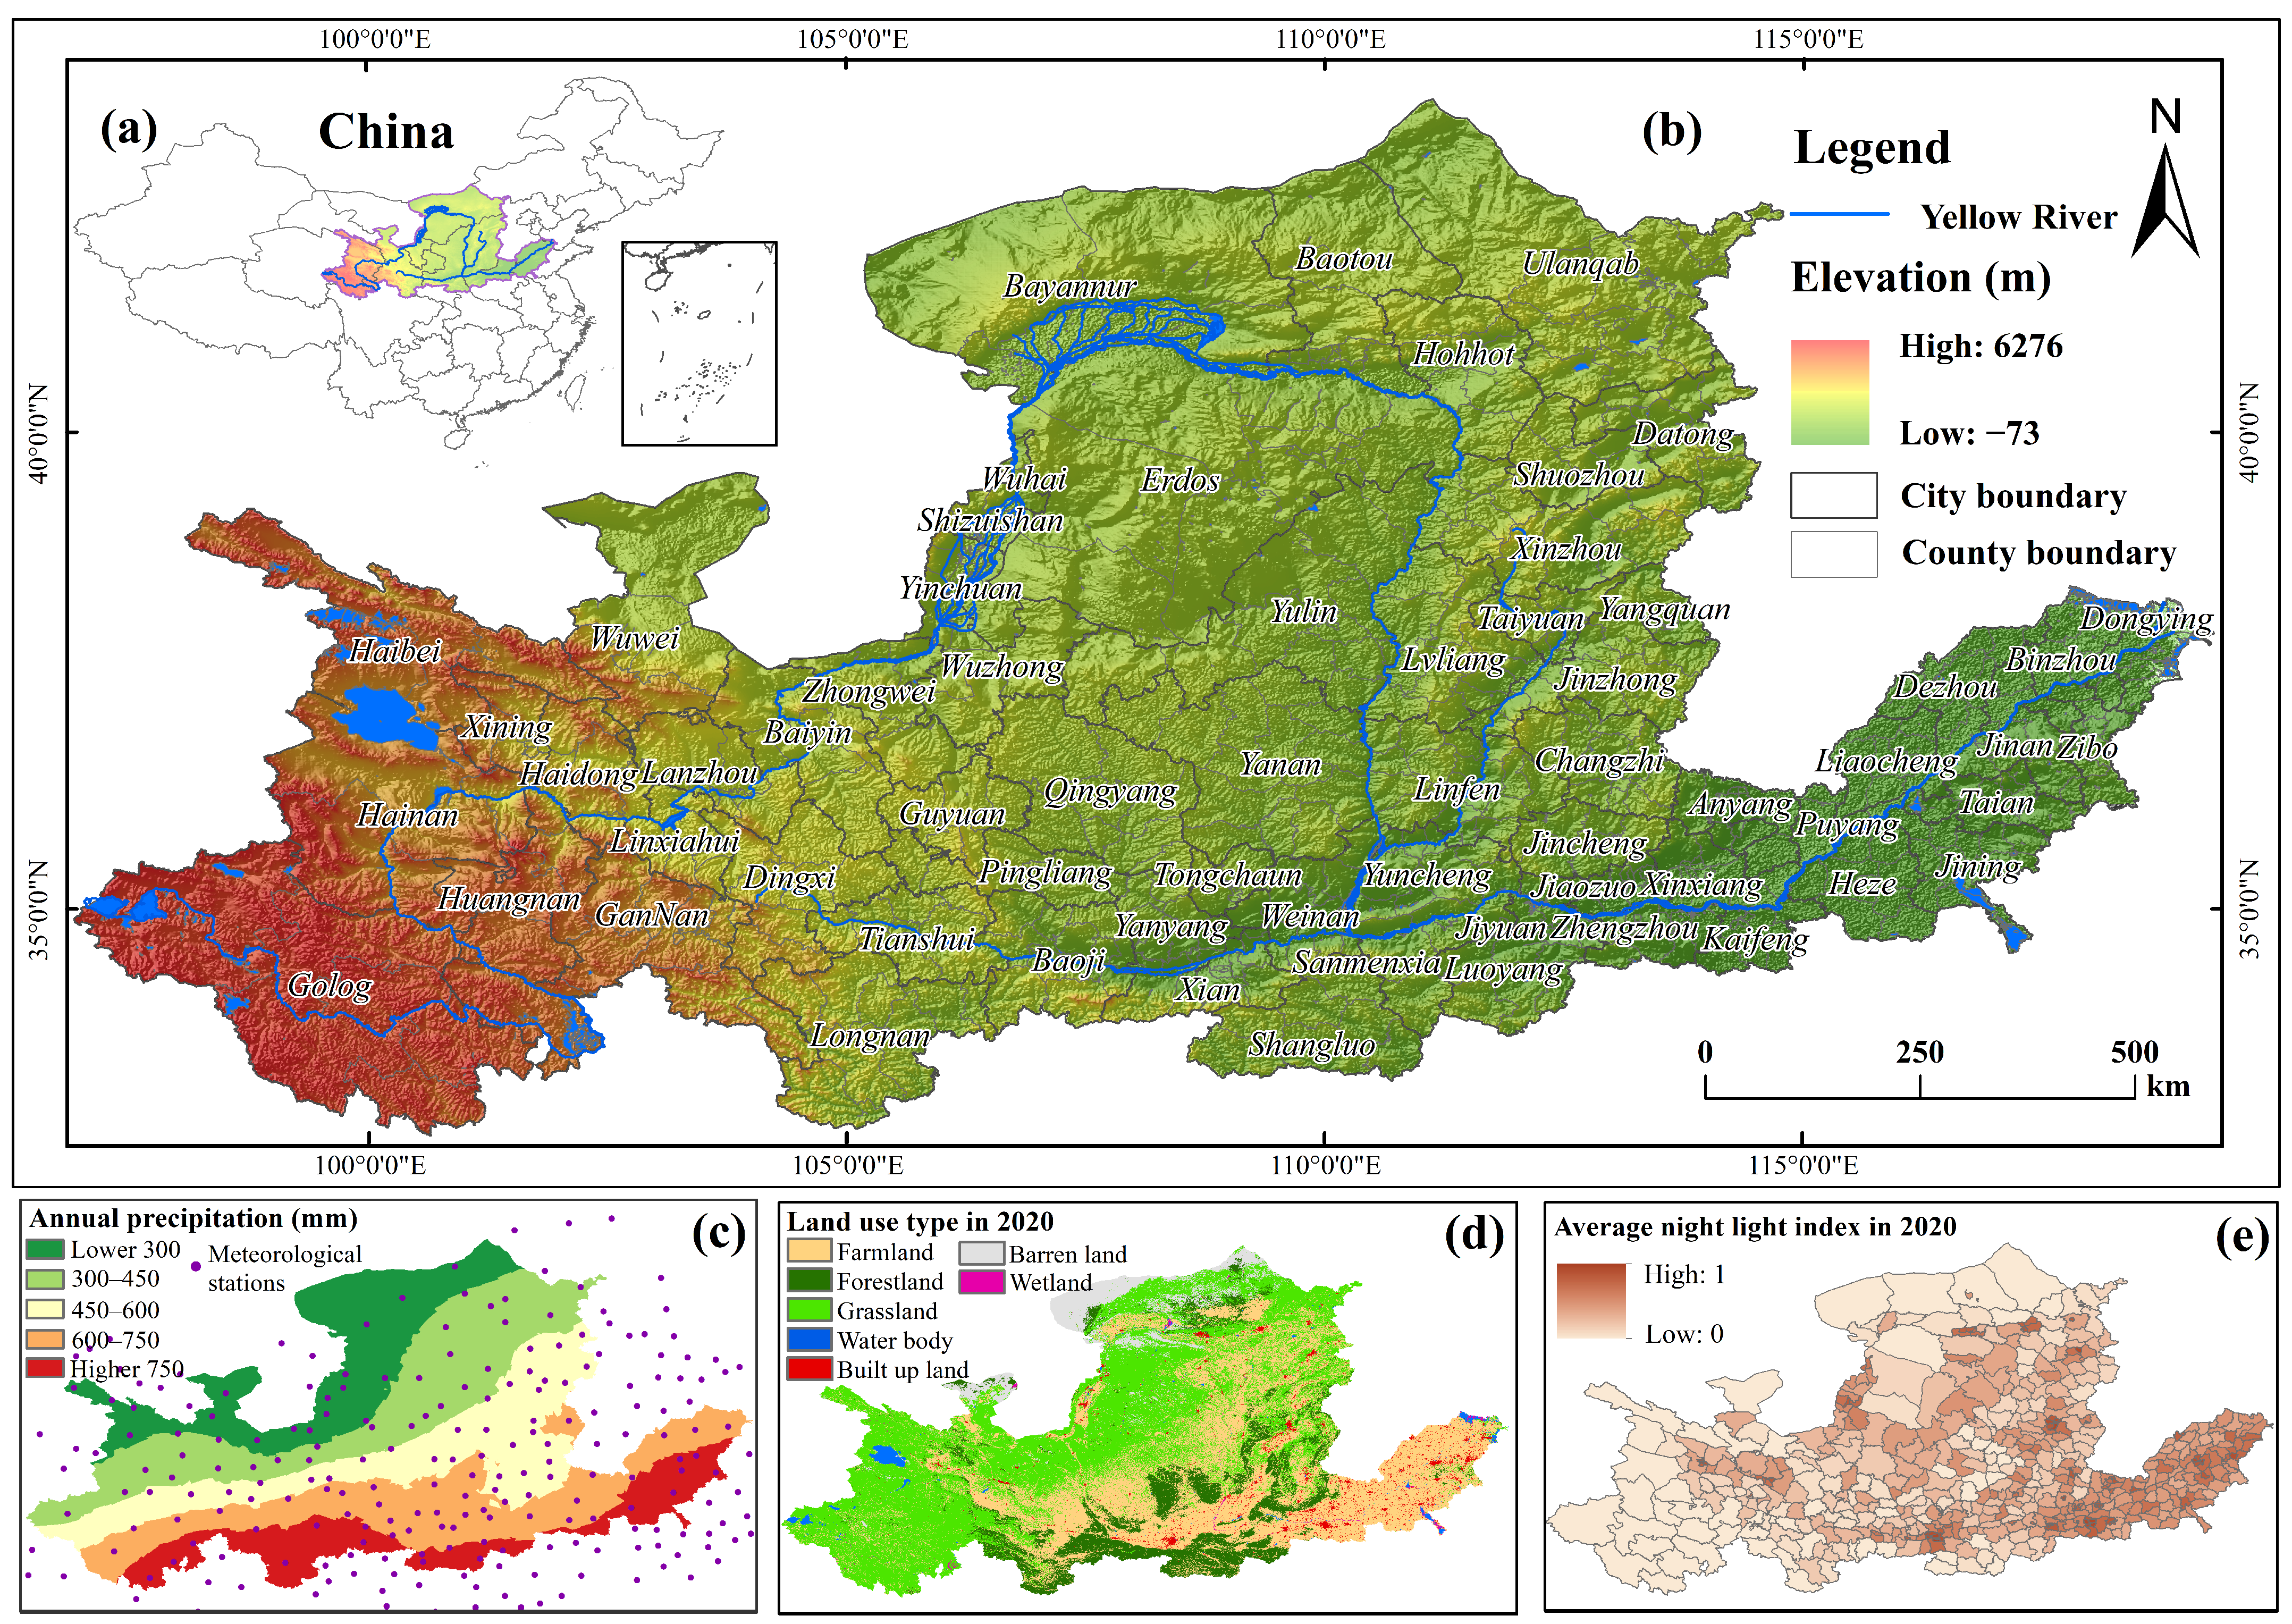
2.1. Study Area

Considering the natural boundary delineated by the Yellow River Conservancy Commission and the administrative integrity of county-level units within the YRB, the study area, as illustrated in Figure 1, encompasses 538 counties across 65 cities located within the YRB catchment (32°35′–43°25′ N, 96°55′–119°16′ E). The YRB spans approximately 5464 km and traverses three distinct ladder-shaped topographic regions of China, forming a geographically complex basin characterized by diverse climatic conditions, uneven socioeconomic development, and high ecological vulnerability. Since the 1950s, the YRB has experienced remarkable economic growth, accelerating notably after 2000. In 2000, its GDP amounted to CNY 644.37 billion, contributing 6.36% of China’s national GDP (CNY 10.13 trillion) and 6.57% of the Yangtze River Basin’s GDP (CNY 9.80 trillion). By 2020, the YRB’s GDP surged to CNY 25.39 trillion, capturing 24.53% of China’s total GDP (CNY 103.49 trillion) and 51.74% of the Yangtze River Basin’s output (CNY 49.08 trillion), marking a 39-fold nominal expansion over two decades. However, this rapid development has also been accompanied by a range of environmental challenges [38,39,40]. Furthermore, the natural conditions and socioeconomic development levels vary markedly across the upper, middle, and lower reaches of the YRB. For instance, the upper and middle reaches include numerous poverty-stricken areas and ecologically fragile zones, while the lower reaches, characterized by a flat terrain, moderate climate, and well-developed irrigation systems, are home to critical grain-producing regions, highly developed urban centers, and densely populated areas [3,41]. Given its role as a region with complex climatic conditions, a vital ecological barrier, and a hub for economic and population aggregation in China, it is imperative to investigate the health status of its ecosystems, the evolution of urbanization, and their intricate interactions. Such research is essential for formulating targeted ecological regulation strategies and promoting ecosystem conservation alongside high-quality economic development.

2.2. Data Sources and Processing

In this study, a comprehensive array of multi-source datasets was utilized, including administrative boundaries, land use/land cover (LULC) data, climate data (encompassing potential evapotranspiration, annual precipitation, annual temperature, annual sunshine hours, annual humidity, and wind speed), topographic data (elevation and slope), normalized difference vegetation index (NDVI), and soil data, as summarized in Table 1. Socioeconomic statistical data, including grain production, urban population, per capita GDP, the proportion of secondary and tertiary industry outputs in GDP, and total investment in fixed assets, were extracted from county-level, city-level, and provincial-level Statistical Yearbooks covering the YRB in China. Nighttime light remote sensing images for 2000, 2005, and 2010 were sourced from the Defense Meteorological Satellite Program/Operational Line Scan System (DMSP/OLS), while images for 2015 and 2020 were obtained from the National Polar-orbiting Partnership/Visible Infrared Imaging Radiometer Suite (NPP/VIIRS). Therefore, prior to calculation, DMSP-OLS and NPP-VIIRS data were preprocessed through calibration, data integration, and continuity correction (p < 0.001, R2 = 0.957). Finally, to ensure consistency, all raster data were resampled to a uniform spatial resolution of 1 km using ArcGIS 10.8 and subsequently averaged at the prefecture level before being integrated into the assessment model.

3. Materials and Methods

Figure 2 presents the research framework used for the coupling cooperation of urbanization and ecosystem health across 538 county-level units within the Yellow River Basin, encompassing three aspects:
(1) Spatiotemporal evolution characteristics of ecosystem health: Remote sensing image interpretation, Fragstats landscape index extraction, InVEST (Integrated Valuation of Ecosystem Services and Tradeoffs) model computations, and ArcGIS spatial analysis were employed to construct a VORS (Vigor–Organization–Resilience–Services) evaluation framework and to further accurately analyze spatiotemporal evolution characteristics of ecosystem health in the YRB.
(2) Spatiotemporal evolution patterns of county-level urbanization: A multidimensional framework encompassing economic, spatial, and population urbanization was constructed to systematically investigate urbanization patterns across 538 county-level units within the YRB by integrating nighttime light remote sensing data, land use/land cover data, and socioeconomic data.
(3) Interaction mechanism between urbanization and ecosystem health: A coupling coordination degree model, nonparametric kernel density estimation, and Theil decomposition were introduced to clarify the interaction mechanisms between urbanization and ecosystem health in the YRB over the past two decades and to further explore the influence mechanisms and evolutionary patterns between these two subsystems from a spatial heterogeneity perspective.

3.1. Measurement of EHI

Ecosystem health refers to the capacity of ecosystems to maintain self-regulatory mechanisms, preserve their organizational structure, recover from external disturbances, and ensure the sustainable provision of ecosystem services [25,26]. In this paper, the improved Vigor–Organization–Resilience–Services (VORS) framework was adopted to systematically evaluate and integrate the subsystems contributing to the overall ecosystem health index (EHI) of the YRB. The detailed calculations of the ecosystem health indicators are shown in Table 2. Furthermore, considering that specific landscape types may exert either positive or negative influences on ecosystem service provision when adjacent to other landscape types [42], the spatial adjacency effect coefficient (SAEC) of ecosystem services was incorporated for different landscape types. This coefficient was derived from an expert-scored matrix [36,37], as detailed in Table S1. This approach enables a more nuanced understanding of how landscape adjacency influences ecosystem service provision and supports the identification of spatial patterns that either enhance or hinder ecosystem health. The VORS model can be mathematically expressed as follows:
E H I = E V × E O × E R × E S 4
where EV represents ecosystem vigor. EO represents ecosystem organization. ER represents ecosystem resilience. ES represents ecosystem services. Detailed calculation results of EV, EO, ER, and ES are shown in Figures S1–S9.

3.2. County Urbanization Assessment

Urbanization is a multifaceted process, typically characterized by the migration of populations from rural to urban areas (demographic urbanization), economic growth coupled with industrial structure optimization (economic urbanization), and the expansion of urban spatial scales (spatial urbanization). Specifically, the escalating population density intensifies the demand for ecosystem goods and services [27], exerting excessive pressure on ecological systems. Furthermore, urban expansion and associated land use modifications—driven by urbanization and the resource demands of growing urban populations—act as critical catalysts for multifaceted environmental transformations [12,13,47,48]. Concurrently, rapid economic development accelerates the depletion of natural capital (e.g., water, minerals, and biomass), while imposing unsustainable stress on ecosystem integrity through overexploitation and habitat fragmentation [23]. In addition, given that the study area encompasses 538 county-level units, there is a notable scarcity of long-term statistical data. Nighttime light remote sensing data have been empirically demonstrated to exhibit a strong correlation with human activities and urban spatial expansion [49,50], making it a robust proxy for tracking urbanization progress. Based on the above analysis, this study selected the urban population density and the percentage of the urban population as population urbanization indicators; the per capita GDP, proportion of secondary industry output in GDP, proportion of tertiary industry output in GDP, and total investment in fixed assets as economic urbanization indicators; and the percentage of construction land area and average nighttime light index as spatial urbanization indicators, as shown in Table 2. To ensure comparability across indicators with differing units, all data were standardized using the minimum-maximum normalization method. Then, the entropy method—a robust objective weighting technique that determines index weights through information entropy quantification based on inter-indicator data variability [51]—was utilized to establish indicator-specific weights. Subsequently, the linear weighted aggregation approach was systematically implemented to calculate the composite urbanization index and its constituent subsystem indices.

3.3. Coupling Coordination Model

The concepts of coupling and coordination are employed to analyze the degree of interaction and synergies between subsystems within a complex system. Coupling quantifies the extent of interdependence and mutual constraints among different subsystems, while coordination evaluates the degree of harmonious and balanced interaction between them [52]. Furthermore, the coordination degree addresses a critical limitation of coupling analysis by preventing scenarios where both the socioeconomic development and the ecological environment system are relatively low, yet the coupling degree appears high. This is achieved by assessing the relative performance and quality of each subsystem. Consequently, the coupling coordination model is utilized in this study to measure the interactive relationship and collaborative development trends between urbanization and ecosystem health. The mathematical formulation of the model is as follows:
C = 2 U ( x ) U ( y ) U ( x ) + U ( y ) 2 1 / 2
T = α U ( x ) + β U ( y ) = α j = 1 n f i j W i + β E H I
C C D = C × T
where C represents the coupling degree, which ranges from 0 to 1. A greater C indicates a stronger interdependence between systems, whereas a lower value suggests a weaker interactive relationship. The variables U ( x ) and U ( y ) denote urbanization index and ecosystem health index, respectively, for each county within the YRB. The term T represents the comprehensive coordination index, reflecting the overall development level of the two elements. The coefficients α and β signify the relative importance of two subsystems. Given that urbanization and ecological environment are considered equally significant, the weights α and β are assigned to 0.5 [8,53]. The coupling coordination degree (CCD) quantifies the level of synergy between the systems, with CCD∈[0, 1]. A higher CCD value indicates a more harmonious and synergistic relationship among the systems during their development process. Finally, referring to the existing literature [12,52,53], the CCD outputs are categorized into ten distinct intervals to reflect varying levels of coupling coordination, as detailed in Table 3.

3.4. Nonparametric Kernel Density Estimation

Kernel density estimation (KDE) is a nonparametric estimation method widely utilized to visualize the spatial disequilibrium distribution of continuous variables. Unlike parametric approaches, KDE does not rely on predefined model assumptions or prior distributions but instead derives the probability density function directly from the inherent characteristics and properties of the dataset. This flexibility enables KDE to provide a more accurate and robust representation of data distributions compared to conventional parametric estimation methods [54]. Therefore, in this study, nonparametric kernel density estimation is employed to characterize the distributional dynamics of the coupling coordination degree (CCD) within the YRB, and to identify the spatiotemporal distribution dynamics and polarization phenomena in coordinated development by analyzing positional shifts, morphological evolution, and extensibility patterns visualized in kernel density plots.
Supposing x 1 , x 2 , x n is an n-sample sequence denoting coupling coordination degree, the probability density function f ( x ) of random variables x can be expressed as follows:
f ( x ) = 1 N h i = 1 N K ( x i x h )
K x x i h = 1 2 π exp 1 2 x x i h 2
where f(x) is kernel density function. x is the mean value. n is the number of observations. xi is the random variable. K(·) is the kernel function. h is the bandwidth used to control the smoothness level. This paper adopts the optimal bandwidth expression proposed by Silverman [55] ( h = 1.06     S e × N 1 / 5 ) to determine this value (h = 0.05).

3.5. Theil Decomposition Method

The Theil decomposition method, put forward by Theil in 1967 [56], is a robust analytical framework for quantifying economic or social disparities among individuals or regions. This model is distinguished by its properties of additivity and decomposability, leveraging the concept of “entropy” from information theory to systematically examine inter-regional and intra-regional disparities and assess their respective contributions to overall inequality [57]. In this study, the one-stage Theil decomposition method is employed to evaluate the spatial distribution differences in the CCD and their contributions to the overall disparities across the YRB. Furthermore, given that anthropogenic production and development activities are the predominant factors influencing ecosystem health [32], the population weight of each county is selected as the weighting factor to construct the Theil index. The mathematical formulation of the Theil index is expressed as follows:
T = T B + T W
T B = Y S Y ln Y S / Y P S / P + Y M Y ln Y M / Y P M / P + Y N Y ln Y N / Y P N / P
T W = Y S Y T S + Y M Y T M + Y N Y T N
T S = i = 1 s Y i Y S ln Y i / Y S P i / P S ,       s = 151
T M = i = 1 m Y i Y M ln Y i / Y M P i / P M ,       m = 257
T N = i = 1 n Y i Y N ln Y i / Y N P i / P N ,       n = 130
where T denotes the Theil index, and the larger the value, the greater is the difference. TB and TW are the inter-regional and intra-regional differences in CCD. TS, TM, and TN represent differences in the upper, middle, and lower reaches, respectively. Yi is the CCD of county i; Pi is the population of county i; YS, YM, and YN are the sums of upstream, midstream, and downstream coupling coordination degrees, respectively. PS, PM, and PN are the total populations of upstream, midstream, and downstream, respectively; Y is the sum of coupling coordination degree of 538 counties within the YRB; P is the sum of population; s, m, and n are the numbers of counties in the upper, middle, and lower reaches of the YRB, respectively, where s = 151, m = 257, and n = 130.
To further investigate the extent to which inter-regional and intra-regional differences contribute to overall disparities in the YRB, Equation (12) is used to calculate the contribution ratios of the T.
T T = T B T + Y S / Y T S T + Y M / Y T M T + Y N / Y T N T
where T B T represents the contribution rate of inter-regional differences to the overall differences. Y S / Y T S T , and Y N / Y T N T respectively represent the contribution rates of inner differences in the upper, middle, and lower reaches to the overall Thiel index, respectively.

4. Results

4.1. County Urbanization

Figure 3 depicts the spatiotemporal evolution of the urbanization level at the prefectural scale within the YRB from 2000 to 2020. To facilitate a comparative analysis of the urbanization levels across different stages and ensure methodological objectivity, the evaluation results were classified into five distinct levels using the natural breaks (Jenks) method in ArcGIS: low level (less than 0.104), relatively low level (0.104–0.215), medium level (0.215–0.488), relatively high level (0.488–0.697) and high level (greater than 0.697).
The findings reveal a pronounced upward trend in county-level urbanization across the study period, albeit with significant variations across four distinct stages. From 2000 to 2010, the urbanization level in the YRB experienced accelerated growth, driven by rapid economic development and the expansion of urban spaces. However, during the subsequent two periods (2010–2015 and 2015–2020), the pace of urbanization decelerated markedly, with the urbanization index increasing by only 0.004 over the decade, equivalent to 17.39% of the growth observed between 2000 and 2010. During this phase, while population and spatial urbanization continued to expand, the economic disparities between counties widened significantly, leading to a slower overall improvement in urbanization levels.
Spatially, counties with relatively high and high urbanization levels were predominantly concentrated in Jinan, Tai’an, and Zibo in Shandong Province; Zhengzhou, Jiyuan, Jiaozuo, Xinxiang, and Anyang in Henan Province; counties along the Fenhe and Weihe rivers; and Ordos City. In contrast, counties with relatively low and low urbanization levels were primarily located in the upper reaches of the YRB, such as Qinghai Province and Gansu Province, where the urbanization levels exhibited minimal spatial variation and generally remained in a state of low-level equilibrium. Additionally, counties in the middle reaches that were distant from provincial capital cities also displayed low urbanization levels.
Figure 3f presents the changes in the urbanization index across 538 counties over the study period. The results indicate that 17.84% of the counties within the YRB experienced a significant increase in urbanization levels, 57.44% exhibited a slight increase, and 24.72% remained relatively stable between 2000 and 2020. Spatially, the fastest-growing counties were predominantly clustered around Zhengzhou, Jinan, Taiyuan, Xi’an, Ordos, and their adjacent areas. Notably, Yanta District and Weiyang District in Xi’an recorded the most substantial growth, with urbanization indices increasing by 0.403 and 0.257, respectively. Conversely, counties with the least improvement were mainly located in the upper and middle reaches of the YRB, with Gande County, Dari County, and Bama County in Qinghai Province, as well as Zhengning County, Lingtai County, and Kangle County in Gansu Province, exhibiting the lowest growth rates. Furthermore, over the past five years, a slight decline in urbanization indices has been observed in Ordos and Baotou (Inner Mongolia), Yuncheng and Linfen (Shanxi Province), and Baoji and Yulin (Shaanxi Province), primarily due to the decline in economic urbanization. In recent years, with the advancement of the national supply-side structural reform, the role of traditional energy advantages in promoting the economy has gradually decreased, coupled with the lagging pace of industrial transformation and upgrading, which results in insufficient internal impetus for economic growth, especially in some resource-based counties such as those in Shaanxi and Shanxi.

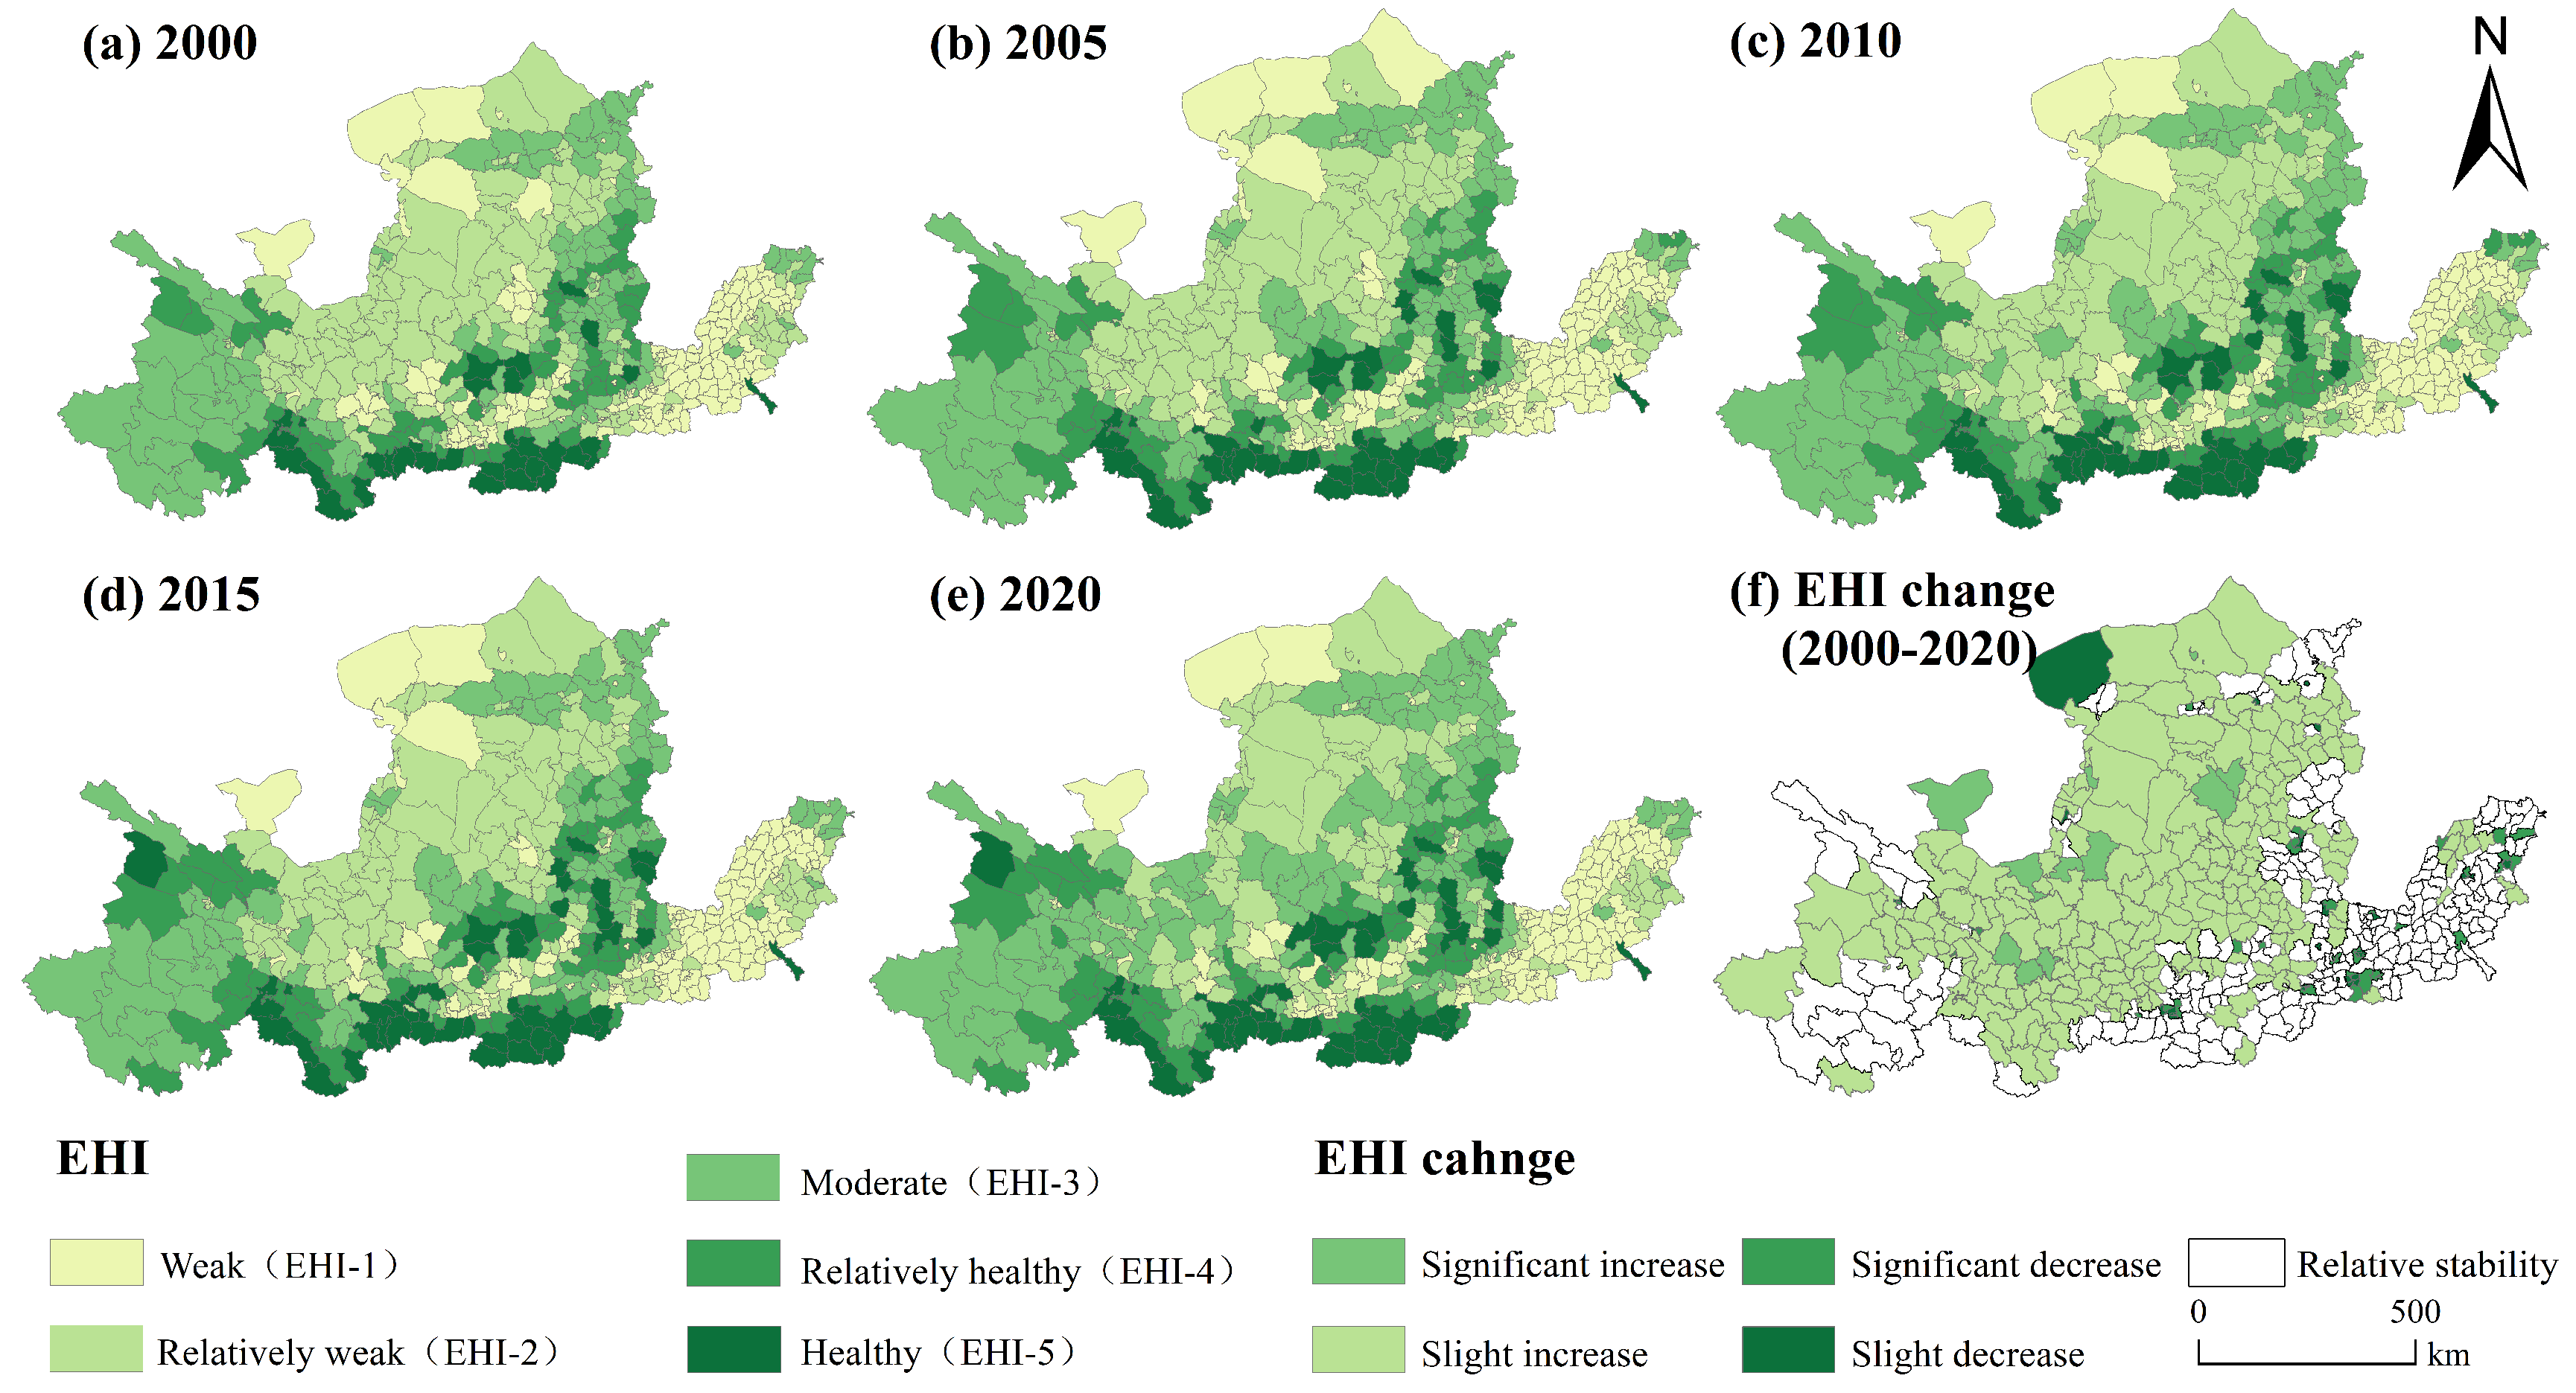
4.2. Ecosystem Health Analysis

To systematically analyze the spatiotemporal dynamics of ecosystem health within the Yellow River Basin (YRB), the ecosystem health index (EHI) was categorized into five distinct intervals: weak (0 < EHI ≤ 0.35, denoted as EHI-1), relatively weak (0.35 < EHI ≤ 0.45, EHI-2), moderate (0.45 < EHI ≤ 0.55, EHI-3), relatively healthy (0.55 < EHI ≤ 0.65, EHI-4), and healthy (0.65 < EHI, EHI-5). The analysis revealed that the majority of prefectures within the YRB exhibited EHI values predominantly within the weak to moderate ranges (EHI-1, EHI-2, and EHI-3), accounting for 29.55%, 24.35%, and 26.39% of the total prefectures in 2020, respectively. Conversely, the proportions of prefectures falling within the relatively healthy (EHI-4) and healthy (EHI-5) categories were markedly lower, representing only 11.34% and 8.36% of the total, respectively, as shown in Figure 4. The findings suggest that the overall ecosystem health status of the YRB remains suboptimal, warranting targeted interventions to address the prevailing ecological challenges.
In terms of spatial visualization, the EHI across the YRB exhibited pronounced spatial heterogeneity. Specifically, counties classified as EHI-4 and EHI-5 were predominantly located in mountainous and hilly regions, including the Qilian Mountains, Sanjiangyuan Nature Reserve, Yinshan Mountains, the northern foothills of the Qinling Mountains, Taihang Mountains, and Lvliang Mountains. These regions demonstrated a notable spatial expansion during the study period. Counties categorized as EHI-3 were primarily distributed in the peripheral areas adjacent to EHI-4 zones, displaying a consistent spatial pattern. In contrast, counties classified as EHI-1 and EHI-2 were concentrated in ecologically fragile regions with a low ecological carrying capacity, such as the Tengger Desert and Kubuqi Desert in the upper reaches, the Loess Plateau in the middle reaches (characterized by severe soil erosion and desertification), and urban centers within the Fenhe River Basin, Guanzhong Basin, and North China Plain.
From the perspective of temporal–spatial changes, the average EHI across the YRB exhibited a slight rise from 0.388 in 2000 to 0.411 in 2020, indicating a gradual improvement in the overall ecosystem health of the basin. Specifically, counties with an increased EHI accounted for 45.72% of the total basin area and were predominantly clustered in the central and northern regions of the YRB, particularly within the Sanjiangyuan Nature Reserve, central Ningxia, and the Loess Plateau. Conversely, counties with decreased EHI constituted 22.49% of the basin and were primarily scattered across economically developed areas in the middle and lower reaches, including the central urban areas of Xi’an City, Yangquan City, and Zhengzhou City, where the EHI declined by more than 50% from 2000 to 2020. A significant decline in the EHI was also observed in Urad Rear Banner, located in the upper reaches of Bayannur City, attributable to extreme drought conditions, limited precipitation, extensive desertification, and poor ecosystem resilience (Figure S9). Furthermore, deteriorating EHI trends were evident in economically developed urban districts, such as the Xiaodian District of Taiyuan City, Pingcheng District of Datong City, Laocheng District and Chanhe Hui District of Luoyang City, Zhangdian District of Zibo City, and Huaiyin District of Jinan City. These declines were largely driven by landscape fragmentation and the diminished capacity of ecosystem services resulting from the rapid expansion of urbanization. This phenomenon has further exacerbated the deterioration of counties’ EHI, thereby counteracting and overshadowing the positive trends observed in ecosystem organization (EO).

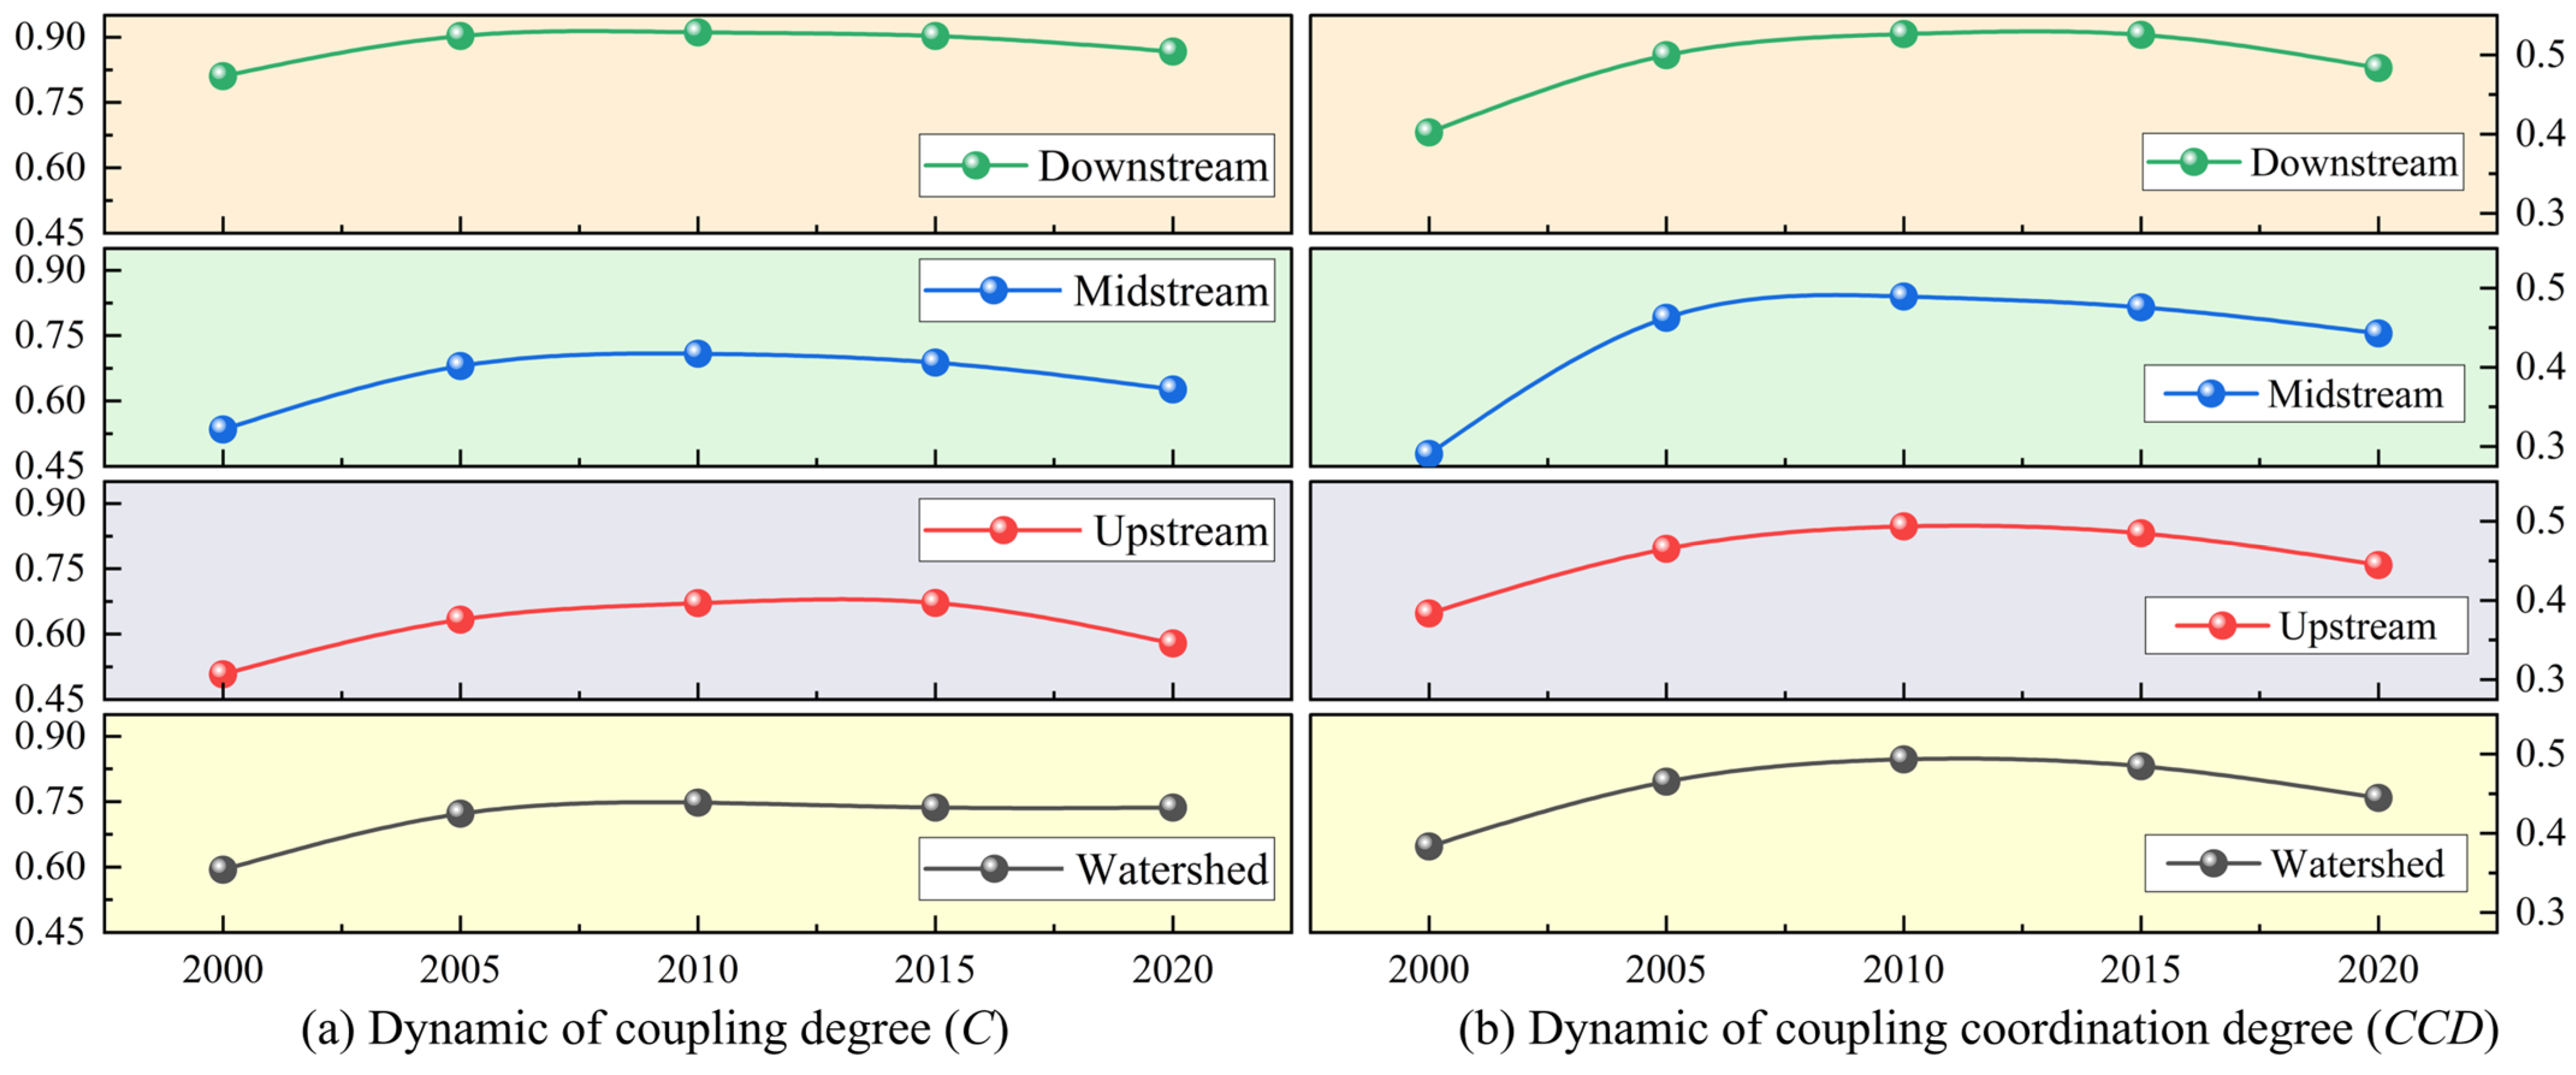
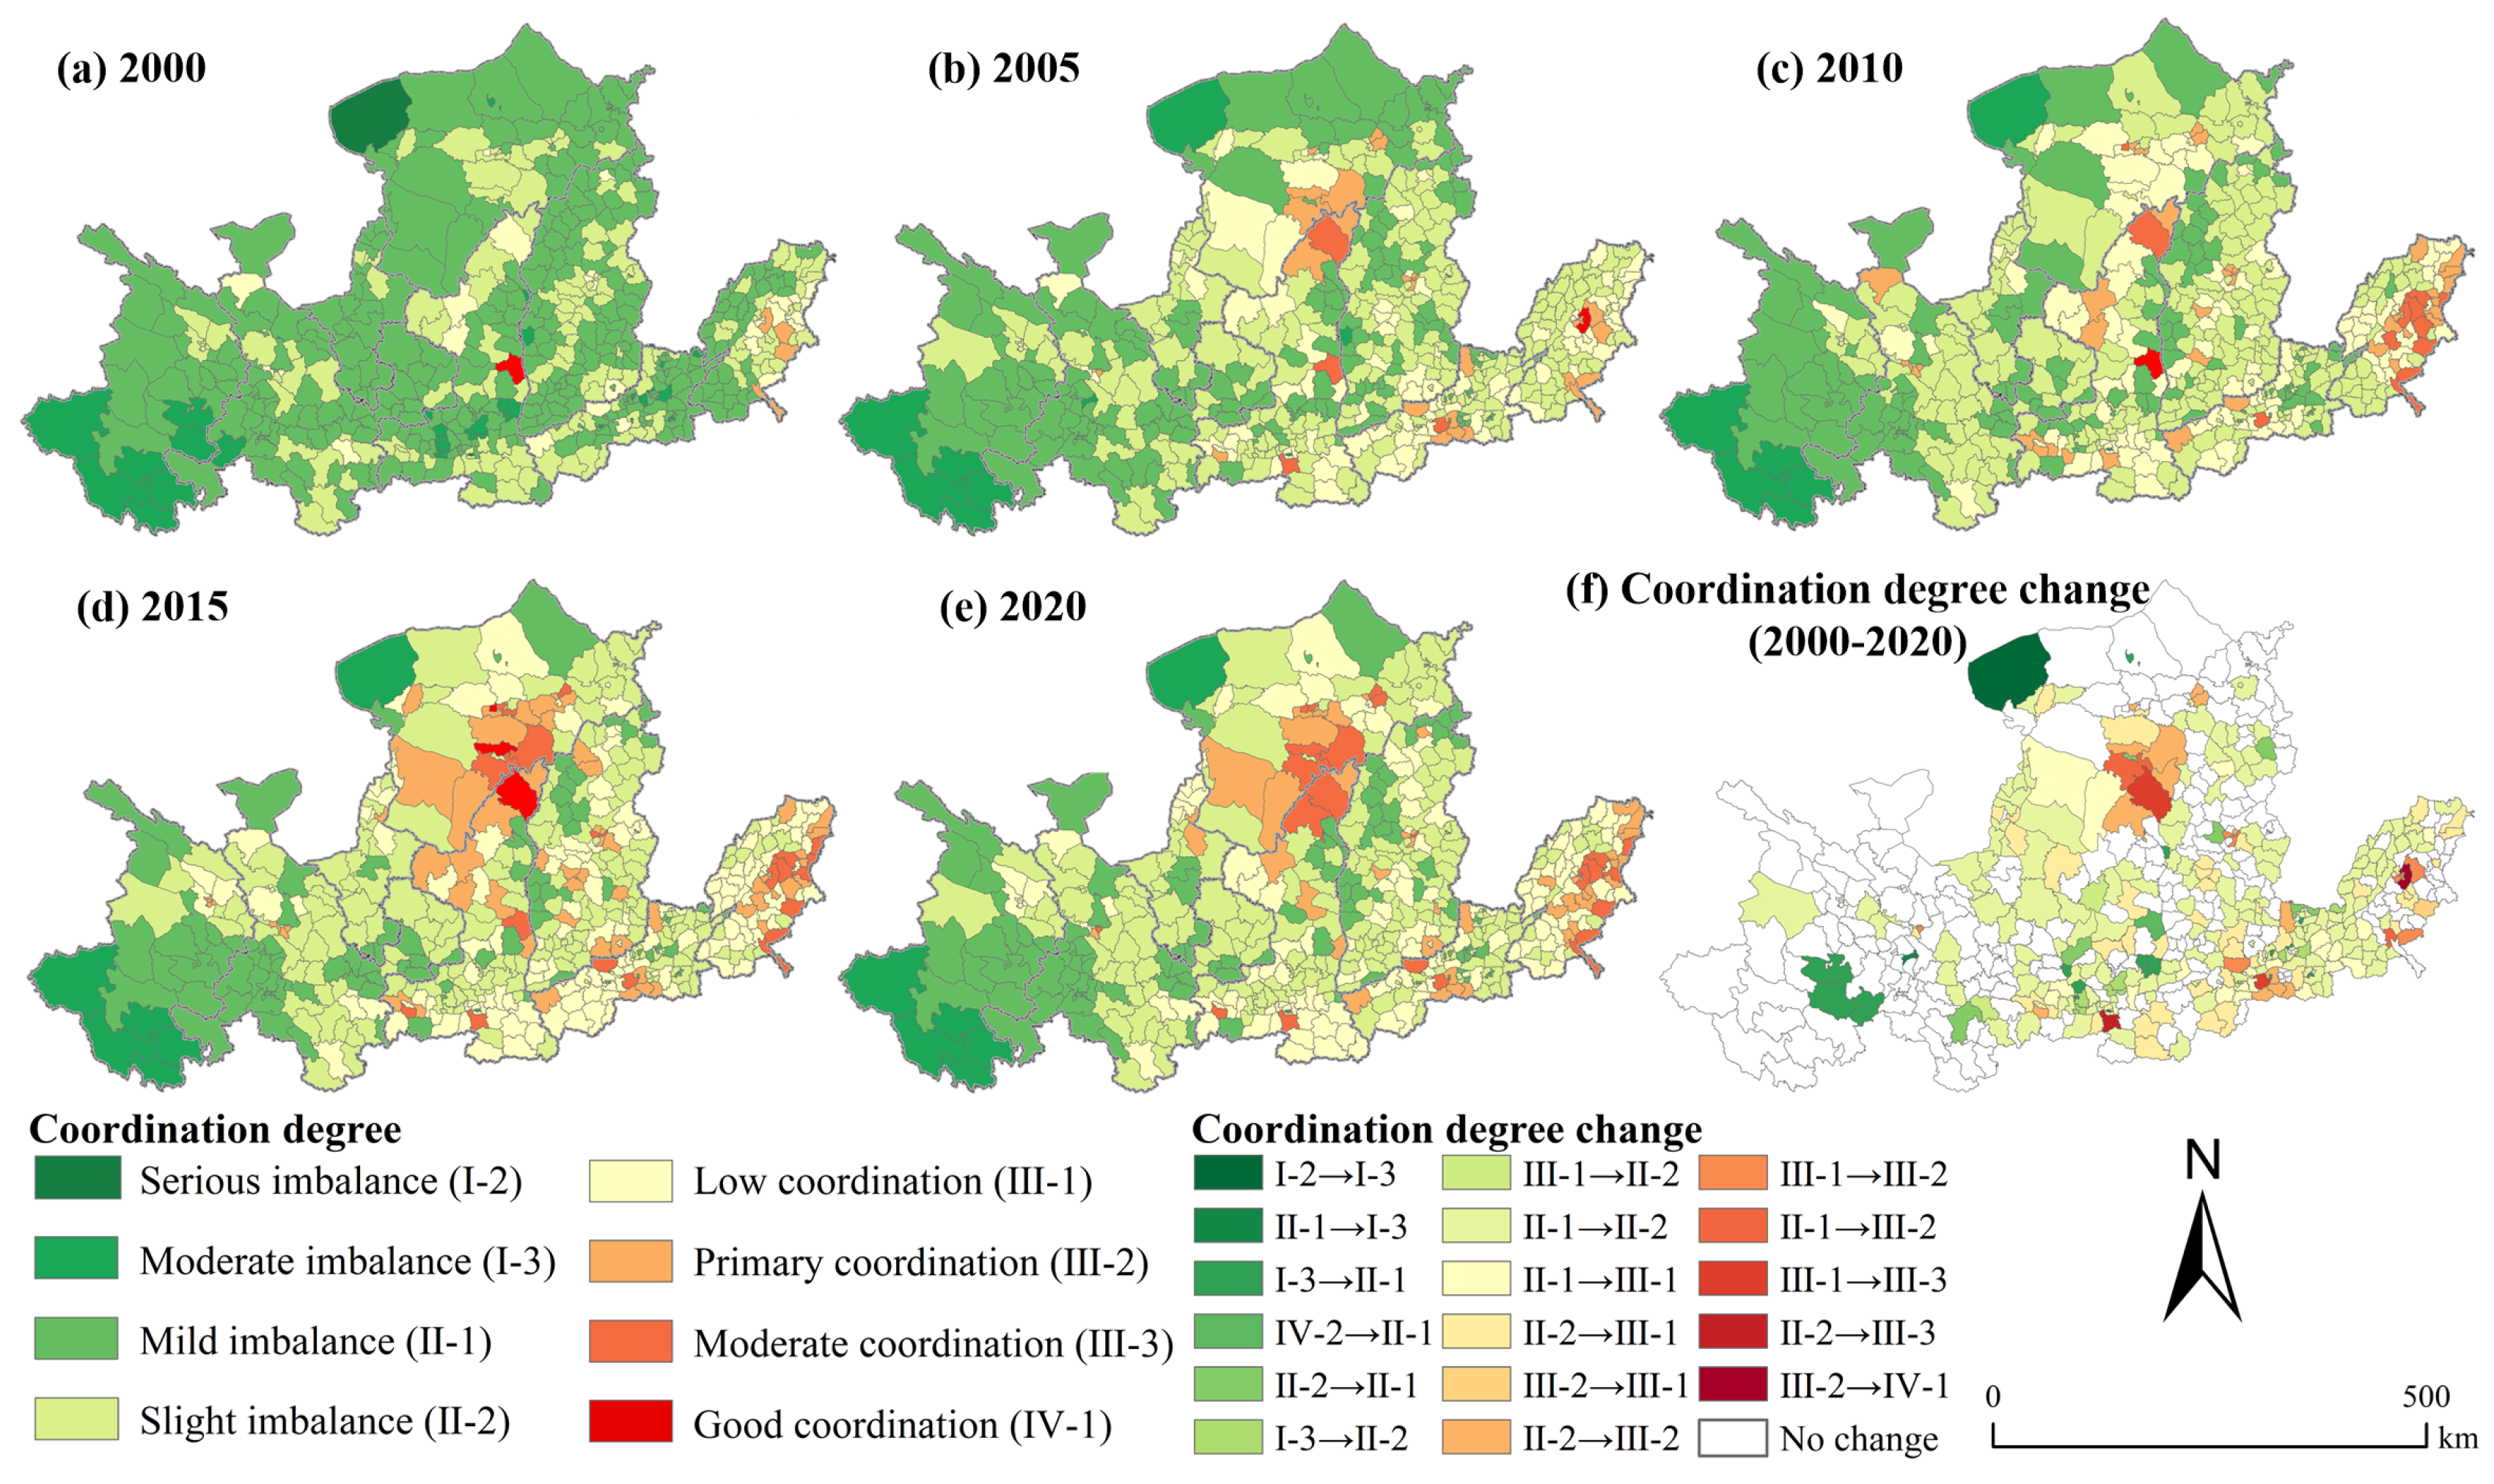
4.3. Coupling Coordination Effect Analysis

Figure 5 illustrates the evolution of the coupling degree (C) and coupling coordination degree (CCD) between the urbanization index and EHI in the YRB. It can be found that the average C and CCD increase from 0.5937 and 0.3836 in 2000 to 0.7364 and 0.4835 in 2020, with growth rates of 24.05% and 15.91%, respectively, presenting an evolutionary trend of C from the antagonism stage (II) to the mutual adaptation stage (III) (adjust to each other through feedback mechanisms), and that of the CCD from the mild imbalance (II-1) to the slight imbalance (II-2) and further to the low coordination (III-1). In terms of the curve characteristic, both C and CCD exhibited synchronous upward trends, with a particularly notable increase of 28.64% in the CCD between 2000 and 2010. This upward trajectory reflects a strengthened interaction between urbanization and natural ecosystems in the YRB, as well as enhanced internal synergy, driven by abundant energy resources and the implementation of a new round of western development policies. However, it is important to note that the CCD displayed a marked downward trend in the past five years, particularly in upstream regions, where it decreased by 10.02%. This recent decline highlights emerging challenges in maintaining the balance between urbanization and ecosystem health, especially in ecologically sensitive areas of the basin.
Figure 6 illustrates the spatial distribution and temporal dynamics of the CCD across 538 counties during the study period. Overall, the spatial distribution of the CCD in the YRB predominantly exhibited a slight imbalance, characterized by lower values in the west and higher values in the east. From a dynamic stage-based perspective, the CCD was generally low in 2000, with 93.68% of the counties categorized as having a serious imbalance, moderate imbalance, mild imbalance, or slight imbalance. Representative examples include Wulatehou Banner (CCD = 0.179) in Bayannaoer League, along with Beilin District (CCD = 0.191) and Lianhu District (CCD = 0.2) in Xi’an. The low CCD of Xi’an primarily stems from the disparity between rapid urbanization and inadequate ecosystem supply, whereas Wulatehou Banner’s low CCD results from both subsystems operating at suboptimal levels. The remaining coordinated counties are predominantly located in core urban areas of provincial capitals and economically developed regions along the YRB. Notable examples include most districts of Taiyuan City, Pingcheng District (Datong), Kundulun District (Baotou), and Jinshui District (Zhengzhou).
In 2005, the number of imbalanced counties in the YRB decreased from 504 (2000) to 417, while coordinated counties increased 2.5-fold to 121 compared to 2000 levels, as shown in Table 4. This trend persisted through subsequent phases: imbalanced counties declined to 379 (2010) and 308 (2015), with coordinated counterparts rising to 159 and 230, respectively. Notably, despite substantial growth in coordinated counties during this period, low coordination (Category III-1) remained predominant, suggesting that urbanization–ecosystem interactions require further optimization. Concurrently, counties achieving primary coordination or higher increased from 51 to 84, primarily clustered in provincial capitals and their economically advanced satellite cities (notably in Shandong and Henan Provinces), as well as southern Inner Mongolia.
By 2020, imbalanced counties numbered 330 versus 208 coordinated counties—a net decrease of 22 coordinated units relative to 2015. The subset attaining primary coordination or higher declined by 17, predominantly concentrated in the Hubao-Eyu Urban Agglomeration and central Shanxi counties. These regions are characterized by resource depletion and heavy reliance on primary chemical industries, structural impediments that have constrained industrial upgrading, leading to economic contraction and a declining coordination level in recent years.

4.4. Regional Difference Analysis

The evolving relationship between urbanization and the EHI in the YRB demonstrates a promising trajectory during the study period, characterized by a gradual transition from an antagonistic stage to a phase of mutual adaptation. However, significant spatial disparities in coordination levels persist across counties, necessitating a deeper exploration of regional heterogeneity. To address this, we employed kernel density estimation (KDE) to analyze the spatiotemporal evolution of the CCD across the YRB for the years 2000, 2005, 2010, 2015, and 2020.
Figure 7 displays the continuous density curves for the entire YRB, as well as its upstream, midstream and downstream sub-regions, generated using R4.1.2 software. As illustrated in Figure 7a, the density functions for the five representative years exhibit a distinct “single peak” pattern, reflecting significant spatial heterogeneity in CCD distribution across the YRB. Notably, the widening of the distribution intervals and the rightward shift of the main peak—with the corresponding CCD value increasing from 0.3 in 2000 to 0.38 in 2020—suggest a progressive convergence of coordination levels.
The sub-regional analysis reveals distinct spatial dynamics (Figure 7b–d). In the upstream region, a significant turning point occurred in 2005, marked by a sharp decline in the main peak height, followed by stabilization around 8 in subsequent years. In the midstream, the peak height decreased significantly from 2000 to 2010, rebounded between 2010 and 2015, and then declined again over the next five years. Concurrently, the right tail of the curve, which was notably elongated in 2000, shortened significantly and stabilized around 0.65 in later periods. This indicates that while spatial imbalance and polarization were pronounced in the initial stages, they have been substantially alleviated in the past decade, driven by improvements in urbanization levels and ecosystem management. The lower reaches’ density curve underwent a distinct change compared to the whole basin, as well as the upper and middle reaches. Specifically, the density function in this region exhibited a notably rightward shift, occurring at a rate significantly faster than that of the entire basin and other sub-regions. This accelerated transition reflects a substantial improvement in the CCD, accompanied by a progressive increase in the number of counties achieving higher coordination levels. Furthermore, the peak height in this region displayed a counter-trend relative to other areas, rising consistently over the study period. Concurrently, the emergence of a weak multi-peak pattern by 2020 highlights a nuanced spatial restructuring within the region. This phenomenon indicates that the overall coordination level in the region has improved, and the CCD differences between downstream counties have significantly narrowed, transitioning optimistically from “single polarization” to “multi-polarization” (e.g., Zhengzhou City and Jinan City).

4.5. Sources of Difference

To further investigate the sources of spatial differences in the CCD across the YRB, the CCD of each county within the three sub-basins (upstream, midstream, and downstream) was decomposed using the Theil index to illustrate the differences within (intragroup) and between (intergroup) regions. As shown in Table 5, the overall difference in the CCD across the YRB exhibited a gradual downward trend, decreasing from 0.396 in 2000 to 0.654 in 2020. Particularly, from 2000 to 2005, the Thiel index decreased by 34.86%, indicating that, despite significant regional spatial differences in the CCD, a distinctly narrowing trend emerged. From the perspective of the three sub-basins, the upstream Thiel index showed a trend of first rising and then declining, illustrating that while there are differences in the CCD among the counties, they have been decreasing in recent years. The Theil index for the counties in the middle and lower reaches shows a steady downward trend, particularly in the lower reaches, indicating that the overall development gap between the middle and lower reaches is gradually narrowing. Comparing the intergroup and intragroup differences, it is evident that the intragroup differences are consistently much greater than the intergroup differences. Therefore, addressing the intragroup differences should be the focus of future efforts.
Moreover, the contributions of the intragroup and intergroup differences to the overall difference were 84.9% and 15.1% in 2000, and 87.9% and 12.1% in 2020, respectively. This illustrates that the intragroup differences dominated the major disequilibrium in the CCD across the YRB. In terms of the contributions of the three sub-basins, the contribution rate in the middle reaches is significantly higher than that in the upper and lower reaches. However, the contribution rate in the upper reaches has gradually increased, while that in the middle and lower reaches has gradually decreased. This indicates that, among the three sub-basins of the YRB, the contribution rate of the intragroup differences in the middle reaches has had the greatest impact on the overall YRB, while that in the upper reaches has increased rapidly during the study period. Therefore, in the future, while focusing on the coordinated development of midstream counties, attention should also be paid to preventing a resurgence of the trend of disharmony among upstream counties.

5. Discussion

5.1. Progressiveness and Scientificity of the Present Study

In terms of scale, the Outline of Ecological Protection and High-Quality Development Plan for the Yellow River Basin (YRB), issued by the Chinese government, emphasizes the necessity of implementing specific policies and guidelines at the county level to achieve high-quality development in the YRB. However, existing research remains disproportionately concentrated on provincial [16,58] and municipal scales [3,59], constrained by data limitations that obscure the complex urbanization–eco-environment interplay at finer resolutions. Similar challenges in data availability and spatiotemporal analysis have been reported in transboundary basins globally. For instance, studies on the Danube River Basin [60] and Colorado River Basin [61] emphasize the trade-offs between urban expansion and eco-environmental deterioration, aligning with our findings. These international comparisons suggest that data limitations are not unique to China but require innovative methods like remote sensing and model integration, as demonstrated in global hydrological assessments [62]. Addressing this gap, we introduce multi-source data, synthesizing nighttime light remote sensing, LULC dynamics, and socioeconomic indicators to systematically analyze urbanization trajectories across 538 county-level units. While this study focuses on the Yellow River Basin, its findings contribute to global debates on sustainable urbanization.
In terms of methodology, Tobler’s First Law of Geography [42] posits that all geographical entities or attributes are inherently interrelated in space. This study innovatively incorporates the spatial adjacency effect into the quantification of ecosystem health. Compared with prior studies [3,16,62,63], our findings are similar in spatial patterns and trends, generally high in the west and low in the east, but reveals more pronounced local differences and variations in the EHI, thereby offering a more nuanced understanding of spatial dynamics and precise implications for ecosystem management. Furthermore, the methodological synthesis of nonparametric kernel density estimation and Theil decomposition enables a novel dual-perspective analysis, simultaneously capturing distributional polarization trends and inequality source attribution of the CCD within the YRB. This integrative approach provides spatial governance insights for the harmonious development of ecosystem conservation and high-quality urbanization in the YRB.

5.2. Coupling Coordination Between Ecosystem Health and Urbanization

The observed evolutionary trajectory of coupling coordination between urbanization and ecosystem health in the Yellow River Basin (YRB) reveals critical insights into regional sustainability transitions. The 24.05% growth in the coupling degree (C) and 15.91% increase in the coupling coordination degree (CCD) from 2000 to 2020 signify a systemic shift from antagonistic interactions (Stage II) toward mutual adaptation (Stage III), aligning with global patterns of socioecological system maturation [12,64,65]. Nevertheless, the persistent prevalence of low-coordination categories (III-1) throughout the study period highlights enduring structural mismatches between urban expansion and ecological carrying capacity. This is particularly evident in the ecologically fragile upper reaches of the YRB, where low CCD levels are primarily attributed to policy-induced ecological restrictions—specifically, China’s Ecological Conservation Redline Policy implemented in 2017—and environmental feedback mechanisms such as desertification and water scarcity [66]. This phenomenon aligns with findings in China’s Qinghai–Tibet Plateau [67] and Ningxia Province [68], where relatively high ecological health levels coexist with lagging urbanization processes, creating unique urban–ecological trade-offs. Meanwhile, in the middle reaches, the nonlinear progression—evidenced by the 2020 decline in coordinated counties relative to 2015—suggests threshold effects (a point where small changes in environmental driving factors produce a significant response in the ecosystem) in resource-dependent regions. Specifically, the regression in the Hubao-Eyu Urban Agglomeration and central Shanxi counties highlights vulnerabilities inherent to economies reliant on primary chemical industries and non-renewable resources, consistent with the “resource curse” paradigm observed in transitional economies, where unregulated resource extraction prioritizes short-term gains over long-term economic–ecological sustainability [69]. These results emphasize the necessity of adaptive governance mechanisms to address lock-in effects from path-dependent industrial structures.
The integration of kernel density estimation (KDE) and Theil index decomposition reveals pronounced spatial heterogeneity in the distribution of the CCD across the YRB. The rightward shift of the density curve’s main peak—from 0.3 in 2000 to 0.38 in 2020—signifies an overall improvement in the CCD, consistent with the transition from antagonistic to mutual adaptation stages. This trend reflects both progress and persistent challenges in reconciling urbanization with ecosystem health [7,12]. Notably, the lower reaches exhibit a weak multi-peak pattern by 2020, signaling the coexistence of advanced coordination clusters (e.g., Zhengzhou and Jinan) with persistent intra-regional disparities. This phenomenon aligns with the “multi-polarization” theory in regional development [70], highlighting the dual nature of CCD evolution in the YRB: while aggregate coordination levels have improved, localized imbalances remain a critical challenge, necessitating spatially differentiated policy interventions to address intra-regional disparities (contributing 87.9% to the total disparities by 2020) and promote basin-wide high-quality sustainable development.

5.3. Limitations and Future Prospects

This study identifies several limitations that warrant further scholarly attention. Firstly, while the application of nighttime light remote sensing data has substantially alleviated the scarcity of long-term statistical data in quantifying county-level urbanization, it does not fully capture the multidimensional nature of urbanization development. Critical aspects such as progress in scientific and technological innovation, improvements in social welfare systems, and commitments to environmental pollution control remain inadequately represented. Future research should integrate a broader spectrum of assessment indicators to refine and augment the county-level urbanization evaluation framework. Second, although the use of spatial adjacency effect coefficients allows for a more precise quantification of ecosystem health, the values of these coefficients are primarily derived from expert knowledge due to the limited availability of field survey data across broad spatial and temporal scales. Consequently, adopting improved methodologies to achieve higher precision at the pixel level is essential for future research. Thirdly, this study indicates that counties with higher terrain ruggedness and complex fluvial networks exhibit stronger negative trends in the CCD. This aligns with geodiversity theory [71], which posits that abiotic constraints (e.g., topography, geology, and hydrology) limit urban expansion while amplifying ecosystem vulnerability to anthropogenic interventions. Future research should integrate high-resolution digital elevation model (DEM) data and hydrological models to explore the geodiversity–urbanization nexus, enabling a more nuanced understanding of how ecological protection and economic development can be balanced under geodiversity constraints—particularly in sensitive regions of the upper Yellow River Basin influenced by combined factors such as climate, topography, geomorphology, and hydrology. The findings provide significant data support and policy insights for identifying regions of imbalanced development and formulating targeted intervention strategies. However, the analysis does not extend to the coordinated characteristics within the upper, middle, and lower reaches of the basin. Future research should focus on exploring internal differences to yield more nuanced and effective policy interventions tailored to the unique developmental contexts of each sub-region.

6. Conclusions and Policy Recommendations

As a pivotal strategic region serving the dual functions of ecological safeguarding and economic development, the YRB occupies a critical position in China’s national ecological security and socioeconomic progression. Nevertheless, intensified anthropogenic disturbances coupled with climate variability have precipitated a discernible disequilibrium between rapid urbanization processes and ecosystem integrity. Within this analytical context, this paper selects 538 county-level administrative units to systematically examine the spatiotemporal evolution patterns, coupling mechanism, spatial differences, and dynamic evolution of urbanization and ecological health for the period 2000–2020 by employing VORS, the coupling coordination model, kernel density estimation, and the Theil decomposition method. This study advances the systematic comprehension of spatiotemporal coupling mechanisms governing economic–ecological interactions in the YRB, and can help decision-makers provide effective management approaches for mitigating conflicts between county development and ecosystem integrity.
The findings are summarized as follows: (1) Urbanization manifested phased enhancement yet maintained an overall elementary developmental stage, exhibiting a distinct spatial gradient descending from the eastern/central riparian counties to the western hinterlands. Specifically, the downstream counties exhibited the highest urbanization intensity and growth rates, while the midstream counties displayed acute intra-regional disparities, and the upstream counties lagged significantly. (2) The EHI in the YRB experienced a marginal upward trend, yet 80.29% of the counties persisted in the suboptimal ecological health categories (EHI-1, EHI-2, and EHI-3). Spatially, EHI improvements were concentrated in the mountainous, high-vegetation-coverage counties (45.72%), contrasting sharply with the declines in the economically developed downstream areas. (3) The average CCD progressed from a mild imbalance (II-1) to a slight imbalance (II-2) and further advanced to low coordination (III-1), with high-level coordinated counties surging from 34 (2000) to 208 (2020). Spatially, the CCD in the upstream area remained the weakest, whereas the midstream and downstream areas improved markedly but with decelerated growth rates recently. (4) The kernel density estimation revealed significant spatial heterogeneity in the CCD distribution across the YRB, alongside a progressive convergence of coordination levels and the emergence of distinct “multi-polarization” patterns in the lower reaches. The Theil index decomposition further confirmed that spatial disparities were predominantly driven by intragroup differences, particularly among the counties in the middle reaches, which accounted for 87.9% of the overall inequality.
Three recommendations can be derived from the above findings to guide practice.
(1)
Strengthen ecological protection and restoration. This study has presented that, while the ecosystem health in the YRB exhibited an upward trend from 2000 to 2020, the overall level remains suboptimal. Notably, localized ecological degradation persists, particularly in ecologically fragile zones such as the northern desert regions and the Ningxia Irrigation Area in the upstream region, as well as in economically developed areas within the midstream and downstream regions. Therefore, the following measures are imperative for ecological and environmental issues. Upstream Region: It is essential to strictly control the scale and intensity of land development, advance initiatives such as the Grain for Green Program to restore forests and grasslands, and prioritize the enhancement of critical ecological service functions. In the Sanjiangyuan Core Area, ecological resettlement should continue to be implemented to reduce disturbances to natural ecosystems caused by human activities. Midstream Region: Despite its abundant mineral resources, the midstream region faces significant ecological challenges due to historically extensive economic growth models, which have led to severe environmental pollution, low vegetation coverage, and a diminished environmental carrying capacity. Addressing these issues requires a dual approach: strictly regulating the disorderly expansion of construction land to preserve the integrity of natural ecosystems, while simultaneously advancing ecological restoration projects aimed at improving habitat quality and soil–water conservation in the Loess Plateau. Additionally, proactive measures to mitigate environmental risks and control soil and water pollution are critical. Downstream Region: Currently, the strict implementation of the “ecological balance of occupation and compensation” should be continued. Meanwhile, comprehensive measures to achieve eco-friendly growth should be put forward, such as revitalizing stock land to ensure an effective supply of urban construction land, alleviating population pressure in urban cores by fostering urban–rural integration, and strengthening the comprehensive management of the ecological environment.
(2)
Promote urbanization with county characteristics. The mainstream of the YRB traverses the eastern, central, and western regions of China, flowing through numerous counties with different natural resource endowments, geographical locations, transportation, and industrial foundations, leading to prominent problems of unbalanced and insufficient urbanization development in various counties. For instance, relying on the advantages of energy resources and initial policy supports, coal-rich counties (e.g., Shenmu City, Zhunge Banner, Gongyi City, Jiyuan City, Fugu County, and Zouping City) were listed among China’s top 100 counties in 2021. In contrast, the majority of counties in the Qinghai and Gansu Provinces remain economically underdeveloped, with urbanization levels lagging significantly behind. Therefore, it is imperative to implement the following measures to enhance county-level urbanization. Upstream Region: Adhering to the development concept of “Lucid waters and lush mountains are invaluable assets” is the foundation. On one hand, by leveraging high-quality ecological resources, the region should explore niche tourism opportunities tied to its plateau landscapes while fostering local agricultural and pastoral brands through the integration of information technologies. On the other hand, the development of renewable energy industries (e.g., wind and solar power) should be accelerated to transform its natural resource endowments into sustainable economic gains. Midstream Region: Historically, counties in this area have achieved rapid urbanization through the agglomeration of population, resources, and economic activities, driven by their abundant energy reserves. However, in recent years, the depletion of these resources has led to diminished economic urbanization, with some counties even experiencing negative growth. Moving forward, the midstream region must align with the dual imperatives of “ecological industrialization and industrial ecologicalization”. For example, in traditional energy cities like Shenmu City, it is necessary to implement the “Reclamation of Industrial and Mining Wastelands + Carbon Sink Forests” project, which aims to transform 300 hectares of coal mining subsidence areas into carbon sequestration forests. In addition, the withdrawn coal mine land can be used for the transformation and development of modern agriculture. Downstream Region: County urbanization in this region is the highest and has improved significantly with the location’s advantages of rich population and labor resources. To sustain and enhance this trajectory, this region should focus on the advantages of the Shandong Peninsula Urban Agglomeration and the Central Plains Economic Zone, formulate the “one county, one policy” and “one county, one industry” distinctive industrial path, and form a new highland for opening up in the YRB.
(3)
Improve coupling coordination effectiveness. The disparities in coupling coordination across the YRB are influenced by both intragroup and intergroup differences, with intragroup variations being the predominant factor. To achieve high-quality development in the YRB, strategic prioritization should be directed toward harmonizing intragroup disparities while incrementally mitigating inter-regional divergences. Upstream Region: Characterized by the lowest CCD in the YRB, this area exhibits acute disequilibrium between urbanization and the EHI, wherein socioeconomic advancement lags markedly behind that of the natural ecosystem. To address this imbalance, upstream counties should prioritize ecological stability while simultaneously promoting technological innovation and optimizing governmental interventions to facilitate a transition from external “blood transfusion” (reliance on external support) to endogenous “hematopoietic” growth (self-sustaining development), thereby fostering a synergistic balance between socioeconomic progress and ecological preservation. Midstream Region: Intragroup differences dominate the overall CCD disparities in the YRB, primarily attributable to pronounced asymmetries in economic urbanization. For instance, in 2020, Fugu County and Shenmu County recorded a per capita GDP of CNY 213,600 and CNY 265,300, respectively. In stark contrast, Jia County and Qingjian County, also under Yulin City’s jurisdiction, remained national-level poverty-stricken counties with a per capita GDP below CNY 60,000. Addressing these internal imbalances is pivotal for enhancing the YRB’s overall coordination efficacy. On the one hand, policy interventions should focus on harnessing the spillover effects and industrial linkages of emerging urban agglomerations (e.g., Hubao-Eyu, Guanzhong, and Taiyuan Economic Belt). Economically advanced counties should drive the progress of less-developed neighboring areas, fostering regional integration and equitable growth. On the other hand, in areas with low levels of ecosystem health (e.g., the Loess Plateau, with severe soil erosion), priority should be given to providing afforestation subsidies, while allocating industrial areas to areas with lower environmental sensitivity to reduce sediment loss without affecting GDP growth. Downstream Region: While the average CCD is the highest in the YRB, the rapid pace of urbanization has exerted increasing pressure on the ecological environment. For example, in economically prosperous counties such as Guancheng Hui District (Zhengzhou), Old City (Luoyang), and Zhangdian District (Zibo), the EHI has shown a declining trend, leading to a noticeable deceleration in the CCD in recent years. To counteract this trajectory, downstream areas should deepen economic openness to stimulate innovation-driven structural transformation, expedite the transition from traditional industries to knowledge-intensive sectors, and leverage the synergistic effect of “multi-polarization” to form a powerful engine for high-quality development across the YRB.

Supplementary Materials

The following supporting information can be downloaded at https://www.mdpi.com/article/10.3390/land14040801/s1, Table S1. Coefficient matrix for the spatial neighboring effect on the ecosystem services of each landscape type. Table S2. Coefficients of resistance and resilience of each land use type. Table S3. The calculation methods of ecosystem services. Figure S1. Spatial pattern of food production in the YRB from 2000 to 2020. Figure S2. Spatial pattern of water yield in the YRB from 2000 to 2020. Figure S3. Spatial pattern of carbon storage in the YRB from 2000 to 2020. Figure S4. Spatial pattern of soil conservation in the YRB from 2000 to 2020. Figure S5. Spatial pattern of wind prevention and sand fixation in the YRB from 2000 to 2020. Figure S6. Spatial pattern of nitrogen export in the YRB from 2000 to 2020. Figure S7. Spatial pattern of phosphorus export in the YRB from 2000 to 2020. Figure S8. Spatial pattern of habitat quality in the YRB from 2000 to 2020. Figure S9. Spatial-temporal evolution of ecosystem vigor, organization, resilience and service in 2000 and 2020. References [72,73,74,75,76,77,78,79,80,81] are cited in the Supplementary Materials.

Author Contributions

Conceptualization, S.G. and L.L.; methodology, S.G.; software, X.G.; validation, S.G.; formal analysis, X.X.; investigation, X.G.; resources, J.H.; data curation, S.G.; writing—original draft preparation, S.G.; writing—review and editing, L.L. and J.H.; visualization, Y.W.; supervision, L.L.; project administration, L.L.; funding acquisition, L.L. All authors have read and agreed to the published version of the manuscript.

Funding

This research was supported by Science and Technology Research and Development Plan Joint Fund Key Project of Henan Province (225200810045), Natural Science Foundation of Henan Province (242300420605), Key Research Project Plan for Higher Education Institutions of Henan Province (24A630017), National Natural Science Foundation of China (42077004), Innovation Fund Project of Henan Agricultural University (30201182), and Scientific and Technological Research Project in Henan Province (242102320228).

Data Availability Statement

The data will be made available on request.

Acknowledgments

The authors would like to thank the anonymous reviewers for their comments and suggestions.

Conflicts of Interest

The authors declare no conflicts of interest.

References

  1. Mason, R.E.; Craine, J.M.; Lany, N.K.; Jonard, M.; Ollinger, S.V.; Groffman, P.M.; Fulweiler, R.W.; Angerer, J.; Read, Q.D.; Reich, P.B.; et al. Evidence, causes, and consequences of declining nitrogen availability in terrestrial ecosystems. Science 2022, 376, eabh3767. [Google Scholar] [CrossRef]
  2. Sun, B.; Lu, Y.; Yang, Y.; Yu, M.; Yuan, J.; Yu, R.; Bullock, J.M.; Stenseth, N.C.; Li, X.; Cao, Z.; et al. Urbanization affects spatial variation and species similarity of bird diversity distribution. Sci. Adv. 2022, 8, eade3061. [Google Scholar] [CrossRef] [PubMed]
  3. Shen, W.; Li, Y.; Qin, Y. Research on the influencing factors and multi-scale regulatory pathway of ecosystem health: A case study in the Middle Reaches of the Yellow River, China. J. Clean Prod. 2023, 406, 137038. [Google Scholar] [CrossRef]
  4. Xiong, S.; Yang, F. Multiscale exploration of spatiotemporal dynamics in China’s largest urban agglomeration: An interactive coupling perspective on human activity intensity and ecosystem health. J. Environ. Manag. 2025, 376, 124375. [Google Scholar] [CrossRef]
  5. Jemiluyi, O.O.; Jeke, L. The role of human capital development in urbanization-economic growth nexus: A new insight on Nigeria. Sustain. Futures 2024, 8, 100266. [Google Scholar] [CrossRef]
  6. Feng, H.; Fu, J.; Li, H.; Liang, Y. Urbanization or “Townization”? Measuring the evolution of urban systems in modern China. China Econ. Rev. 2025, 90, 102368. [Google Scholar] [CrossRef]
  7. Wu, J.; Cheng, D.; Xu, Y.; Huang, Q.; Feng, Z. Spatial-temporal change of ecosystem health across China: Urbanization impact perspective. J. Clean Prod. 2021, 326, 129393. [Google Scholar] [CrossRef]
  8. Adyari, B.; Zhang, L.; Maravić, A.; Chen, J.; Li, L.; Gad, M.; Yu, C.; Hu, A. Urbanization enhances consumer protist-driven ARGs dissemination in riverine ecosystems. Environ. Int. 2025, 195, 109238. [Google Scholar] [CrossRef]
  9. Ma, C.; Sun, W.; Yang, Z.; Wang, J.; Zhou, L. Spatiotemporal variations in land use impacts on river water quality in a mountain-to-plain transitional basin in arid region of northern China. J. Contam. Hydrol. 2025, 271, 104542. [Google Scholar] [CrossRef]
  10. Dai, L.; Tang, H.; Pan, Y.; Zhang, L. Assessment of ecosystem stability in the agro-pastoral transitional zone for local sustainable management: A case study in Duolun County, northern China. Ecol. Indic. 2024, 162, 112018. [Google Scholar] [CrossRef]
  11. Ran, P.; Frazier, A.E.; Xia, C.; Tiando, D.S.; Feng, Y. How does urban landscape pattern affect ecosystem health? Insights from a spatiotemporal analysis of 212 major cities in China. Sust. Cities Soc. 2023, 99, 104963. [Google Scholar] [CrossRef]
  12. Gu, T.; Luo, T.; Ying, Z.; Wu, X.; Wang, Z.; Zhang, G.; Yao, Z. Coupled relationships between landscape pattern and ecosystem health in response to urbanization. J. Environ. Manag. 2024, 367, 122076. [Google Scholar] [CrossRef]
  13. Qiao, W.; Huang, X. The impact of land urbanization on ecosystem health in the Yangtze River Delta urban agglomerations, China. Cities 2022, 130, 103981. [Google Scholar] [CrossRef]
  14. Abbasnezhad, B.; Abrams, J.B. Are prevailing policy tools effective in conserving ecosystem services under individual private tenure? Challenges and policy gaps in a rapidly urbanizing region. Trees For. People 2025, 19, 100730. [Google Scholar] [CrossRef]
  15. Chen, W.; Wang, G.; Zeng, J. Impact of urbanization on ecosystem health in Chinese urban agglomerations. Environ. Impact Assess. Rev. 2023, 98, 106964. [Google Scholar] [CrossRef]
  16. Yang, M.; Gao, X.; Siddique, K.H.M.; Wu, P.; Zhao, X. Spatiotemporal exploration of ecosystem service, urbanization, and their interactive coercing relationship in the Yellow River Basin over the past 40 years. Sci. Total Environ. 2023, 858, 159757. [Google Scholar] [CrossRef]
  17. Theodorou, P.; Radzevičiūtė, R.; Lentendu, G.; Kahnt, B.; Husemann, M.; Bleidorn, C.; Settele, J.; Schweiger, O.; Grosse, I.; Wubet, T.; et al. Urban areas as hotspots for bees and pollination but not a panacea for all insects. Nat. Commun. 2020, 11, 576. [Google Scholar] [CrossRef] [PubMed]
  18. Altuwaijri, H.A.; Al Kafy, A.; Rahaman, Z.A. Multi-temporal remote sensing and geospatial analysis for urban ecosystem service dynamics: A three-decade assessment of land surface transformation in Jeddah, Saudi Arabia. Phys. Chem. Earth Parts A/B/C 2025, 139, 103892. [Google Scholar] [CrossRef]
  19. Wang, X.; Yao, W.; Luo, Q.; Yun, J. Spatial relationship between ecosystem health and urbanization in coastal mountain city, Qingdao, China. Ecol. Inform. 2024, 79, 102458. [Google Scholar] [CrossRef]
  20. Bai, X.M.; Mcphearson, T.; Cleugh, H.; Nagendra, H.; Tong, X.; Zhu, T.; Zhu, Y.G. Linking Urbanization and the Environment: Conceptual and Empirical Advances. Annu. Rev. Environ. Resour. 2017, 42, 215–240. [Google Scholar] [CrossRef]
  21. Da Silva, R.T.; Fleskens, L.; van Delden, H.; van der Ploeg, M. Incorporating soil ecosystem services into urban planning: Status, challenges and opportunities. Landsc. Ecol. 2018, 33, 1087–1102. [Google Scholar] [CrossRef]
  22. Wang, J.; Wang, J.; Zhang, J. Optimization of landscape ecological risk assessment method and ecological management zoning considering resilience. J. Environ. Manag. 2025, 376, 124586. [Google Scholar] [CrossRef] [PubMed]
  23. Yusuf, D.A.; Zhu, J.; Khaing, C.T.; Adamu, S.; Bala, H.S. Regulating urban metabolism in semi-arid regions: Classification and valuation of urban open spaces ecosystem services in metropolitan Kano. Environ. Dev. 2025, 54, 101165. [Google Scholar] [CrossRef]
  24. Zhang, W.; Liu, G.; Yang, Z. Urban agglomeration ecological risk transfer model based on Bayesian and ecological network. Resour. Conserv. Recycl. 2020, 161, 105006. [Google Scholar] [CrossRef]
  25. Costanza, R. Ecosystem health and ecological engineering. Ecol. Eng. 2012, 45, 24–29. [Google Scholar] [CrossRef]
  26. Rapport, D.J.; Costanza, R.; Mcmichael, A.J. Assessing ecosystem health. Trends Ecol. Evol. 1999, 13, 397–402. [Google Scholar]
  27. Styers, D.M.; Chappelka, A.H.; Marzen, L.J.; Somers, G.L. Developing a land-cover classification to select indicators of forest ecosystem health in a rapidly urbanizing landscape. Landsc. Urban Plan. 2010, 94, 158–165. [Google Scholar] [CrossRef]
  28. Das, M.; Das, A.; Pereira, P.; Mandal, A. Exploring the spatio-temporal dynamics of ecosystem health: A study on a rapidly urbanizing metropolitan area of Lower Gangetic Plain, India. Ecol. Indic. 2021, 125, 107584. [Google Scholar] [CrossRef]
  29. Liu, R.; Dong, X.; Wang, X.; Zhang, P.; Liu, M.; Zhang, Y. Relationship and driving factors between urbanization and natural ecosystem health in China. Ecol. Indic. 2023, 147, 109972. [Google Scholar] [CrossRef]
  30. Xiao, R.; Liu, Y.; Fei, X.; Yu, W.; Zhang, Z.; Meng, Q. Ecosystem health assessment: A comprehensive and detailed analysis of the case study in coastal metropolitan region, eastern China. Ecol. Indic. 2019, 98, 363–376. [Google Scholar] [CrossRef]
  31. Khatun, R.; Das, S. Assessment of wetland ecosystem health in Rarh Region, India through P-S-R (pressure-state-response) model. Sci. Total Environ. 2024, 951, 175700. [Google Scholar] [CrossRef]
  32. Guo, S.; Li, L.; Wang, S.; Huang, J.; Xie, X.; Wang, Y. What are the dominant drivers and optimal thresholds for a healthy ecosystem in the Yellow River Basin, China? from a perspective of nonlinear nexus. Ecol. Indic. 2024, 162, 111997. [Google Scholar] [CrossRef]
  33. Yadav, A.; Kansal, M.L.; Singh, A. Ecosystem health assessment based on the V-O-R-S framework for the Upper Ganga Riverine Wetland in India. Environ. Sustain. Indic. 2025, 25, 100580. [Google Scholar] [CrossRef]
  34. Hasani, M.; Pielesiak, I.; Mahiny, A.S.; Mikaeili, A. Regional ecosystem health assessment based on landscape patterns and ecosystem services approach. Acta Ecol. Sin. 2023, 43, 333–342. [Google Scholar] [CrossRef]
  35. Pan, Z.; He, J.; Liu, D.; Wang, J.; Guo, X. Ecosystem health assessment based on ecological integrity and ecosystem services demand in the Middle Reaches of the Yangtze River Economic Belt, China. Sci. Total Environ. 2021, 774, 144837. [Google Scholar] [CrossRef]
  36. Marulli, J.; Mallarach, J.M. A GIS methodology for assessing ecological connectivity: Application to the Barcelona Metropolitan Area. Landsc. Urban Plan. 2005, 71, 243–262. [Google Scholar] [CrossRef]
  37. Peng, J.; Liu, Y.; Wu, J.; Lv, H.; Hu, X. Linking ecosystem services and landscape patterns to assess urban ecosystem health: A case study in Shenzhen City, China. Landsc. Urban Plan. 2015, 143, 56–68. [Google Scholar] [CrossRef]
  38. Ouyang, W.; Hao, F.; Skidmore, A.K.; Toxopeus, A.G. Soil erosion and sediment yield and their relationships with vegetation cover in upper stream of the Yellow River. Sci. Total Environ. 2010, 409, 396–403. [Google Scholar] [CrossRef]
  39. Wang, X.; Sun, Z.; Feng, X.; Ma, J.; Jia, Z.; Wang, X.; Zhou, J.; Zhang, X.; Yao, W.; Tu, Y. Identification of priority protected areas in Yellow River Basin and detection of key factors for its optimal management based on multi-scenario trade-off of ecosystem services. Ecol. Eng. 2023, 194, 107037. [Google Scholar] [CrossRef]
  40. Yi, S.; Wu, P.; Peng, X.; Tang, Z.; Bai, F.; Sun, X.; Gao, Y.; Qin, H.; Yu, X.; Wang, R.; et al. Biodiversity, environmental context and structural attributes as drivers of aboveground biomass in shrublands at the middle and lower reaches of the Yellow River basin. Sci. Total Environ. 2021, 774, 145198. [Google Scholar] [CrossRef]
  41. Yu, X.; Yu, F.; Li, Z.; Zhan, J. Occurrence, distribution, and ecological risk assessment of pharmaceuticals and personal care products in the surface water of the middle and lower reaches of the Yellow River (Henan section). J. Hazard. Mater. 2023, 443, 130369. [Google Scholar] [CrossRef]
  42. Tobler, W. On the First Law of Geography: A Reply. Ann. Assoc. Am. Geogr. 2004, 94, 304–310. [Google Scholar] [CrossRef]
  43. Sun, Y.; Liu, X.; Su, Y.; Xu, S.; Ji, B.; Zhang, Z. County urbanization level estimated from nighttime light data in Anhui province. J. Geo-Inf. Sci. 2020, 22, 1837–1847. (In Chinese) [Google Scholar]
  44. Cui, F.; Tang, H.; Zhang, Q.; Wang, B.; Dai, L. Integrating ecosystem services supply and demand into optimized management at different scales: A case study in Hulunbuir, China. Ecosyst. Serv. 2019, 39, 100984. [Google Scholar] [CrossRef]
  45. Agboola, J.I.; Ndimele, P.E.; Odunuga, S.; Akanni, A.; Kosemani, B.; Ahove, M.A. Ecological health status of the Lagos wetland ecosystems: Implications for coastal risk reduction. Estuar. Coast. Shelf Sci. 2016, 183, 73–81. [Google Scholar] [CrossRef]
  46. Peng, J.; Tian, L.; Liu, Y.; Zhao, M.; Hu, Y.; Wu, J. Ecosystem services response to urbanization in metropolitan areas: Thresholds identification. Sci. Total Environ. 2017, 607–608, 706–714. [Google Scholar] [CrossRef]
  47. Qu, H.; You, C.; Wang, W.; Guo, L. Spatio-temporal interplay between ecosystem services and urbanization in the Yangtze River Economic Belt: A new perspective for considering the scarcity effect. Land Use Pol. 2024, 147, 107358. [Google Scholar] [CrossRef]
  48. Shen, Z.; Gao, Y.; Wang, L.; Xia, Z.; Liu, H.; Deng, T. Non-stationary response of complex ecosystem service networks to urbanization: Evidence from a typical eco-fragile area in China. Geogr. Sustain. 2025, 6, 100214. [Google Scholar] [CrossRef]
  49. Ma, T.; Zhou, C.; Pei, T.; Haynie, S.; Fan, J. Quantitative estimation of urbanization dynamics using time series of DMSP/OLS nighttime light data: A comparative case study from China’s cities. Remote Sens. Environ. 2012, 124, 99–107. [Google Scholar] [CrossRef]
  50. Zhao, C.; Zhu, H.; Zhang, S.; Jin, Z.; Zhang, Y.; Wang, Y.; Shi, Y.; Jiang, J.; Chen, X.; Liu, M. Long–term trends in surface thermal environment and its potential drivers along the urban development gradients in rapidly urbanizing regions of China. Sust. Cities Soc. 2024, 105, 105324. [Google Scholar] [CrossRef]
  51. Xia, Q.; Tian, G.; Zhao, D.; Zhao, Q.; Varis, O. Effects of new-type urbanization on resource pressure: Evidence from a water-energy-food system perspective in China. Sust. Cities Soc. 2024, 107, 105411. [Google Scholar] [CrossRef]
  52. Li, J.; Liu, C.; Kang, B.; Ma, T. Research on coupling coordination and spatial-temporal evolution of hydrogen energy industry in hebei province based on R-P-D chain. Int. J. Hydrogen Energy 2024, 79, 1180–1190. [Google Scholar] [CrossRef]
  53. Zhang, K.; Jin, Y.; Li, D.; Wang, S.; Liu, W. Spatiotemporal variation and evolutionary analysis of the coupling coordination between urban social-economic development and ecological environments in the Yangtze River Delta cities. Sust. Cities Soc. 2024, 111, 105561. [Google Scholar] [CrossRef]
  54. Kemp, C.D.; Silverman, B.W. Density estimation for statistics and data analysis. J. R. Stat. Society. Ser. D (Stat.) 1987, 36, 420–421. [Google Scholar] [CrossRef]
  55. Silverman, B.W. Density Estimation for Statistics and Data Analysis; Chapman and Hall: New York, NY, USA, 1986. [Google Scholar]
  56. Theil, H. Economics and Informtation Theory; North Holland Publishing Company: Amsterdam, The Netherlands, 1967; pp. 13–21. [Google Scholar]
  57. Xue, D.; Yue, L.; Ahmad, F.; Draz, M.U.; Chandio, A.A.; Ahmad, M.; Amin, W. Empirical investigation of urban land use efficiency and influencing factors of the Yellow River basin Chinese cities. Land Use Pol. 2022, 117, 106117. [Google Scholar] [CrossRef]
  58. Liu, Z.; Chang, Y.; Pan, S.; Zhang, P.; Tian, L.; Chen, Z. Unfolding the spatial spillover effect of urbanization on composite ecosystem services: A case study in cities of Yellow River Basin. Ecol. Indic. 2024, 158, 111521. [Google Scholar] [CrossRef]
  59. Zhang, Z.; Wang, Q.; Yan, F.; Sun, Y.; Yan, S. Revealing spatio-temporal differentiations of ecological supply-demand mismatch among cities using ecological Network: A case study of typical cities in the “Upstream-Midstream-Downstream” of the Yellow River Basin. Ecol. Indic. 2024, 166, 112468. [Google Scholar] [CrossRef]
  60. Karabulut, A.; Egoh, B.N.; Lanzanova, D.; Grizzetti, B.; Bidoglio, G.; Pagliero, L.; Bouraoui, F.; Aloe, A.; Reynaud, A.; Maes, J.; et al. Mapping water provisioning services to support the ecosystem–water–food–energy nexus in the Danube river basin. Ecosyst. Serv. 2016, 17, 278–292. [Google Scholar] [CrossRef]
  61. Comte, L.; Olden, J.D.; Lischka, S.; Dickson, B.G. Multi-scale threat assessment of riverine ecosystems in the Colorado River Basin. Ecol. Indic. 2022, 138, 108840. [Google Scholar] [CrossRef]
  62. Lubczynski, M.W.; Leblanc, M.; Batelaan, O. Remote sensing and hydrogeophysics give a new impetus to integrated hydrological models: A review. J. Hydrol. 2024, 633, 130901. [Google Scholar] [CrossRef]
  63. Chen, W.; Yuan, Y.; Liu, Z.; Zeng, J.; Yang, L.; Zhong, Y.; Gu, T.; Feng, Z. Ecosystem health in the Yangtze and Yellow River basins in China: Regional differences and driving forces. Ecol. Indic. 2024, 166, 112422. [Google Scholar] [CrossRef]
  64. Shen, J.; Zhao, M.; Tang, X.; Wu, C. Ecological restoration zoning and strategy based on ecosystem service supply and demand relationships: A case study of the Yellow River Basin. J. Nat. Conserv. 2025, 84, 126837. [Google Scholar] [CrossRef]
  65. Sha, A.; Zhang, J.; Pan, Y.; Zhang, S. How to recognize and measure the impact of phasing urbanization on eco-environment quality: An empirical case study of 19 urban agglomerations in China. Technol. Forecast. Soc. Change 2025, 210, 123845. [Google Scholar] [CrossRef]
  66. Ministry of Environmental Protection, National Development and Reform Commission. Guidelines for the Delineation of Ecological Conservation Redline. Beijing. 2017. Available online: https://www.mee.gov.cn/gkml/hbb/bgt/201707/W020170728397753220005.pdf (accessed on 1 July 2024).
  67. Yang, Y.; Yu, C.; Liu, M.; Wei, H. Uncovering the coupling relationships and key factors linking ecosystem services to human well-being through system dynamics: A case study in the Qinghai-Tibet Plateau. Ecol. Indic. 2024, 166, 112408. [Google Scholar] [CrossRef]
  68. Wang, X.; Bu, X.; Wang, J.; Du, L.; Hong, Z.; Shi, G.; Baqiatullah. Study on the coordination and factors affecting the coupling of resource and environmental carrying capacity and regional economy in ecologically fragile areas. Ecol. Indic. 2024, 167, 112656. [Google Scholar] [CrossRef]
  69. Auty, R.M. Sustaining Development in Mineral Economies: The Resource Curse Thesis; Routledge: London, UK, 1993. [Google Scholar]
  70. Fujita, M.; Krugman, P. The new economic geography: Past, present and the future. Pap. Reg. Sci. 2004, 83, 139–164. [Google Scholar] [CrossRef]
  71. Balaguer, L.P.; Garcia, M.D.G.M.; Reverte, F.C.; Ribeiro, L.M.D.A. To what extent are ecosystem services provided by geodiversity affected by anthropogenic impacts? A quantitative study in Caraguatatuba, Southeast coast of Brazil. Land Use Pol. 2023, 131, 106708. [Google Scholar] [CrossRef]
  72. Bai, Y.; Chen, Y.; Alatalo, J.M.; Yang, Z.; Jiang, B. Scale effects on the relationships between land characteristics and ecosystem services—A case study in Taihu Lake Basin, China. Sci. Total Environ. 2020, 716, 137083. [Google Scholar] [CrossRef]
  73. Wang, J.; Zhou, W.; Pickett, S.T.A.; Yu, W.; Li, W. A multiscale analysis of urbanization effects on ecosystem services supply in an urban megaregion. Sci. Total Environ. 2019, 662, 824–833. [Google Scholar] [CrossRef]
  74. Zhang, L.; Dawes, W.R.; Walker, G.R. Response of mean annual evapotranspiration to vegetation changes at catchment scale. Water Resour. Res. 2001, 37, 701–708. [Google Scholar] [CrossRef]
  75. Williams, J.R. The erosion-productivity impact calculator (EPIC) model: A case history. Phil. Trans. R. Soc. Lond. B. 1990, 329, 421–428. [Google Scholar] [CrossRef]
  76. Mccool, D.K.; Foster, G.R.; Mutchler, C.K.; Meyer, L.D. Revised slope length factor for the universal soil loss equation. Trans. Asae 1989, 32, 1571–1576. [Google Scholar] [CrossRef]
  77. Lufafa, A.; Tenywa, M.M.; Isabirye, M.; Majaliwa, M.J.G.; Woomer, P.L. Prediction of soil erosion in a Lake Victoria basin catchment using a GIS-based Universal Soil Loss model. Agric. Syst. 2003, 76, 883–894. [Google Scholar] [CrossRef]
  78. Yin, H.; Xu, L.; Ning, J.; Lu, Q. Spatio-temporal explicit mapping and quantification of ecosystem services provision area: An application for wind erosion prevention service in northern China. Ecol. Indic. 2023, 156, 111132. [Google Scholar] [CrossRef]
  79. Fryrear, F.D.; Bilbro, D.J.; Saleh, A.; Schomberg, H.M.; Zobeck, T.M. RWEQ: Improved wind erosion technology. J. Soil Water Conserv. 2000, 55, 183–189. Available online: https://www.researchgate.net/publication/259196891_RWEQ_Improved_wind_erosion_technology (accessed on 1 July 2024).
  80. Zhang, Y.; Lu, X.; Liu, B.; Wu, D.; Fu, G.; Zhao, Y.; Sun, P. Spatial relationships between ecosystem services and socioecological drivers across a large-scale region: A case study in the Yellow River Basin. Sci. Total Environ. 2021, 766, 142480. [Google Scholar] [CrossRef]
  81. Gao, Y.; Ma, L.; Liu, J.X.; Zhuang, Z.Z.; Huang, Q.H.; Li, M.C. Constructing Ecological Networks Based on Habitat Quality Assessment: A Case Study of Changzhou, China. Sci. Rep. 2017, 7, 46073. [Google Scholar] [CrossRef]
Figure 1. (a) Geographical location of the study area. (b) Elevation. (c) The annual average precipitation in 2020. (d) Land use types in 2020. (e) Average night light index of 538 counties in 2020. Note: China’s administrative division system consists of four hierarchical tiers: (1) provincial-level divisions, (2) prefecture-level divisions, (3) county-level divisions, and (4) township-level divisions. At the county level, these encompass municipal districts (subdivisions of prefecture-level cities; typically urban core zones with high population density and intensified land use), county-level cities, counties, and autonomous counties.
Land 14 00801 g001
Figure 2. Research framework.
Land 14 00801 g002
Figure 3. Spatial–temporal change in urbanization index at county level in the Yellow RRB from 2000 to 2020.
Land 14 00801 g003
Figure 4. Spatial–temporal change in ecosystem health of 538 counties in the YRB from 2000 to 2020.
Land 14 00801 g004
Figure 5. Dynamics of coupling degree (C) and coupling coordination degree (CCD) in the YRB from 2000 to 2020.
Land 14 00801 g005
Figure 6. Spatial–temporal change in coupling coordination degree of 538 counties in the YRB from 2000 to 2020.
Land 14 00801 g006
Figure 7. Kernel density estimation graph of CCD at county level during 2000–2020 in the YRB.
Land 14 00801 g007
Table 1. Data sources and description.
Data TypeData DescriptionData TypeResolutionData Sources
Administrative boundaryCounty boundary.shp-https://www.resdc.cn/ (accessed on 15 June 2024)
Land use/land coverGlobal ESA CCI land cover classification map.tif300 mhttps://www.copernicus.eu/en (accessed on 1 July 2024)
Meteorological dataPotential evapotranspiration.tif1 kmhttps://figshare.com/ (accessed on 1 July 2024)
Annual mean temperature
Annual mean precipitation
Annual mean humidity
Annual mean sunshine hours
Wind speed
.shp-http://data.cma.cn/ (accessed on 1 July 2024)
Topography dataElevation
Slope
.tif30 mhttp://www.gscloud.cn/ (accessed on 1 July 2024)
NDVIBand calculation from Landsat TM/ETM images.tif500 mhttp://www.gscloud.cn/ (accessed on 1 July 2024)
Soil data1:1,000,000 soil type map.tif1 kmhttps://www.fao.org/home/en/
DMSP/OLS and NPP/VIIRS datasetsNighttime light remote sensing images.tif1 kmhttps://dataverse.harvard.edu/dataset.xhtml?persistentId=doi:10.7910/DVN/GIYGJU (accessed on 3 July 2024)
Socioeconomic statistical dataGrain production
Urban population
Per capita GDP
Proportion of secondary and tertiary industry outputs in GDP
Total investment in fixed assets
.txt-National Bureau of Statistics https://www.stats.gov.cn/ (accessed on 3 July 2024)
Table 2. Comprehensive index system coupling urbanization and ecosystem health.
DimensionSub-DimensionIndicatorMeasurementUnit
UrbanizationDemographic urbanization (DU)Urban population densityUrban population/Urban areaPerson/km2
The percentage of urban populationUrban population/Total population×100%%
Economic
urbanization
(EU)
Per capita GDPGDP/Total populationCNY
The percentage of the output of secondary industry in GDPOutput of secondary industry/GDP × 100%%
The percentage of the output of
tertiary industry in GDP
Output of tertiary industry/GDP × 100%%
The total investment in fixed assetsThe total cost of building and purchasing fixed assets in a certain period of timeCNY
Spatial
urbanization
(SU)
The percentage of construction land areaConstruction land area/Total area × 100%%
Average night light index (ANLI) A N L I = 1 n i = 1 n L D N i
L D N i is brightness value of the ith pixel in the study area; n is the number of pixels [43]
/
Ecosystem healthEcosystem vigor
(EV)
Net primary productivity
(NPP)
N P P ( x , t ) = A P A R ( x , t ) × ε ( x , t )
A P A R ( x , t ) = S O L ( x , t ) × F P A R ( x , t ) × 0.5
ε ( x , t ) = T ε 1 ( x , t ) × T ε 2 ( x , t ) × W ( x , t ) × ε m a x
The Carnegie–Ames–Stanford Approach (CASA) model was used to calculate NPP [44]
/
Ecosystem
organization
(EO)
Landscape heterogeneity (LH)
Landscape connectivity (LC)
Important patches connectivity (IC)
E O = 0.35 L H + 0.35 L C + 0.30 I C = ( 0 . 25 SHDI + 0 . 10 AWMPFD ) + ( 0 . 25 FI + 0 . 10 CONT ) + ( 0 . 08 FI 1 + 0 . 03 COHESION 1 + 0 . 05 FI 2 + 0 . 02 COHESION 2 + 0 . 05 FI 3 + 0 . 02 COHESION 3 + 0 . 04 FI 4 + 0 . 01 COHESION 4 )
FI1, FI2, FI3, FI4 represent the patch fragmentation indices of forestland, water body, wetland, and grassland, respectively. COHESION1, COHESION2, COHESION3, COHESION4 represent the patch connectivity indices of each land use type [32,45]
/
Ecosystem
resilience
(ER)
Resistance coefficient ( C r e s i s t a n )
Resilience coefficient ( C r e s i l i e n )
E R = 0.4 × i = 1 n A i × C r e s i s t a n , i + 0.6 × i = 1 n A i × C r e s i l i e n , i
C r e s i s t a n , i and C r e s i l i e n , i indicate coefficients of resistance and resilience, respectively. Both can be assigned corresponding to the land use types [35,46], as detailed in Table S2
/
Ecosystem
services
(ES)
Food production (FP)
Water yield (WY)
Carbon storage (CS)
Soil conservation (SC)
Wind protection and sand
fixation (WPSF)
Water purification (WP)
Habitat quality (HQ)
E S C I = j = 1 m i = 1 n E S i j × 1 + S A E C i 100 / n
E S i j refers to the jth ecosystem service of the ith grid cell after standardization; SAECi represents the sum of the spatial adjacency effect coefficients of four adjacent pixels on pixel i’s ecosystem services [32,36,37]. The specific quantification methods for the seven ES supplies are listed in Table S3
/
Table 3. Criteria for the coupling coordination between urbanization and ecosystem health.
Coupling StageCCCDCoordination State
Low-level coupling stage (I)(0.0~0.3)(0.0~0.1)Extreme imbalance (I-1)
[0.1~0.2)Serious imbalance (I-2)
[0.2~0.3)Moderate imbalance (I-3)
Antagonism stage (II)[0.3~0.5)[0.3~0.4)Mild imbalance (II-1)
[0.4~0.5)Slight imbalance (II-2)
Mutual adaptation stage (III)[0.5~0.8)[0.5~0.6)Low coordination (III-1)
[0.6~0.7)Primary coordination (III-2)
[0.7~0.8)Moderate coordination (III-3)
High-level coupling stage (IV)[0.80~1)[0.8~0.9)Good coordination (IV-1)
[0.9~1.0)High coordination (IV-2)
Table 4. Distribution of coupling coordination state in the 538 districts and counties in the YRB from 2000 to 2020.
Coordination State20002005201020152020
Serious imbalance (I-2)30000
Moderate imbalance (I-3)3211877
Mild imbalance (II-1)32916513498108
Slight imbalance (II-2)140241237203215
Low coordination (III-1)2989108146141
Primary coordination (III-2)427386043
Moderate coordination (III-3)04122124
Good coordination (IV-1)11130
Table 5. Theil index and contribution rates of CCD in the YRB from 2000 to 2020.
Weight VariableYearYRBIntragroupIntragroup (TWR)Intergroup (TBR)
UpstreamMidstreamDownstream
Population20000.6540.484 (0.199)0.684 (0.499)0.390
(0.151)
0.555 (0.849)0.099 (0.151)
20050.5700.536 (0.249)0.540 (0.456)0.338
(0.150)
0.488 (0.855)0.083 (0.145)
20100.4260.618 (0.388)0.336 (0.376)0.252
(0.152)
0.390 (0.916)0.036 (0.084)
20150.4200.572 (0.362)0.334 (0.377)0.255
(0.158)
0.377 (0.897)0.043 (0.103)
20200.3960.476 (0.316)0.359 (0.431)0.200
(0.132)
0.348 (0.879)0.048 (0.121)
Note: The values outside the brackets indicate the Thiel index of regional differences, and the values inside the brackets indicate its contribution rate (%) to the overall difference in the YRB.
Disclaimer/Publisher’s Note: The statements, opinions and data contained in all publications are solely those of the individual author(s) and contributor(s) and not of MDPI and/or the editor(s). MDPI and/or the editor(s) disclaim responsibility for any injury to people or property resulting from any ideas, methods, instructions or products referred to in the content.

